copper recovery and cyanide destruction with a …infohouse.p2ric.org/ref/39/38792.pdfi cyanide and...
TRANSCRIPT

Copper Recovery and Cyanide Destruction with a Plating Barrel Cathode and a Packed-Bed Anode
Report-Research Project 78
By C.-D. Zhou and D.-T. Chin
A batch electrochemical cell, consisting of a plating barrel cathode and a packed-bed anode, was used to recover copper from a waste acid copper sulfate solution and simultaneously to recover copper and destroy cyanide in a waste copper cyanide solution. The cyanide destruction experiments were carried out with and without the addition of NaCI. The concentrations of total cyanide, free cyanide and copper were measured as a function of electrolysis time at various solution temperatures, cell currents, barrel rotation speeds, barrel loadings, and barrel immersion levels. The total cyanide concentration was reduced from 580 ppm to less than 10 ppm. The average energy consumption was 80 to 340 kWhlkg of total cyanide destroyed, depending upon the operating conditions. A cost analysis indicates that the present electrolytic method is more cost effective than the conventional alkaline chlorination treatment for waste cyanide solutions. It also offers a cost advantage over a commercial carbon fiber electro- lytic process because of a lower capital investment.
M etal cyanide compounds are extensively used in the electroplating and metal finishing industries. The proc- ess wastewater is toxic and disposal causes a loss of
valuable materials. Cyanide wastes must be adequately treated before being discharged from the process plant.
The conventional method for cyanide treatment is chlorina- ti or^.'-^ By reacting with chlorine gas or sodium hypochlorite in alkalinesolutions, cyanide is converted into CNO, CO,, N,, and NH;. The cost of chlorination is high; it has the drawback that complex cyanides and strong cyanide solutions cannot be adequately treated. Incineration of cyanide waste and destruc- tion of cyanide by thermal hydrolysis are alternate methods. The cost of incineration, including equipment, maintenance and operation, is also high. Although the cost of thermal hydrolysis is in the range of 10 to 35 percent of the cost of con- ventional chlorination the method does not permit the recovery of heavy metal ions from waste plating solutions.
Electrochemical destruction of cyanide is a promising proc- ess. The method is capable of simultaneously recovering metal and destroying complex cyanides in waste plating solutions. Electrochemical oxidation of cyanide was first reported by Clevenger and Hall in 1913.' Since then, numerous reports have been published on this subject.8-12 The electrochemical method can be accomplished by two different techniques: The first is based on electrodeposition of metal ions at the cathode and oxidation of cyanide to cyanate, carbon dioxide and nitro- gen gases at the a n ~ d e . ' ~ - ' ~ For a waste copper cyanide solution, the cathodic and anodic reactions may be described by the following equations:
June 1993
P 04219
Cathode reactions: Cu(CN);- + e- --f Cu + 3 CN-
2 H,O + 2 e- -+ H, + 2 OH-
(EO = -1.09 V) (1 1 (2)
(E" = -0.83 V) (3) Cu(CN); + e- --f Cu + 2 CN- (E" = -0.43 V)
Anode reactions: CN- + 2 OH- -+ CNO- + H,O + 2 e- CNO- + 2 OH- -+ CO, + lh N, + H,O + 3 e- (EO = -0.76 V) Cu(CN)B + 6 OH- +
(EO = -0.97 V) (4) (5)
Cu+ + 3 CNO- + 3 H,O + 6 e- (Eo = -0.69 V) (6) (E" = 0.40 V) (7) 4 OH-+ O,+ 2 H,O + 4 e-
where E" is the standard reduction electrode potential vs. SHE at 25 "C.
The second technique is based on an in-situ liberation of chlorine by electrolysis of a cyanide waste to which sodium chloride has been added.'"" This technique is suitable for treating dilute electroplating rinsewater with a cyanide concen- tration less than 500 ppm. For a waste copper cyanide solution, the cathodic reactions are described by Reactions (1)-(3). The anodic reactions include Reactions (4)-(7) and the following additional reactions:
2 CI- + CI, + 2 e- CI, + 2 OH- + CI- + CIO- + H,O
(E" = 1.36 V) (8) (9)
2 CN-+ 5 CIO-+ 2 OH- + 5 CI- + N, + 2 COl -+ H,O (10)
For dilute plating waste and rinsewater, three-dimensional electrodes, such as a packed and a fluidized bed:$,' are often used. This type of electrode has a large surface area and a high reaction rate per unit cell volume. A high mass transfer rate is needed to increase current efficiency for metal deposition reactions in dilute wastewater. For this aspect, a tumbling bed, such as a plating barrel, would be a good choice, where the relative movement of electrode particles with respect to the electrolyte improves mass transfer and current efficiency for metal deposition reactions. Several patents describe the use of tumbling bed electrodes to treat Oehr used a barrel plater as the anode for cyanide oxidation?' Tison described a bipolar tumbling bed electrochemical cell to re- cover copper from a dilute copper sulfate solution.srm A com- parison between the packed bed and tumbling bed electrodes for metal recovery was also discussed byTison.34 The tumbling bed has more uniform current and metal deposition distribu- tions than those of the packed bed. The tumbling bed also offers a higher mass transfer rate than the packed bed because of the movement of particles. In a plating shop, an existing barrel plater may be used, and little investment is needed for in-house waste treatments.
This study examines the feasibility of using an electroplating barrel cathode and a packed-bed anode to recover metals and
69

I cyanide and copper at the beginning of electrolysis were 520 ppm, 112 ppm, and 317 ppm, respectively.
destroy cyanide simultaneously in waste plating solutions. The effects of temperature, cell current, barrel rotation speed, barrel loading, and barrel immersion level were studied with waste copper sulfate and copper cyanide solutions. -- . Experimental Procedure Test Solutions Batch cell experiments were carried out to recover copper from an acid copper sulfate solution and simultaneously to recover copper and destroy cyanide in a copper cyanide solution, with and without the addition of NaCI. Table 1 lists the composition, volume and temperature of test solutions used in the experiments.
For the acid copper sulfate solution, 10 liters of an aqueous solution containing 0.1 M CuSO, and 1 M H,SO, at 20 to 27 "C were used. The copper ion concentration in the solution was equivalent to 6350 ppm, as shown in Table 1.
For the copper cyanide solution without NaCI, 8 to 1 1 liters of an aqueous solution containing 0.0056 M CuCN, 0.017 M NaCN and 0.2 M NaOH were used. The solution composition corresponded to an initial concentration of 585 ppm of total cyanide, 1 19 ppm of free cyanide, and 356 ppm of copper. The tests were carried out in the temperature range of 25 to 65 "C.
For the copper cyanide solution with the addition of NaCI, 1.35 liters of an aqueous solution containing 0.005 M CuCN, 0.015 M NaCN, 0.1 M NaOH and 0.2 to 0.6 M NaCl at 25 "C were used. The initial concentrations of total cyanide, free
r I Z - b J
Electrolyte out
Anode Current
Outer Container
Packed Bed Anode Drain
Cell Set-up The electrochemical cell used in the tests of acid copper sulfate solution and copper cyanide solution without NaCl is shown schematically in Fig. 1. The cell consisted of rectangular PlexiglasTM inner and outer containers. The total volume of the cell was approximately 12 liters. A variable speed plating barrel, 13 cm in diameter by 15 cm long,a loaded with copper shot was placed in the inner container as the cathode, to recover copper from the waste plating solutions. The diameter of the copper shot was 0.3 to 0.5 cm for the treatment of acid copper sulfate solutions, and 0.1 to 0.3 cm for copper cyanide solution. Two stainless steel balls 2.5 cm in diameter, coated with a thin layer of gold, were used as the dangler contacts in the plating barrel. A packed bed 13 x 13 x 10 cm (wlh), located on the bottom of the inner container, was used as the anode. Forthe acid copper sulfate solution, the anode bed was packed with lead shot 0.2 cm in diameter and a lead plate was used as the anode current collector. For the copper cyanide solution, the anode bed was packed with steel nails 0.2 cm in diameter by 3.8 cm in length and a stainless steel screen was used as the anode current collector. The test solution was recirculated between the outlet of the anode bed and the top of the plating barrel with a metering pump.b The solution flowed through mesh openings in the barrel walls to the interior of the plating barrel, where copper ions in the solution were cathodically deposited on copper shot, according to Reactions (1)-(2). The catholyte exited the screened barrel walls by gravity and flowed into the anode bed, where cyanide ion was oxidized to nontoxic chemical species, according to Reactions (4)-(6). The anolyte exited the packed bed by gravity and was recirculated by the metering pump through an overflow port on the outer container wall of the cell. The direction of solution flow is shown by the arrows in Fig. 1. The solution temperature in the cell was controlled by a quartz heater and a thermistor probe connected to an exterior tem- perature controller. Table 2 summarizes the experimental conditions of cell set-up.
Forthecopper cyanide solution with addition of NaCI, a small cell similar to that of Fig. 1 was used. The total volume of the small cell was approximately 6.5 liters. A miniature plating barrel 6.4 cm in diameter by 10 cm long,c loaded with copper shot, 0.1 to 0.3 cm in diameter, was used as the cathode. The dangler contact for the cathode bed was a copper cylinder 0.6 cm in diameter by 1.2 cm in length. The anodic packed bed below the plating barrel was 13 x 10 x 9 cm (wlh). It was packed with graphite pellets 0.3 cm in diameter by 0.5 cm in thickness. A piece of graphite felt, 1.25 cm thick, was used as the anode current collector. The experimental condition of cell set-up is shown in the third column of Table 2.
Test Procedures For each run, a known amount of copper shot was placed in the plating barrel, which was then put into the cell filled with the test solution. The recirculation pump was turned on and the plating barrel began to rotate at a constant speed. After the solution temperature had been raised to the desired level by the temperature controller, a constant current from a DC power supply" was applied to the cell. The cell voltage and solution pH were monitored during the electrolysis. A small amount of
Model 46A, Sterling Systems, Streamwood, IL. Masterflex US, Cole-Parmer Instrument Co.. Chicago, IL. Snap-On Barrel, Singleton Co., Cleveland, OH. Model 62748, Hewlett-Packard, Albany, NY. Fig. I-Schematic of cell set-up
70 Plating and Surface Finishing

NaOH was periodically added to the cell to keep the solution pH above 11 during the treatment of copper cyanide solution. For the copper sulfate solution, a run was terminated when copper ion concentration was below 10 ppm. For the copper cyanide solutions, a run was terminated when the total cyanide concen- tration dropped below 10 ppm.
For the acid copper sulfate solution, 10 mL of sample solution were taken from the cell every one to two hours, and copper ion concentration was analyzed with a copper-ion-selective elec- trode and a double-junction Ag/AgCI reference electrode filled with 10-percent KNO, solution.
For the copper cyanide solution, 10 mL of sample solution were taken every one to two hours during the electrolysis. Free cyanide concentration was measured with a cyanide-ion-selec- tive electrode and a double junction Ag/AgCI reference elec- trode. Afterwards, the sample was treated with 50 mL of 6 M H,SO, in a distillation device. The gaseous HCN liberated was absorbed in a glass flask containing 100 mL of 1.25 M NaOH solution. The total cyanide absorbed in the NaOH solution was determined with the cyanide-ion-selective electrode. The sample left in the distillation flask was used to determine copper ion concentration with the copper-ion-selective electrode. For the cop- per cyanide solution containing NaCI, a small amount of AgNO, solution was added to precipitate CI- before the copper-ion- selective electrode was used to measure copper concentration.
Results and Discussion Acid Copper Sulfate Solution All the runs with acid copper sulfate solution were carried out in 10 liters of a solution containing 0.1 M CuSO, and 1 M H,SO,
June 1993
at a barrel rotation speed of 22 rpm, a barrel immersion level of 75 percent of barrel diameter, and a solution recirculation rate of 3.1 mUsec. The runs were made at room temperature; however, the solution temperature was raised by the cell current from 20 to 27 "C during the run. The experiments were carried out at cell currents of 6, 9, 12 and 15 A over a range of barrel loading of 25 to 75 percent of barrel volume.
Table 3 summarizes the results of copper recovery from the acid copper sulfate solution at various operating conditions. The average cathode current efficiency and energy consump- tion per kilogram of copper recovered were based on the reduction of cupric ion to copper and a copper concentration change in the solution from 6350 ppm to 10 ppm.
Copper sulfate solution ('20-27 'C Barrel s p e d = 22 rpm Barrel loadlng = 25%
9A 6A
II . . . . . . . . . I . . . . . . . . . , . . . . . . . . . , . . .......,...*..., 5 0 10 15 20
Time, hr Fig. 2-Copper ion concentration vs. time for treatment of a waste copps sulfate solution.
71

Figure 2 shows the changes in copper ion concentration with respect to electrolysis time at cell currents of 6,9, 12 and 15 A. The data were obtained at a barrel loading of 25 percent of barrel volume. The rate of copper recovery increased with increasing cell current. Low cell current offered high current efficiency and low energy consumption. Table 3 shows that the average cathode current efficiency for copper deposition reac- tion decreased from 39 percent at a low cell current of 6 A, to 29 percent at a high cell current of 15 A. The average energy consumption per kilogram of copper deposited in the barrel increased from 13 kWh at 6 A to 30 kWh at 15 A. The instantaneous cathodic current efficiency and energy con- sumption per kilogram of copper recovered were calculated from the slope of the concentration vs. time curve by the following equations:
where n is the number of electrons transferred in the electrode reaction, Vis the solution volume in liters, I is the cell current (A), C is the concentration of copper ion in mol/L, t is the electrolysis time in hr, E,,, is the measured anode-to-cathode cell voltage (V), M is the molecular weight of copper in @mol, and dddt is the slope of the concentration vs. time curve in moVUhr.
The instantaneous cathodic current efficiency and energy consumption at cell currents of 6 A and 15 A are plotted against copper ion concentration in Fig. 3. The runs with a 6-A cell current had higher current efficiency and lower energy con- sumption than those with cell current of 15 A. When the copper ion concentration dropped below 200 ppm, the current effi- ciency became less than 10 percent and energy consumption became greater than 100 kWh/kg Cu. At low copper ion concentrations, a large fraction of cell current was used for hydrogen ion reduction and a large amount of energy was needed to recovercopper. The results indicate that the present electrochemical method is economical for the treatment of waste copper sulfate solution when copper ion concentration is above 200 ppm.
Figure 4 shows the instantaneous current efficiency and energy consumption for two barrel loadings of 25 and 75 percent of barrel volume at a cell current of 15 A. Barrel loading
72
Copper ion concentration, ppm
Fig. 3-Electric energy consumption and current efficiency vs. copper ion concentration for treatment of a waste copper sulfate solution.
of 75 percent produced higher current efficiency and lower energy consumption than 25 percent barrel loading. The im- provement in current efficiency with high barrel loading was the result of increased cathode surface area available for copper deposition.
Copper Cyanide Solution without NaCl The experiments for the treatment of copper cyanide solution were carried out with 8 to 11 liters of a solution containing 0.0056 M CuCN, 0.017 M NaCN and 0.2 M NaOH in the temperature range of 25 to 65 "C, at a recirculation rate of 0.8 mUsec. To determine the effect of operating variables, four cell currents of 3,6,9 and 12 A, two barrel rotation speeds of 5 and 10 rpm, three barrel loadings of 25,50 and 75 percent of barrel volume, and three barrel immersion levels of 50, 75 and 100 percent were used.
Table 4 summarizes the results for copper recovery and cyanide destruction for various operating conditions. The aver- age cyanide current efficiency and energy consumption in the table were based on Reaction (4) and a change of total cyanide concentration from 580 ppm to 10 ppm.
Figure 5 shows the total cyanide, free cyanide and copper concentrations vs. electrolysis time for a run with a cell current of 6 A and a barrel speed of 10 rpm at 25 "C. The barrel loading was 50 percent of barrel volume and the barrel immersion level was 75 percent of barrel diameter. During the first four hr of electrolysis, there was a large drop in total cyanide concentra- tion, while free cyanide concentration changed little. The small
100 Copper sulfate solution (20-27 'C) Barrel speed E 22 rpm Cell current I 15A Barrel loading
40
20
100 lo00 10000
Copper ion concentration, ppm
Fig. 4--Electric energy consumption and current efficiency vs. copper ion concentration lor treatment of a waste copper sulfate solufion with two barrel loadings.
Plating and Surface Finishing
E 2 d
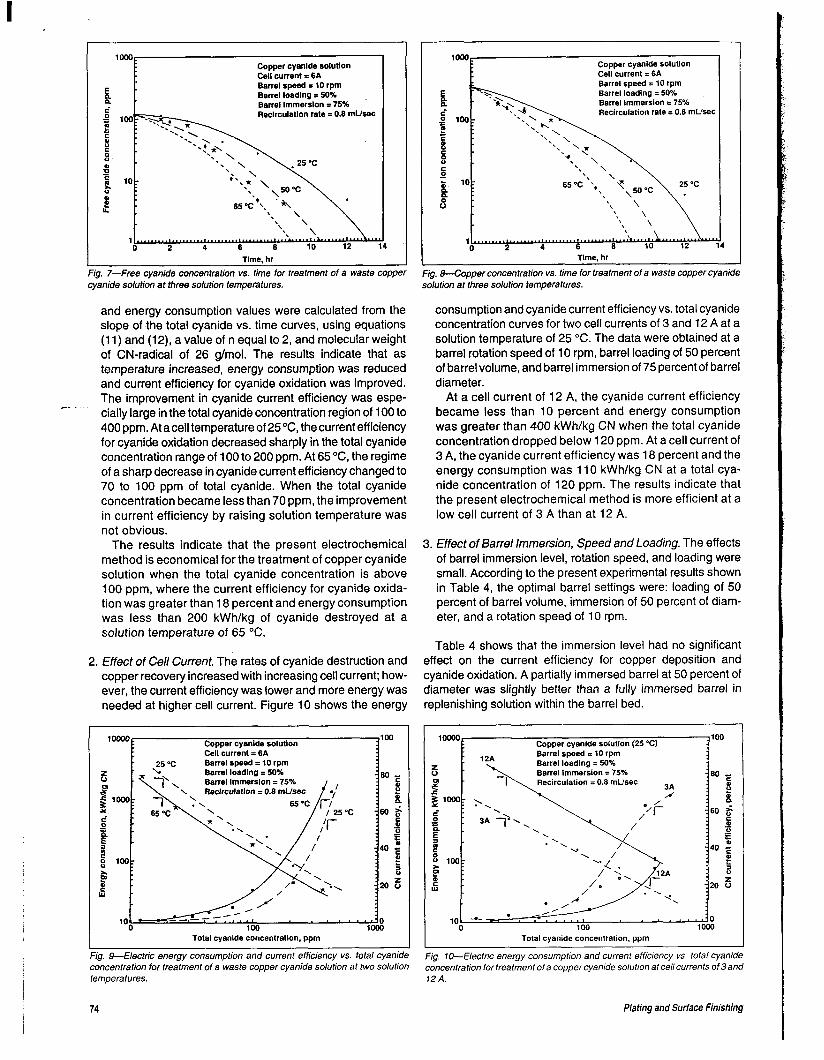
Fig. 7-Free cyanide concentration vs. time for treatment of a waste copper cyanide solution at three solution temperatures.
and energy consumption values were calculated from the slope of the total cyanide vs. time curves, using equations (1 1) and (12), a value of n equal to 2, and molecular weight of CN-radical of 26 g/mol. The results indicate that as temperature increased, energy consumption was reduced and current efficiency for cyanide oxidation was improved. The improvement in cyanide current efficiency was espe- cially large in the total cyanide concentration region of 100 to 400 ppm. At acell temperature of 25 "C, the current eff iciency for cyanide oxidation decreased sharply in the total cyanide concentration range of 100 to 200 ppm. At 65 "C, the regime of a sharp decrease in cyanide current efficiency changed to 70 to 100 ppm of total cyanide. When the total cyanide concentration became less than 70 ppm, the improvement in current efficiency by raising solution temperature was not obvious.
The results indicate that the present electrochemical method is economical for the treatment of copper cyanide solution when the total cyanide concentration is above 100 ppm, where the current efficiency for cyanide oxida- tion was greater than 18 percent and energy consumption was less than 200 kWh/kg of cyanide destroyed at a solution temperature of 65 "C.
C. ~
Copper cyanlde solution Cell current = 6 A Barrel speed = 10 rpm Barrel loading = 50% Barrel lmmerslon = 75%
2. Effect of Cell Current. The rates of cyanide destruction and copper recovery increased with increasing cell current; how- ever, the current efficiency was lower and more energy was needed at higher cell current. Figure 10 shows the energy
1 100
Copper cyanlde solution Cell current = 6 A
loo00
. 25 'c Barrel speed = 10 rpm
* . * 0 lo00 IO0 100
Total cyanide concentration, ppm J Jg. 9-€lectric energy consumption and current efficiency vs. total cyanide
concentration for treatment of a waste copper cyanide solution at two solution tempera tures.
loo0 Copper cyanide solution
Cell current = 6 A Barrel speed = 10 rpm Barrel loading = 50% Barrel immersion = 75% Recirculation rate = 0.8 mUsec
. 0
Time, hr
Fig. &Copper concentration vs. time for treatment of a waste copper cyanide solution at three solution temperatures.
consumption and cyanide current efficiency vs. total cyanide concentration curves for two cell currents of 3 and 12 A at a solution temperature of 25 "C. The data were obtained at a barrel rotation speed of 10 rpm, barrel loading of 50 percent of barrel volume, and barrel immersion of 75 percent of barrel diameter.
At a cell current of 12 A, the cyanide current efficiency became less than 10 percent and energy consumption was greater than 400 kWh/kg CN when the total cyanide concentration dropped below 120 ppm. At a cell current of 3 A, the cyanide current efficiency was 18 percent and the energy consumption was 11 0 kWh/kg CN at a total cya- nide concentration of 120 ppm. The results indicate that the present electrochemical method is more efficient at a low cell current of 3 A than at 12 A.
3. Effect of Barrel Immersion, Speed and Loading. The effects of barrel immersion level, rotation speed, and loading were small. According to the present experimental results shown in Table 4, the optimal barrel settings were: loading of 50 percent of barrel volume, immersion of 50 percent of diam- eter, and a rotation speed of 10 rpm.
Table 4 shows that the immersion level had no significant effect on the current efficiency for copper deposition and cyanide oxidation. A partially immersed barrel at 50 percent of diameter was slightly better than a fully immersed barrel in replenishing solution within the barrel bed.
IO000 Copper cyanide solution (25 "c) 1w
Barrel sped = 10 rpm
Recirculation = 0.8 mUsec
Total cyanide concentration. ppm
Fig. 70--Electric energy consumption and current efficiency vs. total cyanide concentration for treatment ofa coppercyanide solution at cell currents of 3and 12 A.
74 Plating and Surface Finishing

The effect of barrel rotation speed on cyanide oxidation is shown in Table 4. A speed of 10 rpm offered higher cyanide current efficiency and a lower energy consumption than at 5 rpm. This is be-
--cause the mass transfer rate at 10 rpm was higher than at 5 rpm.
Table 4 shows that a barrel loading of 50 percent of volume offered higher cya- nide current efficiency and lower energy consumption than at loadings of 25 per- cent and 75 percent of volume. The re- sults agreed with the operating guideline discussed by Hignett, who pointed out that the optimal load level for a normal barrel plating operation should be around 60 percent of barrel volume.35 The im- provement from 25 to 50 percent loading resulted from increased cathode surface area available for copper deposition. When the rate of cathodic copper depo- sition increased, more free cyanide ions were released, and the anodic current efficiency was improved. There are two reasons for the better performance of a 50-percent loading over that of a 75- percent loading. The first reason is bed movement; particle motion with 50-per- cent loading was faster and offered a higher mass transfer rate than with a 75- percent loading. The second reason is cur- rent distribution. According to Geissman and Carlson, the current distribution in a plating barrel became less uniform with increasing barrel loading.% In a barrel with 75-percent loading, a large fraction of cop- per shot was relatively inaccessible to copper deposition reaction because of non-uniform current distribution.
Copper Cyanide Solution with Addition of NaCl In the presence of CI- in a waste copper cyanide solution, CIO- ions may be gen-
erated by anodic oxidation of chloride ions at a graphite anode, in agreement with Reactions (8) and (9). The CIO ions subsequently reacted with CN- ions to produce non-toxic N, gas and C0:- ions via Reaction (10). As a result, the de- struction of cyanide in an electrochemi- cal process may be accelerated by addi- tion of NaCl to a waste plating solution. In the present study, several experiments were carried out with the addition of NaCl to 1.35 liters of a solution containing 0.005 M CuCN, 0.01 5 M NaCN and 0.1 M NaOH at 25 "C. The concentration of NaCl in the resulting solution, at the be- ginning of electrolysis, ranged from 0 to 0.6 M. The experiments were carried out in a small cell with a miniature plating barrel 6.4 cm in diameter by 10 cm long at a cell current of 3 A. A barrel rotation speed of 9 rpm, loading of 50 percent, immersion level of 50 percent and a solution recirculation rate of 0.8 mUsec were used. Table 5 summarizes the ex- perimental conditions and results.
Figures 1 1 and 12 show the total cya- nide and copper concentration vs. elec- trolysis time curves, respectively, for four NaCl concentrationsof 0,0.2,0.4and 0.6 M. As expected, the rates of total cyanide destruction and copper recovery in- creased with increasing NaCl concentra- tion. Figure 13 shows the instantaneous energy consumption and cyanide current efficiency vs. total cyanide concentration curves without NaCl and with 0.6 M NaCI. Without NaCI, the current efficiency was less than 10 percent when the total cya- nide concentration dropped below 180 ppm. With the addition of NaCl to the test solution, CIO ions were produced at the anode during electrolysis. The subse- quent reaction between the CIO- ions and C N in bulk solution appeared to improve
the current efficiency for cyanide oxida- tion in the overall electrolysis. For the run with 0.6 M NaCI, only when the total cyanide concentration dropped below 85 ppm, did the apparent current efficiency become less than 10 percent. The re- sults indicate that the addition of NaCl improves the apparent current eff iciency for cyanide oxidation and reduces the energy consumption per kilogram of cyanide destroyed.
Cost Analysis A cost analysis was performed for an in- house cyanide treatment of a waste plat- ing solution containing 580 ppm of total cyanide, using the present electrolytic process with the addition of 0.6 M NaCI. It was assumed that a spare plating bar- rel would be used as the cathode, and that the packed bed anode would be assembled by packing graphite pellets on the bottom of an electrolytic cell. The capital investment, consisting of a 700- liter cell tank, a recirculation pump, pipes, filters, rectifier, and installation was am- ortized over a 10-year period, using a straight line depreciation method and a zero interest rate. The electrolytic cell would be operated 20 hr/day and 300 dayslyr, with a total of 490 kg of cyanide destroyed annually.
Based on the results of the present experimental studies, various operating costs were estimated. The estimated op- erating and capital investment costs were then pro-rated for one kilogram of cya- nide destroyed by the waste treatment process. The results are listed in the third column of Table 6. For comparison, the operating and capital investmenvkg of cyanide destroyed using the conventional chlorination method3 and a carbon fiber electrolyticcelP are also listed on the first and second columns of Table 6. All costs in Table 6 were adjusted to 1992 U.S. dollars, using the cost information and price indexes listed in Refs. 37 and 38.
Capital investment for the chlorina- tion and carbon fiber electrolytic meth- ods was also amortized over a 10-year operating period, using the straight line depreciation method and zero interest rate. The cost of chlorination amounts to $71.81/kg of cyanide destroyed, be- cause of the hi'gh operating costs for chemicals, labor, and disposal of solid sludges. The electrolytic treatment is more cost effective at $14.54/kg CN, using carbon fiber electrodes, and $12.52/kg CN, using a plating barrel cathode and packed,bed anode. The operating cost of the present electro- lytic process is slightly higher than that
June 1993 75

Operating Costs NaOH ($O.62/kg)l3'1 NaOCl ($O.l2/L)Pl Lime ($49.5/metric ton) NaCl ($0.1 1/kg)@q Electricity ($O.O4/kWh) Anode (replaced every 2 YE.) Labor & Maintenance ($lO/hr) Filter Cartridges (24honth) Sludge Transportation PId
($0.1 9Imetric ton-km) Sludge Disposal ($253/ton) PId
Subtotal
Copper cyanide solution ( with addition of NaCl) Cell current = 3A
lo00
\ . Barrel loadlng = 50% \. '\
. Barrel Immersion = 50% \ '- 0.4M Na2°.2M NaC'
l.........1.........1.........l.........l 0 1 2 3 4 5 6
Reclrculation rate I 0.8 mUWC \0.6M NaCl
Capital Costs Equalization Tank f3Id Cyanide Oxidation Unit 131d Precipitation Reactor PI Flocculator/Clarifier 14 Sludge Holding Tanks I3ld
Filter Press I3ld Electrochemical Cell
Subtotal Total
ChlorlnationDl a
Consumption (Per kg CN)
or rota1 Investment
cost
8 kg 57 L
0.008 metric ton
0.84 metric ton-km
0.036 metric ton
$20,000 $31,000 $28,000 $21 ,Ooo $3,500 $1 1,000
4.96 6.84 0.40
42.00
0.16
9.10 63.46
1.50' 2.30 I 2.00 1.50 0.25 0.80 I
8.35 71.81
I Time. hr
ble 6 nation and Electrochemlcal 7
ET Using Carbon F i b e F .
Consumption (Per kg CN)
or Total Investment
cost
0.18 kg
2.65 kg 20 kWh
0.14 piece
$1 29,000
Fig. I I-Totalcyanide concentrations vs. time for treatment ofa coppercyanide solution with four NaCl concentrations.
76
0.1 1
0.29 0.80 2.00 4.00 1.20
8.40
6.14' 6.14 14.54
?atment (ET) n 1992 dollars)
ET Using Plating Barrel' (present study)
Consumption (per kg CN)
or Total Investment
cost
5.0 kg 100 kWh
0.50 piece
$12,100
0.55 4.00 0.27e 4.00 1.20
10.02
2.50 2.50 12.52
of the carbon fiber electrolytic method. This is a result of a low initial cyanide concentration of 580 ppm and a high electrical requirement of 100 kWh/kg CN used in the cost estimate of the present electrolytic process.
In the carbon fiber electrolytic method,21 a waste cadmium cyanide solution containing 1,000 to 4,500 ppm of total cyanide and an electric energy consumption of 20 kWh/kg CN de- stroyed were used in the analysis. The present electrolytic method has a lower capital investment cost, which results in a net saving of $2.00/kg of cyanide destroyed over the carbon fiber electrolytic method. The cost figures in Table 6 do not include any credits resulting from metal recovery at the cath- ode. The present electrolytic treatment method would become more cost-effective if a more concentrated waste cyanide solution were used for the treatment.
Findings For an acid copper sulfate solution, copper ion concentration was reduced from 6350 ppm to less than 10 ppm with an average cathode current efficiency of 29 to 40 percent and an energy consumption of 13 to 33 kWh/kg of copper recovered.
Plating and Surface Finishing

Copper cyanlde solution ( with addition of NaCI) Cell current = 3A
1wO
Temperature = 25 “C
Barrel loading = 50% Barrel Immersion = 50%
0 1 2 3 4 5 6 Tim. hr
1woO 100 Copper cyanlde solutlon (with NaCI)
. Cell current L 3A
. Temperature = 25 OC z Barrel speed = 9 rpm 80 o i
g 100
10 1
- 0)
Barrel loading I 50% \ Bawd Immersion = 50%
0 10 100 lo00
Total cyanlde concentratlon. ppm I Fig. ISElectric energy consumption and current efficiency for cyanide oxida- tion vs. total cyanide concentration for treatment of a copper cyanide solution witbout NaCl and with 0.6 M NaCl.
Fig. 124opper concentration vs. time for treatment of a copper cyanide solution with four NaCl concentrations.
For a copper cyanide solution, the total cyanide concentration was reduced from 580 ppm to below 10 ppm, free cyanide from 120 ppm to 1 ppm, and copper from 356 ppm to 1 ppm, with an average cyanide current efficiency of 9 to 23 percent and an average energy consumption of 80 to 340 kWh/kg of cyanide destroyed, depending upon the operating conditions. Thecath- ode and anode current efficiencies increased and energy con- sumption decreased with: (1) increasing solution temperature; (2) decreasing cell current; (3) increasing NaCl concentrations.
The optimal barrel settings were found to be: Rotation speed of 10 rpm; loading of 50 percent of barrel volume; and an immersion level of 50 percent of barrel diameter.
A cost analysis indicates that the present electrolytic method is more cost effective than theconventional chlorination method, and has a small cost advantage over acommercial carbon fiber electrolytic process, because of a lower capital investment.
Acknowledgment The authors wish to thank the project supervisor, Dr. Peter Bratin of ECI Technology, for his assistance and discussions in the course of this study.
References 1. Ohio River Valley Sanitation Commission, “Methods for
Treating Metal-Finishing Wastes,” Cincinnati, OH (1 953). 2. M.R. Watson, “Pollution Control in Metal Finishing,” pp.
147-178, Noyes Data Corp., Park Ridge, NJ (1973). 3. S.A.K. Palmer, M.A. Breton,T.J. Nunn0andD.M. Sullivan,
“Metal Cyanide Containing Wastes Treatment Technolo- gies,” pp. 602-624, Noyes Data Corp., Park Ridge, NJ (1988).
4. A.P. Cadotte, R.G.W. Laughlin, H.L. Robey and D. Cobb, flat. and Surf. Fin., 68, 63 (Nov., 1981).
5. H.L. Robey, flat. and Surf. Fin., 70, 79 (Jun., 1983). 6. T.C. Tan and W.K. Teo, flat. and Surf. Fin., 74, 70 (Apr.,
7. G.H. Clevenger and M.L. Hall, J. Electrochem. SOC., 24,
8. J.T. Byrne, W.S Turnley and A.K. Williams, J. Electrochem.
9. M.R. Hillis and C. Lopez-Cacicedo, Ger. Offen. 2600084
1987).
271 (1913).
Soc., 105, 607 (1958).
(1978).
10. T.C. Tan, W.K. Teo and D.-T. Chin, Chem. Eng. Commun., 38, 125 (1985).
11. R.B. Valencia, Jr., MSThesis, Dept. of Chem. Engineering, Univ. of Waterloo, Waterloo, Ontario, Canada, 1969.
12. E.V. Mitrofanov and V.N. Flerov, Electrokhimiya, 8, 11 65 (1 972).
13. M.C. Dart, J.D. Gentles and D.G. Renton, J. Appl. Chem., 13,55 (1963).
14. H. Tamura, T. Arikado, H. Yoneyama and Y. Matsuda, Electrochim. Acta, 19, 273 (1 974).
15. E. Kubankova, Koroze OchvMater, 18,93 (1974). 16. J.P. Wiaux, T.T. Nguygen and S.A. Titalyse, MetalFin., 31,
17. M. Fujikawa, Mizu ShoriGijutsu, 12(9), 39 (1971). 18. A.M. Ueda, Japan Kokai Tokkyo Koho, 80, 111; 892
19. J. Drogen and L. Pasek, Elecfroplat. and Metal Fin., 18,
20. R. Nagendran, N.V. Pathasarthy and K.S.G. Doss, f lat.
21. D.T. Vachon, W. Bissett, B.A. Calver and G.C. Dickson,
22. D.-T. Chin and B. Eckert, flat. andsurf. Fin., 63,38 (Oct.,
23. A.K.P. Chu, M. Fleischmann and G.J. Hills, J. Appl.
24. S.P. Ho, Y.Y. Wang and C.C. Wan, Wafer Res., 24, 131 7
25. G. Kreysa, Electrochim. Acta, 23, 1351 (1978). 26. B.D. Barker and B.A. Plunkett, Trans. IMF, 54,104 (1 976). 27. A.G. Tyson, flat. and Surf. Fin., 71, 44 (Dec., 1984). 28. D. Schab, H.-J. Lange and K. Hein, DD-Pat. 114624
29. A. Kirchhof, K. Hein and D. Schab, DD-Pat. 231 585 (1 986). 30. R. Kammel and H.W. Liber, U.S. patent 4,123,340 (1978). 31. K.H. Oehr, Paper 579 presented at the Electrochemical
32. R.P. Tison, J. Electrochem. SOC., 128, 317 (1981). 33. R.P. Tison and B.J. Howie, flat. and Surf. Fin., 71, 54
34. R.P. Tison, Environ. frog., 2, 70 (1 983). 35. J.B. Hignett, Metal Finishing Guidebook and Directory
Issue, Vol. 78, Metals and Plastics Publications, Hackensack, NJ, 1980; p. 84.
49 (Nov., 1990).
(1 980).
310 (1965).
and Surf. Fin., 54, 179 (Nov., 1967).
flat. and Surf. Fin., 73, 68 (Apr., 1986).
1 976).
Electrochem., 4, 323 (1 974).
(1990).
(1975).
Society Meeting, Seattle, WA, May 21-26, 1978.
(Sept., 1984).
June 1993 77

I . .
Requirements
C . IR STRIPPING COLUMNS: @ P.V.C. Poly-Pro, F.R.P., or
VOC Removal rates as high
Custom design units or
Stackable Sections for
P.V.C. Poly-Pro, F.R.P., or
Horizontal or vertical design
Continuous scrubbing solution recirculation
Non-clogging mass packing
Free Details: Circle 143 on postpaid reader service card.
36. W.C. Geissman and R.A. Carlson, Proc. AES Annual
37. “Chemical Marketing Report,”pp. 27-31, August 31,1992. 38. Chemical & Engineering News, 70 (26), 48 (1992). 39. “AESAR 1992-1 993 Catalog,” AESAWJohnson Matthey,
Tech. Conf., p. 153 (1952).
Ward Hill, MA (1 992).
About the Authors C.-D. Zhou is a doctoral candidate in chemical engineering at Clarkson University, Potsdam, NY 13699-5705. She received BS and MS degrees in chemical engineering from the East China University of Chemical Technology.
Dr. Der-Tau Chin is professor of chemical engineering at Clarkson University. He has more than 20 years’ research experience in electroplating, corrosion, electrochemical en- ergy conversion, and industrial electrolytic processes. Prior to joining Clarkson, he was a senior research engineer in the Electrochemistry Department of General Motors Research Laboratories. Prof. Chin holds a PhD from the University of Pennsylvania. He is the author or co-author of more than 1 10 technical papers.
NEW KOCOUR 6000 Thickness Testing System . . .
easy-to-use, compact, affordable. H Micro-processor based circuitry provides access to over 300 coatingJsubstrate applications W Versatile - measures anything from a #2 screw to the largest coil. Multi-layer coatings and alloy layer formed during manufacturing. W Digital Calibration, 98%+ Accuracy W Easy to Read Direct Readout W STEP H Print capability W RS232C Interface to PC H Proven Kocour Quality, Reliability and Value
Kocour Company 4800 South St. Louis Ave c @ x @ Chicago, Illinois 60632 Tel: (31 2) 847-1 1 1 1 Fax:’(312) 847-3399
. --.-~ - x - -
Pioneers in Control for the Plating Industry Since 1923 1 Free Details: Circle 144 on postpaid reader setvice card.
78 See Us At SUWFINm’93 Booth # 609 Prating and Surface Finishing