copper - usgs mineral resources program · copper was consumed as refined copper and as direct melt...
TRANSCRIPT

COPPER—2000 23.1
COPPER
By Daniel L. Edelstein
Domestic survey data and tables were prepared by Janet D. Richards and Deana Demichelis, statistical assistants, and theworld production tables were prepared by Regina R. Coleman, Linder Roberts, and Glenn J. Wallace, international datacoordinators.
In 2000, mine production of recoverable copper in the UnitedStates continued its downward slide that began in 1998, fallingby more than 150,000 metric tons (t) to the lowest level since1988. In addition to mine closures and cutbacks carried forwardfrom midyear 1999, high energy costs coupled with low copperprices led to unanticipated cutbacks and closures. Somerationalization of capacity occurred following consolidation ofownership at the end of 1999. Three companies, Phelps DodgeCorp., ASARCO Inc. (owned by Mexico’s Grupo Mexico S.A.de C.V.), and Kennecott Utah Copper Corp. (owned by RioTinto plc of the United Kingdom), accounted for more than 95%of U.S. copper mine production. While the United States maintained its position as the world’ssecond largest mine producer of copper, accounting for about11% of world production, its share of global productioncontinued to decline from its 19% share in 1994. Chile, wheremine production increased by 5% in 2000, and by 85% since1995, was the largest mine producer and accounted for 35% ofworld production. World mine production grew by about 3.5%in 2000 and by 30% since 1995. The world reserves and reservebase for copper were estimated to be 340 million metric tons(Mt) and 650 Mt, respectively. The United States had about13% each of reserves and reserve base. In the 1998 NationalMineral Resource Assessment conducted by the U.S. GeologicalSurvey (U.S. Geological Survey, 2000), the estimated copper
contained in undiscovered resources in the United States rangedfrom greater than 170 Mt at a 90% probability to greater than440 Mt at a 10% probability. The mean estimate of copper inundiscovered deposits was 290 Mt. According to theassessment, more than two-thirds of the copper was thought tobe contained in undiscovered porphyry copper deposits. Othermajor deposit types were sediment-hosted and volcanogenicmassive sulfide deposits. About 50% of the undiscoveredresource was believed to be in Great Basin and Southern Basinand Range regions (portions of Arizona, California, Nevada,New Mexico, and Utah). The identified copper resource wasestimated to be 260 Mt. Coupled with past production of about91 Mt, the total discovered copper resource in the United Stateswas estimated to be 350 Mt.
U.S. copper smelter and refinery production also continued tofall and were down by 23% and 16%, respectively, from 1999production levels, and 42% and 33%, respectively, fromproduction in 1998. Owing to the combined impact of minecutbacks and low prices, three of seven primary smelters hadclosed in 1999. Primary refined production declined owing to adownstream shortage of anode for refining. With the threesmelters remaining closed in 2000, the United States became anet exporter of copper in concentrates. Contraction of thesecondary copper industry continued with the closure in May ofone of the Nation’s two remaining secondary smelters and its
Copper in the 20th Century
At the beginning of the 20th century, following patenting ofthe electric lightbulb and initial development of electric powerdistribution infrastructure late in the 19th century, the UnitedStates was experiencing a prolonged period of expansion incopper use for electrical generation, distribution, andindustrial applications. U.S. mine production rose from27,000 metric tons in 1880 to 275,000 tons in 1900 and490,000 tons in 1910. Most of the copper produced camefrom high-grade vein deposits that predominantly yielded orefor direct shipping to smelters (80 smelters operated in 1907). By 1900, Montana and Arizona had emerged as the leadingproducing States, accounting for 45% and 20% of domesticproduction, respectively. The United States was by far theworld’s largest producer in 1900, accounting for 55% ofworld production and exporting about 160,000 tons of refinedcopper and consuming about 160,000 tons.
The United States retained its position as the largestproducer and consumer of copper through most of the century. Domestic copper mine production peaked in 1997 at 1.94million tons. Froth flotation and large-scale open pit miningmethods introduced during the first decade of the century hadrevolutionized copper mining, and production was derived
increasingly from low-grade porphyry copper deposits. Industrialization, rural electrification, and growinginfrastructure all contributed to the growth in copper demand. Electrical applications accounted for an increasing share ofdomestic consumption (about 75% in 2000).
By the start of the 21st century, however, the United Stateshad relinquished its role as the world’s largest copperproducer to Chile (35% of global production). U.S. mineproduction in 2000 fell to about 1.4 million tons andaccounted for only about 11% of world production. Technology advances made in the 1980s resulted in one-thirdof U.S. mine output in 2000 coming from the leaching andsolvent extraction-electrowinning of acid soluble ores. Thecombined impact of environmental regulation and industryrestructuring left only four smelters operating. The UnitedStates remained the world’s largest user of refined copper(about 3 million tons, 20% of world total) and was dependanton imports for about one-third of its refined copper supply. Copper recovered from old scrap (500,000 tons in 1997) alsofell victim to industry consolidation and offshore processingand declined to only 350,000 tons in 2000.

U.S. GEOLOGICAL SURVEY MINERALS YEARBOOK—200023.2
captive electrolytic refinery. Electrowon production, whichaccounted for a record 36% of primary refined production and38% of mine production, declined by about 5%. Though itretained its position as the second largest refiner and thirdlargest smelter, the U.S. share of world smelter and refineryproduction fell to 9% and 12% , both down from 15% in 1998. In 1998, the United States had been the largest smelter andrefiner of copper.
Twenty-seven mines operating in 7 States, down from 33 in1999, reported recoverable quantities of copper in 2000. Fourteen mines located in Arizona, Utah, New Mexico, andMontana, in descending order, accounted for more than 99% ofproduction. The remaining 13 mines were either small leachoperations or byproduct producers of copper. Despite thedecline in production, capacity utilization at domestic minesrose, as capacity was adjusted downward to reflect the long-termclosure of mines that were not expected to reopen withoutsignificant capital investment.
During the year, 4 primary and 2 secondary smelters, 6electrolytic and 3 fire refineries, and 14 solvent extraction-electrowinning (SX-EW) facilities operated in the United States. By yearend, however, one secondary smelter and associatedelectrolytic refinery had closed. Following closure of threeprimary smelters in 1999, which were not anticipated to reopenin the short term, smelter capacity for 2000 was reviseddownward from 1.75 million metric tons per year (Mt/yr) in1999 to 1.18 Mt/yr. Consequently, smelter capacity utilizationrose from 74% in 1999 to 85% in 2000. Capacity at refineriesdeclined by about 200,000 metric tons per year (t/yr) to 2.4Mt/yr and the utilization rate fell to 74%. The conversion of oldscrap to alloys and refined copper, declined by 47,000 t (12%),contributed 334,000 t of copper to the market, and accounted for11% of apparent industrial demand. Lower copper prices in2000 and closure of a secondary copper smelter led to thecontinued downward trend in recovery.
Copper was consumed as refined copper and as direct meltscrap at about 35 brass mills, 13 wire-rod mills, and 600foundries, chemical plants, and miscellaneous operations. According to data compiled by the Copper DevelopmentAssociation Inc. (CDA) (Copper Development Association, Inc.,2001, p. 18), mill and foundry product shipments to the U.S.market, including net imports of mill products, continued theirupward trend, rising by170,000 t (4%) to 4.33 Mt, and were43% higher than shipments in 1990.
The net import reliance for refined copper, as a percentage ofapparent consumption, rose sharply to a record-high 37% (from14% in 1998) following cutbacks in domestic production andgrowth in demand. Peru emerged as the largest source ofrefined copper, and, along with Canada and Chile, accounted forabout 80% of refined imports. Canada remained the largest U.S. source for unwrought copper, accounting for 27% of totalimports of unwrought copper. China (including Hong Kong),owing to a large growth in U.S. scrap exports, became thelargest recipient for unwrought exports, accounting for 58% ofrefined exports and 38% (copper content) of total exports.
Legislation and Government Programs
On January 26, 2000, as authorized by the Coin Act of 1997,the U.S. Mint began releasing its new Golden dollar coin toreplace the Susan B. Anthony dollar coin that had been
introduced in 1979. In its report to Congress, the Mint outlineddetails of a promotional campaign aimed at helping the publicbuild a strong awareness for the coins. According to the Mint,about 700 million Golden Dollars were placed in circulationduring 2000, 7 times initial expectations. The new coins alsogenerated an $800 million profit for the Mint (U.S. Mint, 2001). At a coin weight of 8.1 grams and overall composition of 88.5%copper, 6% zinc, 3.5% manganese, and 2% nickel, the 700million coins contained about 5,000 t of copper.
In January, the U.S. Department of Labor, Division of TradeAdjustment and Assistance, rejected a petition by the UnitedSteel Workers of America seeking transitional adjustmentassistance for workers producing copper rod at the Pauline, KS,plant of Superior-Essex Inc. In rejecting the petition, thedepartment found that criterion 3 (the subject firm increasedimports of like products from Canada or Mexico) and criterion 4(the firm shifted production to Canada or Mexico) of the act hadnot been met. The Division of Trade Adjustment andAssistance concluded that copper rod production at Pauline hadbeen shifted to other domestic plants of the subject firm and thatSuperior-Essex had neither increased its imports from Mexicoor Canada nor shifted production to those countries (U.S.Department of Labor, 2000).
In June, the U.S. Environmental Protection Agency (EPA)proposed a change to its proposed national emissions standardsfor hazardous air pollutants (NESHAP) for primary smelters (smelting furnaces, slag cleaning furnaces, and batchconverters). In April 1998, under section 112 of the Clean AirAct, which directs EPA to establish NESHAPs to controlemissions from major stationary sources, EPA had proposed anequipment-based standard. The new proposed rule for thecontrol of process emissions would establish a numericalemissions standard for particulate matter of 23 milligrams oftotal particulate matter per dry standard cubic meter (0.010grains per dry standard cubic foot). In EPA’s judgment, theproposed standard reflects “a level of total particulate matteremissions that can be achieved consistently by a properlyoperated and maintained sulfuric acid plant used to controlprocess offgas from primary smelting and convertingoperations.” The proposed standard also specifies that a furnacewill be in violation of the standard if leak detector alarmsinstalled on baghouses indicate higher than allowable emissionsmore than 5% of the operating time over a 6-month period. Copper smelting was 1 of 170 categories selected for regulationunder the Clean Air Act (U.S. Environmental ProtectionAgency, 2000b).
In November, in response to an industry petition, EPA issueda final rule exempting the need for a residue tolerance test, inaccordance with the Federal Food, Drug, and Cosmetic Act (asamended by the Food Quality Protection Act of 1996), whencopper sulfate pentahydrate is used as a fungicide on rawagricultural commodities after harvest. This regulationeliminates the need to establish a maximum permissible levelfor residues of copper sulfate pentahydrate. While use ofcopper compounds has been exempted from tolerance testswhen applied to growing crops, they had not been exemptedwhen applied to crops at the time of or after harvest. Coppercompounds are already exempted from testing when used onharvested fish, meat, poultry, eggs, and irrigated crops. Ingranting its exception, EPA noted relevant scientific dataindicating that it is unlikely that excessive amounts of copper

COPPER—2000 23.3
ion from this use would be ingested, that copper is ubiquitous innature and naturally occurring in ingested water and plants, is anessential nutritional element in animals (including humans) andplants, not readily absorbed when ingested, and that most ofabsorbed copper is excreted (U.S. Environmental ProtectionAgency, 2000a).
Production
Mine production capacity was adjusted downward by about250,000 t/yr to about 1.75 Mt/yr, reflecting the sustained closureof BHP Copper Co. mines and reduced capacity at several othermines that had shifted mining strategies or plans. Phelps Dodgeclosed its Metcalf concentrator at its Morenci Mine in Arizonaduring August in anticipation of switching to an all leachoperation in 2001. In response to lower average prices, mineclosures, and higher than anticipated utility rates, productiondeclined by about 160,000, t and capacity utilization roseslightly to about 84%. With the exception of its small Arizonaleach SX-EW operations at San Manuel, Pinto Valley, andMiami, BHP’s mines remained shuttered.
Primary smelter production declined by 21% following theclosure of three of the seven primary domestic smelters during1999 and was down by 42% from that in 1998. Smelter capacitywas revised downward to reflect the indefinite closure of thesesmelters. Secondary smelter production continued its downwardtrend, declining by 31%. In May, Southwire Co. closed itssecondary smelter and associated electrolytic refinery, inCarrollton, GA. Southwire continued to operate its rod millhoused within its Copper Division Southwire (CDS). Sixteenmonths prior, as part of a restructuring plan aimed at loweringits costs, Southwire had unsuccessfully placed its Carrolltoncopper smelter/refinery operations on the market. Southwirecited economic factors, including the continued cost ofcompliance with environmental regulations in the metro-Atlantaarea, for the closure of copper smelting operations. CDS wasconstructed in 1972, at a time when primary producers exertedgreater control over copper prices. As part of the closurejustification, Southwire cited the advent of worldwidecommodity prices and their own “strong buying position” asleverage in meeting future raw material needs (Southwire Co.,2000). Closure of CDS secondary copper facilities, which havea capacity to produce 140,000 t/yr of refined copper, had asignificant impact on the U.S. scrap copper market. Southwireprocessed a mixture of imported blister and copper scrap at itssmelter to produce anode for electrolytic refining. Southwirewas one of two remaining secondary smelters in the UnitedStates, two other smelters having closed in the preceding 3years. Southwire closed its other secondary copper smelter inGaston, SC, at the end of 1994, also citing the high cost ofenvironmental compliance as the reason for closure.
Primary and secondary refinery production declined by 16%and 9%, respectively. The aforementioned smelter closures ledto downstream shortages of anode for refining. Electrowonproduction declined by only about 3% and accounted for arecord 36% of primary refined production. The Warrenton firerefinery, which had closed in March 1999, was reopened underdifferent management, mitigating some of the lost secondaryrefinery capacity.
Following acquisition of the assets of Cyprus Amax MineralsCo. at yearend 1999, Phelps Dodge Corp. reported record
copper production of 1.32 Mt, including minority participantsshare of 235,000 t, from its worldwide operations. U.S.production amounted to 850,000 t. In the United States,production and costs were adversely affected by unusuallyheavy precipitation during the fourth quarter of the year andhigh energy costs, including electricity, diesel fuel, and naturalgas. According to Phelps Dodge, its domestic electricity costsduring the fourth quarter averaged $0.11 per kilowatthour, morethan three times their 5-year average cost, and total energy costsrose by $0.08 per pound of copper production, a 65% increaseover the comparative 1999 period. Total energy costs increasedcopper unit costs in 2000 by approximately $0.04 per poundcompared with unit costs in 1999. Beginning in the spring of2000, the impact of a power supply/demand imbalance inCalifornia, drought in the Pacific Northwest, and higher naturalgas prices caused a shortage of electricity and higher spotmarket electricity costs. Approximately 27% of Phelps Dodge’selectricity requirements in 2000 was purchased on the spotmarket (Phelps Dodge Corp., 2001a, p. 15-16; 2001b, p. 3).
At its Morenci Mine, production of copper in concentratedeclined from 177,000 t to 120,000 t following placement of theMetcalf concentrator on standby in June. In September 1999,Phelps Dodge had announced its intent to reduce productioncosts by converting all Morenci production to mine-for-leach byearly 2001 and permanently shut both the Metcalf and Morenciconcentrators. The $220 million conversion proceededthroughout 2000 and was completed during the first quarter of2001. New facilities included an expanded crushing andconveying system, mobile stackers to disperse the ore on leachpiles, expanded solvent extraction facilities, and construction ofa new electrowinning tankhouse. Electrowon production in2000 of 258,000 t was unchanged from that of 1999 (PhelpsDodge Corp., 2001a, p. 3-9).
At its Miami, AZ, leach operations acquired with thepurchase of Cyprus Amax, a new mine plan was instituted inJune that suspended stripping in a higher cost section of themine and allowed redistribution of equipment to other PhelpsDodge operations. Production in 2000 of 54,000 t of cathodewas not impacted by the mine plan change, though productionin 2001 and 2002 was expected to fall by 16,000 t and 39,000 t,respectively. At its newly acquired Bagdad Mine in Arizona,Phelps Dodge reported production of 101,000 t of copper inconcentrate and 10,700 t of electrowon copper. Electrowonproduction at its Tyrone, NM, mine was essentially unchangedat 72,000 t (Phelps Dodge Corp., 2001a, p. 3-9).
In March, Phelps Dodge ended speculation on the fate of itsnewly acquired Sierrita Mine in Arizona when it announced thatit intended to invest $13 million to upgrade the mine ($2.9million), the crushing and conveying system ($2.5 million), thesolvent extraction circuit ($1.3 million), as well as otherupgrades and land purchases ($3.0 million) (Platt’s MetalsWeek, 2000c). Production in 2000 amounted to 87,000 t ofcopper in concentrate and 24,000 t of electrowon copper(Phelps Dodge Corp., 2001a, p. 8).
At its Hidalgo, NM, smelter, closed in September 1999,Phelps Dodge announced its intention to reconfigure the smelterto produce sulfuric acid for its leaching operations. WhilePhelps Dodge had a near-term surplus of concentrate, thecompany announced at midyear that it intended to stopexporting surplus concentrates and to stockpile them inanticipation of conversion of Morenci to all leach operation,

U.S. GEOLOGICAL SURVEY MINERALS YEARBOOK—200023.4
resulting in a future concentrate shortfall. Prior to closure of theHidalgo smelter, Phelps Dodge had been a net importer ofcopper concentrates from its South American operations (PhelpsDodge Corp., 2000). In 2000, Phelps Dodge smelters produced449,000 t of copper. As a result of the upstream curtailment insmelting, Phelps Dodge’s refineries in El Paso, TX, and Miami,AZ, operated at only 72% of their combined capacity,producing 427,000 t of copper cathode (Phelps Dodge Corp.,2001a, p. 9).
In July, Asarco, a wholly owned subsidiary of Mexico’sGrupo Mexico S.A. de C.V., announced plans to consolidate allcorporate functions in Phoenix, AZ, by yearend. Followingacquisition by Grupo in November 1999, Asarco had alreadytransferred many of its corporate functions from New York Cityto Arizona (ASARCO Inc., 2000a). Grupo reported thatoperating and cost savings from the integration of Asarco andSouthern Peru Copper Corp. following acquisition in 1999amounted to more than $171 million. Asarco’s share of mineproduction declined from 293,000 t in 1999 to 261,000 t in 2000(Grupo Mexico S.A. de C.V., 2001b).
At Asarco’s Ray Operations in Hayden, AZ, production ofcopper in concentrate and electrowon cathode declined to99,300 t and 38,800 t, respectively, down from 144,000 t and40,000 t, respectively, in 1999. The Ray mining unit consists ofa 227,000-metric-ton-per-day (t/d) open pit mine with a 27,000-t/d concentrator (Ray) and a 23,500-t/d concentrator (Hayden), a13,600-t/d silicate leaching system, a low-grade sulfide dumpleaching system, and a SX-EW operation. The Hayden oxygenflash smelter, with an annual capacity of 650,000 t/yr ofconcentrates, produced 191,000 t of copper anode. Asarco’s ElPaso smelter remained on standby throughout the year, andproduction at its Silver Bell Mine and SX-EW operation inArizona declined by about 2,000 t to 18,300 t (Grupo MexicoS.A. de C.V., 2001a, p. 10-13).
In November, Asarco initiated a new mine plan at its MissionMine Unit in Arizona. Under the plan, ore production wasreduced from 56,000 t/d to 37,000 t/d, while total material minedwas increased by 25%, thus increasing the stripping ratio andextending the reserve life at the mine from 14 to 22 years. Thenew plan was expected to boost average ore grades, increaserecovery rates, and reduce unit production costs. Annualproduction of copper in concentrate was expected to decline by22,000 t (ASARCO Inc., 2000b).
Montana Resources Inc. (49% owned by Asarco) suspendedmilling operations at its Continental Mine in Montana on June30, citing “a dramatic escalation in power prices” as the reasonfor the shutdown. Stripping operations continued after the millclosed, and the company had anticipated resuming operations byyearend when it had expected utility rates to abate after the peaksummer demand (Platt’s Metal’s Week, 2000b). At yearend,however, the mine remained closed and was not anticipated toreopen in the near term.
Despite numerous setbacks and limited interest by investmentcompanies, Summo Minerals Corp. continued predevelopmentwork on its Lisbon Valley Copper Project, San Juan County,UT. The company resumed a drilling program early in the yearin the Centennial SE Extension deposit and updated reservecalculations for a revised “final feasibility study,” approved inSeptember, for submission to banks for solicitation of financing. The plan design is for an open pit, heap-leach, SX-EW projectproducing 18,000 t/yr of cathode during a minimum 8.5-year
period at anticipated cash and full operating costs of below$0.50 and $0.75 per pound of copper, respectively. Reserveswere estimated at 333 Mt of ore grading an average 0.54%copper with a stripping ratio of 2.25 (Summo Minerals Corp.,2000a; 2000b).
At Kennecott Utah Copper Corp.’s Bingham Canyon Mine,production of copper increased by 5.9% to 296,000 t, and goldoutput rose 44% to 529,000 ounces compared with productionin 1999. A 4% increase in ore milled, combined with a 4% and44% increase, respectively, in copper and gold grades,accounted for the production growth. Copper ore grades hadfallen from 0.62% copper in 1998 to 0.55% in 1999 andrecovered, beginning midyear, to an annual average of 0.57% in2000, still below the expected life-of-the-mine average. Kennecott anticipated that large-scale underground miningwould extend mine life by 15 years when open pit reserves areexhausted around 2015. Refinery output increased nominally to269,000 t with the smelter reportedly operating in excess ofrated capacity (Rio Tinto plc, 2001, p. 37).
Nord Resources Corp. was seeking financing to return theJohnson Camp copper mine to full production. Nord acquiredJohnson Camp in June 1999. In the first 6 months of 2000, thecompany incurred losses related to the planned redevelopmentof the mine but operated on a close to break-even basis after that(Nord Resources Corp., 2000b). The Johnson Camp CopperMine, 105 kilometers east of Tucson, AZ, is currently beingoperated on a maintenance basis. Since 1975, the mine hasproduced more than 68,000 t of cathode copper from open pitmining, heap leaching, and SX-EW processing of oxide ores. Although significant reserves remain, mining operations ceasedin 1997. Heap leaching continues and the mine is producing 1to 2 million pounds of copper annually. A detailed feasibilitystudy to restart the Johnson Camp Mine demonstrated that themine could produce 8,900 t per year of copper cathode for 11years at an average cash cost of $0.63 per pound. Startup costswould total $13.5 million, including $7.9 million of capitalinvestment and $5.6 million of working capital and other costs. Current reserves are placed at 3.2 Mt grading 0.417% copper(Nord Resources Corp., 2000a).
Consumption
Reported consumption of refined copper by domesticmanufacturers continued its upward trend, rising by 1.6%, to3.03 Mt. In addition to refined copper, domestic manufacturersdirectly consumed (melted or processed into chemicals) 1.3 Mtof copper-base scrap containing about 1 Mt of recoverablecopper. An additional 75,000 t of copper was recovered in theconsumption of aluminum-, nickel-, and zinc-base scrap.
Consumption of refined copper at wire-rod mills increasednominally and accounted for about 74% of domesticconsumption of refined copper. For the third consecutive year,consumption growth at wire-rod mills was moderated byincreased imports of wire rod, principally from Canada andMexico, from which imports rose by 45,000 t to 225,000 t in2000. Total imports rose by 63,000 t. Capacity utilization atdomestic mills remained high following closure of two wire-rodmills in 1999. According to industry reports, despite increasedimports, the U.S. wire-rod market was tight and at midyearexperienced supply shortages. Wire-rod inventories in June fellto their lowest levels in recent years. An extended maintenance

COPPER—2000 23.5
shut down at Grupo Minero Mexico S.A.’s Mexican wire-rodmill led to a 20% cutback in shipments in June, and productiondifficulties were also reported at Southwire Co., which hadclosed its secondary smelter and electrolytic refinery at the endof May (Platt’s Metals Week, 2000d). In response to limitedU.S. capacity and expectations of continued demand growth,Alcatel, a French-owned communications company with wire-rod mills in Canada, France, and Germany, announced plans toconstruct a 200,000-t/yr wire-rod mill in the southeastern UnitedStates. Commissioning was anticipated in 2 to 3 years (Platt’sMetals Week, 2000a).
At brass mills, which were the second largest consumers ofrefined copper, consumption of refined copper rose by about5%, while consumption of copper-base scrap rose by less than2%, reflecting the continued impact of relatively low copperprices that reduced the cost of using refined copper and reducedthe availability of scrap for processing. Brass mills stillremained the largest consumers of scrap, accounting for abouttwo-thirds of the total copper recoverable from scrap.
According to data compiled by the CDA (2001, p. 18), thesupply of copper and copper-alloy products to the U.S. marketby fabricators (wire mills, brass mills, foundries, and powderproducers), including net imports, rose by about 4% to 4.3 Mt,up from the revised total of 4.16 Mt in 1999, and contained anestimated 3.9 Mt of copper. About 71% of these shipments wasas unalloyed copper products. Wire mill products accounted forabout 49% of total shipments to the domestic market; brass millproducts, 47%; and foundry and powder products, 4%. Inbuilding construction, the largest end-use sector, shipments wereessentially unchanged and accounted for about 39% of themarket, down from 41% the previous year. Buildingconstruction included products used for building wire, plumbingand heating, air conditioning and commercial refrigeration,builders hardware, and architectural applications. Shipments forelectric/electronic products and consumer/general products roseby 9% and 11%, respectively, and accounted for 28% and 11%of the market, respectively. Shipments for transportationequipment, 11%, and industrial machinery, 11%, rose slightly.
In May, Cerro Copper Products Co. announced that it hadbroken ground on a new “flagship” tube manufacturing anddistribution center in Cedar City, UT. The tube mill wasexpected to be commissioned in 2001. The facility is part of a3-year, $125 million expansion program. In addition toemploying a unique, Cerro-developed process to produce bothplumbing and air conditioning tube, the mill will be the onlytube mill in the western United States (Cerro Copper Products,2000). According to the Copper Development Association Inc.data (2001, p. 17), though down slightly in 2000, plumbing andcommercial tube shipments to the U.S. market have risen 14%since 1995.
Prices and Stocks
Despite growing global inventories, copper prices in Januarycontinued the upward trend begun in mid-1999 and rose to theirhighest level in almost 2 years. The Commodity Exchange(COMEX) spot price averaged $0.85 per pound in January. With global inventories held on the commodity exchangescontinuing to rise in February, prices began to weaken. Despitea sharp reversal in the upward trend in global inventoriesbeginning in March, prices remained lower, the COMEX price
averaging only $0.80 per pound in the March to June period. According to data compiled by the International Copper StudyGroup (2001a, p. 6), monthend inventories of refined copper onthe global exchanges (LME, COMEX, and Shanghai FuturesExchange) peaked in February at 990,000 t before beginning asustained slide that lasted through November when monthendinventories fell to 495,000 t. Prices began to respond to thedecline in global stocks in May, and the average monthlyCOMEX price climbed to $0.91 per pound in September. Prices weakened and fluctuated during the fourth quarter of theyear, the COMEX price averaging $0.86 per pound andfinishing the year at $0.85 per pound. At yearend, inventoriesof copper held on the metals exchanges totaled 530,000 t, andtotal reported inventories, as reported by the InternationalCopper Study Group (ICSG), decreased to 1.31 Mt, down from1.62 Mt in 1999. At the prevailing rate of consumption, globalinventories at yearend represented only about 31 days of supply,down from 41 days in 1999.
Trade
Net imports of refined copper rose sharply for the fifthconsecutive year to 962,000 t, compared with 812,000 t in 1999. General imports of refined copper (1,025,000 t) were 30,000 tlower than imports for consumption as bonded material wasremoved from U.S.-located London Metal Exchange Ltd.(LME) warehouses. Beginning in March, LME inventoriesdeclined steadily and at yearend totaled 204,000 t, down from412,000 t at yearend 1999. Exports of refined copper rose to94,000 t, up from 25,000 t in 1999, and accounted for some ofthe drawdown in LME inventories.
Reduced domestic capacities led to shifts in the trade patternfor several copper products. Continuing the trend begun duringthe second half of 1999 following the closure of three primarysmelters, the United States reverted to being a net exporter ofcopper in concentrates during 2000. The United States exported175,000 t of copper in concentrate while having only negligibleimports. Prior to 1998, the United States had been a long-termnet exporter of concentrates. Reduced secondary processingcapacity led to a surge in scrap exports; combined scrap exportsof 486,000 t for 2000 exceeded exports of 315,000 t in 1999. China, including Hong Kong, was the largest recipient,accounting for 223,000 t, 46%, of total scrap exports. Owing toreduced capacity at domestic wire-rod mills, growth inindustrial demand for wire rod was met by increased imports. Wire-rod imports (as reported by the U.S. Census Bureau andadjusted by the U.S. Geological Survey) rose to 247,000 t, upfrom 197,000 t in 1999 and 108,000 t in 1998.
According to U.S. Census Bureau data compiled by theCopper and Brass Fabricators Council Inc. (2001, p. 1-9), theUnited States imported 394,000 t of copper and copper-alloysemifabricated products, excluding wire-rod mill products, andexported 158,000 t. Net imports rose to 236,000 t, up from139,000 t in 1999 and 86,000 t in 1998. Canada and Mexicoaccounted for 75% of semifabricated copper exports and 30% ofimports.
Each year during the anniversary month of the publication ofan antidumping or countervailing duty order, finding, orsuspension of investigation, interested parties may request thatthe Department of Commerce conduct a review of the prevailingruling. Numerous copper products for which antidumping or

U.S. GEOLOGICAL SURVEY MINERALS YEARBOOK—200023.6
countervailing duties have been imposed were subject to reviewin 2000. In May, the International Trade Administration (ITA)ruled that revocation of antidumping duty orders against brasssheet and strip from the Republic of Korea, the Netherlands, andSweden was not likely to lead to recurrence or continuation ofmaterial injury to the domestic industry and that it was revokingthe duties effective January 1, 2000 (U.S. Department ofCommerce, 2000b). Conversely, the ITA ruled to maintainantidumping and countervailing duty orders for brass sheet andstrip from Brazil, Canada, France, Germany, Italy, and Japan(U.S. Department of Commerce, 2000a).
World Review
The global production oversupply for refined copper thatdeveloped at midyear 1997, and continued into 1999, began toshift during the first quarter of 2000. According to datacompiled by the ICSG, reported world inventories of refinedcopper by the end of June had declined 220,000 t from thoseheld at yearend 1999, and by yearend 2000 were down by310,000 t to 1.3 Mt. At the prevailing rate of consumption,yearend world inventories represented a 31-day supply ofrefined copper, down from about 42 days at the end of 1999. Inventories held in LME warehouses declined by 433,000 t,overshadowing increases in reported consumer and ShanghaiFutures Exchange inventories. The transition from productionsurplus in 1999 to production deficit in 2000 reflects aslowdown in refined production growth and an almost 8%growth in world refined copper consumption to 15.3 Mt. Whileconsumption grew only about 2% in North America to 3.74 Mt,consumption by European Union countries grew by about 7% to4.1 Mt, and Asian countries by about 11% to 6.1 Mt. Growthwas particularly strong in China, where usage grew by about25% to 1.88 Mt (International Copper Study Group, 2001a).
In 2000, despite the decline in U.S. capacity, estimated worldmine capacity rose by 470,000 t/yr, or 3.4%, to 14.4 Mt/yr,extending the strong growth trend that began in 1995. Chile,Indonesia, and Kazakhstan accounted for most of the capacityexpansion, their capacities having grown by 270,000 t/yr,145,000 t/yr, and 90,000 t/yr, respectively. Capacity alsoincreased significantly in Australia (33,000 t/yr) and China(30,000 t/yr). World smelter capacity, which had trendedupward over the preceding 5 years, declined by about 150,000t/yr. Indefinite closures of U.S. smelters were partially offset byexpanded capacity in Australia (110,000 t/yr), where the MountIsa smelter reached full capacity and the new Port Kemblasmelter was commissioned during the year. In Korea,incremental expansions of the Onsan smelters boosted capacityby about 40,000 t/yr; in Bulgaria, expansion of the UM Pirdopsmelter increased capacity by 45,000 t/yr; and in China,installation of an Isasmelt furnace at the Yunnan smelter boostedcapacity by about 50,000 t (International Copper Study Group,2001c, p.1-56). According to CRU International Ltd. (2001, p.54-55), the supply of copper concentrates for smelting exceededdemand by about 230,000 t/yr of contained copper, and contracttreatment (smelting) and refining charges assessed by smeltersaveraged about $0.18 per pound of recoverable copper,essentially unchanged from that in 1999.
World refinery capacity rose by about 140,000 t/yr, less than1%, principally owing to expansion of electrowinning capacityin Chile. The decline in U.S. electrolytic refining capacity was
offset by increased capacity in Australia, where the Port Kemblarefinery was commissioned (60,000 t/yr expanding to 120,000t/yr) and the Olympic Dam refinery was expanded by about50,000 t/yr. In Indonesia, capacity increased by about 30,000t/yr at the Gresik refinery, commissioned in 1999 (InternationalCopper Study Group, 2000c, p. 57-98).
Outlook
U.S. mine production is expected to decline by about 100,000t in 2001 as the full impact of 2000 mine plan changes isrealized and new cost saving programs are implemented. Production is expected to decline by an additional 40,000 t in2002. The Morenci Mine in Arizona already closed itsremaining concentrator and converted to an all leach operationduring the first quarter 2001, reducing its total output butincreasing production of electrowon copper. At Miami,suspension of stripping in 2000 was expected to reduce outputin 2001 and 2002 by 16,000 t and 38,000 t, respectively. Themine plan implemented by Asarco at its Mission Mine atyearend should further reduce production in 2001 by about20,000 t. In June 2001, Kennecott announced that it wouldsuspend operations from its higher cost North concentrator,reducing ore throughput by about 18% (Kennecott Utah CopperCorp., 2001). Following cutbacks in concentrate output, thethree primary smelters closed in 1999 are expected to remainshuttered.
Primary refined production in 2001 is expected to declineonly slightly owing to a decrease in net exports of concentrateand increased electrowon production. Secondary refinedproduction is expected to fall following the May closure ofSouthwire Co.’s secondary smelter.
Domestic consumption of refined copper during the first 6months of 2001 was down by about 10% from the same periodin 2000. In addition to a more than 100,000 t decline in copperconsumption at wire-rod mills, weakness in the wire-rod marketwas indicated by a 20,000-t decline in net imports of wire rodfor the first 6 months of the year. Economic slowdown duringthe second half of 2001 was expected to keep demand at orbelow first half levels.
At the Annual General Session of the ICSG, held in June2001, in Lisbon, Portugal, a consensus view of the worldbalance of copper supply and use for refined copper wasdeveloped by Government and industry delegates. According tothe consensus, world production of refined copper from bothprimary and secondary sources in 2001 (adjusted to reflectprimary feed shortages and disruptions to operations) isprojected to increase by about 500,000 t (3.4%), while worldrefined copper use is expected to decline by about 100,000 t(less than 1%). This forecast follows a 10-year period ofsustained demand growth. Consequently, the production deficitthat developed in 2000 was expected to be reversed, and a smallsurplus of about 130,000 t of refined copper was anticipated. At the prevailing rate of use, this surplus represents only about a3-day supply of copper. Projections by the ICSG for 2002indicate that refined production, adjusted to reflect feedshortages and disruptions, will increase by only about 0.5% andwill not keep pace with the projected 3.7% growth in demand. As a result, a production deficit is expected for 2002(International Copper Study Group, 2001b).

COPPER—2000 23.7
References Cited
ASARCO Inc., 2000a, Asarco to consolidate corporate functions in Arizona: New York, ASARCO Inc. news release, July 25, 1 p.
———2000b, Asarco Mission Mine plan: New York, ASARCO Inc. newsrelease, October 30, 1 p.
Cerro Copper Products, 2000, Cerro selects flagship facility site: St. Louis,Cerro Copper Products news release, May 1, 2 p.
Copper and Brass Fabricators Council Inc., 2001, Import/export report: Washington DC, Copper and Brass Fabricators Council Inc., February, 62 p.
Copper Development Association Inc., 2001, Annual data 1999—Copper supplyand consumption: New York, Copper Development Association Inc., 20 p.
CRU International Ltd., 2001, Copper quarterly industry and market outlook: London, CRU International Ltd., April, 72 p.
Grupo Mexico S.A. de C.V., 2001a, Annual report—2000: Mexico City, GrupoMexico S.A. de C.V., 44 p.
———2001b, Grupo Mexico, S.A. de C.V. end of year 2000 results: MexicoCity, Grupo Mexico S.A. de C.V. press release, February 28, 7 p.
International Copper Study Group, 2001a, Copper Bulletin: Lisbon,International Copper Study Group, v. 8, no. 8, 48 p.
———2001b, Copper forecast for 2001 and 2002: Lisbon, Portugal,International Copper Study Group press release, June 18, 1 p.
———2001c, Directory of copper mines and plants: Lisbon, InternationalCopper Study Group, July, 89 p.
Kennecottt Utah Copper Corp., 2001, Kennecott to curtail operations: Magna,UT, Kennecott Utah Copper Corp. press release, May 25, 2 p.
Nord Resources Corp., 2000a, Nord Resources announces results of feasibilitystudy on Johnson Camp: Albuquerque, Nord Resources Corp. press release,March 6, 2 p.
———2000b, Nord Resources announces third quarter 2000 results: Albuquerque, Nord Resources Corp. press release, December 19, 2 p.
Phelps Dodge Corp., 2000, Phelps Dodge expects second quarter and full-year2000 results to be reduced by operational issues and restructuring charges: Phoenix, Phelps Dodge Corp. news release, June 27, 6 p.
———2001a, Form 10-K—2000: Securities and Exchange Commission, 124 p. ———2001b, Phelps Dodge reports 2000 earnings of 92 cents per share before
nonrecurring charges: Phoenix, Phelps Dodge Corp. news release, January25, 11 p.
Platt’s Metals Week, 2000a, Alcatel plans new copper rod plant: Platt’s MetalsWeek, v. 71, no. 32, August 7, p. 11.
———2000b, Montana’s 10-mil lb/yr Continental moly mine closes: Platt’sMetals Week, v. 71, no. 28, July 10, p. 1, 10.
———2000c, Phelps Dodge to invest $13 million in Sierrita copper mine: Platt’s Metals Week, v. 71, no. 13, March 27, p. 13.
———2000d, U.S. rod tightens on production glitches; cathode firm: Platt’sMetals Week, v. 71, no. 21, May 22, p. 10.
Rio Tinto plc, 2001, Annual report and accounts—2000: London, Rio Tinto plc,136 p.
Southwire Co., 2000, Southwire to close copper refinery and sell aluminumsmelter: Carrollton, GA, Southwire Co. news release, April 4, 2 p.
Summo Minerals Corp., 2000a, Increased ore reserves at Lisbon Valley copperproject revised terms for fixed lump sum construction: Denver, SummoMinerals Corp. news release, October 3, 1 p.
———2000b, Lisbon Valley copper SX-EW project final bankable feasibilitystudy completed: Denver, Summo Minerals Corp. news release, September 6,2 p.
U.S. Department of Commerce, 2000a, Continuation of antidumping andcountervailing duty orders for brass sheet and strip from Brazil, Canada,France, Italy, Germany, and Japan: Federal Register, May 1, p. 25304-25305.
———2000b, Revocation of antidumping duty orders—Brass sheet and stripfrom the Republic of Korea, the Netherlands, and Sweden: Federal Register,v. 65, no. 84, May 1, p. 25305.
U.S. Department of Labor, 2000, Superior-Essex, Pauline, KS—Notice ofnegative determination on reconsideration: Federal Register, v. 65, no. 87,May 4, p. 25948.
U.S. Environmental Protection Agency, 2000a, Copper sulfate pentahydrate;exemption from the requirement of a tolerance: Federal Register, v. 65, no.221, November 15, p. 68908-68912.
———2000b, National emissions standards for hazardous air pollutants forsource categories—National emissions standards for primary copper smelters: Federal Register, v. 65, no. 123, June 26, p. 39326-39334.
U.S. Geological Survey, 2000, 1998 assessment of undiscovered deposits ofgold, silver, copper, lead, and zinc in the United States: U.S. GeologicalSurvey Circular 1178, 21 p.
U.S. Mint, 2001, The U.S. Mint reports to Congress on the success of theGolden Dollar coin after the first year: Washington, DC, U.S. Mint pressrelease, April 2, 1 p.
GENERAL SOURCES OF INFORMATION
U.S. Geological Survey Publications
Copper. Ch. in Metal Prices in the United States Through 1998,1999.
Copper. Ch. in Mineral Commodity Summaries, annual.Copper. Ch. in United States Mineral Resources, Professional
Paper 820, 1973.Copper. Mineral Industry Surveys, monthly.The Nature and Use of Copper Reserve and Resource Data,
Professional Paper 907-F, 1981.
Other
American Bureau of Metal Statistics (ABMS) Non-FerrousMetal Data.
The Availability of Copper in Market Economy Countries, U.S.Bureau of Mines Information Circular 9310, 1992.
Copper. Ch. in Mineral Facts and Problems, U.S. Bureau ofMines Bulletin 675, 1985.
Annual Data 2001—Copper Supply and Consumption: CopperDevelopment Association Inc.
International Copper Study Group, monthly Copper Bulletin.World Bureau of Metal Statistics (WBMS, London), monthly
World Metals Statistics.

TABLE 1SALIENT COPPER STATISTICS 1/
(Metric tons unless otherwise specified)
1996 1997 1998 1999 2000United States: Mine production: Ore concentrated thousand metric tons 274,000 284,000 268,000 236,000 202,000 Average yield of copper 2/ percent 0.47 r/ 0.46 0.46 0.42 r/ 0.44 Recoverable copper: Arizona 1,240,000 1,250,000 1,190,000 1,050,000 928,000 Michigan, Montana, Utah 339,000 337,000 337,000 313,000 W New Mexico 256,000 259,000 252,000 197,000 195,000 Other States 85,600 96,500 78,900 37,400 321,000 Total 1,920,000 1,940,000 1,860,000 1,600,000 1,440,000 Total value millions $4,610 $4,570 $3,220 $2,680 $2,810 Smelter production: From domestic and foreign ores 1,300,000 1,440,000 1,490,000 1,090,000 (3/) From scrap (new and old) 339,000 285,000 232,000 205,000 (3/) Total 1,640,000 1,720,000 1,720,000 1,290,000 1,000,000 Byproduct sulfuric acid, sulfur content thousand metric tons 1,240 1,430 1,420 1,130 830 Refinery production, primary materials: Electrolytic from domestic ores 1,290,000 1,370,000 1,290,000 1,110,000 865,000 Electrolytic from foreign materials 147,000 113,000 238,000 196,000 163,000 Electrowon 574,000 586,000 609,000 586,000 557,000 Total 2,010,000 2,070,000 2,140,000 1,890,000 1,590,000 Refinery production, secondary materials (scrap): Electrolytic 193,000 233,000 202,000 156,000 (3/) Fire refined 152,000 163,000 147,000 73,700 (3/) Total 345,000 396,000 349,000 230,000 208,000 Grand total 2,350,000 2,470,000 2,490,000 2,120,000 1,790,000 Secondary copper produced: Recovered from new scrap 891,000 967,000 956,000 949,000 r/ 952,000 Recovered from old scrap 428,000 498,000 466,000 381,000 363,000 Total 1,320,000 1,460,000 1,420,000 1,330,000 1,310,000 Copper sulfate production 43,400 48,400 44,000 r/ 52,700 55,500 Exports: Refined 169,000 92,900 86,200 25,200 93,600 Unmanufactured 4/ 748,000 628,000 412,000 395,000 650,000 Imports: Refined 543,000 632,000 683,000 837,000 1,060,000 Unmanufactured 4/ 961,000 999,000 1,190,000 1,280,000 1,350,000 Copper stocks, December 31: Blister and in-process material 173,000 180,000 160,000 138,000 122,000 Refined copper: Refineries 32,200 59,700 44,200 9,830 14,800 Wire rod mills 32,100 24,600 37,300 32,500 r/ 28,600 Brass mills 14,000 14,300 20,800 23,800 r/ 23,600 Other industry 2,700 3,390 3,870 3,870 r/ 4,680 New York Commodity Exchange (COMEX) 26,600 83,000 85,200 83,100 58,700 London Metal Exchange (LME), U.S. warehouses 38,300 129,000 341,000 412,000 204,000 Total 146,000 314,000 532,000 565,000 r/ 334,000 Consumption: Refined copper, reported 2,610,000 2,790,000 2,890,000 2,980,000 r/ 3,030,000 Apparent consumption, primary refined and old scrap 5/ 2,830,000 2,940,000 r/ 3,030,000 r/ 3,130,000 3,110,000 Price: Producer, weighted average cents per pound 109.04 106.95 78.64 75.91 88.16 COMEX, first position do. 105.87 103.58 75.08 72.11 83.97 LME, Grade A cash do. 104.05 103.25 75.01 71.33 82.24World, production: Mine thousand metric tons 11,000 11,400 12,100 r/ 12,700 r/ 13,200 e/ Smelter do. 10,800 11,200 r/ 11,400 11,700 r/ 11,900 e/ Refinery do. 12,700 13,500 14,200 r/ 14,600 r/ 15,000 e/e/ Estimated. r/ Revised. W Withheld to avoid disclosing company proprietary data; included with "Other States."1/ Data are rounded to no more than three significant digits, except prices; may not add to totals shown.2/ Yield calculations are for concentrated ore only.3/ Withheld to avoid disclosing company proprietary data; included in "Total."4/ Includes copper content of alloy scrap.5/ In 1998, 1999, and 2000, apparent consumption is calculated using General imports of 725,000 tons, 915,000 tons, and 1,020,000 tons respectively.

TABLE 2LEADING COPPER-PRODUCING MINES IN THE UNITED STATES IN 2000, IN ORDER OF OUTPUT 1/
Capacity(thousand
Rank Mine County and State Operator Source of copper metric tons)1 Morenci Greenlee, AZ Phelps Dodge Corp. Copper ore, concentrated and leached 4502 Bingham Canyon Salt Lake, UT Kennecott Utah Copper Corp. Copper-molybdenum ore, concentrated 3103 Ray Pinal, AZ ASARCO Inc. Copper ore, concentrated and leached 1504 Chino Grant, NM Phelps Dodge Corp. Copper-molybdenum ore, concentrated and leached 1255 Bagdad Yavapai, AZ do. do. 1156 Sierrita Pima, AZ do. do. 1207 Mission Complex do. ASARCO Inc. Copper ore, concentrated 1108 Tyrone Grant, NM Burro Chief Copper Co. Copper ore, leached 759 Miami (Inspiration) Gila, AZ Phelps Dodge Corp. do. 7510 Continental Silver Bow, MT Montana Resources Inc. Copper-molybdenum ore, concentrated 5011 Silver Bell Pima, AZ ASARCO Inc. Copper ore, leached 2112 San Manuel Pinal, AZ BHP Copper Co. do. 2513 Miami Gila, AZ do. do. 1214 Pinto Valley do. do. do. 101/ The mines in this list accounted for 99% of the U.S. mine production in 2000.
TABLE 3MINE PRODUCTION OF COPPER-BEARING ORES AND RECOVERABLE COPPER CONTENT OF ORES
PRODUCED IN THE UNITED STATES, BY SOURCE AND TREATMENT PROCESS 1/
(Metric tons)
1999 2000Gross Recoverable Gross Recoverable
Source and treatment process weight copper weight copperMined copper ore:Concentrated 236,000,000 1,000,000 202,000,000 2/ 879,000Leached NA 586,000 NA 557,000 Total NA 1,590,000 NA 1,440,000Copper precipitates shipped: leached from tailings, dumps, and in-place material 7,850 r/ 6,230 3,910 2,810Other copper-bearing ores 3/ 6,550,000 7,220 9,880,000 5,310Grand total XX 1,600,000 XX 1,440,000r/ Revised. NA Not available. XX Not applicable. 1/ Data rounded to three significant digits; may not add to totals shown.2/ In 2000, 17,243 kilograms of gold and 285 metric tons of silver were recovered from concentrated ore. Theaverage value of gold and silver per metric ton of ore concentrated was $0.72.3/ Includes gold ore, lead ore, silver ore, silver-copper ore, zinc ore, and ore shipped directly to smelter.
TABLE 4CONSUMPTION OF COPPER AND BRASS MATERIALS IN THE UNITED STATES, BY ITEM 1/
(Metric tons)
Foundries, Smelters,chemical plants, refiners,
Item Brass mills Wire rod mills miscellaneous users ingot makers Total1999: Copper scrap 1,010,000 r/ W 79,900 535,000 r/ 2/ 1,630,000 Refined copper 3/ 691,000 2,230,000 52,200 r/ 4,480 2,980,000 r/ Hardeners and master alloys 703 -- 2,100 -- 2,800 Brass ingots -- -- 124,000 r/ -- 124,000 r/ Slab zinc 55,800 -- (4/) (4/) 78,200 r/2000: Copper scrap 1,030,000 W 83,000 482,000 2/ 1,600,000 Refined copper 3/ 723,000 2,240,000 59,800 4,590 3,030,000 Hardeners and master alloys 621 -- 2,260 -- 2,880 Brass ingots -- -- 122,000 -- 122,000 Slab zinc 57,500 -- (4/) (4/) 82,800See footnotes at end of table.

TABLE 4--ContinuedCONSUMPTION OF COPPER AND BRASS MATERIALS IN THE UNITED STATES, BY ITEM 1/
r/ Revised. W Withheld to avoid disclosing company proprietary data; included with "Smelters, refiners, ingot makers." -- Zero.1/ Data are rounded to no more than three significant digits; may not add to totals shown.2/ Includes item indicated by symbol W.3/ Detailed information on consumption of refined copper can be found in table 5.4/ Withheld to avoid disclosing company proprietary data; included in "Total."
TABLE 5CONSUMPTION OF REFINED COPPER SHAPES IN THE UNITED STATES, BY CLASS OF CONSUMER 1/
(Metric tons)
Ingots and Cakes and Wirebar, billets,Class of consumer Cathodes ingot bars slabs other Total
1999: Wire rod mills 2,220,000 -- -- 16,800 2,230,000 Brass mills 492,000 18,300 79,300 102,000 691,000 Chemical plants -- -- -- 1,220 1,220 Ingot makers W W W 4,480 2/ 4,480 Foundries 3,460 6,100 r/ -- 11,600 21,200 r/ Miscellaneous 3/ W W W 29,800 2/ 29,800 Total 2,710,000 24,400 r/ 79,300 166,000 2,980,000 r/2000: Wire rod mills 2,220,000 -- -- 18,700 2,240,000 Brass mills 501,000 18,300 101,000 103,000 723,000 Chemical plants -- -- -- 1,200 1,200 Ingot makers W W W 4,590 2/ 4,590 Foundries 3,810 5,530 -- 16,700 26,000 Miscellaneous 3/ W W W 32,600 2/ 32,600 Total 2,730,000 23,800 101,000 176,000 3,030,000r/ Revised. W Withheld to avoid disclosing company proprietary data; included with "Wirebar, billets, other." -- Zero.1/ Data are rounded to no more than three significant digits; may not add to totals shown.2/ Includes items indicated by symbol W.3/ Includes consumers of copper powder and copper shot, iron and steel plants, primary smelters producing alloys otherthan copper, and other manufacturers.
TABLE 6COPPER RECOVERED FROM SCRAP PROCESSED IN THE UNITED STATES,
BY KIND OF SCRAP AND FORM OF RECOVERY 1/
(Metric tons)
1999 2000 Kind of scrap: New scrap: Copper-base 903,000 906,000 Aluminum-base 46,200 r/ 45,500 Nickel-base 94 18 Total 949,000 r/ 952,000 Old scrap: Copper-base 349,000 334,000 Aluminum-base 31,200 r/ 28,400 Nickel-base 44 170 Zinc-base 31 32 Total 381,000 363,000 Grand total 1,330,000 1,310,000Form of recovery: As unalloyed copper: At electrolytic plants 156,000 128,000 At other plants 81,800 88,400 Total 238,000 217,000 In brass and bronze 1,000,000 1,010,000 In alloy iron and steel 599 r/ 549 In aluminum alloys 78,200 r/ 74,900See footnotes at end of table.

TABLE 6--ContinuedCOPPER RECOVERED FROM SCRAP PROCESSED IN THE UNITED STATES,
BY KIND OF SCRAP AND FORM OF RECOVERY 1/
(Metric tons)
1999 2000 Form of recovery--Continued: In chemical compounds 11,800 2/ 11,700 Total 1,090,000 1,100,000 Grand total 1,330,000 1,310,000r/ Revised. 1/ Data are rounded to no more than three significant digits; may not add to totals shown.2/ 1999 data reflects expanded coverage to include copper sulfate and other copperchemical producers.
TABLE 7COPPER RECOVERED AS REFINED COPPER AND IN ALLOYS AND OTHER FORMS
FROM COPPER-BASE SCRAP PROCESSED IN THE UNITED STATES, BY TYPE OF OPERATION 1/
(Metric tons)
From new scrap From old scrap TotalType of operation 1999 2000 1999 2000 1999 2000
Ingot makers 34,700 29,900 94,700 90,700 129,000 121,000Refineries 2/ 48,800 39,000 181,000 169,000 230,000 208,000Brass and wire rod mills 804,000 822,000 25,900 22,200 830,000 844,000Foundries and manufacturers 11,400 10,800 40,000 44,500 51,400 55,400Chemical plants 3/ 3,940 3,880 7,840 7,840 11,800 11,700 Total 903,000 906,000 349,000 334,000 1,250,000 1,240,0001/ Data are rounded to no more than three significant digits; may not add to totals shown.2/ Electrolytically refined and fire-refined scrap based on source of material at smelter level.3/ 1999 data reflects expanded coverage to include copper sulfate and other copper chemical producers.
TABLE 8PRODUCTION OF SECONDARY COPPER AND COPPER-ALLOY PRODUCTS
IN THE UNITED STATES, BY ITEM PRODUCED FROM SCRAP 1/
(Metric tons)
Item produced from scrap 1999 2000Unalloyed copper products: Electrolytically refined copper 156,000 128,000 Fire-refined copper 73,700 80,000 Copper powder 7,420 7,510 Copper castings 647 839 Total 238,000 217,000Alloyed copper products: Brass and bronze ingots: Tin bronzes 15,800 r/ 14,600 Leaded red brass and semired brass 97,300 r/ 93,500 High leaded tin bronze 13,000 12,700 Yellow brass 6,010 5,650 Manganese bronze 7,060 r/ 6,240 Aluminum bronze 6,870 7,030 Nickel silver 2,050 2,260 Silicon bronze and brass 4,530 4,680 Copper-base hardeners and master alloys 13,200 r/ 13,800 Miscellaneous 169 r/ 3,500 Total 166,000 r/ 164,000 Brass mill and wire-rod mill products 1,030,000 1,060,000 Brass and bronze castings 43,400 45,600 Brass powder 214 198 Copper in chemical products 11,800 2/ 11,700 Grand total 1,490,000 r/ 1,490,000r/ Revised.1/ Data are rounded to no more than three significant digits; may not add to totals shown.2/ 1999 data reflects expanded coverage to include copper sulfate and other copper chemical products.

TABLE 9COMPOSITION OF SECONDARY COPPER-ALLOY PRODUCTION IN THE UNITED STATES 1/
(Metric tons)
Copper Tin Lead Zinc Nickel Aluminum TotalBrass and bronze ingot production: 2/ 1999 r/ 137,000 4,850 7,900 15,700 267 19 166,000 2000 136,000 5,240 8,430 14,400 252 14 164,000Secondary metal content of brass mill products: 1999 830,000 950 7,840 188,000 W W 1,030,000 2000 844,000 1,650 7,450 199,000 W W 1,060,000Secondary metal content of brass and bronze castings: 1999 39,100 708 1,100 2,260 112 119 43,400 2000 42,200 633 837 1,700 85 98 45,600r/ Revised. W Withheld to avoid disclosing company proprietary data; included in "Total."1/ Data are rounded to no more than three significant digits; may not add to totals shown.2/ Includes about 97% from scrap and 3% from other than scrap in 1999 (revised) and about 96% from scrap and 4% from other than scrap in 2000.
TABLE 10CONSUMPTION AND YEAREND STOCKS OF COPPER-BASE SCRAP 1/
(Metric tons, gross weight)
1999 2000Scrap type and processor Consumption Stocks Consumption Stocks
No. 1 wire and heavy: Smelters, refiners, ingot makers 106,000 2,360 r/ 86,000 2,260 Brass and wire-rod mills 431,000 (2/) 438,000 (2/) Foundries and miscellaneous manufacturers 41,200 2,520 45,500 2,650No. 2 mixed heavy and light: Smelters, refiners, ingot makers 137,000 6,020 r/ 133,000 2,120 Brass and wire-rod mills 21,200 (2/) 13,800 (2/) Foundries and miscellaneous manufacturers 3,230 226 3,320 193 Total unalloyed scrap: Smelters, refiners, ingot makers 243,000 8,380 r/ 219,000 4,370 Brass and wire-rod mills 452,000 20,300 452,000 17,600 Foundries and miscellaneous manufacturers 44,500 2,740 r/ 48,800 2,840Red brass: 3/ Smelters, refiners, ingot makers 50,200 2,150 r/ 52,700 2,120 Brass mills 10,400 (2/) 9,330 (2/) Foundries and miscellaneous manufacturers 10,600 (2/) 12,400 (2/) Leaded yellow brass: Smelters, refiners, ingot makers 20,600 1,110 r/ 16,500 1,210 Brass mills 400,000 (2/) 396,000 (2/) Foundries and miscellaneous manufacturers 1,740 (2/) 1,680 (2/) Yellow and low brass, all plants 76,600 1,160 r/ 105,000 713Cartridge cases and brass, all plants 79,400 (2/) 72,600 (2/) Auto radiators: Smelters, refiners, ingot makers 53,400 2,130 r/ 48,300 1,610 Foundries and miscellaneous manufacturers 4,650 (2/) 2,750 (2/) Bronzes: Smelters, refiners ingot makers 16,100 886 r/ 11,100 1,130 Brass mills and miscellaneous manufacturers 10,600 (2/) 11,800 (2/) Nickel-copper alloys, all plants 23,000 369 r/ 28,100 314Low grade and residues: Smelters, refiners, miscellaneous manufacturers 111,000 13,100 r/ 88,600 7,670Other alloy scrap: 4/ Smelters, refiners, ingot makers 12,100 839 r/ 11,300 324 Brass mills and miscellaneous manufacturers 6,740 (2/) 7,600 (2/) Total alloyed scrap: Smelters, refiners, ingot makers 258,000 21,200 r/ 221,000 15,300 Brass mills 593,000 35,500 620,000 39,500 Foundries and miscellaneous manufacturers 35,500 3,030 r/ 34,200 2,360 Total scrap: Smelters, refiners, ingot makers 501,000 29,600 r/ 440,000 19,600 Brass and wire-rod mills 1,050,000 55,700 1,070,000 57,200 Foundries and miscellaneous manufacturers 79,900 5,770 r/ 83,000 5,210See footnotes at end of table.

TABLE 10--ContinuedCONSUMPTION AND YEAREND STOCKS OF COPPER-BASE SCRAP 1/
r/ Revised.1/ Data are rounded to no more than three significant digits; may not add to totals shown.2/ Individual breakdown is not available; included in "Total unalloyed scrap," "Total alloyed scrap," and "Total scrap."3/ Includes cocks and faucets, commercial bronze, composition turnings, gilding metal, railroad car boxes, and silicon bronze.4/ Includes aluminum bronze, beryllium copper, and refinery brass.
TABLE 11CONSUMPTION OF PURCHASED COPPER-BASE SCRAP 1/ 2/
(Metric tons, gross weight)
From new scrap From old scrap TotalType of operation 1999 2000 1999 2000 1999 2000
Ingot makers 46,300 44,000 132,000 125,000 178,000 169,000Smelters and refineries 71,100 58,800 252,000 212,000 323,000 271,000Brass and wire-rod mills 1,020,000 1,050,000 26,800 23,000 1,050,000 1,070,000Foundries and miscellaneous manufacturers 27,200 26,200 52,700 56,800 79,900 83,000 Total 1,160,000 1,180,000 464,000 417,000 1,630,000 1,600,0001/ Data are rounded to no more than three significant digits; may not add to totals shown.2/ Consumption at brass and wire-rod mills assumed equal to receipts.
TABLE 12FOUNDRIES AND MISCELLANEOUS MANUFACTURERS
CONSUMPTION OF BRASS INGOT, REFINED COPPER ANDCOPPER SCRAP IN THE UNITED STATES 1/
(Metric tons)
Ingot type or material consumed 1999 2000 Tin bronzes 33,200 29,900Leaded red brass and semired brass 70,100 r/ 71,000Yellow, leaded, low brass 2/ 8,520 r/ 8,510Manganese bronze 4,720 4,590Nickel silver 3/ 2,710 3,480Aluminum bronze 4,140 4,650Hardeners and master alloys 4/ 2,100 2,260Lead free alloys 5/ 141 r/ 145 Total brass ingot 126,000 r/ 125,000Refined copper 52,200 r/ 59,800Copper scrap 79,900 83,000r/ Revised.1/ Data are rounded to no more than three significant digits; maynot add to totals shown.2/ Includes brass and silicon bronze.3/ Includes brass, copper nickel, and nickel bronze.4/ Includes special alloys.5/ Includes copper-bismuth and copper-bismuth-selenium alloys.
TABLE 13AVERAGE PRICES FOR COPPER SCRAP AND ALLOY-INGOT, BY TYPE
(Cents per pound)
Dealers' buying (New York) Alloy-ingot (New York) 1/Brass mills Refiners No. 2 Red brass turnings No. 115 brass Yellow brass
Year No. 1 scrap No. 2 scrap scrap and borings (85-5-5-5) (405)1999 70.88 57.53 42.97 37.74 138.50 135.252000 80.67 64.99 51.43 39.95 138.50 135.251/ List price quotes effective July 1996.
Source: American Metal Market.

TABLE 14U.S. EXPORTS OF UNMANUFACTURED COPPER (COPPER CONTENT), BY COUNTRY 1/
Ore and concentrate Matte, ash, precipitates Refined Unalloyed copper scrap Blister and anodes TotalQuantity Value Quantity Value Quantity Value Quantity Value Quantity Value Quantity Value
Country (metric tons) (thousands) (metric tons) (thousands) (metric tons) (thousands) (metric tons) (thousands) (metric tons) (thousands) (metric tons) (thousands)1999 63,100 r/ $72,500 r/ 26,700 $34,700 25,200 $42,100 128,000 $166,000 30,800 $54,400 274,000 $369,0002000: Belgium -- -- 48 78 -- -- 731 5,320 397 532 1,180 5,930 Brazil 3,090 5,270 3 9 15 22 97 106 33 68 3,240 5,480 Canada 45,000 68,500 13,100 10,500 5,990 12,000 45,300 50,900 10,400 13,300 120,000 155,000 China 8,500 11,000 10 95 52,700 99,400 124,000 101,000 61 120 185,000 212,000 Finland 4,680 7,990 -- -- 19 47 -- -- -- -- 4,690 8,030 Germany 6,100 10,200 -- -- 123 281 2,070 5,270 383 758 8,670 16,500 Hong Kong 111 135 3 4 1,750 3,310 6,900 6,870 2,330 5,320 11,100 15,600 Italy 7 25 5 7 97 145 147 463 510 1,100 766 1,740 Japan 483 1,290 56 551 74 110 15,900 38,900 1,990 4,680 18,500 45,500 Korea, Republic of 1,180 8,080 10 24 538 880 20,600 31,500 589 1,380 22,900 41,900 Mexico 31,500 22,900 17,900 22,500 2,980 5,460 2,760 7,350 1,680 2,650 56,800 60,900 Philippines 4,300 6,920 -- -- 4 6 28 31 89 261 4,420 7,220 Singapore 115 297 -- -- 7,220 14,600 979 1,050 953 2,280 9,270 18,300 Taiwan 65 79 93 315 20,400 36,700 5,080 7,530 2,230 5,180 27,900 49,900 United Kingdom 600 673 40 88 33 50 113 253 439 976 1,230 2,040 Other 1,200 2,530 90 223 1,640 3,190 2,840 3,530 1,250 2,930 7,020 12,400 Total 107,000 146,000 31,300 34,300 93,600 176,000 228,000 260,000 23,300 41,600 483,000 658,000r/ Revised. -- Zero.1/ Data are rounded to no more than three significant digits; may not add to totals shown.
Source: U.S. Census Bureau.

TABLE 15U.S EXPORTS OF COPPER SEMIMANUFACTURES, BY COUNTRY 1/
Pipes and tubing Plates, sheets, foil, bars Bare wire, including wire rod 2/ Wire and cable, stranded Copper sulfateQuantity Value Quantity Value Quantity Value Quantity Value Quantity Value
Country (metric tons) (thousands) (metric tons) (thousands) (metric tons) (thousands) (metric tons) (thousands) (metric tons) (thousands)1999 26,100 $78,900 42,200 $159,000 46,300 $118,000 25,000 $94,500 10,600 r/ $23,000 r/2000: Australia 23 121 4 90 5 41 76 1,090 261 643 Belgium 178 1,120 33 197 45 188 109 1,220 -- -- Brazil 26 162 12 227 78 2,260 1,700 12,200 76 216 Canada 9,920 31,200 24,700 89,400 16,700 42,200 4,190 12,900 777 1,590 China 215 656 1,360 3,680 21 285 504 937 833 1,840 Colombia 103 390 12 50 7 42 486 2,640 -- -- Denmark 44 234 18 86 11 89 22 280 382 917 Dominican Republic 27 55 22 71 1,280 3,010 238 776 -- -- France 811 4,320 90 939 69 990 119 3,090 90 210 Germany 19 105 1,400 7,130 65 1,170 209 9,420 31 142 Hong Kong 61 106 1,010 5,010 341 2,960 207 1,510 325 633 India 313 1,120 26 284 1 17 45 322 -- -- Indonesia -- -- -- -- -- -- 14 84 179 433 Israel 305 945 17 658 31 518 86 531 -- -- Italy 2,390 7,130 98 579 2 28 28 599 183 486 Japan 22 119 5,470 10,000 82 530 184 2,060 826 1,990 Korea, Republic of 187 915 1,330 6,210 27 260 261 2,870 2,060 4,540 Mexico 11,800 32,700 3,740 14,400 53,000 143,000 17,800 77,700 59 195 Netherlands 447 2,510 43 284 4 81 14 228 19 44 Philippines 31 103 239 1,720 -- -- 28 251 15 47 Saudi Arabia 249 849 51 100 39 183 842 2,290 -- -- Singapore 12 54 179 886 145 878 568 3,420 236 560 Spain 112 369 11 169 9 86 31 273 125 332 Sweden -- -- 9 405 8 117 27 664 1,650 4,370 Taiwan 53 244 1,200 5,460 244 967 41 519 611 1,450 United Kingdom 290 1,550 328 3,440 97 658 166 2,570 1,120 2,830 Venezuela 87 293 6 41 343 828 478 2,220 62 780 Other 1,080 3,430 1,010 5,690 2,230 7,240 2,920 14,400 364 892 Total 28,800 90,800 42,400 157,000 74,900 208,000 31,400 157,000 10,300 25,100r/ Revised. -- Zero.1/ Data are rounded to no more than three significant digits; may not add to totals shown.2/ Total exports of wire rod in 1999 were 28,400 tons valued at $58,800,000 and in 2000 were 44,100 tons valued at $98,000,000.
Source: U.S. Census Bureau.

TABLE 16U.S. IMPORTS FOR CONSUMPTION OF UNMANUFACTURED COPPER (COPPER CONTENT), BY COUNTRY 1/
Ore and concentrate Matte, ash, precipitates Blister and anode Refined Unalloyed scrap TotalQuantity Value 2/ Quantity Value 2/ Quantity Value 2/ Quantity Value 2/ Quantity Value 2/ Quantity Value 2/
Country (metric tons) (thousands) (metric tons) (thousands) (metric tons) (thousands) (metric tons) (thousands) (metric tons) (thousands) (metric tons) (thousands)1999 143,000 $83,700 1,730 $1,580 193,000 $461,000 837,000 $1,360,000 34,400 $45,600 1,210,000 $1,950,0002000: Brazil -- -- -- -- -- -- 2,510 3,650 -- -- 2,510 3,650 Bulgaria -- -- -- -- 4,040 10,300 56 105 -- -- 4,100 10,400 Canada -- -- 20 62 53,500 158,000 268,000 512,000 9,130 14,500 330,000 685,000 Chile -- -- 1 16 76,200 143,000 258,000 453,000 275 476 334,000 596,000 China -- -- 2 4 -- -- 1,410 2,450 -- -- 1,410 2,450 Costa Rica -- -- -- -- -- -- -- -- 947 1,050 947 1,050 Dominican Republic -- -- -- -- -- -- -- -- 1,480 1,780 1,480 1,780 Finland -- -- -- -- 2,180 4,570 178 471 -- -- 2,360 5,050 Germany -- -- (3/) 3 18 44 3,700 8,260 283 345 4,000 8,650 Guatemala -- -- -- -- -- -- -- -- 536 624 536 624 Honduras -- -- -- -- -- -- -- -- 402 492 402 492 Italy -- -- -- -- 2,180 4,100 (3/) 6 251 1,590 2,430 5,690 Japan -- -- -- -- -- -- 5,010 11,700 124 879 5,130 12,600 Kazakhstan -- -- -- -- -- -- 54,900 101,000 -- -- 54,900 101,000 Mexico -- -- 757 453 19,500 62,900 80,400 149,000 15,100 18,400 116,000 230,000 Namibia -- -- -- -- 2,750 5,880 -- -- -- -- 2,750 5,880 Peru -- -- -- -- 5,960 11,200 311,000 580,000 277 609 317,000 592,000 Poland -- -- -- -- -- -- 10,200 20,100 -- -- 10,200 20,100 Russia -- -- -- -- 117 203 58,900 115,000 1 14 59,000 115,000 Spain -- -- -- -- 5,670 11,100 -- -- -- -- 5,670 11,100 Turkey -- -- -- -- 11,000 20,300 1,100 1,780 -- -- 12,000 22,100 Venezuela -- -- -- -- -- -- -- -- 418 462 418 462 Other 53 12 903 2,240 1,680 3,030 1,050 2,110 1,590 2,120 5,220 7,250 Total 53 12 1,680 2,780 185,000 435,000 1,060,000 1,960,000 30,900 43,400 1,270,000 2,440,000-- Zero.1/ Data are rounded to no more than three significant digits; may not add to totals shown.2/ C.i.f. value at U.S. port.3/ Less than 1/2 unit.
Source: U.S. Census Bureau.

TABLE 17U.S. IMPORTS FOR CONSUMPTION OF COPPER SEMIMANUFACTURES, BY COUNTRY 1/
Pipes and tubing Plates, sheets, foil, bars Bare wire, including wire rod 2/ Wire and cable, stranded Copper sulfateQuantity Value 3/ Quantity Value 3/ Quantity Value 3/ Quantity Value 3/ Quantity Value 3/
Country (metric tons) (thousands) (metric tons) (thousands) (metric tons) (thousands) (metric tons) (thousands) (metric tons) (thousands)1999 434 $2,280 79,500 r/ $257,000 r/ 197,000 r/ $354,000 r/ 9,430 $37,700 26,700 $21,2002000: Australia (4/) 9 67 135 -- -- -- -- 300 4,890 Belgium -- -- 1,200 3,370 217 920 -- -- -- -- Brazil -- -- 2,040 4,550 13,300 36,200 1 5 -- -- Canada 368 2,120 14,700 46,300 116,000 240,000 1,050 3,210 -- -- Chile 2 7 4,850 12,100 501 1,040 -- -- -- -- Costa Rica -- -- -- -- 72 175 592 1,480 -- -- Finland 3 15 4,020 14,200 549 2,100 4 28 -- -- France -- -- 2,980 7,820 586 5,730 119 1,070 254 653 Germany 5 48 26,100 78,100 663 3,540 381 2,510 304 688 Hong Kong -- -- 9 80 3 6 5 54 288 358 India 6 43 176 187 (4/) 2 38 1,180 -- -- Israel -- -- -- -- 946 3,980 2,740 16,400 -- -- Italy -- -- 6,600 17,100 6 54 -- -- -- -- Japan 5 293 12,900 56,100 1,630 8,110 69 922 8 105 Korea, Republic of 14 29 2,040 4,480 7,980 26,900 12 87 54 85 Luxembourg -- -- 3,440 24,300 -- -- -- -- -- -- Malaysia 278 937 1,060 7,100 3 46 -- -- -- -- Mexico (4/) 11 18,900 38,800 110,000 204,000 (4/) 13 1,290 2,970 Norway -- -- (4/) 13 -- -- -- -- 54 115 Peru -- -- 2,270 5,580 231 537 69 142 -- -- Poland -- -- 38 67 9 60 628 1,820 -- -- Sweden -- -- 11,500 38,800 15 97 -- -- -- -- Turkey -- -- 125 309 6,090 20,100 1,780 6,400 -- -- United Kingdom 4 87 2,000 8,650 3,200 7,200 32 189 2 46 Other 334 1,150 3,120 12,400 3,440 9,060 109 614 -- -- Total 1,020 4,750 120,000 381,000 266,000 570,000 7,620 36,100 2,550 9,910r/ Revised. -- Zero.1/ Data are rounded to no more than three significant digits; may not add to totals shown.2/ Total imports of wire rod in 1999 were 193,000 tons valued at $330,000,000 and in 2000 were 247,000 tons valued at $502,000,000. Imports data adjusted by USGS to correctmisclassification of imports from Mexico.3/ C.i.f. value at U.S. port.4/ Less than 1/2 unit.
Source: U.S. Census Bureau.

TABLE 18U.S. EXPORTS OF COPPER SCRAP, BY COUNTRY 1/
Unalloyed copper scrap Copper-alloy scrap
1999 2000 1999 2000 Quantity Value Quantity Value Quantity Value Quantity Value
Country (metric tons) (thousands) (metric tons) (thousands) (metric tons) (thousands) (metric tons) (thousands)Belgium 1,540 $13,500 731 $5,320 361 $1,160 1,280 $1,730Canada 31,800 32,900 45,300 50,900 35,700 42,300 41,400 56,700China 51,300 47,400 124,000 101,000 34,800 26,400 86,100 65,700Germany 1,120 3,950 2,070 5,270 2,120 3,520 5,610 9,920Hong Kong 9,390 10,700 6,900 6,870 4,040 4,720 6,240 6,700India 2,580 2,430 933 963 26,100 24,100 24,000 19,400Japan 10,500 28,300 15,900 38,900 9,690 13,200 16,200 24,700Korea, Republic of 7,630 12,100 20,600 31,500 34,800 41,100 39,700 54,800Mexico 1,610 2,310 2,760 7,350 20,700 19,400 14,700 14,600Singapore 1,960 1,900 979 1,050 213 219 2,440 2,920Spain 2,760 526 589 272 2,670 1,610 5,460 1,400Taiwan 4,120 6,590 5,080 7,530 7,510 10,100 6,190 7,620United Arab Emirates 203 221 28 31 1,400 2,340 266 316United Kingdom 555 1,060 113 253 1,700 2,370 713 553Other 1,250 r/ 1,940 r/ 1,560 2,860 5,040 r/ 7,590 r/ 7,480 9,400 Total 128,000 166,000 228,000 260,000 187,000 200,000 258,000 276,000r/ Revised.1/ Data are rounded to no more than three significant digits; may not add to totals shown.
Source: U.S. Census Bureau.
TABLE 19U.S. IMPORTS FOR CONSUMPTION OF COPPER SCRAP, BY COUNTRY 1/
Unalloyed copper scrap Copper-alloy scrapQuantity Value 2/ Gross weight Copper content e/ 3/ Value 2/
Country or territory (metric tons) (thousands) (metric tons) (metric tons) (thousands) 1999 34,400 $45,600 102,000 73,300 $122,000 r/2000:Canada 9,130 14,500 54,400 39,200 72,100Chile 275 476 958 690 1,530Colombia 146 165 2,670 1,920 4,060Costa Rica 947 1,050 876 630 999Dominican Republic 1,480 1,780 1,530 1,100 1,620Guatemala 536 624 1,730 1,250 2,680Honduras 402 492 776 559 628Italy 251 1,590 -- -- -- Jamaica 278 465 936 674 738Japan 124 879 37 27 69Malaysia -- -- 827 596 1,650Mexico 15,100 18,400 29,400 21,200 32,400Spain -- -- 4,100 2,950 2,930Taiwan 17 22 1,150 829 1,460United Kingdom 11 32 2,550 1,840 4,340Venezuela 418 462 1,760 1,270 1,640Other 1,700 2,400 9,140 6,580 13,700 Total 30,900 43,400 113,000 81,200 143,000e/ Estimated. r/ Revised. -- Zero.1/ Data are rounded to no more than three significant digits; may not add to totals shown.2/ C.i.f. value at U.S. port.3/ Content is estimated by USGS to be 72% of gross weight.
Source: U.S. Census Bureau.

TABLE 20COPPER: WORLD MINE PRODUCTION, BY COUNTRY 1/ 2/
(Metric tons)
Country 1996 1997 1998 1999 2000 e/Albania e/ 2,500 220 3,200 900 900Argentina -- e/ 30,421 170,273 210,126 r/ 145,197 3/Armenia e/ 9,100 9,000 9,200 9,600 7,231 3/Australia: By concentration or cementation 503,100 507,400 552,000 655,900 r/ 751,300 Leaching (electrowon) 44,200 50,600 55,000 83,100 77,700 Total 547,300 558,000 607,000 739,000 r/ 829,000 3/Bolivia 92 182 48 252 r/ 110 3/Botswana 4/ 25,275 22,840 25,043 37,604 r/ 38,420 3/Brazil (concentrate) 46,203 39,952 34,446 r/ 31,371 r/ 31,786 3/Bulgaria 89,000 93,000 88,000 76,000 r/ 75,000 Burma: By concentration or cementation 4,841 2,927 -- 97 r/ 100 Leaching (electrowon) -- -- 6,700 e/ 26,736 26,711 3/ Total 4,841 2,927 6,700 e/ 26,833 26,811 3/Canada: By concentration or cementation 685,900 656,800 703,966 620,085 r/ 634,162 3/ Leaching (electrowon) 2,500 2,700 1,800 -- -- 3/ Total 688,400 659,500 705,766 620,085 r/ 634,162 3/Chile: 5/ By concentration or cementation 2,480,100 2,511,000 2,578,800 3,029,100 r/ 3,229,800 3/ Leaching (electrowon) 635,700 881,000 1,108,000 1,362,100 r/ 1,372,600 3/ Total 3,115,800 3,392,000 3,686,800 4,391,200 r/ 4,602,400 3/China e/ 439,000 496,000 486,000 520,000 r/ 590,000 Colombia e/ 2,222 3/ 1,800 1,400 1,400 1,400 Congo (Kinshasa): 6/ By concentration or cementation e/ 6,200 -- -- -- -- Leaching (electrowon) 43,800 39,651 r/ 34,994 r/ 32,000 r/ e/ 21,000 Total 50,000 e/ 39,651 r/ 34,994 r/ 32,000 r/ e/ 21,000 Cuba e/ 2,000 1,000 1,000 1,000 1,000 Cyprus: Leaching (electrowon) 1,688 3,900 7,800 11,300 r/ e/ 11,300 Ecuador e/ 100 100 100 100 100 Finland e/ 9,261 3/ 8,500 9,000 10,500 r/ 11,600 3/Georgia 5,100 4,100 6,000 e/ 8,000 8,000Honduras (7/) (7/) (7/) (7/) -- India 47,800 37,200 e/ 39,900 34,100 r/ e/ 35,500 3/Indonesia 6/ 507,484 529,121 780,780 766,027 r/ 1,012,054 3/Iran: e/ By concentration or cementation 108,000 r/ 108,000 r/ 128,300 r/ 3/ 131,000 r/ 3/ 131,000 Leaching (electrowon) 1,500 r/ 9,500 r/ 14,000 r/ 14,000 14,000 Total 109,000 r/ 118,000 r/ 142,000 r/ 145,000 r/ 145,000 Japan 1,145 932 1,070 1,038 1,211 3/Kazakhstan 250,000 e/ 316,166 337,600 374,000 e/ 430,000 Korea, North e/ 16,000 16,000 14,000 14,000 14,000 Korea, Republic of 3 -- e/ 41 -- -- 3/Macedonia 8,484 13,000 9,100 10,200 r/ 10,000Malaysia 20,219 18,821 13,907 4,600 r/ -- 3/Mexico: By concentration or cementation 295,303 342,319 335,822 330,232 r/ 319,766 3/ Leaching (electrowon) 45,407 48,217 48,819 50,952 44,800 3/ Total 340,710 390,536 384,641 381,184 r/ 364,566 3/Mongolia 123,039 124,400 125,400 126,700 124,800 3/Morocco 14,600 r/ 15,400 8,200 r/ 7,700 r/ 7,100 3/Namibia 14,845 17,879 6,500 -- 5,070 Norway 7,400 6,671 2,698 r/ 3/ -- e/ --Papua New Guinea 186,665 r/ 111,515 r/ 152,200 r/ 187,921 r/ 200,900 3/Peru: By concentration or cementation 396,060 406,760 381,501 421,470 r/ 426,614 3/ Leaching (electrowon) 88,171 99,738 101,837 114,917 127,310 3/ Total 484,231 506,498 483,338 536,387 r/ 553,924 3/Philippines 61,600 48,600 r/ 45,400 r/ 37,600 r/ 32,000 Poland 421,900 414,800 436,200 464,000 r/ 456,200 3/Portugal 109,935 106,479 114,637 99,500 e/ 76,200 See footnotes at end of table.
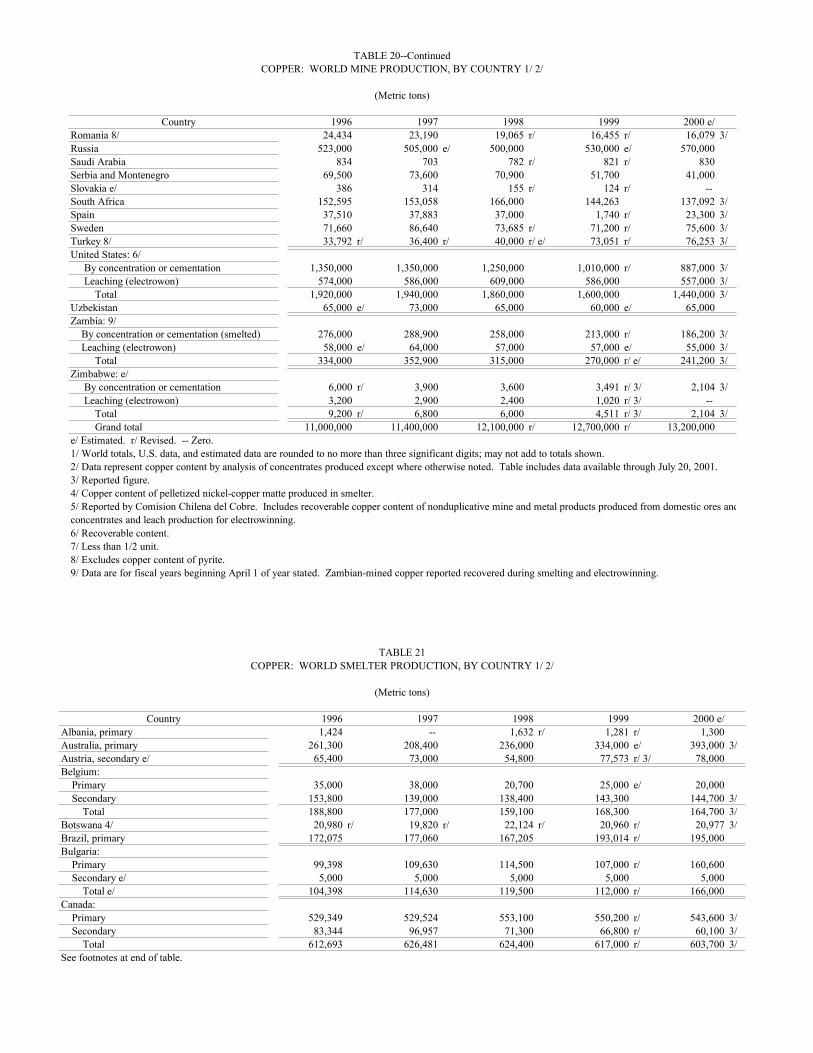
TABLE 20--ContinuedCOPPER: WORLD MINE PRODUCTION, BY COUNTRY 1/ 2/
(Metric tons)
Country 1996 1997 1998 1999 2000 e/Romania 8/ 24,434 23,190 19,065 r/ 16,455 r/ 16,079 3/Russia 523,000 505,000 e/ 500,000 530,000 e/ 570,000 Saudi Arabia 834 703 782 r/ 821 r/ 830 Serbia and Montenegro 69,500 73,600 70,900 51,700 41,000 Slovakia e/ 386 314 155 r/ 124 r/ -- South Africa 152,595 153,058 166,000 144,263 137,092 3/Spain 37,510 37,883 37,000 1,740 r/ 23,300 3/Sweden 71,660 86,640 73,685 r/ 71,200 r/ 75,600 3/Turkey 8/ 33,792 r/ 36,400 r/ 40,000 r/ e/ 73,051 r/ 76,253 3/United States: 6/ By concentration or cementation 1,350,000 1,350,000 1,250,000 1,010,000 r/ 887,000 3/ Leaching (electrowon) 574,000 586,000 609,000 586,000 557,000 3/ Total 1,920,000 1,940,000 1,860,000 1,600,000 1,440,000 3/Uzbekistan 65,000 e/ 73,000 65,000 60,000 e/ 65,000Zambia: 9/ By concentration or cementation (smelted) 276,000 288,900 258,000 213,000 r/ 186,200 3/ Leaching (electrowon) 58,000 e/ 64,000 57,000 57,000 e/ 55,000 3/ Total 334,000 352,900 315,000 270,000 r/ e/ 241,200 3/Zimbabwe: e/ By concentration or cementation 6,000 r/ 3,900 3,600 3,491 r/ 3/ 2,104 3/ Leaching (electrowon) 3,200 2,900 2,400 1,020 r/ 3/ -- Total 9,200 r/ 6,800 6,000 4,511 r/ 3/ 2,104 3/ Grand total 11,000,000 11,400,000 12,100,000 r/ 12,700,000 r/ 13,200,000e/ Estimated. r/ Revised. -- Zero. 1/ World totals, U.S. data, and estimated data are rounded to no more than three significant digits; may not add to totals shown.2/ Data represent copper content by analysis of concentrates produced except where otherwise noted. Table includes data available through July 20, 2001.3/ Reported figure.4/ Copper content of pelletized nickel-copper matte produced in smelter.5/ Reported by Comision Chilena del Cobre. Includes recoverable copper content of nonduplicative mine and metal products produced from domestic ores andconcentrates and leach production for electrowinning. 6/ Recoverable content.7/ Less than 1/2 unit.8/ Excludes copper content of pyrite.9/ Data are for fiscal years beginning April 1 of year stated. Zambian-mined copper reported recovered during smelting and electrowinning.
TABLE 21COPPER: WORLD SMELTER PRODUCTION, BY COUNTRY 1/ 2/
(Metric tons)
Country 1996 1997 1998 1999 2000 e/Albania, primary 1,424 -- 1,632 r/ 1,281 r/ 1,300Australia, primary 261,300 208,400 236,000 334,000 e/ 393,000 3/Austria, secondary e/ 65,400 73,000 54,800 77,573 r/ 3/ 78,000Belgium: Primary 35,000 38,000 20,700 25,000 e/ 20,000 Secondary 153,800 139,000 138,400 143,300 144,700 3/ Total 188,800 177,000 159,100 168,300 164,700 3/Botswana 4/ 20,980 r/ 19,820 r/ 22,124 r/ 20,960 r/ 20,977 3/Brazil, primary 172,075 177,060 167,205 193,014 r/ 195,000Bulgaria: Primary 99,398 109,630 114,500 107,000 r/ 160,600 Secondary e/ 5,000 5,000 5,000 5,000 5,000 Total e/ 104,398 114,630 119,500 112,000 r/ 166,000Canada: Primary 529,349 529,524 553,100 550,200 r/ 543,600 3/ Secondary 83,344 96,957 71,300 66,800 r/ 60,100 3/ Total 612,693 626,481 624,400 617,000 r/ 603,700 3/See footnotes at end of table.

TABLE 21--ContinuedCOPPER: WORLD SMELTER PRODUCTION, BY COUNTRY 1/ 2/
(Metric tons)
Country 3/ 1996 1997 1998 1999 2000 e/Chile, primary 1,355,600 1,389,600 1,403,100 1,474,000 1,456,500 3/China: e/ Primary 616,000 789,000 839,000 837,000 r/ 990,000 Secondary 220,000 180,000 170,000 190,000 200,000 Total 836,000 969,000 1,010,000 1,027,000 r/ 1,190,000Congo (Kinshasa), primary: e/ Electrowon 43,800 40,100 40,000 32,000 r/ 21,000 Other 6,000 -- -- -- -- Total 49,800 40,100 40,000 32,000 r/ 21,000Finland: Primary 178,675 r/ 159,000 r/ 156,000 r/ 149,600 r/ 155,400 3/ Secondary e/ -- r/ 2,000 2,000 2,000 2,000 Total e/ 178,675 r/ 3/ 161,000 r/ 158,000 r/ 151,600 r/ 157,400France, secondary e/ 2,300 2,400 2,000 1,000 r/ --Germany: Primary 296,800 273,000 258,600 266,400 275,000 Secondary e/ 88,600 76,000 80,000 3/ 60,000 75,000 Total e/ 385,000 349,000 338,600 3/ 326,000 350,000Hungary, secondary e/ 100 100 -- -- --India, primary 45,300 51,000 107,600 224,400 225,600 3/Indonesia -- -- -- 126,739 173,726 3/Iran: e/ 5/ Primary 93,100 r/ 93,000 r/ 144,000 r/ 150,000 r/ 150,000 Secondary 6,000 6,100 6,000 4,000 r/ 4,000 Total 99,100 r/ 99,100 r/ 150,000 r/ 154,000 r/ 154,000Japan: Primary 1,122,571 1,214,172 1,171,657 1,256,276 1,331,352 3/ Secondary 110,856 136,274 131,979 133,188 149,282 3/ Total 1,233,427 1,350,446 1,303,636 1,389,464 1,480,634 3/Kazakhstan 245,000 315,960 335,000 e/ 384,234 400,000Korea, North: e/ Primary 24,000 24,000 23,000 20,000 20,000 Secondary 5,000 5,000 4,500 5,000 5,000 Total 29,000 29,000 27,500 25,000 25,000Korea, Republic of 150,000 160,000 293,000 370,000 410,000Mexico: Primary 280,462 348,290 378,302 352,700 323,000 Secondary e/ 21,800 4,000 4,000 5,000 5,000 Total 302,262 352,290 382,302 357,700 328,000Namibia, primary 16,659 24,997 r/ 8,014 r/ -- e/ 13,488 3/Norway, primary 28,526 r/ 32,639 r/ 31,658 r/ 33,262 27,000Oman, primary 24,663 22,800 24,400 r/ 16,818 r/ 23,790 3/Peru, primary 345,119 r/ 323,382 r/ 356,189 r/ 350,399 r/ 340,447 3/Philippines, primary 201,661 206,160 198,088 148,000 r/ 140,000Poland: Primary 399,800 415,000 e/ 422,243 486,384 r/ 507,846 3/ Secondary e/ 15,000 15,000 10,000 10,000 r/ 10,000 Total 415,000 e/ 430,500 e/ 432,000 468,000 518,000Romania: Primary 32,622 25,024 18,708 24,013 r/ 16,500 Secondary e/ 1,000 1,000 1,000 2,000 2,000 Total e/ 33,600 26,000 19,700 26,000 r/ 18,500Russia: e/ Primary 550,000 535,000 510,000 540,000 580,000 Secondary 20,000 35,000 40,000 158,000 200,000 Total 570,000 570,000 550,000 698,000 780,000 3/Serbia and Montenegro: Primary e/ 59,940 3/ 60,000 40,000 r/ 54,000 86,000 Secondary 65,287 60,000 e/ 55,000 r/ 49,780 r/ 4,000 Total 125,227 120,000 e/ 95,000 r/ 103,780 r/ 90,000 3/See footnotes at end of table.

TABLE 21--ContinuedCOPPER: WORLD SMELTER PRODUCTION, BY COUNTRY 1/ 2/
(Metric tons)
Country 3/ 1996 1997 1998 1999 2000 e/Slovakia, primary e/ 14,000 10,000 10,000 10,000 10,000South Africa, primary 148,400 163,600 152,300 149,300 r/ 126,128 3/Spain: Primary 248,500 288,900 291,400 305,000 e/ 264,800 3/ Secondary 22,400 23,800 23,800 25,000 e/ 65,000 Total 270,900 312,700 315,200 330,000 e/ 329,800Sweden: e/ Primary 100,000 3/ 95,000 r/ 90,000 r/ 85,000 r/ 95,000 Secondary 26,000 r/ 3/3/ 33,000 r/ 35,000 r/ 30,000 r/ 35,000 Total 126,000 r/ 3/ 128,000 r/ 125,000 115,000 r/ 130,000Turkey 6/ 38,600 e/ 32,491 35,000 37,000 37,000United States: Primary 1,300,000 1,440,000 1,490,000 1,090,000 W Secondary 339,000 285,000 232,000 205,000 W Total 1,640,000 1,720,000 1,720,000 1,290,000 1,000,000 3/Uzbekistan: e/ Primary 75,000 80,000 89,900 72,000 75,000 Secondary 5,000 5,000 5,000 5,000 5,000 Total 80,000 85,000 94,900 77,000 80,000Zambia, primary: 7/ Electrowon 73,900 61,140 51,736 25,000 e/ 25,000 Other 250,300 220,327 206,871 184,000 e/ 169,500 Total 324,200 281,467 258,607 209,000 e/ 194,500Zimbabwe, primary e/ 8/ 18,000 r/ 18,000 r/ 10,000 r/ 10,000 r/ 10,000 Grand total: 10,800,000 r/ 11,200,000 r/ 11,400,000 11,700,000 r/ 11,900,000 Of which: Primary: Electrowon 118,000 101,000 91,700 57,000 r/ 46,000 Other 8,930,000 r/ 9,360,000 r/ 9,520,000 r/ 9,500,000 r/ 8,730,000 9/ Secondary 1,260,000 r/ 1,180,000 1,070,000 1,180,000 r/ 1,050,000 9/ Undifferentiated 455,000 r/ 528,000 r/ 685,000 r/ 939,000 r/ 2,040,000 9/e/ Estimated. r/ Revised. W Withheld to avoid disclosing company proprietary data; included in total. -- Zero.1/ World totals, U.S. data, and estimated data are rounded to no more than three significant digits; may not add to totals shown.2/ This table includes total production of copper metal at the unrefined stage, including low-grade cathode produced by electrowinning methods. The smelter feedmay be derived from ore, concentrates, copper precipitate or matte (primary), and/or scrap (secondary). To the extent possible, primary and secondary output ofeach country is shown separately. In some cases, total smelter production is officially reported, but the distribution between primary and secondary has been estimated. Table includes data available through July 20, 2001.3/ Reported figure.4/ Copper content of nickel-copper matte exported to Norway for refining.5/ Data are for year beginning March 21 of year stated. Secondary production is estimated to be about 5% of total.6/ Secondary production is estimated to be about 5% to 10% of total.7/ For fiscal year beginning April 1 of year stated. Electrowon is total electrowon production reported less the quantity reported as "finished production, leachcathodes."8/ Includes impure cathodes produced by electrowinning in nickel processing.9/ U.S. production undifferentiated in 2000.
TABLE 22COPPER: WORLD REFINERY PRODUCTION, BY COUNTRY 1/ 2/
(Metric tons)
Country 1996 1997 1998 1999 2000 e/Albania, primary 1,544 r/ -- r/ 1,150 r/ 342 r/ 350Argentina, secondary e/ 16,000 16,000 16,000 16,000 16,000Australia, primary 311,400 270,100 285,900 412,000 r/ 487,000See footnotes at end of table.

TABLE 22--ContinuedCOPPER: WORLD REFINERY PRODUCTION, BY COUNTRY 1/ 2/
(Metric tons)
Country 1996 1997 1998 1999 2000 e/Austria: e/ Primary 1,000 2,000 2,000 2,000 2,000 Secondary 57,000 65,000 76,000 75,000 77,000 Total 58,000 67,000 78,000 77,000 79,000 3/Belgium: 4/ Primary 191,000 190,000 185,000 201,000 e/ 236,100 3/ Secondary 163,000 183,000 183,000 187,000 e/ 187,000 Total 354,000 373,000 368,000 388,000 e/ 423,000Brazil, primary 172,075 177,060 167,200 193,011 r/ 185,345 3/Bulgaria: Primary 17,301 29,530 31,400 r/ 16,000 r/ e/ 25,500 Secondary e/ 5,000 5,000 5,000 5,000 5,000 Total 22,301 34,530 36,400 r/ 21,000 r/ 30,500 3/Burma, electrowon -- -- 6,700 e/ 26,736 26,711 3/Canada: Electrowon 2,500 2,700 1,800 -- -- Primary 475,000 458,400 488,100 480,400 r/ 490,100 3/ Secondary 81,700 99,300 72,600 68,200 r/ 61,300 3/ Total 559,200 560,400 562,500 548,600 r/ 551,400 3/Chile: Electrowon 635,700 881,000 1,108,000 1,361,300 1,372,600 3/ Primary 1,112,500 1,235,600 1,226,900 1,304,300 1,295,700 3/ Total 1,748,200 2,116,600 2,334,900 2,665,600 2,668,300 3/China: e/ Primary 692,000 801,000 870,000 836,000 r/ 1,060,000 Secondary 428,000 379,000 341,000 338,000 r/ 340,000 Total 1,120,000 1,180,000 1,210,000 1,170,000 r/ 1,400,000Congo (Kinshasa), primary 5/ 40,147 r/ 37,658 r/ 38,236 r/ 31,225 r/ 20,500Cyprus, electrowon 1,499 r/ 4,435 r/ 4,936 r/ 5,004 r/ 5,197 3/Egypt, secondary e/ 4,600 5,000 r/ 6,000 r/ 6,000 r/ 5,000Finland: e/ Primary 101,000 r/ 100,000 108,000 r/ 100,000 r/ 100,000 Secondary 10,000 16,000 15,000 15,000 14,000 Total 111,000 r/ 116,000 123,000 r/ 115,000 r/ 114,000France: e/ Primary 10,500 -- -- -- -- Secondary 28,600 35,600 22,400 1,800 1,500 Total 39,100 35,600 22,400 1,800 1,500Germany: Primary 316,000 e/ 297,900 322,800 271,000 e/ 335,000 Secondary 355,000 e/ 375,800 373,000 425,000 e/ 375,000 Total 671,000 e/ 673,700 695,800 696,000 e/ 710,000Hungary, secondary e/ 11,000 12,000 r/ 12,000 r/ 12,000 r/ 12,000India: Primary, electrolytic 29,100 30,200 100,000 200,000 e/ 234,000 Secondary e/ 10,200 6,000 7,000 8,000 9,000 Total e/ 39,300 36,200 107,000 208,000 243,000Indonesia, primary -- -- -- 126,700 173,800 3/Iran: 6/ Electrowon 1,500 9,500 14,000 14,000 e/ 14,000 Primary 7/ 99,100 103,300 129,000 r/ 131,700 r/ 130,000 Total 100,600 112,800 143,000 r/ 146,000 r/ e/ 144,000Italy: Primary 25,000 5,600 -- -- -- Secondary 60,800 80,100 29,100 e/ 28,000 e/ 70,000 Total 85,800 85,700 29,100 e/ 28,000 e/ 70,000Japan: Primary 1,140,502 1,157,299 1,149,266 1,215,248 1,290,091 3/ Secondary 110,871 121,400 128,086 126,301 147,260 3/ Total 1,251,373 1,278,699 1,277,352 1,341,549 1,437,351 3/See footnotes at end of table.

TABLE 22--ContinuedCOPPER: WORLD REFINERY PRODUCTION, BY COUNTRY 1/ 2/
(Metric tons)
Country 1996 1997 1998 1999 2000 e/Kazakhstan, primary 267,100 301,100 324,900 361,889 394,722 3/Korea, North: e/ Primary 23,000 23,000 23,000 20,000 20,000 Secondary 5,000 5,000 5,000 5,000 5,000 Total 28,000 28,000 28,000 25,000 25,000Korea, Republic of: Primary 246,305 265,426 373,205 450,444 470,537 3/ Secondary e/ 2,000 2,000 2,000 4,000 4,000 Total e/ 248,000 267,000 375,000 454,000 475,000Mexico: Primary: Electrowon 45,407 48,217 48,819 50,952 47,800 Other 180,100 234,000 e/ 383,181 361,000 r/ 340,400 3/ Secondary 16,493 14,783 15,000 e/ 14,000 e/ 15,000 Total 242,000 297,000 447,000 425,952 r/ 403,000Mongolia, electrowon -- 2,751 2,319 1,545 r/ 1,450Norway, primary 7/ 28,526 32,639 r/ 31,658 r/ 33,262 r/ 27,000Oman, primary 24,150 r/ 23,600 r/ 22,700 r/ 17,171 r/ 24,281 3/Peru: Electrowon 88,172 99,738 r/ 101,837 114,927 r/ 127,310 3/ Primary 249,890 284,347 r/ 309,594 r/ 318,914 324,416 3/ Total 338,062 384,085 r/ 411,431 r/ 433,841 r/ 451,726 3/Philippines, primary 155,774 146,630 152,400 147,982 r/ 135,000Poland: Primary 404,700 r/ 420,600 r/ 426,537 r/ 448,300 466,002 3/ Secondary e/ 20,000 20,000 20,300 22,200 3/ 20,000 Total 424,700 r/ 440,600 r/ 446,837 r/ 470,500 486,002 3/Romania: Primary 29,305 22,912 21,028 24,983 r/ 13,803 3/ Secondary e/ 5,000 4,000 2,000 4,000 4,000 Total 34,305 26,912 23,028 28,983 r/ 17,803 3/Russia: Primary 543,000 535,000 543,000 600,000 640,000 Secondary 57,000 65,000 77,000 150,000 200,000 Total 600,000 600,000 620,000 750,000 840,000Serbia and Montenegro: Primary 59,940 70,534 49,346 r/ 48,002 r/ 45,602 3/ Secondary 44,060 43,000 45,000 e/ 1,900 r/ e/ 40,000 Total 104,000 113,534 94,346 r/ 49,902 r/ 85,600Slovakia, primary and secondary e/ 28,000 31,400 r/ 24,100 21,000 20,000South Africa, primary 7/ 123,000 130,200 125,600 116,400 r/ 100,500Spain: e/ Primary 210,000 229,000 r/ 239,600 r/ 3/ 250,756 r/ 3/ 250,800 3/ Secondary 54,000 63,300 64,730 r/ 65,000 r/ 65,000 Total 264,000 292,000 304,330 r/ 3/ 315,756 r/ 3/ 315,800 3/Sweden: e/ Primary 100,000 105,000 100,000 95,000 105,000 Secondary 25,000 23,000 3/ 25,000 20,000 25,000 Total 125,000 3/ 128,000 3/ 125,000 115,000 130,000Taiwan, secondary e/ 6,000 4,000 4,000 4,000 4,000Turkey: Primary 80,700 102,100 82,800 69,000 e/ 62,000 Secondary 20,000 9,300 9,000 9,000 e/ 10,000 Total 100,700 111,400 91,800 78,000 e/ 72,000United Kingdom: Primary 12,869 9,100 8,000 5,000 e/ 1,000 Secondary 43,746 51,300 44,000 45,000 e/ 49,000 Total 56,615 60,400 52,000 50,000 e/ 50,000See footnotes at end of table.

TABLE 22--ContinuedCOPPER: WORLD REFINERY PRODUCTION, BY COUNTRY 1/ 2/
(Metric tons)
Country 1996 1997 1998 1999 2000 e/United States: Primary: Electrowon 574,000 586,000 609,000 586,000 557,000 3/ Other 1,430,000 1,480,000 1,530,000 1,300,000 1,030,000 3/ Secondary 345,000 396,000 349,000 230,000 208,000 3/ Total 2,350,000 2,470,000 2,490,000 2,120,000 1,790,000 3/Uzbekistan: e/ Primary 95,000 105,000 89,930 3/ 72,000 75,000 Secondary 5,000 5,000 5,000 5,000 5,000 Total 100,000 110,000 94,930 77,000 80,000Zambia, primary: 8/ Electrowon 58,000 63,736 80,709 57,000 e/ 55,000 Other 276,000 268,553 248,820 176,000 e/ 170,000 Total 334,000 332,289 329,529 233,000 e/ 225,000Zimbabwe: e/ Electrowon 3,200 2,900 2,400 1,020 r/ -- Primary 10,900 4,990 2,940 7,000 r/ 7,200 Secondary 6,000 -- -- -- -- Total 20,100 7,890 5,340 8,020 r/ 7,200 Total, primary 10,700,000 11,400,000 12,200,000 12,700,000 r/ 13,000,000 Total, secondary 1,980,000 2,090,000 1,940,000 r/ 1,880,000 1,960,000 Total, primary and secondary, undifferentiated 39,000 43,400 r/ 36,100 r/ 33,000 r/ 32,000 Grand total 12,700,000 13,500,000 14,200,000 r/ 14,600,000 r/ 15,000,000e/ Estimated. r/ Revised. -- Zero.1/ World totals, U.S. data, and estimated data are rounded to no more than three significant digits; may not add to totals shown.2/ This table includes total production of refined copper, whether produced by pyrometallurgical or electrolytic refining methods and whether derived from primaryunrefined copper or from scrap. Copper cathode derived from electrowinning processing is also included. Table includes data available through July 20, 2001.3/ Reported figure.4/ Includes reprocessed leach cathode from Congo (Kinshasa).5/ Excludes leach cathode exported for processing in Belgium.6/ Data are for Iranian years beginning March 21 of that stated.7/ May include secondary.8/ Data are for fiscal year beginning April 1 of that stated. Electrowon covers only presumably high-grade electrowon cathodes reported as "finished productionleach cathodes." Other, in addition to electrowon cathodes, includes a smaller amount of "finished product shapes" presumably cast from electro-refined cathodes, or any blister-anodes and low-anodes and low-grade electrowon cathodes that were furnace- or fire-refined.