copy data to minitab statistical tests open excel file > highlight all data & column headings...
TRANSCRIPT
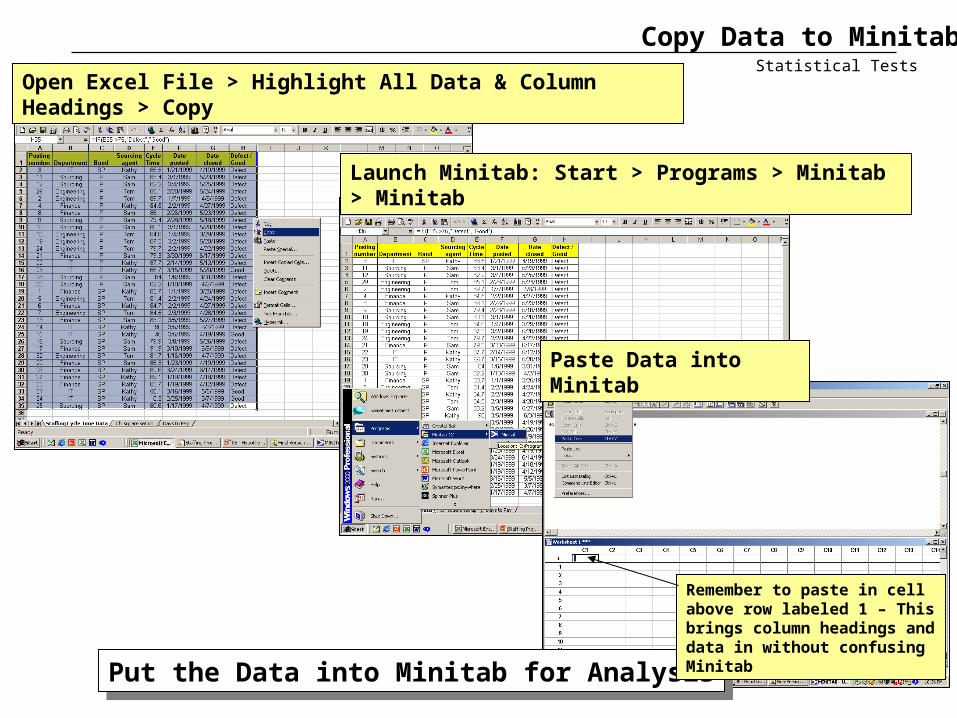
Copy Data to MinitabStatistical Tests
Open Excel File > Highlight All Data & Column Headings > Copy
Launch Minitab: Start > Programs > Minitab > Minitab
Paste Data into Minitab
Put the Data into Minitab for AnalysisPut the Data into Minitab for Analysis
Remember to paste in cell above row labeled 1 – This brings column headings and data in without confusing Minitab

Do you have Normal Data?
Ho: Data distribution = Normal Distribution
Ha: Data distribution Normal Distribution
Continuous
Non Normal Normal
If the p-value >.05 …… Then Ho is true and there is no difference in the groups you had me test(Accept Ho) The Data is normal
If the p-value < .05 …... Then Ho is false and there is a statically significant difference (Reject Ho ) The Data is not Normal
Normality Test
91 8971 9279 8386 7994 7288 8580 7495 7389 8777 8195 8587 96101 8582 9083 74
Staffing Cycle time

MINITAB: Stat> Basic Statistics> Display Descriptive statistics>
Normality Test>
If the p-value >.05 …… Then Ho is true and there is no difference in the groups you had me test(Accept Ho) The Data is normal
If p-value < .05 …... Then Ho is false and there is a statically significant difference (Reject Ho ) The Data is not Normal
If the p-value >.05 …… Then Ho is true and there is no difference in the groups you had me test(Accept Ho) The Data is normal
If p-value < .05 …... Then Ho is false and there is a statically significant difference (Reject Ho ) The Data is not Normal
P-value = 0.000 < 0.05 Therefore The data is NOT NormalP-value = 0.000 < 0.05 Therefore The data is NOT Normal
Cycle Time
Perc
ent
120100806040200
99
95
90
80
70
605040
30
20
10
5
1
Mean
<0.005
79.39StDev 15.59N 34AD 5.353P-Value
Probability Plot of Cycle TimeNormal
Normality Test
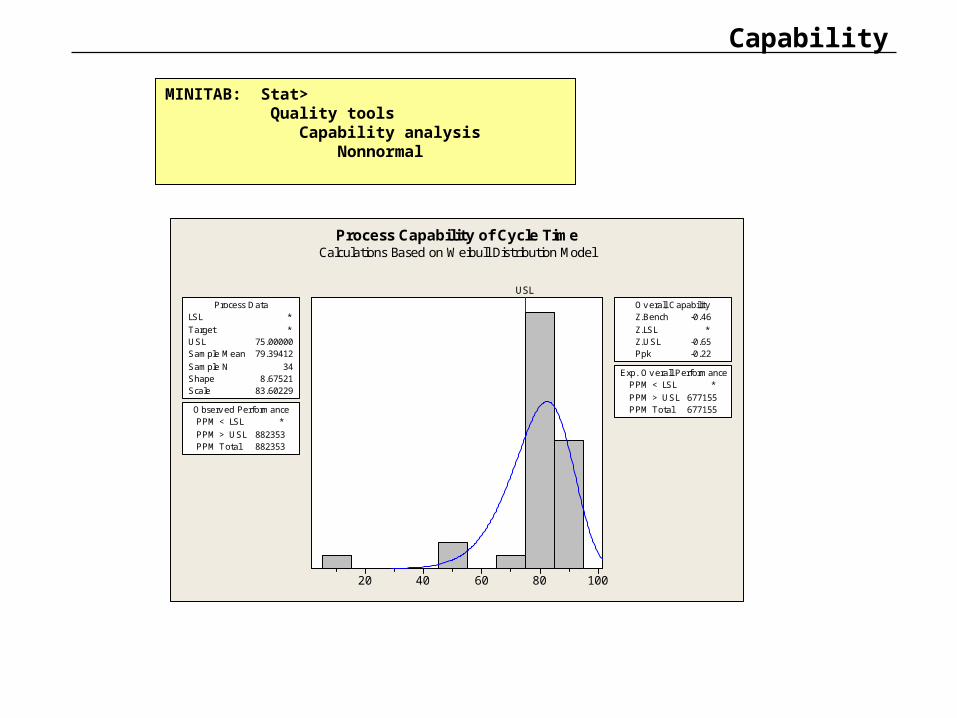
Capability
10080604020
USLProcess Data
Sample N 34Shape 8.67521Scale 83.60229
LSL *
Target *USL 75.00000Sample Mean 79.39412
Overall CapabilityZ.Bench -0.46
Z.LSL *Z.USL -0.65Ppk -0.22
Observed PerformancePPM < LSL *
PPM > USL 882353PPM Total 882353
Exp. Overall PerformancePPM < LSL *
PPM > USL 677155PPM Total 677155
Process Capability of Cycle TimeCalculations Based on Weibull Distribution Model
MINITAB: Stat> Quality tools Capability analysis Nonnormal
Engineering Finance IT Sourcing
0
10
20
30
40
50
60
70
80
90
Department
Cyc
le T
ime
Kathy Sam Tom
0
10
20
30
40
50
60
70
80
90
Sourcing agent
Cyc
le T
ime
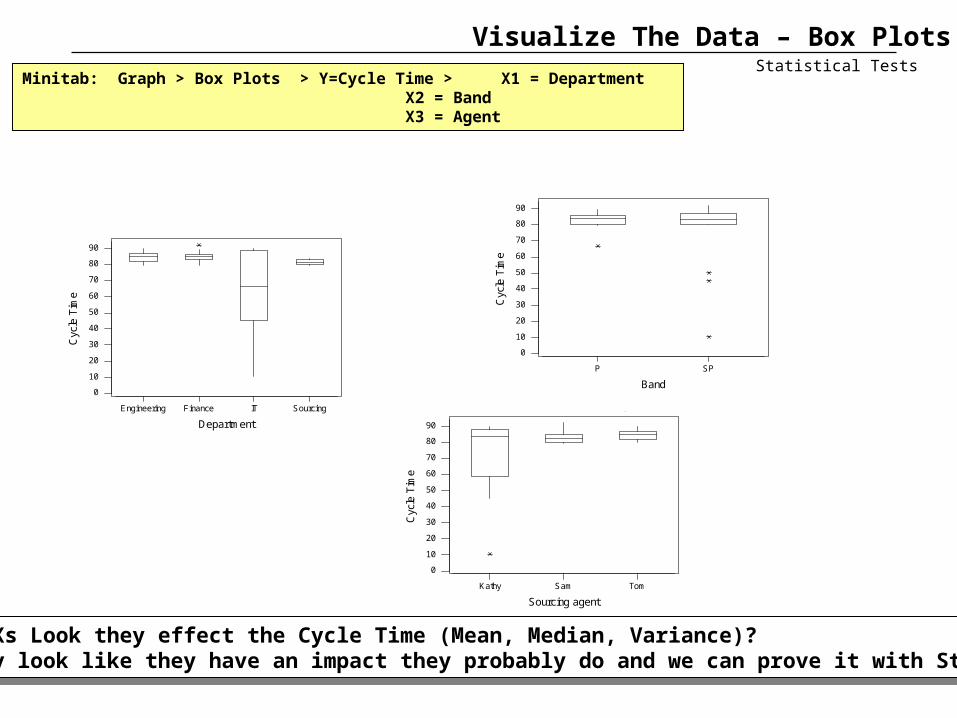
Visualize The Data – Box PlotsStatistical Tests
Minitab: Graph > Box Plots > Y=Cycle Time > X1 = DepartmentX2 = BandX3 = Agent
Which Xs Look they effect the Cycle Time (Mean, Median, Variance)? If they look like they have an impact they probably do and we can prove it with Statistics
Which Xs Look they effect the Cycle Time (Mean, Median, Variance)? If they look like they have an impact they probably do and we can prove it with Statistics
P SP
0
10
20
30
40
50
60
70
80
90
Band
Cyc
le T
ime
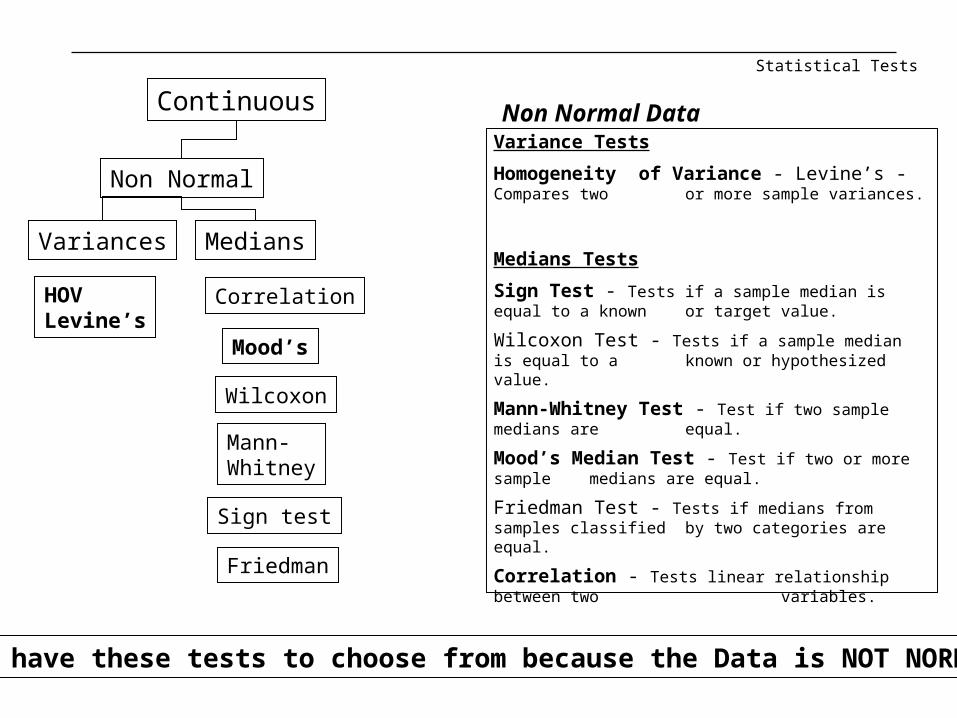
We have these tests to choose from because the Data is NOT NORMAL
Statistical Tests
Variances
HOVLevine’s
Correlation
Sign test
Wilcoxon
Mann-Whitney
Mood’s
Friedman
Continuous
Non Normal
Medians
Non Normal DataVariance Tests
Homogeneity of Variance - Levine’s - Compares two or more sample variances.
Medians Tests
Sign Test - Tests if a sample median is equal to a known or target value.
Wilcoxon Test - Tests if a sample median is equal to a known or hypothesized value.
Mann-Whitney Test - Test if two sample medians are equal.
Mood’s Median Test - Test if two or more sample medians are equal.
Friedman Test - Tests if medians from samples classified by two categories are equal.
Correlation - Tests linear relationship between two variables.
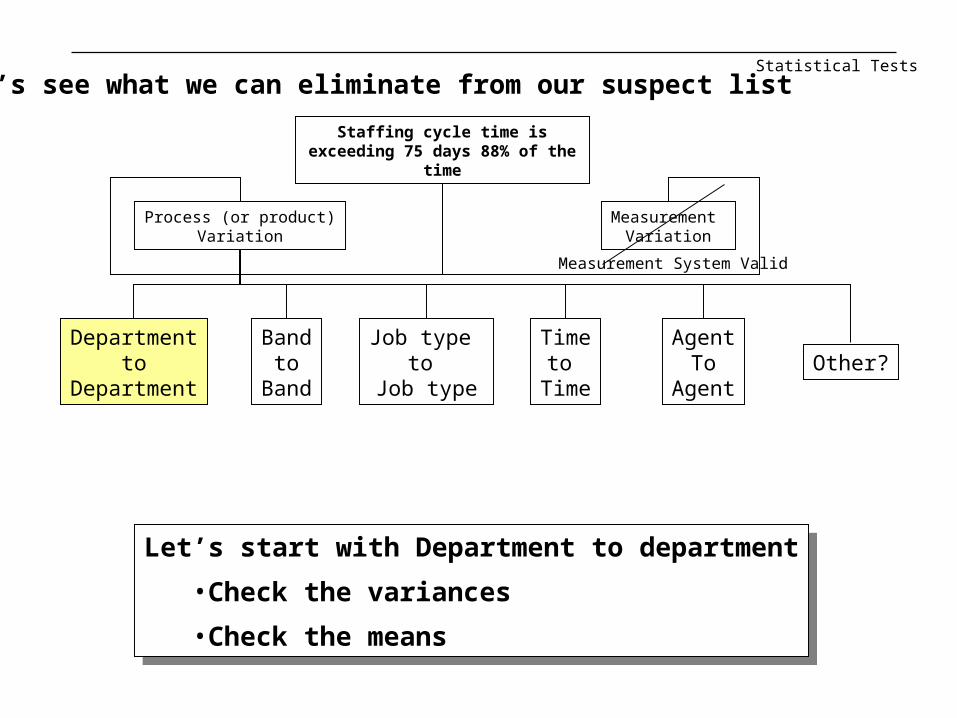
Staffing cycle time is exceeding 75 days 88% of the time
Measurement Variation
Process (or product)Variation
Measurement System Valid
Timeto
Time
Departmentto
Department
Job type to
Job type
Bandto
Band
AgentTo
AgentOther?
Let’s see what we can eliminate from our suspect list
Let’s start with Department to department
•Check the variances
•Check the means
Let’s start with Department to department
•Check the variances
•Check the means
Statistical Tests
HOV
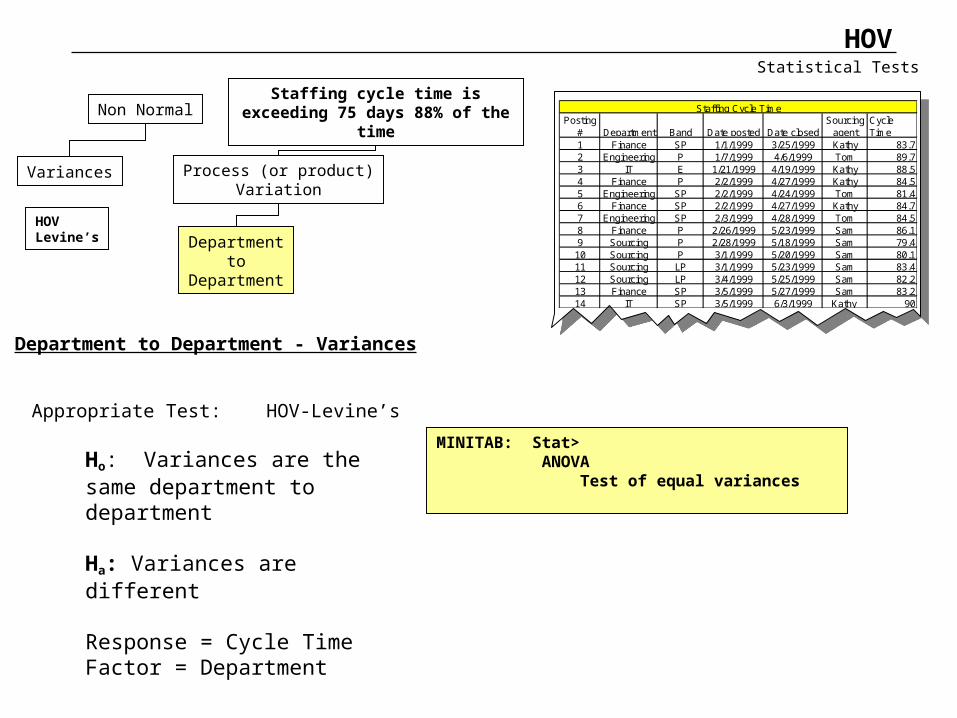
Posting # Department Band Date posted Date closed
Sourcing agent
Cycle Time
1 Finance SP 1/1/1999 3/25/1999 Kathy 83.72 Engineering P 1/7/1999 4/6/1999 Tom 89.73 IT E 1/21/1999 4/19/1999 Kathy 88.54 Finance P 2/2/1999 4/27/1999 Kathy 84.55 Engineering SP 2/2/1999 4/24/1999 Tom 81.46 Finance SP 2/2/1999 4/27/1999 Kathy 84.77 Engineering SP 2/3/1999 4/28/1999 Tom 84.58 Finance P 2/26/1999 5/23/1999 Sam 86.19 Sourcing P 2/28/1999 5/18/1999 Sam 79.4
10 Sourcing P 3/1/1999 5/20/1999 Sam 80.111 Sourcing LP 3/1/1999 5/23/1999 Sam 83.412 Sourcing LP 3/4/1999 5/25/1999 Sam 82.213 Finance SP 3/5/1999 5/27/1999 Sam 83.214 IT SP 3/5/1999 6/3/1999 Kathy 90
Staffing Cycle TimeStaffing cycle time is exceeding 75
days 88% of the time
Process (or product)Variation
Departmentto
Department
Department to Department - Variances
Appropriate Test: HOV-Levine’s
Ho: Variances are the same department to department
Ha: Variances are different
Response = Cycle TimeFactor = Department
Statistical Tests
Variances
HOVLevine’s
Non Normal
MINITAB: Stat> ANOVA Test of equal variances
Remember: Min I.Tab can only give us a P-value, we have to determine what it means
Statistical Tests
HOV
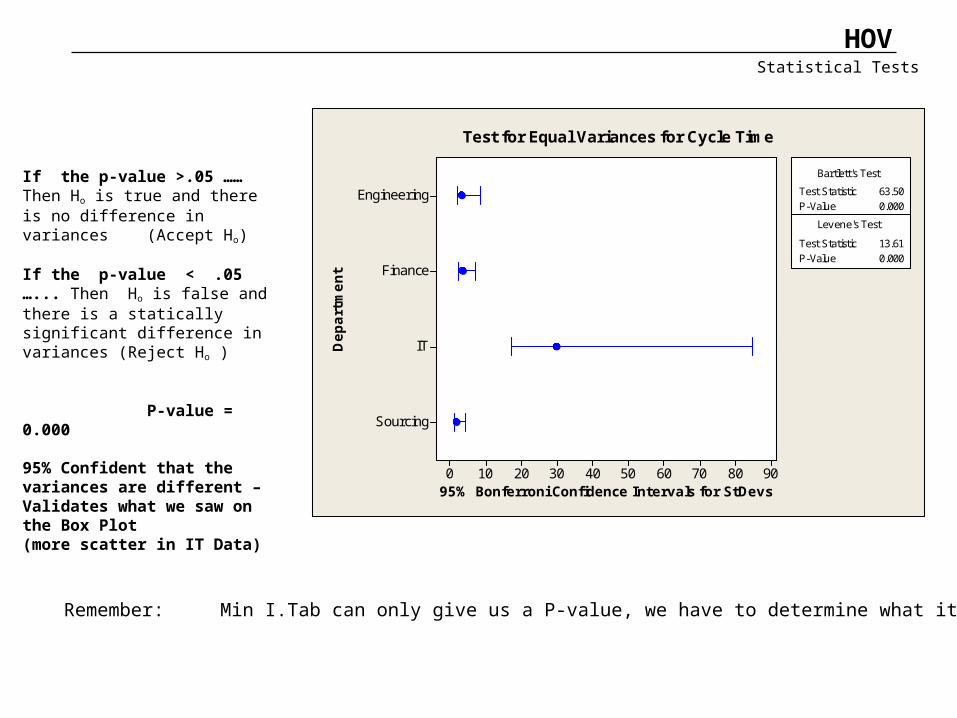
If the p-value >.05 …… Then Ho is true and there is no difference in variances (Accept Ho)
If the p-value < .05 …... Then Ho is false and there is a statically significant difference in variances (Reject Ho )
P-value = 0.000
95% Confident that the variances are different – Validates what we saw on the Box Plot (more scatter in IT Data)
Depart
ment
95% Bonferroni Confidence Intervals for StDevs
Sourcing
IT
Finance
Engineering
9080706050403020100
Bartlett's Test
0.000
Test Statistic 63.50P-Value 0.000
Levene's Test
Test Statistic 13.61P-Value
Test for Equal Variances for Cycle Time
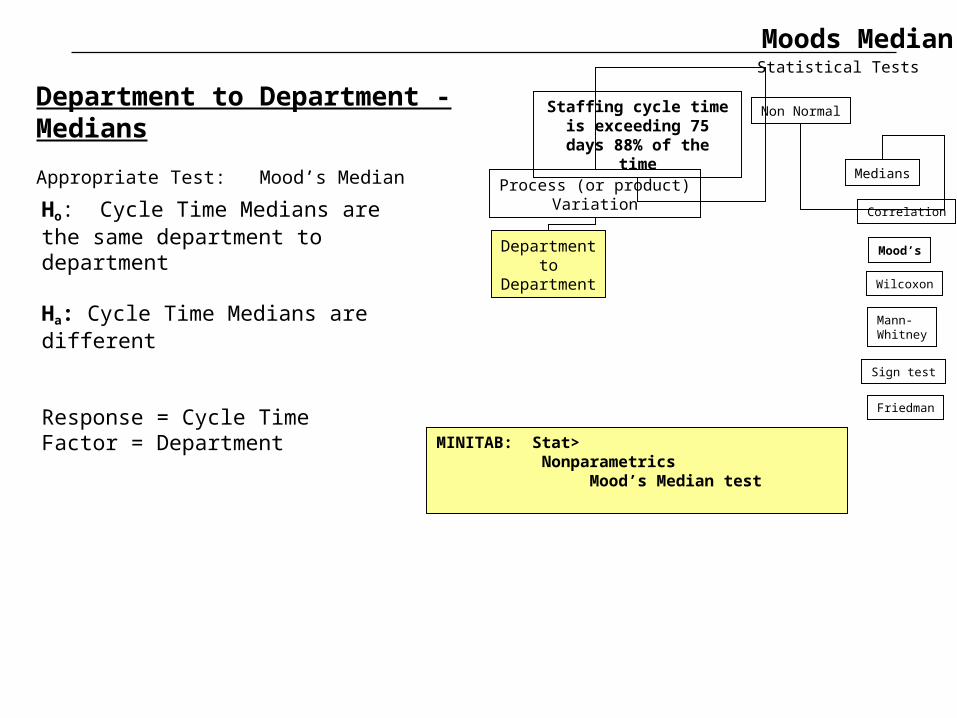
Department to Department - Medians
Appropriate Test: Mood’s Median
Ho: Cycle Time Medians are the same department to department
Ha: Cycle Time Medians are different
Response = Cycle TimeFactor = Department
Staffing cycle time is exceeding 75 days 88%
of the time
Process (or product)Variation
Departmentto
Department
Statistical Tests
Moods Median
Correlation
Sign test
Wilcoxon
Mann-Whitney
Mood’s
Friedman
Non Normal
Medians
MINITAB: Stat> Nonparametrics Mood’s Median test

If the p-value >.05 …… Then Ho is true and there is no difference in Means (Accept Ho)
If the p-value < .05 …... Then Ho is false and there is a statically significant difference in Means (Reject Ho )
P-value = 0.06
The Department Medians are NOT different at 95% Confidence Level – but close
Statistical Tests
Moods Median
Mood Median Test
Mood median test for Cycle Ti
Chi-Square = 7.42 DF = 3 P = 0.060
Individual 95.0% CIs
Departme N<= N> Median Q3-Q1 -------+---------+---------+---------
Engineer 3 5 84.6 5.3 (-+-)
Finance 3 8 84.5 3.1 (+-)
IT 4 3 66.7 43.5 (-------------------+--------------)
Sourcing 7 1 81.4 3.2 (+-)
-------+---------+---------+---------
45 60 75
Overall median = 83.6
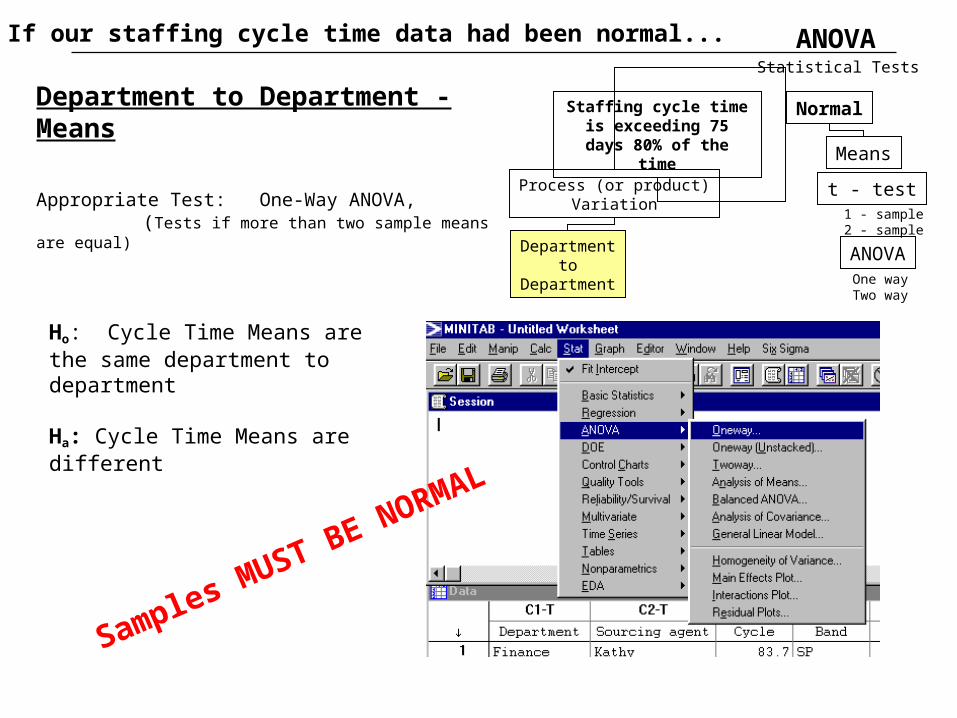
Means
t - test1 - sample2 - sample
ANOVAOne wayTwo way
NormalDepartment to Department - Means
Appropriate Test: One-Way ANOVA, (Tests if more than two sample means are equal)
Ho: Cycle Time Means are the same department to department
Ha: Cycle Time Means are different
Staffing cycle time is exceeding 75 days 80%
of the time
Process (or product)Variation
Departmentto
Department
Statistical Tests
ANOVAIf our staffing cycle time data had been normal...
Samples MUST BE NORMAL
Staffing cycle time is exceeding 75 days 88% of the time
Measurement Variation
Process (or product)Variation
Measurement System Valid
AgentTo
Agent
Departmentto
Department
Bandto
Band
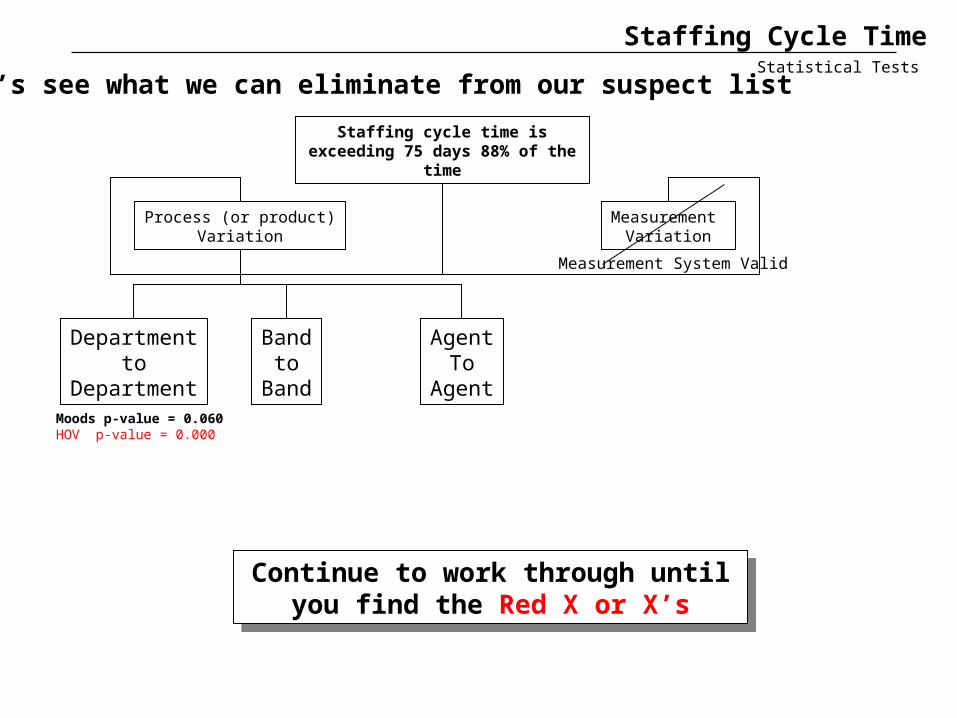
Let’s see what we can eliminate from our suspect list
Moods p-value = 0.060HOV p-value = 0.000
Continue to work through until you find the Red X or X’s
Continue to work through until you find the Red X or X’s
Statistical Tests
Staffing Cycle Time
Staffing cycle time is exceeding 75 days 88% of the time
Measurement Variation
Process (or product)Variation
Measurement System Valid
AgentTo
Agent
Departmentto
Department
BandTo
Band
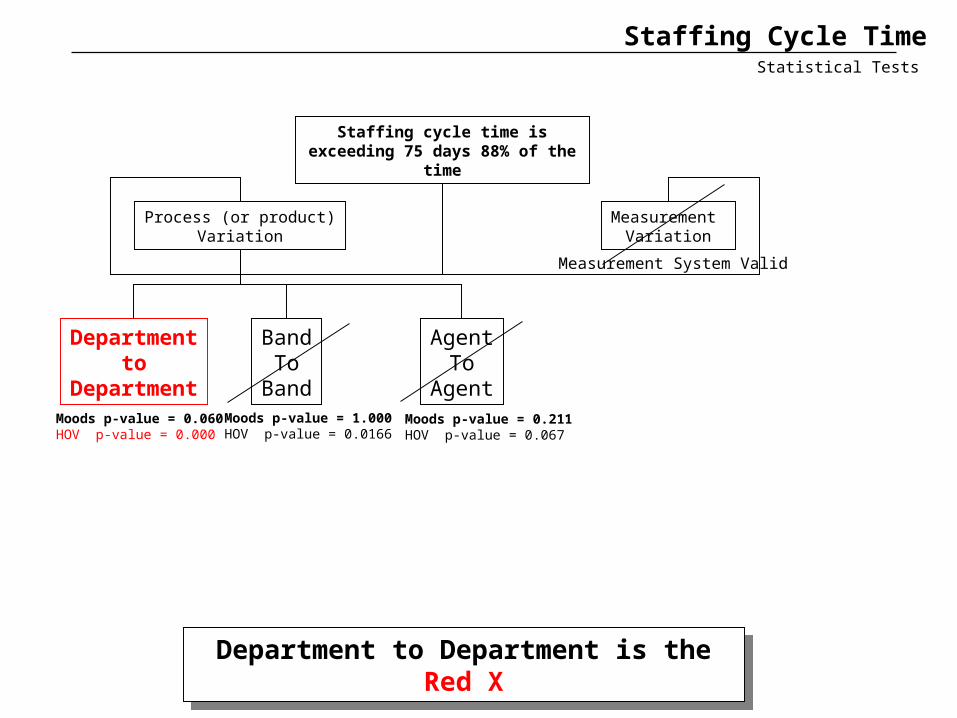
Staffing Cycle TimeStatistical Tests
Department to Department is the Red XDepartment to Department is the Red X
Moods p-value = 0.060HOV p-value = 0.000
Moods p-value = 1.000HOV p-value = 0.0166
Moods p-value = 0.211HOV p-value = 0.067
Statistical Tests
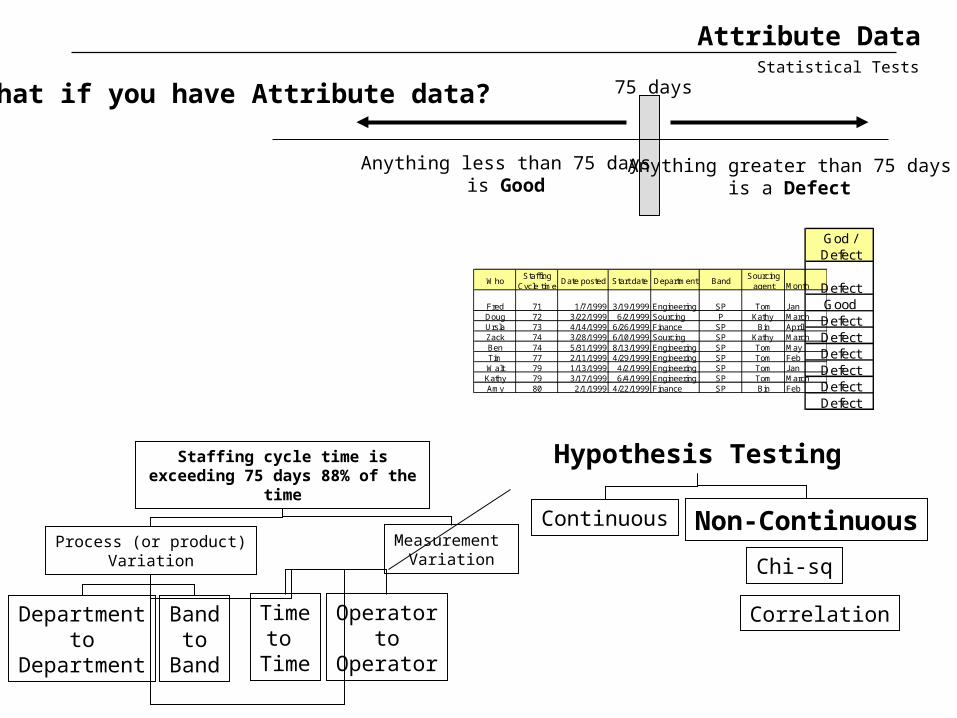
What if you have Attribute data? 75 days
Anything less than 75 daysis Good
Anything greater than 75 daysis a Defect
WhoStaffing
Cycle timeDate posted Start date Department Band
Sourcing agent Month
Fred 71 1/7/1999 3/19/1999 Engineering SP Tom JanDoug 72 3/22/1999 6/2/1999 Sourcing P Kathy MarchUrsla 73 4/14/1999 6/26/1999 Finance SP Bin AprilZack 74 3/28/1999 6/10/1999 Sourcing SP Kathy MarchBen 74 5/31/1999 8/13/1999 Engineering SP Tom MayTim 77 2/11/1999 4/29/1999 Engineering SP Tom FebWalt 79 1/13/1999 4/2/1999 Engineering SP Tom JanKathy 79 3/17/1999 6/4/1999 Engineering SP Tom MarchAmy 80 2/1/1999 4/22/1999 Finance SP Bin Feb
God / Defect
DefectGoodDefectDefectDefectDefectDefectDefect
Hypothesis Testing
Continuous Non-Continuous
Chi-sq
Correlation
Staffing cycle time is exceeding 75 days 88% of the time
Measurement Variation
Process (or product)Variation
Timeto
Time
Departmentto
Department
Bandto
Band
Operatorto
Operator
Attribute Data

Non-Continuous
Chi-sq
Correlation
Ho: All Departments are the sameHa: Departments are different
If the p-value >.05 …… Then Ho is true and there is no difference in the groups you had me test(Accept Ho) Departments are the same
If the p-value < .05 …... Then Ho is false and there is a statically significant difference (Reject Ho ) Departments are different
Staffing cycle time is exceeding 75 days 88% of the time
Process (or product)Variation
Departmentto
Department
Pass Fail
Engineering
Finance
Sourcing
Department to Department
Counts of p
ass / f
ail
Chi 2
Statistical Tests
75 days
Anything less than 75 daysis Good
Anything greater than 75 daysis a Defect
Statistical Tests
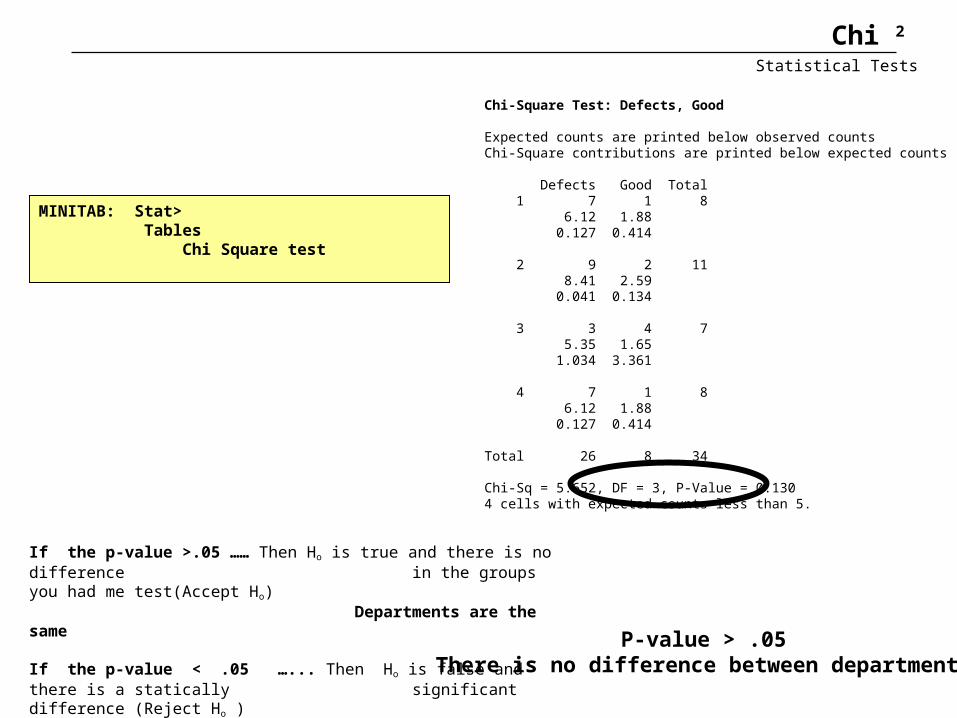
If the p-value >.05 …… Then Ho is true and there is no difference in the groups you had me test(Accept Ho) Departments are the same
If the p-value < .05 …... Then Ho is false and there is a statically significant difference (Reject Ho ) Departments are different
P-value > .05There is no difference between departments
Chi 2
MINITAB: Stat> Tables Chi Square test
Chi-Square Test: Defects, Good
Expected counts are printed below observed countsChi-Square contributions are printed below expected counts
Defects Good Total 1 7 1 8 6.12 1.88 0.127 0.414
2 9 2 11 8.41 2.59 0.041 0.134
3 3 4 7 5.35 1.65 1.034 3.361
4 7 1 8 6.12 1.88 0.127 0.414
Total 26 8 34
Chi-Sq = 5.652, DF = 3, P-Value = 0.1304 cells with expected counts less than 5.