copy no development of ksc program for ... 975 copy no development of ksc program for investigating...
TRANSCRIPT

GP 975
COPY NO
DEVELOPMENT OF KSC PROGRAM
FOR INVESTIGATING AND GENERATINGFIELD FAILURE RATES
VOLUME 11: RECOMMENDE FORMAT
FOR RELIABILITY HANDBOOK
FOR GROUND SUPPORT EQUIPMENT
FINAL REPORT
PRC R-1459
24 MAY 1972
OT1972
NASA-CR-1313620 DEVELOPMENT OF KSC N73-2026
PROGRAM OF. INVESTIGATING AND GENERATING
FIELD FAILURE RATES. VOLUME 2:
RECOMMENDED (PRC Systems Sciences Co., Unclas
Los Angeles) 394 p HC .$21.75 CSCL 14D G3/11 17170
PREPARED FOR
KENNEDY SPACE CENTER
\ \PLANNING RESEARCH CORPORATION
., ,
https://ntrs.nasa.gov/search.jsp?R=19730011541 2018-06-04T16:39:20+00:00Z

DEVELOPMENT OF KSC PROGRAM FOR
INVESTIGATING AND GENERATING
FIELD FAILURE RATES
VOLUME II: RECOMMENDED FORMAT FOR
RELIABILITY HANDBOOK FOR
GROUND SUPPORT EQUIPMENT
Final Report
PRC R-1459
24 May 1972
Prepared for
Kennedy Space CenterUnder Contract No. NAS10-7621
Prepared by
Charles E. BloomquistRichard H. Kallmeyer
Details of illustrations Inthis document may be better
studied on microfiche
PRC SYSTEMS SCIENCES COMPANY1100 GLENDON AVENUE * LOS ANGELES, CALIFORNIA 90024 * (213) 473-1163
l

PAGE BLAN NoT
FOREWORD
This volume of the final report presenting results of the study to
develop a program for investigating reliability aspects of the Ground
Support Equipment of the Kennedy Space Center is in the form of the
recommended reliability handbook for ground support equipment. The
work of this volume was performed by the following studyteam members:
E. E. Bean, C. E. Bloomquist, R. Hall, K. Hein, R. Kallmeyer,
F. Kontrovich, W. Mull, D. O'Lear, J. Sorenson, J. R. Robles, and
E. Rumble. Ms. E. E. Bean was the PRC Project Manager for the
entire study. Mr. Bloomquist was primarily responsible for the super-
vision of the work reported in this volume.
Preceding page blank I

i H--±ANG PAGE BLANK NOT FILMED
GP 975
RELIABILITY HANDBOOK FOR
GROUND SUPPORT EQUIPMENT
24 May 1972
National Aeronautics and Space AdministrationJohn F. Kennedy Space CenterKennedy Space Center, Florida 32899
Preceding page blank 1
;C FORM 16-12 (4/66)
JOHN F. KENNEDYSPACE CENTER
II
NASA-PAFB APR/70

PRC R-1459iii
FOREWORD PRECEDING PAGE BLANK NOT FILMED
This handbook presents a collection of reliability data for various
components of the ground support equipment at the John F. Kennedy
Space Center (KSC). These data have been obtained primarily by an
analysis of the computerized data bank generated in conjunction with
the Unsatisfactory Condition Report (UCR) system in effect at KSC.
Reliability data are presented for many different components and
at varying levels of detail. The bulk of the handbook, including 20
individual reliability assessments of components (RACs), is intended
primarily for reliability and design engineers. There are, however,
numerous summary presentations that may be of interest to managers
as well.
The data contained herein was generated by PRC Systems Sci-
ences Company, an operating unit of Planning Research Corporation,
under contract to the Technical Management Systems Office, Design
Engineering. Methods for updating and extending the reliability data
of this report are also included herein.
Comments or questions should be directed to Mr. Robert E. Cato,
Code DD-SED-21, National Aeronautics and Space Administration,
John F. Kennedy Space Center, Kennedy Space Center, Florida, 32899.
Preceding page blank|
Ah,

PRC R-1459v
PRECEDING PAGE BLANK NOT FILMED
ABSTRACT
Field failure rates and confidence factors are presented for 88
identifiable components of the ground support equipment at the John F.
Kennedy Space Center. For most of these, supplementary information
regarding failure mode and cause is tabulated. Complete reliability
assessments are included for three systems, eight subsystems, and
nine generic piece-part classifications. Procedures for updating or
augmenting the reliability results presented in this handbook are also
included.
Preceding page blank

PRC R-1459
~PR-&CE1G PAGE viiGE BLANK NOT -FaNE
TABLE OF CONTENTS
ABSTRACT.
I. INTRODUCTION.
II. INDIVIDUAL RELIABILITY ASSESSMENTS OFCOMPONENTS . . ....
A: AMPLIFIER/AMP BOX ..................
B: BATTERY.
C: CABLE ASSEMBLIES
D: CAPACITORS.
E: CIRCUIT BREAKER S
F: COMPRESSORS.
G: CONNECTORS.
H: HOLDDOWN ARM SYSTEM ..................
I: PRESSURE SWITCHES
J: PUMP ASSEMBLIES
K: REGULATORS
L: RELAYS
M: RF CARRIER DEMODULATOR ...............
N: RF CARRIER MODULATOR
O: RF INSTRUMENTATION ......
P: RF LINE REPEATER AMPLIFIER ....
Q: SOLENOID VALVES
R: TAIL SERVICE MASTS
S: TELEVISION SYSTEM
T: WATER SYSTEM
III. BASELINE UCR DATA ................
A. Field Failure Rates and Confidence Factors
B. Failure Causes ....................
C. Failure Modes · .· . . .
D. Repair Time Statistics ...................
Preceding page blank
Page
v
I-1
II- 1
A-1
B-1
C-1
D-1
E-1
F-1
G-1
H-1
I-1
J-1
K-1
L-1
M-l
N-1
0-1
P-1
Q-1
R-1
S-1
T-1
III- 1
III-1
III-7
III- 12
III- 12

PRC R-1459viii
TABLE OF CONTENTS(Continued)
Page
IV. ADDITIONAL UCR DATA .................... IV-1
V. SUPPLEMENTARY DATA .................... V-1
VI. METHODOLOGY FOR THE RELIABILITYASSESSMENT OF COMPONENTS ............ VI-1
Ao General ............................. VI- 1
B. Definitions ........................... VI-4
C. Step-By-Step Procedures .................. VI-7
D. Bibliography ......................... VI-43

PRC R-1459ix
LIST OF EXHIBITS
1. Various KSC GSE Component Failure Rates .........
2. Baseline Field Failure Rates for John F. KennedySpace Center Ground Support Equipment . . . . .. ..
3. Graph for Determining 90-Percent Confidence Limitson the Field Failure Rate .
4. Baseline Failure Causes for John F. Kennedy SpaceCenter Ground Support Equipment .. . . . . . . .
5. Baseline Failure Modes for John F. KennedySpace Center Ground Support Equipment .
6. Repair Time Data for John F. Kennedy SpaceCenter Ground Support Equipment.
7. Additional Field Failure Rates for John F. KennedySpace Center Ground Support Equipment .
8. Additional Failure Causes for John F. Kennedy SpaceCenter Ground Support Equipment .................
9. Additional Failure Modes for John F. Kennedy SpaceCenter Ground Support Equipment Components ........
10. Methodology for Assessing Component Reliability .
11. TSM Unsatisfactory Condition Occurrence Datesby TSM Serial Number ........................
12. Classification of Pressure Switch Failures by FailureType and Failure Mode for Two Modal Classes .......
13. Cumulative Distribution of Connector Times-to-Failure . . . . . .
14. Number of TSM Failures per Quarter
15. Summary Page for Reliability Assessment ofConnectors . . . . . . . . . . . . . . . . .
16. Cumulative Distribution of Total Cable AssemblyDowntime
Page
.II-4
III-2
III-8
III- 9
III- 13
III- 16
IV-2
IV -3
IV-4
VI-2
VI-15
VI-26
VI-31
VI-37
VI-40
VI-42

PRC R-1459I-1
I. INTRODUCTION
As a part of the on-going KSC effort to provide safe, reliable, and
efficient services for the launching of space systems, an investigation
into the field failure history experienced by the ground support equip-
ment (GSE) under KSC' s design responsibility was initiated. Three
phases of this study have been completed to date. The relationship of
these study phases to this handbook is as follows. Phase I established
that field failure information recorded by technicians and engineers as
part of the KSC UCR system could be utilized in the reliability assess-
ment of components, This was done by deriving a methodology and
applying it to four electromechanical components.
Phase II refined the methodology and assessed seven components
in a standardized format. These components included both electromech-
anical ones, including one update of a Phase I assessment, and elec-
tronic devices such as amplifiers and capacitors. Phase III further re-
fined the methodology and applied it to 15 components including four
updated assessments.
All applications of the methodology with one exception in Phase I
were successful resulting in 20 completed reliability assessments of
components (RACs). These 20 RACs are included in this report as sub-
sections of Section II. Each RAC is self-contained and self-explanatory,
summarizing all data contained in the UCR data bank. Perusal of the
introduction to Section II should give the reader an understanding of how
the reliability information is derived and an indication of its use.
Section VI gives step-by-step procedures for generating a RAC
and provides definitions of terms. A useful bibliography is also in-
cluded for anyone interested in assessing a component not already
covered in this document or updating the RAC for one that is.
The most commonly used reliability data are extracted from the
RACs of Section II and presented in the summary tabulations of Sec-
tion III. These data include field failure rates, failure causes, failure
modes, and repair statistics. They are referred to as "baseline UCR
data" because they are derived almost solely from UCRs and only from

PRC R-1459I-2
those written prior to 15 October 1969. This date marks the transition
from one UCR system to another. The old system is static or "baseline"
because the UCRs are no longer carried in the computerized UCR data
bank, being basically incompatible with UCRs from the new system.
The results of Section III, therefore, should not change for any particu-
lar component once all its old UCRs are analyzed; it would only become
longer as more components are included in the analysis. Although there
are substantial differences in the two UCR systems, the methodology of
Section VI is applicable to either.
Section IV reports the same type of reliability data as given in
Section III but is restricted to data from UCRs written under the new
system. The results here may be used to modify the baseline results
and, if updating is done conscientiously, to track the reliability of spe-
cific components. Although not many UCRs had been collected under
the new system prior to the cutoff date for inputs to the handbook, the
new data should ultimately, completely supplant the baseline data. Note,
however, that there are no repair time statistics in Section IV because
there is no provision for the requisite source data on the UCR form
subsequent to 15 October 1969.
Section V contains suggestions for the generation of failure rate
data from "standard" sources and for reporting the results.
To make the quantitative data of each RAC more meaningful to
the design engineer it is strongly recommended that the introductory
pages of Section II be fully assimilated prior to RAC utilization.

PRC R-1459II- 1
II. INDIVIDUAL RELIABILITY ASSESSMENTS OF COMPONENTS
Each of the 20 subsections of this section of the report is devoted
to one reliability assessment of a component (RAC) of the John F. Kennedy
Space Center (KSC) ground support equipment (GSE). Each has been gen-
erated in accordance with the methodology of Section VI and each is com-
pletely self-contained. The tabs identify each RAC and mark the divis-
ion between subsections.
Before turning to the RACs themselves reconsider, for a moment,
what it is that is generally being presented. Each RAC is based on re-
corded data from field usage at the Kennedy Space Center. The basis of
a RAC is actual experience, not a theoretical construct. This fact car-
ries with it some implications for effective utilization of the results.
Each RAC is a summarization of actual experience of actual com-
ponents in the environment of interest. There is no requirement to
convert " standard" failure rate values to those applicable to the KSC
GSE, for the rates presented are derived from component experience
in the KSC environment. Furthermore, these data are not static but
are continually changing reflecting changing conditions of utilization at
KSC.
Each RAC presents not only failure rates but also failure modes,
failure causes, repair times, and other information unique to the com-
ponent under discussion. Supporting curves and tabulations for each of
these elements are included in each RAC. Except for the failure rate
itself there is no reason to suspect that the information given is not
totally representative of the population at large.
The field failure rates are open to question on two grounds. First,
only failing members of a component population are included in the as-
sessment. Therefore, in large populations of relatively reliable com-
ponents some members of the population are systematically excluded
from the UCR sample, never having failed. This fact gives a higher
field failure rate than would obtain if the nonfailing members of the
population were included at the same rate as the failing members.

PRC R-1459II-2
That is, the assumption is made that the true field failure rate (FFR)
is given by
FFR = f n) ti + > tii=l j=f+l
where f = number of failures,
t. = time at failure for each of the f failing components,
tj = time without failure for each of the n - f nonfailing
components.
The analysis of some components necessarily must exclude
n
tj=f+
thereby increasing the field failure rate for those components.
The second question is the veracity of the Unsatisfactory Condition
Report itself. That is, it is assumed that those completing the UCR
forms for whatever reason, do not convey accurate information.
This second question can be easily answered. In the course of
the component assessments a large number of related UCRs were
studied quite carefully, including the narrative portions. No internal
evidence of deliberately inaccurate data has ever been found. This
implies that either the UCR generators are well coordinated, or that
deliberate attempts to transmit inaccurate data are rare. The latter
alternative is assumed to be true in the analyses. If, however, one
assumes that the first alternative is true, it is still of interest to know
what is being blamed or reported as being the problem by the UCR gen-
erators. That is, whether the goal of analyzing field experience data
is to improve the hardware and/or to improve the reporting it is neces-
sary to proceed from a base of actual information rather than subjective
judgments.

PRC R-1459II-3
The first and more important problem is basically one of visibility.
The UCR system provides only a very imperfect record of the reliability
of components. It reports only on failed items. And it reports only on
some of these. Moreover, each UCR is fragmentary at best. It is gen-
erally accepted that analysis of incomplete data does aid in the under-
standing of a given phenomena, whether it be reliability of equipment,
astronomical observations, government intelligence activities, etc.
In fact, incomplete data in these areas serves to intensify rather than
to diminish analysis activities. The results in the RACs are derived
in the same spirit.
The information upon which the RAC is based is included therein
and can be modified to reflect the reader's greater understanding of
the problem or to reflect data not available to the assessment analyst.
The data presented should, in fact, be used precisely in this creative
fashion and not as though it were some update of other failure rate
tabulations, such as MIL-HDBK-217A. What is presented is the ob-
served (through the UCR system) experience of certain components at
a particular point in time. This experience is reflected in the entire
RAC but is summarized as a Field Failure Rate, Repair Time Statistics,
and various apportionments of the Field Failure Rate.
There are, for components of KSC GSE, at least six different
types of failure rates of interest as shown in Exhibit 1. The first is,
in one sense at least, the failure rate one would really like to know.
The second and third are the failure rates provided by the RAC. Al-
though there is reason to believe that the failure rates identified under
the second bar are generally greater than or equal to those under the
first bar, the size of the discrepancy varies with component and in no
case is it known with precision. For Tail Service Masts and similar
components the failure rates of Bar 1 and Bar 2 should be within ex-
perimental error. For components such as capacitors or pressure
switches, the indicated bias certainly exists (that is, failure rates
under Bar 2 are greater than those under Bar 1). For system level
components, however, the true field failure rate may be higher than

PRC R-1459II-4
I I k -- 4.
Uc ., co o zk k H C a ' O ¢ ) O U Q; 0 d 0 4-3· u (1) '' P
o )Q
04 U -O 0 Cd ( k
4-I
4 ~U) U) - -.E X tD
) ( OO.0 ed cd
0 po 0 w X 1
U1) 0 =0O O) - 0)a, A _ O:
k 0
.. (d 0d ' , )..4 " r.-, r< % ., Q E:=1 E. ¢
0
A 0 a)
:j
EH m
0
..
..4 m cd·X4 4 9
4AH
H
zz
o0
0
0
U
S
w U
-4
Iisx
a4e[ alnlle,

PRC R-1459II-5
that given in the RAC simply because knowledge of failures as derived
from the UCR system is more likely to be "lost" than is component
installation time.
The third bar in the chart apportions the failures as to cause.
By eliminating those failures with an obvious remedy or cause, a "best"
failure rate for the given component can be estimated. If the world
were simple, this value would equal the generic failure rate (as found
for example in MIL-HDBK-217A) modified by the suitable application
factor (also found in MIL-HDBK-217A). Since neither the failure rates
nor the K-factors of MIL-HDBK-217A are particularly appropriate to
KSC GSE, the failure rates of Bars 4 and 5 cannot be expected to be
approximately equal as shown in Exhibit 1.
It is urged that consideration be given to the entire contents of
each RAC before its results are used or rejected. Furthermore, since
the handbook is primarily a design tool it should be used as a guideline
of observed operational experience rather than as a theoretical model.

PRC R-1459A-1
RELIABILITY ASSESSMENT
OF
AMPLIFIER/AMP BOX
Date: 24 May 1972
Observed Field Failure Rate
In Failures Per Thousand Hours
Of Installed Component Time 0. 150
Observed Failure Times, In Hours
Mean 6660
Minimum 0
Maximum 43, 200
Number of Observations 215
Observed Repair Times, In Hours
Mean 2. 58
Minimum 0. 05
Maximum 168
Number of Observations 1896

PRC R-1459A-2
FAILURE MODES AND CAUSES CONTRIBUTING TO
THE OBSERVED FIELD FAILURE RATE
AS A PERCENT OF THE TOTAL
Number of Relevant UCRs: 2, 134 Currency:( 1 ) 15 September 1969
( 1)Date of latest UCR run included in the assessment.
Proximate Cause of Failure
NormalService Other Total
Function Unique 21.7 0.2 21.9
No Output 19.5 0. 3 19.8
Q Noisy 14.6 0.3 14. 9o0o Incorrect Output 10.2 0.1 10.3
Incorrect Gain 9.2 0.1 9. 3
Inoperative 5.8 0.4 6.2
X Unknown 4.4 0.3 4.7
Inte rmittent 2.7 0.1 2.8
Other 9.2 0.9 10.1
Total 97.3 2.7 100.0
Problem Classification (Percent)

PRC R-1459A-3
DESIGN BACKGROUND DATA
1. Component Description
This analysis deals with the UCR major item, "amplifier/amp box,"
or, in more generic terms, amplifiers. While a considerable number of
amplifier types are included, they all function to provide an output that
magnifies or increases (i. e., amplifies) some characteristic of the input.
The wide range of amplifier types stems from the input characteristic
that is amplified. For instance, a read amplifier in a tape recorder
magnifies the weak signals read from the tape so that the signal informa-
tion is usable in other circuitry in the recorder. A power amplifier con-
verts the current-voltage characteristics of the input so that a higher
current can be obtained from the output in power supply applications.
All amplifier types included in the analysis are electrical/electronic
and do not include mechanical amplifiers that would be found in, say, a
fluidic control system.
2. Data Base
A total of 2219 UCR's are contained within the historical data file
as of 15 September 1969, listed under the UCR major item code 348,
amplifiers/amp box. In general each UCR represents a problem asso-
ciated with one amplifier. In every case where an entry greater than
one appears in the UCR data element, "quantity rejected," the entry
refers to piece parts within the amplifier. In this analysis, therefore,
the number of UCR' s is also the number of amplifier problems.
Three of the 2219 UCR's were eliminated from further consider-
ation, two because they are requests for design action on problems
previously reported, and one because of unresolved data irregularities
(attributed to an amplifier not located at KSC).
The remaining 2216 UCR's are distributed among 35 functional
systems, with 96 percent concentrated in 8 of them. Exhibit 1 shows
the number of UCR' s in the data base for these 8 functional systems.
About half of the total number of UCR's are written against amplifiers
in the television and OIS-RF functional systems, each accounting for
about one-fourth of the data. Another 20 percent of the UCR's are
attributed to OIS-Audio. The 27 functional systems which are not

PRC R-1459A-4
EXHIBIT 1 - AMPLIFIER DATA BASE: NUMBER OF UCR'S BYFUNCTIONAL SYSTEM
Functional System
Television
OIS-RF
OIS-Audio
Data Transmission
Measuring
Range Instrumentation
PA and Paging
Telemetry
No. ofUCR' s
566
564
452
157
158
116
81
40
Total: 2,134

PRC R-1459A-5
represented in the exhibit account for only 82 widely scattered UCR's.
Furthermore, these UCR's are written against amplifier types which
are different from any of those appearing in the eight functional systems
which are listed. Therefore, and for convenience of analysis, these
UCR's are eliminated from the data base.
The data base, then, consists of the 2134 UCR's, distributed among
the eight functional systems as shown in Exhibit 1.
3. Engineering Analysis
Numerous tabulations, contrasts and preliminary classifications
were made in the course of the initial analysis of the 2134 amplifier UCR's.
Only the more significant findings are summarized here.
First, the UCR's span a 5-year period from early 1964 to early
1969 and are distributed as shown in Exhibit 2. In all cases save two,
the majority of the UCR's each month are from the three major functional
systems in the sample (Television, OIS-Audio and OIS-RF). The UCR's
from these systems comprise roughly three-fourths of the total number
of UCR's and their monthly distribution generally reflects this. The
two exceptions are: (1) no UCR's appear for these three systems before
September 1965, and (2) in March 1967 the monthly distribution is altered
slightly by a relatively large number of UCR's (31) against Range Instru-
mentation. The 31 Range Instrumentation UCR's, all Multiplexer Ampli-
fiers, were generated during some kind of calibration-maintenance procedure.
The "peak" in September 1967 is due to 116 amplifier UCR's written
against the television system. These 116 UCR's comprise roughly 75
percent of all UCR' s for that month. All are from LC 39 and occurred
approximately 6 weeks prior to the first launch from that complex. Of
the 116 UCR's, slightly over half concern AGC/DA amplifiers, and
slightly under a fourth, switching output amplifiers.
Ninety percent of the AGC/DA amplifier UCR's (57 of them) involve
replacement of a "defective" photocell. It appears that this is related to
an AVO modification (dated August 30, 1967) for "no AGC action," but
the exact relationship is not clear. It is not obvious whether the photo-
cell was actually defective, whether it would have become so had the

PRC R-1459A-6
1965 1966Date
* 1967of Occurrence
1968
ii1969
EXHIBIT 2 - FREQUENCY OF AMPLIFIER UCR'S BY DATE OFOCCURRENCE
150
140
130
120
110 -
100 -
90 -
80 -
70 -
mU
0k00
z60 -
50 -
40
30
20 -
10 -
I II
1964
I!
I I

PRC R-1459A-7
modification not been made or whether the two are related only by time
(i. e., perhaps the unit was to be repaired because of the defective photo-
cell and the modification was also made at this time).
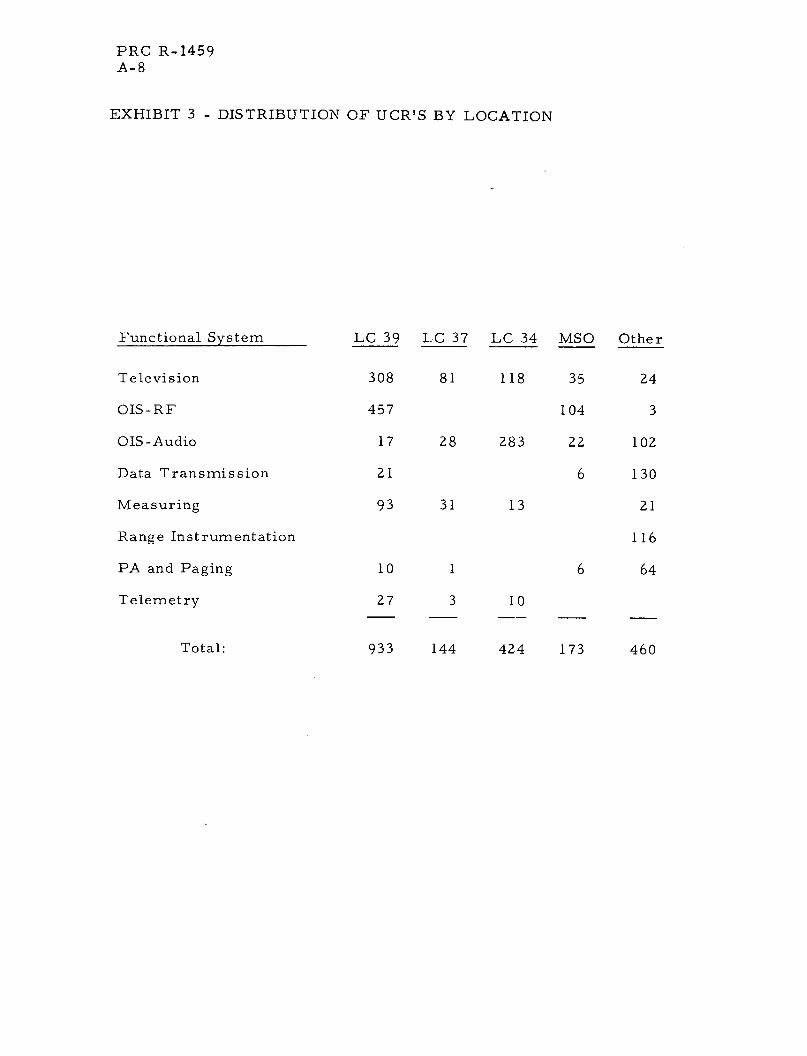
Exhibit 3 tabulates the distribution of UCR's by location. Slightly
over 40 percent are from Launch Complex 39, with LC 34 accounting
for the next largest group (20 percent of the total). The UCR's from
Launch Complex 37 comprise a minor percentage of the total, roughly
7 percent. No UCR's within OIS-RF are attributed to Launch Complex
34 or 37. About 80 percent of the OIS-RF problems occurred at
Launch Complex 39; the remaining 20 percent of the OIS-RF UCR's are
from the MSO. The column titled "Other" in the exhibit represents a
variety of locations, such as the VAB, CIF, and CDC.
In the total data base there are only 91 UCR's with time or age
entries. However, determination of time-between-failure for a particular
amplifier type is possible via the time tracing technique using serial
numbered components for 153 additional time observations. Of these
244 time entries, 215 are distributed among 15 specific amplifier types
in five functional systems as shown in Exhibit 4. In four of the 15 types,
data for two part numbers are combined based on the similarity evident
in their function and utilization. No grouping could be made for the
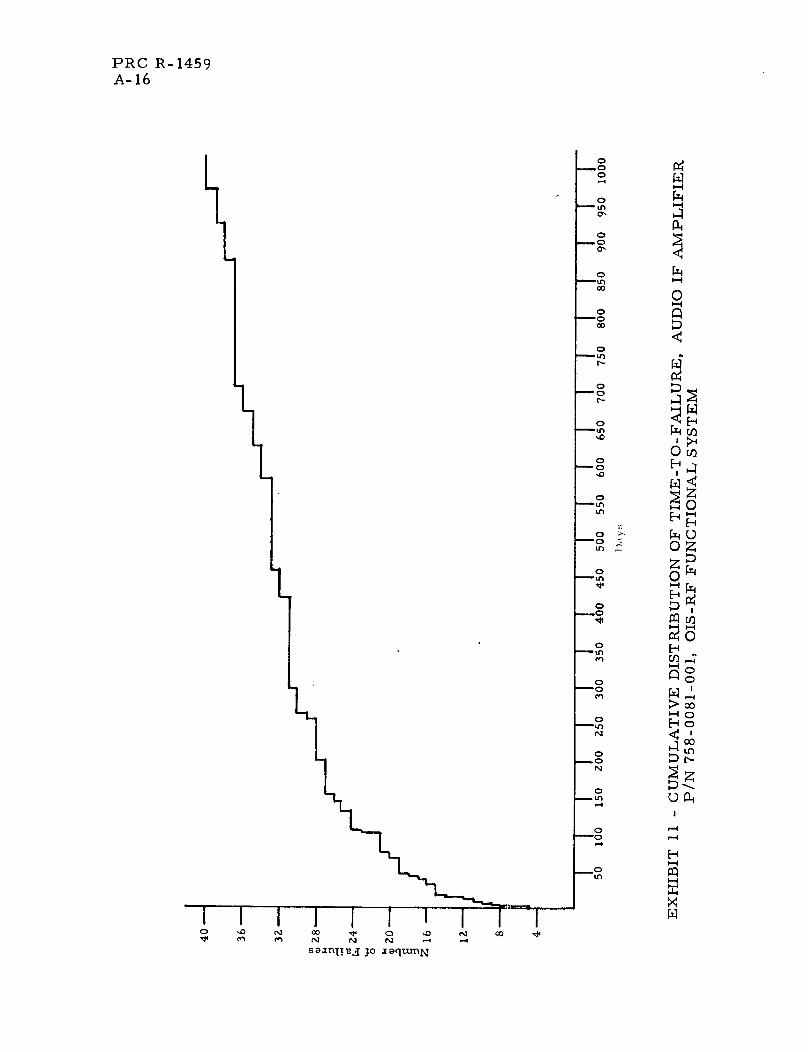
remaining 29 time entries. Assuming that each time observation repre-
sents one amplifier time-to-failure, the cumulative distributions of
time-to-failure for these amplifier types are shown in Exhibits 5
through 19.
Amplifier failures are related to problems associated with the
piece parts contained within the component. Piece part and module
failures reported in the data base are tabulated by functional system
in Exhibit 20. There are a total of 2454 piece parts. The "miscellaneous"
category in the exhibit includes all low-population piece parts such as
relays, fuses, switches, photocells, potentiometers, inductors of
various sorts, etc. The "unknown" column reflects those UCR's where
parts were replaced but the type of part was not indicated and those
cases where an overall number of various replaced part types is given
but the exact number of each part type can not be determined.
PRC R-1459A-8
EXHIBIT 3 - DISTRIBUTION OF UCR'S BY LOCATION
Functional System
Television
OIS-RF
OIS-Audio
Data Transmission
Measuring
Range Instrumentation
PA and Paging
Telemetry
Total:
LC 39
308
457
17
21
93
10
27
933
LC 37 LC 3
81 118
28 283
31 13
1
3 10
144 424
4 MSO
35
104
22
6
Other
24
3
102
130
21
116
64
460
6
173

PRC R-1459A-9
EXHIBIT 4 - NUMBER OF TIME OR AGE ENTRIES BY AMPLIFIER TYPE
Functional System Amplifier Description
No. of UCR'swith Time
Obs ervations
Total No.in
Data Base
Television
Television
Television
Television
Television
Television
OIS-RF
OIS-Audio
OIS-Audio
OIS- Audio
Measuring
Measuring
Measuring
Measuring
RangeInstrumentation
Switching Amp,P/N 3207, 3207 Althru A5
Switching Output Amp,P/N BO 5390A
Insert Amp,P/N 3207-A12
Video Distribution Amp,P/N D5864A, DA61PA
Pulse Distribution Amp,P/N 5841A, 3202
AGC/DA, P/N AG7394A
Audio IF Amp,P/N 758-0081-001
Headset PCB,P/N 24620496
AIA PC Card,P/N CO-0046
Mike PCB,P/N 24620492
Blue or Red Amp,P/N 173930
Amplifier P/N 723397-1
Amplifier P/N 356358-1
Amplifier P/N 356410-7
Multiplexer Amp,P/N 20010 and 20011
215 1215
29
9
97
19
7214
8 66
4 44
9 73
40 447
11 115
9 57
6 65
14 70
10
7
7
11
12
7
38 60
Total:

PRC R-1459A-10
1O
CoC> )
L-
Io Um
o_O
o HZ
' -,
C) r .
0 w1
o
H0LO M
u<
I' LI I LI C I('3 N -
s..InUTt.A ,o J nO ullrl4

PRC R.- 1459A-11
VU
z
H
Ln'i-i
CD5
c jn
_° S.
0
'- ~~In .
0 ~~ C
LO -IEl
m 0
.o~
c~
saxnITeI jo Iarquxnt
a 00 "- to L 'e N -4

PRC R-1459A-12
O
-O
'0
-un
-U7
U,
-O
Un
t
0 a
-0
oU,
O-o
N
O,..
oo
ouq
r:
z
CD
Z
1-4
U]
ZO
U)
l
DW
oaZ
Lq
I I I I I I I I I - I I I Il' N _ 0 cr, 0 t '0 Un v M N -
_ - -__ _ _ -r
sal:nllie fo .aqumN
i

cO ' D co N -
PRC R-1459A-13
rZ
ONm
H O
LO1.0
.0
OL
o
o H
o o
e ~ I
0N O
o H
'.0o Iz
H-
sal.TnlTe, jo xaqumnM

PRC R-1459A- 14
O
0X Z¢
o
,,o O[~D
o ~O
o aE]
)o A
°n Z
o
~N ~ m
Ln
azLX
D;
'rlnTT'.' TO ::I'TTrlkT X,...... L JU -' * V 1.LIr.

O' O r- ,o In n N -
saTnlTieq Jo xaqumN
PRC R-1459A-15
a
LO ¢x
oo X
o ~
C )CIo cd ,•
o HF-, OV
N
E-4
LF¢ >
; C
D-
o
PRC R-1459A-16
o-
-,
o0
o
a,
o
- o
o
-*no
-tn
I.-
00
o
0
o
-o
0
o0
--
O
-4D
O-o
Lno
o
o
u~,-4
o
Ln
I:
--T
0
FD
0 z
l4
00
Hr
Ez
E--
mr
I IIfi I NI I I I 'TN I o ,4 00 N N 4 _
sainITeJ Jo laqu-nN
. . .· !

PRC R-1459A-17
O'0
Ln
o 0o
o L
o
10
-Ln V-'
n 0ton
o 1¢
O °
.q4
o >
tf Z
o d<
o Ho
o N
N
- I4
r-
-q ° a' oo r- s0 In n N -
sainlIle jo l aqUInN

0N
00
O,
oo
O
,o z
o
, 0¢
O~
'0
o
1'- X
o
N O
o 'ee
o
!II
Ui
0 ~
x ~Sc L ! L ~ ~ ~ L l i i i ~ ~
sa.nlIet~. jo xaqumN
PRC1..- 18
1459

PRC R-1459A-19
pqU
o aLn
o
O 3
0
o O
o X,o
o cd o
u
-Ln
oo
0
a,
q
-4
saanI.e,' jo IoqturnN-
o LO

PRC R-1459A-20
4
o ", $
00
ON
0o
O 4
o ZZo
o 4In
oH
o 0
0-'Gusn C_ , Ol co r- tn~ Hen 0
o 5
o o
_~~~~~~ ~ ~ ~ ~ _ _
_~~~~~~~~~~: _ _
saJnHlTI 3{0 j aoqumN
..

PRC RP1459A-21
I I Ib- ~'I Ln
I I I I
oI-4
ODErx1
,, '.0
Z
H
I--4
U']
sm E crs
C O
,Ii,
HN
N SAP
so w_
X
s ainIT ez jo aqurnN
II I
ors X
I I II I I
-- I

PRC R-1459A-22
z
Iz
0U
%f
I I I I I I I
I _N 22?- 1- 1 1 1 1 1 X~~~~~~~~~~~0
rs so tn + s H~~~~~~~~~~~~~~~~~~~~~-
sanlpe.g jo XaqumN

PRC R-1459A-23
o
L,Lr~
'I¢
O
HZOrA
0 z
co tn
> ,
O =
N
- -I
I I I I I S n0 L .I I*qr -n
scIn11ne 3 jo aaquafl
"-L -,I

PRC R-1459A-24
X
HE
<)Ho
as O9
00
c 1S
U'
N -4
H~E--4
-4~~
>'13d[AI;I
sa9nl-tPi Jo iJaqtxmN
C ': N c0 O D ' 1Ne fe N N N
PRC R-1459A-25
Of all the piece parts, capacitors appear to be the most trouble-
some, especially in the television system. They do not appear to be
especially troublesome if the TV system is excluded. This could pos-
sibly be due to the number of capacitors, frequently large electrolytics,
required in television equipment. Of all high-population piece parts,
diodes appear to be least troublesome, even slightly less so than resistors.
A maintenance policy change occurred apparently in early 1967.
Before that time, most replacements were piece parts; after that, mod-
ular replacement became fairly standard. The "modular replacement"
column in Exhibit 20 reflects the number of such replacements and in-
cludes printed circuit boards and cards, in addition to those cases
specifically indicating replacement of a module, amplifier, headset,
regulator, etc. The module was either returned to the vendor for repair
or the UCR on the module repair was not written against the amplifier.
Thus, while it can be assumed that many modular replacements were
due to failed piece parts, the type of failed parts cannot be determined.
Of the total number of replacements, the ratio is 2/3 for piece parts
and 1/3 for modules.
The large entry in the miscellaneous column for television (101)
is due primarily to 57 photocell replacements. These were the UCR's
in September 1967 against the AGC/DA amplifiers discussed earlier.
A fairly significant number of UCR's (106) reported problems due
to part or component aging. Of these UCR's, roughly 60 percent were
written against the television system. The parts involved were unknown
in most cases, although it could be determined that capacitors accounted
for roughly a fourth. It is not known whether the aged parts actually
failed or whether they were replaced as a precautionary measure.
Four points should be noted which are significant in spite of the
few UCR's associated with them. First, in only 13 cases was the cause
of failure attributed to environment, where environment is defined as
natural (lightning, rain, etc.) or artificial (improper ventilation, for
instance). Hence, it does appear that environment has little effect on
amplifiers at KSC, possibly because they are located within electronic
enclosures.

PRC R-1459A-26
IaWU
a,0(N
-- I
cc
oza)
H;JP
ao
0
U). H n
a o
U) -
k (
-'-4-IU
CO
I(J
P U
Crl0
C!Z
x0 a''aIt
n ol o r- Ir)0a - -- -4 '0
00 n inr* It I I
O~~~0 N cc~~ N I
- ( tN
N ( Ln rn a'r- - -rn -
0 (NJ-4 Nrlj
0
0O ao t I -4cc 'P
'n .0 In aD cnI
cc'IT
'Pa'
U)
Cdo
E-40P
n In 0 o C N aCY,N - Lfn _
0 'O t CO N -4
0r~ c -4
w
a,(A)
U
w
z
o
U)
-4
H
Uz
ccPQ
¢
-4
0
;
H
P-4
¢
¢fl-
o
r-lH
Xw
0
o
On tO
0 .
C C)
H 0 O e H p
,~ ~ ~ .~

PRC R-1459A-27
Second, there were 12 cases of bad spares. While this is not
significant in terms of the number of cases, it could be significant if it
caused extended down-time during critical periods.
Third, in a few cases, less than 5 percent of the data, the problem
observed during operation and reported on the UCR could not be repro-
duced during repair activities. This could reflect an unrealistic simu-
lation of operating conditions in the repair environment or improper
operations or maintenance procedures.
Finally, there were 42 cases of blown fuses or circuit breakers.
The number of parts protected (that is, did not fail) from the problem
resulting in the blown fuses or circuit breakers is unknown. It is
assumed, however, that the protection prevented the occurrence of
additional down-time. The significance to KSC in terms of "saved"
down-time as a result of using circuit protection devices is an area
which could be investigated further.
4. Component Population
The engineering analysis revealed 15 sub-populations within the
amplifier data base for which FFR calculations can be made. There are
215 time-to-failure observations among 15 amplifier types. In 12 of
these types the population is formed by part number of the amplifier.
In the remaining three, two part numbers are combined. In each
of these 3 cases, the amplifiers are structurally and functionally similar.
Exhibit 4 lists the 15 amplifier types and shows in each case that
the number of UCR's with time observations is 10 percent or more of
the total amplifier type UCR' s.
5. Component Times
The 215 time observations listed in Exhibit 4 are depicted in
Exhibits 5 through 19 as the cumulative time-to-failure distribution for
each amplifier type. Three of the exhibits reflect a probable inspection
at specified maintenance intervals: Exhibits 6 and 17 at 24 months,
Exhibit 19 at 12 months.

PRC R-1459A-28
The minimum, maximum and mean time-to-failure observations
for each of the 15 populations is shown in Exhibit 21. The Television
Switching amplifier data exhibits a significantly low mean time to failure.
Since in this analysis an amplifier is considered failed if at least one
part within it fails, the low mean time to failure is probably the result
of the complexity of an output television amplifier. High power compo-
nents are involved. The data do indicate, however, a cause for concern
for this amplifier type.
No further analysis is provided for the amplifier types associated
with the remaining 29 failure times available in the data base; no popu-
lation groups of sufficient size for FFR calculation could be formed.
6. Component Failures
The problems associated with each of the 215 time observations
are judged to represent an unsatisfactory condition (or failure) attribu-
table to the associated amplifier types.
7. Failure Classification
All 2134 UCR's were classified on the basis of the narrative
descriptions of the unsatisfactory conditions and the coded data elements
"failure, repair disposition, recommend and reason." Tabulations were
then made on the basis of problem classification vs. failure mode. The
coded headings of the tabulations for problem classification are defined
as follows.
NS (Normal Service). In this category are all those unsatis-
factory conditions which arise as a result of normal field operation or
for which insufficient information is available to assign it to any of the
other four categories. Most amplifier unsatisfactory conditions due to
failed piece-parts are included in this category. The part failure involved
may have actually been due to a design problem (overstressing, for in-
stance), but there is no way to determine this from the UCR.
CP (Operational Problem). UCR's in this category imply that the
unsatisfactory condition was caused or exacerbated by the misuse, incor-
rect repair or mishandling of the amplifier on the part of the operating

PRC R-1459A-29
f in '00 n CO rN
-o 'N N
0 o o0
a~d''o00o o
o r0 CO D0, 0 00oo
M . l . .
o o o o
r- ' It N N-- ' O O
', Un Ln nr-
in
a' Ui) 0t N tN --
Nin
C0o NN
U) o N N 0 nC NO --4
r-
Ln
N 4-
o N
oF9 r
-4Nc
0
9
Co00*n
-¢4 C¢~ 0
a H
¢ -J o
4 • aC) or-al u) u -) 04- -
U) .U->
o0
a)
E*H
(12
p
o 0
to 0N0 Ln
m N X
E0H
¢C
o
4-W
(124
Q
hv
a)co
,I;J
UL
0
U-v::
v¢
NO r - o o 0 n Co Co
-i -
0Co0o4
ao, ,oND 0 N CO 0 oo n 'IT r ',D X N ,-0 (c, , e~ O CO N ON _ 4 N C tin N CO
0 N t n 0000 --- O '0 '.o
--4
'- 'O No, o -,
N No I
<
0. H
PQ
14
U
aV
F0 H
0 0
- -4I I
m a' in
N N in. -N cn
r-
o
ioLnm
PL
E
av-d
k , H .Ho H *H .H-4 -4I .-
V z a cu ¢ ¢ ¢
-04 E
N
-4
00N
r-
0
0oN
-4
H
,--
,-I
a
c,
C
or0
.H
.4-(r
Ea) ;-4
r. z
Cd
C
.,
(1
CV
En(120
bt oC o°4,
o ao
-n o o
0 0
o-0C)
N
0
zita;
Y:
(n
a)
*Hr Ci
HO
0 Q
. r-j
4 -HJ
m >
EH U)F- o
..O
.0
Cd
Ln
0
U)
0
0
0oo
4U
'Z
t-4
. H
Q,.
I--
a)43
Ut
.H
ur-w.
PRC R-1459A-30
or maintenance (O and M) personnel. An example of a classification in
this category is a wrong connection resulting from an error in an
earlier repair.
QP (Quality Problem). This implies a fault which is neither in-
herent in the design nor the result of normal (or abnormal) operation.
It is generally a manufacturing problem such as the wrong valued parts
having been installed by the vendor.
DP (Design Problem). A fault which is inherent in and can be
corrected by the amplifier design. An example of a classification in this
category is an overheating problem because adequate precautions were
not included in the design, even though the amplifier was intended for
high-power use.
PM (Preventive Maintenance). This classification includes UCR's
that detail conditions which, although not currently unsatisfactory in any
operational sense, could become so in the future. An example here is
an amplifier that was refurbished when the equipment was undergoing
general overhaul.
Each UCR was further categorized according to one of the 16 failure
modes listed in Exhibit 22. In establishing these 16 categories and in
assigning each UCR to one of the 16, two ground rules were applied.
First, the failure mode is that of the affected amplifier and not that of
a part within the amplifier nor that of the system in which the amplifier
is located. Second, the failure mode assignment for each UCR reflects
as nearly as possible the actual information entered on the UCR.
Most of the failure modes listed in Exhibit 22 are self-explanatory,
but a few clarifying comments are in order.
o Incorrect Output: Includes cases reporting distorted out-
put, output out-of-spec, DC bounce on output, etc.
o Incorrect Gain: Includes cases reporting loss of gain, low
gain, gain variations, incorrect AGC (automatic gain control), etc.
o Noisy: In addition to cases reporting noise conditions,
includes ringing, humming and improper filtering.

PRC R-1459A-31
EXHIBIT 22 _ AMPLIFIER FAILURE MODE CATEGORIES
1. No Output
2. Incorrect Output
3. Incorrect Gain
4. Noisy
5. Intermittent
6. Unstable
7. Incorrect Frequency Response
8. Oscillations
9. Defective Power Supply
10. Blown Fuse
11. Incorrect Timing
12. Incorrect Manual Function
13. Inoperative
14. Function Unique
15. Unknown
16. Other

PRC R-1459A-32
o Defective Power Supply: Includes cases reporting a power
problem, such as loss of regulation, power supply out-of-tolerance,
loss of supply voltage(s), etc.
o Incorrect Manual Function: Includes cases reporting inoper-
ative switch, improper response to switching, loss of indication
or incorrect indication, etc.
o Function Unique: Includes cases reporting an effect that is
applicable only to the specific system in which the amplifier is a
part. In other words, the amplifier failure mode could not be
determined other than as a symptom observed of the system
within which the amplifier is functioning. Examples within this
category include "video streaking," "no transmit," "poor recorder
pen response," etc.
o Other: Includes all failure modes that are reported less
than 1 percent of the time. For the 2134 UCR's in the sample,
this means that any failure mode appearing less than 20 or 21
times is included in this category. Examples are "out of adjust-
ment," "clipping," "overheating," etc.
In assigning a failure mode to each UCR, several assumptions were
required due to the nature of some of the entries. On many UCR's,
failure mode information is restricted to the part level (such as "leaky
capacitor") and therefore does not provide any indication of the reaction
of the amplifier. In these cases it was assumed that the amplifier fail-
ure mode is "unknown" since it could not be determined from the UCR
whether the part failure caused "no output," "incorrect gain," etc.
On many other UCR's, failure mode information is restricted to
the system level and again, the failure mode of the amplifier cannot be
determined. In all of these cases, however, there was sufficient infor-
mation on the UCR's to justify the assumption that the failure mode was
"function unique."
The tabulation of problem classification vs. failure mode for all
amplifiers appears in Exhibit 23. A significant point to be noted from
this exhibit is that almost all (97.3 percent) amplifier unsatisfactory

PRC R-1459A-33
EXHIBIT 23 - CLASSIFICATION OF ALL AMPLIFIER UNSATISFACTORYCONDITIONS
Failure Mode
No Output
Incorrect Output
Incorrect Gain
Noisy
Intermittent
Unstable
Incorrect FrequencyResponse
Oscillations
Defective Power Supply
Blown Fuse
Incorrect Timing
Incorrect ManualFunction
Inoperative
Function Unique
Unknown
Other (each < 1% of total)
Total
% c
Proximate
NS OP
417 2
217
196
312 2
57 1
20
24
31
26
31
23
22
123
464
94
19
Z076
97.3
3
Cause of
QP
4
1
2
3
2
1
Failure
DP PM Total
1 424
1 219
198
1 318
58
20
1 25
1
33 1.5
31 1.5
31 1.5
24 1.2
23 1.1
1
1
2
4
15
0.7
8
2
2
26
1.2
1
6
0.3
11
11
0.5
131
468
101
30
2134
100.0
1 See text, page A-28, for definition of descriptor codes.
19.8
10.2
9.3
14.9
2.7
0.9
1.2
6.1
21.9
4.7
1.4
100.0

PRC R-1459A-34
conditions arise during normal service. This is largely due, however,
to lack of information on the UCR so that a more proper assignment can
be made. This may be due to insufficient information available to the
repair personnel when completing the UCR. The repair technician may,
for instance, have no way of knowing that a part he replaced has failed
because of a QP problem unless the problem is quite obvious.
Of problems arising other than in normal service, QP has the
greatest number, followed by O and M. This has little significance,
however, due to the few occurrences and the uncertainty implicit in the
Normal Service assignments.
Exhibit 24 depicts the failure mode classifications for all UCR's
associated with the various amplifier types having installation times
available. This exhibit is for normal service conditions only. Other
classifications for these amplifier types can be made in only 17 instances.
The bottom row of the exhibit indicates the percentage of normal service
classifications for each amplifier type.
Function unique is the largest single failure mode group for ampli-
fiers in general (over 20 percent) and roughly half of the various amplifier
types indicate this same phenomenon. Since most entries in the function
unique category reflect a description of only a system problem, the failure
mode of the amplifier itself cannot be known with any certainty. This is
also true of the "inoperative" failure mode since inoperative could mean
loss of output, loss of supply power, or any number of other conditions.
Combining the function unique and inoperative failure modes with the
unknown category reveals that the true amplifier failure mode is not
known for approximately one-third of all cases.
Excluding the three failure modes discussed above (i.e., function
unique, inoperative and unknown), the categories "no output," "noisy,"
"incorrect output" and "incorrect gain," in that order, comprise the
4 leading failure modes and account for slightly over half of all assign-
ments to amplifiers in general. The remaining 9 failure mode categories
all contribute less than 3 percent each (and usually less than 2 percent)
to the assignments to amplifiers in general. Except in a few individual
cases, the assignments to the specific amplifier types follow this
same trend.

PRC R-1459A-35
'dtu -tiaxaldInI r-. n.- I I I I I I I o ouoEleluatumnsuI aNue Na .No o
L-0la9S5 'O*N 'd-vtu r l e , , , -, ,_ , ,- . r- o
1-85£I95 'ON 'dtuy 'Ouianse I
N I II I N 0
I-L6££ZL 'oN duu¥ 'SulznseoaI _ , ~ , , , , , , , _ , , m , , o
0
,--u '0 ! .- I - , -I _ I . ' 0 N'dtuv pa' .to anlg 'Su1.nse _ _ , - r-
- t- -
0'
0',
P-0Do DcI VIV 'oTp.pnV-SIO N
' dIZ :sP~O 'uox.P p- m I I I In -'t n -I I I -I I I' I ,-l ,.-I -, n
' du XI oSpnH '.l y-Ip O o_ N (n __ o r-
VQ/DDV 'UoISIATlaTL N N
_E~ O
_4 0
,O
u'
0 - C1) 0 ..
'd d o U, N -4 U-bfldLI - 0 i U
U U c1)U0 i U U U °
--.4 h LE 9_U 3 S h ()O h Z
,-Z ,-i , o0'n.o,, ~ k uU, , d ,
c4~,- - 0
O~k (d~c ' .. (D U
0 O '0aoO~~o o
0
z
U)OI
z 00
OH
1 -4zHEH
H
OU
F_
OOS
O $
I]
¢ ¢qr

PRC R-1459A-36
8. Field Failure Rate
Taking each of the permissible component times for each of the
15 amplifier populations as representing one time to failure, the mean
time to failure (MTTF) may be found by summing the individual times
to failure and dividing by the appropriate number of observations (that
is, failures) for each amplifier type. The field failure rate (FFR) is
the reciprocal of the MTTF.
The FFR estimates for the 15 amplifier populations are shown in
Exhibit 25. The FFR is shown in the familiar form, field failures per
1000 hours. Combining the data for all 15 amplifiers provides the
cover sheet data.
9. Confidence Factors
An examination of Exhibits 5 through 19 shows that the assumption
of exponentially distributed times to failure is not unreasonable for
most of the populations. This assumption is used in order to calculate
the 90 percent confidence interval on the FFR for each of the 15 popu-
lations. The confidence intervals, together with associated FFR, are
shown in Exhibit 25.
10. Resolution of FFR Rates
There is no evident indication of factors influencing the field failure
rate for amplifiers. Environmental factors have negligible effect;
quality control, personnel (O and M), or design problems occur in less
than 3 percent of the data base. On the basis of the UCR information,
the magnitude of the FFR' s reflect normal service problems. The
failure mode analysis offers little to aid in the isolation of influencing factors.
It is possible, of course, that many of the problems classified
herein as normal service are indeed quality, design, and O and M prob-
lems. Determination of ways to reduce the amplifier FFR's should
include investigations into supply and maintenance policies and procedures.

k r r9 N 0 o o (1n a, 0 - O r · ,C) N r9l N r- CN Lr) Lf) r- LO 1 a fi (O 00 ->
04
P4 O ), C; .~ . O O .0 C- c- -; 0 . . . -
U)
z~~~~~~~~~
P- 0C N N y)-- C C N00r-CT a r t
~ ~ ~~~ Lr u~ --I0 0~0 LO ~ 0~o CY N 0~
-c 0 0 0 0 0 0 0 0 0 0 0 0 0 0
3NN~~O 00
Uo;= ' o
CD r- Lf) So ON ~o0a, Ll .'rT
'A 01 _>
Hr O CY 00 r9 = Oa O 9 00 0 C > t)~~~~- ~o 3 _ oo Cy _ - M o o o o oCo
a~~~~~
~~~~~~~~~~o
0~~~~~~~~~~~~~~~ ......9
CTdH~~~~ ·1
Lr) Lf o 1 -4C
o Ln _ ,
0 Lr NF4S~ o1 o 9
cr n£a, \ kk c o *n r a
r sD n £ c9 $, O 0 am r
A 0 c9 ~~N (13 9 O On O4
k 4
¢ c.Fl (clr \O 9~~~~~~~~~~~~~~~~~~~~~~~O 1
¢a $¢
P ~ ~ ~ -4
¢ Nor)oo o o-4 O1) 4 O 0 -O
10 00C1 N f)1-
h Q N Og g = t5
4 -HICf d d ¢°2, ¢ 5 to 4 ° ° ^
¢ g: 9 Q Q (¢) g ' t N LO a :¢
.- b *-4 r CY M Q) zz 4 a ai e ~r 1 E" 4 ~~4C) 04 4J 4 ~ ~
5· 33 3 sa a (Dk s ¢ °¢2gg EO O a k 4 M0 a) 0U) 0-
m c, PI U F4 P: k k k 5~~~14 --MME aX~~~~_ 1-44U) 4Z, o 4a , k
.,j ~ ~ ~ ~ a pCl)~~: ~
Y) Ln pI df d q C !~ a,~~~~~~~
PRC R-1459A-37
U)
<
LD
0
c~
<
F~
In
;
0©
o
ox
r-q)
<t-4
Q-,
tg
I
n
LO
z
0
U\
4
z
E-1
X
w

PRC R-1459A-38
11. Repair Time
Approximately 90 percent of the UCR's (1,896) provided repair
time data. Separate, rather than overall. repair times are reported
since repair procedures differ among the various functional systems.
For instance, repairing a tube-type video amplifier requires different
techniques from repairing a modularized-transistor multiplexer ampli-
fier. Repair time information for the various functional systems as
well as the number of UCR's per system is given in Exhibit 26.
The highest mean repair time is for PA and Paging, and this
occurred because of significant amounts of time to locate the failure.
Television exhibits the next highest mean repair time and this
occurs for at least two reasons. First, the time-to-checkout is signi-
ficant in many cases; it appears that this is due to complex alignment
requirements. Second, modularization of TV equipment is not prevalent
so that part replacement was required in a significant number of cases.
In fact, in many cases, several parts had to be replaced. To shed more
light on this, median repair times were computed for the television sys-
tem for three cases: (1) overall, (2) when more than one part was re-
placed, and (3) when repair was by modular replacement. The results
are as follows:
Median repair time when morethan one part replaced: - 6-1/2 hours
Median repair time, overall: - 5 hours
Median repair time for modularreplacement: - 1 hour
297 UCR's against the television system report replacement of more
than one part; 142 UCR's report modular replacement.
Range instrumentation mean repair time is also high (4 hours,
18 min. ) but this is due to two exceptionally lengthy repairs. If these
two cases are excluded, the mean repair time becomes 1 hour, 24 min.
The mean-time-to-repair for OIS-Audio (1 hour 36 min,) is somewhat
large because it reflects two maintenance policies. After the repair
policy changed to modular replacement in early 1967, the mean repair
time became 30 minutes.

PRC R-1459A-39
EXHIBIT 26 - REPAIR TIMES BY FUNCTIONAL SYSTEM
Functional System
I elevision
OIS-RF
OIS- Audio
Data Transmission
Measuring
Range Instrumentation
PA and Paging
Telemetry
All of the above
No. ofUJCR's
532
529
446
154
43
98
81
13
1896
Min.Hr s. Min.
- 3
4
- 16
- 2
- 5
- 5
- 15
- 10
- 2
Repair Time
MeanHrs. Min.
6 7
31
1 36
- 29
- 6
4 18
6 48
28
2 35
Max.Hrs. Min.
50 -
9
15 31
2 30
49
168 30
38 48
35
168 30
I

PRC R-1459A-40
Sixty-seven UCR's reported "time awaiting replacement." These
times ranged from a few minutes to, in one case, 8 months. A tabula-
tion of this information is presented in Exhibit 27. The highest mean-
time awaiting replacement (1.7 months) is for OIS-Audio since it contains
the 8 month entry. This time becomes 57 hours when the 8 month entry
is excluded. Television exhibits the next highest mean-time-awaiting-
replacement, primarily because of 6 entries greater than 1 month.
Excluding these 6 entries reduces the mean-time-awaiting-replacement
to 2 hours 48 minutes. PA and Paging has a long mean awaiting time
(67 hours) due to the 640 hour entry. When this entry is excluded, the
mean awaiting time becomes 1.6 hours.

PRC R-1459A-41
EXHIBIT 27 - REPLACEMENT AWAITING TIME BY FUNCTIONALSYSTEM
Functional System.
Television
OIS-RF
OIS-Audio
Data Transmission
Measuring
Range Instrumentation
PA and Paging
Telemetry
No. ofUCR' s
38
0
12
4
0
0
11
2
Time Awaiting Replacement
Min. Mean Max.
Hrs. Min. Hrs. Min. Hrs. Min.
- 15 334 - 1800 -
10 1.7 months
20 - 28
15
15
67 -
- 30
8 months
- 40
640 -
- 45

PRC R-1459B-1
RELIABILITY ASSESSMENT
OF
BATTERY
Date: 24 May 1972
Observed Field Failure Rate
In Failures Per Thousand Hours
Of Installed Component Time
Observed Failure Times, In Hours
Mean
Minimum
Maximum
Number of Observations
Observed Repair Times, In Hours
Mean
Minimum
Maximum
Number of Observations
0. 108
9, 250
1, 460
17, 250
9
1.48
0
6
12

PRC R-1459B-2
FAILURE MODES AND CAUSES CONTRIBUTING TO
THE OBSERVED FIELD FAILURE RATE
AS A PERCENT OF THE TOTAL
Failure Causes
Design Quality NormalProblem Problem Service Total
Battery Wearout 0 0 40.8 40.8
Battery Post Problem 0 11.1 0 11.1
Acid Problem 3.7 0 0 3.7
Wiring Error 0 3.7 0 3.7
Safety Control 3.7 0 ' 0 3.7
Overcharged- Boiloff 3.7 0 0 3.7
o Shipping 0 3.7 0 3.7Internal Short 0 0 3.7 3.7
Won't Maintain Charge 0 0 3.7 3.7
Cable Broken/Cut 3.7 0 7.4 11.1
Too Small Gauge 3.7 0 0 3.7
Battery Charger 3.7 0 0 3.7Mech. Misalignment
Battery Rack 3.7 0 0 3.7Acid Problem
Total 25.9 18.5 55.6 100.0
Number of Relevant UCRs: 27 Currency:(1) 26 April 1971
( 1 )Date of latest UCR run included in the assessment.

PRC R-1459B-3
DESIGN BACKGROUND DATA
1. Component Description
The compdnent considered in this assessment is restricted to
electrical storage batteries used at all KSC locations. These components
are listed as major item 360 in the old UCR system and as major item
116 in the new system.
2. Data Base
The KSC UCR data bank was polled for batteries in the major
item category. This poll resulted in 26 UCR s of the old type and four
of the new type. All of those UCRs are combined into one data base of
30 UCRs.
Three UCRs were coded "battery" incorrectly, referring instead
to gaseous nitrogen and helium storage tank batteries; these UCRs have
been removed from the data base. Of the remaining 27 UCRs, four
referred to cable problems, one to a battery charger problem, one to
a battery rack problem, seven to mobile radio battery wearout, and
14 to miscellaneous battery problems.
The earliest failure occurrence date among the 27 acceptable
UCRs is 20 December 1965 and the most recent is 25 September 1970;
the data retrieval was executed on 26 April 1971. No efforts were made to
extend the data base beyond the results of this printout.
3. Engineering Analysis
Although there are very few data points in the data base, there
are five subsets into which these data naturally fall. These are battery
charger (1 UCR), battery rack (1 UCR), battery cables (4 UCRs), mobile
radio batteries (7 UCRs), and miscellaneous, or other, batteries
(14 UCRS). The battery charger, battery rack, and cable UCRs, while
not specifically battery failures, will be carried throughout the analysis
for completeness.
Among these five subsets there is little correlation of specific
unsatisfactory conditions except for the mobile radio batteries. In
this subset, all batteries suffered natural wearout and were replaced.
It is for these failures that the most complete downtime data was given,
PRC R-1459B-4
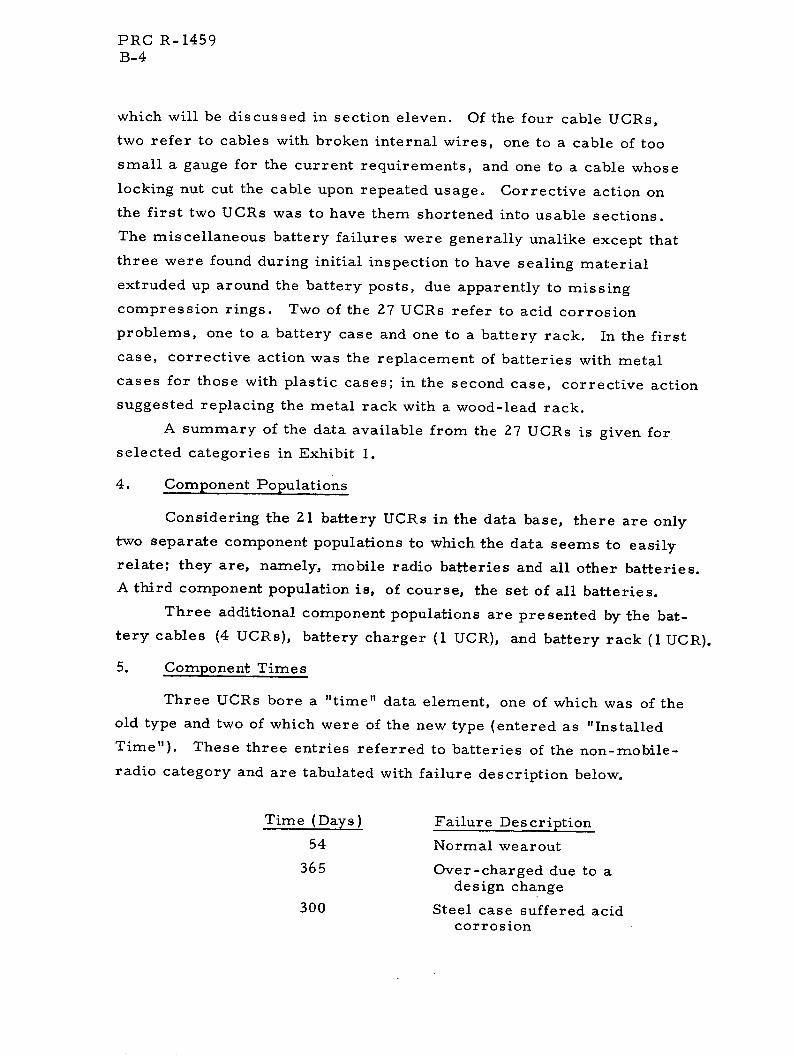
which will be discussed in section eleven. Of the four cable UCRs,
two refer to cables with broken internal wires, one to a cable of too
small a gauge for the current requirements, and one to a cable whose
locking nut cut the cable upon repeated usage. Corrective action on
the first two UCRs was to have them shortened into usable sections.
The miscellaneous battery failures were generally unalike except that
three were found during initial inspection to have sealing material
extruded up around the battery posts, due apparently to missing
compression rings. Two of the 27 UCRs refer to acid corrosion
problems, one to a battery case and one to a battery rack. In the first
case, corrective action was the replacement of batteries with metal
cases for those with plastic cases; in the second case, corrective action
suggested replacing the metal rack with a wood-lead rack.
A summary of the data available from the 27 UCRs is given for
selected categories in Exhibit 1.
4. Component Populations
Considering the 21 battery UCRs in the data base, there are only
two separate component populations to which the data seems to easily
relate; they are, namely, mobile radio batteries and all other batteries.
A third component population is, of course, the set of all batteries.
Three additional component populations are presented by the bat-
tery cables (4 UCRs), battery charger (1 UCR), and battery rack (1 UCR).
5. Component Times
Three UCRs bore a "time" data element, one of which was of the
old type and two of which were of the new type (entered as "Installed
Time"). These three entries referred to batteries of the non-mobile-
radio category and are tabulated with failure description below.
Time (Days) Failure Description
54 Normal wearout
365 Over-charged due to adesign change
300 Steel case suffered acidcorrosion

PRC R-1459B-5
EXHIBIT 1 - NUMBER OF DATA ELEMENTS FOR SELECTEDCATEGORIES TAKEN FROM BATTERY UCRS
Category
Total Number of UCRs
Part Number
Serial Number
Vehicle
Time or Age
Launch Complex
Time to Locate
Time to Repair
Total Downtime
Manufacturer
Functional System
Next Assembly Name
Criticality
Number of UCRsWith Entry
27
15(1)
2(1)
9
7(1)
17
7(1)
(1) Generally not7 the same UCRs
7(1)
21
22
22(1)
3(1)23.
Note: (1) Not available on the four UCRs of the new type.

PRC R-1459B-6
Six UCRs (different from the three above), three of the non-mobile-
radio battery category, two referring to cables, and one referring to
a battery rack, had "Age" entries. These are tabulated with failure
descriptions below. All six UCRs were of the old type.
Battery Rack 12
12
Batteries18
24
12
12Cables
Metal battery rack sufferingfrom acid corrosion
Battery bank unprotected bysafety cover
Internal shortcircuit
Normal wearout
Internal wire broken
Cable cut by locking nut
These six battery failures were due to normal wearout, and corrective
action consisted of replacement with a like item.
The complete distribution of the 27 UCRs by failure date is given
in Exhibit 2. Age entries are also indicated.
6. Component Failures
Of the 27 UCRs, all refer to legitimate failures as defined by
this Reliability Assessment. However, perhaps one deserves further
note. On 9 July 1966, a 275 volt storage battery was found to be missing
a safety cover. The UCR indicated that such a cover was mandatory
and classified the condition as a design problem. The criticality code
was entered as "Loss of Vehicle or Life."
It should also be pointed out that in four cases the quantity
rejected code was something other than "1". In two cases "0" was
entered for initial inspection failures, and in two cases "2" was entered.

PRC R-1459B-7
Md >,
- . V
o o
i'l
F1i
1.J! i71
I- j
JI
i
Li
IU
CD
U
0
0
V-
A
UD
F-
P:Hl
--U 4,.
000
0 0
a)0)0)0+ bO
cn ut u
V v
o a) aP Q O +
0-C)
,_
OD
-- 4
ON
co
'0
-400
~o
_
as
.r
-4
' - '0
_ Do-4
ON

PRC R-1459B-8
In one of these cases two batteries in a ramp generator suffered normal
wearout. In the other case, two cells of one 12-volt battery used as un-
interrupted power supply in the Flight Training Building suffered normal
wearout (internal short). Because of vagaries in the data, no attempt
has been made to investigate battery failures in terms of individual cells,
and because of the nature of the failure of the ramp generator batteries,
this UCR is treated as a single failure.
The table below is a summary of the number of failures given by
the data base.
UCRs Failur e s Batteries
Battery Rack 1 I 0
Battery Charger 1 I 0
Cables 4 4 0
Batteries: Mobile Radio 7 7 7
Non-Mobile Radio 14 14 15
Total 27 27 22
7. Failure Classifications
All 27 failures have been put into three failure mode classifications.
These are:
o Design Problem - a fault inherent in and correctable by
component design;
o Normal Operation - a failure determined to be due to
normal field operation;
o Quality Control - a fault due neither to design nor
normal (abnormal) operational problems. Generally
a manufacturing error.
Altogether, seven design problems, five quality control problems, and
15 normal operation problems were found.
The battery charger failure, the battery rack failure, two cable
failures, and two of the non-mobile-radio battery failures were design

PRC R-1459B-9
problems. These last two were written on UCRs of the new type. All
five of the quality control problems referred to non-mobile-radio bat-
teries, and were found during initial inspection or cleaning operations.
Two cable failures, six non-mobile-radio battery failures, and all seven
mobile-radio battery failures were normal operation problems. Two of
these non-mobile-radio battery failures were written in the new UCR
format, but bore occurrence dates prior to 15 October 1969. A sum-
mary of the failure modes is given in Exhibit 3. It is noted that the fail-
ure of a battery due to no safety cover being installed (see discussion in
section 6) has been classified as a design failure.
8. Field Failure Rates
Nine entries for the battery population UCRs carried a failure time
or age. Combining these indiscriminately they are distributed as shown
in Exhibit 4. The mean failure time, t , is given by:
5
t = tifi/ni=l
where n = 9 and ti
and fi are as given in the table. The value of t is
12-2/3 months. Taking the reciprocal of this value and converting units
gives an estimated FFR of 0. 107 failures per thousand hours.
9. FFR Confidence Intervals
From the tabulation given, the distribution of time-to-failure
looks as though it is better described by a normal distribution rather
than the usual exponential distribution. Therefore, the standard deviation,
s, of the nine failure times is calculated as:
5 2 1/2
S =I i(n) = 5. 9 months

PRC R-1459B-10
EXHIBIT 3 - TABULATION OF FAILURES BY FAILURE MODE
Failure Mode Failure Description
Design
Battery Rack 1.
Battery Charger 1.
Cables 1.
2.
Batteries, Other( )
Quality Control
Batteries, Other (1 )
Normal Operation
Cable 1.
2.
Batteries, M. R.
Batteries, Other( 1 )
Metal back corroded due to action of bat-tery acid.
Misalignment of gear shaft due to inadequatemounting.
Cable of too small a gauge to carry propercurrent.
Locking nut cuts cable upon repeated usage.
1. No safety cover provided.
2. Overcharged/Electrolyte boiled off, dueto design change.
3. Battery cases corroded due to action ofbattery acid.
1. Wiring error
32. l Sealant extruded at post due to missing4. compression ring.
5.. Wrong type battery delivered due toshipping error.
1. Internal wires broken.
1.2.3.4.5.6.7.
1.2.3.4.5.6.7.
Note: (1) Batteries, Other
Normal battery wearout.
Normal battery wearout.
Internal short (two batteries in one application).
refers to the non-mobile-radio batteries.

PRC R-1459B-ll
EXHIBIT 4 - EMPIRICAL TIME-TO-FAILURE DISTRIBUTION FORBATTERIES
Index Numberi
Failure Timet. (months)1
2
2
3
4
10
12
18
Number of Failuresf.1
1
1
5
1
245 1

PRC R-1459B-12
and 90 percent confidence limits on the mean are approximated by
L_ t U
where L = t - 1.860s/ /n = 9.0 months
U = + 1.860s/ yn = 16.3 months
Taking the reciprocal of those limits and converting to units of failures
per thousand hours a 90-percent confidence interval on the mean FFR
is given by
L= 0.084
U= 0.15
10. Resolution of FFR Factors
A number of tabulations and cross-comparisons of available data
elements are listed in Exhibits 5 and 6. Exhibit 5 tabulates manufacturers
against component population, failure modes, and criticality. Exhibit 6
graphs failure mode, component population (see Exhibit 2), and launch
complex by occurrence date.
In only two cases was there any indication of repetitive problems.
The first of these is the initial inspection discovery of extruded sealant
around the battery post. The three occurrences of this problem are
12 February 1966, 24 February 1966, and 28 February 1966. The other
case is the seven mobile radio batteries reported between 18 June 1968
and 28 January 1969. No radio appears twice. Furthermore, all other
batteries appear to be in unlike applications with no part numbers or
next assembly data, when given, occurring twice.
It is relatively clear from Exhibit 5 that quality problems have
been solved. This does not substantially impact the field failure rate,
however, since only one quality problem had an associated failure time
and that was 12 months; very near the mean value.

PRC R-1459B-13
_______ _ - ------ I I
0ooa aujAg - 0 0 0 0 - 0 0 0 - 0 0 0 0
Aula-llaI a' o a 0 0 0 o -o o o o o - o 0
Ala ueg -ua 0 o 0 0 0 0 0 0 0 0 0 0 o-
peala a - CI 0 0 0 0 o o 0 0 0 0 0 o- 0
DialoT - 0 "- 0 0 0 0 0 0 0 -0 0 0-
AOlll I ~ o --- o o - o o o o o o o o -
sayolS I ~ o o 0 0 00 0 00 o 0 0 0 0
uo arll~ _ o o ~ o o o o ~ 0 o o o o uollnAgj 0 0 - 0 0 0 0 "'0 0 0 0 -
ap!x3 N o o o oN o o o o o oN
Suon Telll r- in n o oDo r- o - o o o
'4o. ._
o o O otO ~~~~~~ ~ 0- E 4 .U o-uM 0c O O O 4 ~ (3 O) O . .
Su:> 1l° N F S~ tX £~ +F
<~~~~x ii,;,?5i
>l
F-4
0
z
ZZ
H
140
mp¢Z
I
I

PRC R-1459B-14
Key: * - Design+ - Quality
0 blank - Normal Operation
Li [c Wz~o [ II 1- 11 I-1 1 1 F I-10r
- 1 1 t I [ I I I I j I19(65 1966 1967 1968 19691~-~T~-r' ' :d~ ''' i I 'I~ T
7rr-' I I I I r1970
Key: * - Battery Racko - Battery Charger+ - Cablesx - Battery-Mobile Radioblank - Battery-Other
r5 )I E n . luI nfII l I7rf I I I i III i i I I f I I I ri IT
1968 1969 1970
Key: * - M.S.O. Bldg.+ - L. C. 37x - L. C. 39blank - Miscellaneous/No Entry
rnI mrllj U blRIFI j Me m
1966 1 967 1968 1 1969 1970
EXHIBIT 6 - GRAPH BY OCCURRENCE DATE OF FAILURE MODE (TOP),COMPONENT POPULATION (MIDDLE), AND LAUNCHCOMPLEX (BOTTOM)
||1 9 i ill
1965I I I I Ir I I 1 I I' I l l 96!
1966 1 1967
F]
f1
xe
I I I 11 I9 I I I 1965
L4 1 +-
1t4 0

PRC R-1459B-15
11. Repair Time
The most interesting time-related entries on these UCRs were
"Time to Locate," "Time to Repair, " and "Total Downtime. " Twelve
UCRs bore entries in these categories, five referring to non-mobile-
radio batteries, six referring to mobile-radio batteries, and one refer-
ring to cables. Since this information is unavailable on UCRs of the new
type, all 12 UCRs are of the old type. The entries as they appeared on
the UCRs are given below; it should be noted, however, that "Total
Downtime'' is usually taken as the sum of the other two items. Consid-
ering total downtime to be at least the sum of time to repair and time
to locate, it is seen that six mobile radios were down at least a total
of 8 hours for an average of at least 1 hour and 20 minutes.
Time to Time toLocate Repair Downtime
Cable: I hr. 1 hr. 1 hr.
Non-Mobile-Radio Batteries: 4 hrs. 2 hrs.
I hr. - I hr.
0 hr. 0 hr. 0 hr.
15 min. -
30 min. 1 hr. I hr. 30 min.
Mobile-Radio Batteries: 20 min. 40 min. -
2 hr.
- I hr.
1 hr.
I hr.
2 hr.
The six non-mobile-radio batteries caused a total downtime of 9 hours
and 45 minutes or an average of just over an hour and a half each. Com-
bining the data for all batteries indicates a mean downtime of 1.48 hours.

PRC R-1459C-1
RELIABILITY ASSESSMENT
OF
CABLE ASSEMBLIES
Date: 24 May 1972
Electrical Mechanical
Observed Field Failure Rate
In Failures Per Thousand Hours
Of Installed Component Time
Observed Failure Times, In Hours
Mean
Minimum
Maximum
Number of Observations
Observed Repair Times, In Hours
Mean
Minimum
Maximum
Number of Observations
7,450
0
43, 800
76
3
0
106
210
17, 000
730
35, 000
14
8
4
14
3
0.142 0. 054

PRC R-1459C-2
FAILURE MODES AND CAUSES CONTRIBUTING TO
THE OBSERVED FIELD FAILURE RATE
AS A PERCENT OF THE TOTAL
Problem Classification (Percent)
ElectricalCable Assemblies
MechanicalCable Assemblies
Cause of Failure
System DesignCable Quality ControlNormal OperationSystem Quality ControlOperation and MaintenanceAll Others
Predominant Failure Modes
ShortedDamaged CableDefective InsulationBrokenDefective ConnectionsPreventive MaintenanceAll Others
Number of Relevant UCRs: 830 Currency:( 1 ) 16 June 1969
( 1 )Date of latest UCR run included in the assessment.
3025151210
8
201621
916
18
64
1899
27
27
46
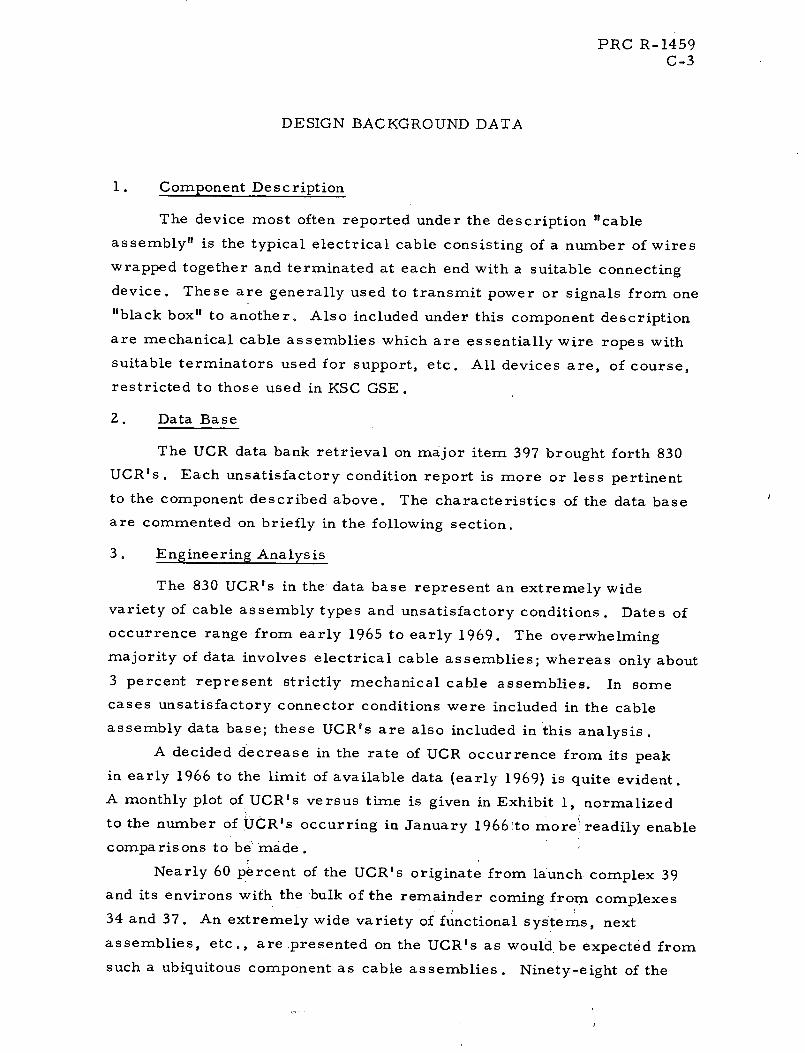
PRC R-1459C-3
DESIGN BACKGROUND DATA
1. Component Description
The device most often reported under the description "cable
assembly" is the typical electrical cable consisting of a number of wires
wrapped together and terminated at each end with a suitable connecting
device. These are generally used to transmit power or signals from one
"black box" to another. Also included under this component description
are mechanical cable assemblies which are essentially wire ropes with
suitable terminators used for support, etc. All devices are, of course,
restricted to those used in KSC GSE.
2. Data Base
The UCR data bank retrieval on major item 397 brought forth 830
UCR's. Each unsatisfactory condition report is more or less pertinent
to the component described above. The characteristics of the data base
are commented on briefly in the following section.
3. Engineering Analysis
The 830 UCR's in the data base represent an extremely wide
variety of cable assembly types and unsatisfactory conditions. Dates of
occurrence range from early 1965 to early 1969. The overwhelming
majority of data involves electrical cable assemblies; whereas only about
3 percent represent strictly mechanical cable assemblies. In some
cases unsatisfactory connector conditions were included in the cable
assembly data base; these UCR's are also included in this analysis.
A decided decrease in the rate of UCR occurrence from its peak
in early 1966 to the limit of available data (early 1969) is quite evident.
A monthly plot of UCR's versus time is given in Exhibit 1, normalized
to the number of UCR's occurring in January 1966!to more' readily enable
comparisons to be made.
Nearly 60 percent of the UCR's originate from launch complex 39
and its environs with the bulk of the remainder coming from complexes
34 and 37. An extremely wide variety of functional systems, next
assemblies, etc., are presented on the UCR's as would be expected from
such a ubiquitous component as cable assemblies. Ninety-eight of the

PRC R-1459C-4
0o-
I I I I I m
O O O O O O O O OaO co [- ,, Lf v ' I) N -
s ,o1 n jo JaoquN 9AT..ela
-4
00
ON-4
u
_- '
0o
-- 4 4-
Ad
V.
05
Er7
v)
L4
H
Z
0
I
ZT~
w:-D
-4
u)
-4
o
__
_r
I

PRC R-1459C-5
UCR's contain entries regarding component in-service time upon,
occurrence of the unsatisfactory condition and provide the time required
to repair the unsatisfactory condition. These items are treated in more
detail in the subsequent sections.
4. Component Populations
Other than the obvious dichotomy between mechanical and electrical
cable assemblies there is no clear way to assign a, given cable assembly
to a unique sub-population of substantial size. An obvious classifi-
cation would be cable length and capacity (number of wires) but neither
of these factors is generally available. Part numbers are much too
diverse to form the basis of population discrimination.
Furthermore, the quantity of available component in-service time
data is not of sufficient magnitude to warrant the definition of numerous
populations. Therefore, for the purposes of failure rate calculations
only three subpopulations have been defined; (1) all heavy-duty mechanical
cable assemblies, (2) electrical cable assemblies at launch complex 39,
and (3) electrical cable assemblies at launch complexes 34 and 37.
5. Component Times
All available age entries are taken directly from the UCR printout
and are shown in Exhibit 2 by the selected populations. Eleven entries
which do not fit the categorization have been excluded. Decimal entries
were recorded as hours on the UCR's and converted to months by dividing
by 730 hours per month. Note the grouping of failure times at half-year
intervals, particularly at 6, 12 and 24 months. This probably reflects
the fact that most age entries are educated guesses rather than measure-
ments and hence tend to group as shown. The entries indicating zero
time reflect those items received bad from the manufacturer and detected
during installation, etc.
6. Component Failures
All 87 UCR's for which component time information is tabulated
above are judged to represent a failure of a cable assembly; furthermore,
only one attributable failure is reported per UCR. The number of

PRC R-1459C-6
EXHIBIT 2 - COMPONENT TIMES FOR VARIOUS CABLE ASSEMBLYPOPULATIONS
Cable(Age at Failure
As sembliesFrequency in Months)
Electrical
Age Mechanical LC39 LC34/37
1
1
1
4
3
1
2
4
4
1
1
4
1
1
5
1
1
2
3
1
14
1
1
2
1
1
1
1
5
1
5
2
2
4
1
1
1
1I I
0
0.114
0.137
1
2
2.58
2.65
3
3.55
5
6
9
11
12
14
15
16
18
24
30
36
40
48
60

PRC R-1459C-7
failures for each population can be counted from Exhibit 2; the numbers
are: 11 for mechanical cable assemblies, 31 for electrical cable
assemblies at launch complex 39 and 45 for those at launch complexes
34 and 37.
7. Failure Classifications
Each of the 87 failures have been classified according to its failure
mode, its failure mechanism and its failure cause. These are tabulated,
by population, in Exhibit 3 and further summarized on the cover sheet.
Note the extremely high incidence of failure causes other than normal
operation and in particular the category referred to as system design.
The headings of Exhibit 3 are for the most part self-explanatory.
The item heading called Preventive Maintenance under failure mode de-
notes a repair, or corrective action, undertaken in anticipation of a fail-
ure and thus is counted as a failure and included as a failure mode. The
dichotomy between a "system" and "cable" under Failure Cause is in-
tended to reflect those UCR's written against the cable assembly for
which the cable assembly itself is not at fault but rather the cable/system
interaction.
8. Field Failure Rates
Exhibit 2 contains all the data requisite for the calculation of field
failure rates for the three selected cable assembly populations. The
following tabulation (using a conversion factor of 730 hours per month)
summarizes the calculations.
Cable Assembly Population
Mechanical ElectricalL.C. 39 L.C. 34/37
No. of Failures 11 31 45
Mean-Time-To-Failure (Months) 25.3 9.41 9.85
Failure Rate (failures/month) 0.040 0.106 0.101
Failure Rate (failures/1000 hours) 0.054 0.146 0.139
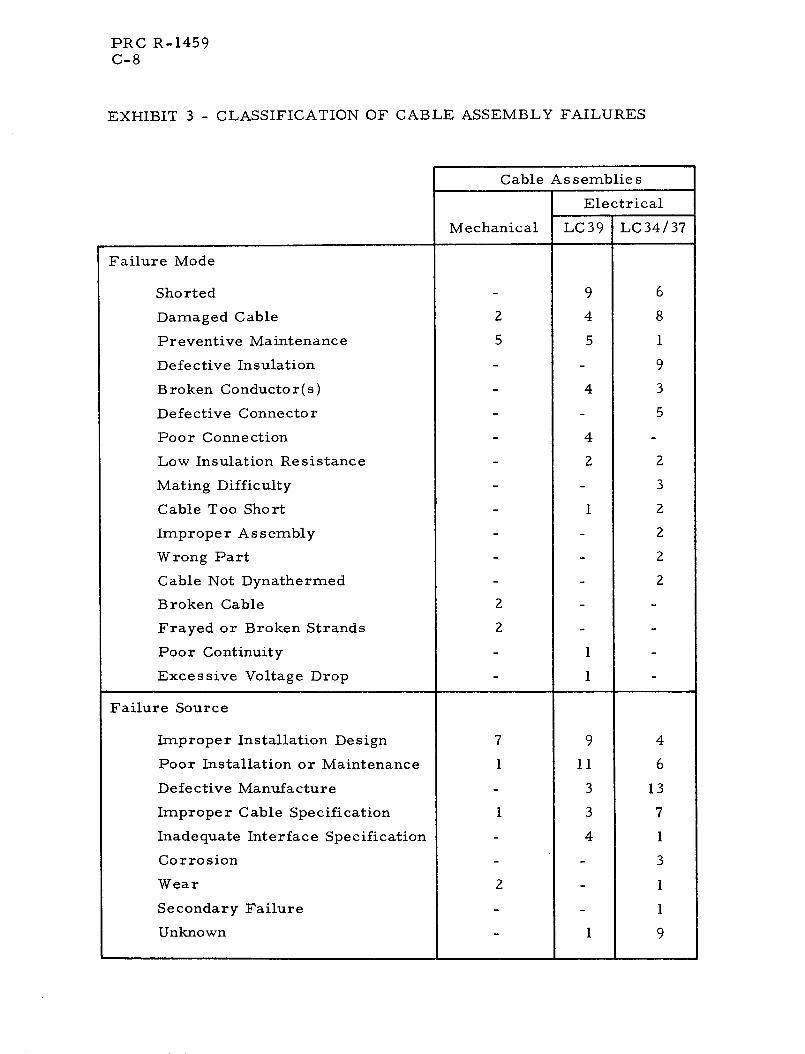
PRC R-1459C-8
EXHIBIT 3 - CLASSIFICATION OF CABLE ASSEMBLY FAILURES
Cable As semblie s
Electrical
Mechanical LC39 LC34/37
Failure Mode
Shorted 9 6
Damaged Cable 2 4 8
Preventive Maintenance 5 5 1
Defective Insulation - 9
Broken Conductor(s) ) 4 3
Defective Connector - 5
Poor Connection 4
Low Insulation Resistance 2 2
Mating Difficulty - - 3
Cable Too Short 1 2
Improper Assembly - 2
Wrong Part - 2
Cable Not Dynathermed - 2
Broken Cable 2
Frayed or Broken Strands 2
Poor Continuity - 1
Excessive Voltage Drop - 1
Failure Source
Improper Installation Design 7 9 4
Poor Installation or Maintenance 1 11 6
Defective Manufacture - 3 13
Improper Cable Specification 1 3 7
Inadequate Interface Specification - 4 1
Corrosion - 3
Wear 2 - 1
Secondary Failure - 1
Unknown 1 9
I I I

PRC R-1459C-9
EXHIBIT 3 (Continued)
Cable Assemblies
Electrical
Mechanical LC39 LC34/37
Failure Cause
System Design 7 16 7
Cable Quality Control - 3 16
Normal Operation 2 2 9
System Quality Control 1 4 5
Operation and Maintenance 1 6 2
Cable Design - 4
Unknown - 2

PRC R-1459C-10
The field failure rates for the two electrical cable assembly popu-
lations are clearly not significantly different. Hence, that data may be
combined to give a composite field failure rate for electrical cables
used in KSC GSE of 0.142 failures per 1000 hours (equivalent to an
MTBF of 9.67 months).
9. FFR Confidence Intervals
Ninety percent confidence intervals are calculated for both mech-
anical and electrical cable assemblies under the assumption that the times
to failure of each are adequately described by an exponential distribution.
These limits are:
Field Failure Rate (failure/1000 hours)
Lower Limit Mean Upper Limit
Mechanical Cable Assemblies 0.030 0.054 0.084
Electrical Cable Assemblies 0.116 0.142 0.169
10. Resolution of FFR Factors
On the basis of Exhibit 3 (supported by detailed examination of the
UCR's) no more than one failure in 6 can be attributed simply to the
inherent unreliability of cable assemblies. Indeed, over 1/3 of all failures
can be attributed to system design, i.e., these failures would not have
occurred if the pertinent piece of GSE were more adequately designed.
Over 40 percent of the failures are directly associated with cable in-
stallation divided nearly equally between actual workmanship and faulty
specifications .
Only ten percent of the Launch Complex 39 electrical cable as-
sembly failures were attributed to defective manufacture whereas nearly
30 percent were so classified at Complexes 34 and 37. This phenomenon
is also reflected in the greater proportion of zero-time failures at
L.C. 34/37. It may indicate improved cable assembly manufacture or,
perhaps, only different reporting procedures. Almost half of the me-
chanical cable assembly failures took the form of preventive maintenance,

PRC R-1459C-ll
i.e., replacing the cable prior to an impending failure. Only two of 11
mechanical cable assembly failures were due primarily to simple wear-
out.
In any event, solely by improving design, quality control, operation
and maintenance both at KSC and at the point of cable assembly manu-
facture, it would be possible to reduce the cable assembly field failure
rates given above by a factor of 6.
As noted previously the incidence of UCR occurrence is becoming
less frequent; unfortunately, there are insufficient data to quantify this
phenomena in terms of the field failure rate.
11. Repair Time
Nearly half of all the UCR's in the data base contain some infor-
mation with respect to repair time induced by the cable assembly UCR.
Exhibit 4 is a plot giving the cumulative frequency of total down time for
all electrical cable assemblies. Exhibit 5 collects some repair time
statistics of interest to the three selected sub-populations.

PRC R-1459C-12
oo
o
o
oo
O .9
O~~ U)
C-)
H
o
I~~~~- O0
H
H
- H
m
M-
-4
-4 IA
0 0 0 0 0 0 0 0 0 0 0o0 0C CO r. 0 r "I ) N -
(:uao.Id) Aouanbai. aAl.elnuIno

PRC R-1459C-13
EXHIBIT 5 - CABLE ASSEMBLY REPAIR TIME STATISTICS
Number ofEntries
Repair Time Element(Minute s)
Minimum Mean Maximum
Mechanical Cable Assemblies
Time to Locate 4 0 5 15
Time to Repair 4 240 352 840
Total Down Time 3 240 480 840
Electrical Cable Assemblies
Launch Complex 34/37
Time to Locate 36 10 25 2,400
Time to Repair 25 30 180 2,880
Total Down Time 31 10 165 3,360
Launch Complex 39
Time to Locate 21 0 60 780
Time to Repair 13 0 30 5,760
Total Down Time 17 0 45 6,360
All
Time to Locate 349 0 30 15,000
Time to Repair 173 0 180 5,760
Total Down Time 210 0 172 6,360

PRC R-1459D-1
RE LIABILITY ASSESSMENT
OF
CAPACITORS
Date: 24 May 1972
Observed Field Failure Rate
In Failures Per Thousand Hours
Of Installed Component Time 0. 072
Observed Failure Times, In Hours
Mean 1. 9
Minimum 1
Maximum 120
Number of Observations 122
TV FunctionalSystem All Others
Observed Repair Times, In Hours
Mean 13.8 4.3
Minimum 0. 08 0. 05
Maximum 696 77
Number of Observations 202 203
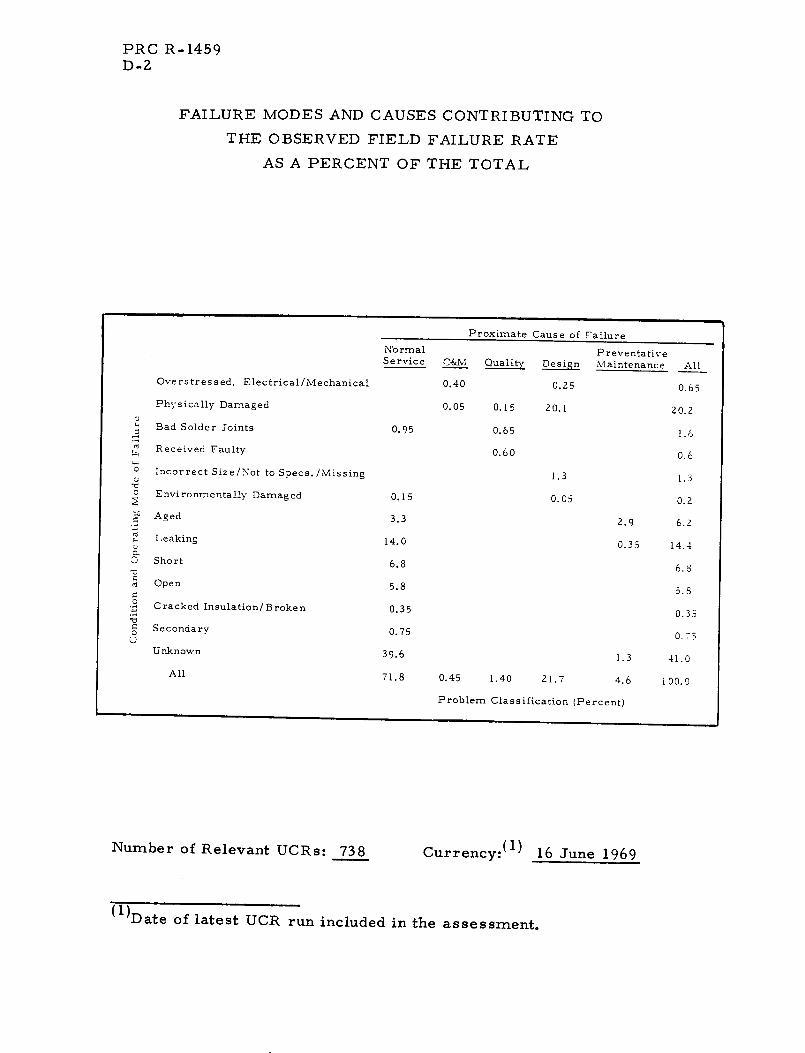
PRC R-1459D-2
FAILURE MODES AND CAUSES CONTRIBUTING TO
THE OBSERVED FIELD FAILURE RATE
AS A PERCENT OF THE TOTAL
NormalService
Overstressed, Electrical/iMechanical
Physically Damaged
Bad Solder Joints
Received Faulty
Incorrect Size/Not to Specs./!LIissing
Environmentally Damaged
Aged
Leaking
Short
Open
Cracked Insulation/Broken
Secondary
Unknown
All
O&M
0.40
0.05
0.95
0.15
3.3
14.0
6.8
5.8
0.35
0.75
39.6
71.8
Quality Design
0.25
0.15 20.1
0.65
0.60
1.3
0.05
P reventativeMaintenance All
0.65
20.2
1.6
0.6
1.3
0.2
2.9 6.2
0.35 14.4
6.S
1.3
0.45 1.40 21.7 4.6
Problem Classification (Percent)
5.8
0.35
0.75
41.0
1 00.0
Number of Relevant UCRs: 738 Currency:(1 ) 16 June 1969
(1)Date of latest UCR run included in the assessment.
Proximate Cause of Failure
OH
,,
ri
o
S
C:0
U
__

PRC R-1459D-3
DESIGN BACKGROUND DATA
1. Component Description
Capacitors, the major item analyzed in this section, are the
familiar electrical devices which store a charge when operating in a DC
circuit and alternately charges and discharges to present an impedance
when operating in an AC circuit. The capacitors in the sample are the
types used in electronic assemblies and in electrical power supplies
and are found in various applications within KSC ground support equip-
ment.
2. Data Base
The retrieval from the UCR data bank on major item code 810 re-
sulted in 745 UCR's, seven of which were incorrectly coded, and thus
eliminated. Each of the 738 UCR's used in the analysis reports an un-
satisfactory condition deemed to be assignable to a capacitor(s). Less
than 5% of the UCR's also report other piece parts as being associated
with the problem being discussed.
The data base could be extended by considering other major item
codes which are known to contain capacitors as piece parts, such as
amplifiers (348), encoders (481), printed circuit boards (640). While
capacitor failures not considered here (because they are reported else-
where) are suspected to be significant in terms of number, the large
sample size underlying this analysis is considered quite representative
of the KSC capacitor problems.
The capacitor data base consists of 2, 005 capacitor failures re-
ported on 738 UCR's.
3. Engineering Analysis
A summary of pertinent data elements on the 738 UCR's is pre-
sented below.
The UCR's cover a calendar time span from early 1966 to early
1969. A discontinuity appears in the number of UCR's generated at
the beginning of 1968. Exhibit 1 shows that the number of capacitor
UCR's per month throughout 1966 and 1967 was relatively low, 4 per
month on the average. In the 15-month period beginning January 1968,
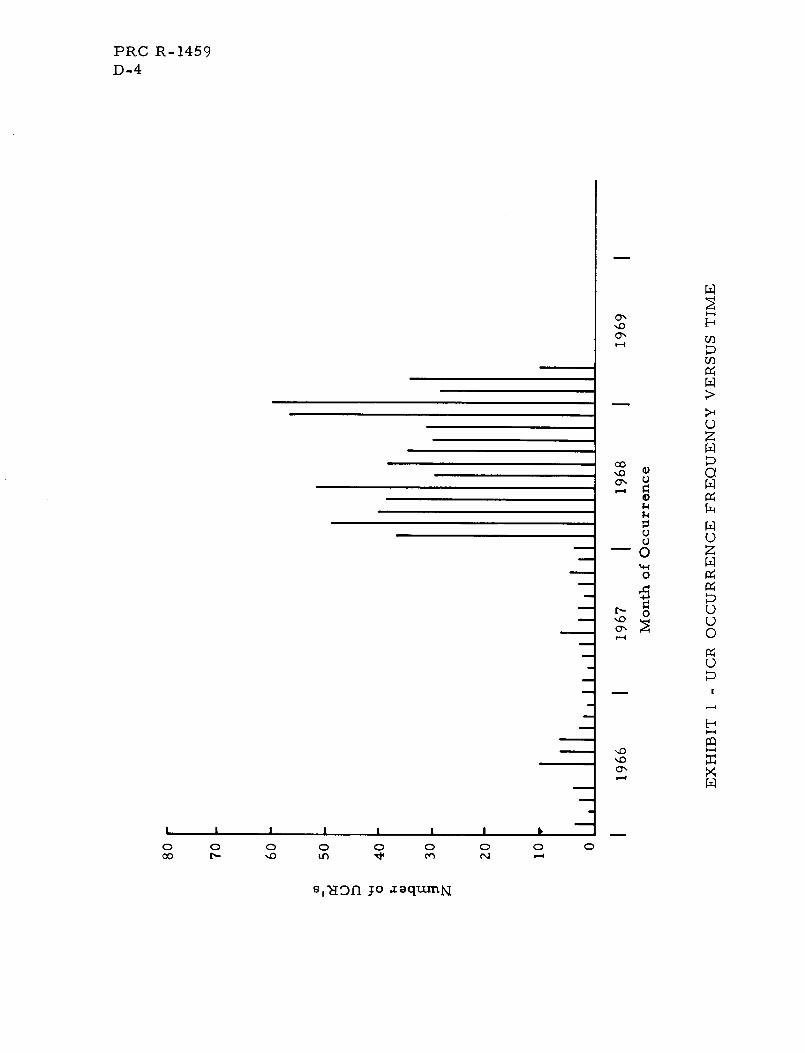
PRC R-1459D-4
o',
0)
u U-_OZ
o
U
_ X
o o o o o I oi _ _ _ _ _ _ _N
a'
s,oHnfl 3o TaqumN
0o re r- o e cN

PRC R-1459D-5
the average number of UCR's per month is 43. A possible explanation
for this sudden and continued high level of UCR generation can be found
in the observation that all UCR's written after the beginning of 1968 are
prepared by FEC; all UCR's (except one) written prior to 1968 were pre-
pared by an organization other than FEC. While it is possible that
capacitors were added to the code table as a major item at the beginning
of 1968, it is believed to be more likely that the discontinuity of Exhibit
1 reflects the increased emphasis placed on detail reporting by an or-
ganization newly assigned to the task. The discontinuity does not adversly
affect the analysis herein but should be noted.
Nineteen functional systems are represented among the capacitor
UCR's. Exhibit 2 shows the distribution of the UCR's and the associated
capacitor failures by functional system with a further breakdown to next
higher assembly for the Television Functional System. The Television
Functional System accounts for 65% of the 738 UCR's and 64% of the
2, 005 capacitor failures. All but 4 of the Television UCR's were gener-
ated after January 1968. The 453 failures of the Range Instrumentation
Functional System occurred primarily before January 1968 (only 14
occurred after that date) and represent almost totally design problems
associated with the equipment in which the capacitor was used.
No particular trend is evident among the capacitor failures that
could be attributed to size and voltage. The problems occur on capaci-
tors ranging in size from < 1.0 mfd to > 10, 000 mfd and from < 15v to
> 6, 000v. Relatively little information is available for capacitor type.
That at least 52% of the failing capacitors could be classified aluminum
electrolytic from their brand names (i.e., MEC, Sprague TE Series,
and Cornell Dubilier BR Series) may simply reflect the relative appli-
cation frequency of this type of capacitor in the GSE.
Only 122 time or age entries were recorded on the UCR's. It is
assumed in each case that these entries are time estimates logged
against the next higher assembly in which the capacitor failed. A de-
tailed analysis of all the next higher assemblies and their serial num-
bers identified on the UCR's resulted in no instances of repeat capacitor

PRC R-1459D-6
EXHIBIT 2 - PARTIAL DISTRIBUTION OF CAPACITOR UCR'S ANDFAILURES BY FUNCTIONAL SYSTEM AND NEXTHIGHER ASSEMBLY
Number NumberFUNCTIONAL SYSTEM of UCR's of Failures
Television 482 1259
(Next Higher Assemblies)
8" Monitor 261
Switching Amplifier 222
Insert Amplifier 217
Video Distribution Amplifier 177
Pulse Distribution Amplifier 69
DA-AGC Amplifiers 65
Demodulator 38
Power Supply 37
Phase Connector 29
Camera and Camera Control 23
21" Monitor 20
All Others (18 Next Assembly) 101
Range Instrumentation 77 453
Countdown Distribution 41 54
Data Transmission 35 69
OIS-RF 33 62
OIS Audio 15 21
Timing Distribution 13 13
P.A. and Paging 10 29
All Others (11 Functional Systems) 32 45
738 2005TOTAL

PRC R-1459D-7
failures (i.e., by the identical find number) from which further age data
could be determined. The distribution of the 122 failure times is shown
in Exhibit 3. Thirty-six of the 40 failures occurring at 24 months were
reported as the result of maintenance action; it is probable that the actual
date of failure occurrence is less than 24 months.
Over half of the UCR's (54%) were written against Launch Complex
39, with the Command Distribution Center, MSO Building and LC-34
contributing together another 24%. The remaining were essentially un-
class ified.
4. Component Population
The engineering analysis indicates that there is only one potential
capacitor sub-population for which field failure rates (FFR's) can be
calculated. This is not unexpected since there are only 68 UCR's with
time or age entries. For these UCR's, representing 122 capacitor
failures, the time entries are actually associated with the assembly in
which the capacitor is used.
Were time entries available, sub-populations exist in sufficient
size to warrant FFR calculations. Aluminum electrolytic capacitors,
with 1,043 failures, are a good example. Also, categorization by size
and voltage reveals such frequencies of occurrence as 253 failures of
50 mfd 50 volt capacitors and 82 failures of 500 mfd 15 volt capacitors.
Unfortunately, insufficient data exist to derive FFR's for these, and
similar, populations. In the sequel only those capacitors with time
entries are treated in the FFR calculation and they are combined into a
single sample.
5. Component Time
The 122 available time entries are each assumed to represent one-
time-to-failure for the associated capacitors. These are combined
and plotted in Exhibit 3. The underlying assumption here is that time-
to-failure of the equipment reporting the capacitor failure can be as -
signed as the time-to-failure of the capacitor. The frequency of failures
by time-to-failure in months is as follows:

PRC R-1459D-8
,-4
o
Do W
D
Sue
w 0
- 0E. ) E(
so
I ~ ~ z
1 X
I ! I I I · I~~~~ O -
H U) F
o ."
-5
4'.
[.L
C)
I p C)~~~~~~~~o C) C) C) C)~~~~~~~~~
C) ~ ~ ~
remrat o J o O
sonlT e~I lol'vdr D Jo .xqtun.N

PRC R-1459D-9
Time-to- No. of Time-to- No. ofFailure Capacitor Failure Capacitor(Months) Failures (Months) Failures
1 7 15 22 6 18 13. 4 20 14 11 21 16 13 24 407 6 40 38 2 36 5
10 1 42 111 1 48 112 6 60 814 1 120 1
6. Component Failures
Of the 122 capacitors with time entries, all are judged to represent
an unsatisfactory condition, or failure. The large number of entries, 40,
at 24 months is suspected of being the result of a scheduled inspection
or tests and may represent unsatisfactory conditions occurring at some
time less than 24 months. It may also represent a correction of a con-
dition which has not yet resulted in equipment inoperation. From the
narrative description on the UCR's, it is believed that the high frequency
at 24 months can be attributed to the former reason.
7. Failure Classifications
Classifying all 738 UCR's on the basis of the narrative descriptions
of the unsatisfactory condition report and the UCR coded data elements,
"failure," "repair disposition," I"recommend," and "reason" results in
the tabulation of Exhibit 4.
The "cause of failure" headings in that exhibit are defined as
follow s .
NS (Normal Service). All conditions which arose as the
result of normal field operation or for which insufficient information
is available to assign it to any of the other categories.
O and M (Operational and Maintenance). Problems clas-
sified under this heading imply that the condition was caused by im-
proper equipment usage by operating and maintenance personnel. This

PRC R-1459D-10
.n Un tA
I O
04 rn L N 0N
O o124 O Q r N _ f
0
0¢ ' ~2
z U)
CI ea)c) N N o EH >N0 ~' .C N u0 N LA L bD0'rn
u umXS
~o o
4L1
u -I
(d - 4
UU) P U) u S
p-4 (d -4 ) a) U)
H H' ~ ~ Ua (l o U 0o U Q)
aInll'e Jo apoWy Buile-.ado pue uo:llpuoD

PRC R-1459D-11
includes such actions as wrong frequency applied, excessive voltage,
and improper securing of the equipment.
QP (Quality Problem). A classification that implies a fault
neither in the design of a capacitor or its next higher assembly nor the
result of normal or abnormal operation. It is generally a manufacturing
problem such as bad solder joints for a capacitor on a card, or a ship-
ping and packaging problem such as physical damage.
DP (Design Problem). A fault which is inherent in and can
be corrected by design of the equipment in which the capacitor is used.
A particularly frequent problem (discovered and corrected prior to 1968)
was improper ventilation of equipment resulting in an extreme heat con-
dition in turn causing loss of capacitors.
PM (Preventive Maintenance). Those conditions in which
the capacitor was removed to prevent possible inoperative equipment
at a later date.
Each capacitor failure was further categorized according to one
of the thirteen condition and operating modes of failure listed below.
1. Overstressed, electrical/mechanical2. Physically damaged3. Bad solder joints4. Received faulty5. Incorrect size/not to specifications6. Environmentally damaged7. Aged8. Leaking9. Short
10. Open11. Cracked/broken insulation12. Secondary (inoperative due to another failure)13. Unknown
8. Field Failure Rates
Using each of the 122 capacitor failure times tabulated above as
representing one capacitor time-to-failure (TTF), the mean TTF (MTTF)
may be found by summing the times and dividing by 122. The FFR is
the reciprocal of the MTTF. These two values are

PRC R-1459D-12
MTTF = 19.1 months
FFR = 0.052 failures/month
Using a conversion factor of 730 hours per month,
MTTF = 13,900 hours
FFR = 72 failures/million hours
If the data presented on Exhibit 3 is adjusted to remove those
failures appearing at 24 months that are suspected of being the result of
maintenance actions, the MTTF calculation changes relatively little
(from 19.1 months to 20 months). For purposes here all 122 data ele-
ments are used.
9. FFR Confidence Intervals
An exponential distribution of the times-to-failure is assumed.
Since the MTTF is not significantly affected by adjusting the entries at
24 months, this assumption is not as unreasonable as it might appear
from Exhibit 1. The 90% confidence interval on the FFR is from 61 to
82 failures per million hours.
10. Resolution of FFR Factors
Exhibit 4 shows that at least 1/4 of the total capacitor problems
are due to other than normal service type problems. The 795 failures
for which no failure mode could be determined were generated primarily
after January 1968, and for this reason are believed to be the result of
either normal service problems or preventive maintenance actions,
rather than design or quality problems. A good assumption is thattheir
mode of failure is probably distributed in proportion to the four highest
modes of failures shown in Exhibit 4, excluding physically damaged, i. e.,
aged, leaking, short, and open.
11. Repair Times
The repair times associated with the capacitor UCR's are those
times required to repair a larger assembly by replacing the failed
capacitor(s). An analysis of the total repair times given on 505 of the

PRC R-1459D-13
UCR's shows a significantly longer average repair time for those capa-
citor failures in the TV functional system than that required in the other
18 functional systems represented in the data base. The reason for this
longer average repair time is two-fold. First, the repair, once the
capacitor is located and replaced, requires considerable time for check-
out and realignment, a requirement not so prevalent in the other func-
tional systems. Second, over 60% of the TV UCRss have time entries
in exact multiples of days (1/2, 1, 2), possibly reflecting scheduling
of personnel rather than realistic repair times.
The average total repair time for equipments within the television
functional system is 13.8 hours; in all others, 4.3 hours.

PRC R-1459E-1
RELIABILITY ASSESSMENT
OF
CIRCUIT BREAKERS
Date: 24 May 1972
Observed Field Failure R.ate
In Failures Per Thousand Hours
Of Installed Component Time 0. 072
Observed Failure Times, In Hours
Mean 13, 980
Minimum 5
Maximum 51, 100
Number of Observations 108
Observed Repair Times, In Hours
Mean 0. 02
Minimum 5. 51
Maximum 120
Number of Observations 77

PRC R-1459E-2
FAILURE MODES AND CAUSES CONTRIBUTING TO
THE OBSERVED FIELD FAILURE RATE
AS A PERCENT OF THE TOTAL
/oC"
qj;
0I-
I0~
Failure Causes
A-o
A7 $~~~17s'-I
C) 0 / e
2~~~~
O / Q /
fs'-0
/
f-4-0
0~
o)
.1 IITe
Number of Relevant UCRs: 176 Currency: (1 ) 26 April 1971
(')Date of latest UCR run included in the assessment.
Corrosion 6.8 - - - 6.8
Improper Response 19.6 - 2.8 0.6 23.0
Short 12.0 1.7 - - 13.7
Open 4.0 - - - 4.0
'0 Loose, Broken, or0 Burned Connection 5.7 _ 0.6 - 6.3
a Inoperative 4.0 - 0.6 - 4.6
Unsatisfactory ConditionX or Operation 14.2 - 1.7 5.7 21.6
Construction Problem 1.7 0.6 4.0 2.8 9.1
Wiring Failure 1.7 0.6 0.6 2.3 5.2
Miscellaneous 5.7 - - - 5.7
Total 75.4 2.9 10.3 11.4 100.0
!
ru

PRC R-1459E-3
DESIGN BACKGROUND DATA
1. Component Description
This analysis is concerned with the UCR major item, "Circuit
Breakers and Fuses." A circuit breaker in this analysis is a switch
that automatically interrupts an electric circuit under an infrequent
abnormal condition. A fuse is an electrical safety device consisting
of or including a wire or strip of fusile metal that melts and inter-
rupts the circuit when the current becomes too strong. This analysis
is restricted to circuit breakers and fuses used in KSC GSE.
2. Data Base
The UCR data bank retrieval on major item "Circuit Breakers
and Fuses" brought forth 237 UCRs. Before 15 October 1969, this
major item was coded as 805; after this date it was coded 143. Only
18 of the UCRs were written against occurrences after 15 October 1969.
Among the 237 UCRs there were two duplicates. Fifty-nine additional
UCRs were not included; 55 of these were integrated circuit failures,
four were failures of components other than circuit breakers or fuses.
Ten of the UCRs were written against fuses; all the rest were written
against circuit breakers.
The data base for the analysis of the major item of concern con-
sists, therefore, of 176 unsatisfactory condition reports, written mainly
against circuit breakers and predominantly before 15 October 1969;
i. e., written under the "old" UCR system.
3. Engineering Analysis
A complete tabulation and detailed scrutiny was given to each
data element on the 176 major item UCRs. Only significant highlights
are summarized here.
The UCRs span the period from late 1965 to mid 1970 as shown
in Exhibits 1 and 2.
About 59 percent of the UCRs originated from launch complex
39; over 85 percent are from the Saturn V program. Twenty-two
functional systems are represented in the UCR data, but 75 percent

PRC R-1459E-4
Ln 0N N
UL o
sDjnfl o iaqtuun
U)
'-
* 4
Oc-
Lo
Cy,
'-' " C
- ~_]
U
,-)so O
_L P7F
Xs
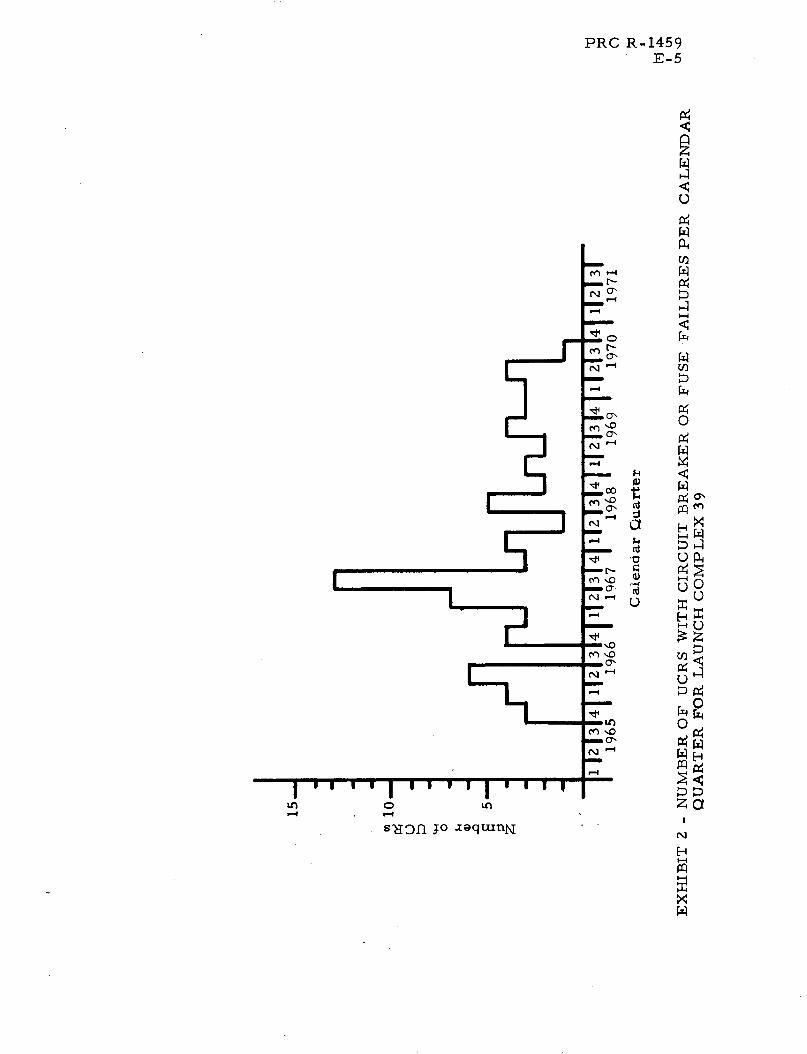
-4 -4
s-dofl jo aaqanMl
PRC R-1459E-5
U)
_0 0U]
_ O \O
_n k0
¢
- 4
N
H
7%.D
~a 01
r- F:~p

PRC R-1459E-6
of all UCRs come from the OIS-RF, Electrical Power Distribution,
and Electrical Networks functional systems.
There were 108 time or age entries recorded on the 176 UCRs.
These entries were all for circuit breakers. No times-to-failure
were reported for fuses. Exhibit 3 shows the distribution of these en-
tries assuming that each represents one circuit breaker time to failure.
4. Component Populations
The first attempt in defining component populations was to cate-
gorize the circuit breakers by their tripping limit. This attempt proved
unsuccessful since about 65 percent of the UCRs gave no indication as
to the limit, and for the other 35 percent there were 27 different limits
and at most 10 UCRs within one limit.
Further investigation of the UCRs yielded the following four popu-
lations: (1) all circuit breakers and fuses at launch complex 39, (104
UCRs); (2) all circuit breakers and fuses at launch complex 37, (16
UCRs); (3) all circuit breakers and fuses at launch complex 34, (12
UCRs); and (4) all circuit breakers and fuses at locations other than
LC39, LC37, and LC34 (44 UCRs).
5. Component Times
The 108 time observations previously mentioned are depicted in
Exhibit 3 as the cumulative time-to-failure distribution for the com-
posite population. Two of the subpopulations reflect a probable inspec-
tion at specified maintenance intervals; Launch Complex 39 at 12, 18,
and 24 months; and Launch Complex 34 at 60 months.
The minimum, maximum, and mean-time-to-failure observations
for each of the four populations is shown below:
Subpopulation Min Mean Max
LC-39 325 hrs 10,584 hrs 26,280 hrs
LC-37 2,190 hrs 16,734 hrs 51,100 hrs
LC-34 730 hrs 28,642 hrs 51,100 hrs
Misc 5 hrs 8,964 hrs 26,280 hrs

0,It
a.Inlleq 30o .aqunnN
PRC R-1459E-7
O
~r- X
Co
W-4
C, C-3
V:
rJ
ZU~
U2 g
_ <' )
SE
¢
_D 4
> D
C C 00 O o
8 a

PRC R-1459E-8
6. Component Failures
Each UCR in the sample represented one circuit breaker or fuse
failure. There were 166 circuit breaker failures and 10 fuse failures.
The problems associated with each of the 108 time observations were
judged to represent one and only one failure attributable to a circuit
breaker.
7. Failure Classifications
Classifying all 176 UCRs on the basis of the narrative descriptions
of the unsatisfactory conditions and the coded data elements "failure,
repair disp., recommend, and reason" leads to the tabulation of Ex-
hibit 4. The coded headings of that exhibit for problem classification
are defined as follows:
DP (Design Problem). A fault which is inherent in, and can be
corrected by, the circuit breaker or fuse design.
OP (Operational Problem). A fault due not directly to a circuit
breaker or fuse, but instead due to the improper action of operating
or maintenance personnel.
QP (Quality Problem). Implies a fault which is neither inherent
in the design nor the result of normal (or abnormal) operation. It is
generally a manufacturing problem such as a poor weld, not providing
a locking device for a screw, or not tightening connecting bolts during
as sembly.
NS (Normal Service). In this category are put all those unsatis-
factory conditions which arise as a result of normal field operation
or for which insufficient information is available to assign it to any of
the other three categories.
Each UCR was further categorized according to one of the ten
failure modes listed below:
1. Corrosion
2. Improper Response
3. Short
4. Open
5. Connection poor, broken, loose, or burned

PRC R-1459E-9
Problem Classification
OP QP
5
3
1
1
135
75.4
5
2.9
1
1
3
7
1
18
10.3
DP
1
10
5
4
20
11.4
12
41
24
7
11
8
38
16
9
10
176
100
6.8
23.0
13.7
4.0
6.3
4.6
21.6
9.1
5.2
5.7
100
EXHIBIT 4 - CLASSIFICATION OF ALL FAILURES
NS
1
2
3
4
5
6
7
8
9
12
35
21
7
10
7
25
3
3
(U
(D
10
m
-4
rfz
1010
Z

PRC R-1459E-10
6. Inoperative
7. Unsatisfactory condition or operation
8. Construction problem
9. Wiring failure
10. Miscellaneous
Exhibit 5 is a tabulation of all failures at LC-39.
8. Field Failure Rates
Taking each of the number of permissible component times for
each subpopulation as representing one circuit breaker time-to-failure
(TTF), the mean TTF (MTTF) for each subpopulation may be found by
summing the individual TTFs within each subpopulation and dividing by
the number of permissible components for the corresponding subpopu-
lation. The field failure rate (FFR) is the reciprocal of the MTTF.
These values are tabulated in Exhibit 6.
Other than for the "miscellaneous" subpopulation, LC-39 had
the highest FFR. One very interesting point is that the inclusion of
installed time for UCRs after 15 October 1969, showed a marked in-
crease in the FFR for LC-39.
For the overall population the field failure rate data is as follows:
MTTF = 13,900 hours
FFR = 72 failures/million hours
If the UCRs after 15 October 1969 are not included, these numbers are
MTTF = 16,000 hours
FFR = 62 failures/million hours
9. FFR Confidence Intervals
From Exhibit 3 it can be seen that the assumption of exponentially
distributed times to failure is not unreasonable. Using this assumption
the lower and upper confidence limits (90 percent confidence interval)
on the FFR were obtained, see Exhibit 6.
10. Resolution of FFR Factors
From Exhibit 4, classifying the failures upon which the FFR is
based, it can be seen that about 76 percent of the failures are "normal"

PRC R-1459E-ll
Pro blem Classification
QP
3
5
3
16
1
1
1
1
1
6
1
13
12.5
DP
16
15.4
EXHIBIT 5 - CLASSIFICATION OF FAILURES FOR LC-39
NS OP
5
29
1
2
3
4
7 2
1
4
5
33
a)0
,-4
4.8
31.9
8.79
5
6
7
8
4
6
4
24
3.8
5.8
3.4
23.37
9
10
4 11
4
2
10.6
6 5.8
72
69.2
3
2.9
2
104
1.9
100
100

PRC R-1459E-12
U mm
.0 LO a, o r-
4 o Ca o CO ) cC C O N c
4-1CO L o- o o o oo 5 O 0 Co O 0 0 0 0 0o 0
m
C) -.
a4 0 0 Ll tO Un '0 0 N N
.0 m- N, t ,o to o
k C; o oC o Is oc o
O O O O O 0 O O
o o ~0; .4 O O O O O O O O e:
n 0 0 0 LO L0
rZ4
4-4
o . 0 0 0u X 9 O O O *
H cg N O ' cO O CO .0 EeOG· . _ - N _- - -4
.> 0 0 r
10 c 10 t_ '0 O N CO N h O
O CO to to Q 0
4u -
c N " N- eO C O__
V° .o 'l a 1 V
0C a' -~~~Z~C CO C) m
U Co 0~m~V V V~~~~~~h'~o I-~~~1 .~~ V Z iV~~~~~~~~~~~~~~~Q
U)
V
0
0
(¢
H
H
W-4E
I
,,

PRC R-1459E-13
service type problems. This is equivalent to a failure rate of 57
(rather than the 72 calculated in section 8) failures per million hours
for the entire circuit breaker population. The differences in this FFR
for the four populations studied are large enough to indicate a signifi-
cantly higher circuit breaker failure frequency at LC-39 that at LC-34
and LC-37. This may, however, simply indicate the more active status
of LC-39 relative to the two other complexes.
11. Repair Time
A sizable amount of datawas present with respect to repair time.
Exhibit 7 shows the cumulative distribution of repair times. The mean
repair time was 5.5 hours with 77 observations. The minimum repair
time was 0.02 hours. The maximum repair time was 120 hours. The
time to repair statistics for the various subpopulations is as follows:
Time to Repair
Population Minimum Mean Maximum No. of Observations
LC-39 0.02 2.3 8.0 37
LC-37 1.0 18 120 8
LC-34 0.58 2.1 8.0 8
OtherLocations 0.03 7.3 120 24
Composite 0. 02 5.5 120 77

PRC R-1459E-14
Ci2
'N .,-4
NN
'-4
MNO p
,¢
o
h H
O
o
V H
_-t~~ I
so.0 ;i
$l
II
I I I I I I I I I I I I I I I IO u% ~ U% O Lr) O u-~ ¢D u') O u% O u% O u% OO0 r-- t-- ..O ,.O Lr) u') ~~~o%~
¢q ,-~ ,-~
sazniT~~ jo zaqcunlxI
. . . E a
II
I
II
m
m
m
-
I
I
I
I
I
I
10
1
1
I
1
4

PRC R-1459F-
RELIABILITY ASSESSMENT
OF
COMPRESSORS
Date: 24 May 1972
Observed Field Failure Rate
In Failures Per Thousand Hours
Of Installed Component Time 0.117
Observed Failure Times, In Hours
Mean 8550
Minimum 12
Maximum 51,840
Number of Observations 38
Observed Repair Times, In Hours
Mean 47. 5
Minimum 1
Maximum 264
Number of Observations 21

PRC R-1459F-2
FAILURE MODES AND CAUSES CONTRIBUTING TO
THE OBSERVED FIELD FAILURE RATE
AS A PERCENT OF THE TOTAL
/ Failure Cause
Number of Relevant UCRs: 76 Currency:(1 ) 13 May 1971
(1)Date of latest UCR run included in the assessment.
/
Broken, Cracked Parts 17.5 1.3 - 18.8
Contamination, Corrosion 6.3 2.5 - - 8.8
Design Deficiency - 8.9 - - 8.9
Electrical Problem 5.1 - - - 5.1
a Inoperative, Poor Operation 12.7 - - - 12.7
o Leaking Compressor 6.3 - - 6.3
w Motor Problem 7.6 - 1.3 - 8.9
> Not to Specification - - 1.3 2.5 3.8
X Valve Problem 7.6 - 1.3 - 8.9
Worn Parts 12.7 - - - 12.7
Other 3.8 - - 1.3 5.1
Total 78.6 11.4 5.2 3.8 100.0
/

PRC R-1459F-3
DESIGN BACKGROUND DATA
1. Component Description
The component population consists of mechanical devices used
for increasing fluid pressure. Compressors are designated by major
item code 829 on all unsatisfactory condition reports (UCRs) written
prior to 15 October 1969, and by major code 151 on all UCRs written
after 15 October 1969.
2. Data. Base
Seventy-nine UCRs were obtained through the use of the 'major
item code" entry. There were 74 UCRs with major item code 829 and
5 UCRs with major item code 151. Three UCRs with major item code
829 had failures associated with electrical circuits such as video com-
pression circuits. These UCRs are not included in the data base.
Thus, the data base consists of 76 UCRs.
3. Engineering Analysis
Exhibit 1 presents the number of UCRs occurring per calendar
quarter for compressors. After the third quarter of 1969, there were
only two compressor failures with no reported failures after September
1970.
Forty-five percent of the UCRs occurred within launch complex
39. Launch complexes 34 and 37 each had 11 percent of the component
population. The remaining compressor failures occurred at seven
other locations.
Compressor failures occurred in 12 functional systems. The
functional systems are:
Compressed air 27.6%
HE 26.4%
Air ConditioningHeat Ventilating 21.1%
HP Gas 9.2%
Other functional systems 15.7%
There were five failures for part number 85-HES-10 and four
failures for part number 25275. Forty-four other part numbers had
only one or two failures.

PRC R-1459F-4
-4.
CY
- 4
N
mM a
LO
No
9r o %D U Itcn r N e-4 0
sIdfln jo .aquun,

PRC R-1459F-5
4. Component Populations
Only one component population was chosen for this reliability
assessment--that of compressors.
5. Component Time s
There were 38 entries for component times-to-failure (TTF).
Thirty-seven TTFs were for failures occurring prior to 15 October
1969. The remaining TTF was from a failure occurring in November
1970.
Exhibit 2 presents the cumulative distribution of times-to-failure
for all 38 compressor failures.
6. Component Failures
With the exception of one UCR, each UCR represent one failure.
One UCR reported the failure of four different compressors. Thus,
there are 79 compressor failures.
7. Failure Classifications
Each compressor failure was classified according to the cause
of the failure. The failure causes and the number of failures due to
each cause are:
Normal Service (63 failures)--failure occurred as a result of
normal field operation or for which there is insufficient
information available to assign the failure to any other
category.
SystemDesign (9 failures)--a failure in which the fault is inherent
in and can be corrected by design action; such as, insuf-
ficient space for maintenance personnel to service a
compressor.
Quality Problem (4 failures)--failure is a manufacturing problem;
such as, compressor motor burned out in less than manu-
facturer- specified operational time.
Operational Problem (3 failures)--a failure occurred as a result
of operation and maintenance personnel; such as, com-
pressor equipment not installed to specifications.

PRC R-1459F-6
O O Lon o LUO oMr, caN nN - -m
s aa n Jo aaqIuan
o
OUC)
oU
O
l4
ry0 H
0 r
o.
° t-,
O
V]
Ln o

PRC R-1459F-7
In addition, the mode of each failure was determined. These
modes and the quantity of failures involved are:
Broken, cracked parts (15 failures)--failure of compressor to '
operate due to broken or damaged parts.
Contamination, corrosion (7 failures)--parts of the compressor
were corroded or contaminated such that it affected com-
pressor performance.
Design deficiency (7 failure s)--the compressor design is lacking
in some feature preventing the unit from operating in the
desired manner. Y
Inoperative, poor operation (10 failures)--compressor inoperative
or operates poorly, information to further classify the mode
of failure is not available.
Leaking compressor (5 failures)--compressor is leaking.
Motor problem (7 failures)--compressor failed due to a motor,
includes burned out motor, motor windings open, etc.
Not to specification (3 failures)--compressor installation is not
to specifications.
Valve problem (7 failures)--compressor failed due to valve
problem.
Worn parts (10 failures)--compressor fails to operate due to worn
parts.
Other (4 failures)--all other categories.
8. Field Failure Rate
Using the data of section 5, the field failure rate is determined
by dividing the number of failures with time information (38) by the
sum of the times-to-failure. The field failure rate is 0.117 failures/
1,000 hours.
9. FFR Confidence Intervals
From Exhibit 2, it can be seen that the assumption of exponen-
tially distributed times-to-failure is not unreasonable. Using this as-
sumption, the 90 percent confidence interval is:
Upper limit 0.149 failures/1,000 hours
Lower limit 0.089 failures/1,000 hours

PRC R-1459F-8
10. Resolution of FFR Factors
The current field failure rate may be different from that computed
in Section 8 due to the fact that there is only one time-to-failure after
October, 1969. This fact and the observation of the few failures re-
ported after October, 1969, would seem to indicate that the field failure
rate at the present time should be lower.
11. Repair Time s
Twenty-one UCRs had repair time information. Exhibit 3 presents
the cumulative distribution of times-to-repair (TTR) for the compressor
population. The mean TTR is 47.5 hours. The minimum TTR is 1 hour.
The maximum TTR is 264 hours.

PRC R-1459F-9
LnC
N
NN0
0
m zN
LO
-o
LOnI
XUU H
- D
H
N g
0 L0 L0 0~~~o U~SanJ o qun o
salTnl'e,[ Do laqtunN

PRC R-1459G-1
RELIABILITY ASSESSMENT
OF
CONNECTORS
Date: 24 May 1972
Prior To After15 October 1969 15 October 1969
Observed Field Failure Rate
In Failures Per Thousand Hours
Of Installed Component Time 0. 134 1. 98
Observed Failure Times, In Hours
Mean 7, 460 505
Minimum 70 60
Maximum 26, 280 1, 395
Number of Observations 25 6
Observed Repair Times, In Hours
Mean 3.33
Minimum 0
Maximum 36
Number of Observations 100
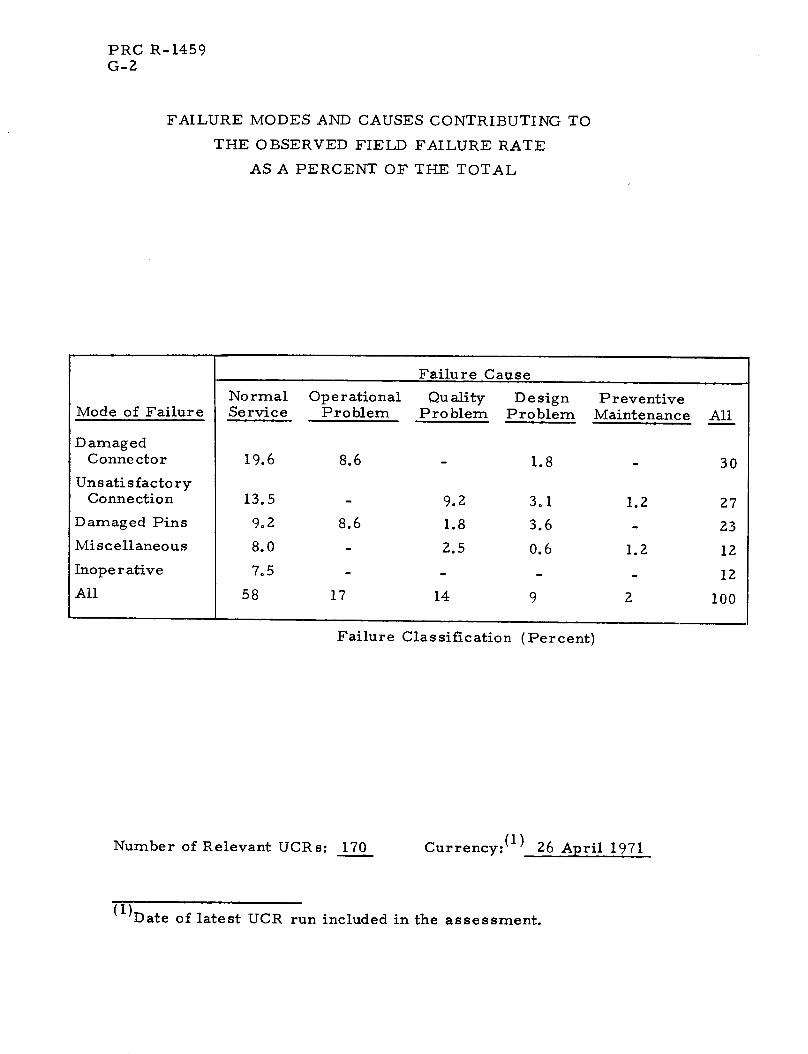
PRC R-1459G-2
FAILURE MODES AND CAUSES CONTRIBUTING TO
THE OBSERVED FIELD FAILURE RATE
AS A PERCENT OF THE TOTAL
I.
Mode of Failure
DamagedConne ctor
Unsati sfactoryConnection
Damaged Pins
Miscellaneous
Inoperative
All
Failure Cause
NormalService
19.6
13.5
9.2
8.0
7.5
58
OperationalProblem
8.6
8.6
17
Qu ality DesignProblem Problem
9.2
1.8
2.5
14
1.8
3.1
3.6
0.6
9
PreventiveMaintenance
1.2
1.2
2
Failure Classification (Percent)
Number of Relevant UCRs: 170 Currency:(1 ) 26 April 1971
(1)Date of latest UCR run included in the assessment.
All
30
27
23
12
12
100

PRC R-1459G-3
DESIGN BACKGROUND DATA
1. Component Description
The component under analysis here is more precisely described
as an electrical connector and includes all devices used to connect elec-
trical power or signals from one equipment to another. Solder joints
are excluded, as are mechanical connecting devices such as hose clamps,
pipe joints, etc. The devices included are, of course, restricted to those
used in KSC GSE.
Connectors are designated by major item code 423 for UCRs writ-
ten prior to 15 October 1969, and by major item code 156 for UCRs
written after 15 October 1969.
2. Data Base
The data base consists of 196 UCRs. Of these, 175 UCRs were
obtained by retrieving all UCRs with major item code 423 from the set
of UCRs written prior to 15 October 1969. The remaining 21 UCRs
were obtained by retrieving those UCRs written after 15 October 1969
with major item code 156.
From the first set of UCRs, 11 of the 175 UCRs concerned failures
of non-electrical connectors. Similarly in the second set, 15 of the 21
UCRs concerned failures of non-electrical connectors. These 26 UCRs
are not considered in this reliability analysis. Thus, there are 170 un-
satisfactory condition reports in the data base.
3. Engineering Analysis
Exhibit 1 presents the number of UCRs per calendar quarter.
From the exhibit it can be seen that connector failures occur in
bunches and that there is a significant drop in the number of con-
nector failures after the third quarter of 1969.
Most UCRs originate from launch complex 39 (over 60 percent).
Twenty-six functional systems are represented in the UCR data, but
60 percent of all UCRs come from the OIS-RF, Mobile Radio and Range
Instrumentation Systems.

PRC R-1459G-4
26-
24-
22
20 _
18 -w
16-D
o 14 -
10
8 -
6
4
Zr
1965
Calendar Quarter
EXHIBIT 1 - NUMBER OF UCRS PER CALENDAR QUARTER
nFq

PRC R-1459G-5
4. Component Populations
The engineering analysis indicates that there are no likely sub-
populations for which field failure rates (FFR' s) can be calculated'in
the general electrical connector population. Since there are only some
31 UCRs with time (or age) data, this is not surprising,
There is, however, one interesting division of the data for UCRs
written prior to 15 October 1969 which, but for the lack of component
time information in one segment, could form the basis for two subpop-
ulations. This division is basically between those UCRs which carry
the letters FEC under the "Reliab Use Only" data element and the letters
QJ2 under "Organization," and those which do not. There are 71 UCRs
in the latter category and hence 92 in the former. The first category
unfortunately has only one component time related entry in the entire 92
UCRs.
The category containing the smaller group of UCRs appears to be
representative of all connectors with the exception of three data elements.
In addition to the two mentioned above, the smaller group of UCRs does
not contain the letters DE or MJ in the Design Organization data ele-
ment; the larger group contains one or the other of these two sets of
letters and no others. The letters "FEC" represent the UCR originator
and QJ2 is a code for the Communications Systems Branch. The KSC
Design Centers represented by the code letters DE and MS are not de-
fined in the current code tables.
Thus, although two populations of electrical connectors can be
defined, it is not clear that they differ in any significant way, particu-
larly as regards their reliability. Unfortunately, FFR' s can only be
estimated for the more general of the two populations.
In the sequel, where it is necessary to distinguish between those
two populations, the more general will be designated population 1 and
the other population 2.
A third population exists in the six UCRs of the new data base
(i. e., UCRs written after 15 October 1969).

PRC R-1459G-6
5. Component Times
There were 27 UCRs with time entries for failures occurring prior
to 15 October 1969. Examination of the narrative portion of the UCRs
indicates that two of these entries do not represent times-to-failure.
The first of these (Age = 1 month) is indicated in the narrative section
of its UCR to represent receipt of a wrong part which could not be in-
stalled at all. The second (Age = 6 months) UCR is actually a plea for
the return of cannibalized parts. Exhibit 2 presents the cumulative dis-
tribution of connector times-to-failure for UCRs occurring prior to 15
October 1969. Exhibit 3 presents the cumulative distribution of the six
connector times-to-failure recorded after 15 October 1969.
6. Component Failures
Of the 31 UCRs with installation times, all are judged to represent
an unsatisfactory condition (or failure) attributable to a connector.
7. Failure Classifications
Classifying all 170 UCRs on the basis of the narrative description
of the unsatisfactory conditions and the coded data elements "failure,
repair disp., recommend, and reason" leads to the tabulation of Ex -
hibit 4. The coded headings of that exhibit for problem classification
are defined as follows:
DP (Design Problem). A fault which is inherent in, and can be
corrected by, the connector design.
OP (Operational Problem). UCRs in this category imply that the
unsatisfactory condition was caused or exacerbated by the misuse of
the connector on the part of the operating or maintenance (O&M)
personnel.
QP (Quality Problem). Implies a fault which is neither inherent
in the design nor the result of normal (or abnormal) operation. It is
generally a manufacturing problem such as a cold solder joint or im-
proper connector assembly.

PRC R-1459G-7
B L'zLI I
O
0HrOWU
0,
o
4 Z
O
0) U
Zo
L O
0
o>
N
C) o 0 Ln O(I N ( N -1i-
soanlTe.a Jo Jaqqunlq
O

PRC R-1459G-8
L n
t o
o '
O TU"
Lb N
b 0 [ L'Liu& . J L V 0LJU V
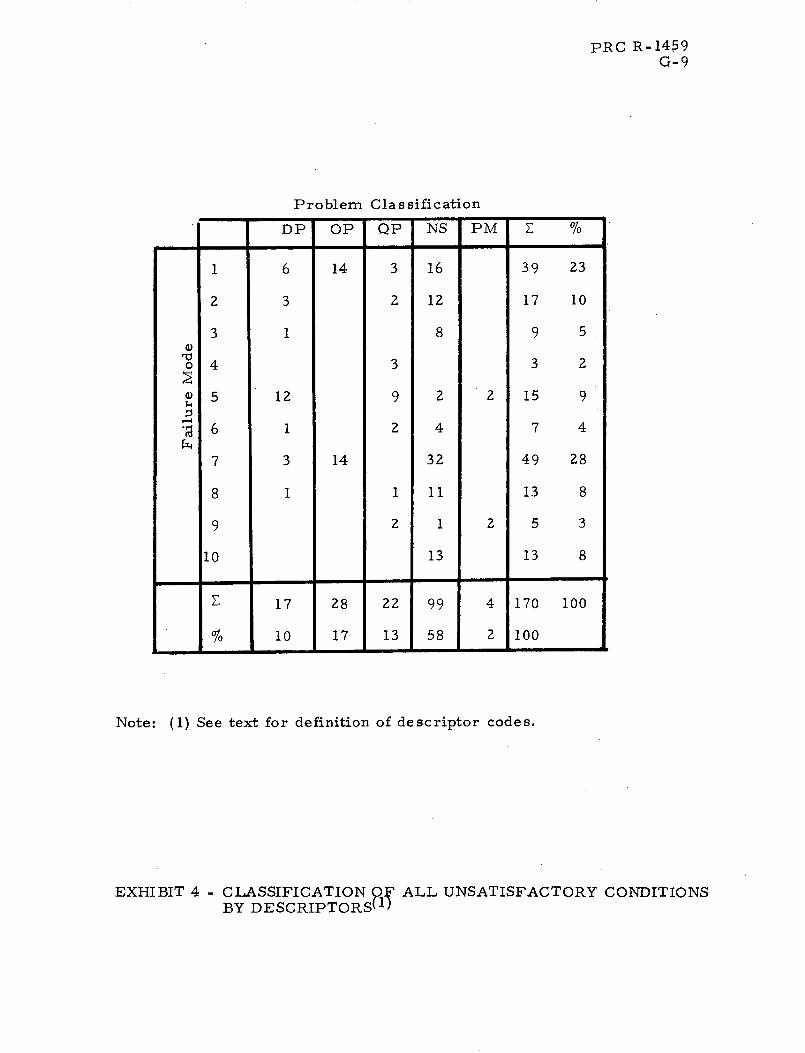
o0
a0)h
.,q
1
2
3
4
5
6
7
8
9
10
6
3
1
12
1
3
1
PRC R-1459G-9
Problem Classification
DP
QP~~~~~~~~~~~~~~~~~~~~~~~~PM
39 23
17 10
9 5
3 2
2
2
E 17 28 22 99 4 170 100
% 10 17 13 58 2 100- -~~~~ ..- - - - -
9
OP
14
14
3
2
3
9
2
1
2
16
12
8
2
4
32
11
1
13
15
7 4
49 28
13 8
5 3
13 8
Note: (1) See text for definition of descriptor codes.
EXHIBIT 4 - CLASSIFICATION O 1F ALL UNSATISFACTORY CONDITIONSBY DESCRIPTORS ( 1)
I
a .
DP QP NS

PRC R-1459G-10
NS (Normal Service). In this category are put all those unsatis-
factory conditions which arise as a result of normal field operation or
for which insufficient information is available to assign it to any of the
other three categories.
PM (Preventive Maintenance). A few UCRs detail conditions
which, although not currently unsatisfactory in any operational sense,
could become so in the future.
Each UCR was further categorized according to one of the 10 fail-
ure modes listed below:
(1) Connector pins damaged (broken, bent, smashed, mangled,
etc. ).
(2) Connection poor, broken, loose, intermittent, etc.
(3) Corrosion or contamination.
(4) Unsoldered or poorly soldered pins.
(5) Mating difficulty.
(6) Internal short or high conductivity.
(7) Broken case, dielectric or connector just damaged.
(8) Broken wire, lead or connector wire separation.
(9) Wrong or missing connectors or connector parts.
(10) Insufficient data to otherwise classify; inoperative, etc.
In addition, it was observed that 20 (or nearly 12 percent) of the
unsatisfactory conditions were associated with the Cape environment,
and 8 (about 4 percent) of the unsatisfactory conditions were the result
of higher level design problems--cables too short, for example, thus
putting an unnecessary stress on the connector.
Exhibit 5 is a similar tabulation for the two populations discussed
earlier (the third population is not tabulated due to the paucity of the
sample).
The differences in the two are reasonably clear. For example,
population 2 includes only one quality problem in 92 UCRs, whereas
nearly a third of the population 1 UCRs are so classified.
Exhibit 6 is yet another similar tabulation, this one restricted to
those UCRs for which time or age entries (component times) were pro-
vided. Comparison of this exhibit with the previous one indicates the
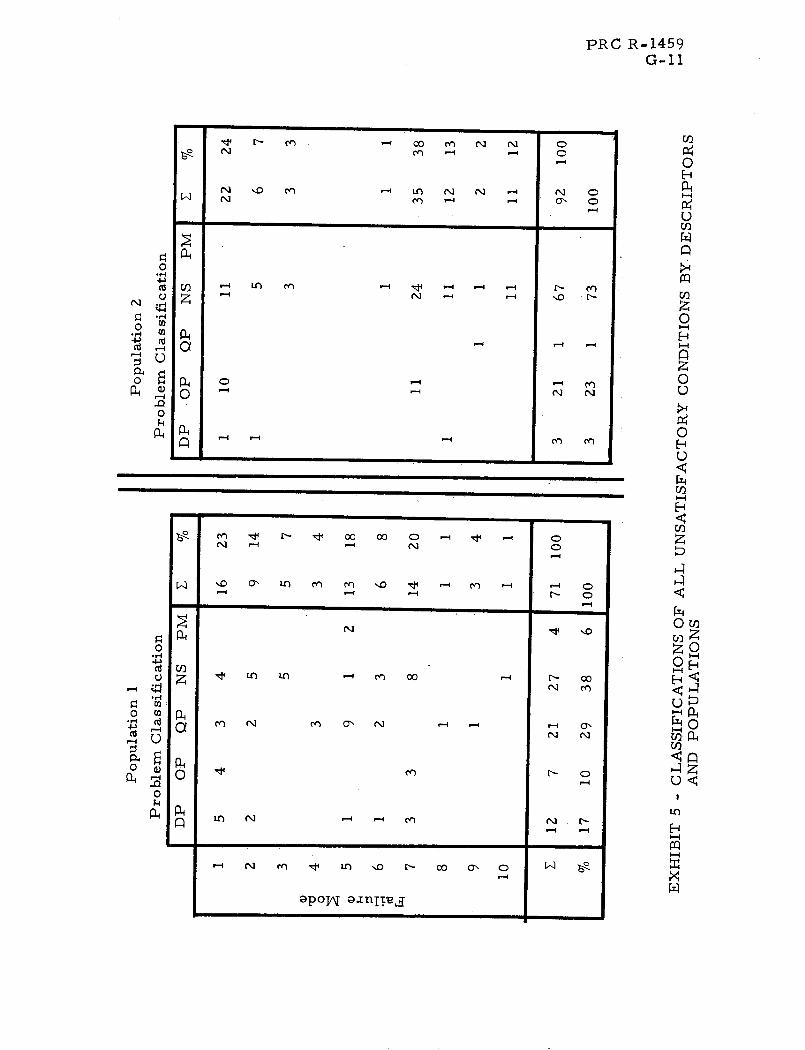
PRC R-1459G-11
,So N e - -i ii
N D I - L N N N OW N e _ O OCO
O CIO
P4.
P, , a _ _
0
o, _j N
O
h CY)i
O " ~~~~~ cu~ N
-. 4
- - - S
%9. ~ ~, -- dt oo o0 0 o d o
'I O', cO c O I ' -4 n
II
(NN N O
U ON L .0 -- 00
a ̂ > ^O -N N
OLO N -r-)
- oo o, o,--I
- N M t Ll s0
I3apoy[ ainlIt,
i
U)
O
U]
U)
0
00O
0
OE
ZO
U)
H
-4
o0
'.,j
0020 M
n 00

PRC R-1459G-12
Problem ClassificationI- r I
DP OP QP NS PM
9 27
4 12
3 9
1 3
4 12
4 12
3 9
1 3
3 9
1 3
6 4 5 15 3 33 100
% 18 12 15 46 9 100
EXHIBIT 6 - CLASSIFICATION OF UNSATISFACTORY CONDITIONSWITH COMPONENT TIMES
a)
oa)k
.H(di~q
3 3
1
1
1
1
3
1 3
1
1 2
1
1
2
2
2 1
2
il
1
2
3
4
5
6
7
8
9
10
0
I
1

PRC R-1459G-13
sample is quite representative of population 1 in all respects, but much
less so for population 2, as would be expected.
8. Field Failure Rates
'Taking each of the 31 permissible component times given in Ex-
hibits 2 and 3 as representing one connector time-to-failure (TTF), the
mean TTF (MTTF) may be found by adding the individual TTFs and di-
viding by the number of TTFs. The field failure rate (FFR) is the re-
ciprocal of the MTTF. These calculations are performed separately
for the 25 failures occurring prior to 15 October 1969, and for the six
failures occurring after 15 October 1969. The resultant FFRs are:
Time Period FFR
Prior to 15 October 1969 0.134 failures/1,000 hours
After 15 October 1969 1.98 failures/1,000 hours
9. FFR Confidence Intervals
From Exhibits 2 and 3 it can be seen that the assumption of ex-
ponentially distributed times-to-failure is not unreasonable. Using
this assumption, the 90 percent confidence intervals on FFR are:
(Failure s/1,000 Hours)
Time Period Upper Limit Mean Lower Limit
Prior to 15 October 1969 0.181 0.134 0.093
After 15 October 1969 3.46 1.98 0.86
10. Resolution of FFR Factors
From Exhibit 6, a classification of the failures upon which the FFR
is based, it can be seen that only 40 to 50 percent of the failures are
"normal" service type problems. As much as 1/4 of this failure rate
may in fact be due to the weather conditions inherent at the Cape.
The high failure rate for failures occurring after 15 October 1969,
as compared with failures prior to 15 October 1969, may be partly due
to the small quantity of failure data. Relevant connector failures may
be included under other major item code classifications. These fail-
ures may also have a longer MTTF. No other reason is evident.

PRC R-1459G- 14
11. Repair Time
An unusual amount of data is present with respect to repair time
for UCRs written prior to 15 October 1969. Exhibit 7 is a graphical
presentation of total time to repair. From this graph the assumption
of a log-normal distribution for the total down time parameter seems
reasonable. Also, at least for connectors, the basic data indicate that
repair time is much longer than "time to locate" (by a factor of 4 to 5).
A median total down time of two hours is indicated. The mean down
time is 3-1/3 hours.
There were no repair times for the UCRs with failures occurring
after 15 October 1969.

PRC R-1459G-15
Cooo X
z
0O
O
O
H
oo U
O
0
OzO
E a
m
rX
l >~~~~~~> O >~~~~~
0o.-4
(:uoaoa- ) Adouanbat a. AelOa

PRC R-1459H-1
RELIABILITY ASSESSMENT
OF
HOLDDOWN ARM SYSTEM
Date: 24 May 1972
Observed Field Failure Rate Launch Complex 34
In Failures Per Thousand Hours Launch Complex 37
Of Installed Component Time Launch Complex 39
Observed Failure Times, In Hours
Mean
Minimum
Maximum
Number of Observations
0. 173
0.416
0. 348
2, 644
0
18,344
31
Observed Repair Times, In Hours (Launch Complexes 34 and 37 only)
Mean 22.3
Minimum 1
100Maximum
Number of Observations
Number of Relevant UCRs: 34 Currency:() 13 May 1971
( 1Date of latest UCR run included in the assessment.
7

PRC R-1459H-2
DESIGN BACKGROUND DATA
1. Component Description
Holddown Arms (HDA) are located at Launch Complex 34, 37, and
39, The HDA are operated by a pneumatic system which is activated at
LC-39 by helium at a pressure of 1,500 psig, and at LC-34 and 37, by
helium at a pressure of 750 psig. Pneumatic separators (ball-lock mech-
anism) terminate the restraining action of the arm linkage mechanism.
At a specified point in the countdown, the HDA system is pressurized
with helium which causes activation of a pressure switch located on the
Control Release Panel. The pressure switch closes the arming ignition
circuit activating the engines. Following engine ignition, load reversal
on the HDA assembly is effected due to engine thrust. The arms restrain
the vehicle until full thrust of all five F-1 engines is obtained, at which
point a release command is generated to actuate the solenoid valves.
This permits the helium to energize the pneumatic separators releasing
the ball-lock mechanisms. The arm linkage is then free to retract and
release the vehicle for flight.
There are four HDA's at LC-34 and LC-37 and four HDA's on each
Mobile Launcher at LC-39. The four arm assemblies are activated from
a single pneumatic helium pressure system, with a Control Release
Panel, at all three launch complexes.
2. Data Base
Thirty-six UCRs form the primary data base for evaluation of the
HDA system. Data bank retrieval was made on functional system 17
for UCRs written prior to 15 October 1969, and on functional system
0400 for UCRs written after 15 October 1969. One UCR, written against
an improperly installed pipe anchor in the industrial area was eliminated
from the data base as irrelevant to the HDA reliability. UCRs KSC-084608
and KSC-091261 are identical in all respects and appear to be a report
of the same unsatisfactory condition. As a consequence, KSC-091261
was eliminated from the data base.

PRC R-1459H-3
3. Engineering Analysis
Exhibit 1 presents the number of UCRs occurring per calendar
quarter.
In general, the UCRs are reasonably complete although written
against major items; that is, at a lower level than the HDA system.
Thus, it was necessary to deduce the impact of the unsatisfactory con-
dition on the HDA system.
4. Component Populations
Although the total data base for the Holddown Arm systems is quite
small, it is possible to separately consider the individual Holddown Arm
systems. As a consequence, a categorization of UCRs can be made by
launch complex, and Field Failure Rates (FFRs) determined for each
HDA system. The categorization results in 20 UCRs applicable to LC-39,
seven UCRs applicable to LC-37, and seven UCRs applicable to LC-34.
Each of the populations includes all the Holddown Arms and the associated
control and pressurization systems.
5. Component Time
Time or age entries on the UCRs were not utilized, since those
entries are in reference to a constituent component age rather than the
HDA system operational time. Time of failure occurrence is given in
Exhibit 2 and times between failures in Exhibit 3.
6. Component Failures
Although 36 UCRs were evaluated, only 34 represent an unsatis-
factory condition, and hence a failure, within the Holddown Arm systems.
Each UCR is regarded as representing one unsatisfactory condition within
a Holddown Arm system. These unsatisfactory conditions, or failures,
are summarized by launch complex for each HDA system and presented
in Exhibit 2, along with the part identification and date of occurrence.
Exhibit 3 is a tabulation by launch complex of occurrence dates and days
between occurrence by launch complex.

PRC R-1459H-4
I me, N -4 O
sI)Fn Jo aoqulnN
-4
-O_
-
_ ON -4
,-
a
CO
z
0
z
m
I
1-4
o) '.
CY ON- 4 4
N U_
,- -4
_ ON
-4 No,
.-I
LO
-,
I I I
II
]
0
m 0
. 0
m 0
w .
a
m
0
P
0
4
a .
. 0

PRC R-14'59H-5
EXHIBIT 2 - SUMMARY OF RELEVANT HOLDDOWN ARM SYSTEMFAILURES
Lanllch N inu be r_)_;te Conmplex VI ehicle Co-nponent Rejected Failure Description
I li rI s, As
liarne.s Asse-bly
I'm 1(11 ilati Separator
,'ai ul ; r Link
Flex I1 -se Asse mbly
tldldo-rin IRelcase Sitc:h
III)A Release limit Switch
Flat [liead Screw
Support Assembly
Prcessure Switch
Se parl t;rl
Cylinder Iprimary)
Cylinder (secondary)
C(:nter link
Lower Linkage
I lyd raulic PneumaticAssenmbly
llpp,:r Link Pail
Striker Plate
Lower I~inkage
llolddown Arm Basi
Valve PositionPotentiomete r
Casting
Pneumatic Separator
Dust Cap
Cable Assembly
Holddown Arm No. 3
Plunger Block
Pressure Switch
Pneumatic Cylinder
Hand Valve
Actuator
Pressure Switch
1
1
I
1
I1
1I
6
6
1
1
3
4
1
1
3
1
1
4
1
1
g
1
I
1
1
2
Coiuld not be fully opened or closed becauseof burrs on threads
Broke due to Tnatcrial defect
Cable Colnne t,,lr pins hent
Internal failulre due to improper assembly
HIole for separatoer pin is nl..t perspecifications (unldersizel
Th read dlanag.rd after hyd r, static test
Cr-ntacts of cal h' assean lIly switch stick
Switch operates intermittently
Screws sheared
Cracked xweld due ti. s01isaliglmlent of lugs
Phlug pin connrlctorr besit during connection
Separator ball locks, Jr piston risorstoo large
Internal leakage in excess of specifications
Internal leakage in ex:cess of specifications
Manufacturing error didn't adhere to specsand damaged in transit
Broken screw (failed)
PI''tting boots loose on connectors
Three roots sheared under loaded weightof vehicle
Bolts sheared--fatigue for retraction tests
Impact on lower linkage due to poor design
Cracks in HDA base (failed)
Cracked
Extensive laminations in radius at baserange design; poor design
Hlolddown arms not released inspecified time
Plating on dust cap flaking
Locking ring on connection failed to holdcorrectly
HDA cracked
Numerous cracks
Pressure switches activated
Leaking in excess of specifications
Valve leaking across seat
Actuator bolts bent
Failed to give deactivation indication
a I_
2 /Z8 /(65
I I. /6,I.
I/?-/' !',6
/1,'/(,(1
I / I I 6I7
'1/146/67
t/2 /6'(,
12/10/672/1-/67
4/ 14 /L7
1/1 1/67
6/05/67
10/1I/67
10 / 18 / 67
101/ZO67
1/22/68
1/31/68
2/10/69
8/28/69
3/13/70
4/9/70
4/11/70
5/4/70
5/7/70
10/22/70
12/1/70
1/12/71
3/4 / 71
1.(. - 34
LC-34LC-39
1.(:-34I1C-34I,( -391,C-39)
1,(C-34
LC-34
1.C-37
MIL-I
ML-I
LC:-37
MCr-17
LC-37
LC-34
L.C -3)
ML-3
ML-3
LC-34
ML-Z
ML-2
ML-2
ML-2
ML-3
SA 2011
SA 201
None
None
None
00 F'
SA 203
SA 202
AS 501
AS 5(!1
AS 204
AS 204
AS 501
AS 501
204 1.M
2041,M
AS 501
AS 501
AS 501
204 LM
None
AS 508
AS 508
AS 508
AS 509
GSE
AS 509
GSE
GSE
GSE
GSE
7
I
I

PRC R-1459H-6
', oO o Nr s o a: N 00 m N ,o t
-g .- N- '
\%O \0 .0 .0 N 0,O ,.o -,o .O t o 'oo . .o ,.o D .. t-N '0 '.0 a' - O -NN N ,. t -- -
,- - - -- N 4 u-I -4t- -I -q N
a 00 o' M -4
t-- q'- ,: 0 O0 O0
CN .0 CO COO
a' -4 -I - N N m
'0 4 t _ I- ---
-,O"t 't .- - - -
I L(' O r O O ,0 0- L U O N N - N ,. 0 O N -4,I 'a - .c'N a' N N 'o t t f
1-4-( ct " I ' '-4
.:0 .0 N O'IO 'IO .D0 . '0 C NO NO '.0 '.0 C'O 0 oO -q.0 .0) .O , O . .O N - -. r N 0 -O - -
~ ~ -4 - -. -- o 00 O C - - N - N - r'0 N N ' N N t :- 4 CO C- I -- 4 N - N --N -4- -4 _ -I -4 In L - N -4 ON -4 N- r- - d- - o 0 . 0 0 -- -- - -- 0 N - -
,- en) c t -4 N N .O0 -4 1- CO n - tf '-'-4 -4 -m)
4
cQhq
0) hoA 0
rn U
CI
a)U
UQ
0 4t
k ~hj Q
Qu
0
c zDa) U
N N9~4)
o) h
M Q
r0
QC
h4 %QU
oO
Q4)0
uz k
00Cuu>1
>sQO
U
4U
oO
{-I
u-
U
0
0
O
Ez-
0
UO
W
¢N
i
i
I
I
v
II
II-

PRC R-1459H-7
7. Failure Classification
Classification of failures beyond that provided by Exhibit 2 is be-
lieved to not be particularly instructive, hence none is undertaken. The
UCR does contain a more detailed failure classification than that provided
in Exhibit 2; however, the data relates to the component within the Hold-
down Arm system. There are no predominate failure modes of the major
items. Most of the failures appear to be normal service type problems
rather than being due to faulty HDA design, operation or quality control.
8. Field Failure Rates
For all three launch complexes the mean-time-between-failures
(MTBF) is derived as the mean of the individual times between failure.
The results of these MTBF calculations for the three launch com-
plexes are:
LC-39: 119 days
LC-37: 100 days
LC-34: 241 days
The reciprocals of the MTBF's are presented in units of failures/
1,000 hours. This represents the FFR. The field failure rates were
found to be:
LC-39: 0.348 failures/l,000 hours
LC-37: 0.416 failures/l, 000 hours
LC-34: 0.173 failures/l,000 hours
9. Confidence Factors
In the determination of the confidence factors the time between
consecutive failures for the Holddown Arm system is assumed to be
exponentially distributed. The following 90-percent confidence inter-
vals were then obtained for the areas indicated:
LC-39 LC-37 LC-34
(Failures/l,000 Hours)
Upper Confidence Limit 0.500 0.822 0.303
Lower Confidence Limit 0.229 0.228 0.076

PRC R-1459H-8
10. Resolution of FFR Factors
Some consideration should be given to the possibility that HDA
failures are being classified under a functional system other than the
HDA, such as the Pneumatic System. Under these circumstances, a
UCR run on the HDA functional system would not pick up all UCRs.
They could all be detected only if a run was made on all the possible
functional systems or hardware classifications within the HDA system.
Then an identification of the parts within that run would have to be made.
This is further complicated by the fact that it was found that HDA part
numbers contained on the UCRs are often times in disagreement with
the part numbers contained on the engineering drawings. This ultimately
leads to the conclusion that unless all HDA component failures are clas-
sified as belonging to the HDA functional system, it may be impossible
to identify all HDA system failures.
11. Repair Time
Some UCRs contained data on repair time. These data are sum-
marized on the cover page of this RAC. However, since UCRs were
written againstmajor items, the time indicated is the repair time for
the components and not the Holddown Arm system. However, it is
reasonable to assume that upon completicn of the component repair,
the HDA would again be operational.

PRC R-1459I-1
RELIABILITY ASSESSMENT
OF
PRESSURE SWITCHES
Date: 24 May 1972
Observed Field Failure Rate
In Failures Per Thousand Hours
Of Installed Component Time 0. 10
Observed Failure Times, In Hours
Mean 9, 150
Minimum 0
Maximum 43, 800
Number of Observations 50
Observed Repair Times, In Hours
Mean 6. 72
Minimum 0. 33
Maximum 50
Number of Observations 26
' v. ! _

PRC R-1459I-2
FAILURE MODES AND CAUSES CONTRIBUTING TO
THE OBSERVED FIELD FAILURE RATE
AS A PERCENT OF THE TOTAL
Out of Tolerance
-4 Won't Deactivate
Fails to Operateo
Id EErratic/Intermittento
Other /Unknown
All
Number of Relevant UCRs: 120
Proximate Cause of Failure
NormalService O&M Quality Design All
11.9 0 4.6 18.1 34.6
9.9 0 0 3.6 13.5
8.2 0 4.1 0.5 12.8
6.7 0 2.6 0 9.3
3.6 2.1 4.6 19.5 29.8
40.3 2.1 15.9 41.7 100.0
Problem Classification (Percent)
Currency: (1 ) 16 June 1969
( 1)Date of latest UCR run included in the assessment.

PRC R-1459I-3
DESIGN BACKGROUND DATA
1. Component Description
The pressure switches analyzed herein are a very common and
somewhat troublesome item in the KSC ground support equipment; they
are generally found in the "fluid" functional systems, e. g., N 2 , 0 2 , H 2 ,
hydraulic and pneumatic. Their function is to activate or deactivate a
particular function dependent upon existing pressures. Their construc-
tion is often quite complex and their operating conditions far from ideal.
2. Data Base
By drawing upon the "major item" entry, 122 UCR's were retrieved
from the UCR Data Bank as those associated with major item code 682,
pressure switches. Two of these were discarded from all the subsequent
analyses, one because it reported a knife switch failure, and one because
it duplicated another UCR that was included. Of the remaining 120 UCR's,
6 are readily singled out as initial inspection failures on 6 different items
of the same serial number; on each of these reports the failure-rate data
is essentially the same. Consequently, in calculating failure-rate data,
these 6 reports have been treated as contributing to a single entry.
3. Engineering Analysis
Exhibit 1 is a tabulation of the data elements appearing on the UCR's.
For example, of the 120 UCR's analyzed, 111 carry an entry for part
number, 79 carry an entry for serial number, and 120 give an occurrence
date. Of the 111 reports with a part number entry, however; only 75
give an entry of the type 75M¥*>'*; 24 different such part numbers are
represented. The largest number of reports associated with any one part
number is ten, and only four part numbers have more than six associated
UCR's. The insufficiency of serial number, replacement part number,
and replacement serial number data elements precludes a failure analy-
sis by part number.
The following graph plots the occurrence dates of the 120 UCR's
with the launch dates of fifteen Apollo spacecraft indicated for reference.
There seems to be no strong correlation between these launch dates and

PRC R-1459I-4
EXHIBIT 1 - NUMBER OF DATA ELEMENTS OCCURRING IN 120PRESSURE SWITCH UCR'S
Part Number
Serial Number
Occurrence Data
Vehicle
Non-ApplicablePart Number
Non-ApplicableSerial Number
Time
Age
Cycle
Closure Code
QuantityRejected
Approval Date
Launch Complex
ReferenceRepresentativeNumber
ReplacementSerial Number
Time to Locate
Time to Repair
Total Down Time
Compressed AirCode--Date
Reliability UseOnly
111 Part Name
79 Manufacturer
120 Program
98 Stage
Func tional103 System
Non-Applicable39 Name
7 Operation
49 Organization
6 Criticality
76 DesignOrganization
120 Design FindNumber
120Replacement
120 Part Number
ReplacementManufacturer
60Non-ApplicableDesign Failure
31 Numbe r
33 Non-ApplicableManufacturer
39Replacement
31 Part Name
Replacement98 Find Number
Disposition120
120 Failure Analysis
114 Failure
120 RepairDisposition
120Recommendation
117 Reason
Narrative116
120
120
114
119
100
57
56
43
98
80
51
120
120
120
120
120
120
120

PRC R-1459I-5
15
4-4
V 10
z 5
LaunchesYear
the failure occurrence date. This observation is supported by Exhibit 2
which gives the distribution of UCR's by occurrence date and vehicle.
This chart shows the span of months in which failures have occurred
for each vehicle and the distribution of the 12.5%0oof UCR's indicating
"NONE" as the entry in the vehicle data category.
A total of 194 pressure switches were rejected by the 120 UCR's
with 99 UCR's (83%) rejecting only one switch. The distribution of rejec-
tions is given in the following table.
Quantity Rejected 1 2 3 4 5
Total
20 22 194
Number of UCR's 99 11 2 5 1 1 1 120
All 120 UCR's bear an entry in "Launch Complex;" 62 percent of
them refer to L. C. 39. Of this 62 percent, however, 24 percent are
assigned to Mobile Launcher 1, 2, or 3, and 9 percent are assigned to
Pad A specifically; the remaining 29 percent are otherwise assigned.
The complete distribution is given in the following table.
ILl 7-

PRC R-1459I-6
-I
IF.-
UItI | | -O
El=S ~~3 Ii. m
. N ol
i I 'a
FI71r II II-
i I-- I N
u II
·-I i
4)I IL__lu~~~t -Cd N OI
I , I
C.-. I I l- - -
~l I I- m
m- I I I
C I t
-- I I 0
o0
I 'a
LINri- - O
[~I ,~~~~~- - ,.-'a
L.J a'~~~~~~~~~~~~~~:~
)' N N 'a )1) - n a' - a' In -l In ln 0H
.. I-I(1Dr _ I >_0_111_ UlU
O _ _ _N ,9_
O 0 N 0 0
0 N r.' r N N 9 N o ) In in In In C a< ~ e I I ¢ ' V) < V) U) n oo oUr Z,) v) u) m m un '< ¢ < : ¢ ¢ Z Z 0 F
Erq
-I
O
0H
H
Io
vl
pE
Ou
N
i,-.
i,-,
i

PRC R-1459I-7
No. of QuantityLaunch Complex Entry UCR's Rejected
L.C. 39 35 97
L. C. 39, PadA 11 13
M.L. 1 8 8
M.L. 2 17 18
M.L. 3 4 7
Subtotal 75 143
L.C. 34 25 29
L.C. 37 16 16
M.S.O. Bldg. 2 4
Industrial Area 1 1
Launch Complex 1 1
Total 120 194
By percentages, then, 62 percent of the UCR's refer to L. C. 39,
21 percent to L. C. 34, and 16 percent to L. C. 37. With respect to the
number of switches rejected, 74 percent refer to L. C. 39, 15 percent
to L. C. 34, and 8 percent to L. C. 37.
The 120 UCR's distribute over 21 "Functional System" entries
with the majority represented as follows: N2 , 22 percent; 02, 15 per-
cent; hydraulic, 12 percent. A complete tabulation is given in the fol-
lowing table; the quantity of pressure switches rejected is also indicated.
'The five "Miscellaneous" data elements are High Pressure Gas, Com-
pressed Air, Launch Mast, Water and Sewage, and Hold Down Arms,
each representing one UCR and one rejected switch.

PRC R-1459I-8
No. of No. SwitchesFunctional System UCR' s Rejected
N 2 26 50
02 18 45Hydraulic 14 16
Pneumatic 11 12
Environmental Control 11 11
H 2 9 13Umbilical Swing Arms 8 11
Industrial Water (Fire X) 4 4
Special Test Equipment 2 3
Electrical Networks 2 2
Water Quench 2 2
Air Cond/Heat Vent 2 2
Primary Power 1 5
Propellant Sensing 1 4
Altitude Chamber 1 2
Misc ellaneous 5 5
Unassigned 3 7
Total 120 194

PRC R-1459I-9
The same type of table is presented below for criticality codes.
It is interesting that the criticality category with the greatest number
of UCRs does not show a proportional increase in the tabulation of the
quantity of switches rejected; these additional switches are instead
distributed among the more severe criticality classes, or are of un-
known criticality.
No. of No. SwitchesCriticality UCR's Rejected
Loss of Vehicle or Life 3 5
CD Scrub/Personnel Injury 4 30
Launch Hold/No Injury 11 20
Data Loss - No CD/L Effect 57 69
No Priority 39 40
Unknown 6 30
Total 120 194
4. Component Populations
Based on the number and diversity of pressure switch unsatisfactory
conditions, it is clear that no statistically relevant definition of pressure
switch subpopulations or categorizations is particularly meaningful for
purposes of field failure rate calculation; hence, none are defined. This
implies, of course, that the reliability numerics derived subsequently
are equally applicable (or non-applicable) to all pressure switches.
5. Component Times
Quite notable from Exhibit 1 is the general lack of time related
data on the UCR's. Furthermore, all six of the "Cycle" entries and six
of the seven "Time" entries rise from the six initial inspection failures
mentioned earlier, and therefore make little contribution to the failure
rate computations. The "Time/Age/Cycle" information is the time-to-
failure data used in computing field failure rates, and Exhibit 3 is a plot
of this information. The six initial inspection failures were counted
individually and contribute to the steep initial slope of the graph. The

PRC R-1459I-10
o
C i
,en !
Cl
o Z
o .
c)I
I I I I I I In I It o ,~
sa.an!TTI Jo laqum.N
cif

PRC R-1459I-11l
abrupt increase in failures at twenty-four months evidences the 26 per-
cent of the UCR's which gave this figure as the age of the associated
pressure switches at the time of failure. Below is a tabulation of these
"Time" and "Age" entries with the associated quantity of rejected pres-
sure switches indicated. The dotted lines indicate the six initial inspec-
tion failures.
Age No. Age No. Age No. Age No. Age No.(mos.) Rej. (mos.) Rej. (mos) Rej. (mos.) Rej. (mos.) Rej.
0 1 2 1 6 1 24 1 24 1
0 1 2 1 6 2 24 1 24 1
0 1 2 2 7 1 24 1 24 1
0 1 4 4 7 1 24 1 30 1
0 1 4.8 1 8 1 24 1 30 1
0 1 5 1 9 1 24 1 36 1
0 1 6 1 12 1 24 1 36 1
1 1 6 1 12 4 24 1 48 1
1 4 6 1 13 1 24 1 60 1
1 5 6 1 13 1 24 1 60 1
6. Component Failures
All 50 UCR's, tabulated above, are judged to represent at least
one failure. Each UCR may, however, represent as many failures as
there are number of switches rejected, also given in the above tabulation.
The UCR's themselves, and particularly the narrative portions
thereof, could be used to support either assumption. Hence, both assump-
tions will be carried separately throughout the classification of failures
and the calculation of the field failure rate. That is, it will be assumed
that there are either 50 failures or 65 failures.
7. Failure Classification
An analysis of the narrative section of the 120 UCR's leads to a
classification of the failures by failure mode and failure type. Results
PRC R-1459I-12
are shown in Exhibit 4. Those headings used for failure type are:
Design: A fault inherent in, and correctable by, a change in
pressure switch or system design.
Quality: A fault neither the result of design nor operation per se.
It is generally a manufacturing problem or a fabrication problem.
Operation: A fault due not directly to a pressure switch, but instead
due-to the improper action of operating or maintenance personnel.
Normal Service: A fault or condition arising in normal field oper-
ation, such as normal wear-out, or those conditions for which available
information is inadequate to assign the problem to a failure type listed
above.
Two sets of headings have been used, reflecting an operating mode
and a condition mode. These sets of headings are tabulated below.
Operating Mode: Out of Tolerance
Won't Deactivate
Fails to Operate
Erratic/Intermittent
Other / Unknown
Condition Mode: Corroded
Cracked/Leaking/Broken
Wrong Switch for Requirements
Switch Wrongly Assembled for Operation
Normal Wear
Switch Installed Wrong but Undamaged
Other/Unknown
Several comments must be made regarding the condition mode
classifications. Since these headings are intended to completely parti-
tion the 120 UCR's (194 failed switches), the most fundamental failure
mode has been used rather than secondary modes. For example,
switches corroded due to fluid entering the switch because it was broken
in installation has been classified only as "Cracked/Leaking/Broken."
The two entries appearing in this row and in the column "Operational"

PRC R-1459I-13
EXHIBIT 4 - CLASSIFICATION OF PRESSURE SWITCH FAILURES BYFAILURE iYPE AND FAILURE MODE FOR TWO MODALCLASSES( 1-
Number of UCR's Number of Rejected SWS
Normal NormalOperating Mode Design Quality Operation Service Total Design Quality Operation Service Total
Out of Total # 8 8 0 17-2/3 33-2 /335 9 0 23 67
% 6.7 6.7 -- 14.7 28.0 18.0 4.6 -- 11.9 34.6
Won't Deactivate # 3 0 0 18 21 7 0 0 19 26
% 2.5 -- - 15.0 17.6 3.6 -- -- 9.8 13.5
Fails to Operate # 1 4-1/3 0 15 20-]/3 1 8 0 16 25
% 0.8 3.6 -- 12.5 16.9 0.5 4.1 -- 8.2 12.8
Erratic/Intermittent # 0 5 0 12 17 0 5 0 13 18
% -- 4.2 -- 10.0 14.2 -- 2.6 -- 6.7 9.3
Other/Unknown # 10 8 3 7 28 38 9 4 7 58
% 8.3 6.7 2.5 5.8 23.3 19.6 4.6 2.1 3.6 29.8
Total # 22 25-1/3 3 69-2/3 120 81 31 4 78 194
% 18.3 21.1 2.5 58.1 100 41.8 16.0 2.1 40.2 100
Condition Mode
Corroded # 6 3 0 9 18 9 6 0 9 24
% 5.0 2.5 -- 7.5 15.0 4.6 3.1 -- 4.6 12.4
Cracked/Broken # 3 5 2 8 18 24 6 2 8 40
% 2.5 4.2 1.7 6.7 15.0 12.4 3.1 1.0 4.1 20.6
Wrong Switch for # 8 1 0 0 9 39 2 0 0 41
Requirement go% 6.7 0.8 -- -- 7.5 20.1 1.0 -- -- 21.1
Switch Assembly # 1 7-1/3 0 0 8-1/3 2 8 0 0 10
Wrong T% 0.8 6.1 -- _ 6.9 1.0 4.1 -- - 5.2
Normal Wear # 0 0 0 2 2 0 0 0 2 2
% -- -- 1.7 1.7 -- -- -- 1.0 1.0
Installed Wrong # 0 0 1 0 1 0, 0 2 0 2
% -- -- _ 0.8 -- 0.8 -- -- 1.0 -- 1.0
Other/Unknown # 4 9 0 50-2/3 63-2/3 7 0 59 75
% 3.3 7.5 -- 42.2 53.. 3.6 4.6 -- 30.4 38.7
Total i 22 25-1/3 3 69-2/3 120 81 31 4 78 194
% 18.3 21.1 2.5 58.1 100 41.8 16.0 2.1 40.2 100
Note: (1) Percentages do not necessarily add, due to rounding error.

PRC R-1459I-14
in the matrix of Exhibit 4 are of this type. As expected, most entries
in the mode "Wrong Switch for Requirements" are design problems, and
most entries in the mode "Switch Wrongly Assembled for Operation"
are quality or manufacturing problems. There are only two exceptions,
one in each case. First, one UCR reported that two switches were pro-
cured wrongly (that is, not to design specifications) and so were classi-
fied as a quality problem; second, one UCR reported that two switches
were wired into the system wrongly, as the design indicated, and so
were classified as a design problem. All other entries are straight-
forward. It is to be noted that in those matrices presented in terms of
the number of UCR's (as opposed to the number of switches rejected),
fractions can appear; this is simply because one UCR may refer to
several failed switches whose failure modes differ.
8. Field Failure Rates
The following table summarizes the ages-before-failure (in months)
assuming that all 65 rejected pressure switches from the 50 UCR's that
carried "Time" and "Age" entries are failures. Six of the items with age
zero months are the six initial inspection failures discussed in the
Engineering Analysis section.
Age in No. of failed ProductMonths = A Switches = N = A x N
0 7 01 10 102 4 84 4 164.8 1 4.85 1 56 7 427 2 148 1 89 1 9
12 5 6013 2 2624 13 31230 2 6036 2 7248 1 4860 2 120
Total 65 814.8failures months

PRC R- 1459I115
Dividing 814.8 by 65 gives the mean time to failure (in months).
The field failure rate (failures per month) is, then, the reciprocal of
the mean time to failure,
Mean time to failure (MTTF): 12.5 months/failure
Field failure rate (FFR): 0.08 failures/month.
Converting to hours, using the rate of 730 hours/month, gives the
following results.
MTTF: 9,150 hours/failure
FFR: 0.109 failures/1000 hours.
If each UCR is assumed to represent only one failure, the same
sort of calculations will give the mean time between UCR. In this case,
the total of the age-to-failures given on the 50 UCR's is 751.8 months.
Dividing by 50 gives an average of 15.0 months/UCR or, taking the
reciprocal, 0.067 UCR's/month. The following table summarizes
these results after conversion to hours.
Mean time to UCR: 11,000 hours/UCR
Field UCR-rate: 0.091 UCR's/1000 hours.
Note that the final field failure rates under the two assumptions are quite
similar and essentially bound the true field failure rate. Averaging the
two values gives that recommended for use at this time, i. e., 0.1 fail-
ures per 1000 hours.
9. FFR Confidence Intervals
Exhibit 3 offers sufficient justification for the assumption of an
exponentially distributed time to failure for pressure switches. Using
this assumption and calculating the 90 percent confidence limits for the
two cases presented above, i. e., (1) failures = rejects, and (2) failures =
UCR's, and then averaging the two results in the following tabulation.
Confidence Limits (90%)Lower Upper
Rejects = Failures 0.088 0.132
UCR's = Failures 0.071 0.113
Average 0.08 0.12

PRC R-1459I-16
10. Resolution of FFR Factors
From Exhibit 4 it can be seen that design problems represent as
great a problem, in terms of rejected switches, as normal operation.
Quality problems account for approximately one UCR out of five, whereas
operational and maintenance problems, in terms of their contribution to
the field failure rate, are essentially negligible. Reducing design and
quality problems to the level contributed by operations and maintenance
would essentially halve the observed field failure rate.
Wear-out is not reported with sufficient frequency to indicate that
it represents a problem for pressure switches. Corrosion, on the other
hand, is reported often enough (10 to 15 percent of the failures) to indi-
cate that the Cape Kennedy environment is a significant contribution to
the pressure switch failure rate.
11. Repair Time
"Time to Locate," "Time to Repair," and "Total Down Time" data
elements are present in an average of 29 percent of the UCR's. Exhibit
5 plots these entries on a semi-log scale; the graph demonstrates that
it is reasonable to assume a log-normal distribution for these down-
time parameters. Apparently, the "Time to Locate" element is less
significant than the "Time to Repair" element in determining the down-
time of the typical pressure switch. The range and mean times for these
three categories are given in the following table.
Max. Ave. Min.
Time to Locate (minutes) 360 56 -0
Time to Repair (minutes) 2880 278 5
Total Down Time (min. ) 3000 404 20
The number of observations used in computing these figures are 28, 34,
and 26, respectively.

d Cd
04) t
000.4 .41
0 .0 0
I II
I '11
I
-i"I'-'I
I
.I_ II--- - - I--
II
I,,,,
-'II._. ,
1L
I.
I
PRC R-1459I-17
oo_o
t/2
o
B O.4J
Z
CI
. (
E
o x0~~
(;uoaDocd) Aduonb..zi afATeTI1
o 0 0 0 0o o0 , ( N
i-- I
I
IIi
I
II
IiII

PRC R-1459J-1
RE LIABILITY ASSESSMENT
OF
PUMP ASSEMBLIES
Date: 24 May 1972
Observed Field Failure Rate
In Failures Per Thousand Hours
Of Installed Component Time 0. 129
Observed Failure Times, In Hours
Mean 7, 769
Minimum 1
Maximum 43, 200
Number of Observations 44
Observed Repair Times, In Hours
Mean 7. 7
Minimum 1
Maximum 24
Number of Observations 12

PRC R-1459J-2
FAILURE MODES AND CAUSES CONTRIBUTING TO
THE OBSERVED FIELD FAILURE RATE
AS A PERCENT OF THE TOTAL
/
0
A,
-YI
7o /
F Ip
.; I >30 10
n I Q~~~~~~~~~~~~~~~~~~~I
Failure Cause
-o
st 02
Lj\
A'1.0
0 1
('
I ,
0 1 0
O / 1
Failure Classification (Percent)
Number of Relevant UCRs: 103 Currency:(1) 13 May 1971
( 1 )Date of latest UCR run included in the assessment.
/
Bearing Problems 5. 7 2.8 0.9 9.4
Contamination, Corrosion 2.8 6.6 - - 9.4
Cracked or Broken Parts 13.3 - 2.8 0.9 17.0
Defective or Worn Parts 13.3 0.9 0.9 - 15.1
0 Design Deficiency - 9.4 - - 9.4
Electrical Problem 6.6 1.9 - - 8.5
. Inoperative 5.7 - - - 5.7
h Seal Problem 12.3 3.8 1.9 - 18.0
Other 3.8 2.8 - 0.9 7.5
Total 63.5 28.2 5.6 2.7 100.0
I .r-
I

PRC R-1459J-3
DESIGN BACKGROUND DATA
I. Component Description
The component population consists of all devices used to pamp
water, air, or other liquids or gases for use at Kennedy Space Center.
Pump assemblies are designated by major item code 918 on Unsatis-
factory Condition Reports (UCRs) written prior to 15 October 1969, and
by major item code 262 for UCRs written after 15 October 1969.
2. Data Base
The data base consists of 103 UCRs. Ninety-two UCRs were
obtained by retrieving all UCRs occurring prior to 15 October 1969
with major item code 918. Eleven UCRs were obtained by retrieving
all UCRs occurring after 15 October 1969 with major item code 262.
3. Engineering Analysis
Exhibit 1 presents the number of UCRs occurring per calendar
quarter. Except for the peak at the third quarter of 1969, the number
of failures decreased from the second quarter of 1968 with no failures
reported from the third quarter of 1970.
Sixty-five percent of the UCRs reported failures within launch
complex 39. Launch complexes 34 and 37 accounted for 12 percent.
Pump assembly UCRs were written against 20 functional systems.
The table below indicates the distribution.
PercentageFunctional System of UCRs
N 2 26..4
02 13.2
H.P. Gas 12.2
Industrial Water (Firex) 5.8
Altitude Chambers 4. 7
Hydraulics 2.8
RP-I 2.8
All Others 32. 1

PRC R-1459J-4
· .-4 4I:
,,.-4
~No` ~ .a
43
-4
aN
n X
_ z
X _.0X
mC mN-4-4 -- 4 s -I--4 -4_f4 -4o;-4 -4
SUfln jo xaqumN

PRC R-1459J-5
4. Component Populations
Only one component population was chosen for analysis - that
of pump assemblies.
5. Component Times
Forty-four UCRs had time or age entries for pump assemblies.
Exhibit 2 presents the cumulative distribution of component times.
The component times range from 1 hour to 60 months (43, 200 hours).
6. Component Failures
There were 106 reported failures in the data base. One UCR
reported four failures (each for a different pump assembly) while each
of the remaining 102 UCRs reported one failure. Forty-four failures
had relevant time-to-failure information, which is as indicated in
Exhibit 2.
7. Failure Classifications
Failure causes were determined for each failure. The description
of the failure causes and the number of failures per classification are:
Normal service (67 failures) - failure occurred as a result
of normal field operation or there is insufficient
information to assign it to any of the other three
categories.
Design problem (30 failures) - a failure in which the fault
is inherent in and can be corrected by design action;
such as, wrong diameter pipe used for intake to pump.
Quality problem (6 failures) - a failure which is a manufacturing
problem; such as, pump case cracked when received
from vendor.
Operational problem (3 failures) - a failure which resulted
from action of operation and maintenance personnel;
such as, piston inserted wrong.

PRC R-1459J-6
LA
ms
, OP-4
0
o-
IIx - O
'w m p · m C X
s.-nIfa[ jo zaquinN

PRC R-1459J-7
In addition, the following failure modes were determined:
Bearing problems (10 failures) - failure occurred due to
bearings, bearings noisy.
Contamination, corrosion (10 failures) - the pump failed
due to a contaminate such as oil containing foreign
particles or pump assembly parts were corroded.
Cracked or broken parts (18 failures) - pump parts are
broken or cracked.
Defective or worn parts (16 failures) - pump parts are
worn effecting pump performance.
Design deficiency ( 10 failures) - pump assembly does not
operate in the desired manner due to the design;
such as, wrong size pump for application.
Electrical problem (9 failures) - failure due to electrical
problem.
Inoperative (6 failures) - pump fails to operate; further
classification of problem is not evident.
Seal problem (19failures) - seal is leaking or is defective.
Other (8 failures) - all other failure modes.
8. Field Failure Rates
Each of the 44 component times from section 5 represents one
time-to-failure (TTF); hence, the field failure rate is derived by dividing
the number of failures (44) by the sum of the TTFs. The field failure
rate for pump assemblies is 0. 129 failures/l, 000 hours.
9. FFR Confidence Intervals
Exhibit 2 indicates that it is not unreasonable to assume the
pump assembly time-to-failures are exponentially distributed. Thus,
the 90 percent confidence limits are:
upper limit 0. 161 failures/I, 000 hours
lower limit 0. 098 failures/ 1, 000 hours

PRC R-1459J-8
10. Resolution of FFR Factors
Forty-eight percent of the failures with TTF information had
normal service failure causes. Forty-five percent had system design
failure causes. Thus, by eliminating design problems the failure
frequency of pump assemblies could be essentially halved even if no
other reliability improvement efforts whatever were undertaken.
There are no time-to-failure data for failures occurring after the
third quarter of 1969 which has an adverse influence on the credi-
bility of the field failure rate for current use.
1 I. Repair Time
Twelve UCRs had repair time information. The mean time-to-
repair was 7.7 hours. The minimum time-to-repair was 1 hour while
the maximum time-to-repair was 24 hours. Exhibit 3 presents the
cumulative time-to-repair distribution for pump assemblies.

sa.eda- Jo iaqLunN
PRC R-1459J-9
U)
N mU)
O_-o 0N
_ z
_ Ho0
LO Z
- D
'-D
'I
To~~

PRC R-1459K-1
RELIABILITY ASSESSMENT
OF
REGULAT ORS
Date: 24 May 1972
Observed Field Failure Rate
In Failures Per Thousand Hours
Of Installed Conmponent Time
By Inlet Pressure Range
Inlet Pressure Range (psi) Field Failure Rate
3000 or greater 0.23
750 to 3000 0.20
750 or less 0.13

PRC R-1459K-2
FAILURE MODES AND CAUSES CONTRIBUTING TO
THE OBSERVED FIELD FAILURE RATE
AS A PERCENT OF THE TOTAL
/ Failure Cause
Number of Relevant UCRs:
Failure Classification (Percent)
193 Currency: ( l ) 10 April 1968
(1)Date of latest UCR run included in the assessment.
Leakage, Internal 12.6 12.6
Leakage, External 6.3 6.3
Leakage, Seat 9.2 9.2
Pressure not Maintained 17.9 17.9
Incorrect Regulation 5.9 5.9
No Regulation 3.6 3.6
Faulty Bleed Adjustments 2.7 2.7
; Removed for PreventiveMaintenance 12.6 12.6
XI Part Misapplication 6.3 6.3
Part Cannot Operate toSpecifications 2.7 2.7
Foreign Material 6.8 6.8
Installed with KnownProblems 1.3 1.3
Contamination, Corrosion 2.3 2.3
Other 5.9 0.8 0.8 - 2.3 9.8
Total 64.7 9.8 8.9 12.6 4.6 100.0

PRC R-1459K-3
DESIGN BACKGROUND DATA
1. Component Description
Regulators were one of two lower level items selected for analysis.
The selection was made from two standpoints--(1) mechanical and elec-
tromechanical regulators are a high population item of GSE (satisfying
the study definition of a component, and (2) regulators are identified
as a major item on the UCR (code 639 for UCRs written prior to 15
October 1969) facilitating data retrieval from the UCR file. In addi-
tion, regulators are used in many applications and in various locations
throughout KSC.
2. Data Base
The request of the data bank for all UCRs written against regulators
resulted in 587 UCRs. This number was reduced to 193 UCRs for pur-
poses of analysis by eliminating (1) all non-KSC UCRs, (2) electrical
regulators, and (3) incorrectly coded UCRs.
3. Engineering Analysis
The 193 UCRs are distributed among 79 different part numbers;
nine of the 193 UCRs have no entry for part number. Exhibit 1 shows
that only 14 of the different part numbers have UCR frequencies of four
or more.
The small sample sizes limit the calculation by part number of
FFRs to five different part numbers. A grouping of part numbers by a
number of component characteristics was considered; the resultant
decision was to group regulators by inlet pressure ranges of high, medi-
um, and low. Two considerations were involved in this decision.
The first is the supposition that regulators designed to withstand
similar pressures can be expected to possess other design similarities
in addition to structural strength. Regulator differentiation with respect
to type of fluid, i. e., nitrogen, oxygen, hydrogen, water, etc., proved
to be an unacceptable criterion for grouping because a number of regu-
lators were found in different fluid systems. For example, part numbers
75M50305 and 75M51168-1 are used in both helium and nitrogen systems;

PRC R-1459K-4
EXHIBIT 1 - NUMBER OF REGULATOR UCRS BY PART NUMBERS
Part Number (P/N)
75M50165- 13
75M11856
75M51102
75M084 10- 1
75M084 10- 1B
75M11859
75M50305- 1
75M11875
75M04839-4
Model 77-4
Model 77-3
75M07000-2
75M08829
75M51168-1
All Others,
Total
Number of UCR's
17
9
8
7
7
7
6
5
4
4
4
4
4
4
90
103
193
3 or Less

PRC R-1459K-5
part number M-13955-AE, in both water and nitrogen. The information
available via UCRs preclude examination of any characteristic other than
pres sure.
The second consideration was derived through examination of the
regulator population as determined from the Pad 34/Vehicle 205 find
book. 1 The exercise tabulated the regulators by inlet pressure in order
to establish the distribution; information on inlet pressure was obtained
from the "Remarks" column of the find number index. Of the 196 "Regu-
lator" entries, the inlet pressure could be determined for 126. The re-
maining 70 could not be determined by this method. The results grouped
quite well, as follows:
Inlet Pressure Number
6,000 32
Between 6,000 and 3,000 7
3,000 34
Between 3,000 and 750 10
750 26
Below 750 17
Total 126
Based on these results, the decision was made to group the regulator
data base into pressure ranges--high, medium, and low, corresponding
approximately to 6,000, 3,000, and 750 psi, respectively. Exhibit 2
shows the distribution of the 193 UCRs of this study by inlet pressure
regulation.
4. Component Populations
Ideally, FFRs for regulators would be computed for each different
part number among the total regulator population. Unfortunately, the
resultant data base prohibits this procedure except for five part number
1 "Wearout Analysis Approach" 1 page copy, no other identification.

PRC R-1459K-6
° I cvo o0% ~ ~ ~ ' ,.Ln
O4)
ma0
,-4i
u
o D
4.-4
, -
a4 0
ma)u(d
UU'-4(d
Cd4.)Nd
N
E-
tI
U
H
O
Fr
U
iD
I
X
.,,
Coo
C-
- O
$ OP° C
. n., u V
o V
LO
vl r
4l
Cd,-44.0H~
4.- ,
x

PRC R-1459K-7
groupings or populations of the regulators for which FFRs might be de-
rived. Section 3 describes the principal groupings chosen for use here--
three populations of regulators determined by value of inlet pressure.
A final population consisting of all electromechanical regulators is also
utilized.
a. Components Defined by Part Number
Part numbers are requested on the UCR and, with few excep-
tions, do appear. As reported elsewhere in this document, a wide va-
riety of part number formats is contained within the data base. The
most frequently occurring format, 75MXXXXX, appears to be related
to drawing numbers. The first step in grouping the UCRs by part num-
ber resulted in the 90 UCRs shown in Exhibit lwhere each part number
has a frequency of four UCRs or more. These 14 part numbers do rep-
resent components on the basis of the study definition and have a suffic-
iently large data base to be candidates for FFR calculation.
b. Component Defined by Inlet Pressure
In searching for an alternate component definition under
which FFRs might be generated, it was postulated that regulators de-
signed to withstand similar pressures can be expected to possess other
design similarities in addition to structural strength.
Engineering analysis of the 193 UCRs in the data base revealed
that three groups could be formed corresponding to low, medium, and
high inlet pressure. Low inlet pressure is defined as 750 psi or less;
medium, as greater than 750 psi, but less than 3,000 psi; high, as
3,000 psi or greater. Exhibit 2 shows that 168 of the UCRs could be so
classified. The three categories--low, medium, and high--represent
three alternate regulator populations, each of which is a candidate for
FFR calculations.
c. Electromechanical Regulators
Among the 105 UCRs with a frequency of three or less in
Exhibit 1, there are 15 UCRs written against electromechanical regu-
lators. Because these as a group can be said to "function in a defined

PRC R-1459K-8
manner relative to the overall equipment operation" electromechanical
regulators also represent a candidate population for FFR calculation.
5. Component Time s
In-service time data for the regulator data base depend directly
on information available on the UCR. Two UCR blocks are provided for
recording time associated with the major items, age and time. In those
UCRs where age entries occur, it is assumed that the number of months
the major item has been installed in its recorded position at the time the
UCR was written. Time entries are in terms of hours and minutes; as
with age entries, it is assumed here that the time reflects the time to
failure of the major item in its position at the time of UCR generation.
It is possible to check the validity of this assumption and, in some
instances, to deduce additional time estimates. To illustrate this, regu-
lator part number 75M50165-13 will be used as an example. There are
17 UCRs written against this component, each representing one regulator.
Generally, no time or cycle information is given; 10 of the UCRs give
the data element of age, representing the number of months the compo-
nent has been installed in the next higher assembly. All the UCRs give
date of occurrence and part number and disposition; 13 give the part
serial number. From these data additional time estimates for three
regulators can be deduced, and nine of the age entries can be validated.
This is done by constructing a detailed time profile chart by regulator
serial number. This profile is shown in Exhibit 3.
The exhibit is to be interpreted as follows. The vertical line oc-
curring at the right end of a bar denotes the date of a component failure
and removal. The vertical line at the left end of a bar denotes date of
installation. Wavy lines terminating a bar on the left indicate an unknown
date of installation. Wavy lines terminating a bar on the right indicate
that the status of the unit is unknown after the last vertical line. A ver-
tical line in the middle of a bar denotes a failed unit that was repaired
in place. The 13 bars terminated by vertical lines at both ends are
"Failure" is used here to mean any unsatisfactory condition.
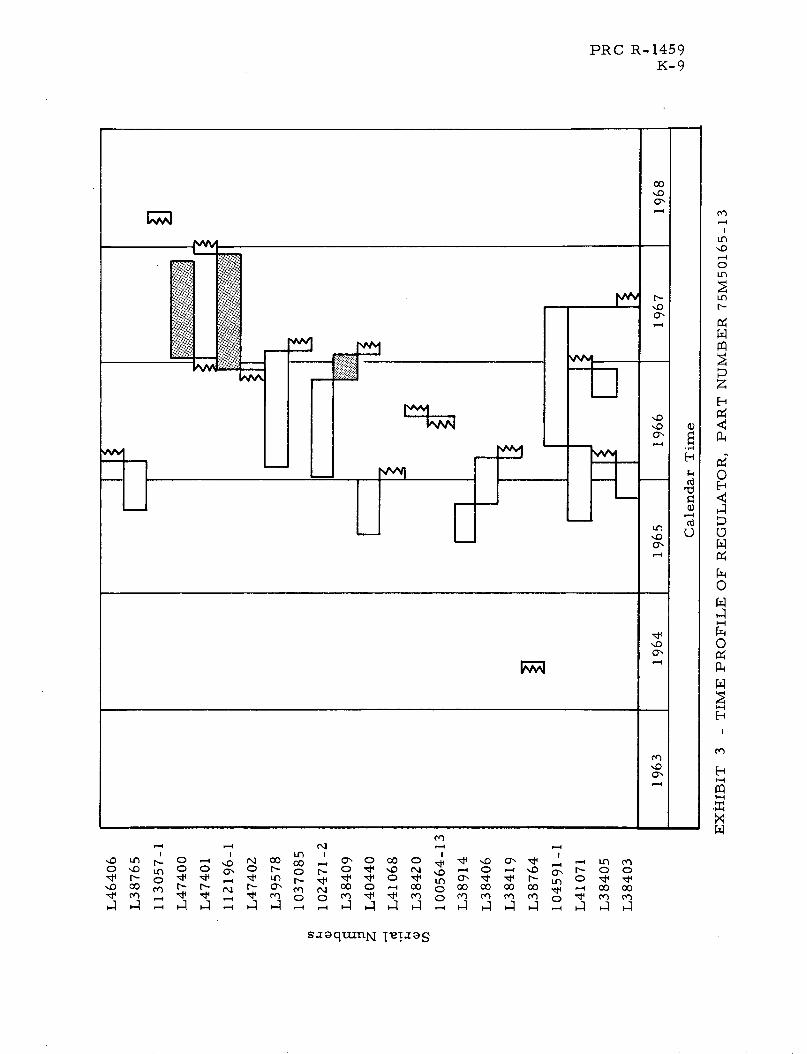
PRC R-1459K-9
Ln-0
r-f-
W
Z
(D4
O
H
;4
wr
H1
·3n
in~~~~~~c-4 -4 c.~~~~~~~~~'4 ,-
cO '0cOOr- 'o N 00~~~~~Lf I 0 w 'o00 ' t m~L CY)
0 ,, 0 0 o 0 P- 0 t- 0 ,0 ri 0 ,-4 .0 0
0 00 n - - Nd - C,1 0 O , - 0 COC C0 O 00 O0
-~~4 -4 C1 00 (f ~ 4 ~ -q ~ -4~
~~~~~~~~~~~~~O~~~~~~~~g N~~~~~~~~~~~~~~~,~~-o'1 ,_~ ~ ~ ,_~ '~ o'10O o 0%~ % O o1o1o1o1 ~ o1o
s aqtunN -leJaS

PRC R-1459K-10
indicative of in-service times to failure (or age) of the associated regu-
lators listed by serial number.
Since the date of installation is not given directly in the UCR, the
lengths of the bars were determined either by subtracting the age, where
given, from the UCR date of occurrence or by the following expedient.
When a regulator is replaced, the date of installation is established for
the replacement unit. If the replacement unit fails at a later date and
its serial number appears on both UCRs, its in-service time or age is
approximately the difference between the two UCR dates of occurrence.
Derivations of in-service time for each of the three regulator
groupings are discussed in the following subsections.
a. Components Defined by Part Number
Exhibit 4 shows the number of component times or ages
available for the part numbers of Exhibit 1.
Disregarding for the moment the question of whether or not the
114 regulators in Exhibit 4 represent failures, it can be seen that seven
of the part numbers have no, or only one component time or age esti-
mate and must, therefore, be eliminated from the FFR calculations by
part number.
It is important to note that the problem here is not a fault of the
UCR system; time estimates are required. Those UCRs with blank
time and age entries may result either from lack of information avail-
able to the UCR originator or because the originator considers the entry
to be of little value. It is a fact that approximately 38 percent of the
193 regulator UCRs have such entries; it seems reasonable to assume,
therefore, that this information is available. Furthermore, time esti-
mates can often be deduced if the serial numbers for the part and its
replacement are given. However, only 71 of the 193 regulator UCRs
recorded replacement part serial numbers.
b. Components Defined by Inlet Pressure
Exhibit 5 shows the number of component time estimates
available for the regulators grouped according to inlet pressure ranges.
FFRs for these groups can be generated.

PRC R-1459K-11
" -- OD 00 O I I 0 O O I Z
0 0 ooo 0 0 0 I It 0 0 0D 0 1-4 I
N- C 0 w N- It It ICO' 't UnIt-4 -4 -4 ~~~~~~~~~~~NJ1-
m-4
I O'NION 0 a, InIn o -.4 I 0
c C O O cU
In tn In n nN rN rN
N -4
I I aC) 'o Io Co N N 0 Co ODr- on 0 X O O
I 't -I -I N 0 -O _Co Q a o m
0 a I -1 °
n 0 tLNNrLONNNm Hr- r , > E-4
a)
Z -
V
k m~-40 0 u2
" .4 -4
(4 J
Sq U]
O) % r .
aai
0 -
Bk, o
O4210 H4k 0
.1 ;JV b
,fl
4
U)
EH
U)
0
OZH 0
1U)
OH
D0
¢nC7
o4
00) r
u -I
EH
zP1
O
In

PRC R-1459K-12
,+- cn a)
"o h Z E
w a
t
U
U0Q)u
5, 0 g hO) d.., 0U
;J pq w
I r)0
f.
-4 CQ
O ;0
O0
V~d
_u
Z
0v
9U)
002
OQ.)
'-4
IH
k
Q,
aQk
pdc
:j
Iu ) - o o0"-I o
I ,-4
o0.
o
o
0 2
o
-du% . a
onNo
Bo
(n
,--)
0H
~D
O
0'4
0
CI
HZ
O
qC
u%
X
m
9I 00 00I N
N
,n.o ooo 't n cooo
I0.0

PRC R-1459K-13
c. Electromechanical Regulators
Of the 15 electromechanical regulator UCRs representing
22 regulators, 20 have age or time entries. Pending identification of
failures among the 22 regulators, FFRs can also be calculated for this
group.
6. Component Failures
An engineering analysis of each of the 193 regulator UCRs was
performed to determine which UCRs, in fact, represent regulator fail-
ures. As stated elsewhere, the definition of a field failure for this study
is "the inability of a component to perform its defined function regard-
less of cause." Included in this definition are regulators not capable of
performing their function because they are defective, either at installa-
tion or after some elapsed period, and regulators unable to perform
their function because of part misapplication (design problems) or be-
cause of problems in the realm of quality control.
The engineering analysis of the UCRs identified design problems,
quality control problems, and defective parts, as well as those UCRs
that cannot be classified as field failures. The UCR system provides
for essentially this same type of classification; unfortunately, too many
coding irregularities exist to permit sorting the UCRs on the basis of
the codes provided in the UCR block, "reason for report."
The number of identified failures for each of the regulator groups
previously defined as candidates for FFR calculations is given in the
following paragraphs.
a. Components Defined by Part Number
Six part numbers have a sufficient number of UCRs and as-
sociated time estimates to potentially permit an FFR calculation, depend-
ing on the number of failures involved.
(1) Part Number 75M50165-13
This component is a cold gas regulator; a, total of 17
UCRs are written against 75M50165-13.

PRC R-1459K-14
Sixteen of the UCRs are coded by the UCR originator as "failed
item." Engineering analysis by the study team indicates that, in fact,
all of the 17 are failures.1
(2) Part Number 75M11856
This component is a cold gas regulator, used in the
tail service mast assemblies. Thirteen regulators are involved on nine
UCRs. Each of the 13 regulators are identified as failures under the
study definition, with two representing conditions existing prior to in-
stallation and thus assigned to the category of quality control.
(3) Part Number 75M08410-1, -1B
Part numbers 75M08410-1 and -lB are also cold gas
regulators used in the umbilical swing arm assemblies; all 14 UCRs
were originated at LC-39. Twenty-eight regulators are involved, 15
of which were reported on one UCR. These 15 regulators were disas-
sembled for modification and are not considered to represent regulator
failures. Eight of the modified regulators were reinstalled and failed
at a later date. These eight and the remaining five unmodified regulators
are all considered to be failures.
(4) Part Number 75M50305-1
This is a cold gas regulator used in the helium and
pneumatic functional systems at LC-34 and LC-37. Six UCRs report
problems on six regulators; all are classified as failures.
Two data inconsistencies are evident in the anlysis of the six UCRs.
Serial number 3677 reported failed on 23 September 1966. It is used as
a replacement for a failed regulator on 16 December 1966, presumably
after repair. On 21 November 1967, it is used again as a replacement
in a different position than in December 1966. In the intervening year,
1The discrepancy is coded "operational problem"; the narrative readsin part, ",.. regulator could not be adjusted to produce higher (required)output... possible causes.. . a leaking diaphragm or defective internalrelief valve."

PRC R-1459K-15
no record is given concerning the regulator. It seems likely that S/N
3677 did incur another problem during the interval 16 December 1966
to 21 November 1967; the incident is not reported via the UCR system.
The second data inconsistency concerns two regulators reported
on consecutive UCR numbers, having the same serial number and the
same find number, but with different next assembly numbers and re-
placement serial numbers. There are instances of different next as-
sembly numbers having identical find numbers (e. g., TSMs). The ex-
istence of two different regulators is assumed for this study.
(5) Part Number 75M04839-4, -1
This component is a cold gas regulator used in the
helium functional system at LC-34. Four UCRs are written against
the -4; three against the -1. The problem being reported on the seven
UCRs involves the regulators in the pneumatic control distribution as-
sembly. Since all seven regulators are interchanged in similar posi-
tions, the group is considered appropriate for FFR calculations.
The UCR events are important tothe determination of the number
of failures for this component. On 19 February 1966, S/N 2 of 75M04839-1
(F/N 1592) incurred internal leakage, as did S/N 2 of 75M04839-4 (F/N
1593). They were replaced with S/N 14 and S/N 16, respectively. On
21 February 1966, S/N 5 (F/N 1616) and S/N 1 (F/N 1617) were re-
moved; investigation of the first two failures revealed that the helium
"had caused a problem with the rubber on diaphragm plate," and S/N
5 and 1 were removed to "ensure no failure of system 2 before launch."
They were, however, replaced with the original two regulators. On 26
February 1966, these two regulators incurred the same failure mode
they had experienced on the 19 of February. The assumption for this
study is that two failures occurred on 19 February after seven months
of service, were repaired and reinstalled, and experienced two addi-
tional failures in five days. The seventh UCR also represents a failure;
thus, a total of five failures are identified for this component.

PRC R-1459K-16
(6) Part Number Model 77-4
Model 77-4 is a 1,000 GPM set point reference regu-
lator used in the nitrogen functional system at Pad A, LC-39. The four
UCRs, all with age entries, report the same design problem against
four regulators. Since only one failure event occurs, the component is
eliminated for FFR calculation purposes.
b. Component Defined by Inlet Pressure
Identification of failures for the alternative method of group-
ing the regulator data base (by range of inlet pressure) is accomplished
by engineering analysis similar to that performed for the UCRs grouped
by part number. Each of the UCRs for the three pressure ranges was
examined and classified as a failure.
Since the FFR calculations of Section 8 below are limited to
those regulators where time estimates are available, only these reg-
ulators of the total 222 (see Exhibit 5) are classified below as failures
or non-failures.
(1) High-Pressure Regulators
Among the 116 high-pressure regulators of Exhibit
5, there are 46 with time estimates. Forty-four of these are identified
as failures.
(2) Medium-Pressure Regulators
There are 19 regulators with time estimates among
the 48 medium-pressure regulators of Exhibit 5. All are classified as
failures appropriate for FFR calculations.
(3) Low-Pressure Regulators
All 36 low-pressure regulators with time entries (see
Exhibit 5) are classified as failures and form the base for the FFR cal-
culations presented below.
c. Electromechanical Regulators
All 20 electromechanical regulators with time estimates are
failures under the definition of this study and are the basis of the FFR
calculated below.

PRC R-1459K-17
7. Failure Classifications
An engineering analysis was performed using the information on
each UCR. Exhibit 6 presents five major classifications of problems
recorded on the regulator UCRs that were grouped previously according
to high-, medium-, and low-inlet pressure.
The first classification, identified as "d efective part, " is by far
the largest category. Two major subcategories are possible: (1) regu-
lators where the observed problem occurs during some prescribed pro-
cedure, i. e., initial component test, system test, or normal operation;
and (2) regulators which were removed from an installation for preven-
tive maintenance, generally precipitated by a related regulator problem.
Of these two major subcategories, the first has a sufficient number and
variety of unsatisfactory conditions to permit a further breakdown.
Each of the titles listed represents a defective part observation;
they are not of the same levels, but do give a reasonable description
based on the UCR information. Brief remarks concerning each cate-
gory are in order.
In the three leakage categories, the 20 seat-leakage problems
are so identified as the result of a failure analysis reported on the UCR.
The 13 external leakage observations are primarily defective "O" rings.
The internal leakage category (28 entries), however, is not as clearly
defined; the exact location of the leak could not be determined from the
entries. Diaphragms, "O" rings, or the seats may be the problem.
Problems classified as "pressure not maintained" indicate vari-
ations in pressure, resulting perhaps from insufficient lubrication or
a combination of functional forces; "incorrect regulation" reflects
constant error in pressure. The "no regulation" category includes
regulators with no output pressure and is primarily indicative of
ruptured diaphragms.
"Vibration" or noisy regulators may be the result of the seat
material used, contamination, or the number of cycles the regulators
have undergone. "Mechanical binding" includes regulator problems
where the buildup of mechanical or structural tolerances is exceeded,

PRC R-1459K-18
EXHIBIT 6 - PROBLEM CLASSIFICATION FOR REGULATORS
Inlet Pressure Range
HighNo.
MediumNo.
Low TotalNo. %
Defective Part--Problem Observation
Normal ServiceLeakage, internalLeakage, externalLeakage, seatPressure not maintainedIncorrect regulationNo regulationVibrationMechanicalFaulty bleed adjustmentsPressure SpikeBroken part
Removed for preventive maintenanceTotal
Design Problems
Part misapplicationPart can not operate to specificationsWrong partMissing part
Total
Quality Control
Improper assemblySlots, scoresForeign materialInstalled with known problems
[
20111527
06236002
3 51 23 29 4
11 21 11 01 30 02 01 00 26
92 33 45 77
0 8 61 4 10 1 00 1 01 14 7 10i
1I1
153
Totall 20
0000
tO
sOsOtO
00000 91
Contamination- Corrosion
Unable to Classify
Total 3
Totall 0
48 58 100 percent I
1
0
iZ21
5 21
Page TotalF116

PRC R-1459K-19
or corrosion or the lack of lubrication is present. The remaining cate-
gories are self-explanatory.
In each of the above groups, no further determination could be
made as to the cause of the problem. It is entirely possible, for ex-
ample, that manufacturing processes or human errors are contributing
factors. For the present, however, 77 percent of the 222 regulators
of Exhibit 6 are classified as defective parts.
Design problems account for 10 percent of the reported problems
on UCRs, including part misapplications of various types and, in one
instance, operation of a system without a required regulator. Problems
associated with quality control activities (e. g., improper assembly,
foreign material), account for 9 percent of the total problems; identified
corrosion and contamination involve 2 percent of the observed problems.
The remaining 2 percent of the UCRs contained insufficient information
for classification. Problems reported in the UCRs for electromechanical
regulators can be classified into two groups--defective parts and design
problems. Among the 20 electromechanical regulators are temperature
and environment controllers (accounting for the nine defective parts)
and speed regulators associated with the crane operation (11 design
problems).
8. Field Failure Rates
Calculation of field failure rates is limited to those nine popula-
tions defined in the preceding two subsections which have a sufficient
number of failures and associated times to failure to make calculation
feasible. Exhibit 7 summarizes this information for each of the three
major groupings and includes individual times to failure, total accumu-
lated time, and total number of failures for each component population.
Exhibit 8 shows the mean time to failure for each of the nine pop-
ulations derived as the sum of all individual times to failure divided by
the number of observed failure times. The FFR is then found by taking
the reciprocal of the mean failure time and converting to units of failures
per 1,000 hours.

PRC R-1459K-20
In -4
Io000,.i
a,
0
,-4 -- -, 4
I
'
00
Lnr
I*n
0
u%
-O O
N
i)
0 0 00"00N
-4 -4-4-4 -4
,- -- I .- 4 --.
-4 -4 -4 -4 - -4 -4 -4
I N N 1 n "t
¢ )N <v) s~
U)
0.)
uI
,,
()
Ln
cO a)
C)
,.oO
co
0);4
.-40 1
o o
0[0
.1-4
WW U)
5-4
U)U1)
0.,
.
sI
bl*
000000
4 -4- 00 0
-4 C) 0-N
*-41 '- i
.; 1 -4 N N
i--4
¢4OFl
0
f4
C4
X
-4
HO
¢4•0
O
z
LO
DO P<I
-4
i
0
o
0)
I
'0
0Ul.
InN-
En
U)
4~
-I
C)
U)
0
oH
I-

PRC R-1459K-21
0r-No
-4
0000-1 ur% r..JD NN
r-
CIU~~~~ ~~~~~~~~~~~~~InL4-"4
I O O" o'uo0c Ot n O O O O O O O OO I
W W
e'~ e'%"O'- ['" O~o" ~4 ~ ~q t'-oO '"~ ~l~ '- O'-O ~'J~i~ r-4 r-
o9
a~
O
Q-4
0
11
a)
;j
U)U)
a)
pqo
;j
-4
sq
D
XP:j
m
a)
PI
-
U
a)
o9
-4
-4
r.
'U
Cu)
a)
4;
O
P3
a)
0-VL)v0
."
F-H
xq
w -4H-

PRC R-1459K-22
;J
.r..r:0V
L)v
0
0
0
u
H
0000o 0000
N e .n o-4
00-4.
-Ln
4rl .*H .
X.
u
U)
o
Qa
o -4
o O0
*- { 0 4-H
0 o
.,IQc 0
o m
0 Q U)
. ,
o 0 ~ S -c
cd 0
II I II II
P.F:c,4 l
>,
a
a)
-4
Q)
-4
-4
,.I.
0
a)
~ -rt -qX N -I ON

PRC R-1459K-23
N 00 N O CaC> tO 00 N
0 O O0 Co
-00000
0000 -r
(% oO au uIt
N N O
m W Ln L It1-4
a)
I I
O C? LA U)
() mLO -C)CO Co )
Ln LA LANN
-4
ha)
0o
h
,--
-4
ah4 O
U0O-0 _
a)
N N N
00 N N_
o0 0 C
ONN~ (,_
4 N %C
N LA N,14--4-4
0
U
U
ZO
u
to
-4
H
z
tOU]
't 0-P
a o
f.4 CO
U _
a)P-,
a) -a) ; .PI
,
o ava)
-4 0-I 4
¢ H., d 1::
o U(A h
m 'd
hz,+-0
N
0
0,o
NO
0
,-4(D0
.- 4
U
U
(D,-ua)
-0P
u
0)
o!h
a)~-
oD
H-4
mx
IoLo_O-
Ln L- t-
U)
C)
Cl)V
0 V 04o
gL
LA A ,,, P
a)
,0
zP-
,-4C-U
a)
-4Cd
4u
a)
W

PRC R-1459K-24
The mean FFR values given in Exhibit 8 are appropriate to the
related population only; individual elements or groups of elements
within the population might well have FFRs considerably different from
the mean value presented. For example, all regulator populations shown
in the grouping by part number form a part of the population of high-
pressure regulators in the grouping by inlet pressure range. The five
regulators in the former grouping have FFR estimates that vary by an
order of magnitude, a fact which must be borne in mind if the average
high-pressure regulator FFR estimate of 0.23 failures per 1,000 hours
is to be used.
It should also be recognized that the FFR estimates presented are
based on a rather small sample of regulator times to failure (compared
to the number that would be available if all UCRs were completed) and
hence may not be particularly stable. That is, those available might
not be a random sample of failure times, but rather a sample with some
inherent bias. The presence of bias is much more likely with the smaller
sample sizes. It is the author' s judgment, based on all available data,
that the estimated FFRs for those populations of Exhibit 8 containing 12
or more samples are reasonably stable; additional data are not expected
to significantly alter the values presented.
9. Confidence Factors
The failure rates computed in the preceding section indicate the
order of magnitude of regulator failure rates under field conditions. It
is important to note that no distributional assumption was made with
respect to the times to failure or the FFRs.
In order to explore the potential variation of the FFRs in terms of
confidence factors, some distributional assumption must be made. Using
the Kolmogorov-Smirnov test, the hypothesis that the underlying distribu-
tion is exponential could not be rejected for any of the nine groups of reg-
ulators. There is no evidence that the wearout phenomenon sometimes
associated with mechanical parts is present.
In view of the facts that the exponential distribution cannot be re-
jected for any of the populations and the data are insufficient to support

PRC R-1459K-25
any other distributional assumption, the exponential assumption is made
for purposes of confidence interval determination for the estimated FFRs.
This is considered to be the minimal assumption possible within the con-
straints of the data.
The confidence intervals for regulators are shown in Exhibit 8.
Again, it should be emphasized that the confidence intervals are with
respect to the mean FFR for a given population; individual FFRs within
the given population could easily vary by an order of magnitude.
10. Resolution of FFR Factors
Section 7 pointed out that no evidence of the wearout phenomenon
is evidenced by the data. Cycle information is not available for any of
the regulators. Thus, neither of these two potential contributing factors
is included here.
Investigation by date of problem occurrence in relationship to the
associated vehicle or launch pad indicated no discernible factor that
could be said to influence the FFR.
Exhibit 9 shows the original FFR for the five part types and three
groupings of regulators and the contribution to those rates by the three
categories defined in Exhibit 6--design, quality control, and contamination/
corrosion. The percentages shown in Exhibit 6 are applied to all regu-
lator groups (except electromechanical regulators) for the three groups
of contributing factors. Design problems account for over 50 percent
of the FFR of electromechanical regulators; no other contributing factor
could be isolated for this group.

PRC R-1459K-26
O OD O O N
C 0 C 0'
00000
0000-
ddddd
_t ,I, tnCo oo n Ud
000 00 uU
_c
0 00
in inN N
a)I r
0 m in SCD 00 00 00 t _ )Ln 0 -a)
in U)n Ln
.4-ia)
O - O
d0d
Nrqr-o
0
000 0 d ds Cs C;
oa
oo
.4
a)
O9
4
a)
4Ar
-4
f--,
a)WrZ.
0.4> 0
.~ 4
U(6)
4- a)
Qao '"
Cd C
oa)
Uq
'.4-I
00°UU
O )
.- 4
4
- 4
V
o
CdC
5w
¢U
00
o oN d
N
0
0000
O
0
0
U)
E-H
U)
0
H
U)
0
0
Ev
I--I
0
U)
0I
0
o
Il
H
rX
11
09
cO 0N N00
m) O) mN N
000
00
0
a)
O-4
u
4:u
u
ooo
' Va)
o V
a)
Oin
a)
a)laE0
-opzd.4I
ma)0.oin
vi
0.4

PRC R-1459L-1
RELIABILITY ASSESSMENT
OF
RELAYS
Date: 24 May 1972
Observed Field Failure Rate
In Failures Per Thousand Hours
Of Installed Component Time
Prior to 15 October 1969 0. 0'9
After 15 October 1969 0. 42

PRC R-1459L-2
FAILURE MODES AND CAUSES CONTRIBUTING TO
THE OBSERVED FIELD FAILURE RATE
AS A PERCENT OF THE TOTAL
Failur
0Q
4)C)
/c6
I v
n I~ot
60
0
'7IZ
/
re Cause
I ,
Q I
as
__ _ _ 1 I Oi I q i i I
o Contact Problem 6.7 - - 6.70 Higher Level Equipment Affected 33.1 0.4 1.5 35.0
o h No Output 7.8 - - 7.8h Operation Problem 23.9 1.5 0.4 25.8
o Oscillating 1.9 0.4 0.4 2.7h Short Circuit 3.7 0.4 - 4.1
0 Undesired or Unspecified Operation 3.3 4.1 7.8Other 5.6 4.5 - 10.1
Total 86.0 7.6 6.4 100.10Contact Problem 4.3 - - 4.3
m Higher Level Equipment Affected 10.6 - - 10.6No Output .
· Operation Problem 29.7 - - 29.7¢ Oscillating 4.3 - - 4.3u Short Circuit 12.8 2.1 - 14.9O Undesired or Unspecified Operation 17.0 - - 17.0m Other 12.8 4.3 2.1 19.2
'l otal 91.5 6.4 T. I 100T
Failure Classification (Percent)
Number of Relevant UCRs: 294 Currency:(1 ) 26 April 1971
(1)Date of latest UCR run included in the assessment.
I
"wx,o
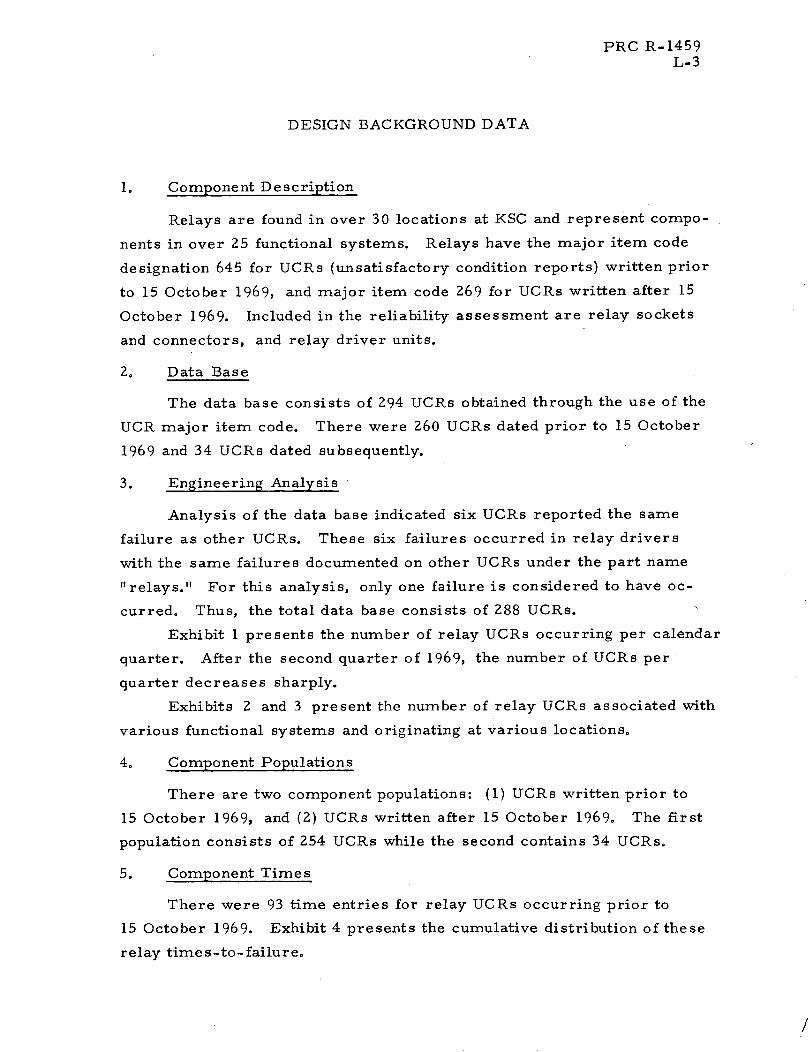
PRC R-1459L-3
DESIGN BACKGROUND DATA
1. Component Description
Relays are found in over 30 locations at KSC and represent compo-
nents in over 25 functional systems. Relays have the major item code
designation 645 for UCRs (unsatisfactory condition reports) written prior
to 15 October 1969, and major item code 269 for UCRs written after 15
October 1969. Included in the reliability assessment are relay sockets
and connectors, and relay driver units.
2. Data Base
The data base consists of 294 UCRs obtained through the use of the
UCR major item code. There were 260 UCRs dated prior to 15 October
1969 and 34 UCRs dated subsequently.
3. Engineering Analysis
Analysis of the data base indicated six UCRs reported the same
failure as other UCRs. These six failures occurred in relay drivers
with the same failures documented on other UCRs under the part name
"relays." For this analysis, only one failure is considered to have oc-
curred. Thus, the total data base consists of 288 UCRs.
Exhibit 1 presents the number of relay UCRs occurring per calendar
quarter. After the second quarter of 1969, the number of UCRs per
quarter decreases sharply.
Exhibits 2 and 3 present the number of relay UCRs associated with
various functional systems and originating at various locations.
4. Component Populations
There are two component populations: (1) UCRs written prior to
15 October 1969, and (2) UCRs written after 15 October 1969. The first
population consists of 254 UCRs while the second contains 34 UCRs.
5. Component Times
There were 93 time entries for relay UCRs occurring prior to
15 October 1969. Exhibit 4 presents the cumulative distribution of these
relay time s-to- failure.
/

PRC R-1459L-4
X..4.I'
C/
[-
ga
Ct
C,
'0¢ O
.q4
I~l ..-4 X---q
X- X[.
a) n It N 0 00 ' 4 N 0O OW '0 '4 NN r N N N ,- - _ _
RtDJfl jo aqun Np.

PRC R-1459L-5
Functional System Number of UCRs
Range Instrumentation 51
Electrical Networks 28
Environmental Control 26
Countdown Distribution 18
Timing Distribution 16
Camera. Start 14
Control 12
Other (with 10 UCRs or less) 123
EXHIBIT 2 - NUMBER OF UCRS PER FUNCTIONAL SYSTEM
Launch Complex 39 172
Launch Complex 34 30
Launch Complex 37 3017
O& C Bldg 17
Other (with 10 UCr-.s or less) 52
EXHIBIT 3 - NUMBER OF UCRS PER LOCATION

PRC R-1459L-6
U)
0
or
o IU) I
0
o~
o 0
U) Q
_A 'n 0 in o in L i 0 .in C mLI)
o W0I
co 00 r- o n L Im V-t en C N m
saolnTlve 30 zeqxunN V O

PRC R-1459L-7
For UCRs written after 15 October 1969, there were 10 time
entries. Exhibit 5 presents the cumulative distribution of times-to-
failure for this population.
6. Component Failures
Several UCRs report on multiple relay failures. As a result there
were actually 270 failures occurring prior to 15 October 1969 and 47 oc-
curring after that date.
7. Failure Classifications
Each relay failure was classified according to its cause of failure.
The failure causes are:
o Normal Service - failure occurred as a result of normal
field operation or for which insufficient information is
available to assign it to any of the other two categories.
o Quality Problem - failure is a manufacturing problem such
as corroded contacts on relay received from vendor.
o Design Problem - a failure in which the fault is inherent in
and can be corrected by design action; such as incorrect
voltage applied to operate relay.
Below are presented the failure causes for the two populations.
Failure Cause No. of Failures Percent
Normal Service 232 86
Quality Problem 21 8
Design Problem 17 6
(Failure causes for failures occurring prior to 15 October 1969)
Failure Cause No. of Failures Percent
Normal Service 43 92
Quality Problem 3 6
Design Problem 1 2
(Failure causes for failures occurring after 15 October 1969)

0
N
.)
oo
0
N
44
o I
tn
LA
vON-
o 0o )O
o0
LA~ln
LA
o
LnO
-- Lw- on
I · Io p · It) t
0 0",O0 E-, ~ ~ ~ '~ ti,-,,I~~~~~~S
s anmIT,.a jo Iaquxun
PRC R-1459L,-8
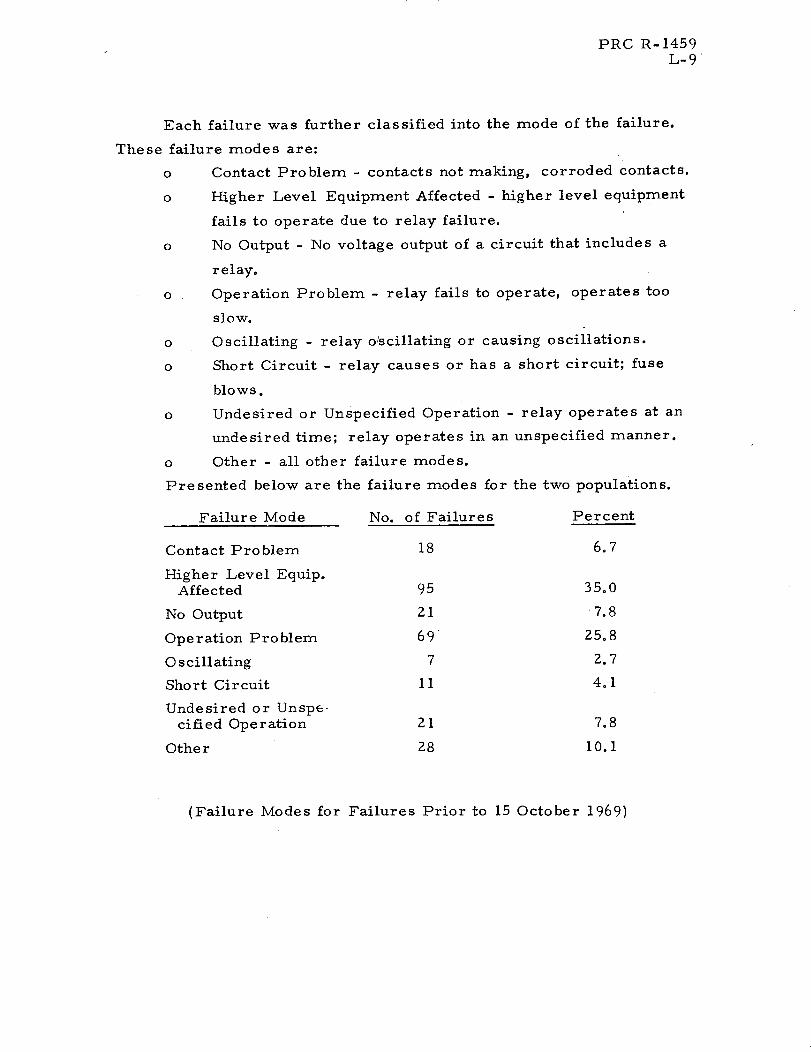
PRC R-1459L-9
Each failure was further classified into the mode of the failure.
These failure modes are:
o Contact Problem - contacts not making, corroded contacts.
o Higher Level Equipment Affected - higher level equipment
fails to operate due to relay failure.
o No Output - No voltage output of a circuit that includes a
relay.
o Operation Problem - relay fails to operate, operates too
slow.
o Oscillating - relay o~scillating or causing oscillations.
o Short Circuit - relay causes or has a short circuit; fuse
blows.
o Undesired or Unspecified Operation - relay operates at an
undesired time; relay operates in an unspecified manner.
o Other - all other failure modes.
Presented below are the failure modes for the two populations.
Failure Mode No. of Failures Percent
Contact Problem 18 6.7
Higher Level Equip.Affected 95 35.0
No Output 21 7.8
Operation Problem 69 25.8
Oscillating 7 2. 7
Short Circuit 11 4.1
Undesired or Unspe-cified Operation 21 7.8
Other 28 10.1
(Failure Modes for Failures Prior to 15 October 1969)

PRC R-1459L-10
Failure Mode
Contact Problem
Higher Level Equip.Affected
No Output
Operation Problem
Oscillating
Short Circuit
Undesired or Unspe-cified Operation
Other
No. of Failures
2
5
14
2
7
8
9
(Failure Modes for Failures After 15 October 1969)
The tables below present the number of parts that were reported
as being replaced.
Part
Coils
Contacts
Drivers
Relays
Sockets
Other
Qu antity
2
8
7
182
3
7
(Parts Replaced for Failures Occurring Prior to 15 October 1969)
Part
Relays
Sockets
Quantity
34
1
(Parts Replaced for Failures Occurring After 15 October 1969)
Percent
4.3
10.6
29.7
4.3
14.9
17.0
19.2

PRC R-1459L-11
8. Field Failure Rate
Using the data of Exhibits 4 and 5 above, mean-times-to-failure
and field failure rates were computed for each population. The FFRs
are:
Time Period FFR
Prior to 15 October 1969 0.09 Failures/1,000 hr.
After 15 October 1969 0.42 Failures/1,000 hr.
9. Confidence Factors
From Exhibits 4 and 5 it can be seen that the assumption of ex-
ponentially distributed times to failure is not unreasonable. Using this
assumption the 90-percent confidence intervals on FFR are:
Failures/1,000 Hours
Time Period Lower Limit Mean Upper Limit
Prior to 15 October 1969 0,075 0.09 0.11
After 15 October 1969 0.23 0.42 0.66
10. Resolution of FFR Factors
The field failure rate of the later population is higher by a factor
of four when compared to the earlier population. Exhibit 4 shows that
1/4 of failures occurring prior to 15 October 1969, occurred after
13,000 hours ( 18 months). The data base for failures occurring after
15 October 1969, includes only an 18-month interval. Thus, a larger
time span for the second population might tend to decrease the failure
rate.
11. Repair Times
There were no repair times for failures occurring after 15 October
1969. There were 143 repair time entires for the first population.
Summary repair time statistics include:
Minimum Me an Maximum
7 Min. 4.5 Hours 96 Hours

PRC R-1459M-1
RELIABILITY ASSESSMENT
OF
RF CARRIER. DEMODULATOR.
(DSC-39-W)
Date: 24 May 1972
Observed Field Failure Rate
In Failures Per Thousand Hours
Of Installed Component Time 0. 409
Observed Failure Times, In Hours
Mean 2, 440
Minimum 24
Maximum 17, 280
Number of Observations 51
Observed Repair Times, In Hours
Mean 5. 91
Minimum 0. 17
Maximum 17. 0
Number of Observations 113

PRC R-1459M-2
FAILURE MODES CONTRIBUTING TO
THE OBSERVED FIELD FAILURE RATE
AS A PERCENT OF THE TOTAL
Component Problem
Distorted Output
Incorrect Output
Inoperative
Intermittent Output
Mechanical Problem
Noisy
No Output
Sync, Frequency Response
Other
-I .~~~~~~~~~~~~ I S~~~~
16.0
2.8
18.1
3.5
2.8
0.7
18.7
11.8
20.7
4.9
100.0Total
Failure Classification (Percent)
Number of Relevant UCRs: 167 Currency:(1 ) 26 April 1971
(1)Date of latest UCR run included in the assessment.
a
'o
O
(d

PRC R-1459M-3
DESIGN BACKGROUND DATA
1. Component Description
The component population consists of all RF carrier demodulators,
manufactured by AMELCO Incorporated, with part number DSC-39-W.
All demodulators are located at launch complex 39 and represent a com-
ponent within the television (OTV) functional system.
2. Data Base
The data base consists of 167 unsatisfactory condition reports
(UCRs). Eighty-three of these were obtained by selecting all UCRs
from the television functional system data base with the major item
"demodulators, modulators," and then sorting by "demodulators." The
remaining 84 UCRs were obtained by selecting UCRs from the television
data. base which indicated that a demodulator failed but were not written
against the demodulator itself.
3. Engineering Analysis
Exhibit 1 presents the number of UCRs occurring per calendar
quarter. Two peaks occur in the histogram, 36 UCRs in the first quarter
of 1968 and 51 UCRs in the fourth quarter of 1968. For the first quarter
of 1968, 78 percent of the UCRs occurred in March. Fifty-nine percent
of the fourth quarter, 1968 UCRs occurred in November and 33 percent
in December. Only one failure occurred after February 1969.
4. Component Populations
Only one component population was chosen for analysis--that of the
RF Carrier Demodulator itself. All demodulators with part numbers
DSC-39-W are located at launch complex 39.
5. Component Times
Eight UCRs had "Age" or "Time" entries. Forty-three additional
time entries were determined by the use of the demodulator serial num-
bers. All UCRs were sorted by the serial numbers of the respective
demodulators. From this information and replacement serial number
information, the installation date and the failure date of a particular

PRC R-1459M-4
7-
I I- m I I n1 . I . I -
2 3I I _
1968Cale : ~, ar Qu.a rter
4I f
1I
I 2]1969
EXHIBIT 1 - NUMBER OF DEMODULATOR UCRS PER CALENDARQUARTER
50 -
n 0
, 30
20-
10 -
1I 2 4
19671967
1
I
0
I
m

PRC R-1459M-5
demodulator could be determined. The component time is then simply
the difference between the two dates. Exhibit 2 presents the cumulative
distribution of component times to failure.
6. Component Failures
There were 167 UCRs in the data base. However, 23 UCRs repre-
sent the same failure as reported on another UCR. This situation oc-
curred when a demodulator printed circuit card or module was replaced
and then repaired. One UCR was written against the demodulator and
another written against the components that were replaced during repair.
Thus, there are only 144 failures represented in the data base.
7. Failure Classifications
The predominant failure cause was normal operation; i. e., failures
which arise as a result of normal field operation or for which insufficient
information is available to determine otherwise. There was one failure
that could have been corrected by design action.
The failure modes were:
o Component Problem - failure occurred due to a com-
ponent, e. g., a transistor or a capacitor; this clas-
sification was used when a further explanation of the
failure mode was not given in the UCR narrative.
o Distorted Output - output of a demodulator was distorted.
o Incorrect Output - output was incorrect, e. g., too high
output voltage, too low output voltage, nonlinear output,
etc.
o Inoperative - demodulator inoperative with no further
information in the UCR narrative.
o Intermittent output - output intermittent or sporadic.
o Mechanical Problem - mechanical pro blem with demodu-
lator unit such as bent connector pin.
o Noisy - output noisy.
o No Output - no output.
o Sync, Frequency Response - unit not in synchronization,
or has poor or no frequency response.
o Other - all other failure modes.

PRC R-1459M-6
IN
0L" n H
o H
J0
O
o
-I
.o o,
N
8 Hn
.n _ 44 iv~ N -SI
m~ ~ ,

PRC R-1459M-7
Exhibit 3 presents the demodulator failure modes.
Failure Mode
Component Problem
Distorted Output
Incorrect Output
Inoperative
Intermittent Output
Mechanical Problem
Noi sy
No Output
Sync, Frequency Response
Other
No. of UCRs.
23
4
26
5
4
1
27
17
30
7
Total 1 144
EXHIBIT 3 - DEMODULATOR FAILURE MODES
Components (such as capacitors, transistors, etc.) were re-
placed on 85 UCRs. Exhibit 4 presents the number of UCRs mentioning
a particular component failure.
Component No. of UCRs
EXHIBIT 4 - NUMBERS OF UCRS WITH REPLACEMENT OF APARTICULAR COMPONENT
Capacitors 35
Diodes 1
Lamp s 1
Resistors 5
Switche s 4
Transistors 45
Wi ring 1__________________________________________________I
I
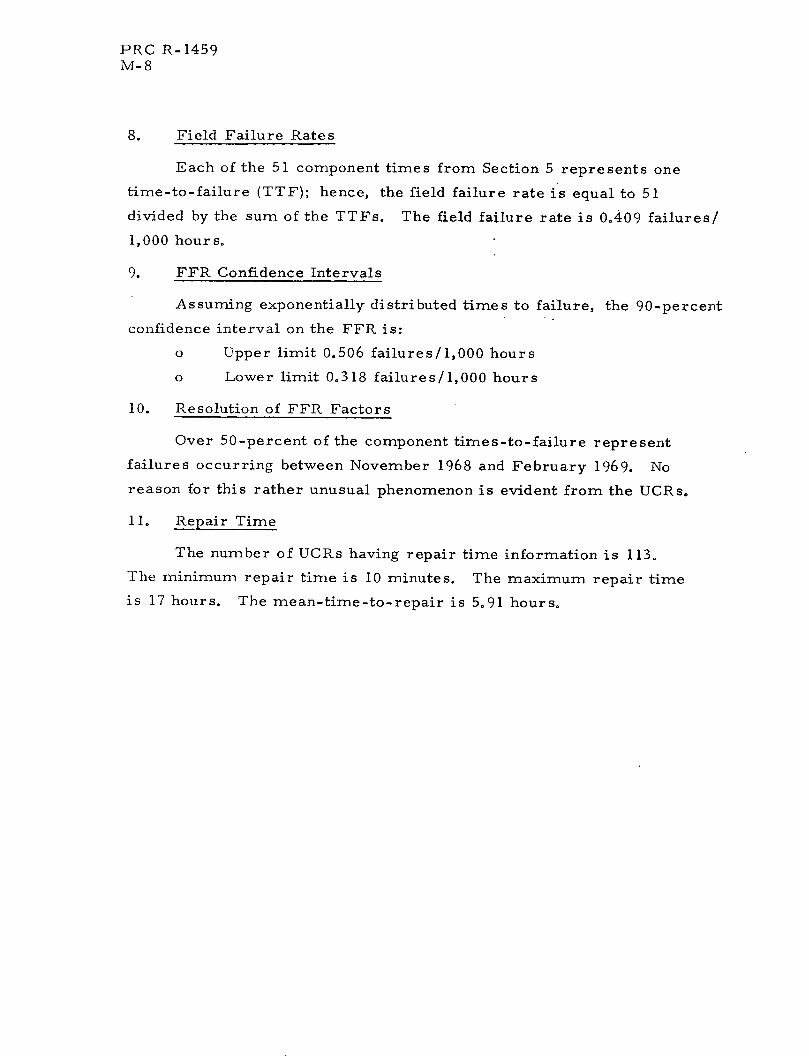
PRC R-1459M-8
8. Field Failure Rates
Each of the 51 component times from Section 5 represents one
time-to-failure (TTF); hence, the field failure rate is equal to 51
divided by the sum of the TTFs. The field failure rate is 0.409 failures/
1,000 hours.
9. FFR Confidence Intervals
Assuming exponentially distributed times to failure, the 90-percent
confidence interval on the FFR is:
o Upper limit 0.506 failures/1,000 hours
o Lower limit 0.318 failures/1,000 hours
10. Resolution of FFR Factors
Over 50-percent of the component times-to-failure represent
failures occurring between November 1968 and February 1969. No
reason for this rather unusual phenomenon is evident from the UCRs.
11. Repair Time
The number of UCRs having repair time information is 113.
The minimum repair time is 10 minutes. The maximum repair time
is 17 hours. The mean-time-to-repair is 5.91 hours.

PRC R-1459N-1
RELIABILITY ASSESSMENT
OF
RF CARRIER MODULATOR
(MSC- 39-W)
Date: 24 May 1972
Observed Field Failure Rate
In Failures Per Thousand Hours
Of Installed Component Time 0. 831
Observed Failure Times, In Hours
Mean 1,203
Minimum 24
Maximum 5, 160
Number of Observations 55
Observed Repair Times, In Hours
Mean 4. 13
Minimum 0. 33
Maximum 16. 5
Number of Observations 169

PRC R-1459N-2
FAILURE MODES CONTRIBUTING TO
THE OBSERVED FIELD FAILURE RATE
AS A PERCENT OF THE TOTAL
0a)o
0)'-4
-'-M
(d4
Alignment, Adjustment
Component Problem
Distorted Output
Incorrect Output
Intermittent Output
Noisy
No Output
Sync, Frequency Response
Other
Total
Total
0.5
16.7
14.5
40.3
1.6
8.1
1.6
10.8
5.9
100.0
Failure Classification (Percent)
Number of Relevant UCRs: 206 Currency:(1 ) 26 April 1971
(1)Date of latest UCR run included in the assessment.

PRC R-1459N-3
DESIGN BACKGROUND DATA
1. Component Description
This reliability assessment includes all RF carrier modulators
manufactured by AMELCO, Incorporated with model (and KSC part)
number MSC-39-W. The modulators are located at launch complex 39
and are contained within the television (OTV) functional system.
2. Data Base
The data base consists of 206 UCRs. Of these, 119 were obtained
by retrieving all UCRs with the part number MSC-39-W. The remain-
ing 87 UCRs were obtained by determining that the failure of a modu-
lator occurred from information other than part numbers on UCRs from
the television system file of UCRs.
3. Engineering Analysis
Exhibit 1 presents the number of UCRs per calendar quarter for
the RF carrier modulators. Over 56 percent of all modulator UCRs
were written in the fourth quarter of 1968, with the majority occurring
in December 1968. Twenty-six UCRs were written in 1969. There
were no UCRs after April 1969.
4. Component Populations
Since the data base is homogeneous with respect to location and
function, the only component population chosen for analysis was the
component itself, viz., RF carrier modulators.
5. Component Times
Seven UCRs had "Age" or "Time" entries. Component times
were determined for another 48 carrier modulators by the use of
serial numbers. UCRs were ordered by means of modulator serial
numbers. Installation and failure dates were determined by tracing
serial numbers using both serial number and replacement serial num-
ber information. The component times were then computed from the
difference between the installation and failure dates. Exhibit 2 pre-
sents the cumulative times to failure for the RF carrier modulators.
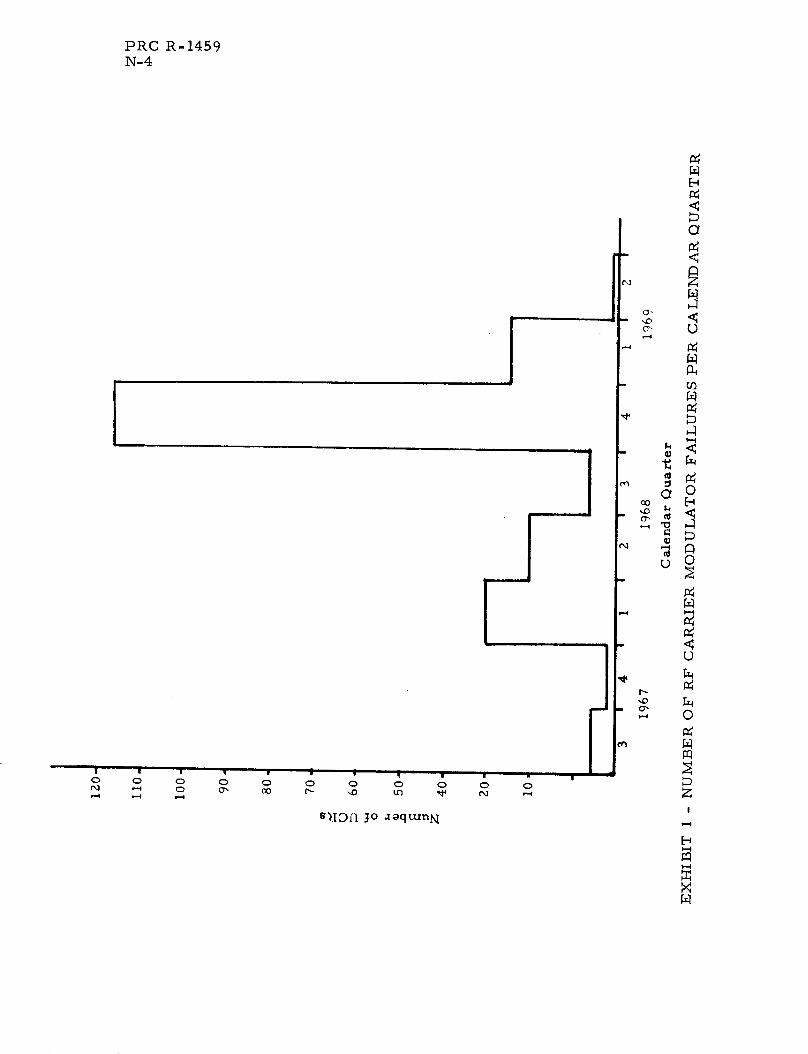
PRC R-1459N-4
0 0 0 0 0 0 0 0 0 0 0N - 0 0', C - '0 Lfl %N -c-4 - -4
sUDf1 jo iaquunN
E-
CY
a-
14
c U00
o 0
0-4
H

An oC) o u') C) UL OIn U' 't ' C, N (I
PRC R-1459N-5
0,1
5E0
r
o 0
2 Z,
O(:
- 01;
~ O
E-A
1)
H
IX
_ _ -
l g _ H~~0
sajnln ,,!,: jo .a;qunN

PRC R-1459N-6
6. Component Failures
Twenty UCRs could be classified as reporting failures that pre-
viously were reported. This situation arose when a modulator was
replaced with another unit. A UCR was written to report this replace-
ment and another UCR was written after the unit was repaired and parts
such as resistors or transistors replaced. The second UCR was writ-
ten with the part name of the part that was replaced. Eliminating these
" second ' UCRs from the failure total, there are 186 failures for RF
carrier modulators.
7. Failure Classifications
The predominant cause of modulator failures was normal service,
i. e., failures which arise as a result of normal field operation or for
which insufficient information is available to classify it otherwise.
The failure modes are:
o Alignment, adjustment--output could not be aligned
or adjusted; output is out of alignment or adjustment.
o Component problem--narrative of UCRs indicates that
the failure occurred due to a component such as a
transistor or capacitor; this classification was used
when no further information existed to classify the
failure in another failure mode.
o Distorted output--output is distorted.
o Incorrect output--output is incorrect such as an output
voltage too high or too low or insufficient gain.
o Intermittent output--output is intermittent or sporadic.
o Noisy - -output is noisy.
o No output--no output occurs from a modulator.
o Sync, frequency response--modulator exhibits poor
or undesired frequency response; modulator is out
of synchronization.
The table on the following page presents the modulator failure modes.
Forty percent of the failures had incorrect output failure modes.
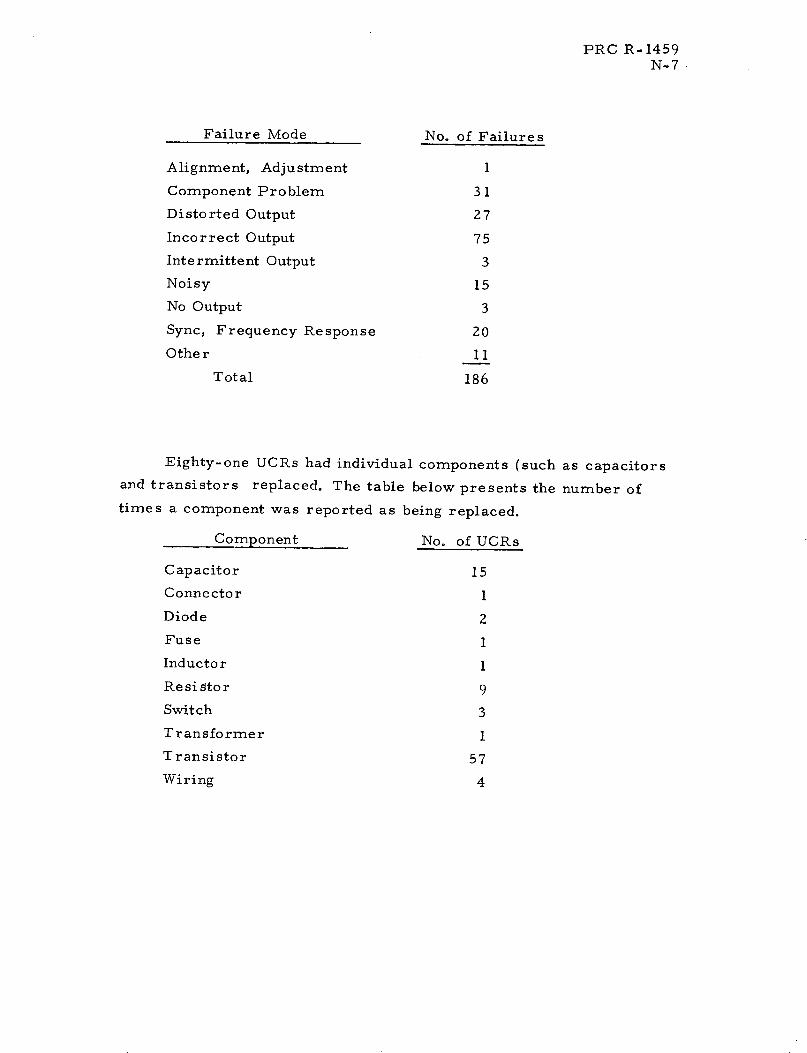
PRC R-1459N-7.
Failure Mode
Alignment, Adjustment
Component Problem
Distorted Output
Incorrect Output
Intermittent Output
Noisy
No Output
Sync, Frequency Response
Other
Total
No. of Failures
1
31
27
75
3
15
3
20
11
186
Eighty-one UCRs had individual components (such as capacitors
and transistors replaced. The table below presents the number of
times a component was reported as being replaced.
Component No. of UCRs
Capacitor 15
Conne cto r
Diode
Fuse
Inductor
Re si sto r
Switch
Transformer
Transistor
Wiring
1
2
1
1
9
3
1
57
4

PRC R-1459N-8
8. Field Failure Rates
RF carrier modulator field failure rates were determined by di-
viding the number of component times by the total of the component
times. The field failure rate is 0.831 failures/l,000 hours.
9. FFR Confidence Intervals
Assuming that times-to-failure are exponentially distributed,
the 90-percent confidence interval is:
o Upper limit 1.022 failures/i,000 hours
o Lower limit 0.654 failures/l,000 hours
10. Resolution of FFR Factors
There is no evident indication of factors influencing the field fail-
ure rate for the RF Carrier Modulator (MSC-39-W). The failure mode
analysis offers little to aid in the isolation of influencing factors. It
should be noted that 76 percent of the failures having component times
occurred between November 1968 and March 1969.
11. Repair Time s
Repair time information was provided on 169 UCRs. The mini-
mum repair time was 20 minutes. The maximum repair time was 16.5
hours. The mean-time-to-repair is 4.13 hours.

PRC R-14590-1
RELIABILITY ASSESSMENT
OF
RF INSTRUMENTATION
Date: 24 May 1972
Observed Field Failure Rate
In Failures Per Thousand Hours
Of Installed Component Time
By Location
Launch Complex 34 0. 80
Launch Complex 37 1.02
Launch Complex 39 0.68
Other 0. 23
Observed Repair Times, In Hours
Mean 3. 7
Minimum 0. 18
Maximum 32
Number of Observations 27

PRC R-14590-2
FAILURE CAUSES CONTRIBUTING TO
THE OBSERVED FIELD FAILURE RATE
AS A PERCENT OF THE TOTAL
Failure Classification (Percent)
Number of Relevant UCRs: 39 Currency: (1
) 26 April 1971
( 1 )Date of latest UCR run included in the assessment.

PRC R-14590-3
DESIGN BACKGROUND DATA
1. Component Description
The RF instrumentation system is comprised of all equipment
located at launch complexes 34, 37, and 39 and other locations that
are considered part of functional system code 23.
2. Data Base
The data base consists of 39 unsatisfactory condition reports
(UCR's) obtained by retrieval of those UCR's bearing a functional
system code of 23 (RF Instrumentation). Twenty-six UCR's had
associated investigation and corrective action reports which are in-
cluded in the data base.
3. Engineering Analysis
Exhibit 1 represents the number of UCR's written per calendar
quarter. There were no UCR's for the RF Instrumentation System
after September 28, 1968.
Calendar Quarter
Location
1965 1966 1967 1968
4 1 2 3 4 1 2 3 4 1 2 3
LC 34 3 6 4 - - 2 2 ..
LC 37 - - - 3 2 .
LC 39 - - - 1 - 4 1 1 - 2 2
Other - 1 - 3 1 I-- - - - - 1
Total 3 7 4 3 5 4 6 1 1 - 2 3
EXHIBIT 1: Number of UCR's Written Per Calendar Quarter
The UCR's are written against major items which are at a lower
level than the RF instrumentation system.

PRC R-14590-4
4. Component Populations
Component populations were chosen by launch complex so as to
have functionally similar equipment for analysis. There were 17 UCR's
occurring at launch complex 34, 5 UCR's for launch complex 37, 11
UCR's for launch complex 39, and 6 UCR's for other locations.
5. Installation Times
Installation times were found by determining the number of days
between the first and last failures for a given location. The installation
times are:
Date of First and InstallationLocation Last Failures Time (Days)
LC--34 11/02/65-04/08/68 886
LC 37 11/21/66-03/20/67 118
LC-39 11/28/66-09/25/68 668
Other 02/16/66-08/29/68 925
6. Number of Failures
Each unsatisfactory condition report had one failure, thus,
there are 39 failures. It should be noted that several UCRs had fail-
ures of several piece parts (such as transistors, capacitors, gears,
etc. ) but only one failure is considered to have occurred against the
RF instrumentation system itself.
7. 0 Failure Classification
Failure causes were determined for each UCR. These data are
presented in Exhibit 2. The failure causes explanations are:
Normal Service -- In this category are all those unsatisfactory
conditions which arise as a result of normal field operation
or for which insufficient information is available to assign
it to any of the other categories.

PRC R-14590-5
Quality -- This implies a fault which is neither inherent in the
design nor the result of normal (or abnormal) operation.
It is generally a manufacturing problem such as a connector
not tightened enough to give a good connection.
System Design -- A fault which is inherent in, or can be corrected
by, the system design.
Location Failure Cause Total
LC -34 9 2 - 17
LC 37 4 1 - 5
LC 39 8 2 2 11
Other 2 1 2 6
Total 23 6 4 39
EXHIBIT 2 - FAILURE CAUSES BY LOCATION
Failure modes are presented in Exhibit 3. The failure modes are:
o Component Failure -- A "piece part" such as a capacitor
or transistor was responsible for the failure. Used only
when there is insufficient information available to other-
wise classify the failure.
o Design -- A failure which is inherent in, or can be
corrected by, the system design.
o Incorrect Output -- A failure in which the output of an
electrical circuit is incorrect such as, too high or too low
voltage, or incorrect waveform.
o Inoperative -- Inoperative used when the failure mode cannot
be more explicitly determined.
o Intermittent -- Intermittent operation of an electrical
circuit.

PRC R-14590-6
o Mechanical -- Failure is mechanical in nature such as
broken connector.
o Noisy, Distorted -- Output is noisy or distorted.
o No Output -- No output from an electrical circuit.
o Short Circuit -- Electrical short circuit or unit blows fuses.
Location Total
Component Failure 2 - - - 2
Design - - 2 2
Incorrect Output 2 1 1 1 5
Inoperative 2 1 2 - 5
Intermittent 4 2 1 - 7
Mechanical 2 - 3 1 6
Noisy, Distorted 2 - 2 - 4
No Output 2 1 2 - 5
Short Circuit 1 - - 2 3
Total I17 1 5 11 6 | 39
EXHIBIT 3 - FAILURE MODES BY LOCATION
8. Field Failure Rates
The field failure rate for the RF instrumentation system was
found by dividing the number of failures by the installation time. The
field failure rates are given by location as follows.

PRC R-14590-7
Lo cation
LC -34
LC--37
LC-39
Other
Field Failure Rate(Failures/1000 Hours)
0. 80
1.02
0. 685
0. 226
9. FFR Confidence Intervals
Ninety percent confidence intervals for RF Instrumentation
components are given below.
Field Failure Rate(Failures/1000 Hours)
Lo cationUpperLimit Mean
LowerLimit
LC 34 1.12 0.80 0. 502
LC-37 3.23 1.02 0.695
LC--39 1.06 0.685 0.384
Other 0. 473 0.226 0.117
10. Resolution of FFR
Normal service failures accounted for over seventy percent of
all failures for launch complexes 34, 37 and 39. All failures occurred
before October 1968.
11. Repair Time
Twenty-seven UCR's had repair time information. The minimum
repair time is 10 minutes. The maximum repair time is 32 hours.
The mean total repair time is 3. 7 hours.

PRC R-1459P-1
RELIABILITY ASSESSMENT
OF
RF LINE REPEATER AMPLIFIER
(ASC-39-W)
Date: 24 May 1972
Observed Field Failure Rate
In Failures Per Thousand Hours
Of Installed Component Time
Observed Failure Times, In Hours
Mean
Minimum
Maximum
Number of Observations
Observed Repair Times, In Hours
Mean
Minimum
Maximum
3. 48
0. 50
12.0
21Number of Observations
0. 537
24
5 9 100
9

PRC R-1459P-2
FAILURE MODES CONTRIBUTING TO
THE OBSERVED FIELD FAILURE RATE
AS A PERCENT OF THE TOTAL
Total
Alignment, Adjustment 13.6
o Incorrect Output 54.6
0 Inoperative 22.8
- No Output 4.5
0 Other 4.5
Total 100.0
Failure Classification (Percent)
Number of Relevant UCRs:' 24 Currency:( ') 26 April 1971
(1)Date of latest UCR run included in the assessment.

PRC R-1459P-3
DESIGN BACKGROUND DATA
1o Component Description
This reliability assessment includes all RF Line Repeater Ampli-
fiers manufactured by AMELCO, Incorporated with model number ASC-39-W.
These repeater amplifiers are located at launch complex 39. They are
part of the Television (OTV) functional system.
2. Data Base
The data base consists of 13 UCRs obtained by retrieving all UCRs
with part number ASC-39-W. An additional 11 UCRs were obtained by
retrieving UCRs having a failure of an RF line repeater amp from the
television system master file of UCRs. The latter method involved
analysis of UCR information other than part number. Thus, the data
base consists of 24 UCRs.
3. Engineering Analysis
Forty-six percent of the repeater amplifier failures occurred in
the first quarter of 1969 as can be seen in Exhibit 1. There were no
failures occurring after March 1969.
4. Component Populations
Only one component population is considered for analysis because
of the similarity of all the components and the common location of the
components.
5. Component Time s
None of the UCRs had "Age" or "Time" entries. However, com-
ponent times were determined for nine repeater amplifiers. The UCRs
were first sorted by repeater amplifier serial numbers. Next, using
the serial numbers and replacement serial numbers information, a
component time was determined from the installation date and the
failure date of a particular repeater amplifier. The cumulative distri-
bution time for the RF line repeater amplifiers is given in Exhibit 2.

PRC R-1459P-4
Calendar Quarter
EXHIBIT 1 - NUMBER OF RF LINE REPEATER AMPLIFIER UCRSPER CALENDAR QUARTER
1
1
0
o
.m
6
5
4
0
1968 1969

PRC R-1459P-5
N
O a
0N N
0
o
o XN 0
00 [Xx
o
co
O X
oS
o N
Im
_O Sw0 B
a' oo r ', In -e N - 0
sanllreW ,o OaqLunN

PRC R-1459P-6
6. Component Failures
The number of reported failures is the same as the number of
UCRs, except for two failures which are the same as two other failures
on other UCRs. These repeated failures occurred when a repeater ampli-
fier was replaced with another repeater amplifier. A UCR was written
for the replacement itself, with another UCR written against the particular
component (such as transistor, capacitor, etc. ) that failed within the
amplifier. There are, therefore, 22 failures in the data base.
7. Failure Classifications
All failures had causes classified as normal service; i. e., those
failures which arise as a result of normal field operation or for which
insufficient information is available to assign it to any other category.
The failure modes of the repeater amplifiers were:
o Alignment, adjustment--amplifier out of alignment or
adjustment; amplifier could not be aligned or adjusted.
o Incorrect output--output incorrect such as too low
output, too high output, low gain, etc.
o Inoperative--inoperative; this classification used when
insufficient UCR narrative information precluded
further classification.
o No output--no output from a repeater amplifier.
o Other--all other failure modes.
The repeater amplifier modes are presented below. The failure mode
"incorrect output" presented 55 percent of all failures.
Failure Mode No. of Failures
Alignment, Adjustment 3
Incorrect Output 12
Inoperative 5
No Output 1
Other 1
Total 22

PRC R-1459P-7
The table below gives the number of times a particular com-
ponent such as capacitor, transistor, etc. was reported as having been
replaced.
Component Number of UCRs
Capacitors 1
Diodes 1
Fuse Holders 1
Switches 1
Transistors 5
8. Field Failure Rates
The field failure rate for RF line repeater amplifiers was deter-
mined by dividing the number of component times (9) by the sum of the
component times. The field failure rate is 0.537 failures/l,000 hours.
9. FFR Confidence Intervals
Assuming that times-to-failure are exponentially distributed
the 90-percent confidence intervals are:
o Upper limit - 0.863 failures/1,000 hours
o Lower limit - 0.280 failures/1,000 hours
10. Resolution of FFR Factors
There is no evident indication of factors influencing the field
failure rate for this particular amplifier. It should be noted, however,
that over half of the failures for which component times could be de-
rived occurred between November 1968 and March 1969.
11. Repair Time
Twenty-one failures had associated repair time information. The
minimum repair time was 30 minutes. The maximum repair time was
12 hours. The mean-time-to-repair was 3.48 hours.

PRC R-1459Q-1
RELIABILITY ASSESSMENT
OF
SOLENOID VALVES
Date: 24 May 1972
Observed Field Failure Rate
In Failures Per Thousand Hours
Of Installed Component Time 0. 118
Observed Failure Times, In Hours
Mean 8, 496
Minimum 4
Maximum 60, 480
Number of Observations 76
Observed Repair Times, In Hours
Mean 4. 05
Minimum 0. 33
Maximum 36
Number of Observations 65

PRC R-1459Q-2
FAILURE MODES AND CAUSES CONTRIBUTING TO
THE OBSERVED FIELD FAILURE RATE
AS A PERCENT OF THE TOTAL
L Failure Cause
o,
9 11
0 I 0J C C
-o0
0f Xq·
U 1 0
0
47.X9
M (V
Failure Classification (Percent)
Number of Relevant UCRs: 333 Currency:(1
) 13 May 1971
(1)Date of latest UCR run included in the assessment.
7
Configuration Problems 0.8 6.8 0.5 0.5 8.6
Contamination/Corrosion 8.1 0.5 1.0 - 9.6
[ Defective Mechanical PartO Part Malfunctions 3.4 2.1 - 0.3 5.8
Electrical Malfunctions 30.8 0.5 1.0 0.3 32.6a Failed to Actuate Properly 8.6 - 0.8 - 9.4
X Leakage Problems 32.3 0.8 0.3 - 33.4
Other - 0.3 - 0.3 0.6
Total 84.0 11.0 3.6 1.4 100.0
-4V4

PRC R-1459Q-3
DESIGN BACKGROUND DATA
1. Component Description
This reliability assessment consists of all electromechanical com-
ponents known as solenoid valves. Solenoid valves were designated by
major item code 786 on UCRs written prior to 15 October 1969, and by
major item code 319 on UCRs written thereafter.
Solenoid valves are located throughout the Kennedy Space Center
ground support equipment locations and are components of several func-
tional systems.
2. Data Base
The data base consists of 333 UCRs. Of these 333 URCs, 305 UCRs
were written prior to 15 October 1969, and were retrieved through major
item code 786. The remaining 28 UCRs were retrieved through major
item code 319.
3. Engineering Analysis
Exhibit 1 presents the number of UCRs occurring per calendar
quarter for the solenoid valve population.
Exhibit 1 has a peak of 51 UCRs during the fourth quarter of 1967.
From this point on, the number of UCRs occurring per calendar quarter
decreases to two UCRs during the first quarter of 1971.
Only six solenoid valve part numbers have four or more UCRs.
These six part numbers account for 26% of the data base as presented
below.
Part Number Number of UCRs
10425701 51
75M02986 12
75M04406 12
10425706 9
PA92304-5100 4
Other 245
Sixty-nine percent of all solenoid valve UCRs occurred at launch
complex 39. The three mobile launchers account for 54 percent of all UCRs.

PRC R-1459Q-4
Z
0U)
,0.o 00
c,,o, 0
CDIUs ~~~~~~~~~~~~~~~~~~~~~~~~~~~~~~~~~~~~~~~pte X
sg nDfl yo aquznN:

PRC R-1459Q-5
Four functional systems account for 54% of the data base. These
are: N2
(132 UCRs), Hydraulic (56 UCRs), Pneumatic (27 UCRs), and
Umbilical Swing Arms (22 UCRs).
4. Component Populations
There are a wide variety of solenoid valves located at every launch
complex and in nearly every functional system. There is no evident and
useful way to group the valves other than by part number. Hence, for
this analysis only two population groupings are considered. The first
consists of populations defined by part number--the size of each popula-
tion being determined by the number of time-to-failure observations
available. Only those solenoid valves which have four or more observed
times to failure are considered suitable for the derivation of FFR esti-
mates. The second population consists of solenoid valves in general;
the size of this population includes all available time-to-failure obser-
vations including those in the first grouping. Identification of each of
these populations and the sample size of time-to-failure observations
for each must await the determination of component times and component
failures.
5. Component Times
In-service time for each solenoid valve must either be given
directly on the UCR as an age or time entry or be deducible from the
replacement part serial numbers. Each available time observation is
assumed to represent the in-service time of the major item immediately
prior to the initiation of the UCR.
A detailed analysis of the entire solenoid valve data base to deter-
mine in-service times results in the following distribution of the number
of observed in-service times versus number of valves, by part number
(dash numbers were uniformly suppressed):
TotalsNumber of ObservedIn-Service Times 26 6 5 4 3 2 1 76
Number of AssociatedValve Part Numbers 1 1 1 3 2 2 17 27

PRC R-1459Q-6
Only six solenoid valve part numbers have four or more observed in-
service times, thus severely limiting the number of populations that
can be defined by part number.
Of the 76 observed in-service times, 63 were given directly on
the UCR as age entries, two were time entries, and the remaining 11
were deduced by subtracting the installation date from the date of occur-
rence of the UCR.
6. Component Failures
There were 382 failures reported in the solenoid valve data base.
Seventy-six failures had component times-to-failure.
The 76 valves for which an in-service time observation was avail-
able were further analyzed to determine which of these observations ter-
minated in major item failure.
Of the five part numbers with four or more times-to-failure avail-
able, all but one (P/N 10425701 with 25 failures) are rejected as being
suitable populations for FFR calculations. This is because of the nature
of the time-to-failure data. The difficulty is that, although each failure
time is associated with one and only one valve failure, they do not appear
to be random samples. That is, the failure dates and times-to-failure
are entirely too similar to be completely independent events.
In fact, the entire sample of failure times for solenoid valves
seems to be somewhat subject to this phenomenon, as can be seen from
Exhibit 2. This exhibit shows all the observed times-to-failure and the
frequency with which each occurs over the entire sample and for part
number 10425701 only. Note the relatively heavy concentration of failure
times at 60, 180, 360 and 720 days.
The reasons for this rather lumpy distribution of failure times can
only be surmised. That they occur in multiples of 30 days is not sur-
prising, since most UCR entries are in terms of months, and a conver-
sion factor of 30 days per month was used in deriving Exhibit 2. The
clustering effect at the equivalent of 2 years, 1 year, and 6 months may
be related to maintenance policies, or they may just be good round

PRC R-1459Q-7
EXHIBIT 2 - DISTRIBUTIONS OF TIME TO FAILURE FOR SOLENOIDVALVES
Time Frequency of Failures(Days) All Valves P/N 10425701
2520 1
1080 2
900 1
720 11 1
540 5
450 1 1
440 1
390 2 2
360 12 7
356 1
314 1
300 1 1
296 1
210 2 1
180 8 2
150 3 1
120 2
108 1
91 1 1
90 4
60 4 4
46 1
37 1
30 3 3
11 1
10 1
5 1
4 1 1
0 2
TOT AL 76 25

PRC R-1459Q-8
numbers used to indicate the order of magnitude of in-se rvice time.
The distribution of data for the single valve generally follows that for
the entire sample but is considerably less pronounced.
Exhibit 3 shows the cumulative distribution of solenoid valve
times- to-failure.
7. Failure Classification
A failure cause was determined for each of the 382 failures. The
failure causes and the number of failures reported are:
o Normal Service (322 failures) - failures which arise as
a result of normal field operation or for which insufficient
information is available to assign it to any of the other
three categories.
o Quality (42 failures) - implies a fault which is neither in-
herent in the design nor the result of normal (or abnormal)
operation.
o Design (14 failures) - a fault which is inherent in, and can
be corrected by, the contractor design.
o Operation and Maintenance (4 failures) - failures were
caused or exacerbated by the misuse of the solenoid valve
on the part of the operating or maintenance personnel.
In addition, the following failure modes were determined:
o Configuration Problems (33 failures) - improper assembly,
part misapplication, or solenoid valve cannot operate to
specifications.
o Contamination/Corrosion (37 failures.) - solenoid valve was
contaminated or corroded.
o Defective Mechanical Part Malfunctions (22 failures) -
solenoid valve had damaged parts, excessive wear,
perforated diaphragm or valve was sticking or chattering.
o Electrical Malfunctions (125 failures) - open or short circuit,
switch malfunctions, valve gives wrong indication.

PRC R-1459Q-9
14u~ X
H
0I
otn
z
Ea4
Bo
'0
H H
to
0
H
k-i
saanlTie,. Jo tIaqlunN

PRC R-1459Q-10
o Failed to Actuate Properly (36 failures) - valve did not
actuate, or actuated too slow or too fast, or did not fully
open or close.
o Leakage Problems (128 failures) - solenoid valve leaked
either externally or internally.
o Other (2 failures) - all other failure modes.
8. Field Failure Rates
A field failure rate for solenoid valves was determined by dividing
the sum of the individual times-to-failure into the number of failures.
The field failure rate for the solenoid valve population is 0. 118 failures/
1000 hours.
For solenoid valve part number 10425701, the field failure rate
is 0. 19 failures per 1000 hours.
9. FFR Confidence Intervals
From Exhibit 3, it can be seen that the assumption of exponentially
distributed solenoid valve times-to-failure is not an unreasonable assump-
tion. Using this assumption, the 90% confidence interval is:
Upper Limit 0. 141 failures/1000 hours
Lower Limit 0.097 failures/1000 hours
10. Resolution of FFR Factors
In section 8 it was noted that the FFR for part number 10425701
was 0. 19 failures/1000 hours. This part number represents over 1/3
of the total population used to compute the overall solenoid valve FFR
which was 0.08 failures/1000 hours less than the part number 10425701
population.
Also, from Exhibit 1, the number of reported failures has been
decreasing. This may have an effect on the present FFR.
11. Repair Time
Sixty-five failures had repair time information. The mean-time-
to-repair was 4.05 hours. The minimum time-to-repair was 0. 33 hours.
The maximum time was 36 hours. Exhibit 4 shows the cumulative dis-
tribution of solenoid valve times-to-repair.

PRC R-1459Q-11
o 1
- I
0
U)
Iq
oO
*, 1
m
0 0 0 0 0 0 0ano Inqu n
sGifllU3v J jizquinK

PRC R-1459R-1
RELIABILITY ASSESSMENT
OF
TAIL SERVICE MASTS AT LAUNCH COMPLEX 39
Date: 24 May 1972
Observed Field Failure Rate
In Failures Per Thousand Hours
Of Installed Component Time
Prior to 15 October 1969
After 15 October 1969
0. 65
0. 11
Number of Relevant UCRs: 166 Currency:( 1) May 1971
(1)Date of latest UCR, run included in the assessment.
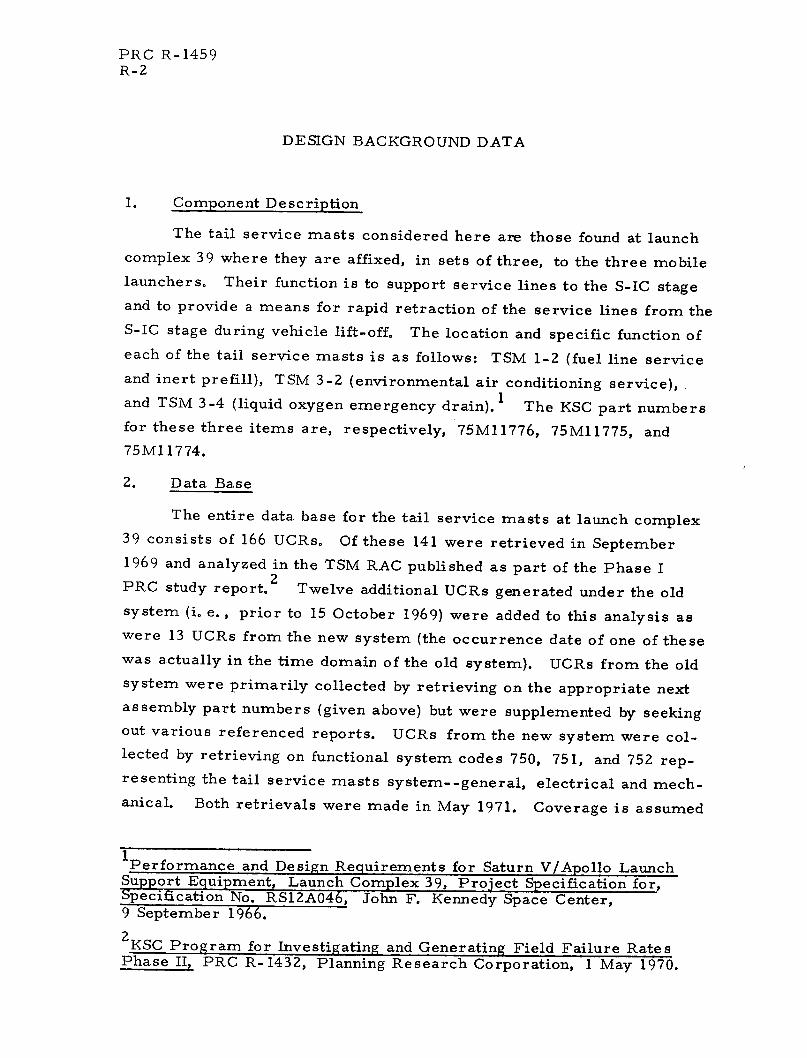
PRC R-1459R-2
DESIGN BACKGROUND DATA
1. Component Description
The tail service masts considered here are those found at launch
complex 39 where they are affixed, in sets of three, to the three mobile
launchers. Their function is to support service lines to the S-IC stage
and to provide a means for rapid retraction of the service lines from the
S-IC stage during vehicle lift-off. The location and specific function of
each of the tail service masts is as follows: TSM 1-2 (fuel line service
and inert prefill), TSM 3-2 (environmental air conditioning service),
and TSM 3-4 (liquid oxygen emergency drain). I The KSC part numbers
for these three items are, respectively, 75M11776, 75M11775, and
75M1 1774.
2. Data Base
The entire data base for the tail service masts at launch complex
39 consists of 166 UCRs. Of these 141 were retrieved in September
1969 and analyzed in the TSM RAC published as part of the Phase I
PRC study report.2
Twelve additional UCRs generated under the old
system (i. e., prior to 15 October 1969) were added to this analysis as
were 13 UCRs from the new system (the occurrence date of one of these
was actually in the time domain of the old system). UCRs from the old
system were primarily collected by retrieving on the appropriate next
assembly part numbers (given above) but were supplemented by seeking
out various referenced reports. UCRs from the new system were col-
lected by retrieving on functional system codes 750, 751, and 752 rep-
resenting the tail service masts system--general, electrical and mech-
anical. Both retrievals were made in May 1971. Coverage is assumed
1 Performance and Design Requirements for Saturn V/Apollo LaunchSupport Equipment, Launch Complex 39, Project Specification for,Specification No. RS12A046, John F. Kennedy Space Center,9 September 1966.
2 KSC Program for Investigating and Generating Field Failure RatesPhase II, PRC R-1432, Planning Research Corporation, 1 May 1970.

PRC R-1459R-3
to be complete for the old system and nearly so for the first year of
the new system. The two systems are not, however, considered to be
entirely compatible and hence are treated virtually in parallel in the
following paragraphs.
3. Engineering Analysis
Preliminary consideration of the data base results in some inter-
esting and sometimes contradictory, conclusions. The UCRs indicate
that there are nine individual TSMs bearing serial numbers 1001 through
1009, and that these nine TSMs are utilized for launch support in sets
of three. This can be clearly seen from Exhibit 1, where each short
vertical line represents one unsatisfactory condition of a particular
TSM at the date indicated. Launch dates and the mobile launcher uti-
lized are also indicated for vehicles AS-501 through AS-509. Note
that the TSM serial numbers and mobile launcher assignments are not
entirely consistent with the assumption of a permanent correspondence
between the two. The installation date of the new UCR system (15
October 1969) is indicated by a vertical dashed line as is the retrieval
date (15 May 1971) for this assessment.
The preliminary analysis indicates quite strongly that the unsatis-
factory conditions occurring prior to about April 1967 (on all TSMs)
reflect an initial acceptance or checkout situation of some kind rather
than an actual launch support role as is the case subsequent to that
date. The end of the initial acceptance and checkout is also indicated
by a vertical dashed line in Exhibit 1.
In general, the UCRs are quite complete although they are writ-
ten against a major item; that is, at a lower level than the TSM, and
IThis incompatibility is reflected more in the large reduction in UCRfrequency under the new system (a difference only partially explainedby increased TSM reliability and reduced utilization rate) than in anyinherent differences in the two systems (different UCR forms, forexample). The reduction in UCR frequency began prior to implemen-tation of the new system and continues; dividing the data into that gen-erated under the old and new systems is then seen to be essentiallyarbitrary.

PRC R-1459R-4
II
O;
0
II - -I
.j I
OD
II
: 4
4.4
I
m4 -
-_ _ _4
DI
_ w =_ - _
= -
(NOl [4301 -Nl H::ItRNlN 14I( lS WI0
U)
P-
U0
U0
Z0U
;:t-
U
C)
I
X
lH
x-
I
DI
11
4
I
0
z
0
-x
o
Om'D
N
N
O
rvO
m"O_
m
z
o
o
D -
_N
r
o
_
_ .-
DN
r,
_
L
I
IILII
IIaI
01
II
0z
z0
-x1II4I
i"~~~~~~~"
r
o Z
.
` I
. I
o ~ ~ ~~~~t
., I ~ ~ ~ ~ ,p
- -- - - - - - I . r - - -
"I~~~~~~~s
-I.,I ~ ~ ~ 0
-; O
.1 _
'o
.I I1
r~
I ~
.4-
11
11I
- _

PRC R-1459R-5
hence the impact of the reported condition on the TSM must be largely
deduced. The significance of the large reduction in UCR frequency
with time is somewhat obscured by the installation of the new UCR sys-
tem. Exhibit 2 is a tabulation of the number of UCRs (and failures) for
the three groups of TSMs by general time period and launch supported.
The number of failures is slightly larger than the number of UCRs be-
cause of multiple failures reported on a single UCR.
4. Component Populations
The engineering analysis indicates that there are a large number
of likely, or possible, tail service mast subpopulations. First, all the
data is divided into the three time periods indicated in Exhibits 1 and 2.
For each of these time periods the following populations may be consid-
ered: (1) all TSMs, i. e., 1 population consisting of 9 units, (2) each
individual TSM, i. e., 9 populations containing 1 unit each, and (3) TSMs
by location (3-2, 1-2, and 3-4), i. e., 3 populations with 3 units each.
In addition each set of three TSMs used in support of one launch may be
considered as a single population with three units. There are, there-
fore, 3 (1+9+3) + 10 = 49 potential populations to be assessed.
5. Component Times
There are no UCR time or age entries as such pertinent to the
TSMs. From the UCR occurrence date, however, a partial time pro-
file for each component above may be derived, much in the manner of
Exhibit 1. The component times for the TSMs in support of a particular
launch are derived by using the date of the first UCR prior to the given
launch (and after the immediately preceding launch using the same TSMs)
as a conservative approximation to its "date of installation" or start date.
The date of launch is taken as the end date. For all other populations
two estimates of component times are presented. The first is referred
to as "maximum" time and is derived as follows for the three time pe-
riods: for the installation and checkout period the maximum estimate
is the period from the date of the first recorded UCR (13 April 1966)
to 15 April 1967. The latter date is a rather arbitrarily assumed end

PRC R-1459R-6
_. ,
0 Ln 0
0 0 0 - '0
o '0 " ' U) '0
U)
,-
o _
' .--. . N
'~ . . 2 NZ- t O_ _a U' N
0 -
cf , 0 ' - 0 000)
C)0 0 000-4 000
CJ U) U] U) U) U)U) U) U)U)U)U)
O NN Un-4 C)
N 0)N
4i
on 9 ~·I n V N tI 0
) 000 00co L o o o o ooC oCoDo
H -4- -14 -~- -4-4-4
4ml ooo ooo oooEq _
v
U)
Eq
E-
U)
EH

PRC R-1459R-7
point to the installation and checkout process. The second period ends
with the installation of the new UCR system on 15 October 1969. The
final period ends with the date of the most recent UCR (24 February
1971).
The second set of estimates are referred to as minimum times
and are estimated by the elapsed time between the date of the first and
last UCR in each of the given populations. The time so derived is as-
sumed to apply to all units in the population. Exhibit 3 summarizes
the component times for all 49 populations rounded to the nearest 100
hours. Maximum times are listed only once for each period. Mini-
mum times are determined for each of the first 39 populations as are
singular component times for the 10 launch related populations.
On the basis of component times six of the potential 49 populations
may be eliminated from the analysis. These are TSMs 1001, 1002,
and 1003 in the third time period and TSMs 1007, 1008, and 1009 in
the initial or installation period.
6. Component Failures
In the course of the engineering analysis those UCRs which were
judged not to represent a TSM failure (under the most stringent inter-
pretation) were eliminated from the data base; multiple failures rep-
resented on a single UCR were separated in the preparation of Exhibit 2.
The resultant number of failures for each of the 43 potential populations
remaining after the component time analysis is given in Exhibit 4. Note
that nearly all of the restricted populations for the new UCR system in-
dicate fewer than four failures. Only the TSMs associated with AS-509
and TSM location 1-2 satisfy the four or more failure criteria for FFR
calculation. Borrowing a UCR from the old system enables AS-508 to
join this select group. Including AS-507 and excluding location 1-2
for reasons of inner group consistency results in four populations as-
sociated with the new UCR system. The population representing TSMs
associated with launch AS-510 is excluded because of the reasonable
expectation of its incurring additional UCRs not included in the data
base.

PRC R-1459R-8
Time Period' ~ ~ ~ ~
13 Api1966
Population
All TSM' s
TSM SerialNo. 1001 (3-4)
1002 (1-2)1003 (3-2)
100410051006
100710081009
(3 -4)(1-2)(3-2)
(3 -4)(1-2)(3-2)
TSM Location3-41-23-2
TSM' s in Supportof Launch
AS-501AS-502AS-503AS-504AS-505AS-506AS-507AS-508AS-509AS-510
ril 15 April1967
Installation
Min. Max.
8300 8800
17002500600
250032002600
100
740079008200
15 October1969
Old UCR System
Min. Max.
19800 21100
107001310013400
18001980016000
158001580015800
187001980018200
400040008600690030004000
New UCR
Min.
11800
24 February1971
System
Max.
11900
52006700
11400
270050001400
72008100
11400
2400540089008100.
Launch date subsequent to date of UCR retrieval.
EXHIBIT 3 - COMPONENT TIMES FOR LAUNCH COMPLEX 39 TAILSERVICE MASTS IN HOURS

PRC R-1459R-9
Time Period
13 April 15 April 15 October 24 February1966 1967 1969 1971
Population Installation Old UCR System New UCR System
All T SM' s 55 124 12
TSM SerialNo. 1001 (3-4) 10 17 *
1002 (1-2) 9 19 *1003 (3-2) 4 15 *
1004 (3-4) 9 11 11005 (1-2) 8 15 21006 (3-2) 10 5 2
1007 (3-4) * /18\** z"'1008 (1-2) 10 1 1(1009 (3-2) * 13/ 1/
TSM Location3-4 20 47' 31-2 17 13 (43-2 18 33 3
TSM's in Supportof Launch
AS-501 26AS-502 32AS-503 46AS-504 9AS-505 4AS-506 5AS-507 1 2AS-508 1 3AS-509 4AS-510 3
· These potential populations eliminated due to lack of component time data.One additional failure not attributable to a specific TSM within the groupof three is known to have occurred.
*** Two additional failures not attributable to specific TSMs within the groupof three is known to have occurred.
EXHIBIT 4 - DISTRIBUTION OF COMPONENT FAILURES FOR LAUNCHCOMPLEX 39 TAIL SERVICE MAST POPULATIONS

PRC R-1459R-10
For the old UCR system there are 19 populations including the
first six Apollo-Saturn launches. No potential populations are excluded
for lack of failure data.
All 10 populations in the initial or installation period with adequate
component times also have four or more failures, hence, each repre-
sents an admissible population.
7. Failure Classifications
Virtually all of the installation period failures associated with
TSMs 1001, 1002, and 1003 can be classified as TSM design failures
with 2/3 of the UCRs actually being written against the TSM itself.
For TSMs 1004 through 1009 there are only five design failures (about
3 percent of the total) and only one failure attributed to a TSM proper.
Of all TSM failures in the installation time period 42 percent
are design problems; the remainder are best classified as normal
service as are all the failures covered by the old and new UCR systems
subsequent to 15 April 1967.
Over half the TSM failures were generated by the following six
part types: regulators 75M11856 and 75M11859, transducers 75M11857
and 75M13108, and solenoid valve 75M11864.
On an overall basis,valves of all types contributed approximately
1/3 of the failures, regulators 1/6, transducers 1/8, hose assemblies
10 percent and all others about 25 percent. Those items which failed
most frequently in the installation and earlier operational periods are
not among those reported to have failed under the new UCR system.
This suggests that the earlier problems are in fact being resolved.
Exhibit 5 is a rather detailed classification of the TSM failures.
8. Field Failure Rates
The FFR' s for those selected subpopulations with adequate time
and failure data are shown in Exhibit 6. Only the maximum times from
Exhibit 3 have been utilized as these are considered to be more repre-
sentative of actual installation times.

PRC R-1459R-11
TAIL SERVICE MASTS
1001 1004 10071002 1005 1008
FAILURE 1003 1006 1009
Installation:TSM Design Problems 14TSM Normal Service 1Arm Assembly 5Hose & Line Assemblies 2 7Valves, Solenoid 5 2Valves, Other 1 4Hydraulic Cylinders 3Pressure Regulators 5 1Pressure Switches 2Miscellaneous 3
UCR System UCR System UCR SystemOld New Old New Old New
.Ope ration:Pressure Transducers
75M11857 5 5 575M13108 8 1
Pressure Regulators75M11859 6 4 275M11856 7 5Others 2 2
ValvesSolenoid
75M11936 1 3 775M11864 6 1 2Others 9 1 1 4 1
Others 4 3 4 6 2Hose & Line Assemblies 2 5 2Pressure Switches 2 1 2Hydraulic Cylinders 2Miscellaneous 6 2 3 1
EXHIBIT 5 - CLASSIFICATION OF TSM FAILURES

PRC R-1459R-12
Time Period
13 April1966
Population
All TSM' s
TSM SerialNo. 1001 (3-4)
1002 (1-2)1003 (3-2)
100410051006
100710081009
(3-4)(1-2)(3-2)
(3 -4)(1-2)(3-2)
TSM Location3-41-23-2
TSM' s in Supportof Launch
AS-501AS-502AS-503AS-504AS-505AS-506AS-507AS-508AS-509AS-510
Installation
0.694
1.1361.0230.454
1.0230.9091.136
0.7560.6440.682
15 April1967-F- -
15 October1969
Old UCR System
0.653
0.8060.9000.711
0.5210.7110.237
0.8530.4740.616
0.7420.6790.521
2.1672.6671.7830.4350.4440.417
24 February1971
New UCR System
0.112
0.4170.2470.150
*,: Insufficient data from which to calculate an FFR.
EXHIBIT 6 - FFR'S FOR LAUNCH COMPLEX 39 TAIL SERVICE MASTSIN FAILURES PER 1,000 HOURS PER TSM
:

PRC R-1459R-13
9. FFR Confidence Intervals
Assuming that the time to failure of TSMs is exponentially dis-
tributed, 90 percent confidence intervals for the estimates of popula-
tion FFRs may be calculated using Equation (1).
X2
(2r) X2- /(2r)
_________ 1 (1)< FFR < - 1 _(1)2T 2T
These intervals are presented in Exhibit 7 for each population.
10. Resolution of FFR Factors
A number of factors appear to be influential or potentially so on
the magnitude of TSM failure rates. A number of these will be investi-
gated briefly in this subsection.
The TSM location does not appear to have a strong influence on
field failure rate; however, the overall averages given below do indi-
cate the general tendency.
TSM Location FFR1
3-4 0.558
1-2 0.510
3-2 0.431
As can be seen from Exhibits 6 and 7 the decrease in FFR with
launch vehicle being supported is both persistent and dramatic indicating
that the reliability of this component is increasing steadily with time.
The differences in individual TSMs does not appear to be signifi-
cant or consistent.
While the difference between the new UCR system and the old UCR
system is highly significant it appears to be due more to a continued
reduction in UCR frequency over both systems rather than to any
characteristics unique to the new system.
1 All values in failures per TSM per 1,000 hours.
I

PRC R-1459R-14
Installation
Upper LowerConfidence Limit FFR Confidence Limit
All TSM' s 0.854 0.694 0.546No. 1001 1.784 1.136 0.619
1002 1.642 1.023 0.5341003 0.881 0.454 0.1551004 1.642 1.023 0.5341005 1.494 0.909 0.4521006 1.784 1.136 0.619
Location:3-4 1.057 0.756 0.5021-2 0.920 0.644 0.4113-2 0.966 0.682 0.441
Operation (OldUCR System)
All TSMs s 0 752 0.653 0.559No. 1001 1.152 0.806 0.514
1002 1.265 0.900 0.5901003 1.038 0.711 0.4381004 0.803 0.521 0.2911005 1.038 0.711 0.4381006 0.434 0.237 0.0931007 1.208 0.853 0.5521008 0.744 0.474 0.2581009 0.922 0.616 0.365
Location:3-4 0. 929 0.742 0.5731-2 0.858 0.679 0.5183-2 0.679 0.521 0.382
Operation (New UCRSystem): All TSJM' s 0.170 0.112 0.064
All TSM' s in Supportof Launch
AS-501 2.908 2.167 1.517AS-502 3.488 2.667 1.942AS-503 2.236 1.783 1.374AS-504 0.698 0.435 0.227AS-505 0.861 0.444 0.152AS-506 0.762 0.417 0.164AS-507 0.875 0.417 0 114AS-508 0.478 0.247 0,084AS-509 0.290 0.150 0.051
EXHIBIT 7 - CONFIDENCE INTERVALS FOR LAUNCH COMPLEX 39TSM'S IN FAILURES PER 1,000 HOURS PER TSM
AI

PRC R-1459S-I
RELIABILITY ASSESSMENT
OF
TELEVISION SYSTEM (OTV)
Date: 24 May 1972
Observed Field Failure Rate
In Failures Per Thousand Hours
Of Installed Component Time
Observed Repair Times, In Hours
Mean
Mean
Maximum
8. 27
0. 07
582
2, 031Number of Observations
91.9

PRC R-1459S-2
FAILURE MODES CONTRIBUTING TO
THE OBSERVED FIELD FAILURE RATE
AS A PERCENT OF THE TOTAL
Lo cation
a a
Alignmnent, Adjustment 0.3 5.8 0. 6.3_ ilast Damage 0.1 - 0.5 - 0.6
(arriera Remote Control PIroblem 0.6 0.2 0.9 0.3 2.0
( ;o)nhl)Ont l'robh lemi 0.5 0.3 4.3 1. I 6.2
,! sign, Modification, )verhaul 0.8 0.6 0.8 0.3 2.5
1",,c s, Disto rted (Outplut 1.3 1. 1 2.9 1.1 6.4
Inco'r rect Output 0.8 0.6 7.5 1.8 10.7
Inlope rative 1.3 1.0 3.7 2.4 8.4
Inte rn ittenit 0.9 0.5 1.3 0.5 3.2
o MAechanical Problem 0.8 0.4 2.2 0.3 3.7
Noi sy 1.4 0.8 4. 1 1.7 8.0
No Output 0.8 1.3 11.4 2. 3 15.8
No Video, Poor Video 1.5 1.1 2.8 1.6 7.0
Short Circuit 0.6 0.4 2.0 1.2 4.2
Sync, 'requency Response 0.9 0.6 3.6 0.7 5.8
Video, Horizontal or Vertical 1.4 1.1 2.7 1.6 6.8
(Other 0.3 - 1.5 0.6 2.4
'Total 14.3 10.0 58.0 17.7 100.0
Number of Relevant UCRs: 3,350 Currency:(1) April 1971
( 1 )Date of latest UCR run included in the assessment.

PRC R-1459S-3
DESIGN BACKGROUND DATA
1. Component Description
The television system includes all equipment used to visually
monitor operations in support of:
o Launch vehicle and spacecraft prelaunch activities or other
hazardous operations that cause an area to be uninhabitable.
o Administration such as public information activities and the
launch information exchange facility.
o General surveillance for security.
o Detection of dangerous hydrogen flame activity.
The equipment is located at launch complexes 34, 37, 39, and
in the industrial area as follows:
Launch complex 39 equipment (9TV001A) is located in the pad
terminal connection room 204 (PTC R ), the mobile service structure
room 102, and the launch control center (LCC) room lPl. The remote
viewing cameras are located in strategic places on the mobile launcher
(ML), the mobile service structure (MSS), and other areas within the
complex, such as the VAB, the launch pad, and various field locations
surrounding the pad.
Launch complexes 34 and 37 (4TV001A/7TV001A) control and
switching equipment is located on the first floor of the control center
The monitors are located in the firing room and operations management
room on the second floor. Cameras are located on the pad and surround-
ing areas, in the automatic ground control station (AGCS) computer room,
and in the launch control center.
Central instrumentation facility (CIF) equipment (2TV001A) is
located in a limited number of rooms on each of the three floors of the
building and the antenna facility to monitor the launch complex 39 area,
the Bell Telephone system, and the launch information exchange facility.
ISummarized from reference material.

PRC R-1459S-4
Spacecraft and industrial area equipment (ITV001A) is located
in the operations and checkout building, auditorium and training facility,
Kennedy Space Center headquarters building, hypergolic test areas 1
and 2, cryogenics areas 1 and 2, and environmental system test facility.
A simplified system block diagram is shown in Exhibit 1.
A typical camera/monitor configuration is shown in the block
diagram of Exhibit 2.
The camera is mounted to view the desired area and is connected
via cable to a camera control unit. A local/remote switch provides for
choice of local control of the camera for maintenance purposes, or re-
mote control for operation of the camera functions at a distance of up to
3,000 feet.
Video information is sent via rf cable to the receiver equipment
where it is demodulated and presented on a monitor. Patch panels and
switching provide flexibility in choice of cameras and monitors. Re-
mote control of the pan, zoom, and tilt cameras is accomplished from
the remote control panel in the launch control center communications
control room.
Audio communications capability is provided from each camera to
the camera control unit. Also, two-way communications is possible be-
tween the camera audio communication circuit and the remote control
panel. This is not connected into the operational intercommunications
system (OIS).
Synchronizing pulses are generated by a master sync generator
and distributed to all areas of the complex. A slave sync generator in
each area provides synchronizing pulses to each camera monitor chain
in the respective area. The master generator and each slave generator
are provided with a standby unit that is automatically switched into the
circuit when a failure is detected.
At launch complex 39, a fault alarm system provides visual and
aural cues at an alarm panel in the launch control center communica-
tions control room when abnormal conditions are present in the areas
monitor ed.

.)
-j
CD0-JmLL
0
PRC R-1459S-5
0 zt_ OS
co a
2
H
HF
z 2
UC
I
r4
oaz~ <:D< Fa: X
cD..-j
n,
I-
v :1

PRC R-1459S-6
I~ ~ I I z1 0
ma ccx i
I I rl-
Z~~~~~~~~~~~~I~
'mr- ~rC, 0~~~~~0
I 1 0I I' 0
I Hcc c
r, w H
0~~~~
D Oz -I G(~~I $
uI i <~ U<
,ram
0 0 <~ ~~~U0O.z'>- z Q
0 ~
II I ruO~~~~~~~~~~~~~~~~~~cI ~ ~~~~~~~~~o , :
_ N~~_m<
I I
I I
<~ Z- u n-r
<I I ICL _
Z I I IZ U 2i ac
0 0 Z
J~~~ U

PRC R-1459S-7
Unsatisfactory condition reports written prior to 15 October 1969
for failures occurring within the television system are referenced by
functional system code 34 and those written after 15 October 1969 are
referenced by functional system code 790.
2. Data Base
The data base consists of 3,348 UCRs written prior. to 15 October
1969 and two UCRs written after this date. The 3,348 UCRs were ob-
tained by retrieving all UCRs having a functional system code of 34 from
the "old" (i. e., UCRs written prior to October 1969) UCR master file.
The remaining two UCRs were obtained by retrieving all UCRs having
a functional system code of 790 from the "new" UCR master file.1
Nearly 300 UCRs had corresponding investigation and corrective action
reports (ICARs). These ICARs are also included in the data base.
3. Engineering Analysis
A sort by location of failure was made on the UCRs. The results
of this sort are presented below. Approxim.a.tely 60 percent of the fail-
ures occurred at launch complex 39.
Launch Complex Number of UCRs Percent of Total
34 468 14.0
37 319 9.5
39 2,006 59.9
All other locations 557 16.6
3,350
1These UCRs were actually written prior to 15 October 1969 and hence,are included in the data base. No other UCRs were retrieved sincethis responsibility now rests with INS QAL.

PRC R-1459S-8
For each launch complex a. plot of the number of UCRs per cal-
endar quarter was made. These plots are presented in Exhibits 3
through 6. Only nine UCRs have failure occurrence dates later than
the first quarter of 1969.
4. Component Populations
Four component populations were chosen, each representing one
launch complex. This was done so that the overall television system
failure rate could be considered by launch complex, i. e., by functional
subsystem. The launch complexes are: 34, 37, 39, and all remaining
locations grouped under the heading "other."
5. Installation Times
Component installation times were found by computing the num-
ber of days between the date of the first failure and the date of the last
failure from the component UCRs. The installation times are presented
below.
Location Time Period Days
LC-34 8/24/65 - 10/10/68 1,144
LC-37 1/7/66 - 5/17/68 861
LC-39 12/3/65 - 5/28/69 1,292
Other 9/8/65 - 3/11/69 1,280
All 8/24/65 - 5/28/69 1,373
6. Component Failures
Though a single UCR might report several part or module fail-
ures (e. g., three transistors, two capacitors, two printed circuit cards,
etc. ), only one failure has occurred against the television system itself--
the failure of some functional part in the television system. However,
in the television system, there are 318 cases in which two UCRs rep-
resent only one failure. The situation arises when a module of a tel-
evision system component is replaced with another module. Two UCRs

PRC R-1459S-9
12 0 --
100
80
60 _-
40
20
ALL1965
1 2 11966
3 47
2 11967
314 2
19
3
9684
CALENDAR QUARTER
EXHIBIT 3 - NUMBER OF UCRS PER CALENDAR QUARTER FORLAUNCH COMPLEX 34
U:
o
Orwm
z
0
II
I0
1-cl

PRC R-1459S-10
70
60
50
lJ 40
0
1 2 3 4 1 2 3 4 1 2
COMPLEX 37COMPLEX 37

PRC R-1459S-11
2 11968
3 4
CALENDAR QUARTER
EXHIBIT 5 - UCRS PER CALENDAR QUARTER FOR LAUNCHCOMPLEX 39
600 "'
-500 -
400 _-
uC-)
0Luo
z
300 -
200 -
100 --
ALL1965
ALL1966
1 2 3 41967
211969
I_ ~
I
I1 1

PRC R-1459S-12
Z
-o
00
0D 10 gl N 0
I-lD
Xr

PRC R-1459S-13
were written: one against the module failure and another UCR against
the piece part (capacitor, potentiometer, resistor, etc. ) that failed
within the module. Thus, the number of failures is equal to the number
of UCRs, 3,350, minus the number of repeated failures, 318. The num-
ber of failures per location is presented below.
Location Number of Failures
LC-34 433
LC-37 304
LC-39 1,755
Other 540
All - 3,032
7. Failure Classification
Over 96 percent of the UCRs had failures that could be classified
as "normal service, design problem failures occurred on 2.3 percent
of the UCRs and the remaining UCRs had quality and operation and main-
tenance failure causes.
For each location, the UCRs could be further divided into five
component types:
o Amplifiers
o Cameras and camera associated equipment
o Modulators/demodulators
o Monitors
o Miscellaneous
Exhibit 7 presents the number of failures for each location and com-
ponent type. Amplifiers, cameras, and camera associated equipment
account for 61 percent of all failures in the television system.
l"Normal service" applies to all conditions which arose as the resultof normal field operation or for which insufficient information is avail-able to assign it to other categories.

PRC R-1459S-14
EXHIBIT 7 - NUMBER OF FAILURES PER LAUNCH COMPLEXAND TELEVISION SYSTEM COMPONENTS
It should be noted that modulator/demodulator failures occurred
only in launch complex 39. It is not known for other locations if there
were any modulator/demodulator failures or if these components were
included under another component name.
All failures were classified Ly the reported modes of failure.
These failure modes and their descriptions are:
o Alignment, adjustment - needed alignment or adjustment;
could not be aligned or adjusted.
o Blast dana.ge - damaged as a result of launch blast,
o Camera remote control problem - failures in remote control
of cameras, e. g., no pan, no tilt, no zoom, sluggish
response, etc.
o Component - failure of a. piece part in an equipment; used
only when no other failure mode was evident on the
UCR except for a. failed piece part.

PRC R-1459S-15
o Design, modification, overhaul - failure is a problem that
should be or should have been corrected by design
action; or parts replaced under a modification or over-
haul action.
o Focus, distorted output - video image is not clear; distorted
picture; output has incorrect waveform.
o Incorrect output - output too high or too low.
o Inoperative - component inoperative; used when no further
failure mode description is available.
o Intermittent - component output intermittent.
o Mechanical problem - covers any failures that are mechanical
such as any fractures, cracked cases, missing mount-
ing fixtures, gears broken, etc.
o Noisy - component output is noisy or causes noise to exist
in other components.
o No output - component has no output; does not include video
output.
o No video, poor video - no, or poor video display.
o Short circuit - short circuit.
o Sync, frequency response - component out of sync, no sync;
component exhibits poor, or no frequency response.
o Video horizontal or vertical - failure results in vertical or
horizontal circuit problems.
o Other - all other failure modes.
Exhibits 8 through 11 presentthe number of failures by location
for these failure modes. Each location has a different distribution of
failures by failure modes.
Over 70 percent of the UCRs had failures that required the replace-
ment of piece parts such as transistors, capacitors, motors, vidicons,
etc. The number of UCRs per location reporting the replacement of
piece parts is as follows:

PRC R-1459S-16
Failure Mode Components Total
Alignment, Adjustment 1.2 1.1 3.3 4.2 0.1 9.9
Blast Damage - 1.5 - - 1.5
Camera Remote Control - 0.9 - - 0.9
Component 4.3 3.1 0.1 - 0.1 7.6
Design, Modification, Overhaul 0.3 1.0 - - 0.1 1.4
Focus, Distorted Output - 1.4 1.9 1.7 - 5.0
Incorrect Output 6.5 1.9 4.1 0.1 0.3 12.9
Inoperative 1.7 2.0 0.5 1.1 0.9 6.2
Intermittent 0.9 0.6 0.5 0.1 0.1 2.2
Mechanical 00 9 1.7 0.2 0.1 1.0 3.9
Noisy 1.9 2.1 2.4 0.6 0.2 7.2
No Output 11.9 1.4 2.3 3.8 0.3 19.7
No Video, Poor Video - 2.2 - 2.7 - 4.9
Short Circuit 0.9 1.6 0.1 0.7 0.2 3.5
Sync, Frequency Response 1.9 0.6 3.4 0.3 - 6.2
Video, Horizontal or Vertical - 0.7 - 3.8 - 4.5
Other 1.7 - 0.3 0.2 0.3 2.5
Total | 34.1 j 23.8 19.1 ] 19.4 3.6 j 100
EXHIBIT 8 - COMPONENT FAILURE MODES FOR LAUNCH COMPLEX 39(PERCENT)
I

PRC R-1459S-17
co
1
I
, QZL fC."
14S UO(T 9/
I
o
0/ICr
JI (I
I-7
Failure Mode
0.3
2.0
3.0
4.9
3.9
1.6
4.3
2.0
2.6
3.6
3.9
4.9
1.0
1.0
5.9
0.3
0.7
0.3
2.0
3.3
6.2
10.8
5.5
10.2
5.3
3.5
8.2
12.8
10.8
4.2
5.6
11.3
TotalComponents
Alignment, Adjustment
Blast Damage
Camera Remote Control
Component
Design, Modification, Overhaul
Focus, Distorted Output
Incorrect Output
Inoperative
Inte rmittent
Mechanical
Noisy
No Output
No Video, Poor Video
Short Circuit
Sync, Frequency Response
Video, Horizontal or Vertical
Other
Total 132.8 44.9 _ 20.7 J 1.6 100
1.0
4.3
3.9
3.6
3.3
0.3
3.9
5.3
3.3
0.6
3.3
0.3
2.6
1.6
0.3
0.7
3.3
2.6
2.6
1.3
5.4
0.3
EXHIBIT 9 - COMPONENT FAILURE MODES FOR LAUNCH COMPLEX 37(PERCENT)
IL��J.
.3

PRC R-1459S-18
Failure Mode
Alignment, Adjustment
Blast Da.mage
Camera Redmote Control
Component
Design, Modification, Overhaul
Focus, Distorted Output
Incorrect Output
Inoperative
Intermittent
Mechanical
Noisy
No Output
No Video, Poor Video
Short Circuit
Sync, Frequency Response
Video, Horizontal or Vertical
Other
/.,
0
., ,
0.2
0.9
4.4
2.8
1.6
4.8
0.5
2.5
1.8
4.6
3.7
1.4
4.8
0.5
1.2
5.3
1.2
0.5
0.7
1.8
1.8
1.6
0.7
0.2
1.2
1,6
1.8
2.1
1.8
3.7
0.9
/CO4
0?
I I0
co
4i
c @
TotalComponent
2. 1
0.5
2.8
2.5
3.5
4.8
3.5
4.6
2.1
3.7
1.4
3,2
0.5
0.2
Total 35.4 42.2 20.4 2.0 100
0.5
0. 5
.5
0.5
2.3
0.9
4.4
3.8
5.6
9.1
5.8
9.4
6.0
5.3
9.5
5.6
10.3
4.0
6.2
9.5
2.3
EXHIBIT 10 - COMPONENT FAILURE MODES FOR LAUNCH COMPLEX 34(PERCENT)
_ _-
7
Io

1.5
1.1
3.3
0.4
1.5
4.4
4.4
1.5
0. 7
1.5
5.4
4.4
5.9
1.7
6.3
1.3
PRC R-1459S-19
o, 1$~~~~~~A?/I £.)
0)
AA*1'7 'S .coNIF -A/~ Q
7
;,
0NNO G /
Failure Mode s
Alignment
Blast Damage
Camera Remote Control
Component
Design, Modification, Overhaul
Focus, Distorted Output
Incorrect Output
Inoperative
Intermittent
Mechanical
Noisy
No Output
No Video, Poor Video
Short Circuit
Sync, Frequency Response
Video, Horizontal or Vertical
Other
Total 1 27.4 23.3 43.8 5.5 100
EXHIBIT 11 - COMPONENT FAILURE MODES FOR OTHER LOCATIONS(PERCENT)
2.2
4.1
4.4
0.4
0.2
5.2
5.4
1.1
0.2
1.3
0.7
0.7
1.7
1.5
0.7
1.9
0.4
3.9
1.1
0.6
2.2
1.3
3.7
0.6
0.7
1.5
1.5
0.4
0.7
1.5
0.7
0.4
0.6
0.6
0.4
0.2
1.1
1.7
6.3
1.5
6.3
10.4
13.4
3.0
1.9
9.5
12.7
9.2
6.7
4. 1
8.5
3.7
r
/Components Total

PRC R-1459S-20
Location
LC-34
LC-37
LC -39
Other
All
Number of UCRs WithPiece Part Failures
382
251
1,348
432
2,413
Percentof Total
82
78
67
78
70
Exhibit 12 presents the number of UCRs indicating replacement of
pa rticular piece parts. (It does not give the total number of piece parts
replaced. )
8. Field Failure Rates
Field failure rates for the television system populations were com-
puted by dividing the total number of failures by the total installation time.
The resulting failure rates are presented below.
Loc ation
LC-34
LC-37
LC-39
Other
All
Field Failure Rate(Failures/1,000 Hours)
15.8
14.7
56.7
17.5
91o9
9. FFR Confidence Intervals
It was assumed that each location had an exponential distribution
of times to failure. Based on this assumption the 90-percent confidence
intervals were computed and are presented as follows!

PRC R-1459S-21
Location
Piece Parts LC-34 LC-37 LC-39 Other Total
Capacitor 134 88 521 168 911
CRT 10 6 62 19 97
Connector 3 2 5 1 11
Diode 24 31 64 28 147
Faceplate 6 1 21 - 28
Fuse 17 13 53 10 93
Inductor 7 5 6 7 25
Lamp 6 1 97 3 107
Lens 3 1 33 1 38
Module 21 7 35 4 67
Motor 12 9 7 12 40
O Ring 10 1 7 - 18
Photocell - - 58 - 58
Relay 2 - 6 - 8
Resistor 50 29 74 43 196
SCR 2 - 6 - 8
Switch 3 7 6 1 17
Transformer 10 9 16 17 52
Transistor 104 80 402 98 684
Tube 44 34 40 12 216
Vidicon 28 12 53 12 105
Wiring 17 12 26 4 59
Yoke 3 1 9 5 18
Miscellaneous 17 15 72 4 108
EXHIBIT 12 - NUMBER OF UCRS INDICATING REPLACEMENTOF PIECE PARTS

l:'RC R-1459S-22
Failure Rate(Failures/1,000 Hours)
Uppe r Linit
17,0
16. 1
58.8
18.8
9403
Mean Lower Limit
15.8
14.7
56.7
17.5
91.9
14.5
13.4
54.4
16.3
89.4
10. Resolution of FFR Factors
The FFR for launch complex 39 was more than three times that of
the other locations. Fifty-eight percent of all failures at launch complex
39 were attributed to amplifier and cameras and camera-associated
equipment. These two component types represented 78 percent of the
field failure rate on launch complex 34, 78 percent on launch complex 37,
and 50 percent for all other locations.
The table below presents the individual contribution to the field
failure rate for five component types.
Su bpopulation
Amplifiers
Cameras & CameraAs sociated Equipnment
Modulato r s /Demodulato r s
Monitors
Miscellaneou s
Total
LC-34
5.6
6.7
3.2
0.3
15.8
LC-37
4.8
6 7
3.0
0.2
14.7
LC-39
19.3
13.5
10 7
11.1
2. 1
56.7
Other
4.9
4.1
7.8
0.9
17.5
11. Repair Times
Repair time data were provided on 65 percent of the UCRs. These
data provide the results presented (in hours) in the following table. The
mean repair time for launch complex 39 is approximately one-half that
of the other locations.
L) c: ati on
LC-34
LC -37
LC- 39
Other
All

PRC R-1459S-23
The maximum total time-to-repair is largely due more
for repair parts, than to actual repair of the equipment.
to waiting
Minimum
6 min.
5 min.
4 min.
5 min.
4 min.
Mean Maximum
11.61 501
10.96 432
6.56 120.25
9.99 582.2
8.27 582.2
Number ofObservations
357
257
976
341
2,031
Location
LC-34
LC-37
LC-39
Other
All
Pe rcentof
UCRs
82
85
56
63
67

PRC R-1459T-1
RELIABILITY ASSESSMENT
OF
WATER SYSTEM
Date: 24 May 1972
Observed Field Failure Rate
In Failures Per Thousand Hours
Of Installed Component Time
Prior to 15 October 1969 10.1
After 15 October 1969 2. 80
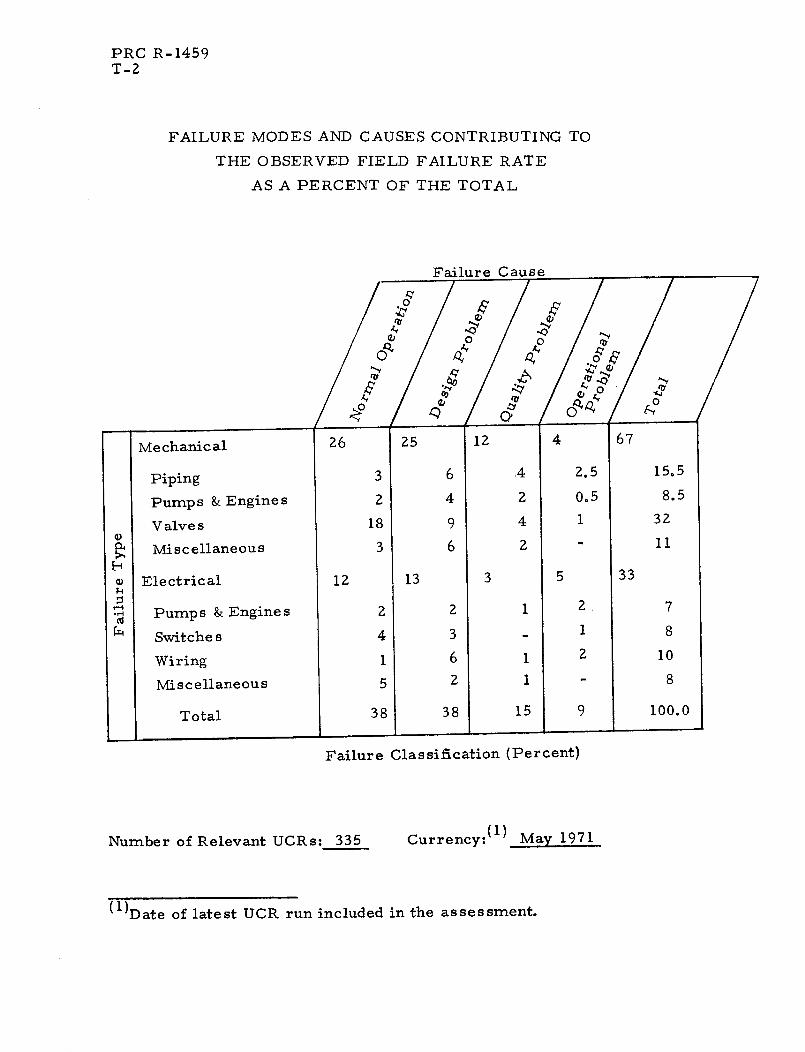
PRC R-1459T-2
FAILURE MODES AND CAUSES CONTRIBUTING TOTHE OBSERVED FIELD FAILURE RATE
AS A PERCENT OF THE TOTAL
Failure Classification (Percent)
Number of Relevant UCRs: 335 Currency: ( 1 ) May 1971
( 1 Date of latest UCR run included in the assessment.

PRC R-1459T-3
DESIGN BACKGROUND DATA
1. Component Description
The water system includes all equipment used to supply water
for use at launch complexes 34, 37, and 39 and associated areas
except that used for the potable water supply. Thus, all unsatisfactory
condition reports (UCRs) written against functional systems 10 and 68
(industrial water system and water quench system) before 15 October
1969 and all UCRs written against functional systems 840, 841, 842 and
843 (firex water system, industrial water system, water control
system and pump station water) after 15 October 1969 are included in
the assessment.
The water system is designed to provide water for use in testing,
fire control, and cooling at launch.
2. Data Base
The water system data base consists of 335 unsatisfactory
condition reports. Three hundred and three of these were written
prior to 15 October 1969 and 32 afterwards. The time period covered
by these data is from May 1965 to January 1971. Approximately 75
percent of the UCRs have associated investigation and corrective
action reports (ICARs); these are also included in the data base.
3. Engineering Analysis
The number of UCRs written per calendar quarter are shown in
Exhibit 1. From the first quarter of 1968, the number of UCRs has
steadily decreased. A further drop in UCR frequency occurs after
installation of the new UCR system (15 October 1969).
Exhibit 2 presents the number of UCRs written by associated
functional system and launch complex. Eighty percent of the UCRs
occurred at launch complex 39, 11 percent at launch complex 37 and
5 percent at launch complex 34.
Ninety percent of the UCRs were written against functional systems
10 and 68 while only 10 percent of the failures were written against
functional systems 840 through 843. (Functional systems 10 and 68
represent UCRs written before 15 October 1969 and functional systems

PRC R-1459T-4
:Da
I"
,_ c..
s~ofl jo a aqxn 7
I4 -, N [
NI Z
I X I E N- 4- z
N Csu zn jo laqumN-
0~~~~w L C4 C4 ~' ~SHDD. JO .xaqtun ~ ~ ~ ~ ~~c

PRC R-1459T-5
EXHIBIT 2 - WATER SYSTEM UCRs BY LOCATION AND FUNCTIONAL-SYSTEM
Functional System
Location 10 68 840 841 842 843 Total
LC-34 17 19 36
LC-37 1 14 15
MSS 2 8 3 13
ML-1 6 3 9
ML-2 4 1 5 10
LC-39 A 33 18 3 9 1 64
LC-39 B 10 14 3 27
LC-39 25 111 5 5 146
Other 4 5 1 3 2 15
Total 102 193 1 14 24 1 335
Functional
10
68
840
841
842
843
Sy stem
Water Quench
Industrial Water
Control System Water
Firex Water
Industrial Water
Pump Station Water

PRC R-1459T-6
840-843 after that date. Also, 58 of the 102 UCRs written against the
water quench system were considered as part of the industrial water
system based on information contained in the UCR (i. e., UCRs
from functional systems 840-843).
Seven of the "new" UCRs had occurrence dates prior to 15 October
1969. These UCRs are included in the data base for "old" UCRs (i. e.,
functional systems 10 and 68).
4. Component Populations
The water system data base may be divided into two subpopulations:
(1) those UCRs considered to be from the "old" UCR system; and (2)
those UCRs from the "new" UCR system. The first subpopulation
consists of 295 UCRs originally from the "old" system plus 8 UCRs
from the "new" system (303 total). The "new" subpopulation comprises
40 UCRs minus 8 that should be in population 1 (32 total).
5. Component Time
No UCR age or time entries refer specifically to the water
system. The UCR entries are written against the particular component
that failed and not against the water system. The component time,
therefore, was assumed to extend from the date of the first UCR in
19661 (17 January) to 15 October 1969. This time is 1, 367 days. The
component time for the new UCR system is 476 days, from 15 October
1969 to the occurrence date of the most recent UCR 3 February 1971.
6. Component Failures
There were 331 failures on 303 UCRs for the old system and 32
failures on 32 UCRs for the new system. Twelve failures on the old
UCR system occurred previous to 1966. These are not included in
failure rate calculations because of lack of water system data at that
time. Thus, there are 319 failures associated with the first population
and 32 with the second.
1UCRs occurring in 1965 were not included because this time periodrepresents the start of the UCR system and water system data from1965 may not be complete.

PRC R-1459T-7
7. Failure Classifications
The water system failures may be classified as electrical or
mechanical. They may be further classified by failed part type;
e.g., valves, piping, switches, etc. Exhibit 3 presents the number
of UCRs and failures by these classifications.
Exhibit 4 assigns failure causes to each of the failure classifi-
cations. The explanations for failure causes are:
o Normal operation - Includes all failures which
arise as a result of normal field operation or for
which insufficient information is available to assign
it to any other category.
o System design - A fault which is inherent in, and
can be corrected by, the water system design.
o Quality - Implies a fault which is neither inherent
in the design nor the result of normal (or abnormal)
operation. It is generally a manufacturing problem
such as missing valve parts or no initial lubrication.
o Design due to corrosion - A fault which is inherent
in, and can be corrected by, the system design in
respect to a corrosive environment.
o Operation and maintenance - Implies that the failure
was caused or exacerbated by the misuse of water
system components on the part of operating or main-
tenance personnel.
o Construction error - Implies a failure of the water
system due to errors in construction. This category
is used for the electrical system for errors in
wiring due to construction personnel or construction
drawing errors.
The predominant failure causes are normal operation and system design
problems which account for over 65 percent of all reported failures.
Exhibit 5 shows that electrical failures caused by design problems
virtually disappeared after the fourth quarter of 1968; mechanical
failures caused by design problems continue at a rate of nearly one
per month.
C I

PRC R-1459T-8
EXHIBIT 3 - NUMBER OF WATER SYSTEM ELECTRICAL ANDMECHANICAL FAILURES
Piping
Pumps & Engines
Valves
Miscellaneous, Mechanical
Total, Mechanical
Old UCR System
UCRs Failures
49 55
25 28
97 105
28 28
199 216
New UCR System
UCRs Failures
2 2
1 1
10 10
9 9
22 22
Pumps & Engines
Switches, Electrical
Wiring
Miscellaneous, Electrical
Total, Electrical
18 21 3 3
26 27 2 2
34 35 -
26 32 5 5
104 115 10 10
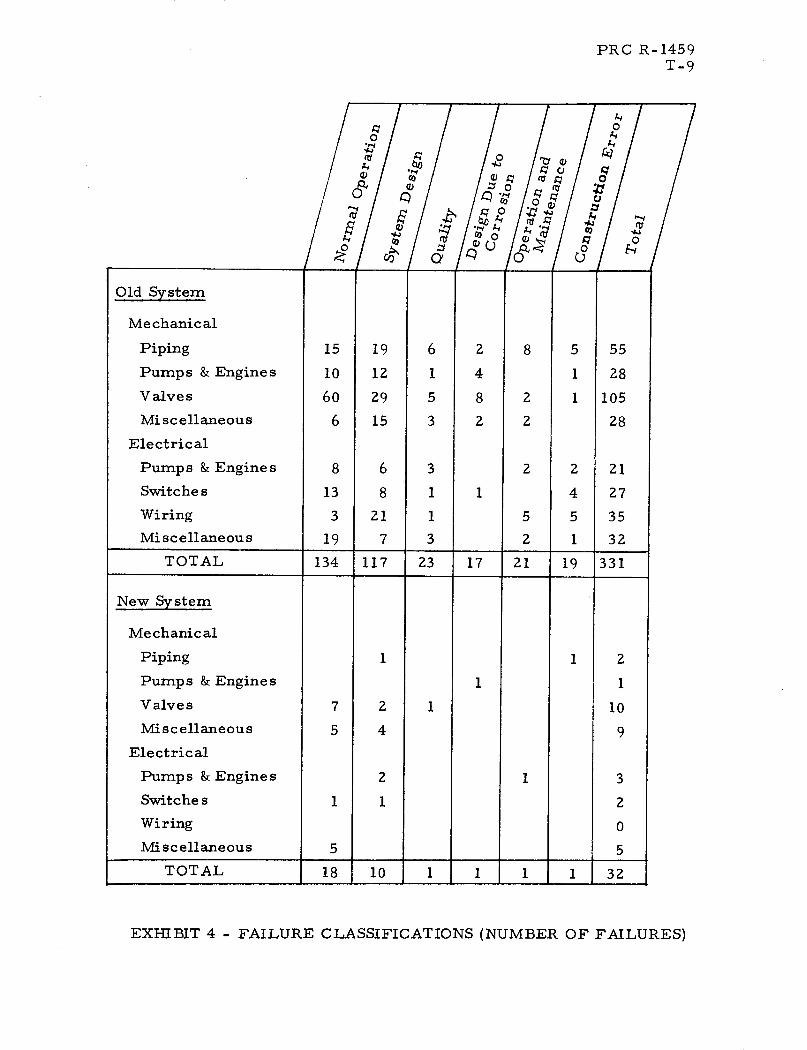
6
1
5
3
8
2
2
PRC R-1459T-9
cI ,
X
'N
1/0
Co
t / / /e1& iQXc o l
CO ' 4 ~," $ 'dco t
z 0C~~, -a - U~
0
A.,
A.,
0'N
Co
Od 00
0 -C)
Old System
Mechanical
Piping
Pumps & Engines
Valves
Miscellaneous
Electrical
Pumps & Engine s
Switche s
Wiring
Mi scellaneou s
TOTAL 134 117 23 17 21 19 331
New System
Mechanical
Piping 1 1 2
Pumps & Engines 1 1
Valves 7 2 1 10
Miscellaneous 5 4 9
Electrical
Pumps & Engine s 2 1 3
Switche s 1 1 2
Wiring 0Miscellaneous 5 5
TOTAL 18 10 1 1 1 1 32
8
13
3
19
6
8
21
7
3
1
1
3
1
2
5
2
21
27
35
32
EXHIBIT 4 - FAILURE CLASSIFICATIONS (NUMBER OF FAILURES)
I
-A
-I- --L- I- I
15
10
60
6
19
12
29
15
2
4
8
2
5
1
1
2
4
5
1
55
28
105
28

PRC R-1459T-10
-4
ON
i A oH I'* 00
-4
Cr\
as N *
I
-4 -4
- N
.10
0NN I N
- I N
+ I +
oo e - ONO9
-N N
N
r0
Ne N N
NO
ON N
.4N eC) -
-4l -4 N
-4
C)'4 (
co V.14 1,
;q (
'o.
:.
CY
0U)
UO
0
U)
r5
f3:
I I
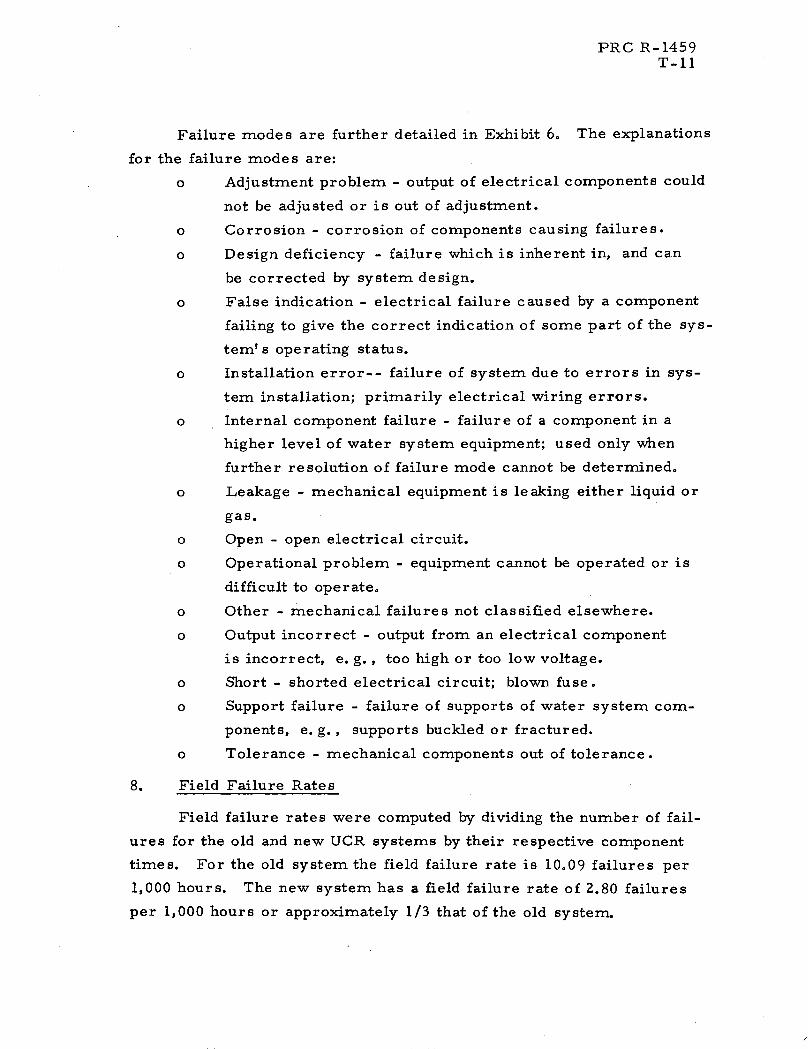
PRC R-1459T-ll
Failure modes are further detailed in Exhibit 6. The explanations
for the failure modes are:
o Adjustment problem - output of electrical components could
not be adjusted or is out of adjustment.
o Corrosion - corrosion of components causing failures.
o Design deficiency - failure which is inherent in, and can
be corrected by system design.
o False indication - electrical failure caused by a component
failing to give the correct indication of some part of the sys-
tem' s operating status.
o Installation error-- failure of system due to errors in sys-
tem installation; primarily electrical wiring errors.
o Internal component failure - failure of a component in a
higher level of water system equipment; used only when
further resolution of failure mode cannot be determined.
o Leakage - mechanical equipment is leaking either liquid or
gas.
o Open - open electrical circuit.
o Operational problem - equipment cannot be operated or is
difficult to operate.
o Other - mechanical failures not classified elsewhere.
o Output incorrect - output from an electrical component
is incorrect, e. g., too high or too low voltage.
o Short - shorted electrical circuit; blown fuse.
o Support failure - failure of supports of water system com-
ponents, e. g., supports buckled or fractured.
o Tolerance - mechanical components out of tolerance.
8. Field Failure Rates
Field failure rates were computed by dividing the number of fail-
ures for the old and new UCR systems by their respective component
times. For the old system the field failure rate is 10.09 failures per
1,000 hours. The new system has a field failure rate of 2.80 failures
per 1,000 hours or approximately 1/3 that of the old system.

PRC R-1459T-12
a. Electrical Failures
CD
CO I
a4~_aI)
Failure Mode Old UCR
F C0Z 0ap aa
aC~' CJ .703 t"W $ o Iiz 4' ~
New UCR.IfAdjustment Problem 2 3 5 2 2
Corrosion 5 3 8
Design Deficiency 3 6 6 3 18 2 1 3
False Indication 3 3 2 2
Installation Error 3 2 14 1 20
Internal Component Failure 9 4 9 9 31 1 1 3
Open 1 1 1 3
Operational Problem 2 9 11
Output Incorrect 8 8
Short 1 2 5 8
TOTAL 21 27 35 32 115 3 2 0 5 10
b. Mechanical Failures
EXHIBIT 6 - FAILURE MODES

PRC R-1459T-13
9. FFR Confidence Intervals
For the old UCR system, assuming an exponential distribution of
failure times, the FFR confidence intervals (per 1,000 hours) are:
Upper 11.40
Lower 8.83
For the new UCR system under the same assumption the FFR
confidence intervals (per 1,000 hours) are:
Upper 3.66
Lower 2.04
10. Resolution of FFR Factors
There are approximately twice as many mechanically related
failures as there are electrical failures. Normal service accounts
for 40 percent of all old UCR failures and 56 percent of all new UCR
failures. Failures caused by system design problems represented
35 percent of all old UCR failures and 31 percent of all new UCR
failures. An FFR breakdown by source is given in Exhibit 7.
/

PRC R-1459T-14
EXHIBIT 7 - FFRs (PER 1,000 HOURS) FOR SUBCLASSIFICATIONS
Old UCR System New UCR System
Mechanical
Piping 1.68 0.18
Pumps & Engines 0.85 0.09
Valves 3.20 0.87
Miscellaneous 0.85 0.78
Total 6.58 1.92
Electrical
Pumps & Engines 0.64 0.26
Switches 0.82 0.18
Wiring 1.08 --
Miscellaneous 0.97 0.44
Total 3.51 0.88

PRC R-1459III- 1
III. BASELINE UCR DATA
This section gathers in one place those reliability elements most
commonly sought for selected portions of the ground support equipment
under KSC design cognizance. These elements include field failure
rates and associated confidence factors, classification of the failures
as to cause and mode, and finally, certain repair time statistics. This
section includes data from UCRs written prior to 15 October 1969.
These data are called baseline data but only because they are so much
more numerous than data subsequent to 15 October 1969. Reliability
elements from the latter data are deferred to Section IV.
The reliability elements are collected into a number of exhibits
each of which will be discussed shortly. At this point, however, it is
strongly urged that any nontrivial use of the data of this section, or the
next one, be made only after reasonable familiarity is gained with the
appropriate RAC of Section II. Each RAC (reliability assessment of a
component) contains all information gained from the UCR system with
respect to the component' s reliability. The FFR or a particular clas-
sification might be qualified in a way that can only be reported in the
RAC itself.
A. Field Failure Rates and Confidence Factors
Exhibit 2 presents all baseline FFRs generated to date on the
various elements of the KSC ground support equipment. The exhibit
is divided into three major sections. The first represents FFRs for
piece parts, the second FFRs for subsystems, and the third for sys-
tems. In this handbook the distinction between these three levels of
equipment is not hard and fast. Piece parts are generally small, rel-
atively high population items found in many if not all functional systems.
A subsystem is generally a collection of piece parts that is still an in-
tegrally functioning unit. A system is generally a collection of subsys-
tems and is often not particularly well defined in terms of constituent
hardware. The examples included under each heading in Exhibit 2

PRC R-1459III-2
EXHIBIT 2 - BASELINE FIELD FAILURE RATES FOR JOHN F.KENNEDY SPACE CENTER GROUND SUPPORTEQ UIPMENT
ConfidenceComponent FFR ( I ) Factor(2 )
A. Piece Parts
1. Batteries 0.108 9
2. Cable Assemblies
Mechanical 0.059 14
Electrical 0.125 80
3. Capacitors 0.072 122
4. Circuit Breakers 0.062 93
5. Connectors 0. 134 25
6. Pressure Switches 0.10 50
7. Regulators
Part No. 75M50165-13 0.18 13
Part No. 75M08410-1, -lB 0.48 8
Part No. 75M50305-1 0.15 5
Part No. 75M04839-4, -1 0.45 5
Part No. 75M11856 1.54 4
With Inlet Pressure>3,000 psi 0.23 42
With Inlet Pressure<750 psi 0.13 12
Intermediate Inlet Pressures 0.20 15
Electromechanical Regulators 0.16 20
8. Relays 0.09 93
9. Solenoid Valves 0.19 76
Notes: (1) Field failure rate (FFR) is given in failures per unit per1,000 hours.
(2) Number of failures upon which the FFR is based. To convertto a statistical 90-percent confidence interval see the text(Section III. A) and Exhibit 3.

PRC R-1459III-3
EXHIBIT 2 (Continued)
ConfidenceComponent FFR( 1 ) Factor(2 )
B. Subsystems
1. Amplifiers
Compo site 0.150 215Television Functional System
Switching Amplifier(3207, A1-A5) 0. 167 29
Switching Output Amplifier(B05390D) 1.63 9
Insert Amplifier 3207-A12 0.285 14
Video Dist. AmplifierD5864A, DA6lPA 0.226 8
Pulse Dist. Amplifier5841A, 3202 0.149 4
A6C/DA: AG7394A 0.346 9OIS-RF Functional System
Audio IF Amplifier758-0081-001 0.199 40
OIS-Audio Functional System
Headset PCB: 24620496 0.307 11
AIA PC Card: C0O-0046 0.284 9
Mike PCB: 24620492 0.176 6Measuring Functional System
Blue or Red Amplifier 173930 0.115
Amplifier 723397-1 0.0709 10
Amplifier 356355-1 0.0579 7Amplifier 356410-7 0.0512 7
Range Instrumentation Func-tional System
Multiplexer Amplifier20010, 20011 0.129 38
Notes: (1) Field failure rate (FFR) is given in failures per unit per1,000 hours.
(2) Number of failures upon which the FFR is based. To convert to astatistical 90-percent confidence interval see the text (Section III. A)and Exhibit 3.

PRC R-1459III-4
EXHIBIT 2 (Continued)
Component
2. Compressors
3. Holddown Arms
Launch Complex 39
Launch Complex 37
Launch Complex 34
4. Pump Assemblies
5. RF Carrier Demodulator(DSC-39-W)
6. RF Carrier Modulator(MSC-39-W)
7. RF Line Repeater Amplifier(ASC-39-W)
FFR0)
0.117
0.348
0.416
0.712
0.129
0.409
0.831
0.537
ConfidenceFactor(2 )
38
19
6
6
44
51
55
9
8. Tail Service Masts at LaunchComplex 39
Compo site
Serial No. 1001
Serial No. 1002
Serial No. 1003
Serial No. 1004
Serial No. 1005
Serial No. 1006
Serial No. 1007
Serial No. 1008
Serial No. 1009
(Location
(Location
(Location
( Location
(Location
(Location
( Location
( Loc ation
(Location
3 -4)
1-2)
3-2)
3 -4)
1-2)
3-2)
3 -4)
1-2)
3-2)
TSMs at Location 3-4
TSMs at Location 1-2
0.653
0.806
0.900
0.711
0.521
0.711
0.237
0.853
0.4 74
0.616
0.742
0.679
124
17
19
15
11
15
5
18
10
13
47
13
Notes: (1) Field failure rate (FFR) is given in failures per unit per 1,000hours.
(2) Number of failures upon which the FFR is based. To convertto a statistical 90-percent confidence interval see the text(Section III. A) and Exhibit 3.

PRC R-1459III-5
EXHIBIT 2 (Continued)
Component
TSMs at Location 3-2
TSMs in Support of LaunchAS 501
TSMs in Support of LaunchAS 502
TSMs in Support of LaunchAS 503
TSMs in Support of LaunchAS 504
TSMs in Support of LaunchAS 505
TSMs in Support of LaunchAS 506
C. Systems
1. RF Instrumentation
At Launch Complex 39
At Launch Complex 37
At Launch Complex 34
At Other Locations
2. Television System (OTV)
At Launch Complex 39 --Compo site
Amplifiers
Cameras and AssociatedEquipment
Modulator s/Demodulators
Monito r s
Miscellaneous
FFR(1 )
0.521
2.167
2.667
1.783
0.435
0.484
0.417
0.68
1.02
0.80
0.23
86.7
19.3
13.5
10.7
11.1
2.1
ConfidenceFactor(Z)
33
26
32
46
9
4
5
11
5
17
6
1,755
598
418
331
343
65
Notes: (1) Field failure rate (FFR) is given in failures per unit per 1,000hours.
(2) Number of failures upon which the FFR is based. To convert toa statistical 90-percent confidence interval see the text (SectionIII. A) and Exhibit 3.

PRC R-1459III-6
EXHIBIT 2 (Continued)
Confidence(1) Factor(Z)
Component FFR Facto
At Launch Complex 37--Compo site 14.7 304
Amplifiers 4.8 100
Cameras and AssociatedEquipment 6.7 136
Monitor s 3.2 63
Miscellaneous 0.3 5
At Launch Complex 34--Compo site 15.8 433
Amplifiers 5.6 153
Cameras and AssociatedEquipment 6.7 183
Monitors 3. 2 89
Miscellaneous 0.3 8
At Other Locations--Compo site 17.5 540
Amplifiers 4.7 146
Cameras and AssociatedEquipment 4.1 125
Monito rs 7.8 240
Miscellaneous 0. 9 29
3. Water System 10.1 319
Notes: (1) Field failure rate (FFR) is given in failures per unit per 1,000hours.
(2) Number of failures upon which the FFR is based. To convert toa statistical 90-percent confidence interval see the text (SectionIII. A) and Exhibit 3.

PRC R-1459III- 7
serve better to identify these elements than any simple definition. They
are listed separately because of their slightly different treatment in the
RACs. Any equipment grouping to which an FFR is attached or upon
which the RAC methodology is performed is called a component.
All FFRs are derived by dividing the number of component fail-
ures by total accumulated component time and are reported in units of
failures per thousand hours. For piece parts and some subsystems
component time is given directly on the UCR. For other subsystems
and for all systems component time must be estimated or deduced. The
specific procedure in either case is contained in the appropriate RAC.
The number of failures are determined by an analysis of all pertinent
UCRs; again, this process is documented in the RACs.
The confidence factor is simply the number of failures upon which
the corresponding FFR is based. Using the number of failures as the
confidence factor has two advantages. First, a single number can be
used which is directly indicative of statistical confidence and at least
indirectly indicative of engineering confidence. That is, the higher the
number of failures the more accurate the indicated FFR. Secondly,
this number together with Exhibit 3 and the FFR can be used to deter-
mine the 90-percent confidence interval onthe estimated FFR. The
abscissa of Exhibit 3 is entered at the value corresponding to the num-
ber of failures and multiplying factors to be applied to the FFR are read
on the ordinate which will give the upper and lower limits of the 90-
percent confidence interval. For example, batteries have an indicated
FFR of 0.108 failures per thousand hours based on nine failures. Enter-
ing the abscissa of Exhibit 3 at nine, the smaller multiplying factor is
found to be approximately 0.53 and the upper factor 1.61. The 90-percent
confidence interval is then (0.53) (0.108) to (1.61) (0.108) failures per
thousand hours. Performing the indicated multiplication gives the values
0.057 to 0.174 failures per thousand hours.
B. Failure Causes
Exhibit 4 assigns one of five failure causes to each component or
subdivision thereof. These failure causes are defined in Section VI. C.

PRC R-1459111-8
tII- 8
2I \ >U V
:J,~, ~*44 o 0
- CD \ O
oV "/ O'4.4
i i=
PC; ¢
-_O
_ ~~(,
~n o~~ In mo o~ U~ tot- Lr) N O P- 01 C H
-I -4 -O O °
~;~ ' ~~~~~~~~~~~~~~~~~~6

PRC R-1459III- 9
EXHIBIT 4 - BASELINE FAILURE CAUSES FOR JOHN F. KENNEDYSPACE CENTER GROUND SUPPORT EQUIPMENT
A. Piece Parts
Failure Cause (Percent) (1 )
Component
1. Batteries
2. Cable Assemblies
Electrical
Mechanical
3. Capacitors
4. Circuit Breakers
5. Connectors
6. Pressure Switches
7. Regulators (Composite)
Inlet Pressure >3,000 psi
Inlet Pressure <750 psi
Intermediate PressureRange
8.
9.
Relays
Solenoid Valves
I
0~~~~~~~0 Co
0
/I /
03406 A A.,.
/ 0 o, 0~4 0 V. - :O, Cj I Ohi o3 ~ 1 fli
/ o /i i/,Q56
23
18
72
76
58
40
64
78
33
64
86
84
26
30
64
22
11
9
42
12
3
14
10
6
4
18
37
9
1
10
14
16
9
17
9
8
11
10
9
3
17
2
2
5
2
13
2
45
13
2
9
5
Note: (1) May not sum to 100 because of rounding.

PRC R-1459III-10
EXHIBIT 4 (Continued)
B. Subsystems
Failure Cause (Percent)(1
)
Component
1. Amplifiers 97 1 1
2. Compressors 79 11 5 4
3. Pump Assemblies 63 28 6 3
4. RF Carrier Demodulator(DSC-39-W) 99 1
5. RF Carrier Modulator(MSC-39-W) 100
6. RF Line RepeaterAmplifier (ASC-39-W) 100
7. Tail Service Masts atLaunch Complex 39 84 16
Note: (1) May not sum to 100 because of rounding.

PRC R- 1459III-11
EXHIBIT 4 (Continued)
C. Systems
Failure Cause (Percent)( 1 )
C(
1. RF Instrumentation
2. Television (OTV) System
3. Water System
Note: (1) May not sum to 100 because of rounding.

PRC R-1459III-12
Briefly, normal service denotes a failure for which there is no obvious
cause, design problem denotes a failure which could have been prevented
or can be corrected by either changing the design of the component itself
or of the system of which it is a part, quality problem usually denotes a
manufacturing defect, operational problem implies abuse on the part of
operations or maintenance personnel, and preventive maintenance indi-
cates a repair action induced by the recognition of an incipient failure.
A final category of "other" is reserved for those failures which are not
readily forced into one of the other categories. More specific informa-
tion on these failures can be had by consulting the RAC.
C. Failure Modes
Exhibit 5 is an array of the failure modes for the various compo-
nents which were assessed. Very little compaction of the failure mode
categories has been attempted since the space saved by compaction is
trivial in comparison with the information lost. Additional information
and more detailed breakouts of failure modes are, however, sometimes
contained in the RACs.
D. Repair Time Statistics
Exhibit 6 briefly summarizes all data with respect to repair time
that is contained in the RACs. The RACs often contain an empirical
distribution of repair time versus frequency which might be more de-
sirable in some cases. The median repair time, for example, is easily
determined from these curves and due to their skewed nature may be
more representative of typical repair times than the mean given here.
The number of repair time observations is given as a rough indication
of the reliability of the other statistics.

PRC R-1459III- 13
EXHIBIT 5 - BASELINE FAILURE MODES FOR JOHN F. KENNEDYSPACE CENTER GROUND SUPPORT EQUIPMENT
A. Piece Parts 5, 0I 0,: I~~~~
a.; s~~~~~~~~;a 0 5 a~~~~~~~~~~~~~~~~~~1 0
A, . ' R - .' ' -0 u * - 0
Failure Mode (Percent)( ) C O c
Broken 9 27
Cable Problem 15
Component Part Problem 6
Configurational Problem 9
Connection Problem 16 6 27
Construction Problem 9
Contact Problem 7
Corrosion 7
Corrosion, Contamination 2 10
Damaged Cable 16 27
Damaged Connector 30
Damaged Pins 23
Defective Insulation 21
Electrical Problem 33
Erratic. Intermittent 9
Everything Else 23
Fails to Operate 13
Foreign Material 7
Improper Actuation 9
Improper Response 23
Incorrect Regulation 6
Inoperative 5 12
Leakage 14 28 33
No Output 8
No Regulation 4
Open Circuit 6 4
Operational Problem 69
Oscillating 3
Other 33 18 46 12 6 12 15 10 1
Out of Tolerance 35
Past Problem 11
Physically Damaged 20
Pressure Not Maintained 18
Removed for Preventive 13Maintenance
Short Circuit 20 7 14 4
Unmowon- Unsatitfactory 4Condition or Operation 4 21 15
Wearout 41
Wiring Problem 5
Won't Deactivate 14
(1) May not sum to 100 because of rounding,
I

PRC R-1459III- 14
EXHIBIT 5 (Continued)
B. Subsystems
g* Iw~~~~
0 &)
I I E $erI o
9~~ " ·~~O '
sP ~~~ gr, o,~
Failure Mode (Percentl) qU / 4 ' 
Alignment, Adjustment 1 14
Bearing Problem 9
Component Part Problem 18 16 16 88
Corrosion, Contamination 9 10
Cracked or Broken Parts 19 17
Defective or Worn Parts 13 15
Design Deficiency 9 9
Design Modification, Overhaul 3 14
Electrical Problems 5 9
Incorrect Gain 9
Incorrect Output 10 18 40 54
Inoperative 6 13 6 4 23
Intermittent Output 3 3 2
Leakage 6
Mechanical Problem 1
Noisyi 15 19 8
No Output 20 12 2 5
Not to Specification 4
Operational Problem 22
Other 10 5 7 5 6 4 12
Seal Problem 18
Sync: Frequency Response 21 11
Unknown-UnsatisfactoryCondition or Operation 5
(1) May not sum to 100 because of rounding.
rII%

PRC R-1459III- 15
EXHIBIT 5 (Continued)
C. Systems
Failure Mode (Percent) ( 1 )
0 A
0 d
4~~~om~~
N 0 0~
4 ' a , '5
Adjustment Problem 2
Blast Damage 1
Camera Remote Control 2
Component Failure 5 6 26
Corrosion, Contamination 14
Design Deficiency 5 16
Design, Modification, Overhaul 3
False Indication 1
Focus, Distorted Output 6
Incorrect Output 13 11
Inoperative 13 8
Installation Error 6
Intermittent 18 3
Leakage 16
Mechanical Problem 15 4
Noisy 8
Noisy, Distorted 10
No Output 13 16
No Video, Poor Video 7
Open Circuit 1
Operational Problem 8
Other 2 3
Output Incorrect 2
Short Circuit 8 4 2
Sync; Frequency Response 6
Support Failure 1
Tolerance 1
Video, Horizontal or Vertical 7
(1) May not sum to 100 because of rounding.
/,--- 7
r

PRC R-1459III- 16
EXHIBIT 6 - REPAIR TIME DATA FOR JOHN F. KENNEDY SPACECENTER GROUND SUPPORT EQUIPMENT
Repair Time (Hours) Number of
Component Minimum Mean Maximum Observations
A. Piece Parts
Batteries 0 1.5 6 12
Cable Assemblies
Electrical 0 3.0 106 210
Mechanical 4.0 8.0 14 3
Capacitors
In TV Functional System 0.08 14.0 700 202
All Other Locations 0.05 4.3 77 203
Circuit Breakers 0.02 5.5 120 77
Connectors 0 3.3 36 100
Pressure Switches 0.33 6.7 50 36
Relays 0. 12 4.5 96 143
Solenoid Valves 0.33 4.0 36 65
B. Subsystems
Amplifiers
Composite 0.03 2.6 170 1,896
In Functional System:
Television 0.05 6.1 50 532
OIS-RF 0.07 0.52 9.0 529
OIS-Audio 0.10 1.6 16 446
Data Transmission 0.03 0.48 2.5 154
Measuring 0.08 0.10 0.82 43
Range Instrumentation 0.08 4.3 170 98
PA and Paging 0.25 6.8 39 81
Telemetry 0.17 0.47 0.60 13
Compressors 1.0 48 264 21
Holddown Arms 1.0 22.3 100 7

PRC R-1459III- 17
EXHIBIT 6 (Continued)
Component
Pump Assemblies
RF Carrier Demodulator(DSC-39-W)
RF Carrier Modulator(MSC-39-W)
RF Line Repeater Ampli-fier (ASC-39-W)
Repair Time
Minimum Mean
1.0 7.7
0.17
0.33
0.50
5.9
4.1
3.5
(Hours) Number of
Maximum Observations
24 12
17
16
12
113
169
21
C. Systems
RF Instrumentation
Television (OTV) System
At Launch Complex 39
At Launch Complex 37
At Launch Complex 34
At Other Locations
0.17
0.067
0.083
0.10
0.083
3.7
6.6
11
12
10
32
120
430
500
580
27
976
257
357
341

PRC R-1459IV- I
IV. ADDITIONAL UCR DATA
Exhibits 7, 8, and 9 exactly parallel Exhibits 2, 4, and 5 of the
previous section. The only difference is that these exhibits reflect data
from UCRs written subsequent to 15 October 1969; i. e., under the new
UCR system. The new system generally contains relatively few UCRs
for any component. For this reason, and perhaps for others, results
from the two systems often differ significantly. The results from the
new system are presented for whatever influence they might have on the
baseline data; they are presented separately to form the nucleus for an
improved and dynamic data base which will eventually supplant that of
Section III entirely.
These data should be periodically updated and if done so frequently
enough would provide a ready means to monitor the field reliability of
any components of interest. Updating procedures and formats, however,
do not form a part of this issue of the handbook.
Due to the sparsity of data from the new system available as inputs
to this issue of the handbook there are no entries for many of the compo-
nents listed in Section III. There are no repair time data whatever since
no provision is made for its collection in the new UCR system.

PRC R-1459IV-2
EXHIBIT 7 - ADDITIONAL FIELD FAILURE RATES FOR JOHN F.KENNEDY SPACE CENTER GROUND SUPPORTEQUIPMENT
Component FFR(1)Confidence
Factor(L)
A. Piece Parts
Circuit Breakers
Connector s
Relays
B. Subsystems
Tail Service Masts (Composite)
TSMs in Support of Launch AS 507
TSMs in Support of Launch AS 508
TSMs in Support of Launch AS 509
C. Systems
Water System
1.07
1.98
0.42
0.112
0.417
0.247
0.150
2.80
15
6
10
12
3
4
4
32
Notes: (1) Field failure rate (FFR) is given in failures per unit per 1,000hours.
(2) Number of failures upon which the FFR is based. To convertto a statistical 90-percent confidence interval see the text(Section III. A) and Exhibit 3.

PRC R-1459IV-3
EXHIBIT 8 - ADDITIONAL FAILURE CAUSES FOR JOHN F. KENNEDYSPACE CENTER GROUND SUPPORT EQUIPMENT
A. Piece Parts
Relays
B. Subsystems
Tail Service Masts(Compo site)
C. Systems
Water System
Note: (1) Totals may not add to 100 percent due to rounding.

PRC R-1459IV-4
EXHIBIT 9 - ADDITIONAL FAILURE MODES FOR JOHN F. KENNEDYSPACE CENTER GROUND SUPPORT EQUIPMENTCOMPONENTS
A. Piece Parts
Contact Problem
Operational Problem
Oscillating
Other
Short Circuit
Note: (1) Totals may not add to 100 percent due to rounding.

PRC R-1459IV-5
EXHIBIT 9 (Continued)
B. Subsystems
1)
Component Part Problem
Note: (1) Totals may not add to 100 percent due to rounding.

PRC R-1459IV-6
EXHIBIT 9 (Continued)
C. Systems
Failure Modes (Percent)( 1 )
Adjustment Problem
Corrosion, Contamination
Design Deficiency
False Indication
Internal Component Failure
Leakage
Operational Problem
Tolerance Problem
Note: (1) Totals may not add to 100 percent due to rounding.

PRC R-1459V-1
V. SUPPLEMENTARY DATA
It is recognized that the data of the preceding two sections is only
a beginning effort in the compilation of needed data in various reliability
engineering efforts at KSC. Even so it is strongly recommended that
the data herein be used in lieu of that from any other source if there are,
in fact, data available and perusal of the associated RAC indicates that
it is relevant.
However, when such is not the case as will be true for the indefinite
future for many components, recourse must be had to another source.
It is the intent of this section to offer some guidelines and suggestions
with respect to the utilization of such sources and for recording the re-
sults of such utilization.
A primary source of reliability data such as that provided by the
UCR system should be handled in a manner entirely analogous to that
provided by the RACs. Secondary sources such as MIL-HDBK-217A
should be used in accordance with their instructions; particular care
should be given to selecting a rate that is appropriate for the intended
application. Multiple sources should be consulted and the results com-
pared with each other. When a best rate from all available secondary
sources is isolated it may be further modified to bring it more in line
with the general ratio of failure rates in the chosen source and this hand-
book. If, for example, the FFRs for piece parts of Section III are always
about three times higher than failure rates from the selected source it
may be desirable to increase the best secondary source failure rate
estimate by a factor of three prior to use.
In any event the entire process should be very carefully documented
and submitted to Code DD-SED-21 for incorporation in subsequent issues
of this handbook. The failure rate and source (or sources) must be iden-
tified together with the values of all parameters needed to pinpoint the
failure rate such as part type, temperature, electrical stress, applica-
tion environment K-factor, etc. If not obvious the reason for selecting

PRC R-1459V-2
each deciding parameter should also be included. The end item (func-
tional system, launch complex, etc. ) into which the unit, for which the
failure rate is needed, is, or is being, installed should also be identified.
An indication of the analyst' s confidence in the accuracy of the re sult
either quantitative or qualitative would also be very helpful to those
using these results in the future. It is intended that these results be
compiled in a table similar to the following:
ComponentFailure Rate
(Failure s/hour)
C1
C2
Utilization
U1
U2
Reference
R1
R2
IntegratedCircuit
12 x 10-
6
C n
Amplifiers inthe OTV atLaunch Com-plex 39
Un
Component will have the same meaning as used in Section II. The failure
rate will no longer have the connotation of field failure rate in the sense
that it is derived from field data, it should however be applicable to field
(or intended) utilization. The utilization will briefly describe the higher
level equipment of which the component is to be a part. The reference
is to a paragraph or subsection of this report which explains how, in
detail, the failure rate was derived.
k
Rn
X1

PRC R-1459VI- 1
VI. METHODOLOGY FOR THE RELIABILITYASSESSMENT OF COMPONENTS
A. General
A simplified flow diagram of the methodology is shown in Exhibit 10.
The indicated approach is quite general and logical, even though the im-
plementation of each step is rather open to interpretation. In extremely
simplified terms, one selects a component to analyze, gathers the perti-
nent data, examines the data. for its relevance and most prominent char-
acteristics, and then selects from the data base those elements which
permit the calculation of field failure rates (FFRs) including confidence
statements and/or factors that influence the magnitude of the FFRs.
Documenting the process ends the methodology application.
Although the flow diagram of Exhibit 10 is felt to be quite indicative
of the developed methodology, it may appear to give more emphasis to
the calculation of field failure rates (FFRs) and less emphasis to the
classification of failures and resolution of FFR factors than is proper
due simply to the greater number of blocks associated with the FFR
calculations.
A better understanding of the overall process and the relative
weights of the individual elements might be obtained by considering the
following highly simplified flow chart.
Perform anSTART Engineering
Anal sis
Derive FFR!s Classify and Resolveand Unsatisfactory Conditions
Confidence Intervals and Factors
DocumentResults END

PRC R-1459VI-2
EXHIBIT 10 - METHODOLOGY FOR PASSESSING COMPONENTRELIABILIT Y

PRC R-1459VI-3
The grist for the methodology mill is provided solely by the UCR
(Unsatisfactory Condition Report) system. There are, currently, two
UCR systems: an old one and a new one. The new system was installed
on 15 October 1969 and completely supersedes the old system which was
in effect prior to that date. The two systems are not entirely commen-
surate. It is therefore recommended that data from the two systems
not be combined into a single data base. Rather, separate applications
of the methodology should be considered for each component of interest,
one using all the data from the old system, the other using a current
retrieval of data from the new system.
A highly useful adjunct to the UCR is the ICAR (Investigation and
Corrective Action Report). While not strictly necessary, data from
the ICAR often clarify the information carried on the UCR. Further-
more, the ICAR bears the same report number as the UCR, thus some-
what facilitating its retrieval in the old system, even though they are
stored in a separate file. In the new system the ICAR' s are stored and
printed out with the corresponding UCR.
No system configuration or other descriptive hardware data are
necessary for application of the methodology. Such data could, however,
greatly enhance the reliability assessment of components. Even where
such data are only partially available for a given component it might be
profitably utilized in the assessment. Thus, although the methodology
contains no explicit steps for incorporating the total number of a given
component installed at the Cape or component categorization by per-
formance characteristics (i. e., pressure ranges of regulators, etc.),
these data should be considered in the assessment to the extent possi-
ble when they are available.
The critical outputs of the methodology are (1) field failure rate
estimates, (2) an indication of the credibility and variability of the esti-
mates, and (3) a delineation of the proportional contribution of each in-
fluencing factor on the component field failure rate. The quality of the
results will vary directly with the quantity of data available and with the
diligence and creativity used to apply the methodology.

PRC R-1459VI-4
The methodology permits, in fact requires, that a rather high de-
gree of engineering knowhow be exhibited by the person who performs
the reliability assessment. However, it has been shown by past experi-
ence that the exercise of personal judgment at the expense of any of the
steps indicated in Exhibit 10 is highly detrimental to the end results of the
methodology. Steps may be added but should not be taken away. Since
each contributes a necessary facet to the overall assessment.
The basic steps in the methodology and their implementation are
discussed at length in the following subsections. Each block of Exhibit 10
is discussed in a separate subsection, and one additional subsection
covers the treatment of repair time data. Repair time is not an integral
part of the component reliability assessment, but is an interesting addi-
tion to it. The reliability assessment of a component (RAC) is primarily
a treatment of UCR data to establish a field failure rate (or rates) and to
discover the factors which influence the magnitude of the component
failure rate(s).
B. Definitions
This section is included to clarify the meaning of often used terms
in the application of the methodology.
1. Component. A matrix of parts, assemblies, or subassemblies,
typically self-contained, that functions in a defined manner
relative to the overall equipment operation. This definition
has been interpreted to include everything from piece-parts
(e. g., capacitors) to functional systems (e. g., holddown arms).
2. Component Field Failure. The inability of a component to per-
form its defined function regardless of cause.
3. Component Time. The accumulated time of the component
from date of installation (DOI) to date of failure (DOF) re-
gardless of operational status during the period, e.g., for
a given component the DOI = 12-31-66 and DOF = 3-7-67;
therefore, the component time is 66 days or 1,584 hours.
Since DOI is rarely known it is either estimated as the date

PRC R-1459VI-5
of first failure for large components with multiple failures
or is ignored completely and component time derived by add-
ing the age (or time) entries from the available sample of
UCRs for a given component population.
4. Component Population. The complete inventory of compo-
nents installed for operation that are structurally and func-
tionally alike and stressed in a, similar manner.
5. Confidence Factor (CF). The probability that the FFR of any
given component is within acceptable engineering limits.
6. Confidence Interval. A confidence interval is calculated for
each estimated FFR. This interval is defined on the range of
the failure rate and is mathematically derived such that the
probability is 90 percent that the "true" but unknown FFR is
bounded by the interval.
7. Field Failure Rate (FFR). The ratio of the number of com-
ponent field failures to their total component time for any
given component population.
8. GSE. That equipment which can be classified into one of the
following:
a. Active GSE. That equipment which is a part of the ve-
hicle sys tem or interfaces with the vehicle system and
is actively utilized during operations and/or testing,
e. g., swing arms, service equipment, and test
equipment.
b. Passive GSE. That equipment which supports the launch
vehicle system but is inactive during preflight operation
and/or testing, e. g., flame deflector and some checkout
and monitoring equipment.
c. Support GSE. That equipment which is not directly con-
nected to the vehicle but is essential to launch operations,
e. g., launch complex communications, nondata type
television, range-type instrumentation, and service
structure.

PRC R-1459VI-6
9. Mean Time Between Failure. (MTBF). MTBF is another
measure of failure frequency and is essentially the reciprocal
of FFR. MTBF is primarily used in the reliability assess-
ment of KSC GSE components to indicate the mean time be-
tween failures of the same component.
10. Mean Time to Failure (MTTF). This measure is highly sim-
ilar to MTBF and is sometimes used interchangeably. It is
more appropriate to use MTTF to indicate the mean of a
sample of individual times to failure which are not all re-
corded against the same individual component.
11. Mean Time to Repair (MTTR). This statistic is often re-
ported on the summary sheet of the previously assessed com-
ponents and usually represents the mean value of a number of
independent estimates of total downtime for a given component
population. Since, however, the UCRs from the old system
report both time to repair and time to locate the context of
the individual assessment should make the meaning clear.
12. Problem Classification. Through considerable use the follow-
ing classification of problems as reported on the UCRs has
been found quite useful. The five categories do not overlap
and taken together they cover all UCRs.
a. Design Problem. A fault vwhich is inherent in and can
be corrected by the component design.
b. Normal Service. In this category are placed all those
unsatisfactory conditions that arise as a result of nor-
mal field operation or for which insufficient information
is available to assign it to any of the other categories.
c. Operational Problem. UCRs in this category imply that
the unsatisfactory condition was caused or exacerbated
by the misuse of the component on the part of operating
or maintenance personnel.
d. Preventive Maintenance. UCRs are placed inthis cate-
gory if they report conditions that are not currently un-
satisfactory in any operational sense but could become
so in the future.

PRC R- 1459VI-7
e. Quality Problem. Implies a fault that is neither inherent in
the design nor the result of normal (or abnormal) operation.
It is often a manufacturing defect.
C. Step-By-Step Procedures
1. Choose a KSC GSE Component
The selection of a component or component type is probably the
least difficult step in the methodology. Some care must be exercised,
however, in component definition. Especially to be avoided are vague
and overly general definitions, such as "valves" when the real interest
is restricted to solenoid valves, or "tail service masts" when only those
masts at launch complex 39 are of direct concern.
In choosing a component it is necessary to provide descriptors
which are sufficiently detailed to distinguish the component from all other
GSE, but which are not so precise that they exclude elements intended
to be covered by the definition.
1. ChooseConoponenl

PRC R-1459VI-8
Wherever possible, the component definition should be one which
can be easily expressed in terms that conform to elements of the UCR
data bank. Obvious examples are those coded as major items or func-
tional systems. Solenoid valves are coded as major item 786 in the old
UCR system and tail service masts are reported under functional sys-
tems 750, 751, and 752 in the new UCR system.
An initial selection is often provided by a particular interest in a
conjectured problem area. It often occurs, however, that study of the
resultant data base indicates a component description either more or
less restrictive than originally anticipated. In this case, either the
data base or the original component description must be modified. For
example, in the component "cable assemblies" previously assessed by
PRC it was originally anticipated that these would be of the electrical
variety only; however, the data. base included a number of UCR' s ap-
plicable to strictly mechanical cable assemblies which, since time and
failure data. were available, were carried under a broadened definition
of this component.
The output of this step in the methodology is generally a simple
descriptive paragraph. Typical i.s the following one for tail service
masts at launch complex 39:
"The tail service masts found at launch complex 39
are affixed, in sets of three, to the mobile launchers. Their
function is to support service lines to the S-IC stage and to
provide a means for rapid retraction of the service lines
from the S-IC stage during vehicle lift-off. The location and
specific function of each of the tail service masts is a.s fol-
lows: TSM 1-2 (fuel line service and inert pre-fill), TSM
3-2 (environmental air conditioning service), and TSM3-4
(liquid oxygen emergency drain). The KSC part numbers
for these three items are, respectively, 75M11776,
75M11775, and 75M11774."

PRC R-1459VI-9
2. Establish a Data Base
START * SCCS
.. t..bli.h .
;...
3. Perto,,,a n £ nl., n Alyli f th. la l l. B..
9.SCI .t 5. D.trrmi,,
II. D,,.,,,,,,,nt END
For each component selected, the pertinent data base will
necessarily consist of two parts: (1) the complete printout of all UCRs
written against the component in the old system, and (2) similar data.
generated under the new system. The first part will contain all perti-
nent UCRs written prior to 15 October 1969 whereas the second part
will contain the subsequent UCRs that have been entered in the system
as of the date of the computer retrieval. These data ba-ses are estab-
lished by assembling computer printouts of each UCR written against
the chosen component. Two retrievals must be made; one from the old
system and one from the new system.
In both cases the retrieval process is relatively straightforward
but some care must be taken to assure that all the applicable UCRs are
retrieved and that the number of irrelevant UCRs are kept to a minimum.
To retrieve solenoid valve UCRs it is only necessary to request all UCRs
written against major item 786 in the old system and major item 319 in
the new system. For tail service masts at launch complex 39 the re-
trieval from the old system is against the next assembly part number for

PRC R-1459VI-10
the three tail service masts. In the new system the retrieval is made
against the three functional system numbers 750, 751, and 752. From
this retrieval all UCRs not from launch complex 39 must be rejected
either by excluding them from the retrieval process or manually sorting
them out afterwards.
At this point it is necessary to further refine the computer printout,
to eliminate UCRs with obvious coding errors, to reconcile inconsistenc-
ies in internal coding and to assess the completeness of the data run. If
it is obvious that some pertinent UCRs have inadvertently been omitted,
they should be requested and incorporated in the data base in a manner
similar to that outlined above. At this point the analytical portion of the
methodology may begin.
This can be a very tedious step in the methodology because of the
necessity for dealing with often great quantities of data before any sim-
plifying procedures can be determined to ease the task. As a result, it
is tempting to reject huge blocks or categories of UCRs as not being
relevant to the reliability assessment of the component under consider-
ation. It is, however, a poor UCR indeed that carries no information
and, if a large number of such UCRs occur for a given component, that
fact itself may have strong reliability implications. Therefore, it is
strongly urged that UCRs be eliminated from the data base only on the
grounds that they do not fit the component description or that they are
complete duplications of other UCRs included in the data base.
This step in the methodology results in a number of UCRs (and
perhaps ICAR's, etc. ) to be used in the assessment. The number of
UCRs, the date of the most recent data retrieval and a judgment as to
the adequacy of the coverage provided should be indicated in the final
documentation of this step. The data base documentation for tail service
masts for the Phase II study periodl is quoted in full as follows:
"The tail service mast data base consists of approxi-
mately 150 unsatisfactory condition reports and were collected
by retrieving on the appropriate next assembly part numbers
from the computerized data bank. A number of retrievals
1 The complete report is the first citation in the bibliography ofsubsection VI.D.

PRC R-1459VI-11
were made, the most recent being on 16 June 1969. In ad-
dition, xerox copies of all TSM UCRs in the data file were
made in late September 1969. Selected ICAR' s were also
collected at that time. Finally, some TSM UCRs were
located by means of the reference report entry on the
earlier UCR runs and these were requested specifically by
UCR number. This data base is, therefore, considered to
be quite complete, at least through early 1969."

PRC R-1459VI-12
3. Perform an Engineering Analysis of the Data Base
As can be seen from Exhibit 10, this step in the methodology
is extremely important to all subsequent steps. Typical activities inthe engineering analysis are difficult to specify precisely. The crux ofthis step is familiarization with the data base and its peculiarities. Theend result should be a reasonably adequate historical profile of the com-ponent as revealed on the UCRs together with whatever other backupinformation can be brought to bear.
Particular attention is focused on determining if the data on a se-lected component can be divided into meaningful subsets. For example,
solenoid valves may be divided according to the fluid controlled by them,or the specific location on the mobile launches of the tail service mastsmay be useful as a subset criteria.
The time period represented by the data. base and selected subsets
thereof is a second area of prime concern. The dates of the first andlast UCRs in each data. subset should be noted as well as their relative

PRC R-1459VI-13
occurrence rate or density. Correlation of UCR occurrence with launch
date is sometimes instructive. Extended periods of abnormally high or
low UCR occurrence rates should be noted.
The unsatisfactory conditions reported in the data base (particularly
in the narrative section of the UCRs) should first be carefully examined
to establish the degree of credibility that can be placed in the data base.
This may vary with component type, launch complex, and so forth. The
data base for tail service masts might well have a higher degree of credi-
bility than that for solenoid valves simply because the former population
is much better defined, has a known number of units, etc. The degree of
credibility should be reported in the RAC.
The unsatisfactory conditions should also be examined to see if
there are any obvious similarities or differences; for example, the
launch complex or functional system where the UCR originated. The
fact that all UCRs on a particular subsystem originated at launch com-
plex 34 would be highly significant. The same type of failure being re-
peated over and over also has an important bearing on the subsequent
analysis.
The corrective actions indicated should also be carefully scrutinized
to see if any instituted action might have caused a significant difference
in the field failure rate. Also note corrective actions suggested repeti-
tively which have not been instituted.
In short, total familiarity with the data base in engineering terms
should be achieved in this step. This will be highly useful in all the
subsequent steps and is necessary to place the entire RAC in the proper
perspective.
Perhaps the easiest way to begin this step in the methodology is
to simply take the first UCR printout in the data base ard read it in detail.
Then do likewise with the second, and the third, and so on. By about the
fifth or sixth UCR, certain similarities imposed by the component defi-
nition become evident. Continuing through the data base, scanning at
a high rate, other similarities as well as disparities begin-to appear.
Finally, flipping through the entire set will tend to lend support to some
of the preliminary hypotheses, destroy others, and leave others still in
do. bt.

PRC R-1459VI- 14
Once a number of candidate hypotheses have been established, a
tabulation or two on a restricted number of UCR elements can often be
performed to give further insight into the preliminary hypotheses and
will perhaps suggest further hypotheses to be examined, etc. The point
is that although clerical level personnel can easily perform the tabula-
tions, only an experienced investigator, by studying the UCR data base
himself, can formulate fruitful hypotheses and establish efficient lines
of investigation.
Also, while it is natural to focus the engineering analysis in such
a way as to most readily provide the other specific requirements of the
methodology, and particularly of component populations and times, the
investigation should remain open to other information contained in the
data base. For example, some sets of UCRs contain considerable in-
formation with respect to component repair times, a. data. element not
specifically called for in the methodology but certainly pertinent to any
complete consideration of component reliability and one that should be
reported, when available.
The entire engineering analysis documentation for the Pha.se II
assessment of tail service mastsl is contained in Exhibit 11 and the fol-
lowing three paragraphs.
"Preliminary consideration of the data base results in
some interesting, and sometimes contradictory, conclusions.
The UCRs indicate that there are nine individual TSMs bear-
ing serial numbers 1001 through 1009, and that these nine
TSMs are utilized for launch support in sets of three. This
can be clearly seen from Exhibit 11, where each short verti-
cal line represents one unsatisfactory condition of a partic-
ular TSM at the date indicated. Launch dates and the mobile
launcher utilized are also indicated for vehicles AS 501
through AS 506. Note that the TSM serial numbers and
mobile launcher assignments are not entirely consistent
with the assumption of a. permanent correspondence be-
tween the two.
1 The complete report is the first citation in the bibliography ofsubsection VI.D.

PRC R-1459VI- 15
^ C).~
a
10 Uo Cur:f) 0V¢ co
^ ,,,
- 4)
en Uo CLIU) (dUlf
¢Cr1 _
L) _~ Q
oN CON 0 -ro 0' 0
- v -
0 C I o
_ , 2 = _ -_
ol ] N 09 _ oC1 -oR:3 ::o 0' -
_()- _ -
. a-
M u0
U) cd¢ -I
tf~
~Cr1.4_
a0 1.
N U
ar
¢3 =_ =
. P =
0'
:o
a'
'0a'
N
N
0
CO
ar
Q0
.-
.u
N
N
O~0Oo
a'
'0 -N
N
t 0\00
'0 a-
N
.n,
CO
;Q`
ul
N
m
vQ
z
v
nH
U
w
H
Uz
H
4
H
>-
(uollt'o I' pUV) l ,LUN U elaS le SaI.
PRC R-1459VI-16
The preliminary analysis indicates quite strongly that
the unsatisfactory conditions occurring prior to about April
1967 (on all TSMs) reflect an initial acceptance or checkout
situation of some kind rather than an actual launch support
role as is the case subsequent to that date.
In general, the UCRs are quite complete. However,
they are written against a major item, that is, at a lower
level than the TSM, and hence the impact of the reported
condition on the TSM must be largely deduced."

PRC R-1459VI- 17
4. Select Component Populations
A component population, as defined in Section III, represents
the complete inventory of individual components installed for operation
that are functionally and structurally alike. In order to increase the
utility of the study, it is desirable to keep the component populations
as specific as possible. Increasing specificity, however, sharply cur-
tails the available UCR data for each population. From the engineering
analysis, this step in the methodology selects a likely set of populations--
likely, in the sense that there are a sufficient number of UCRs associ-
ated with each population to yield the requisite time and failure data
upon which an estimate of FFR can be made.
As indicated in Exhibit 10, this is an iterative process, starting
with the most specific set of component populations and proceeding to
the more general, until the time and failure data requirements are
satisfied. With solenoid valves, for example, one might attempt to

PRC R-1459VI-18
group UCRs by individual part numbers which if unsuccessful might
then proceed to location or medium controlled and might end up with
only the single population "solenoid valves." More than one grouping
of the same data is often possible and is to be encouraged as long as
each is well defined. For launch complex 39 tail service masts potential
populations include each individual mast (9 populations), locations on the
mobile launchers (3 populations, TSM 1-2, 3-2, and 3-4), the TSMs
associated with a particular mobile launcher (3 populations) or even a
particular launch (the TSMs in support of AS 504, for example).
It is probably not particularly useful to report highly similar re-
sults for a multitude of populations. It is preferable to combine such
data and then to simply indicate the near equality of the results for the
various populations. That is, it might be possible, to give FFRs for
a particular component as observed at Launch Complex 39, Launch
Complex 34, and Launch Complex 37. If all the results are within a
few percentage points of each other, it would be preferable to combine
the data to provide one widely applicable FFR together with a statement
of the observed similarity in magnitudes by launch complex.
It is strongly urged that the UCRs or copies thereof be filed by
population for ease in reference and for accomplishment of the remain-
ing steps in the methodology.
The component populations for the tail service mast analysis were
defined in the Phase II studyl this way:
"The engineering analysis indicates that a. large num-
ber of likely, or possible, tail service mast sub-populations
exist. Ten of these will be treated explicitly here. Nine of
them are defined as those TSMs in support of the first three
Saturn V launches. The tenth consists of all TSMs. "
The first citation in the bibliography of subsection VI.D.

PRC R-1459VI- 19
5. Determine Installation Times
The determination of installation or component times is beset
by two problems. First, if the component of interest is a major item
there is generally no way to determine either the total number of units
in the component population or the actual installation or removal dates
for more than a very small subset of these units. On the other hand, if
the component is a functional system or similar high-level aggregate of
major items, the population is either only one unit or is known exactly
(as for the three tail service masts for each mobile launcher at launch
complex 39) but component times are not entered on the UCR since the
UCR' s are written only against major items.
To circumvent these problems, two alternate approaches to the
derivation of a time base can be utilized, depending on the type of com-
ponent under analysis. If the component is a major item, then the age
or time entry, as given on the UCR, is interpreted to mean the instal-
lation time of the specific major item, immediately prior to the date

PRC R-1459VI-20
of occurrence shown on the UCR. Component populations with four or
more such entries (which are stochastically independent) are assumed
to have an adequate time base to proceed with the methodology. If all
the component populations defined in Step 4 are not adequate, then Steps
4 and 5 are reiterated until the populations are adequate.
If the component under consideration is not a major item, but is
rather some higher level of assembly, the procedure for deriving a time
base is as follows. Order the UCRs by component population and their
dates of occurrence. The first such date for a component population
provides a quasi-date of installation and the last, a date-of-termination;
all intermediate dates, subject to the refinements of the next step, rep-
resent failure times. The same criteria for adequacy and iterative nature
of the process apply the way they do in the preceding paragraph.
Component survival time information is probably the single most
unreliable data element in the entire UCR system and at the same time
one of the most important. Some of the more noticeable difficulties are
the absence of data, the tendency of available data, to cluster (6, 12, and24 months are particularly popular) in contradiction to what would be ex-
pected from the remainder of the UCR information, and the frequent
ambiguity of data in terms of what the originator of the UCR meant by
the entry. In spite of these difficulties, the collection of reasonably
large samples of data can overcome most of the problems. For example,
three age entries at 24 months, two at 12 months, and one at 6 months,
give the same mean failure time as six individual entries at 5. 5 months,
10.5 months, 14 months, 20 months, 23.5 months, and 28.5 months.
That is, the reported ages are assumed to be in the correct ball park
and, hence, tend to balance out with large samples. The same is trueof originator errors or biases; given enough originators the biases tend
to average out.
Thus, while every effort should be made to get as large and ac-
curate a sample of component time data as possible, it is by no meansnecessary to stop the analysis because of observed irregularities. Theseirregularities should of course be reported, but they should not become
a bottleneck in the implementation of the methodology.
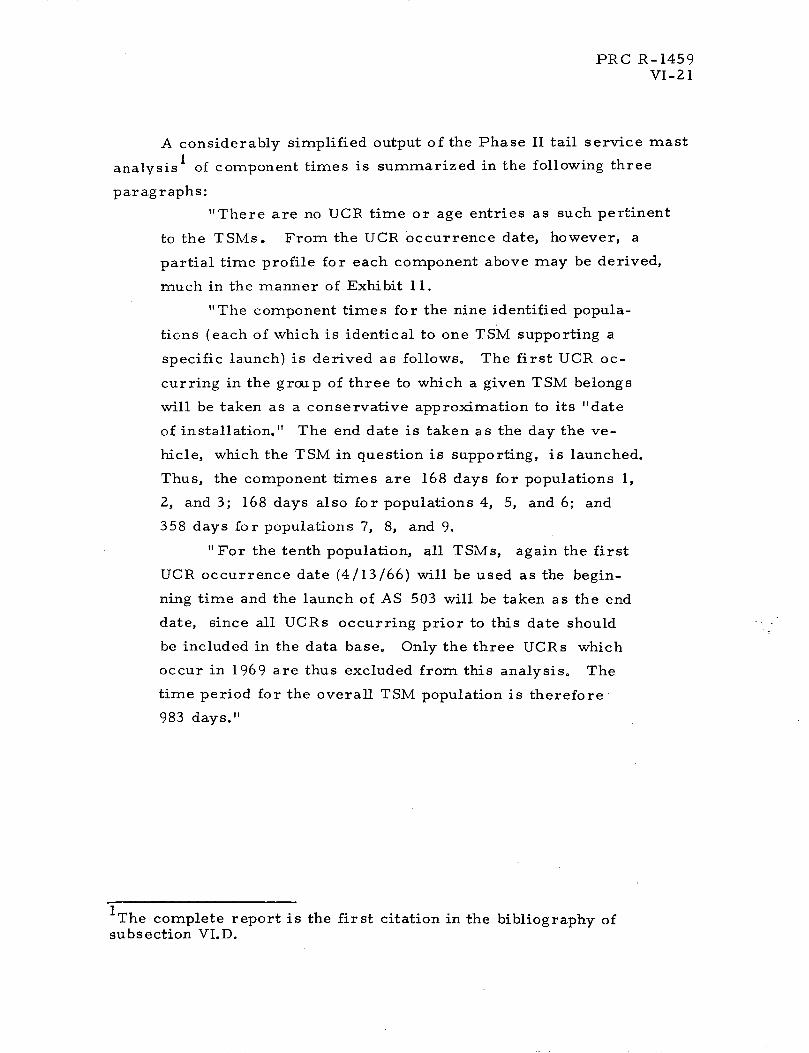
PRC R-1459VI-21
A considerably simplified output of the Phase II tail service mast
analysisI
of component times is summarized in the following three
paragraphs:
"There are no UCR time or age entries as such pertinent
to the TSMs. From the UCR occurrence date, however, a
partial time profile for each component above may be derived,
much in the manner of Exhibit 11.
"The component times for the nine identified popula-
tions (each of which is identical to one TSM supporting a
specific launch) is derived as follows. The first UCR oc-
curring in the group of three to which a. given TSM belongs
will be taken as a conservative approximation to its "date
of installation." The end date is taken as the day the ve-
hicle, which the TSM in question is supporting, is launched.
Thus, the component times are 168 days for populations 1,
2, and 3; 168 days also for populations 4, 5, and 6; and
358 days for populations 7, 8, and 9.
"For the tenth population, all TSMs, again the first
UCR occurrence date (4/13/66) will be used as the begin-
ning time and the launch of AS 503 will be taken as the end
date, since all UCRs occurring prior to this date should
be included in the data base. Only the three UCRs which
occur in 1969 are thus excluded from this analysis. The
time period for the overall TSM population is therefore
983 days."
1 The complete report is the first citation in the bibliography ofsubsection VI.D.

PRC R-1459VI-22
6. Determine Number of Failures
To begin this step, there are n sets of UCRs, each set
representing one component population. Within each set of UCRs some
specified subset contains time data. Each such UCR must now be sub-
jected to further engineering analysis to determine first whether or not
it represents a component failure as defined in subsection VI.B. In this step
only two categories result-- UCRs classified as failures and those clas-
sified as not failures. All doubtful cases should be assigned to the failure
category. There are two reasons for this assignment: (1) without it,
the resultant FFR estimates might become unjustifiably optimistic, and
(2) in subsequent steps, all relevant failures will be further analyzed to
reveal the factors contributing to the magnitude of the FFR. Excluded
failures obviously cannot be analyzed for this purpose. Note that mul-
tiple failures are sometimes reported on one UCR.

PRC R-1459VI-23
This step of the procedure is again an iterative one. That is, if
all the component populations resulting from Step 5 do not have a mini-
mum of four failures and four associated time entries, then it is neces-
sary to return to Step 4 and begin the process anew.
Experience with the old system has shown that nearly every UCR
in fact represents a failure (or failures). Since the UCRs in the new
system are screened to eliminate failures that are not design-related,
each UCR should again represent a failure.
The screening process does render the two sets of UCRs incom-
mensurate as mentioned previously.
Some UCRs do not represent failures of the component under
consideration but rather a failure at some higher equipment level. If
there are many such failures they should be treated separately in the
component analysis; otherwise, they may simply be deferred to a higher
level reliability assessment. The cable assemblies assessment pre-
viously completed by PRC is an example of component UCRs reporting
many failures at a higher level.
The results of this step for the tail service mast analysis previously
alluded to were reported as follows:
"Each entry of Exhibit 11 represents one TSM failure.
In the course of the engineering analysis those UCR' s which
were judged not to represent a TSM failure (under the most
stringent interpretation) were eliminated from the data base;
multiple failures represented on a single UCR were separated
in the construction of the previously mentioned exhibit. The
number of failures for each of the ten population s is as follows:
Population 1 2 3 4 5 6 7 8 9 10
Number ofFailures 11 13 2 15 7 9 13 15 13 160

PRC R-1459VI-24
7. Classify Failures
Although those UCRs for which component times are avail-
able are of particular interest, there is a large amount of data on all
the UCR' s--each of which represents a failure of some kind--whether
or not any time information is available. To extract this information
is the object of this step in the methodology. Accomplishment of this
step occurs through the continuation and refinement of the engineering
analysis discussed in Step 3 above, but is focused on the failure or un-
satisfactory condition itself.
Of particular interest are the failure modes and causes. One way
to approach the whole problem of classification is to examine each UCR
carefully (particularly the narrative section) and answer the following
three questions with no more than a short phrase devoted to each answer.
o What happened?
o Why?
o Who is to blame?

PRC R- 1459VI-25
The detailed tabulation in Exhibit 12 (devoted to pressure switches)
is a. good example of the results of applying this procedure. The op-
erating modes answer the first question with typical responses being
"out of tolerance," "won't deactivate," etc. The condition modes ans-
wer the second question with typical responses of "normal wear,"
"corroded pressure switch," "installed wrong," etc. The column head-
ings "Design," "Quality Control," etc., try to assign the blame in the
sense that any corrective action to be taken would be the responsibility
of that group.
There are, however, many other ways to approach the problem
of failure classification; each assessment will differ to some extent;
those already completed may be used as a starting point in the classi-
fication of failures for similar components.
Failure classification, performed well, is not a. trivial or routine
task. Unfortunately, the usual approach, typified by the coded data ele-
ments "Failure" and "Reason" on the UCR, is to prepare a list of de-
scriptions that are then applied to each case as it arises. The list for
the UCR element "Failure" contains 190 items, but it is manifest (by
comparing the selected entry to the narrative portion of the UCR) that
the selected descriptor is usually totally inadequate. The inadequacy,
moreover, is not removed by adding to the list. What is likely to hap-
pen is that a catch-all descriptor like "inoperative" will be applied
excessively. Furthermore, there is no completely satisfactory defi-
nition of a failure, to say nothing of failure categories (modes, mech-
anisms, effects, causes, etc. ).
The best way to proceed is probably as suggested above or some
variation thereof. That is, from each total UCR printout, but particu-
larly the narrative section, an attempt should be made to summarize
the entire incident in as few words and with the highest informational
content possible. After this is done for a. few UCRs patterns begin to
emerge, descriptions repeat themselves, and so on.
By refining the summary descriptions and by combining similar
ones, certain failure categories become clear. These are, in general,
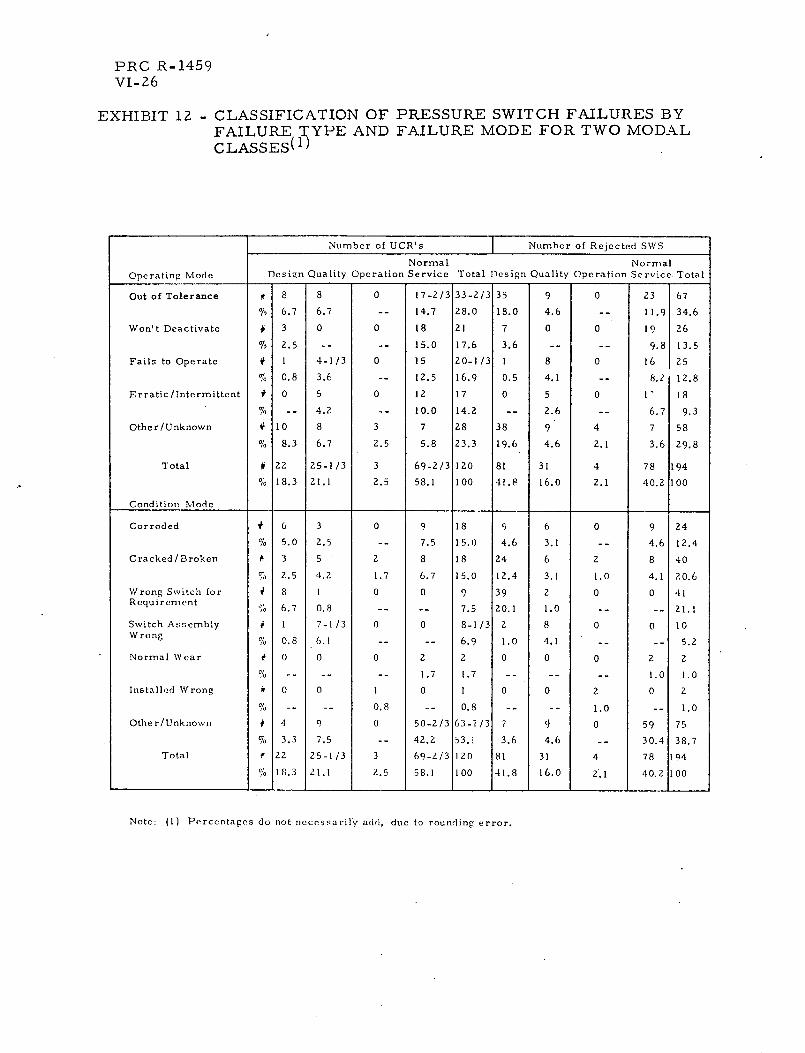
PRC R-1459VI-26
EXHIBIT 12 - CLASSIFICATION OF PRESSURE SWITCH FAILURES BYFAILURE TYPE AND FAILURE MODE FOR TWO MODALCLASSES( 1
Number of UCR's Number of Rejected SWS
Normal Normal
Operating Mode Design Quality Operation Service Total Design Quality Operation Scrvice Total
Out of Tolerance f 8 8 0 17-2/3 33-2/3 35 9 0 23 67
% 6.7 6.7 -- 14.7 28.0 18.0 4.6 -- 11.9 34.6
Won't Deactivate Y 3 0 0 18 21 7 0 0 19 26
% 2.5 -- -- 15.0 17.6 3.6 -- __ 9.8 13.5
Fails to Operate # 1 4-1/3 0 15 20-1/3 1 8 0 16 25
% 0.8 3.6 -- 12.5 16.9 0.5 4.1 -- 8.2 12.8
Erratic/Intermittent # 0 5 0 12 17 0 5 0 1' 18
% -- 4.2 -- 10.0 14.2 -- 2.6 -- 6.7 9.3
Other/Unknown t4 10 8 3 7 28 38 9 4 7 58
% 8.3 6.7 2.5 5.8 23.3 19.6 4.6 2.1 3.6 29.8
Total Y 22 25-1/3 3 69-2/3 120 81 31 4 78 194
% 18.3 21.1 2.5 58.1 100 41.8 16.0 2.1 40.2 100
Condition Mode
Corroded # 6 3 0 9 18 9 6 0 9 24
% 5.0 2.5 -- 7.5 15.0 4.6 3.1 -- 4.6 12.4
Cracked/Broken # 3 5 2 8 18 24 6 2 8 40
% 2.5 4.2 1.7 6.7 15.0 12.4 3.1 1.0 4.1 20.6
Wrong Switch for # 8 1 0 0 9 39 2 0 0 41
Requirnement ~ r 6.7 0.8 -- -- 7.5 20.1 1.0 -- -- 21.1
Switch Assembly # 1 7-1/3 0 0 8-1/3 2 8 0 0 10
Wrong g% 0.8 6.1 - -- 6.9 1.0 4.1 -- -- 5.2
Normal Wear # 0 0 2 2 0 0 0 02 2
% - -- - 1.7 1.7 -- -- -- 1.0 1.0
Installed Wrong # 0 0 1 0 1 0 0 2 0 2
% -. -- 0.8 -- 0.8 -- -- 1.0 -- 1.0
Other/Unknown ! 4 9 0 50-2/3 63-2/3 7 9 0 59 75
% 3.3 7.5 -- 42.2 53.1 3.6 4.6 -- 30.4 38.7
Total f 22 25-1/3 3 69-2/3 120 81 31 4 78 194
% 18.3 21.1 2.5 58.1 100 41.8 16.0 2.1 40.2 100
Note: (1) Percentages do not necessarily add, due to rounding error.

PRC R-1459VI-27
unique for each component assessment and should be reported in as con-
cise and clear a manner as possible without regard to previously estab-
lished categories.
While perhaps not as instructive as some other component, the
results of the tail service mast failure classification were reported as
follows:
"The data base does not provide a great deal of informa-
tion with which to classify TSM failures since the UCRs are
written against a lower level item. In fact nearly half the
TSM failures were generated by the following six part
types: Regulators 75M11856, -859, and -875; Transducers
75M11857 and -13108; and Solenoid Valve 75M11936. On
an overall basis, valves (of all types) contribute approxi-
mately 37 percent of the failures, regulators 26 percent,
transducers 16 percent, hose assemblies 15 percent, and
all other contributors 10 percent. An insignificant num-
ber of failures were attributed to the design, quality con-
trol, operation, etc., of the TSMs themselves, although
the unsatisfactory condition of their constituent parts were
often so classified."

PRC R-1459VI-28
8. Calculate Population Field Failure Rates
The output of Step 6 consists of a set of defined component
populations together with a measure of component time and the number
of failures observed for each. Because of the nature of the component
time measure, there are essentially three different ways to calculate
field failure rate (FFR) estimates.
If the time measured is essentially time to failure, as generally
will be the case for solenoid valves and other major items, then the
FFR estimate is derived as the reciprocal of the mean time to failure
(MTTF). The MTTF is, of course, simply the sum of the times to fail-
ure divided by the number of such observations.
If a number of failures are observed for a particular unit, as in
the case of the individual tail service masts at launch complex 39, the
FFR estimate may be calculated as the reciprocal of the mean time be-
tween consecutive failures. The times between consecutive failures

PRC R-1459VI-29
are obtained by subtracting the date of the first failure from that of the
second, the date of the second from that of the third, etc.
Finally, if only total installation time and total number of failures
are known or can be estimated for a component population, then dividing
the total number of failures by the total installation time provides an es-
timate of FFR. This situation is most likely to occur at the functional
system level.
For tail service masts in Phase II1 the output of the step was re-
ported as follows:
"The UCRs on the nine selected sub-populations
are assumed to arise in the course of the normal activi-
ties associated with readying a vehicle for launch; that
is, these TSMs are assumed to be in service in their
designed mode of operation.
The FFR is calculated as the total number of TSM
failures divided by the total TSM time as derived in the
preceding sections. These FFRs are:
FFRPopulation (failures/1000 hours)
1 2.73
2 3.22
3 0.50
4 3.72
5 1.74
6 2.23
7 1.51
8 1.75
9 1.51
For the tenth, or overall, population a similar
calculation is made; this rate however, includes all
failures prior to 1969. The result of this calculation
is a population 10 FFR of 0.75 failures per TSM per
1000 hours."
1 Complete results are reported in the first citation of the bibliography,Subsection VI.D.

PRC R-1459VI-30
9. Derive FFR Confidence Intervals
The primary purpose of this step in the methodology is to
indicate the distribution and variance of the underlying data and to de-
rive confidence intervals for the FFR estimate. In the first two FFE
estimating procedures, individual times to failure or times between
failure are necessarily derived. The distribution of these random
variables is found by constructing charts, such as those shown in Ex-
hibit 13, where the percent of all observations is plotted as a function
of time to, or between, failure. The variance of the data is indicated
by recording the MTTF (MTBF) and the minimum and maximum ob-
servations (i. e., the range) for each population. In cases where the
only available data are total time and total number of failures, this
procedure cannot be followed exactly. MTBF, however, can be calcu-
lated as the reciprocal of the estimated FFR, a.nd some individual ob-
servations may be available; thus, even though the distribution of time
to failure may not be obtainable, some indication of variance usually is.

PRC R-1459VI-31
-
0
o H7
co
_.en o .~ o UC
N~n N -
, f.]
sainiLe, Jo .aquinN

PRC R-1459VI-32
For all three FFR estimates, the same procedure is used to de-
rive confidence intervals. First, the time-to-failure data are assumed
to be exponentially distributed. The total observed time, T , for each
population is then derived as the sum of the time to, or between fail-
ures for each population as described above, and the total number of
failures, r , pertinent to each population is determined. For the third
FFR calculation approach, T and r are given directly. For the first
method, r is simply the number of observations; for the second, r is
one less than the number of observations because the first failure
merely establishes an installation time.
The lower confidence limit, L, is then given by
X 2 r)L a/2
2T
and the upper confidence limit, U , by
X2 (2r)1 -a/2U =
~2~ ~2T
where X /2(2r) is the lower a/2 percentage point of the Chi-squarea/2 2
distribution with 2r degrees of freedom, and X _a/2(2r) is the upper
l-a/2 percentage point. Although a may assume any value between
O and 1, it is generally assumed to be 0.10.
For the tail service masts, results were reported as follows:
"Assuming that the time to failure of TSMs is ex-
ponentially distributed, 90 percent confidence intervals for
the estimates of population FFRs may be calculated using
Equation 1.
X2(Zr) X (2r)
2T <FFR < Q/ (1)2T 2T~~2

PRC R-1459VI-33
"These intervals are presented
for each population with failure rates
per 1000 hours.
in the following table
in units of failures
Population
1
2
3
4
5
6
7
8
9
10
UpperConfidence Limit
4.20
4,83
1.15
5.44
2.94
3.58
2.26
2° 55
2 26
0.86
FFR
2.73
3.22
0.50
3.72
1.74
2.23
1.51
1.75
1.51
0.75
LowerConfidence Limit
1.53
1.91
0.09
2.30
0.82
1.16
0.90
1.08
0.90
0°66"

PRC R-1459VI-34
10. Resolve FFR Factors
The penultimate step in the methodology is to indicate
what major factors are contributing to the unreliability of the assessed
component in general and to the selected component populations in par-
ticular. As in the case of failure classification, only guidelines and
the sample analyses previously performed by PRC can be offered to
assist in this step. The guidelines are as follows: (1) Compare the
FFR estimates for the various component populations. If there appears
to be no significant difference, it can be concluded that those descrip-
tors used to distinguish the population have no bearing on the magnitude
of the FFR. If there is a significant difference, those factors resulting
in the higher rates of failure can be identified. (2) For each component
population, examine the percentage of all failures arising from the vari-
ous classifications of Step 7. A significant difference in these sets of
ratios might prompt further engineering analysis in order to determine
the causes. In the event of no significant difference, a computation of

PRC R-1459VI-35
the proportion of failure classes among all failures in the data base is
made and can be used to apportion the FFR into its major contributory
sources, if desired.
The FFRs as calculated in previous analyses appear to be con-
siderably higher in every case than the failure rates one would antici-
pate using standard failure rate tabulations and standard reliability
modeling techniques. Some of the reasons for this difference may be
found in the results of this step of the methodology. More importantly,
perhaps, it indicates where corrective action could be most effectively
implemented.
For the Phase III tail service mast analysis this step is as docu-
mented in Exhibit 14 and the remaining paragraphs of this subsection.
"A number of factors appear to be influential or po-
tentially so on the magnitude of TSM failure rates. A
number of these will be investigated briefly in this
subsection.
"The TSM location does not appear to have a strong
influence on field failure rate; however, the overall aver-
ages given below do indicate the general tendency.
TSM Location FFR (1 )
3-4 2.34
1-2 2.10
3-2 1.44
"With respect to the launch vehicle being supported,
the average TSM FFRs are as follows:
Launch Vehicle FFR ( 1 )
AS-501 2.15
AS-502 2.56
AS-503 1.59
These differences are not so great as to be alarming, but
great enough to indicate some caution in extrapolating the
results found here to future launches.
1 Complete results reported in the first citation of the bibliography ofsubsection VI.D.

PRC R-1459VI-36
"The overall average FFR of TSMs in their normal
support service (i. e., the average of the nine subpopulations)
is 1.96 failures per 1000 hours per TSM.
"Another classification is prompted by the appearance
(see Exhibit 11) of a general reduction in failure rate with time
when considering all TSMs and all failures. The plot of
Exhibit 14, however, does not lend much support tothis hy-
pothesis. Although the last three quarters in 1968 exhibited
an FFR essentially half the overall average (6 failures per
quarter compared to approximately 13), the wild fluctuations
of the previous quarters again imply considerable caution in
extrapolating the recent favorable results."
(1)All values in failures per TSM per 1000 hours.

PRC R-1459VI-37
- ~ [-ci
O
O
-I)
saJan-lei j3o .aqrin N
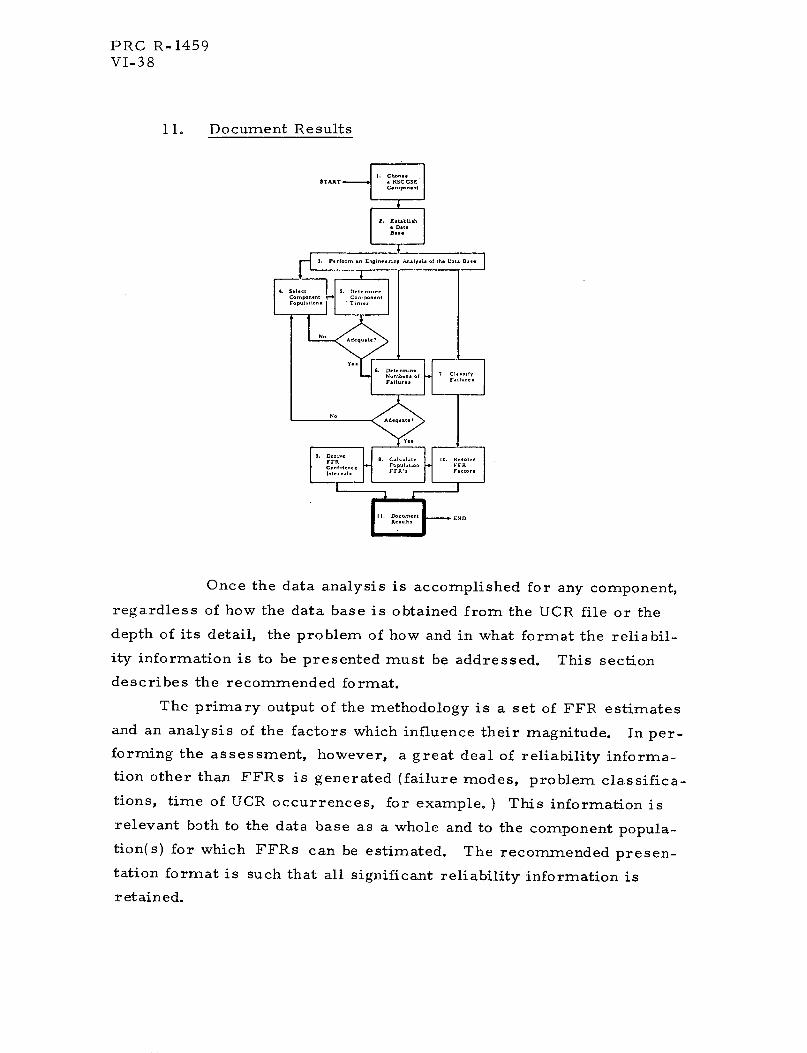
PRC R-1459VI-38
11. Document Results
Once the data analysis is accomplished for any component,
regardless of how the data base is obtained from the UCR file or the
depth of its detail, the problem of how and in what format the reliabil-
ity information is to be presented must be addressed. This section
describes the recommended format.
The primary output of the methodology is a set of FFR estimates
and an analysis of the factors which influence their magnitude. In per-
forming the assessment, however, a great deal of reliability informa-
tion other than FFRs is generated (failure modes, problem classifica-
tions, time of UCR occurrences, for example. ) This information is
relevant both to the data base as a whole and to the component popula-
tion(s) for which FFRs can be estimated. The recommended presen-
tation format is such that all significant reliability information is
retained.
PRC R-1459VI-39
Essentially, the format is a self-contained report, called a Re-
liability Assessment. A summary page is provided as the first page
of the assessment. Exhibit 15 is the summary page for the component,
crr:ectors. The component is identified, the date the UCR historical
aIe- vvas interrogated for relevant UCRs, the number of UCRs forming
the data base, the estimated FFR based on the analysis, an indication
of the range of failure times involved in the FFR calculation together
with the total observations used in the calculation, total repair time
involved in correction of the reported UCR problem, and finally a table
showing the relationship between identified failure modes and cause of
failure. The intent is to provide a convenient reference for selected
reliability elements as they pertain to the data base as a whole and to
component populations within the data base.
The remaining pages of the Reliability Assessment provide backup
information for the summary page and other data of interest that result
as the methodology is applied to the particular data base. The elements
discussed in the remaining sections of each assessment are as follows:
o Component Description
o Data Base
o Engineering Analysis
o Component Populations
o Component Times
o Component Failures
o Failure Classifications
o Field Failure Rates
o FFR Confidence Intervals
o Resolution of FFR Factors
Each of these document the results of one step in the methodology.
Additional sections are added to discuss particular problems of interest
to the given component, to analyze repair time data or for any other
reason which will enhance the overall reliability assessment.
Twenty examples of the output of this step are documented in
Section II.
1The format of the summary page has been altered somewhat from thatshown in Exhibit 15 but retains the same basic information. The newformat is used for all 20 RACs of Section II.

PRC R-1459VI-40
RELIABILITY ASSESSMENT
Component Connectors (UCR Major
(1)Currency
Item Code 423)
16 June 1969
Number of Relevant UCR's
Field Failure Rate(Failures / ,000 Hours)
Minimuml Mean
70Time-to-Failure( Hours )
-0Tinle-to- Repair( Hours )
Number ofMaximum Observation s
7,460 26,280 25
3-1/3 36 100
Mode of Failure
DamagedConnector
UnsatisfactoryConnection 9.2 3.1
Proximate Cause of Failure
PreventiveO & M Quality Design Maintenance
No rmalService
19.6
DamagedPins 8.6 1.8 3.6
Miscellaneous
Inoperative
58 17 14
Problem Classification (Percent)
Note: (1) Date of the UCR run from which the analysis was performed.
8.0 2.5 0.6 1.2 12
EXHIBIT 15 - SUMMARY PAGE FOR RELIABILITY ASSESSMENT OFCONNECTORS
163
0.134
N
All
8.6 1.8 30
13.5 1.2 27
9.2 23
7.5 8
100
-1
All 9 2

PRC R-1459VI-41
12. Analyze Repair Time Data
In the old UCR system repair time data is often entered on
the UCR, it is not an element in the new system. These data are en-
tered in three categories (1) time-to-locate, (2) time-to-repair, and
(3) total down time, and should be analyzed wherever possible.
Cumulative plots of the frequency of occurrence versus downtime
might be constructed for various populations and subpopulations of in-
terest. For example, a previous analysis of amplifiers indicated an
overall median repair time five times greater than that exhibited when
repair was effected by modular replacement.
Experience indicates that the distribution of the various down-
time elements, particularly total downtime, is logarithmic-normal.
Hence, the median values and the range for each distribution should
be included. The cumulative plots suggested above are quite suitable
for this purpose, particularly if the abscissa (time in minutes) is en-
tered on a logarithmic scale.
An example of such an output is shown in Exhibit 16. This data
is taken from the Phase II assessment of cable assemblies.
1The complete assessment is contained in the first cited report of thebibliography, Subsection VI.D.

PRC R-1459VI-42
0oo
I 00o
O
h4
H
pq
0
wJJ
*, H
0 0
H
_ _ _ _ _ _ I _ _ _ _O
L~~~~~~~~~k~~~~~~'~ ~~~~~~ I -
I 0I0
I~~ H!
I ~ ~ ~~ HU)
i~~~~~i~~~~~~~~~~~! ~~~~~~~I I
t-4f
H-4
°x
Ca 00O O O O O o
1O Ln '1 cn nl
(:uaoz.ad) ADuanbaij a.l:elnunD

PRC R-1459VI-43
D. Bibliography
This section lists those documents which are of general interest
in attempting to implement the methodology. Each bibliographical entry
is followed by some remarks indicating its specific utility.
1. Planning Research Corporation, PRC R-1432, KSC Programfor Investigating and Generating Field Failure Rates, Phase II,Eloise E. Bean and Charles E. Bloomquist, 1 May 1970 (Re-stricted to Kennedy Space Center)
This document is very nearly indispensable in the generation of
component reliability assessments. Seven complete assessments are
included covering connectors, tail service masts at launch complex 39,
holddown arms, cable assemblies, capacitors, amplifiers (15 types)
and pressure switches. In addition a summary of the methodology is
included and a list of potential applications of the results of the assess-
ments is given.
2. Planning Research Corporation, PRC R-1248, KSC Programfor Investigating and Generating Field Failure Rates, Eloise E.Bean and Charles E. Bloomquist, 31 December 1968 (Re-stricted to Kennedy Space Center)
This report covers the first (or Phase I) effort by PRC in the re-
liability assessment of KSC GSE components. Four electromechanical
components were analyzed and the results are contained in Section IV
of this report. The components are tail service masts, umbilical swing
arms, regulators, and solenoid valves. A detailed analysis of the data
base collected under the old UCR system is contained in this report as
well as a block by block analysis of the UCR report form itself.
3. John F. Kennedy Space Center, K-AM-050/1, Guide for thePreparation of Discrepancy Records Unsatisfactory Condi-tion Reports, and Investigative and Corrective Action Reports,Revision 1, 1 December 1966
This document explains the operation of the UCR system in effect
prior to 15 October 1969 and together with the appropriate code tables
should be of considerable assistance in retrieving UCRs from the com-
puterized data bank and resolving any problems of interpretation for the
old UCR system.

PRC R-1459VI-44
4. John F. Kennedy Space Center, NASA Management Instruc-tion KMI 5310.11A/QA, Nonconformance Reporting and Cor-rective Action System, 8 January 1971
This document explains the operation of the UCR system in effect
since 15 October 1969 (the new system) and together with the appropriate
code tables should be quite useful in retrieving UCRs from the data bank
and resolving any problems of interpretation for the new UCR system.
5. Epstein, B., Statistical Techniques in Life Testing,PB171580, distributed by U. S. Department of Commerce,Office of Technical Services
This document contains the details of the derivation of confidence
intervals for failure rates that is used in the methodology.