copy of ncsu workshop - dti.1
TRANSCRIPT

Diffusion Tensor Imaging of Multiple Sclerosis Along the Corpus Callosum
Erin DeNardo, Washington University in St. LouisDelaram Farzanfar, University of TorontoJoanna Jeon, University of VirginiaShivangi Mistry, University of VirginiaAinslee Neu, University of MinnesotaKatie Santo, University of Minnesota Tinashe Tapera, Drexel University
May 27th, 2016

Research Question
Do water diffusion profiles along the corpus callosum fibers correlate with the diagnosis of multiple sclerosis ?
○ Understand how diffusion properties are changing along the callosal fiber tracts
○ Predict the likelihood of having MS based on the FA values and gender

Multiple Sclerosis
● Damage to myelin sheath; protective tissue covering axons
● Transmission of nerve impulses impaired
● Damage may be caused by inflammation, lesions, scars, plaques scattered throughout the CNS
● Common symptoms include autonomic, visual, motor & sensory problems

What is Diffusion Tensor Imaging…?
● MRI based imaging method ● Sensitive to microscopic
motion of water molecules ● Water molecule movement
is different in different tissues
● Sensitive to disruption of tissue microstructure
Higher FALower FA
www.na-mic.org
Closer to 0 Closer to 1

Callosal Fibers
http://www.intropsych.com/ch02_human_nervous_system/hemisphe
ric_specialization.html
Left Right

Data Visualisation: Mean Data and Differences of Means
Data Source: MRI/DTI data were collected at Johns Hopkins University and Kennedy-Krieger Institute

Identifying the Difference between MS and Control Points: Independent T-tests
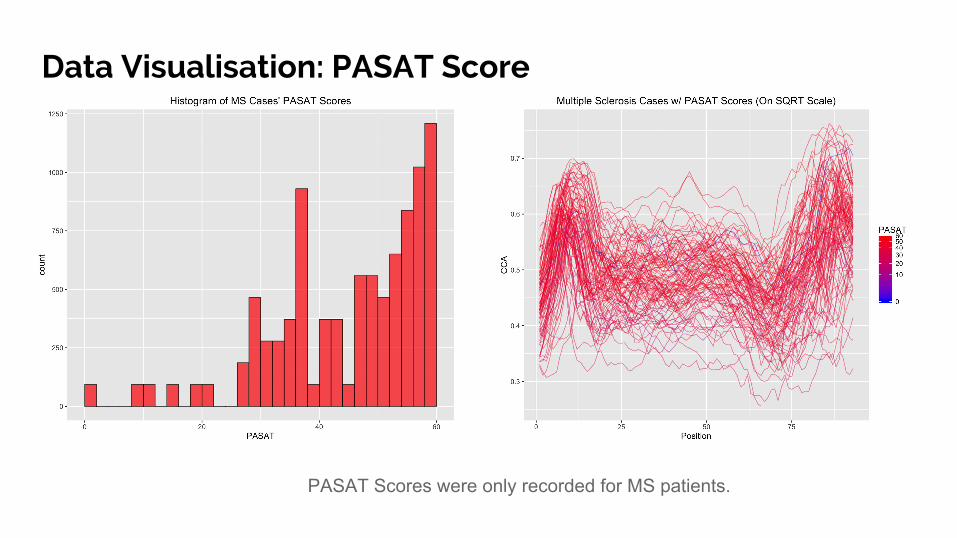
Data Visualisation: PASAT Score
PASAT Scores were only recorded for MS patients.

Data Visualisation: Q-Q Plots

Methodical Approach
1. All Data Points 2. Three equal segments 3. Every 10th Point
● Independent T-tests at each location ● Logistic Regression Models
○ 1. Overall (all 93 points)○ 2. Grouped (split into 3 sections of 31 points)○ 3. Alternating (every 10th point)○ 4. Functional Model
4. Functional Model

Logistic Regression
We have a binary output variable MS, and we want to model the conditional probability
Pr(MS = 1 | X = x) as a function of x.

Train & Test Validation
Data Set
Training Set Test Set
Learned modelLearning
Prediction Accuracy Estimate
5%95%
# Train on Test on Correct
1 S2...S93 S1 90/93
2 S1,S3...S93
S2 75/93

Regression Models

Overall Model (Using All Points)
● Assumes that all points along corpus callosum are predictive● There is high collinearity ● High standard errors ● Very large P-values ● No points are significant ● Due to high correlation between adjacent points ● Prediction accuracy 66%

Grouped Model (3 Equal Segments)
● We originally suspected that the peaks may represent specific regions● May be biologically informed● For practical purposes, we simplified the segments into equal lengths ● Each of the three predictors were significant
○ Region 1: p < 0.001 ○ Region 2: p < 0.001 ○ Region 3: p < 0.001
● Prediction accuracy 76%

Alternating Model (Every 10th)
● Reduce the number of predictors ● Increase the distance between the points ● Two points 13 (p > 0.037) and 73 (p > 0.024) were significant● Prediction accuracy 71%

Functional Model
● Functional data analysis ● Model: Functional
Generalized Additive Model (FGAM)
● CCA data as function as predictor of case status
Equation that FGAM is based on:

Model Prediction Accuracy
Model Prediction Accuracy AIC
Overall 66% 190
Grouped 76% 4281*
Alternating 71% 141
*To be discussed

Limitations
● Age not taken into consideration ● Model not informed by intrinsic variability along the posterior-anterior direction ● No information on the approximate location of the start and end points ● Only the first scan analyzed for patients with multiple scans

Future Directions
● Find the normal range of variability between different portions of the tract
● Develop better diagnostic criteria for MS○ Faster diagnosis for earlier treatment course
● Presence of periventricular lesions as a hallmark of MS○ Lower FA values in the middle section related to proximity to
Lateral ventricles ?○ How does this data relate to variability along the medial plane ?
Aldasoro-Cáceres V, et al. 2014 Jan 31;89(1):31-4.

Thank you !
Questions?