copyright 1990 by the american psychological association...
TRANSCRIPT
Journal of Experimental Psychology:Human Perception and Performance1990, Vol. 16, No. 1, 183-198
Copyright 1990 by the American Psychological Association, Inc.0096-1523/90/S00.75
Does Motor Programming Necessitate Response Execution?
Allen OsmanUniversity of California, San Diego
Sylvan Kornblum and David E. MeyerUniversity of Michigan
The complexity of a movement is known to affect the time it takes to initiate the movement.This effect is thought to reflect changes in the duration of processes that operate on a motorprogram. This question addressed here is whether programming a movement compels the startof its overt execution. If it does, then the programming processes may be said to occur after the"point of no return." We report results from an empirical procedure and a theoretical analysisdesigned to study processes before and after this point separately. According to our results,changes in the complexity of a movement affect only the prior set of processes. From this weargue that motor programming does not necessitate response execution and that the point of noreturn occurs very late in the information-processing system.
In his book Thinking, Bartlett (1958) observed that a"character which belongs to all bodily skills is perhaps mostvividly described in the airman's phrase 'the point of noreturn'" (p. 17). By this he meant that many actions, oncelaunched, cannot be successfully modified. "In cricket, forinstance, in the battle of wits between the bowler and thebatsman, the former is always trying to deliver a ball whichdoes something out of the ordinary after the latter is welllaunched upon his intended stroke" (p. 18).
There is little doubt that speeded voluntary movements,such as the batsman's stroke, are difficult to stop or modifyjust prior to their overt initiation. What remains uncertain,however, is whether some voluntary movements are reallypreceded by a "point of no return." In order to be effective,signals indicating the need to stop or to change a movementmust precede the movement by a certain amount of time(Logan & Cowan, 1984). Such countermanding signals(whether externally or internally generated) may in some casestake considerable time to process, as they may require centralcomputation (Poulton, 1981) or be subject to refractory effects(Smith, 1967; but see Logan & Burkell, 1986). Nevertheless,it is conceivable that, given enough time to respond to acountermanding signal, any movement can be modified atany point during its preparation, right up to its overt execu-tion.
The existence of a point of no return implies a failure ofvoluntary control over and above that caused by the reactiontime necessary to exert such control. It implies that a move-
This research was supported by Grants R01 MH37145 and R01MH38845 from the National Institute of Mental Health to S. Korn-blum and D. Meyer, University of Michigan. Participation of A.Osman was sponsored by training Grant MH16892 from the NationalInstitute of Mental Health. We thank Steven Keele, Gordon Logan,Patrick Rabbitt, David Rosenbaum, and an anonymous reviewer forhelpful comments on earlier versions of the manuscript.
Correspondence concerning this article should be addressed toAllen Osman, Department of Psychology, C-009, University of Cali-fornia, San Diego, La Jolla, California 92093.
ment is immediately preceded by a set of processes that, oncebegun, necessitate the start of overt movement regardless ofthe speed with which any attempt to stop or to modify themovement can be executed. We call these ballistic processes.Ballistic processes are preceded by, and may be distinguishedfrom, controlled processes. Although controlled processes maybe automatic in other senses (cf. Jonides, 1981), they areunder central control with respect to whether they ultimatelylead to overt movement (cf. Logan, 1981). A point of noreturn would be the temporal boundary between controlledand ballistic processes (i.e., the point at which the responsebecomes ballistic).
In this article we are concerned with the existence andlocation of the point of no return. By location we do notmean the length of time by which it follows a stimulus orprecedes a response. Rather, we are concerned with the func-tional nature of the processes before and after the point of noreturn. Determining the location of the point of no returnthus involves specifying which motor processes (e.g., responseselection or motor programming) are controlled and whichare ballistic. The discovery that a particular process is ballisticis especially important, because ballistic processes imply theexistence of a point of no return.
We report here an investigation in which we sought todetermine whether the point of no return occurs before,during, or after "motor programming." A motor program isa set of commands that control, and are set up in advance of,a sequence of movements (Keele, 1968). The discovery thatlonger or more complex movements often take more time toinitiate than do shorter or simpler ones (Henry & Rogers,1960) was an important impetus to the study of motor pro-gramming. This "response-complexity" effect is thought tooccur because more complex movements require more elab-orate motor programs, which in turn take longer to prepareor utilize (Henry & Rogers, 1960; Keele, 1981; Klapp, 1978;Sternberg, Monsell, Knoll, & Wright, 1978). The specificquestion we address here is whether the motor programmingprocesses affected by response complexity are controlled orballistic.
183

184 A. OSMAN, S. KORNBLUM, AND D. MEYER
The answer to this question may help us to discriminatebetween alternative models of motor programming. For ex-ample, one model attributes response-complexity effects todifferences in the time required to read the motor programfrom long-term memory into a short-term motor-programbuffer (Klapp, 1976, 1978). Because this model hypothesizesa single mechanism that ought not to require response exe-cution, it implies that response complexity should affect onlycontrolled processes. A second model explains response-com-plexity effects in terms of the time needed to edit the programwhile it resides in the buffer and to traverse its hierarchicalstructure from the highest to the lowest node that controls thefirst element of the movement (Rosenbaum, Hindorff, &Munro, 1987; Rosenbaum, Inhoff, & Gordon, 1984). Thetraversal process could conceivably be either controlled orballistic, but editing ought not to cause response execution.This model therefore implies that at least some of the proc-esses affected by response complexity are controlled. Finally,according to a third model (Steinberg et al., 1978), the pro-cesses affected by response complexity involve searching themotor-program buffer for the "subroutine" that controls thefirst element of the movement and then performing a secondset of "unpacking" operations on the subroutine. Since bothsearching and unpacking could be either controlled or ballis-tic, this model cannot be rejected on the basis of the particularclass of processes that are affected by response complexity.
The question of whether motor-programming processes arecontrolled or ballistic is also relevant to the issue of whethersimple or choice reaction time should be used to study re-sponse-complexity effects (Klapp, 1978; Sternberg et al.,1978). In the simple reaction time procedure, subjects knowprecisely what movement they will have to make before theoccurrence of the response signal. If programming involvesonly controlled processes, and if the results of these processescan be stored, subjects could preprogram their responsesbefore the signal. Because reaction time is measured from theonset of the signal, the effects of response complexity onmotor programming would not be reflected in the reactiontime. Yet, response-complexity effects are consistently foundin simple reaction time experiments (e.g., Henry, 1980; Henry& Rogers, 1960; Sternberg et al., 1978). One reason for thismight be that at least part of motor programming is a ballisticprocess. Subjects would then be forced to wait for the responsesignal to complete programming in order to avoid respondingon catch trials or making anticipations.
General Approach
Our aim is to determine whether response complexityaffects controlled or ballistic processes. To accomplish thisgoal we employed an approach developed in a previous article(Osman, Kornblum, & Meyer, 1986). The approach utilizesa countermanding procedure and race model to measureseparately the effects of experimental manipulations on con-trolled and ballistic processes. This particular application ofthe race model to the results of the countermanding procedurebuilds upon previous work by Oilman (1973) and Logan(1981) and is similar to that of Logan and Cowan (1984). We
briefly describe this approach below. (For a fuller discussionrefer to Logan and Cowan (1984) or Osman et al. (1986)).
The Countermanding Procedure
The name countermanding comes from the fact that sub-jects are sometimes required to cancel a response to a previ-ously issued command. The procedure involves randomlyinterleaving two types of trials: go trials and stop trials. Gotrials are like those used in standard simple and choice reac-tion time experiments, in which subjects must make a desig-nated response to a go signal as quickly as possible whilemaintaining a high degree of accuracy. Stop trials are similarto go trials, except for the occurrence of a stop signal followingthe go signal. Subjects must respond quickly to the go signalbut should attempt to avoid responding if they subsequentlydetect the stop signal. Of course, subjects never know whetherthe current trial is a go or a stop trial until the actualoccurrence of a stop signal.
We will be especially concerned with three dependent vari-ables that are associated with the countermanding procedure:the reaction time on go trials; the reaction time on stop trialsin which subjects fail to withhold their responses; and responsefunctions. Response functions, denoted -PR(SOA), give theprobability of responding on stop trials (i.e., failing to inhibit)as a function of the time interval (stimulus onset asynchrony,or SOA) between the go and stop signals. We call this intervalthe signal lag. As the signal lag increases, the probability ofresponse inhibition [1 - .PR(SOA)] typically decreases.
The Race Model
The model that we use to interpret these variables involvesthree independent sets of processes and a point of no return.The three sets consist of the controlled and ballistic processesintroduced earlier, and an inhibition process. According tothe model, stop trials involve a race between the controlledand inhibition processes with the point of no return as thefinish line: If the controlled process wins, then the responsewill occur in spite of the stop signal; if the inhibition processwins, then the response will be aborted.
Equations 1-3 show how the race model defines the de-pendent measures of the countermanding procedure. Tc, TI,and TB correspond to the completion times of the controlled,inhibition, and ballistic processes and are assumed to beindependent random variables. Equation 1 shows the reactiontime on go trials:
RTGo = Tc (D
Here there is no race, so reaction time is simply the sum ofthe completion times for the controlled and ballistic processes.Equation 2 expresses the reaction time on stop trials in whicha response occurs:
RTstop = < (T, + SOA))] + TB. (2)
Here there is a race, and it was won by the controlled process.Reaction time is therefore the time taken by the controlled

MOTOR PROGRAMMING AND RESPONSE EXECUTION 185
process, given that it beat the inhibition process, plus the timetaken by the ballistic process. The response function, orprobability of responding on a stop trial, is shown in Equa-tion 3:
/>R(SOA) = P[TC - SOA]. (3)
The right side of the equation represents the probability thatthe signal lag plus the time taken by the inhibition process isgreater than the time taken by the controlled process to reachthe point of no return. Plotting this probability as a functionof signal lag gives us the entire response function, which maybe viewed as a type of psychometric function or cumulativedistribution function that has its own mean and variance overthe temporal domain.
Measuring Controlled and Ballistic Effects
We now have the machinery in place to measure separatelythe effects of various factors on controlled and ballistic proc-esses. These effects cannot be observed directly. However,they can be inferred, by means of the race model, fromchanges in reaction time on go trials and in the responsefunctions. According to the race model, any change in meango-trial reaction time is the sum of the change in meancontrolled-process time and the change in mean ballistic-process time, as shown in Equation 4:
AMGo = AAfB, (4)
where AMGo, AA/C, and AMB denote respectively the changesin the means of go-trial reaction time, controlled-processcompletion time, and ballistic-process completion time. Sim-ilarly, any change in the mean of the response function equalsthe change in the mean controlled-process time minus thechange in the mean inhibition-process time, as shown inEquation 5:
AMR = AMC - AM,, (5)
where AMR and AM, denote changes in the means of theresponse function and inhibition processes. If we assumefurther that the inhibition process remains unchanged by thefactor manipulation under study, Equation 5 reduces to Equa-tion 6:
= AMC, (6)
where the change in the response function simply equals thechange in the controlled processes alone. The change in themean ballistic-process time would then equal the change inthe mean go-trial reaction time minus the change in the meanof the response function, as shown in Equation 7:
AMB = AMGo - AMR (7)
Thus, by observing changes in the response function andcomparing these changes to those in go-trial reaction time,we can study the separate effects of factors on controlled andon ballistic processes. Note, however, the importance of theassumption that the inhibition processes remain unchangedby these factors.
Overview of Experiments
Here we report two experiments designed with three goalsin mind.
First, we wanted to use our approach to discover whetherresponse complexity affects controlled or ballistic processes(Equations 6 and 7). If response complexity affects controlledprocesses only, then it should produce equal effects on meango-trial reaction time and the mean of the response function.If response complexity affects ballistic processes only, then itshould affect go-trial reaction time, but not the responsefunction. Finally, if response complexity affects both con-trolled and ballistic processes (in the same direction), it shouldaffect both measures, but mean go-trial reaction time to agreater degree.
In these experiments, we manipulated response complexityby requiring subjects to press a response key a differentnumber of times in quick succession. Based on previousresearch on typing (Sternberg et al., 1978) and key presses(e.g., Rosenbaum et al., 1987, 1984), such a manipulationseemed likely to produce the desired effect. Moreover, suchresponse-complexity effects may be quite general. Qualita-tively similar effects have been found for both typing andspeech production (Sternberg et al., 1978). We manipulatedresponse complexity in slightly different ways in each experi-ment. In Experiment 1, we varied the number of taps thatwere all made by the same finger. In Experiment 2, we variedthe number of taps made by one finger that followed a singletap by the homologous finger on the other hand. We refer tothese manipulations as "within hand" and "between hands,"respectively.
Our second goal was to reinforce our inferences concerningresponse complexity by verifying whether the assumptionsunderlying our approach were satisfied in these particularexperiments. One check involved manipulating an additionalcontrol factor—lexical status. This factor distinguishes wordsfrom nonwords and affects the time taken to make a lexicaldecision. When subjects have to decide whether a letter stringis an English word, they are faster to respond "yes" to wordsthan "no" to nonwords (Meyer & Schvaneveldt, 1971). Thisdifference presumably stems from an effect of familiarity onperceptual and memorial processes. Our previous research(Osman et al., 1986) has shown that the effect of lexical statusis entirely before the point of no return and that it does notaffect the time necessary to process a stop signal. If all theassumptions underlying our approach are satisfied (Equations1 and 3), this factor should again produce equal effects onmean go-trial reaction time and the mean of the responsefunction (Equations 4 and 5).
Another check involved comparing the reaction time dis-tributions for go trials and stop trials with different stop signaldelays (Equations 1 and 2). If the internal response to the stopsignal merely prevents some of the slower controlled processesfrom contributing to overt reaction time (RT) without affect-ing their distribution of finishing times, the cumulative distri-bution functions [/^RT < t) for any given time t] for thedifferent trial types should fan out from a common minimum.All the distributions should contain the same fastest reaction

186 A. OSMAN, S. KORNBLUM, AND D. MEYER
times, but the duration and proportion of the slower timesshould increase with signal lag and be greatest on go trials.'Consequently, mean reaction time should also increase withsignal lag on stop trials, and be slowest on go trials (Osmanetal., 1986).
Our third goal was to specify further the location of thepoint of no return by acquiring additional information aboutthe location of response-complexity effects in the information-processing system. By comparing within- and between-handsresponse-complexity effects, we hoped to determine whetherprocesses peripheral enough to be unique to the control of asingle hand were involved. By observing whether responsecomplexity and lexical status had additive or interacting ef-fects on reaction time, we hoped to determine whether theyaffected any processes in common (Sternberg, 1969).
Finally, in addition to achieving these goals, the extendedsequences of taps used here also provided us with an oppor-tunity to study how a response is stopped after it has begun.We were particularly interested in comparing this with how aresponse is stopped before it has begun. We hoped that sucha comparison would provide evidence concerning the gener-ality of the stopping mechanism and would reveal any effectsof serial position on the ballistic processes that immediatelypreceded each tap. However, in these experiments, we did notgenerate complete response functions for taps other than thefirst. Consequently, it was not possible to calculate and modelthe effect of a tap's serial position in a sequence on the meanof its response function. Instead, we relied on an approachdeveloped by Logan (e.g., Logan, 1981; Logan & Cowan,1984; Logan, Cowan, & Davis, 1984). According to thisapproach, if two responses differ only with respect to thespeed of their associated controlled processes, they should beequally stoppable. By "equally stoppable," we mean that stopsignals preceding the expected occurrence of each response bythe same interval should be equally effective. Thus, in theseexperiments, we compared the stoppability of the first tap ina sequence with the stoppability of the second tap, when thefirst tap was not inhibited.
Experiment 1
In Experiment 1, we varied response complexity by havingsubjects press a response key either once or three times inquick succession with the same finger while performing alexical-decision task. In the low-complexity conditions theyindicated whether the go signal was an English word or anonword by a single press on one of two response keys. Inthe high-complexity conditions, subjects had to press thecorrect response key three times.
Method
Subjects. Twelve undergraduate students at the University ofMichigan served as paid subjects. Each subject was tested individuallyin a single 1-hour session.
Apparatus. Subjects sat in a moderately illuminated, sound-atten-uating booth throughout each session. Visual and auditory stimuliwere presented with a Hewlett Packard 2126A video terminal viewedat a distance of about 35 cm. Manual responses with the right andleft index fingers were made by depressing the Z and / keys on the
terminal keyboard. The keyboard was located in front of the terminaland placed so that subjects' arms rested comfortably on the table.Stimulus presentation and response collection were controlled by adigital computer (DEC-PDF 11/34).
Stimuli. The stimuli included a warning signal, four-letter stringsfor go signals, and a stop signal. The warning signal was a dashed linethat appeared on the terminal immediately below the location of thego signal. The go signals each contained four capital letters, whichtogether subtended about 1.4° of visual angle in width and about 0.5°in height at the viewing distance of 35 cm.
There were 120 different English words (e.g.,_/oorf) and 120 differ-ent nonwords (e.g., mafe) used as go signals. The words consisted offamiliar nouns and verbs whose frequency of occurrence in ordinarytext equaled or exceeded 32 per million (Kucera & Francis, 1967).The nonwords were pronounceable strings obtained from other Eng-lish words by altering individual vowels or consonants without vio-lating the orthographic rules of English (Venezky, 1970).
The stop signal was a brief tone presented at a comfortable listeninglevel. Signal lags were adjusted for each subject by a staircase trackingalgorithm that independently adjusted the lag values for each of fourexperimental conditions to yield average response probabilities of50% in each (Levitt, 1971). The algorithm decreased the signal lag by50 ms whenever subjects responded on a stop trial and increased thelag by 50 ms whenever they successfully inhibited their response.
Design. The experimental design is shown in Table 1. Two in-dependent variables, lexical status and response complexity, weremanipulated orthogonally to produce four experimental conditions.Stop signals were presented on one fourth of all trials, occurringequally often in each experimental condition. Words and nonwordsoccurred equally often in each block, and low- and high-complexityresponse sets were alternated between blocks. Both the stimulus-response mapping and the order of block presentation were balancedacross subjects.
Procedure. Subjects were tested with the countermanding proce-dure described earlier. Their fingers rested on the relevant responsekeys at all times. At the start of each trial, a warning signal appearedin the center of the terminal screen and was replaced 500 ms later bya four-letter string that served as the go signal. The go signal waseither a word or a nonword, and subjects had to make a lexicaldecision that determined whether to press the right or left key. In thelow-complexity conditions, the correct response key had to be pressedjust once. In the high-complexity conditions, the correct key had tobe pressed three times in quick succession. The first keypress causedthe go signal to vanish from the screen. Stop trials were identical togo trials except that the stop signal followed the go signal, whichdisappeared immediately if it was still on the screen. The warningsignals on successive trials were separated by an interval of 2.25 s plusfeedback presentation time.
Feedback was presented on all stop trials, after errors on go trials,and after each trial block. The word ERROR appeared on go trials ifthe subjects pressed the wrong key, pressed the incorrect number oftimes, or did not respond within 1.5 s after the go signal. On stoptrials, GOOD was presented if the subjects inhibited their responsesuccessfully, and OOPS was presented if they failed to withhold the
1 One way to understand this predicted pattern is to consider theimplicit response to stop signals as a filter for controlled processesinduced by the go signal. On stop trials, only the controlled processesthat beat the inhibition process activate ballistic processes and thuscontribute to reaction time. When the stop signal occurs early, onlythe fastest controlled processes escape inhibition. When the stop signaloccurs later, slower controlled processes also contribute to stop-trialreaction times. On go trials, all controlled processes, both fast andslow, contribute to reaction time.

MOTOR PROGRAMMING AND RESPONSE EXECUTION 187
Table 1Design of Experiment 1
Relative frequency oftrial types
Complexity
Low
Response
1 Li or 1 Ri
Words(e.g.,/ooof)
Go Stop
3/16 1/16
Nonwords(e.g., mafe)
Go Stop
3/16 1/16
High 3 Li or 3 Ri 3/16 1/16 3/16 1/16
Note. Li and Ri denote the left and right index fingers.
entire response. The trial feedback remained visible for 250 msimmediately below where the warning signals were presented. Aftereach block, the subjects' mean reaction time on go trials, number oferrors on go trials, and number of inhibited responses on stop trialsfor that block were displayed.
The instructions to subjects stressed speed on go trials over suc-cessful inhibition on stop trials. Subjects were told to complete theentire response sequence as quickly as possible without making morethan 5% errors on go trials. They were also told that they should tryhard to stop themselves from responding if they detected the stopsignal but that this would not always be possible.
Subjects were tested in a single session with 16 blocks of 48 trialseach. The first two trial blocks included only go trials, to familiarizesubjects with the lexical-decision task. The next six blocks were usedto familiarize subjects with the countermanding procedure (stop plusgo trials) and to let the tracking algorithm locate the right vicinity forthe stop-signal lags. Only the last 8 blocks were included in the dataanalysis.
Results
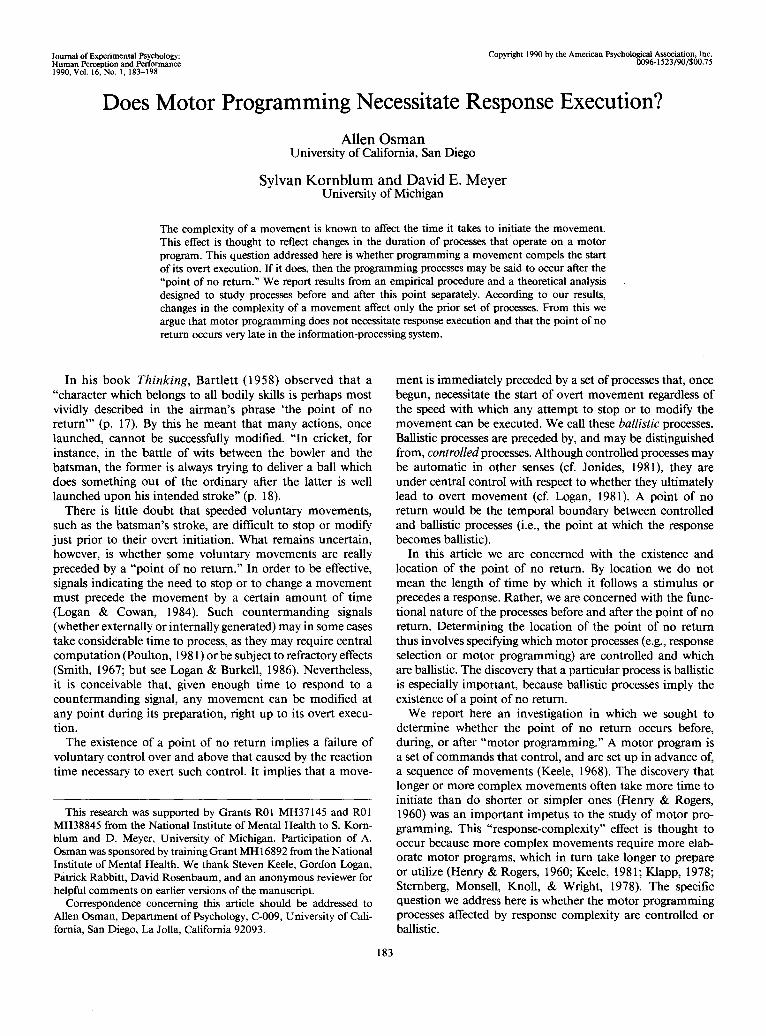
Reaction times and error rates. Figure 1 shows meanreaction times and error rates on go trials in the left paneland on stop trials in the right panel under each experimentalcondition. The reaction times for go trials show an effect oflexical status [mean difference = 42 ms; ;(!!) = 3.52; /^one-tailed) < .01] and response complexity [mean difference = 30ms; f ( l l ) = 3.21; p(one-tailed) < .01], with the two effectsbeing additive [mean interaction = 2 ms; t(\ 1) = 0.24; p >.85]. Stop trials were also affected by lexical status [meandifference = 24 ms; £(11) = 1.94; p(one-tailed) < .05] andresponse complexity [mean difference = 18 ms; /(!!)= 1.81;/"(one-tailed) < .05]. As predicted by the race model, meanreaction time on stop trials was faster than on go trials foreach combination of the two factors: low-complexity re-sponses to words [mean difference = 42 ms; ?(11) = 3.57;p(one-tailed) < .01], low-complexity responses to nonwords[mean difference = 50 ms; r ( l l ) = 5.46; p(one-tailed)< .001], high-complexity responses to words [mean difference= 44 ms; /(!!) = 3.55; (one-tailed) < .01], high-complexityresponses to nonwords [mean difference = 71 ms; t( 11) =6.74; one-tailed) < .0001].
Error rates appear at the bottom of Figure 1. They weregenerally low and gave no indication that the effects onreaction time of lexical status, response complexity, or trialtype were due to a speed-accuracy trade-off. Responses towords were no less accurate than responses to nonwords on
go trials [mean difference = -0.04%; r ( l l ) = -0.05;tailed) > .50] or on stop trials [mean difference = -2.73%;t(\\) = — 1.95;p(one-tailed)>.95]. Low-complexity responseswere no less accurate than high-complexity responses on gotrials [mean difference = 0.31%; t(\ 1) = 0.35;p(one-tailed) >.35] or on stop trials [mean difference = 1.2%; t(\\) = 0.71;p(one-tailed) > .25]. Finally, responses were no less accurateon stop trials than on go trials [mean difference = 0.19%;t( 11) = 0.18; p(one-tailed) > .40].
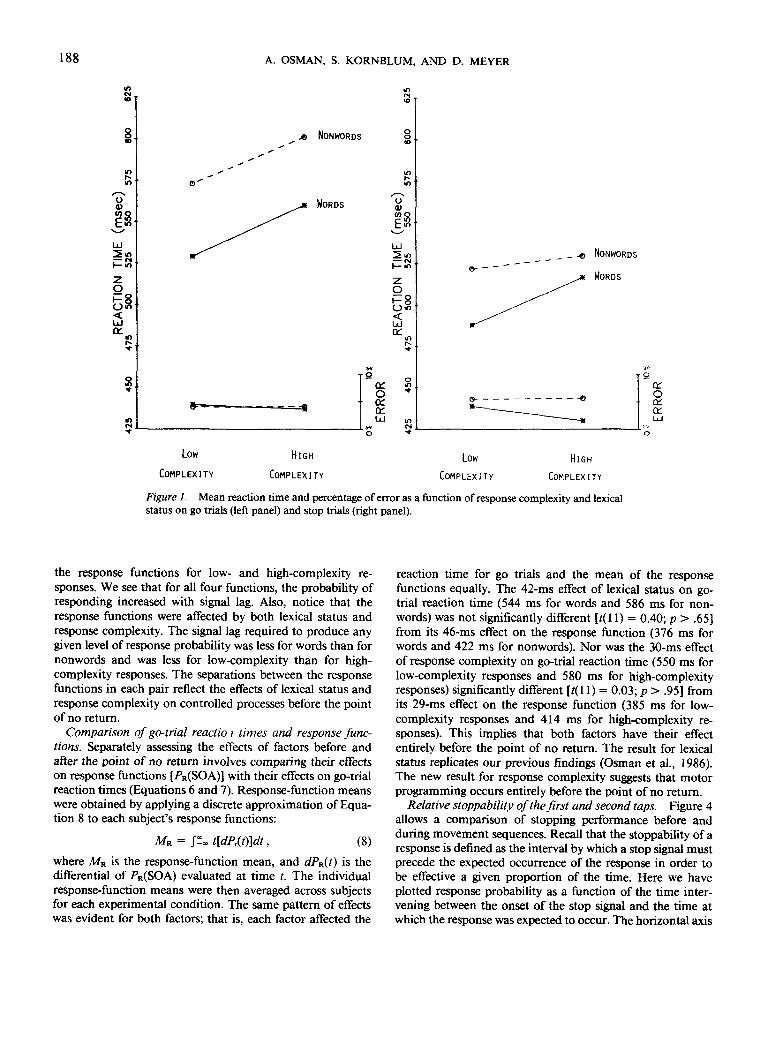
Further support for the race model is shown in Figure 2,which displays group cumulative distribution functions ofreaction times on stop trials and go trials in each of the fourexperimental conditions. These group functions were ob-tained by averaging the quantiles of the functions (Vincentiz-ing) from individual subjects (Thomas & Ross, 1980).2 Thefan pattern predicted by the model was obtained in eachcondition. Note that the minima are smaller for go trials. Thisis as anticipated because the expected value of a sampleminimum decreases as sample size increases, and there werethree times as many go trials as stop trials in each condition.However, after crossing at a low quantile, each pair of cu-mulative distribution functions increasingly diverge at longerreaction times, with stop trials to the left of go trials.
Response probability and stop signal lags. The mean signallag and response probability for each experimental conditionare shown in Table 2. We see here that the staircase trackingalgorithm worked quite well in yielding response probabilitieson stop trials that were close to 50% in each condition. Signallags were shorter for responses to words than to nonwordsand shorter for low-complexity than for high-complexity re-sponses.
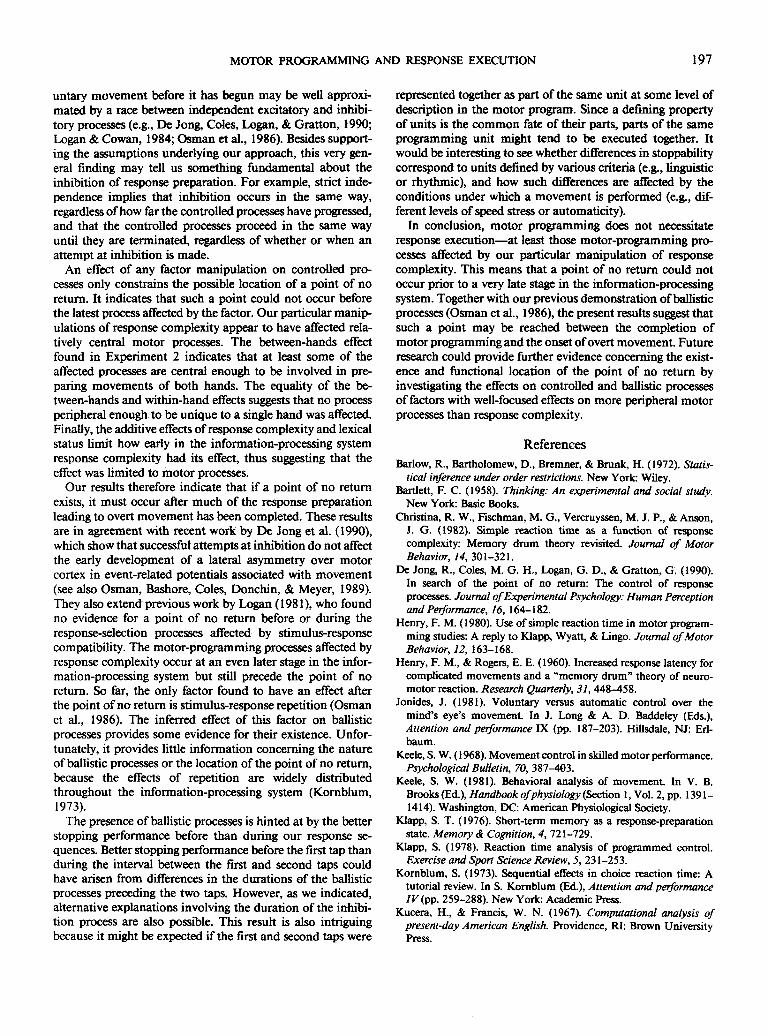
Group response functions appear in Figure 3. These func-tions were obtained by plotting the response probability onstop trials against signal lag for each subject in each condition.This was possible because the staircase tracking algorithmcontinuously varied the signal lags over a range wide enoughto include the entire response function. The functions forindividual subjects were monotonized (Barlow, Bartholomew,Bremner, & Brunk, 1972) and combined into group functionsby Vincentizing (Footnote 2). The upper panel of Figure 3allows a comparison of the response functions for word andnonword stimuli, and the lower panel allows a comparison of
Vincintizing involves averaging the values associated with a fixedprobability level (quantile) across probability functions. We appliedit here to average across subjects' reaction time distributions (Figures2 and 7), response functions (Figures 3 and 8), and stoppabilityfunctions (Figures 4 and 9). In effect, this involved averaging theabscissa values (times) associated with each ordinate (probability).This procedure yields group functions whose shapes are more repre-sentative of their individual constituents than does the more commonprocedure of averaging the probabilities associated with each time. Inparticular, if a parameter can be expressed as (or approximated by) alinear combination of quantiles, its value for the group function willbe the average of its values for the individual functions (e.g., theinterquartile range of the group function will be the average of theinterquartile ranges of all the individual functions). Vincentizing istherefore appropriate for presenting group data in the followingdiscussions, in which we will be concerned with the average differencebetween quantiles associated with the functions of individual subjects.
188 A. OSMAN, S. KORNBLUM, AND D. MEYER
Zo
bJoc
js NONWORDS
WORDS o<U(OC
zo
Lda:
9OXO
• cc
NONWORDS
WORDS
crOQi
Low
COMPLEXITYHIGH
COMPLEXITYLow
COMPLEXITY
HIGH
COMPLEXITY
Figure 1. Mean reaction time and percentage of error as a function of response complexity and lexicalstatus on go trials (left panel) and stop trials (right panel).
the response functions for low- and high-complexity re-sponses. We see that for all four functions, the probability ofresponding increased with signal lag. Also, notice that theresponse functions were affected by both lexical status andresponse complexity. The signal lag required to produce anygiven level of response probability was less for words than fornonwords and was less for low-complexity than for high-complexity responses. The separations between the responsefunctions in each pair reflect the effects of lexical status andresponse complexity on controlled processes before the pointof no return.
Comparison of go-trial reactio i times and response func-tions. Separately assessing the effects of factors before andafter the point of no return involves comparing their effectson response functions [.PR(SOA)] with their effects on go-trialreaction times (Equations 6 and 7). Response-function meanswere obtained by applying a discrete approximation of Equa-tion 8 to each subject's response functions:
/!!«, t[dPM]dt, (8)
where MR is the response-function mean, and dPR(t) is thedifferential of /"R(SOA) evaluated at time t. The individualresponse-function means were then averaged across subjectsfor each experimental condition. The same pattern of effectswas evident for both factors; that is, each factor affected the
reaction time for go trials and the mean of the responsefunctions equally. The 42-ms effect of lexical status on go-trial reaction time (544 ms for words and 586 ms for non-words) was not significantly different [?(!!) = 0.40; p > .65]from its 46-ms effect on the response function (376 ms forwords and 422 ms for nonwords). Nor was the 30-ms effectof response complexity on go-trial reaction time (550 ms forlow-complexity responses and 580 ms for high-complexityresponses) significantly different [/(!!) = 0.03; p > .95] fromits 29-ms effect on the response function (385 ms for low-complexity responses and 414 ms for high-complexity re-sponses). This implies that both factors have their effectentirely before the point of no return. The result for lexicalstatus replicates our previous findings (Osman et al., 1986).The new result for response complexity suggests that motorprogramming occurs entirely before the point of no return.
Relative stoppability of the first and second taps. Figure 4allows a comparison of stopping performance before andduring movement sequences. Recall that the stoppability of aresponse is defined as the interval by which a stop signal mustprecede the expected occurrence of the response in order tobe effective a given proportion of the time. Here we haveplotted response probability as a function of the time inter-vening between the onset of the stop signal and the time atwhich the response was expected to occur. The horizontal axis
MOTOR PROGRAMMING AND RESPONSE EXECUTION
STOP Go o STOP
189
Go£.
'0 200 400 600 800 1000REACTION TIME (msec)
STOP
HIGHCOMPLEXITYNONWORDS
"0 200 400 600 800 1000REACTION TIME (msec)
STOP
200 400 600 800 1000 ~0 200 400 600 800 1000
REACTION TIME (msec) REACTION TIME (msec)
Figure 2. Group cumulative distribution functions of reaction times on stop and go trials for high-complexity responses to words (top left), high-complexity responses to nonwords (top right), low-complexity responses to words (bottom left), and low-complexity responses to nonwords (bottom right).
represents expected reaction time minus stop-signal lag andthe vertical axis represents response probability.3 The func-tions on the left correspond to each of the four experimentalconditions for the first tap and were obtained by Vincentizingthe functions for individual subjects (Footnote 2). We haveseen that both lexical status and response complexity affectresponse functions, which express response probability as afunction of the interval by which the stop signal follows thego signal. However, when we plot response probability againstthe interval by which the stop signal precedes the expectedresponse, the functions from all four conditions are closelyaligned. This means that in order to produce any givenprobability of response inhibition, the stop signal must pre-
cede the expected response by the same interval in eachcondition. Logan and his colleagues (e.g., Logan, 1981; Loganet al., 1984) have previously shown this to be the case for
3 The expected time of occurrence for the first tap was estimatedfrom mean go-trial reaction time. The expected time of occurrencefor the second tap, when the first tap was not inhibited, was estimatedby adding two quantities: mean reaction time for first taps that werenot inhibited on stop trials and the mean of the interval between thefirst and second taps on go trials. Note that the accuracy of theestimated occurrence of the second tap depends on stochastic inde-pendence between the times before the first tap and the times betweenthe first and second taps.

190 A. OSMAN, S. KORNBLUM, AND D. MEYER
Table 2Mean Response Probabilities and Signal Lags forExperiment 1
Words Nonwords
Response typeProbability Lag Probability Lag
(%) (ms) (%) (ms)
Low complexityHigh complexity
5148
338372
5249
392411
factors that affect controlled processes only. The two isolatedpoints on the right of the functions are associated with thesecond taps from the multiple-response conditions, on thosestop trials in which the first tap was not inhibited; one pointis for words and the other for nonwords. Each point wasobtained by averaging response probability and expected re-action time minus mean signal lag across subjects.4 In orderto produce a given probability of response inhibition, the stopsignal had to precede the second response by approximately100 ms more than it had to precede the first response. In
RESPONSE FUNCTIONS
o°ceo.
OD_COo
WORDS NONWORDS
100 200 300 400 500 600 700 BOO 900SIGNAL LAG (msec)
OceQ_
oD.
LJa:
LowCOMPLEXITY
HIGHCOMPLEXITY
0 100 200 300 400 500 600 700 600 900 1000SIGNAL LAG (msec)
Figure 3. Group response functions for words and nonwords (upperpanel), and high- and low-complexity responses (lower panel).
other words, the stop signals were more effective at inhibitingthe entire response sequence than at stopping it once it hadbegun.5
Discussion
The results of Experiment 1 suggest that motor program-ming does not necessitate response execution. If it did, wewould have found an effect of response complexity on ballistic(i.e., unstoppable) processes. Instead, response complexityproduced the same pattern of effects as lexical status did.Each factor affected mean go-trial reaction time and the meanof the response function equally. This is the pattern expectedwhen a factor affects controlled (i.e., stoppable) processes only(cf. Equation 7).
Further evidence that response complexity and lexical sta-tus affect controlled processes only is 'provided by the resultsconcerning the stoppability of the first taps in our responsesequences (Figure 4). The functions relating response proba-bility to the interval by which the stop signal preceded theexpected reaction time (RTGo) were closely aligned for all fourconditions. This result may be better understood by consid-ering Equations 3 and 4. From Equation 3, it can be seenthat the probability of responding equals the proportion ofthe Tc - TI density function that is less than SOA. Changesin the mean of Tc merely translate the distribution along thetime axis. Equal changes in SOA will thus preserve the pro-portion of the distribution less than SOA, leaving responseprobability unaffected. From Equation 4, it can be seen thatchanges in the mean of Tc are reflected by equal changes inthe mean reaction time on go trials. Consequently, if anexperimental manipulation affects only the mean duration ofthe controlled processes, holding RTGo — SOA constantshould leave the probability of responding on stop trialsunaffected. The similar response probabilities at each valueof RTCo — SOA suggests that the reaction time differences
4 The averaging procedures used for studying the second taps (seealso Figure 9) may produce misleading results. First, the pointscalculated for individual subjects may not lie on their stoppabilityfunctions. Because of the staircase tracking algorithm, the stop signaloccurred at several lags for each subject within each condition. Thus,each point is really based on several response probabilities at severallags. Second, averaging response probability and expected reactiontime minus mean signal lag across subjects may produce points thatare not representative of the points calculated for the individualsubjects. Nevertheless, it seems highly unlikely that differences in thestoppability of the first and second taps as large as those observedhere could be due entirely to biases caused by averaging.
5 An anomolous result concerns the relative stoppability of thesecond tap for words and nonwords. Although stop signals precededthe expected occurrence of the second tap by a longer average intervalfor words than for nonwords, the response probability was greater forwords. This result could have occurred for several reasons other thana real difference in stoppability between words and nonwords: Itcould have been due to a violation of the independence assumptionunderlying our estimation of the expected occurence of the secondtap (Footnote 3), or have been an artifact of our averaging procedures(Footnote 4), or reflect sampling error due to the small number ofobservations.

MOTOR PROGRAMMING AND RESPONSE EXECUTION 191
• LOW-COMPLEXITY WORDSa HIGH-COMPLEXITY WORDS« LOW-COMPLEXfTY NONWORDS* HIGH-COMPLEXITY NONWORDS
100 200 300RT - SOA (msec)
400 500
Figure 4. Response probability as a function of expected reaction time minus signal lag for first andsecond taps at each level of lexical status and response complexity.
between the four experimental conditions were all due todifferences in the duration of controlled processes.
The results of Experiment 1 also support the validity ofsome of the assumptions used to infer the locus of response-complexity effects. First, finding equal effects on both go-trialreaction time and the response functions supports the as-sumption that the inhibition process was unaffected by ma-nipulations of either lexical status or response complexity(Equations 4 and 5). Second, the reaction time data providesupport for applying the race model to the countermandingprocedure. In each experimental condition, the mean reactiontime was slower on go trials than on stop trials, and the twocumulative distributions formed the expected fan pattern.
Apparently, the point of no return occurs after the processesaffected by our manipulation of response complexity. Butwhere in the information-processing sequence do these pro-cesses occur? The additivity of lexical-status and response-complexity effects is consistent with the hypothesis that thelatter factor affected only motor processes. However, themotor processes affected by response complexity could beeither relatively central or peripheral. Further evidence con-cerning the locus of response-complexity effects would helpus to locate the point of no return more precisely.
Such evidence would also bear on a hypothesis that weshould consider before definitely concluding that our manip-ulation of response complexity really affected motor program-ming. The response-complexity effects found in Experiment1 could have resulted from changes in the physical parametersof the first movement, rather than from changes in motorprogramming (Christina, Fischman, Vercruyssen, & Anson,Klapp, 1978; 1982). Movement force, and consequently ve-locity, might have been greater for taps made in isolation than
for taps followed by other subsequent taps. Perhaps subjectstapped more gently in order to return quickly to a positionfrom which to initiate the next tap. Faster movements couldhave resulted in shorter reaction times because the terminalkeys must travel some distance before they trigger the mi-croswitch that stops the clock. If such an artifact contributedto the response-complexity effect found in Experiment 1, thepoint of no return would have to occur quite late in order tofollow all of the affected processes. Indeed, this could meanthat subjects were able to inhibit their responses right up tothe moment at which the microswitch was depressed.
Some other questions left unanswered by Experiment 1concern the second tap in our response sequences. Are thepreparatory processes preceding this tap affected by responsecomplexity? If so, are the affected processes controlled orballistic? We were not able to answer these questions becauseonly the high-complexity sequences in this experiment con-tained a second tap. A final question concerns why stoppingperformance was better before the first tap of our sequencesthan between the first and second taps. It should be notedthat previous research has found poorer stopping performancebefore than during a response (Ladefoged, Silverstein, &Papcun, 1973), or has found no difference (Logan, 1982). Ourresults complete the set of possible outcomes. Consequently,it seemed prudent to replicate the effect first before trying toexplain it.
Experiment 2
Experiment 2 was designed to replicate Experiment 1,further localize response-complexity effects, and help answer

192 A. OSMAN, S. KORNBLUM, AND D. MEYER
some remaining questions concerning the second tap in ourresponse sequences. Subjects again performed a lexical-deci-sion task, indicating whether the response signal was a wordor nonword by pressing one of two response keys with eitherindex finger. Here, however, the first keypress was alwaysfollowed by another keypress made with the other finger onthe opposite key. In the low-complexity conditions, subjectspressed once on the opposite key, and in the high-complexityconditions, subjects pressed three times on the opposite key.One other difference between the two experiments concernedthe stop signals. Here we utilized early, middle, and late stopsignals at each level of response complexity.
Method
Subjects. Eleven undergraduate students at the University ofMichigan served as paid subjects. None had been in the previousexperiment. Each subject was tested individually in a single 1-hoursession.
Apparatus and stimuli. The apparatus and stimuli were the sameas in the previous experiment, with one exception. Here the signallags were adjusted to track average response probabilities of 29%,50%, and 71% at each level of response complexity (Levitt, 1971).The stop signals associated with these staircases are labeled early,middle, and late, respectively. On early-signal trials, the signal lag wasdecreased each time a subject responded and was increased when asubject inhibited the response twice in a row. On middle-signal trials,the signal lag was decreased each time a subject responded and wasincreased each time a subject inhibited the response. On late-signaltrials, the signal was decreased when a subject responded twice in arow and was increased each time a subject inhibited the response.The signal lag was always adjusted by an increment of 50 ms.
Design. The design is shown in Table 3. It is like that for theprevious experiment, but with signal lag as an additional factor. Stopsignals in each of the four experimental conditions were presentedequally often at early, middle, and late lags.
Procedure. The trial-by-trial procedure, instructions, and feed-back were the same as in the previous experiment. As before, gosignals consisted of words and nonwords, which determined whetherthe response was started with the left or right index finger. Here,however, the subsequent taps in the sequence were made with theindex finger on the other hand. Low-complexity sequences consistedof a single tap by one index finger followed by a single tap by theother. High-complexity sequences consisted of a single tap on oneindex finger followed by three taps on the other.
Subjects were tested in a single session of 18 blocks of 48 trials.The first two blocks contained only go signals. The remaining blockscontained both stop and go signals, but only the last 12 blocks wereincluded in the analysis.
Results
Reaction times and error rates. Figure 5 shows meanreaction times and error rates on go trials for each combina-tion of response complexity and lexical status. Again, complexresponses took longer than simple ones to initiate [meandifference = 33 ms; t(W) = 3.74; /^one-tailed) < .002].Moreover, the magnitude of this effect was no less than thatfound in the previous experiment [mean difference = — 3 ms;/(21) = —.235; /Kone-tailed) > .6]. Responses to words wereagain faster than responses to nonwords [mean difference =51 ms; f(10) = 5.40; p(one-tailed) < .0002], and the effects oflexical status and response complexity did not significantlyinteract [mean interaction = 7 ms; r(10) = 0.63; p > .5].
Error rates appear at the bottom of Figure 5. They weregenerally low and gave no evidence that the effects of eitherlexical status or response complexity on go-trial reaction timeresulted from a speed-accuracy trade-off. Low-complexityresponses were no less accurate than high-complexity re-sponses [mean difference = -3.6%; /(10) = -3.02; /^one-tailed) > .95], and responses to words were no less accuratethan responses to nonwords [mean difference = .33%; t(\0)= .339; p(one-tailed) > .25].
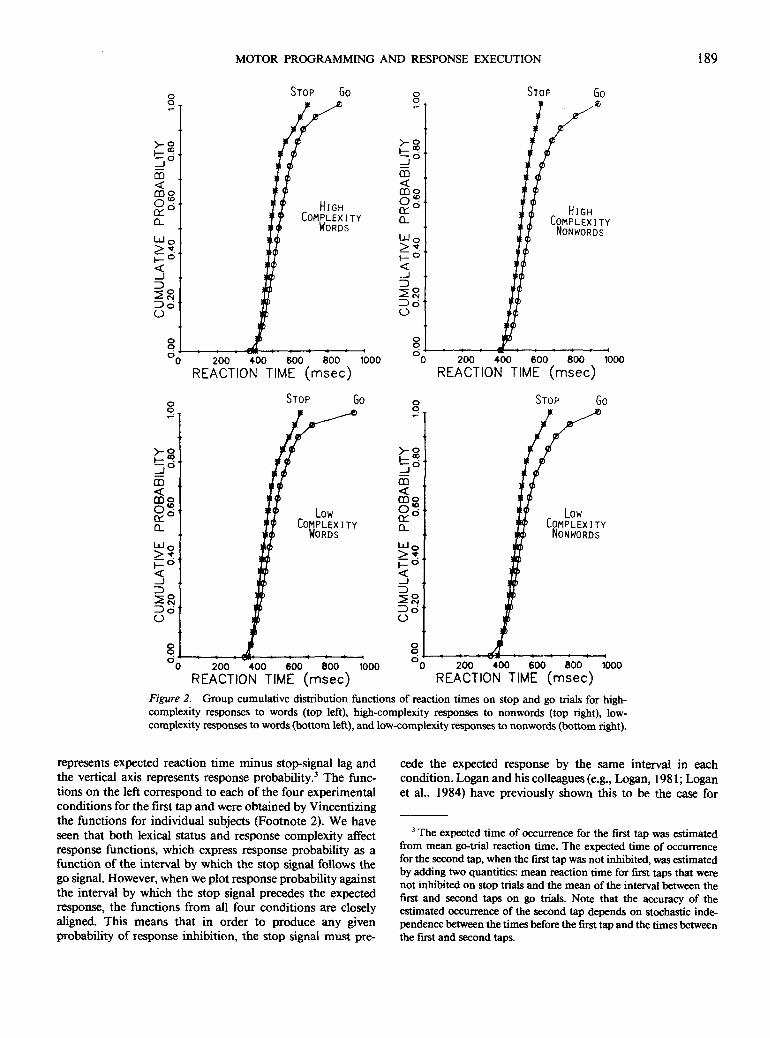
The effect of response complexity on reaction time wasrobust across trial type, as can be seen from Figure 6. Thisfigure shows median reaction time, averaged across subjects,for each level of response complexity on go trials and early,middle, and late stop-trials. Median reaction time, averagedacross each type of stop trial, was faster for simple than forcomplex responses [mean difference = 25 ms; r(10) = 4.13;p(one-tailed) < .001]. Figure 6 also displays some evidencesupporting the race model. Median reaction time was sloweron go trials than on late stop-signal trials for low-complexityresponses [mean difference = 32 ms; /(10) = 4.13; p(one-tailed) < .001] and high-complexity responses [mean differ-ence = 41 ms; ;(10) = 17.6;/?(one-tailed) < .0001]. Late stop-signal trials were slower than middle stop-signal trials for low-complexity responses [mean difference = 23 ms; t(\0) = 1.88;/((one-tailed) < .05] and high-complexity responses [mean
Table 3Design of Experiment 2
Relative frequency of trial types
ComplexityLow
High
Response
1 Ri + 1 Lior
1 Li + 1 Ri
3 Ri + 3 Lior
3 Li + 3 Ri
Go signal
Wordsor
Nonwords
Wordsor
Nonwords
Go
3/16
3/16
3/16
3/16
Early-stop
1/48
1/48
1/48
1/48
Middle-stop
1/48
1/48
1/48
1/48
Late-stop
1/48
1/48
1/48
1/48
Note. Li and Ri denote the left and right index fingers.

MOTOR PROGRAMMING AND RESPONSE EXECUTION 193
°sV)
zoo2eCC"
NONWORDS
WORDS
a:oa:a:LiJ
LowCOMPLEXITY
HIGHCOMPLEXITY
Figure 5. Mean reaction time and percentage of error as a functionof lexical status and response complexity.
difference = 21 ms; f(10) = 2.3; p(one-tailed) < .05]. Middlestop-signal responses were slower than early stop-signal re-sponses for low-complexity responses [mean difference = 11ms; t(lO) = 1.40; /?(one-tailed) < .10] and high-complexityresponses [mean difference = 24 ms; ?(10) = 2.06; p(one-tailed) < .05].
Further support for the race model appears in Figure 7.Group cumulative distribution functions of reaction times foreach trial type are shown for high-complexity responses in theupper panel and for low-complexity responses in the lowerpanel. These group functions were obtained by Vincentizingthe functions from individual subjects (Footnote 2). Eachpanel shows the fan pattern predicted by the race model. Thereaction time minima on early, middle, and late stop-signaltrials are virtually identical within each response condition.(Recall that go-trial responses are expected to have lowerminima because of their greater number.) With one exception,the four cumulative distribution functions in each panel di-verge and exhibit the predicted dominance order: early stop< middle stop < late stop < go trials. Only the early stop-trialdistribution for low-complexity responses violated this pat-tern. However, early stop-trial distributions were estimated
less reliably than the other distributions because they containthe fewest responses, so the violation is not too troubling.Overall, these results provide good support for using the racemodel to interpret other facets of the data.
Response probability and stop-signal lags. The mean signallag and response probability on early, middle, and late stop-signal trials for low- and high-complexity responses are shownin Table 4. We see here that the staircase tracking algorithmused to adjust the signal lags worked moderately well inyielding approximately 29%, 50%, and 71% response proba-bilities for the three signal-trial types. For both low- and high-complexity responses, late signals had greater lags than didmiddle signals, which in turn had greater lags than did earlysignals, just as we intended. Also, the average signal lagsneeded to produce equal levels of response probability wereless for low-complexity responses than for high-complexityresponses.
Group response functions appear in Figure 8. These func-tions were obtained by plotting response probability againstsignal lag, on a subject-by-subject basis, disregarding the typeof stop signal (i.e., early, middle, or late) associated with eachobservation. The functions from individual subjects weremonotonized (Barlow et al., 1972) and combined into groupfunctions by Vincentizing (Footnote 2). As in Experiment 1,response probability increased with signal lag, and the lagnecessary to produce a given response probability was alwaysless for low-complexity responses than for high-complexityresponses.
Comparison of go-trial reaction time and response functions.Experiment 2 also replicated our previous finding that thelocus of response-complexity effects on the preparatory proc-esses preceding the first response of a sequence is entirelybefore the point of no return. The 33-ms effect of responsecomplexity on mean go-trial reaction time (623 ms for low-complexity responses and 656 ms for high-complexity re-sponses) was not significantly different [/(10) = 0.27; p > .75]from its 35-ms effect on the response-function mean (455 msfor low-complexity responses and 490 ms for high-complexityresponses).
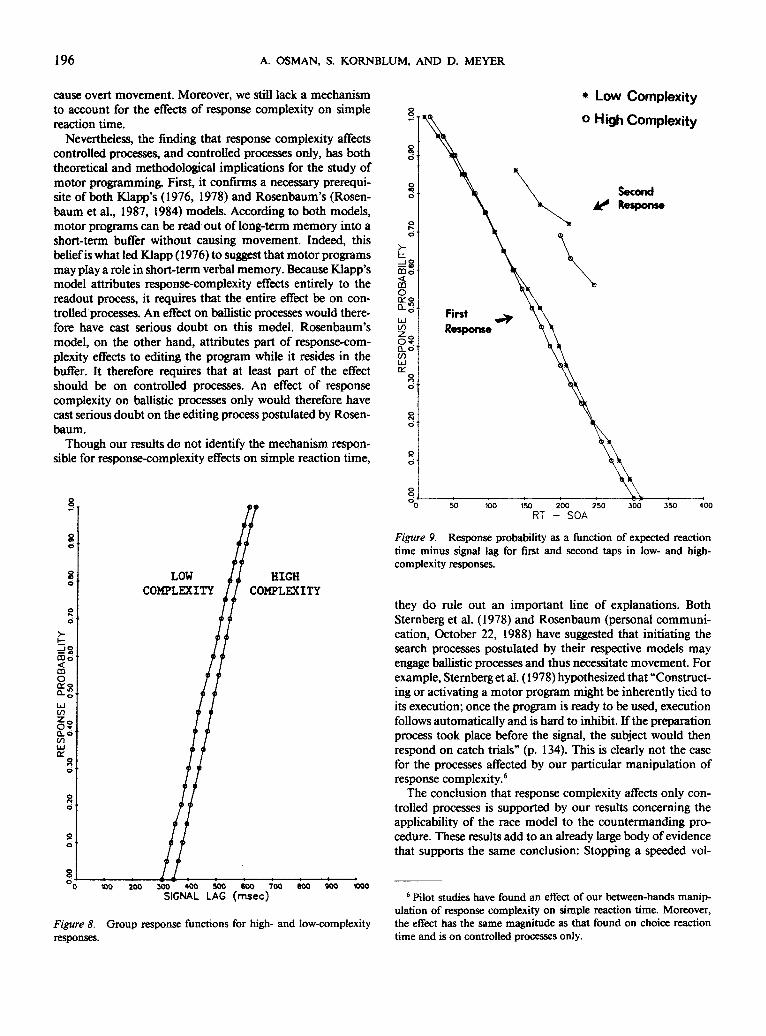
Relative stoppability of the first and second taps. Figure 9shows a more complete comparison of the stoppability of thefirst and second responses than was possible in Experiment 1(Figure 4). As before, the horizontal axis represents the ex-pected reaction time minus the stop signal lag, and the verticalaxis represents response probability. The functions associatedwith the first tap were Vincentized across subjects, and thereaction times and response probabilities associated with thesecond tap were averaged across subjects. We see again thatthe functions on the left, corresponding to the first tap, areclosely aligned. Closed circles correspond to low-complexityresponses and open circles correspond to high-complexityresponses. On the right we see six points for the second tapwhen the first tap was not inhibited, each corresponding toone of the six stop signals. Experiment 2 allows us to investi-gate the effect of response complexity on the second tap. Theinterval between the first and second taps on go trials waslonger for high-complexity than low-complexity responses[mean difference = 68 ms; t(lO) = 3.89; p < .01]. Yet, as with
194 A. OSMAN, S. KORNBLUM, AND D. MEYER
o0)
zo
HIGH COMPLEXITY
Low COMPLEXITY
EARLY MIDDLE LATE Go TRIALS
STOP T R I A L S
Figure 6. Average median reaction time for high- and low-complexity responses on each trial type.
the first tap, the open and closed circles seem to fall on thesame function. Finally, we again found poorer stopping per-formance between the first and second taps than before thefirst tap. The function for the second tap was approximately100 ms to the right of the functions for the first tap.
Discussion
Experiment 2 replicated all major findings of Experiment1. Response complexity again affected only controlled proc-esses: It produced equal effects on go-trial reaction time andon the response function; the first taps of both low- and high-complexity response sequences were equally stoppable. Therace model that we use to interpret the results of the counter-manding procedure was again supported: Mean reaction timeincreased with signal lag on stop trials and was slowest on gotrials; the reaction time distributions on stop and go trialsformed the expected fan pattern. Finally, we again found thatresponse complexity and lexical status produced additive ef-fects on go-trial reaction time and better stopping perform-ance before the first tap than between the first and secondtaps.
Experiment 2 also provides further information concerningthe locus of response-complexity effects. There was no needhere to change the mechanical properties of the first tap inorder to accommodate additional taps with the same finger.Nevertheless, we found the same response-complexity effectsas in Experiment 1. Indeed, the effects were of the samemagnitude in both experiments. Such a finding supports the
hypothesis that our manipulation of response complexityaffected only processes central enough to be involved in thecoordinated activity of both hands. Had processes peripheralenough to be unique to a single hand been affected, we mighthave expected a larger within-hand than between-hands effect.The equality of effects across experiments is especially re-markable since we compared one versus three taps in Exper-iment 1 and two versus four taps in Experiment 2. It suggeststhat reaction time to initiate a response may be linearly relatedto the number of taps in the response (Sternberg et al., 1978).
Another new result is that response complexity affected theduration of the interval between the first and second taps butdid not affect subjects' stopping performance during thisinterval; that is, the points associated with the second tap onthose stop trials when the first tap had not been inhibited allseemed to fall on the same stoppability function. This resultshould be regarded with caution, however, for these pointsare based on very little data, and the averaging proceduresemployed may make them unrepresentative of individualsubjects' stoppability functions (Footnote 4). Nevertheless, itappears that the effect of response complexity on the intervalbetween the first and second taps may have been limited tocontrolled processes. Had there been an effect on ballisticprocesses associated with the second tap, signals preceding thesecond tap by the same interval would have produced differentlevels of response probability at each level of response com-plexity. This is because the longer the duration of the ballisticprocesses preceding a response is, the earlier the stop signalmust occur in order for the inhibition processes to reach

MOTOR PROGRAMMING AND RESPONSE EXECUTION 195
m
PQ_
LJ0
HIGH COMPLEXITY
CD
PtCL
j c3O
EARLY STOP
MIDDLE STOPLATE STOPGO
200 300 400 500 6OO 700 800
REACTION TIME (msec)
LOW COMPLEXITY
EARLY STOPMIDDLE STOPLATE STOPGO
200 300 400 500 600 700
REACTION TIME (msec)800 900 1000
Figure 7. Group cumulative distribution functions of reaction timeson each trial type for high-complexity responses (upper panel) andlow-complexity responses (lower panel).
completion before the ballistic processes begin. The fact thatstopping performance in both conditions appears to be char-acterized by the same function suggests that response com-plexity did not affect ballistic processes preceding the secondtap.
Finally, we again found better stopping performance beforethe first tap than during the interval between the first andsecond taps. The replication of this effect for early, middle,and late signals in both complexity conditions suggests that itis reliable. Moreover, the magnitude of the effect suggests thatit is unlikely to be an artifact of the procedures by which wecalculated the stoppability function for the second tap (Foot-
note 4). This result could have arisen for a number of reasons.First, there might be a difference in the duration of ballisticprocesses preceding the two taps. If this could be verified, itwould constitute a demonstration of the existence of ballisticprocesses. On the other hand, the inhibition process mighttake longer for the second tap. Making the first tap mightproduce a refractory effect on the processing of the stop signal,or subjects might exert less effort after having failed to stopthe first tap. At present we cannot discriminate between thesealternatives.
General DiscussionIn this study we sought to provide evidence concerning the
existence and functional location of a point of no return andto elucidate further the nature of motor programming. Wehoped to achieve both of these objectives by discoveringwhether the motor-programming processes affected by re-sponse complexity are controlled or ballistic. This involvedusing a countermanding procedure and a race model tomeasure separately the effects of response complexity on bothsets of processes. We also tried to verify the assumptionsunderlying these measurements by testing the applicability ofthe race model to the countermanding procedure and tospecify further the location of the point of no return byacquiring additional information concerning the locus ofresponse-complexity effects. Finally, the approach used hereallowed us to compare how a response is stopped before andduring overt movement.
An effect of response complexity on ballistic processeswould have been extremely interesting. To have found thatonly ballistic processes were affected would have ruled outthe hypothesis that any motor-programming operations canbe effectively performed before the response signal (Klapp,1976, 1978; Rosenbaum et al., 1987, 1984). To have foundan effect on both controlled and ballistic processes would havesuggested the existence of two qualitatively different types ofmotor-programming operations. Either of these findingswould have provided a reason why response-complexity ef-fects are found on simple reaction time and demonstrated theexistence of ballistic processes as well.
What we found, however, was that response complexityaffected controlled processes only. In our view, this result isconsistent with all of the models of motor programmingconsidered in this article. Neither reading a motor programinto a memory buffer (Klapp, 1976, 1978) nor editing (Ro-senbaum et al., 1987, 1984), searching (Rosenbaum et al.,1984, 1987; Sternberg et al., 1978), or unpacking (Sternberget al., 1978) the contents of such a buffer need necessarily
Table 4Mean Response Probabilities and Signal Lags for Experiment 2
Response probability %
Response Type
Low ComplexityHigh Complexity
ES
3039
MS
4254
LS
6968
Signal lag (ms)
ES
372426
MS
424474
LS
481522
Note. ES = early signal; MS = middle signal; LS = late signal.
196 A. OSMAN, S. KORNBLUM, AND D. MEYER
cause overt movement. Moreover, we still lack a mechanismto account for the effects of response complexity on simplereaction time.
Nevertheless, the finding that response complexity affectscontrolled processes, and controlled processes only, has boththeoretical and methodological implications for the study ofmotor programming. First, it confirms a necessary prerequi-site of both Klapp's (1976, 1978) and Rosenbaum's (Rosen-baum et al., 1987, 1984) models. According to both models,motor programs can be read out of long-term memory into ashort-term buffer without causing movement. Indeed, thisbelief is what led Klapp (1976) to suggest that motor programsmay play a role in short-term verbal memory. Because Klapp'smodel attributes response-complexity effects entirely to thereadout process, it requires that the entire effect be on con-trolled processes. An effect on ballistic processes would there-fore have cast serious doubt on this model. Rosenbaum'smodel, on the other hand, attributes part of response-com-plexity effects to editing the program while it resides in thebuffer. It therefore requires that at least part of the effectshould be on controlled processes. An effect of responsecomplexity on ballistic processes only would therefore havecast serious doubt on the editing process postulated by Rosen-baum.
Though our results do not identify the mechanism respon-sible for response-complexity effects on simple reaction time,
s03 o
mo
§8Q.O(/)Ldce
LOWCOMPLEXITY
HIGHCOMPLEXITY
200 300 400 500 600 700 800 90O WOO
SIGNAL LAG (msec)
Figure 8. Group response functions for high- and low-complexityresponses.
* Low Complexity
o High Complexity
SecondResponse
50 100 150 200 250 300 350 400RT - SOA
Figure 9. Response probability as a function of expected reactiontime minus signal lag for first and second taps in low- and high-complexity responses.
they do rule out an important line of explanations. BothSteinberg et al. (1978) and Rosenbaum (personal communi-cation, October 22, 1988) have suggested that initiating thesearch processes postulated by their respective models mayengage ballistic processes and thus necessitate movement. Forexample, Sternberg et al. (1978) hypothesized that "Construct-ing or activating a motor program might be inherently tied toits execution; once the program is ready to be used, executionfollows automatically and is hard to inhibit. If the preparationprocess took place before the signal, the subject would thenrespond on catch trials" (p. 134). This is clearly not the casefor the processes affected by our particular manipulation ofresponse complexity.6
The conclusion that response complexity affects only con-trolled processes is supported by our results concerning theapplicability of the race model to the countermanding pro-cedure. These results add to an already large body of evidencethat supports the same conclusion: Stopping a speeded vol-
6 Pilot studies have found an effect of our between-hands manip-ulation of response complexity on simple reaction time. Moreover,the effect has the same magnitude as that found on choice reactiontime and is on controlled processes only.
MOTOR PROGRAMMING AND RESPONSE EXECUTION 197
untary movement before it has begun may be well approxi-mated by a race between independent excitatory and inhibi-tory processes (e.g., De Jong, Cotes, Logan, & Gratton, 1990;Logan & Cowan, 1984; Osman et al., 1986). Besides support-ing the assumptions underlying our approach, this very gen-eral finding may tell us something fundamental about theinhibition of response preparation. For example, strict inde-pendence implies that inhibition occurs in the same way,regardless of how far the controlled processes have progressed,and that the controlled processes proceed in the same wayuntil they are terminated, regardless of whether or when anattempt at inhibition is made.
An effect of any factor manipulation on controlled pro-cesses only constrains the possible location of a point of noreturn. It indicates that such a point could not occur beforethe latest process affected by the factor. Our particular manip-ulations of response complexity appear to have affected rela-tively central motor processes. The between-hands effectfound in Experiment 2 indicates that at least some of theaffected processes are central enough to be involved in pre-paring movements of both hands. The equality of the be-tween-hands and within-hand effects suggests that no processperipheral enough to be unique to a single hand was affected.Finally, the additive effects of response complexity and lexicalstatus limit how early in the information-processing systemresponse complexity had its effect, thus suggesting that theeffect was limited to motor processes.
Our results therefore indicate that if a point of no returnexists, it must occur after much of the response preparationleading to overt movement has been completed. These resultsare in agreement with recent work by De Jong et al. (1990),which show that successful attempts at inhibition do not affectthe early development of a lateral asymmetry over motorcortex in event-related potentials associated with movement(see also Osman, Bashore, Coles, Donchin, & Meyer, 1989).They also extend previous work by Logan (1981), who foundno evidence for a point of no return before or during theresponse-selection processes affected by stimulus-responsecompatibility. The motor-programming processes affected byresponse complexity occur at an even later stage in the infor-mation-processing system but still precede the point of noreturn. So far, the only factor found to have an effect afterthe point of no return is stimulus-response repetition (Osmanet al., 1986). The inferred effect of this factor on ballisticprocesses provides some evidence for their existence. Unfor-tunately, it provides little information concerning the natureof ballistic processes or the location of the point of no return,because the effects of repetition are widely distributedthroughout the information-processing system (Kornblum,1973).
The presence of ballistic processes is hinted at by the betterstopping performance before than during our response se-quences. Better stopping performance before the first tap thanduring the interval between the first and second taps couldhave arisen from differences in the durations of the ballisticprocesses preceding the two taps. However, as we indicated,alternative explanations involving the duration of the inhibi-tion process are also possible. This result is also intriguingbecause it might be expected if the first and second taps were
represented together as part of the same unit at some level ofdescription in the motor program. Since a defining propertyof units is the common fate of their parts, parts of the sameprogramming unit might tend to be executed together. Itwould be interesting to see whether differences in stoppabilitycorrespond to units defined by various criteria (e.g., linguisticor rhythmic), and how such differences are affected by theconditions under which a movement is performed (e.g., dif-ferent levels of speed stress or automaticity).
In conclusion, motor programming does not necessitateresponse execution—at least those motor-programming pro-cesses affected by our particular manipulation of responsecomplexity. This means that a point of no return could notoccur prior to a very late stage in the information-processingsystem. Together with our previous demonstration of ballisticprocesses (Osman et al., 1986), the present results suggest thatsuch a point may be reached between the completion ofmotor programming and the onset of overt movement. Futureresearch could provide further evidence concerning the exist-ence and functional location of the point of no return byinvestigating the effects on controlled and ballistic processesof factors with well-focused effects on more peripheral motorprocesses than response complexity.
ReferencesBarlow, R., Bartholomew, D., Bremner, & Brunk, H. (1972). Statis-
tical inference under order restrictions. New York: Wiley.Bartlett, F. C. (1958). Thinking: An experimental and social study.
New York: Basic Books.Christina, R. W., Fischman, M. G., Vercruyssen, M. J. P., & Anson,
J. G. (1982). Simple reaction time as a function of responsecomplexity: Memory drum theory revisited. Journal of MotorBehavior, 74,301-321.
De Jong, R., Coles, M. G. H., Logan, G. D., & Gratton, G. (1990).In search of the point of no return: The control of responseprocesses. Journal of Experimental Psychology: Human Perceptionand Performance, 16, 164-182.
Henry, F. M. (1980). Use of simple reaction time in motor program-ming studies: A reply to Klapp, Wyatt, & Lingo. Journal of MotorBehavior, 12, 163-168.
Henry, F. M., & Rogers, E. E. (1960). Increased response latency forcomplicated movements and a "memory drum" theory of neuro-motor reaction. Research Quarterly, 31, 448-458.
Jonides, J. (1981). Voluntary versus automatic control over themind's eye's movement. In J. Long & A. D. Baddeley (Eds.),Attention and performance IX (pp. 187-203). HiUsdale, NJ: Erl-baum.
Keete, S. W. (1968). Movement control in skilled motor performance.Psychological Bulletin, 70, 387-403.
Keele, S. W. (1981). Behavioral analysis of movement. In V. B.Brooks (Ed.), Handbook of physiology (Section 1, Vol. 2, pp. 1391 -1414). Washington, DC: American Physiological Society.
Klapp, S. T. (1976). Short-term memory as a response-preparationstate. Memory & Cognition, 4, 721-729.
Klapp, S. (1978). Reaction time analysis of programmed control.Exercise and Sport Science Review, 5, 231-253.
Kornblum, S. (1973). Sequential effects in choice reaction time: Atutorial review. In S. Kornblum (Ed.), Attention and performanceIV (pp. 259-288). New York: Academic Press.
Kucera, H., & Francis, W. N. (1967). Computational analysis ofpresent-day American English. Providence, RI: Brown UniversityPress.

198 A. OSMAN, S. KORNBLUM, AND D. MEYER
Ladefoged, P., Silverstein, R., & Papcun, G. (1973). Interruptibilityof speech. Journal of the Acoustical Society of America, 54, 1105-1108.
Levitt, H. (1971). Transformed up-down methods in psychoacoustics.Journal of the Acoustical Society of America, 49, 467-477.
Logan, G. D. (1981). Attention, automaticity, and the ability to stopa speeded choice response. In J. Long & A. D. Baddeley (Eds.),Attention and performance IX (pp. 205-222). Hillsdale, NJ: Erl-baum.
Logan, G. D. (1982). On the ability to inhibit complex movements:A stop-signal study of typewriting. Journal of Experimental Psy-chology: Human Perception and Performance, 8, 778-792.
Logan, G. D., & Burkell, J. (1986). Dependence and independencein responding to double stimulation: A comparison of stop, change,and dual-task paradigms. Journal of Experimental Psychology:Human Perception and Performance, 12, 549-563.
Logan, G. D., & Cowan, W. B. (1984). On the ability to inhibitthought and action: A theory of an act of control. PsychologicalReview, 91, 295-327.
Logan, G. D., Cowan, W. B., & Davis, K. A. (1984). On the abilityto inhibit simple and choice reaction time responses: A model anda method. Journal of Experimental Psychology: Human Perceptionand Performance, 10, 276-291.
Meyer, D. E., & Schvaneveldt, R. W. (1971). Facilitation in recogniz-ing pairs of words: Evidence of a dependence between retrievaloperations. Journal of Experimental Psychology, 90, 227-234.
Oilman, R. (1973). Simple reactions with random countermandingof the "go" signal. In S. Kornblum (Ed.), Attention and performance/K(pp. 571-581). New York: Academic Press.
Osman, A., Bashore, T. R., Coles, M. G. H., Donchin, E., & Meyer,D. E. (1989, November). Response preparation based on partialinformation: Evidence from event-related motor potentials. Paperpresented at the meeting of the Psychonomic Society, Atlanta, GA.
Osman, A., Kornblum, S., & Meyer, D. E. (1986). The point of noreturn in choice reaction time: Controlled and ballistic stages ofresponse preparation. Journal of Experimental Psychology: HumanPerception and Performance, 12, 243-258.
Poulton, E. C. (1981). Human manual control. In V. Brooks (Ed.),Handbook of physiology (Section 1, Vol. 2, pp. 1337-1389). Wash-ington, DC: American Physiological Society.
Rosenbaum, D. A., Hindorff, V., & Munro, E. M. (1987). Schedulingand programming of rapid finger sequences: Tests and elaborationsof the hierarchical editor model. Journal of Experimental Psychol-ogy: Human Perception and Performance, 13, 193-203.
Rosenbaum, D. A., Inhoff, A. W., & Gordon, A. M. (1984). Choosingbetween movement sequences: A hierarchical editor model. Journalof Experimental Psychology: General, 113, 372-393.
Smith, M. C. (1967). Theories of the psychological refractory period.Psychological Bulletin, 67, 202-213.
Sternberg, S. (1969). The discovery of processing stages: Extensionsof Donders' method. In W. G. Koster (Ed.), Attention and perform-ance II (pp. 276-315). Amsterdam: North-Holland.
Sternberg, S., Monsell, S., Knoll, R., & Wright, C. E. (1978). Thelatency and duration of rapid movement sequences: Comparisonsof speech and typewriting. In G. Stelmach (Ed.), Informationprocessing in motor control and learning (pp. 117-152). New York:Academic Press.
Thomas, E. A. C., & Ross, B. H. (1980). On appropriate proceduresfor combining probability distributions within the same family.Journal of Mathematical Psychology, 21, 136-152.
Venezky, R. L. (1970). The structure of English orthography. TheHague, The Netherlands: Mouton.
Received April 22, 1988Revision received March 17, 1989
Accepted April 25, 1989 •
Call for Nominations for Psychological Bulletin
The Publications and Communications Board has opened nominations for a new editor ofPsychological Bulletin. John C. Masters is the immediate past editor. Candidates must bemembers of APA and should be prepared to begin receiving manuscripts by September1990. Please note that the P&C Board encourages participation by members of underrepre-sented groups in the publications process and would particularly welcome such nominees.To nominate candidates, prepare a statement of one page or less in support of each candi-date. Submit nominations to
Walter Mischel, PhDPsychological Bulletin Editor Search CommitteeAmerican Psychological Association1200 Seventeenth Street, N.W.Suite VA-710Washington, DC 20036
First review of nominations will begin March 1, 1990, although the nomination deadline isMarch 31, 1990.