copyright 2005, alliance of angels introduction the anatomy of the 10 minute pitch the problem the...
TRANSCRIPT

Copyright 2005, Alliance of Angels
Introduction
The Anatomy of the 10 Minute PitchThe Anatomy of the 10 Minute Pitch
The Problem
The Solution
Market Size
Revenue Model
Sales Cycle
Customers
Partners
Traction
Advisory Board
Management
Competition
{00:30 seconds}
{02:30 seconds}
{06:30 seconds}
{08:30 seconds}
{10:00 min.}
Financials
The Offer
Copyright 2005, Alliance of Angels
The ProblemThe Problem
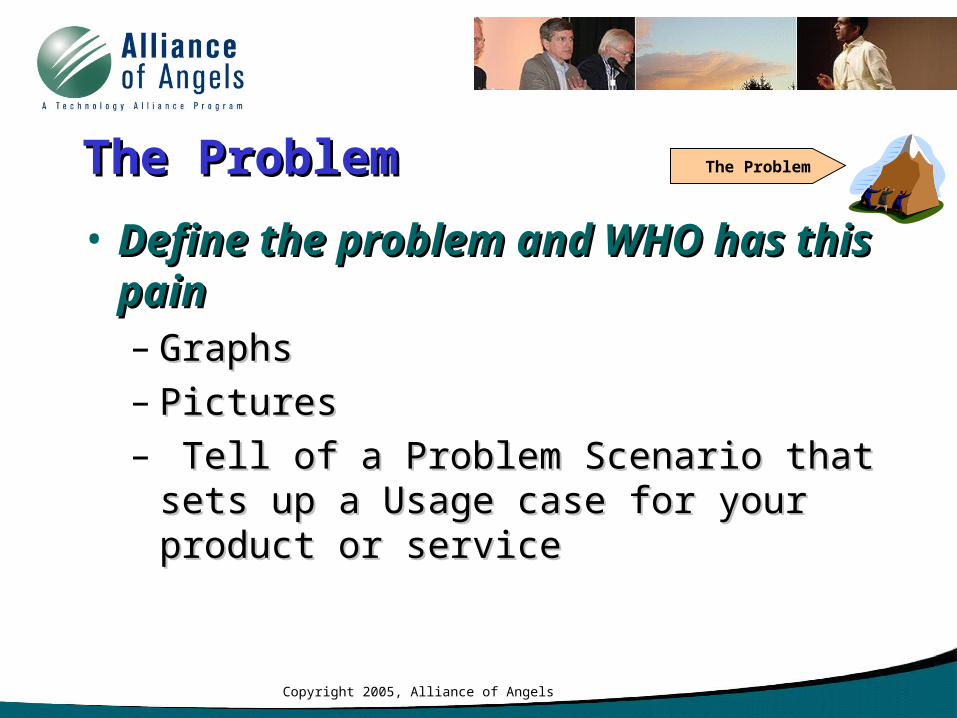
• Define the problem and WHO has Define the problem and WHO has this painthis pain– GraphsGraphs– PicturesPictures– Tell of a Problem Scenario that sets up a Tell of a Problem Scenario that sets up a
Usage case for your product or serviceUsage case for your product or service
The Problem

Copyright 2005, Alliance of Angels
The SolutionThe Solution
Overview of primary product or Overview of primary product or service that will solve the problemservice that will solve the problem
The Solution
• Use multiple slides if necessary Use multiple slides if necessary
• Do not exceed time limitsDo not exceed time limits • Product Photos, Screen shots Product Photos, Screen shots
• Logical Flow and Architecture diagramsLogical Flow and Architecture diagrams
• Short list of Feature/BenefitsShort list of Feature/Benefits
Be clear about the status of Be clear about the status of product developmentproduct development

Copyright 2005, Alliance of Angels
Market SizeMarket Size
• Build the number from the ground upBuild the number from the ground up• Total Total AddressableAddressable Market Market • Use drivers relevant to your productUse drivers relevant to your product
• Show the different segments Show the different segments – Pie Graph works wellPie Graph works well– Explain how you prioritize the segmentsExplain how you prioritize the segments
• ““This is our initial market” (speak to why)This is our initial market” (speak to why)
• If you must use 3If you must use 3rdrd party figures, cite the party figures, cite the sourcesource
Market Size

Copyright 2005, Alliance of Angels
Revenue ModelRevenue Model• Licensed SoftwareLicensed Software
• Hosted Solution, Monthly Fee + 2% of all transactions Hosted Solution, Monthly Fee + 2% of all transactions booked through our systembooked through our system
• We Sell Widgets; Direct and Through a ChannelWe Sell Widgets; Direct and Through a Channel
• Time and MaterialsTime and Materials
Revenue Model
Cost $650
Distributor $1750
Retailer $2000
Customer $2500
Gross Profit $1100
Avg Customer Buys 24 Widgets per year
20%
10%
Gross Margin >60%
Average Customer is worth$60,000 in annual Revenue

Copyright 2005, Alliance of Angels
CompetitionCompetition
• Indirect CompetitionIndirect Competition– Summarize the current alternatives (other Summarize the current alternatives (other
technologies or types of products)technologies or types of products)
• Direct Competitors Direct Competitors (logos are easier to read than text)(logos are easier to read than text)– List competing company 1 and an analysis List competing company 1 and an analysis – List competing company 2 and an analysis List competing company 2 and an analysis – List competing company 3 and an analysis List competing company 3 and an analysis
• Use a matrix if possibleUse a matrix if possible
Competition

Copyright 2005, Alliance of Angels
PartnersPartners
• Pay Sponsorship for Pay Sponsorship for MBA fellowsMBA fellows
• Contribute to deal flowContribute to deal flow– Commitments renewed Commitments renewed
on an annual basison an annual basis
• In-kind sponsorIn-kind sponsor• Public Relations StrategyPublic Relations Strategy
Partners
Copyright 2005, Alliance of Angels
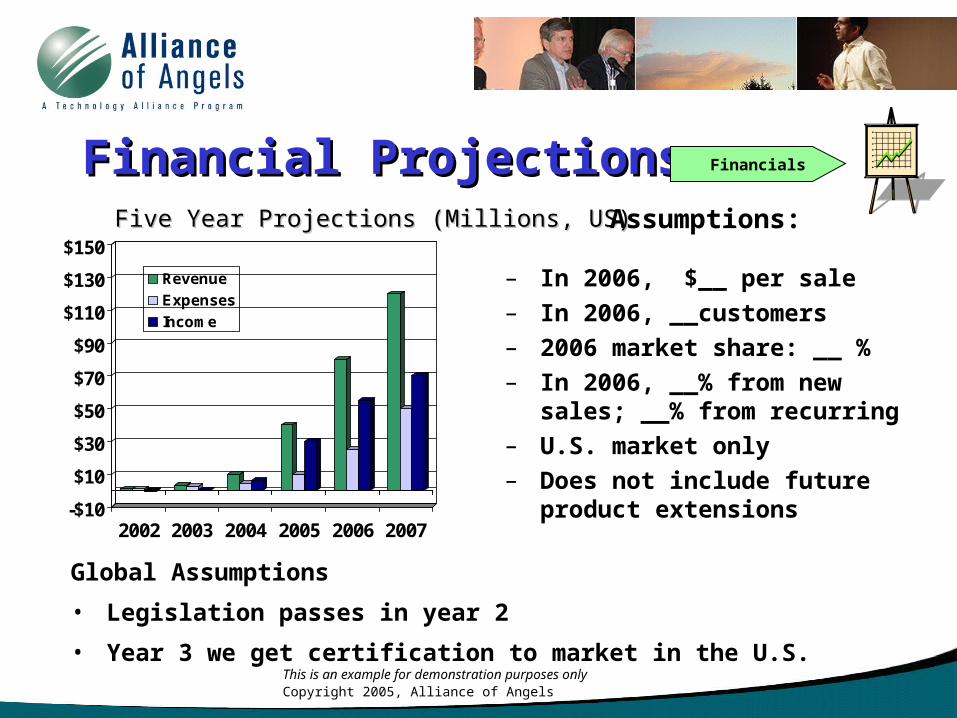
Five Year Projections (Millions, US)Five Year Projections (Millions, US)
-$10
$10
$30
$50
$70
$90
$110
$130
$150
2002 2003 2004 2005 2006 2007
Revenue
Expenses
Income
Assumptions:
– In 2006, $__ per sale
– In 2006, __customers
– 2006 market share: __ %
– In 2006, __% from new sales; __% from recurring
– U.S. market only
– Does not include future product extensions
This is an example for demonstration purposes only
Financial ProjectionsFinancial Projections
Global Assumptions
• Legislation passes in year 2
• Year 3 we get certification to market in the U.S.
Financials

Copyright 2005, Alliance of Angels
Funding RequirementsFunding RequirementsPrior Funding: Prior Funding:
- $ from founders, $ from outside investors, $ grants- $ from founders, $ from outside investors, $ grants
Current Round:Current Round:- Seeking $1 million ($500,000 raised)Seeking $1 million ($500,000 raised)- Pre-money valuation: $2 million (range will be fine) Pre-money valuation: $2 million (range will be fine)
Use of Funds:Use of Funds:- Finish v 2.0 PrototypeFinish v 2.0 Prototype- Launch in xxx marketLaunch in xxx market- File patentsFile patents
Future rounds:Future rounds: - Series B of $ million expected in early 2004- Series B of $ million expected in early 2004
Exit Strategy:Exit Strategy:- Acquisition (perhaps Microsoft, IBM or Nike)Acquisition (perhaps Microsoft, IBM or Nike)
The Offer

Copyright 2005, Alliance of Angels
General Presentation RulesGeneral Presentation Rules
• Examples of the Bad:Examples of the Bad:– Generics instead of SpecificsGenerics instead of Specifics– Busy backgrounds (text over text)Busy backgrounds (text over text)– Diagrams: Too much or too little tech.Diagrams: Too much or too little tech.– Unnecessary animationUnnecessary animation– Over-use of clip-artOver-use of clip-art
Now… some bad examples…Now… some bad examples…
Copyright 2005, Alliance of Angels
Company DescriptionCompany Description
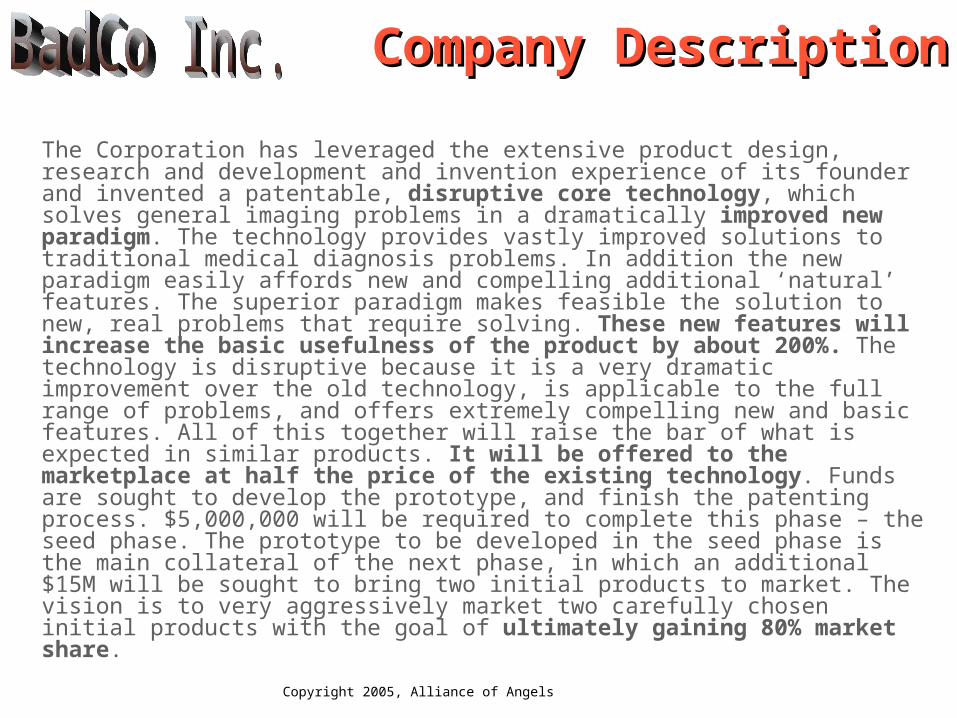
The Corporation has leveraged the extensive product design, research and development and invention experience of its founder and invented a patentable, disruptive core technology, which solves general imaging problems in a dramatically improved new paradigm. The technology provides vastly improved solutions to traditional medical diagnosis problems. In addition the new paradigm easily affords new and compelling additional ‘natural’ features. The superior paradigm makes feasible the solution to new, real problems that require solving. These new features will increase the basic usefulness of the product by about 200%. The technology is disruptive because it is a very dramatic improvement over the old technology, is applicable to the full range of problems, and offers extremely compelling new and basic features. All of this together will raise the bar of what is expected in similar products. It will be offered to the marketplace at half the price of the existing technology. Funds are sought to develop the prototype, and finish the patenting process. $5,000,000 will be required to complete this phase – the seed phase. The prototype to be developed in the seed phase is the main collateral of the next phase, in which an additional $15M will be sought to bring two initial products to market. The vision is to very aggressively market two carefully chosen initial products with the goal of ultimately gaining 80% market share.

Copyright 2005, Alliance of Angels
Network Diagram explaining the process
DataStream
ManagerFORMS
Procedure Rules
XMLBusiness
Rulesand
Templates
FFR Data
OutflowManager
XSLTRules
XML Data
TTF SystemAdministration
Console
SSLStorageSystems
DD Portals &
IVR Engine
VM Server
Primary Access
AccessController
ManagerConsole
UserConsole
AccessPermissions
Inbound MGHG
AccountingConsole
PPRMSystem
WebServices
VPN
WebServer
Data Mgmt System (EODSYS)
PPL Layers,
XPL Stack
XPL StackManager
Outbound MGHG
External Networks (TTO Net)
(PMP Layer)
Administration Internet
VPN MMSAccounting
Internal Network
Internet
TransformationManager
BadCo.com is about to
revolutionize the way you think about
annoying PowerPoint
presentations!

Copyright 2005, Alliance of Angels
FinancialsFinancialsBalance Sheet Forecast 2004 2005 2006 2007 2008
Cash 1,058,841 1,852,321 1,223,236 12,072,691 34,393,913 Accounts Receivable 0 3,802,500 10,660,225 40,538,689 72,369,049 Prepaid Expenses 0 0 0 784 784 Supplies 0 0 0 0 0 Inventory 20,449 682,276 1,256,641 5,174,108 15,389,929 Current Assets 1,373,584 17,114,769 30,162,064 147,482,673 335,718,859 Total Long-Term Investments 0 0 0 0 0 Property & Equipment 27,889 60,516 79,524 219,961 635,209 Total Software Tools 2,704 2,500 1,681 1,600 1,521 Other Noncurrent Assets 0 0 0 4,624 4,624Total Assets 1,934,881 19,651,489 33,814,225 161,830,060 369,663,394
Total Current Liabilities 16,384 3,041,536 8,082,649 47,045,881 84,897,796Long-Term Debt 0 0 0 0 0Total Liabilities 16,384 3,041,536 8,082,649 47,045,881 84,897,796
Preferred Stock, Net 9,000,000 36,000,000 36,000,000 36,000,000 36,000,000 Common Stock, Net 25 25 25 25 25Retained Earnings 3,034,564 11,002,489 9,193,024 20,095 16,069,134Total Stockholders' Equity 1,595,169 7,225,344 8,838,729 34,377,635 100,272,834Total Equity & Liabilities 1,934,881 19,642,624 33,825,856 161,855,503 369,701,849Income Statement ForecastRevenue
Primary Product -$ 30,371,121$ 99,181,681$ 138,203,536$ 193,237,801$ Secondary Product -$ -$ 2,036,329$ 93,973,636$ 479,303,449$ Total Other Products -$ 1,036,324$ 23,097,636$ 62,394,201$ 134,977,924$
Net Revenues - 42,627,841 262,180,864 861,363,801 2,247,897,744
Cost of RevenuePrimary Product -$ 11,600,836$ 37,884,025$ 52,765,696$ 73,822,464$ Total Secondary -$ -$ 777,924$ 35,880,100$ 183,060,900$ Total Other -$ 396,900$ 8,814,961$ 23,824,161$ 51,552,400$ Total Cost of Sales - 16,289,296 100,120,036 328,878,225 858,607,204 Gross profit - 6,215,049 38,266,596 125,753,796 327,972,100
Other Income/(Loss) - - - - - Interest Income - - - 362,404 2,849,344 Total Income - 6,215,049 38,266,596 139,617,856 391,960,804
Operating expenses
General and Administrative 93,636$ 1,600,225$ 3,337,929$ 9,394,225$ 23,193,856$ Research and Development 736,164$ 887,364$ 795,664$ 1,567,864$ 2,732,409$ Selling and Marketing 302,500$ 3,080,025$ 8,838,729$ 18,101,723$ 34,031,029$ Total Operating Expenses 2,937,796 15,697,444 32,398,864 73,474,994 151,354,262 Income from Operations 2,937,796 2,157,961 244,036 10,525,122 56,180,841
Amortization, Depreciation, Interest 784$ 11,449$ 43,681$ 125,316$ 335,241$ Net Income before Taxes 3,034,564 2,483,776 81,225 8,353,513 47,836,423
Taxes -$ -$ -$ -$ 7,650,756$ Net income after Taxes 3,034,564$ 2,483,776$ 81,225$ 8,353,513$ 17,225,721$
Cash Flow Forecast
Net cash provided by operations 2,989,441$ 13,300,609$ 808,201$ 1,856,618$ 3,374,770$ Cash flows used for investing activities 61,009 18,225 11,664 87,616 261,121 Cash flows used for financing activities 9,030,025 16,924,996 565,504 1,695,204 1,132,096 Net increase in cash 1,058,841 110,224 65,025 5,610,161 5,712,361
Cash, Beginning - 1,058,841 1,852,321 1,223,236 12,072,691 Cash, Ending 1,058,841$ 1,852,321$ 1,223,236$ 12,072,691$ 34,393,913$
Copyright 2005, Alliance of Angels
General Presentation RulesGeneral Presentation Rules
• Good examplesGood examples– Use of pictures or graphs instead of textUse of pictures or graphs instead of text– Subtle brandingSubtle branding– Actual pictures or screen-shots of your Actual pictures or screen-shots of your
productproduct
Now… some good examples…Now… some good examples…

What We DoWhat We Do
Geospiza builds software for scientists that transforms living material into digital information
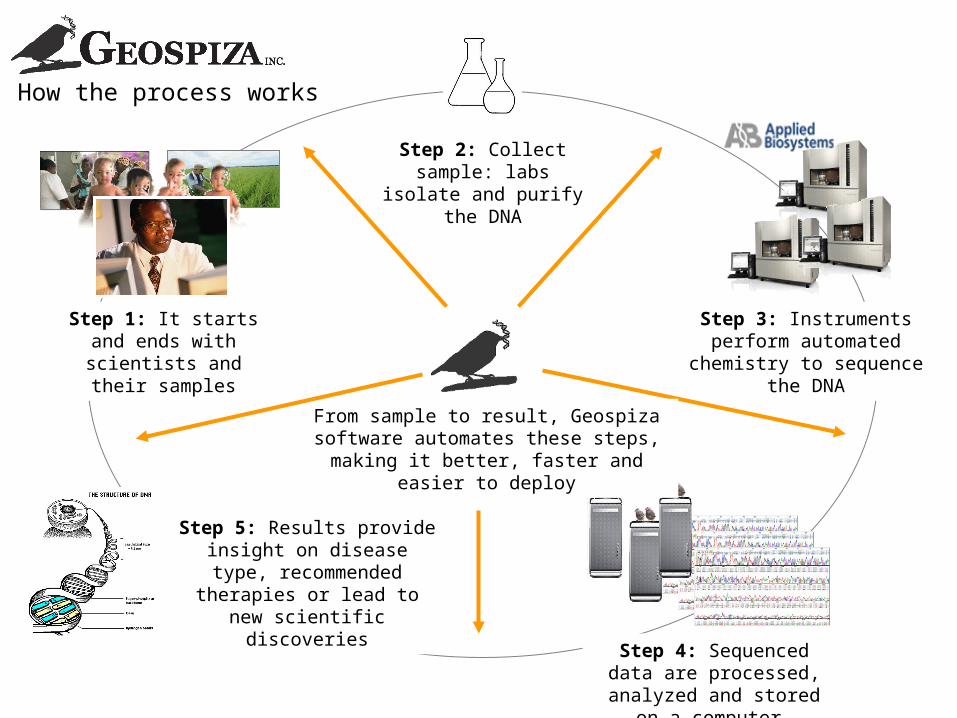
How the process works
Step 1: It starts and ends with scientists and
their samples
Step 2: Collect sample: labs isolate and purify
the DNA
Step 3: Instruments perform automated chemistry to
sequence the DNA
Step 4: Sequenced data are processed, analyzed and
stored on a computer
Step 5: Results provide insight on disease type,
recommended therapies or lead to new scientific
discoveries
From sample to result, Geospiza software automates these steps, making it better,
faster and easier to deploy

Confidential
Competitive Position
Attribute LazerTech $6M Man Amalgodyne SunnyField
Compatability
Size
Strength
Speed
Applicability
Durability
Weight
Price

Proprietary and confidential.© 2004 Morse Best, Inc. All rights reserved.
18
Mercent CompetitionMercent Competition
Mercent
Microsoft
Certified
Am
azon C
ertified
Major R
etail C
ustomers
Hosted
Solution
InstalledS
olution
eBay
Affiliate
Netw
orks
Search E
ngines
Traffic P
ortals
Am
azon.com
ChannelAdvisor
Truition
MarketWorks
MarketLive
Planned/Announced
Supported
Competitor 1
Competitor 2
Competitor 3
Competitor 4

CompetitionCompetition
GoodCo Tools
ClampuMaxRoboMatic
SNF Inc.
Clamping Precision
Cla
mpi
ng S
tren
gth