copyright 2005 northrop grumman corporation is cmmi high maturity worth the investment? southern...
Post on 20-Dec-2015
217 views
TRANSCRIPT

Copyright 2005 Northrop Grumman Corporation
Is CMMI High Maturity Worth the Investment? Southern California SPIN2 February 2007
Rick Hefner, Ph.D.Director, Process ManagementNorthrop Grumman Corporation

Copyright 2005 Northrop Grumman Corporation 2
Background
Until recently, Level 3 was considered the industry standard
Now, several organizations have achieved high maturity and are touting its benefits
To others, high maturity (Levels 4 & 5) is perceived as expensive and of little benefit
Do high maturity processes cost more?
Is Level 4 and 5 worth the effort?

Copyright 2005 Northrop Grumman Corporation 3
Causal Analysis and ResolutionOrganizational Innovation and Deployment5 Optimizing
4 Quantitatively Managed
3 Defined
2 Managed
Quantitative Project ManagementOrganizational Process Performance
Requirements DevelopmentTechnical SolutionProduct IntegrationVerificationValidation Organizational Process FocusOrganizational Process DefinitionOrganizational Training Risk ManagementIntegrated Project Management (for IPPD*)Integrated Teaming*Integrated Supplier Management**Decision Analysis and ResolutionOrganizational Environment for Integration*
Requirements Management Project PlanningProject Monitoring and ControlSupplier Agreement Management Measurement and AnalysisProcess and Product Quality AssuranceConfiguration Management
1 Performed
Process AreasLevel
Work proactively managed, organizational standard processes
Improving, addressing common causes of variation
Quantitatively managed, eliminating special causes of variation
Work planned and tracked (reactively managed)
Work performed, but in an ad hoc fashion
CMMI Levels

Copyright 2005 Northrop Grumman Corporation 4
The Project Manager’s Dilemma at Level 3
I want to use the organization’s standard process, but…
… Does it’s performance and quality meet my customer’s expectations?
… If not, how should I tailor the process?
Copyright 2005 Northrop Grumman Corporation 5
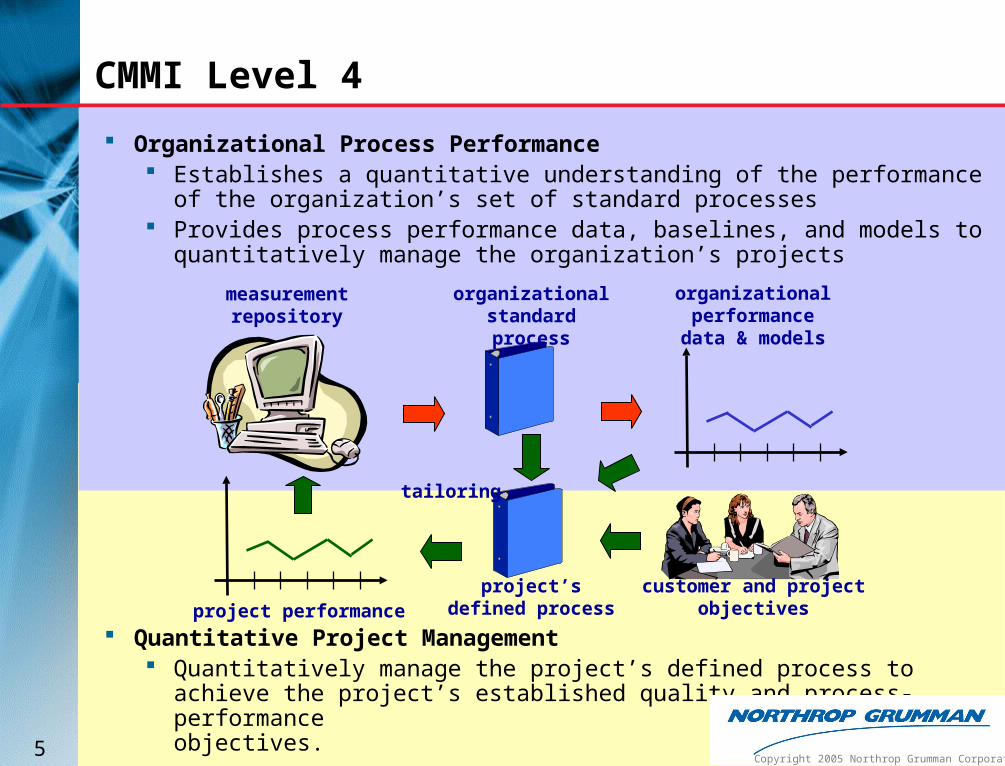
CMMI Level 4
Organizational Process Performance Establishes a quantitative understanding of the performance of the
organization’s set of standard processes Provides process performance data, baselines, and models to quantitatively
manage the organization’s projects
Quantitative Project Management Quantitatively manage the project’s defined process to achieve the project’s
established quality and process-performance objectives.
project’s defined process
customer and project objectives
measurement repository
organizational standard process
organizational performance data
& models
tailoring
project performance
Copyright 2005 Northrop Grumman Corporation

Copyright 2005 Northrop Grumman Corporation 6
Exercise –What is Quantitative Management?
Suppose your project conducted several peer reviews of similar code, and analyzed the results Mean = 7.8 defects/KSLOC +3σ = 11.60 defects/KSLOC -3σ = 4.001 defects/KSLOC
What would you expect the next peer review to produce in terms of defects/ KSLOC?
What would you think if a review resulted in 10 defects/KSLOC?
3 defects/KSLOC?
How would this be useful to your project/ organization? Was the review effective? Was the process different? Is the product different?

Copyright 2005 Northrop Grumman Corporation 7
Exercise – What is Required for Quantitative Management?
What is needed to develop the statistical characterization of a process?
The process has to be stable (predictable) Process must be
consistently performed Complex processes may
need to be stratified (separated into simpler processes)
There has to be enough data points to statistically characterize the process Processes must occur
frequently within a similar context (project or organization)

Copyright 2005 Northrop Grumman Corporation 8
Typical Choices in Industry
Most customers care about: Delivered defects Cost and schedule
So organizations try to predict: Defects found throughout
the lifecycle Effectiveness of peer
reviews, testing Cost achieved/actual
(Cost Performance Index – CPI)
Schedule achieved/actual (Schedule Performance Index – SPI)
Defect Detection Profile
0.00
20.00
40.00
60.00
80.00
100.00
120.00
140.00
160.00
180.00
Req'mts Design Code Unit Test Integrate Sys Test Del 90 Days
Phase
Def
ects
/KS
LO
C
All Projects
New Process
Process performance• Process measures (e.g., effectiveness, efficiency, speed)• Product measures (e.g., quality, defect density).

Copyright 2005 Northrop Grumman Corporation 9
What Can a Level 4 Project/Organization Do?
Determine whether processes are behaving consistently or have stable trends (i.e., are predictable)
Identify processes where the performance is within natural bounds that are consistent across process implementation teams
Establish criteria for identifying whether a process or process element should be statistically managed, and determine pertinent measures and analytic techniques to be used in such management
Identify processes that show unusual (e.g., sporadic or unpredictable) behavior
Identify any aspects of the processes that can be improved in the organization's set of standard processes
Identify the implementation of a process which performs best

Copyright 2005 Northrop Grumman Corporation 10
What Drives the Effectiveness of Level 4?
project’s defined process
customer and project objectives
measurement repository
organizational standard process
organizational performance data
& models
tailoring
project performance
• Comparable projects?• Enough measures to
stratify/analyze the data?
• Enough data points?• How insightful/useful are
the baselines and models?
• How detailed are the standard processes?
• What tailoring is allowed?
• Stable processes?• Clean data?
• Does the organization’s process fit the objectives?
• How much tailoring?• Does the project follow
its process?

Copyright 2005 Northrop Grumman Corporation 11
Level 5
Level 3
What Does Level 5 Add to the Organization?
Organizational Process Focus
Goals are qualitative (e.g., get better)
The effects of the improvements are not estimated or measured
Organizational Innovation & Deployment
Goals are quantitative (e.g., reduce variation by X%, reduce mean by Y%)
Incremental improvements – eliminate special causes of variation
Innovative improvements - cause a major shift in process capability
Potential improvements are analyzed to estimate costs and impacts (benefits)
Improvements are piloted to ensure success
Improvements are measured in terms of variation and mean

Copyright 2005 Northrop Grumman Corporation 12
Peer Reviews – Improving the Process
Reduce the variation Train people on the process Create procedures/checklists Strengthen process audits
Increase the effectiveness (increase the mean) Train people Create checklists Reduce waste and re-work Replicate best practices from
other projects

Copyright 2005 Northrop Grumman Corporation 13
What Does Level 5 Add to the Project?
Causal Analysis & Resolution Identify and analyze causes of defects and other problems Take specific actions to remove the causes
The project can then take actions to prevent the occurrence of those types of defects and problems in the future
Many projects implement Causal Analysis & Resolution at Level 4 Identify and eliminate special cause variations to stabilize the
process

Copyright 2005 Northrop Grumman Corporation 14
How Does Level 4 & 5 Benefit the Customer?
Organizational process performance
More accurate estimates
Quantitative project management
Problem behaviors are recognized faster, enabling quicker resolution
Organizational innovation and deployment
The project benefits from improvements found and proven on other projects
Causal analysis The project fixes the source
of defects to prevent future defects
Level 5 reduces costs and improves quality (so we implement it on Level 5 reduces costs and improves quality (so we implement it on allall projects)projects)
Level 5 reduces costs and improves quality (so we implement it on Level 5 reduces costs and improves quality (so we implement it on allall projects)projects)
Reference: How Does High Maturity Benefit the Customer?, R. Hefner, Systems & Software Technology Conference, 2005

Copyright 2005 Northrop Grumman Corporation 15
Two Complementary Approaches to Process Improvement
Data-Driven (e.g., Lean Six Sigma)
Clarify what your customer wants (Voice of Customer) Critical to Quality (CTQs)
Determine what your processes can do (Voice of Process) Statistical Process Control
Identify and prioritize improvement opportunities Causal analysis of data
Determine where your customers/competitors are going (Voice of Business) Design for Six Sigma
Model-Driven (e.g., CMM, CMMI)
Determine the industry best practice Benchmarking, models
Compare your current practices to the model Appraisal, education
Identify and prioritize improvement opportunities Implementation Institutionalization
Look for ways to optimize the processes

Copyright 2005 Northrop Grumman Corporation 16
Side effects ofregister usage
Can’t keep track
Poordocumentation
Registerallocation
defect
Incorrect processorregister usage
Lack ofprocessorknowledge
Can’t isolate
Pass 1architecture
Process knowledge
UCL 1
LCL 1
UCL 2
LCL 21 2 3 4 5 6 7 7C 8B 8B 8C 8D 8F 20 21 22 23
0
2
4
6
8
10
12
14
16Actual
Expected
95% limits
UCL
_X
Process variation Process performance
0
2
4
6
8
10
12
Projects Audited in First Quarter
Nu
mb
er o
f N
on
com
pli
ance
s
Improve & ControlStabilize Predict
Lean Six Sigma Provides the Needed Tools to Implement CMMI High Maturity
Level 4 Understand project’s process capabilities
based on process performance baselines Control process variation
(remove “assignable causes”) Predict results using process performance
models Manage to achieve goals
Level 5 Base improvement goals on
future business needs Eliminate problem and defect
causes (“common causes”) Select, predict, and measure
improvements to change the process performance baselines - shift the mean; tighten the variance
Manage change

Copyright 2005 Northrop Grumman Corporation 17
Barriers and Challenges
Engineering process measurements are often difficult to analyze Inherent process variations when human creativity is involved Dirty (or no) data Vague measurement definitions, human recording errors Infrequent measurements Non-normal data Need for stratification/aggregation
Must demonstrate the value of quantitative data to managers Management style - reactive vs. proactive vs. quantitative Less value in a chaotic environment Must involve customers

Copyright 2005 Northrop Grumman Corporation 18
Launch 1 Intro to
Quantitative Management
Launch 2Statistical
ProcessControl
Launch 4CMMI Level 5(OID &CAR)
• Collect relevant project historical data, review it and perform initial “clean up”
• Collect data from project subprocesses and put on SPC charts
• Complete project profile
• Review business issues for clarity
• Identify Quantitative Measurement Plan data
• Measure progress against the Level 4/5 plan tasks
• Finish building models
• Begin tracking to models
• Draft Quantitative Measurement Plan
• Draft QPM evidence
• Measure progress against the Level 4/5 plan tasks
• Develop project CAR plan
• Start project CAR activities
• Submit improvements to support OID (when applicable)
• Measure progress against the Level 4/5 plan tasks
Launch 3QuantitativeMonitoring &Management
• Finalize project goals
• Obtain measurement data for the subprocesses the project will put under SPC analysis
• Become familiar with Northrop Grumman Mission Systems QPM process
• Definition of related six sigma project(s)
• Incorporate and measure progress against the Level 4/5 plan tasks
Northrop Grumman Launch Workshop Strategy
STM 925.1-Exec, Rev 01, 05-05-04
Launch 0 Executive Overview
Prerequisite2 week Six
Sigma Green Belt training

Copyright 2005 Northrop Grumman Corporation 19
Lessons Learned (1 of 2)
Based on over 35 Northrop Grumman CMMI Level 5 organizations
1) Level 3 metrics, measurement processes, and goal setting are generally inadequate for Levels 4 and 5 Better definitions of the measures Lower level metrics of lower level subprocesses Stratifying the data properly
2) When operating at Level 3, it is difficult to predict the measurement improvements needed Trying to understand and stabilize the key subprocesses will
naturally drive you to the right metrics
3) CMMI and Six Sigma compliment each other CMMI can yield behaviors without benefit Six Sigma improvements based solely on data may miss
innovative improvements (assumes a local optimum)
4) Six Sigma is an enabler for higher maturity Focus on data, measurement systems, process improvement Tying improvements to business goals Tools and methods support the Level 4/5 analysis tasks

Copyright 2005 Northrop Grumman Corporation 20
Lessons Learned (2 of 2)
5) Projects have different quality and process performance needs, and should select different subprocesses to quantitatively manage This will also slow adoption, and complicate the organizational
baselines and models
6) Training the staff as Six Sigma Green Belts has resulted in a change of language and culture Voice of Customer, data-driven decisions, causal analysis, etc. Better to use the tools in everyday work than to adopt the
“religion”
7) The real ROI comes in institutionalizing local improvements across the wider organization CMMI establishes the needed mechanisms
Having all the tools at Level 5 gives you the insight to manage Having all the tools at Level 5 gives you the insight to manage each project the way the customer needs it to be managedeach project the way the customer needs it to be managed
Having all the tools at Level 5 gives you the insight to manage Having all the tools at Level 5 gives you the insight to manage each project the way the customer needs it to be managedeach project the way the customer needs it to be managed

Copyright 2005 Northrop Grumman Corporation 21
References
2006 CMMI Conference “Using ‘Voice of Customer’ Tools to Advance
Organizational Innovation and Deployment”, Don Corpron
“Making OID Effective,” Diane Mizukami
“Statistical Control of System and Software Design Activities, “ Dr. Richard Welch and Ms. April King
“Business Value of CMMI Level 5,” Gene Miluk, Lynn Penn, Rick Hefner and Rushby Craig
Other Sources “Squeezing Variation for Profit”, Don Corpron, CMMI
Technology Conference and User Group, 2005 “How Does High Maturity Benefit the Customer?,”
Rick Hefner, Systems & Software Technology Conference, 2005
“Using a Process Database to Facilitate Transition to Level 4”, Rick Hefner, International Conference on Applications of Software Measurement, 2002
“Business Value and Customer Benefits Derived from High Maturity”, Alan Pflugrad, CMMI Technology Conference and User Group, 2002
http://www.isixsigma.com High Maturity with Statistics, SEI course
CMMI Implementation: Embarking on High Maturity Practices, Shivraj Kanungo, Asha Goyal
Measuring the Software Process, William A. Florac, Anita D. Carleton
Metrics and Models in Software Quality Engineering, Stephen H. Kan
Understanding Variation: The Key to Managing Chaos, Donald J. Wheeler