copyright © 2006 by mosby, inc. slide 1 chapter 13 asthma figure 13-1. asthma. dmc, degranulation...
TRANSCRIPT

Copyright © 2006 by Mosby, Inc.Slide 1
Chapter 13Chapter 13AsthmaAsthma
Figure 13-1. Figure 13-1. Asthma.Asthma. DMC,DMC, Degranulation of mast cell; Degranulation of mast cell; SMC,SMC, smooth muscle constriction; smooth muscle constriction;MA,MA, mucus accumulation; mucus accumulation; MP,MP, mucus plug; mucus plug; HALV,HALV, hyperinflation of alveoli. hyperinflation of alveoli.
Copyright © 2006 by Mosby, Inc.Slide 2
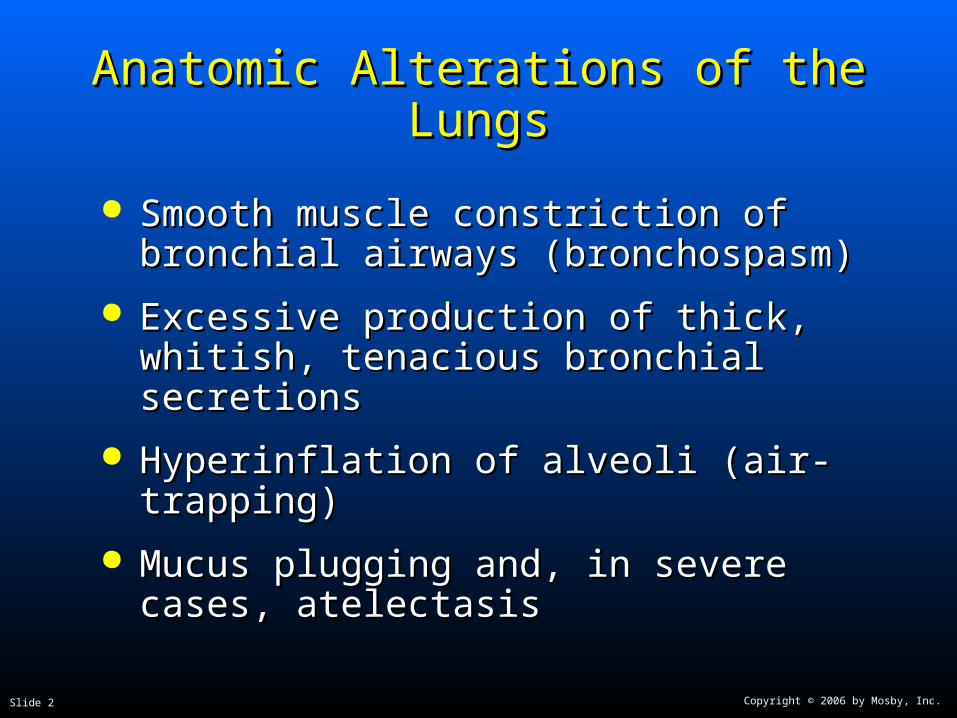
Anatomic Alterations of the LungsAnatomic Alterations of the Lungs
Smooth muscle constriction of bronchial Smooth muscle constriction of bronchial airways (bronchospasm)airways (bronchospasm)
Excessive production of thick, whitish, Excessive production of thick, whitish, tenacious bronchial secretionstenacious bronchial secretions
Hyperinflation of alveoli (air-trapping)Hyperinflation of alveoli (air-trapping)
Mucus plugging and, in severe cases, Mucus plugging and, in severe cases, atelectasisatelectasis
Copyright © 2006 by Mosby, Inc.Slide 3
EtiologyEtiology
Extrinsic asthmaExtrinsic asthma Allergic or atopic asthmaAllergic or atopic asthma
Intrinsic asthmaIntrinsic asthma Nonallergic or nonatopic asthmaNonallergic or nonatopic asthma

Copyright © 2006 by Mosby, Inc.Slide 4
Figure 13-2. Figure 13-2. The immunologic mechanisms in asthma.The immunologic mechanisms in asthma.

Copyright © 2006 by Mosby, Inc.Slide 5
Intrinsic AsthmaIntrinsic Asthma(Nonallergic or Nonatopic Asthma)(Nonallergic or Nonatopic Asthma)
InfectionsInfections
Exercise and cold airExercise and cold air
Industrial pollutants or occupational exposureIndustrial pollutants or occupational exposure
Drugs, food additives, and food preservativesDrugs, food additives, and food preservatives
Gastroesophageal refluxGastroesophageal reflux
Sleep (nocturnal asthma)Sleep (nocturnal asthma)
Emotional stressEmotional stress
Premenstrual asthmaPremenstrual asthma

Copyright © 2006 by Mosby, Inc.Slide 6
Figure 13-3. Figure 13-3. Factors triggering intrinsic asthma.Factors triggering intrinsic asthma.

Copyright © 2006 by Mosby, Inc.Slide 7
Additional Risk FactorsAdditional Risk Factors
Residence in a large urban area, especially Residence in a large urban area, especially the inner citythe inner city
Exposure to secondhand smokeExposure to secondhand smoke
A parent who has asthmaA parent who has asthma
Respiratory infections in childhoodRespiratory infections in childhood
Low birth weightLow birth weight
ObesityObesity

Copyright © 2006 by Mosby, Inc.Slide 8
Overview of the Cardiopulmonary Overview of the Cardiopulmonary Clinical Manifestations Associated Clinical Manifestations Associated
with ASTHMAwith ASTHMA
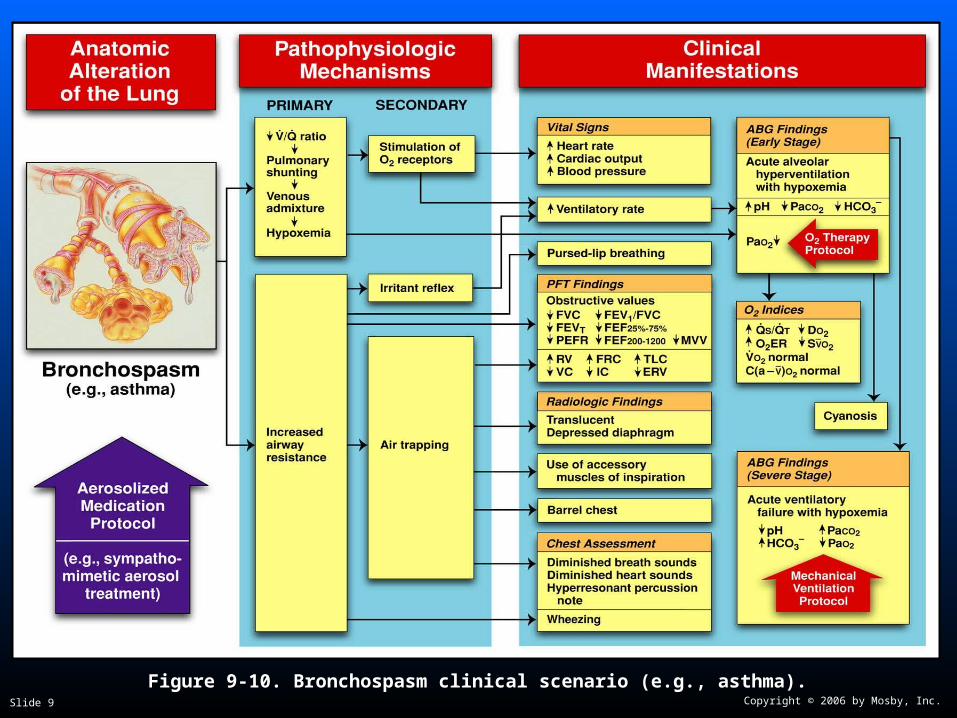
The following clinical manifestations result from The following clinical manifestations result from the pathophysiologic mechanisms caused (or the pathophysiologic mechanisms caused (or activated) by activated) by BronchospasmBronchospasm (see Figure 9-10) (see Figure 9-10) and and Excessive Bronchial SecretionsExcessive Bronchial Secretions (see Figure (see Figure 9-11)—the major anatomic alterations of the lungs 9-11)—the major anatomic alterations of the lungs associated with asthma (see Figure 13-1).associated with asthma (see Figure 13-1).
Copyright © 2006 by Mosby, Inc.Slide 9
Figure 9-10. Bronchospasm clinical scenario (e.g., asthma).Figure 9-10. Bronchospasm clinical scenario (e.g., asthma).

Copyright © 2006 by Mosby, Inc.Slide 10
Figure 9-11. Excessive bronchial secretions clinical scenario.Figure 9-11. Excessive bronchial secretions clinical scenario.

Copyright © 2006 by Mosby, Inc.Slide 11
Vital signsVital signs
Increased respiratory rateIncreased respiratory rate
Increased heart rate, cardiac output,Increased heart rate, cardiac output,blood pressureblood pressure
Clinical Data Obtained at the Clinical Data Obtained at the Patient’s BedsidePatient’s Bedside
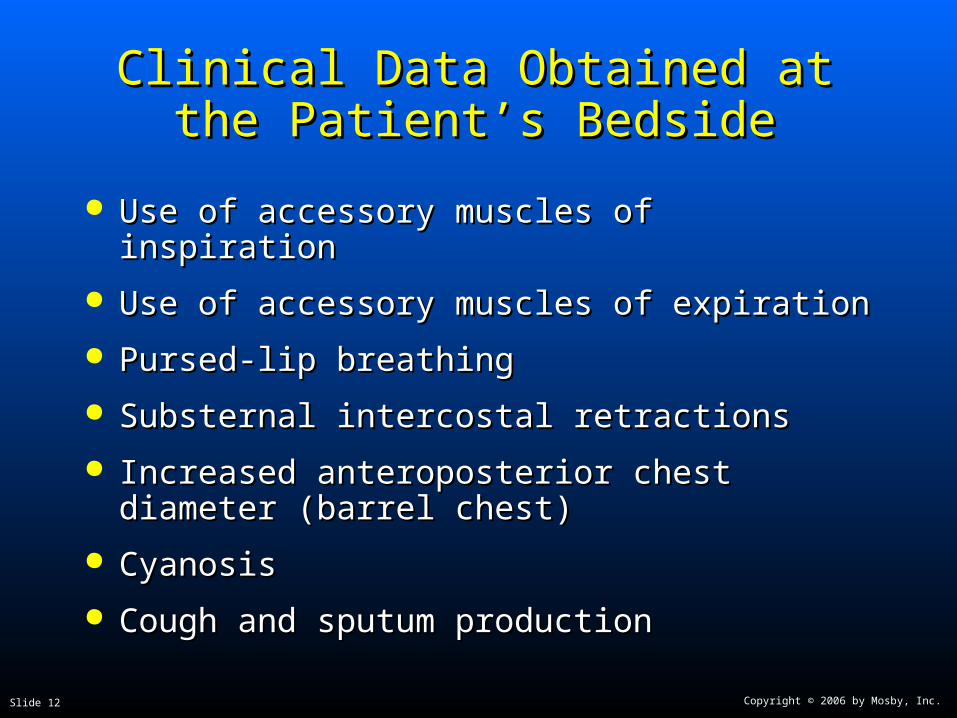
Copyright © 2006 by Mosby, Inc.Slide 12
Use of accessory muscles of inspirationUse of accessory muscles of inspiration
Use of accessory muscles of expirationUse of accessory muscles of expiration
Pursed-lip breathingPursed-lip breathing
Substernal intercostal retractionsSubsternal intercostal retractions
Increased anteroposterior chest diameter Increased anteroposterior chest diameter (barrel chest)(barrel chest)
CyanosisCyanosis
Cough and sputum productionCough and sputum production
Clinical Data Obtained at the Clinical Data Obtained at the Patient’s BedsidePatient’s Bedside
Copyright © 2006 by Mosby, Inc.Slide 13
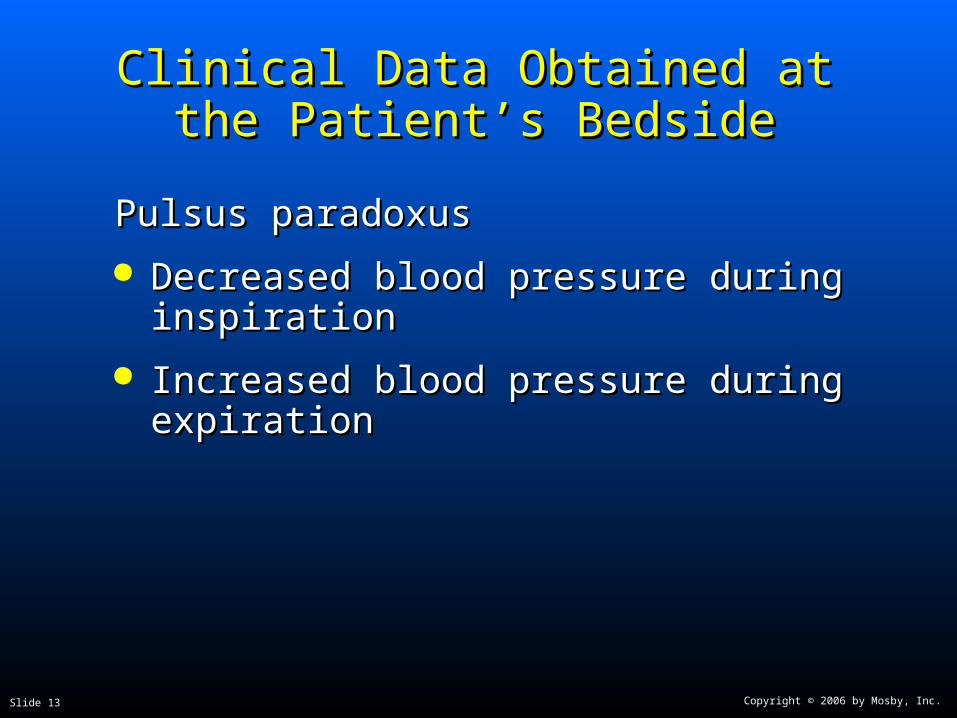
Pulsus paradoxusPulsus paradoxus
Decreased blood pressure during inspirationDecreased blood pressure during inspiration
Increased blood pressure during expirationIncreased blood pressure during expiration
Clinical Data Obtained at the Clinical Data Obtained at the Patient’s BedsidePatient’s Bedside

Copyright © 2006 by Mosby, Inc.Slide 14
Chest assessment findingsChest assessment findings
Expiratory prolongationExpiratory prolongation
Decreased tactile and vocal fremitusDecreased tactile and vocal fremitus
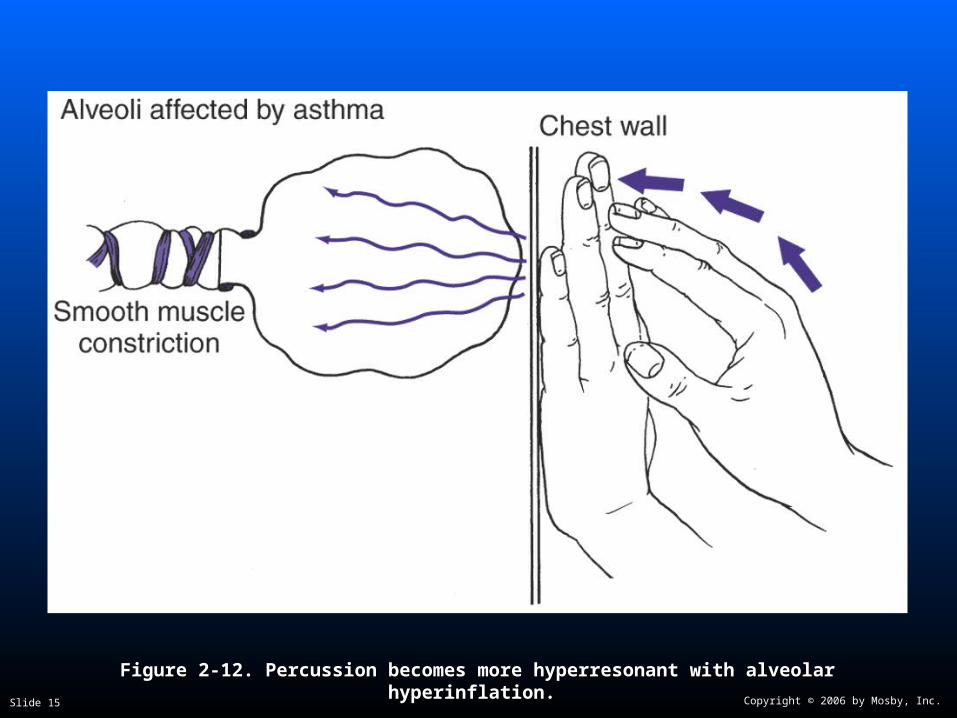
Hyperresonant percussionHyperresonant percussion
Diminished breath soundsDiminished breath sounds
Diminished heart soundsDiminished heart sounds
Wheezing and rhonchiWheezing and rhonchi
Clinical Data Obtained at the Clinical Data Obtained at the Patient’s BedsidePatient’s Bedside
Copyright © 2006 by Mosby, Inc.Slide 15
Figure 2-12. Figure 2-12. Percussion becomes more hyperresonant with alveolar hyperinflation.Percussion becomes more hyperresonant with alveolar hyperinflation.

Copyright © 2006 by Mosby, Inc.Slide 16
Figure 2-17. Figure 2-17. As air trapping and alveolar hyperinflation develop in obstructive As air trapping and alveolar hyperinflation develop in obstructive lung diseases, breath sounds progressively diminish.lung diseases, breath sounds progressively diminish.

Copyright © 2006 by Mosby, Inc.Slide 17
Clinical DataClinical DataObtained from Laboratory TestsObtained from Laboratory Tests
and Special Proceduresand Special Procedures
Copyright © 2006 by Mosby, Inc.Slide 18
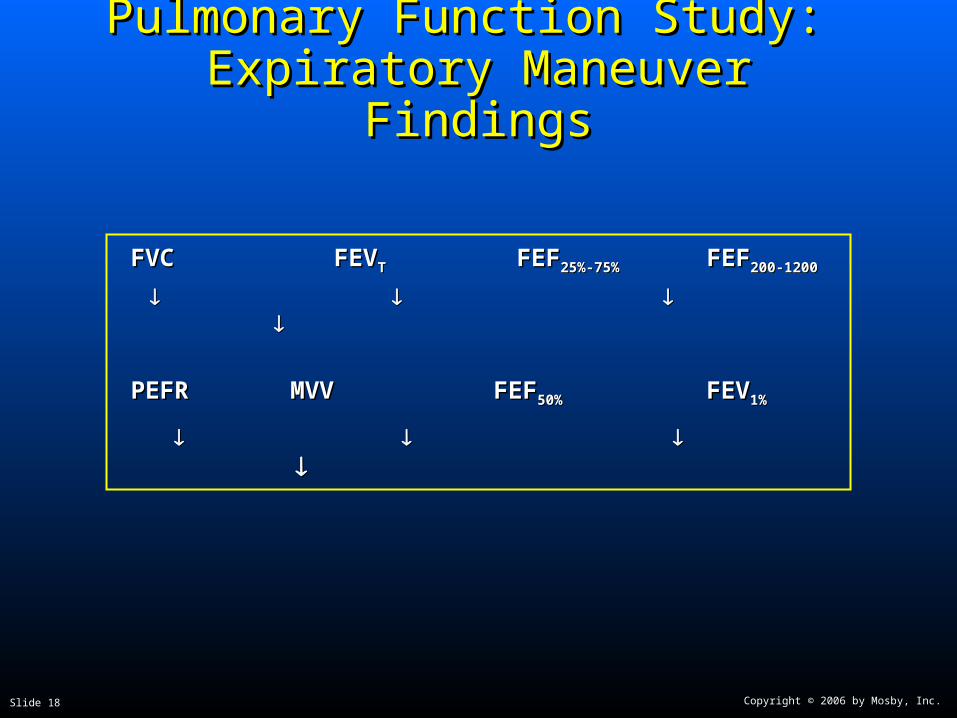
Pulmonary Function Study: Pulmonary Function Study: Expiratory Maneuver FindingsExpiratory Maneuver Findings
FVC FEVFVC FEVTT FEF FEF25%-75%25%-75% FEF FEF200-1200200-1200
PEFRPEFR MVV FEFMVV FEF50% 50% FEVFEV1%1%
Copyright © 2006 by Mosby, Inc.Slide 19
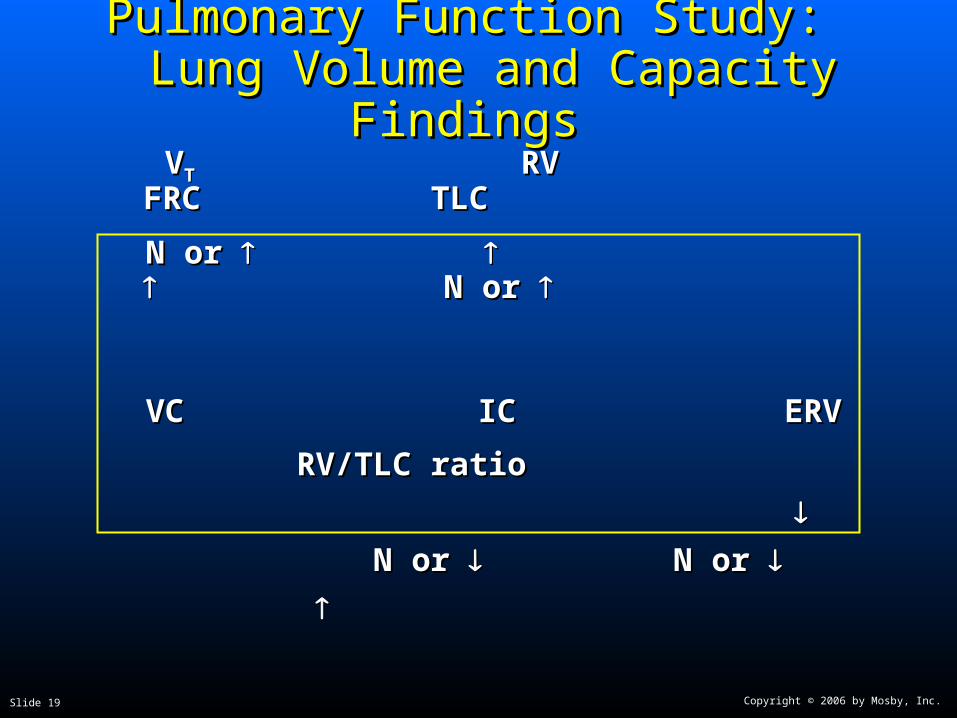
Pulmonary Function Study: Pulmonary Function Study: Lung Volume and Capacity Findings Lung Volume and Capacity Findings
VVTT RV FRC TLC RV FRC TLC
N or N or N or N or
VCVC IC ERV RV/TLC ratio IC ERV RV/TLC ratio
N or N or
N or N or
Copyright © 2006 by Mosby, Inc.Slide 20
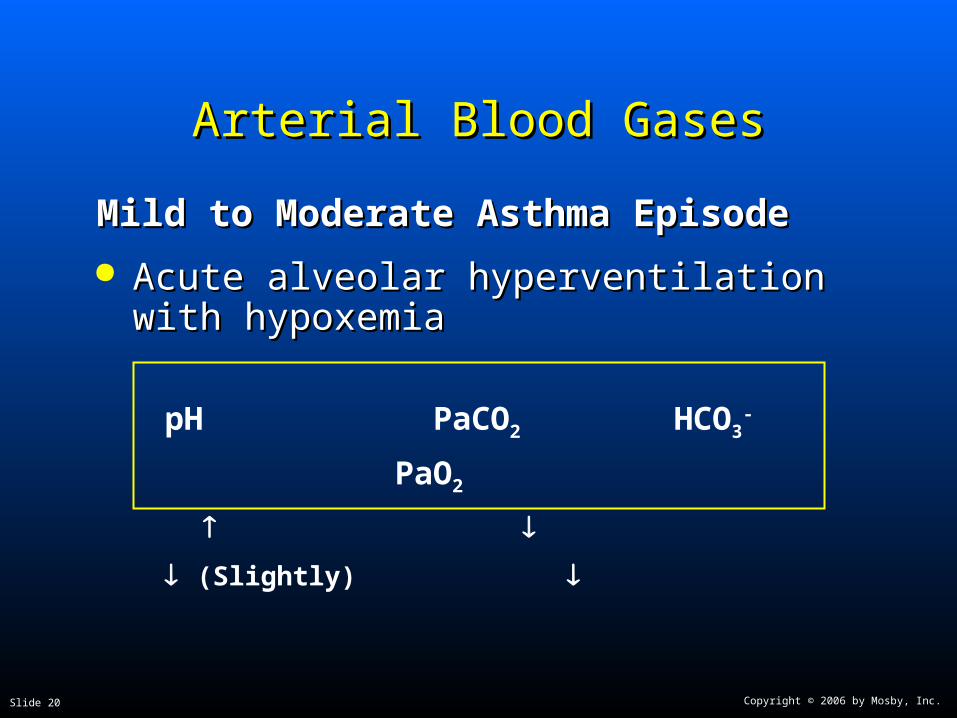
Arterial Blood GasesArterial Blood Gases
Mild to Moderate Asthma EpisodeMild to Moderate Asthma Episode
Acute alveolar hyperventilation with Acute alveolar hyperventilation with hypoxemiahypoxemia
pH PaCO2 HCO3- PaO2
(Slightly)
Copyright © 2006 by Mosby, Inc.Slide 21
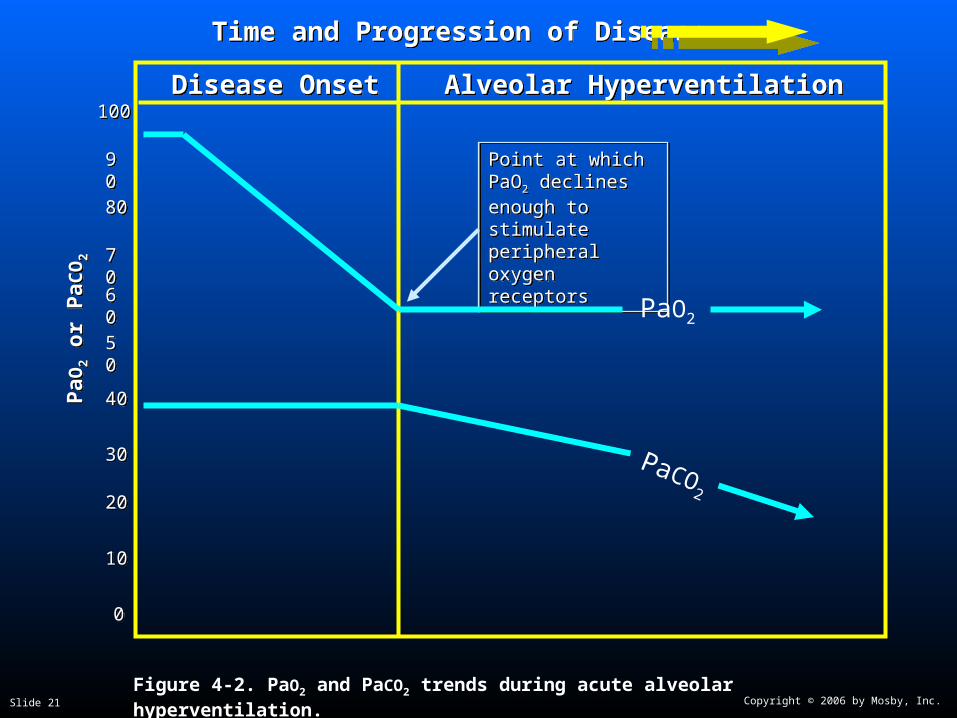
Time and Progression of Disease Time and Progression of Disease
100100
5050
3030
8080
00
PaCO2
1010
2020
4040
Alveolar HyperventilationAlveolar Hyperventilation
6060
7070
9090 Point at which PaO2 declines enough to stimulate peripheral oxygen receptors
Point at which PaO2 declines enough to stimulate peripheral oxygen receptors
PaO2
Disease OnsetDisease OnsetP
aO2
or
PaC
O2
PaO
2 o
r P
aCO
2
Figure 4-2. PaO2 and PaCO2 trends during acute alveolar hyperventilation.
Copyright © 2006 by Mosby, Inc.Slide 22
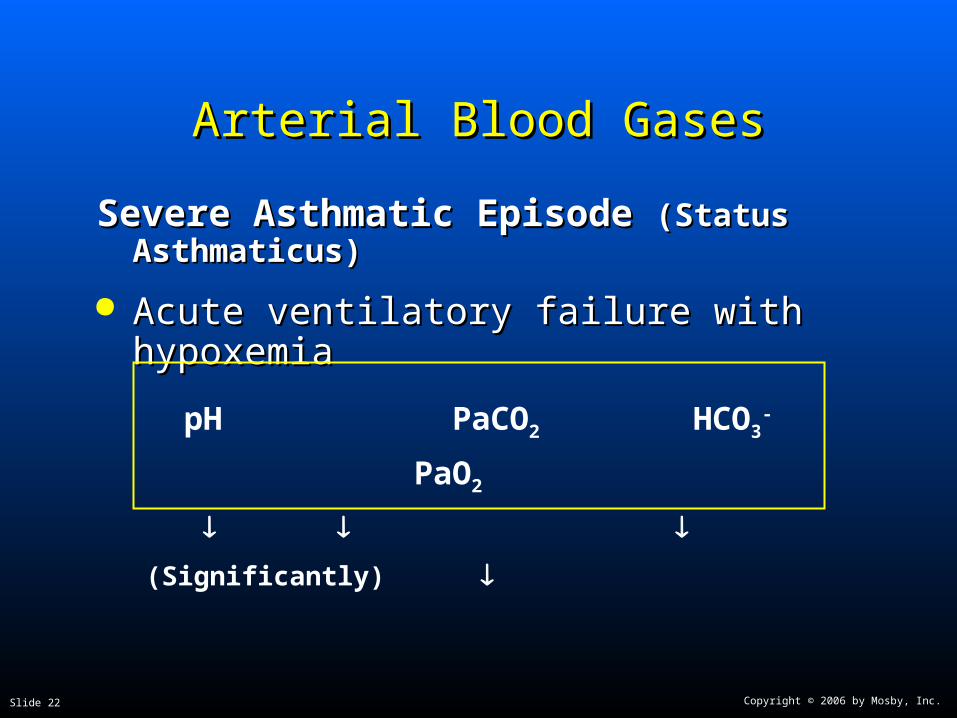
Arterial Blood GasesArterial Blood Gases
Severe Asthmatic Episode Severe Asthmatic Episode (Status Asthmaticus)(Status Asthmaticus)
Acute ventilatory failure with hypoxemiaAcute ventilatory failure with hypoxemia
pH PaCO2 HCO3- PaO2
(Significantly)
Copyright © 2006 by Mosby, Inc.Slide 23
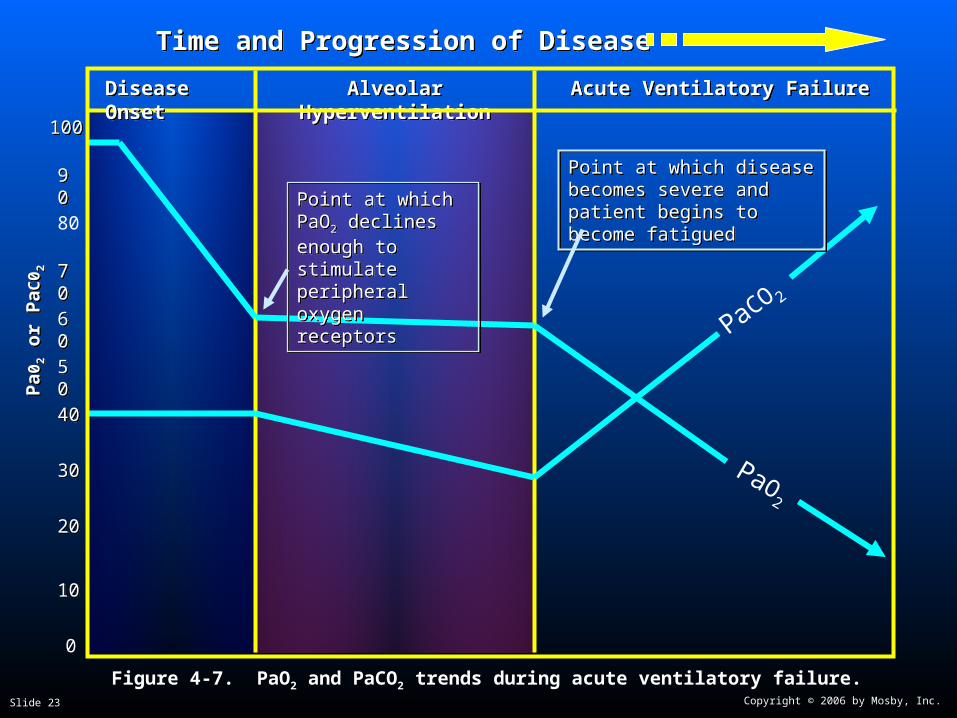
Time and Progression of DiseaseTime and Progression of Disease
100100
5050
3030
80
0
PaO2
1010
2020
4040
Alveolar HyperventilationAlveolar Hyperventilation
6060
7070
9090Point at which PaO2 declines enough to stimulate peripheral oxygen receptors
Point at which PaO2 declines enough to stimulate peripheral oxygen receptors
PaCO 2
Acute Ventilatory Failure Acute Ventilatory FailureDisease OnsetDisease Onset
Point at which disease becomes severe and patient begins to become fatigued
Point at which disease becomes severe and patient begins to become fatigued
Pa0
2 o
r P
aC0 2
Pa0
2 o
r P
aC0 2
Figure 4-7. PaO2 and PaCO2 trends during acute ventilatory failure.

Copyright © 2006 by Mosby, Inc.Slide 24
Oxygenation IndicesOxygenation Indices
QQSS/Q/QTT D DOO22 V VOO22 C(a-v) C(a-v)OO22
Normal NormalNormal Normal
OO22ER SvER SvOO2 2
Copyright © 2006 by Mosby, Inc.Slide 25
Abnormal Laboratory Tests and Abnormal Laboratory Tests and ProceduresProcedures
Abnormal laboratory tests and procedures Abnormal laboratory tests and procedures Sputum examinationSputum examination
• EosinophilsEosinophils
• Charcot-Leyden crystals (see next slide)Charcot-Leyden crystals (see next slide)
• Casts of mucus from small airwaysCasts of mucus from small airways called Kirschman spiralscalled Kirschman spirals
• IgE level (elevated in extrinsic asthma)IgE level (elevated in extrinsic asthma)

Copyright © 2006 by Mosby, Inc.Slide 26
Charcot-Leyden Crystals Charcot-Leyden Crystals
Needle shaped crystals -Needle shaped crystals -
Represents breakdown products of eosinophils Represents breakdown products of eosinophils
Copyright © 2006 by Mosby, Inc.Slide 27
Radiologic FindingsRadiologic Findings
Chest radiographChest radiograph
Increased anteroposterior diameterIncreased anteroposterior diameter
Translucent (dark) lung fieldsTranslucent (dark) lung fields
Depressed or flattened diaphragmDepressed or flattened diaphragm

Copyright © 2006 by Mosby, Inc.Slide 28
Figure 13-4. Figure 13-4. Chest X-ray of a 2-year-old patient during an acute asthma attack.Chest X-ray of a 2-year-old patient during an acute asthma attack.

Copyright © 2006 by Mosby, Inc.Slide 29
Table 13-1. Asthma Classification Table 13-1. Asthma Classification Based on Severity—ExcerptsBased on Severity—Excerpts
DiseaseDisease Symptoms Symptoms
Step 4:Step 4: Continual symptomsContinual symptoms
Step 3:Step 3: Daily symptomsDaily symptoms
Step 2:Step 2: Symptoms > than twice weeklySymptoms > than twice weekly
Step 1:Step 1: Symptoms < than twice weeklySymptoms < than twice weekly
From McCance KL, Huether SE: From McCance KL, Huether SE: Pathophysiology: The biologic basis for disease in adults and Pathophysiology: The biologic basis for disease in adults and childrenchildren, ed 4, St. Louis, 2002, Mosby., ed 4, St. Louis, 2002, Mosby.

Copyright © 2006 by Mosby, Inc.Slide 30
Table 13-2. Asthma Zone Management Table 13-2. Asthma Zone Management System—ExcerptsSystem—Excerpts
Green zoneGreen zone 80% to 100% of personal best PEFR80% to 100% of personal best PEFR
Yellow zoneYellow zone 50% to 80% of personal best PEFR50% to 80% of personal best PEFR
Red zoneRed zone <50% of personal best PEFR<50% of personal best PEFR
Copyright © 2006 by Mosby, Inc.Slide 31
General Management of AsthmaGeneral Management of Asthma
Environmental controlEnvironmental control
Respiratory care treatment protocolsRespiratory care treatment protocols Oxygen therapy protocolOxygen therapy protocol
Bronchial hygiene therapy protocolBronchial hygiene therapy protocol
Aerosolized medication protocolAerosolized medication protocol
Mechanical ventilation protocolMechanical ventilation protocol
Medications commonly prescribedMedications commonly prescribed XanthinesXanthines
CorticosteroidsCorticosteroids
Anti-inflammatory agentsAnti-inflammatory agents
Leukotriene inhibitorsLeukotriene inhibitors

Copyright © 2006 by Mosby, Inc.Slide 32
General Management of AsthmaGeneral Management of Asthma
MonitoringMonitoring Arterial blood gas measurementsArterial blood gas measurements
Pulse oximetryPulse oximetry
Serial PFTsSerial PFTs
• PEFR PEFR
• FEVFEV11
Vital signsVital signs
Chest radiographsChest radiographs
Copyright © 2006 by Mosby, Inc.Slide 33
General Management of AsthmaGeneral Management of Asthma
Patient compliancePatient compliance Asthma-symptom/medication-use diariesAsthma-symptom/medication-use diaries Serum theophylline levelsSerum theophylline levels Carboxyhemoglobin determinationsCarboxyhemoglobin determinations Total (circulating) eosinophil countsTotal (circulating) eosinophil counts No-show rates at physician officesNo-show rates at physician offices Rate of medication useRate of medication use Frequency of emergency department visits and Frequency of emergency department visits and
hospitalizationshospitalizations Number of red zone days per months (see Table 13-2)Number of red zone days per months (see Table 13-2)

Copyright © 2006 by Mosby, Inc.Slide 34
Classroom DiscussionClassroom DiscussionCase Study: AsthmaCase Study: Asthma