copyright © 2013 pearson education, inc. publishing as prentice hall. building blocks of managerial...
TRANSCRIPT

Copyright © 2013 Pearson Education, Inc. Publishing as Prentice Hall. 1
Building Blocks of Managerial Accounting
Chapter 2

Copyright © 2013 Pearson Education, Inc. Publishing as Prentice Hall. 2
Objective 1Distinguish among service,
merchandising, and manufacturing companies

Copyright © 2013 Pearson Education, Inc. Publishing as Prentice Hall. 3
Three types of companies
• Service
• Merchandisers
• Manufacturers

Copyright © 2013 Pearson Education, Inc. Publishing as Prentice Hall. 4
Service Companies
• Provide a service only• No inventory• Examples
– Accountants– Banks– Doctors– Lawyers

Copyright © 2013 Pearson Education, Inc. Publishing as Prentice Hall. 5
Merchandisers
• Resell products purchased from suppliers • One inventory account• Examples
– Amazon.com– J. C. Penney– Sears
• Retailers vs. Wholesalers

Copyright © 2013 Pearson Education, Inc. Publishing as Prentice Hall. 6
Manufacturers
• Use labor and other inputs to convert raw materials into finished products
• Examples– Crayola Crayons– Dell Computers– Craftsman Tools
• 3 inventory accounts

Copyright © 2013 Pearson Education, Inc. Publishing as Prentice Hall. 7
Manufacturers
• 3 inventory accounts
– Raw materials
– Work in process
– Finished goods

Copyright © 2013 Pearson Education, Inc. Publishing as Prentice Hall. 8
Objective 2Describe the value chain
and its elements

Copyright © 2013 Pearson Education, Inc. Publishing as Prentice Hall. 9
Value Chain• Activities that add value to products and
services and cost money.
R&DProduction/Purchases
Marketing
Design
DistributionCustomer
Service
Copyright © 2013 Pearson Education, Inc. Publishing as Prentice Hall. 10
Now turn to E2-16A

Copyright © 2013 Pearson Education, Inc. Publishing as Prentice Hall.
E2-16A
Research on selling satellite radio service
Purchases of merchandise
Rearranging store layout
11

Copyright © 2013 Pearson Education, Inc. Publishing as Prentice Hall.
E2-16A
Research on selling satellite radio service R & D
Purchases of merchandise
Rearranging store layout
12

Copyright © 2013 Pearson Education, Inc. Publishing as Prentice Hall.
E2-16A
Research on selling satellite radio service R & D
Purchases of merchandise Purchases
Rearranging store layout
13

Copyright © 2013 Pearson Education, Inc. Publishing as Prentice Hall.
E2-16A
Research on selling satellite radio service R & D
Purchases of merchandise Purchases
Rearranging store layout Design
14

Copyright © 2013 Pearson Education, Inc. Publishing as Prentice Hall.
E2-16A (cont.)
Newspaper advertisements
Deprec. expense on delivery trucks
Payment to consultant for advice on location of new store
15

Copyright © 2013 Pearson Education, Inc. Publishing as Prentice Hall.
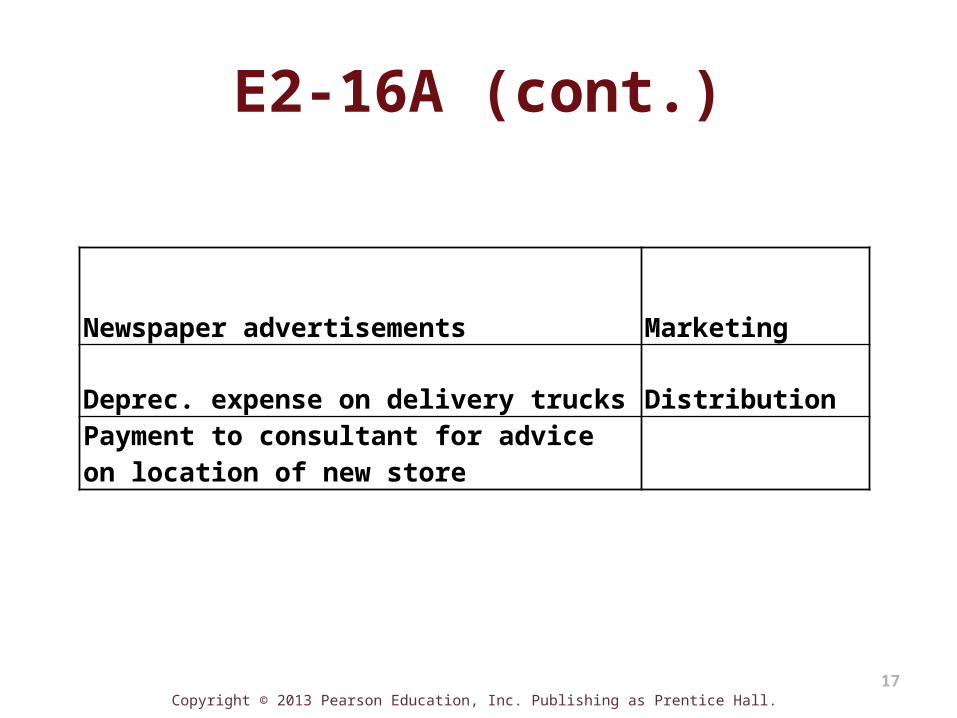
E2-16A (cont.)
Newspaper advertisements Marketing
Deprec. expense on delivery trucks
Payment to consultant for advice on location of new store
16
Copyright © 2013 Pearson Education, Inc. Publishing as Prentice Hall.
E2-16A (cont.)
Newspaper advertisements Marketing
Deprec. expense on delivery trucks Distribution
Payment to consultant for advice on location of new store
17
Copyright © 2013 Pearson Education, Inc. Publishing as Prentice Hall.
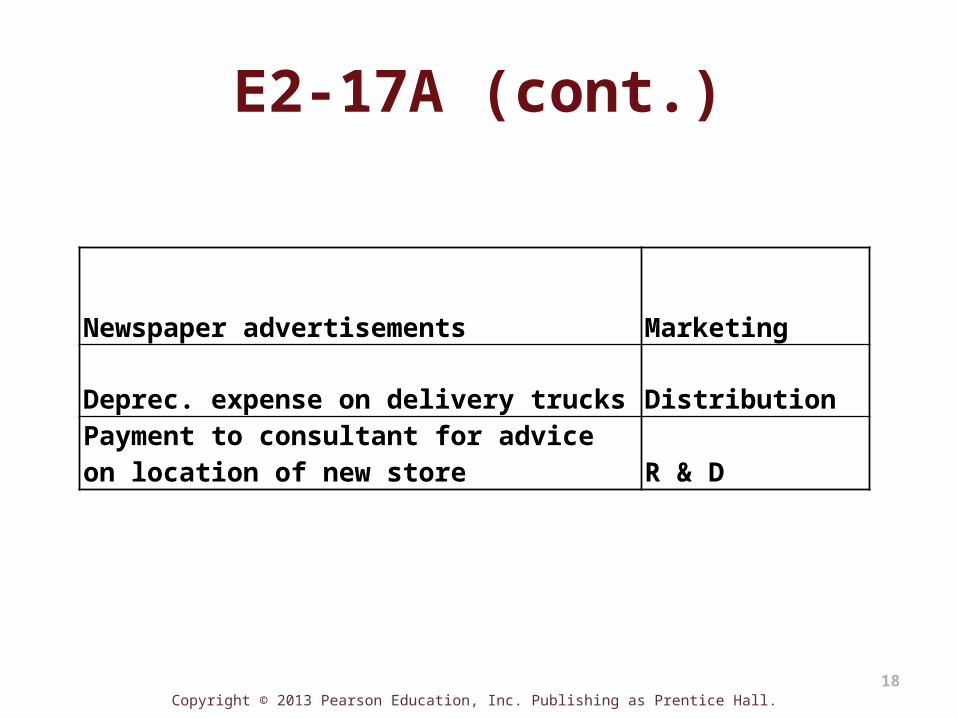
E2-17A (cont.)
Newspaper advertisements Marketing
Deprec. expense on delivery trucks Distribution
Payment to consultant for advice on location of new store R & D
18

Copyright © 2013 Pearson Education, Inc. Publishing as Prentice Hall.
E2-16A (cont.)
Freight-in
Salespersons’ salaries
Customer complaint department
19

Copyright © 2013 Pearson Education, Inc. Publishing as Prentice Hall.
E2-16A (cont.)
Freight-in Purchases
Salespersons’ salaries
Customer complaint department
20

Copyright © 2013 Pearson Education, Inc. Publishing as Prentice Hall.
E2-16A (cont.)
Freight-in Purchases
Salespersons’ salaries Marketing
Customer complaint department
21

Copyright © 2013 Pearson Education, Inc. Publishing as Prentice Hall.
E2-16A (cont.)
Freight-in Purchases
Salespersons’ salaries Marketing
Customer complaint departmentCustomer service
22

Copyright © 2013 Pearson Education, Inc. Publishing as Prentice Hall. 23
Objective 3Distinguish between direct and
indirect costs

Copyright © 2013 Pearson Education, Inc. Publishing as Prentice Hall. 24
Cost Object
• Anything for which managers want a separate measurement of cost– Direct cost
– Indirect cost

Copyright © 2013 Pearson Education, Inc. Publishing as Prentice Hall. 25
Now turn to S2-4

Copyright © 2013 Pearson Education, Inc. Publishing as Prentice Hall. 26
a. The wages of store employees
b. The cost of operating the corporate payroll department
c. The cost of carpet steamers offered for rent
d. The cost of gas and oil sold at the store
S2-4
Direct
Direct
Indirect
Direct

Copyright © 2013 Pearson Education, Inc. Publishing as Prentice Hall. 27
S2-4 (cont.)
e. Store utilitiesf. The CEO’s salaryg. The cost of chainsaws
offered for renth. The cost of national
advertising Indirect
Direct
DirectIndirect
Copyright © 2013 Pearson Education, Inc. Publishing as Prentice Hall. 28
Objective 4Identify the inventoriable product costs and period costs of merchandising and
manufacturing firms

Copyright © 2013 Pearson Education, Inc. Publishing as Prentice Hall. 29
Two definitions of product cost
• Total costs – used internally only (will see this in later chapters)
• Inventoriable product costs – used for external reporting

Copyright © 2013 Pearson Education, Inc. Publishing as Prentice Hall. 30
R&D Design
MarketingDistributionCustomer
Service
Production/Purchases
Inventoriable Product Costs
Inventoriable product costs

Copyright © 2013 Pearson Education, Inc. Publishing as Prentice Hall. 31
Period Costs: All costs incurred in the other stages of the value chain
Period Costs
MarketingDistributionCustomer
Service
R&D Design

Copyright © 2013 Pearson Education, Inc. Publishing as Prentice Hall. 32
Inventoriable Product Costs -- Merchandiser
• + Purchase price from suppliers • + Cost to get ready for sale• + Freight-in• + Import duties or tariffs

Copyright © 2013 Pearson Education, Inc. Publishing as Prentice Hall. 33
Inventoriable Product Costs -- Manufacturer
• Direct materials• Direct labor• Manufacturing overhead
Direct Costs
Indirect Costs

Copyright © 2013 Pearson Education, Inc. Publishing as Prentice Hall. 34
Manufacturing Overhead
• Indirect costs related to manufacturing that are not direct materials or direct labor– Indirect materials
– Indirect labor
– Other indirect manufacturing overhead

Copyright © 2013 Pearson Education, Inc. Publishing as Prentice Hall. 35
Now turn to S2-7

Copyright © 2013 Pearson Education, Inc. Publishing as Prentice Hall. 36
1. Company president’s annual bonus
2. Plastic gallon containers in which milk is packaged
3. Depreciation on marketing department’s computers
4. Wages and salaries paid to machine operators at dairy processing plant
S2-7
Period
Period
Product, DM
Product, DL

Copyright © 2013 Pearson Education, Inc. Publishing as Prentice Hall. 37
5. Research and Development on improving milk pasteurization process
6. Cost of milk purchased from dairy farmers
Product, DM
7. Lubricants used in running bottling machines
8. Depreciation on refrigerated trucks used to collect raw milk from dairy farms
S2-7 (cont.)
Product,MOH
Period
Product,MOH

Copyright © 2013 Pearson Education, Inc. Publishing as Prentice Hall. 38
9. Property tax on dairy processing plant
10. Television advertisements for DairyPlains’ products
11.Gasoline used to operate refrigerated trucks used to deliver finished dairy products to grocery stores
S2-7 (cont.)
Period
Product,MOH
Period
Copyright © 2013 Pearson Education, Inc. Publishing as Prentice Hall. 39
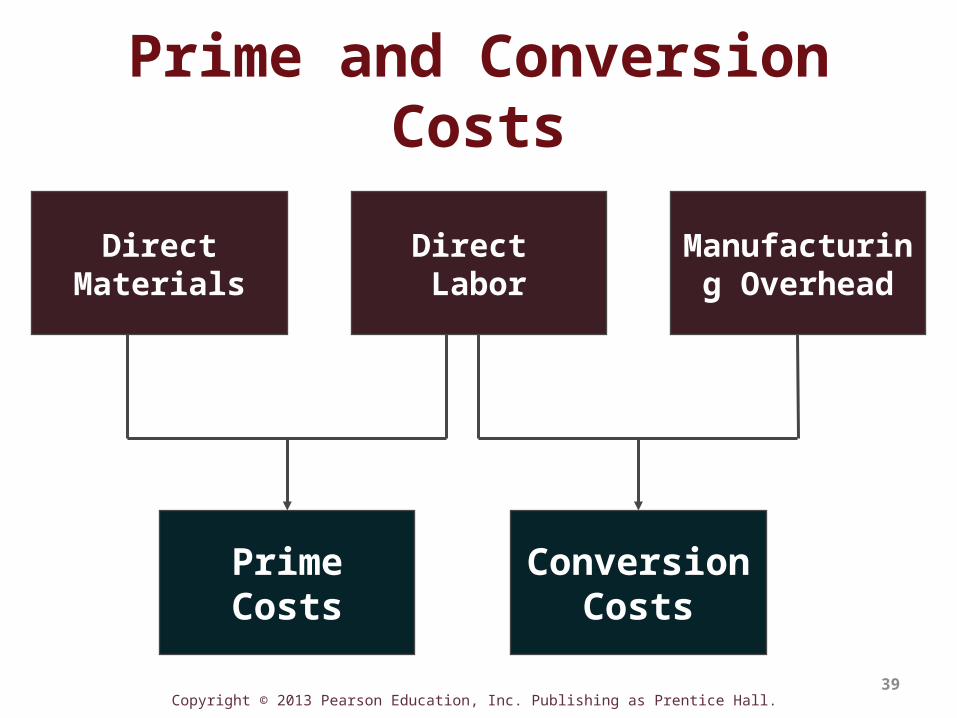
Prime and Conversion Costs
Manufacturing Overhead
Direct Materials
Prime Costs
Direct Labor
Conversion Costs

Copyright © 2013 Pearson Education, Inc. Publishing as Prentice Hall. 40
Direct and indirect labor costs include
• Salaries and wages • Fringe benefits• Payroll taxes

Copyright © 2013 Pearson Education, Inc. Publishing as Prentice Hall. 41
Objective 5Prepare the financial statements for
service, merchandising and manufacturing companies

Copyright © 2013 Pearson Education, Inc. Publishing as Prentice Hall. 42
Income Statement – Service Company
• Simplest income statement• All costs are period costs
Service Revenues- Operating expenses Operating income

Copyright © 2013 Pearson Education, Inc. Publishing as Prentice Hall. 43
Cost of Goods Sold Calculation – Merchandiser
+ Beginning inventory+ Purchases+ Import duties or tariffs+ Freight-in= Cost of goods available for sale- Ending inventory= Cost of goods sold

Copyright © 2013 Pearson Education, Inc. Publishing as Prentice Hall. 44
Now turn to S2-9

Copyright © 2013 Pearson Education, Inc. Publishing as Prentice Hall.
S2-9
45
Cost of Goods Sold Computation
Beginning inventory $ 4,200Purchases $42,000Import duties 1,100
-Freight in 3,600 46,700Cost of goods avail for sale 50,900
Ending inventory (5,400 )Cost of goods sold $45,500

Copyright © 2013 Pearson Education, Inc. Publishing as Prentice Hall. 46
Income Statement – Merchandiser
+ Sales- Cost of goods sold= Gross profit- Operating expenses= Operating income

Copyright © 2013 Pearson Education, Inc. Publishing as Prentice Hall. 47
Now turn to S2-10

Copyright © 2013 Pearson Education, Inc. Publishing as Prentice Hall. 48
S2-10
Gossamer Secrets
Schedule of Cost of Goods Sold
Beginning inventory $ 3,350,000
Purchases 23,975,000
Cost of goods available $ 27,325,000
Ending inventory (4,315,000)
Cost of goods sold $ 23,010,000

Copyright © 2013 Pearson Education, Inc. Publishing as Prentice Hall. 49
S2-10
Gossamer Secrets
Income Statement
Sales revenue $ 39,300,000
Cost of goods sold 23,010,000
Gross profit $ 16,290,000
Operating expenses 6,150,000
Operating income $ 10,140,000

Copyright © 2013 Pearson Education, Inc. Publishing as Prentice Hall. 50
Direct Materials Used Calculation –Manufacturer
+ Beginning raw materials inventory+ Purchases of raw materials+ Freight in= Materials available for use- Ending raw materials inventory= Direct materials used

Copyright © 2013 Pearson Education, Inc. Publishing as Prentice Hall. 51
Now turn to S2-11

Copyright © 2013 Pearson Education, Inc. Publishing as Prentice Hall. 52
S2-11Allterrain
Computation of Direct Materials Used
Direct materials used:Beginning raw materials inventory $ 3,900
Purchases of direct materials $15,600
Import duties 900
Freight-in 600 17,100
Direct materials available for use 21,000
Ending raw materials inventory (2,000 )
Direct materials used $19,000

Copyright © 2013 Pearson Education, Inc. Publishing as Prentice Hall. 53
Cost of Goods Manufactured Calculation – Manufacturer
+ Beginning work in process inventory+ Direct materials used+ Direct labor+ Manufacturing overhead= Total manufacturing costs to account for- Ending work in process inventory= Cost of goods manufactured

Copyright © 2013 Pearson Education, Inc. Publishing as Prentice Hall. 54
How to calculate
Beginning Inventory + Net Purchases =
Cost of Goods Sold + Ending Inventory

Copyright © 2013 Pearson Education, Inc. Publishing as Prentice Hall. 55
Cost of Goods Sold Calculation –Manufacturer
+ Beginning finished goods inventory+ Cost of goods manufactured= Cost of goods available for sale- Ending finished goods inventory= Cost of goods sold

Copyright © 2013 Pearson Education, Inc. Publishing as Prentice Hall. 56
Now turn to E2-25A
Copyright © 2013 Pearson Education, Inc. Publishing as Prentice Hall. 57
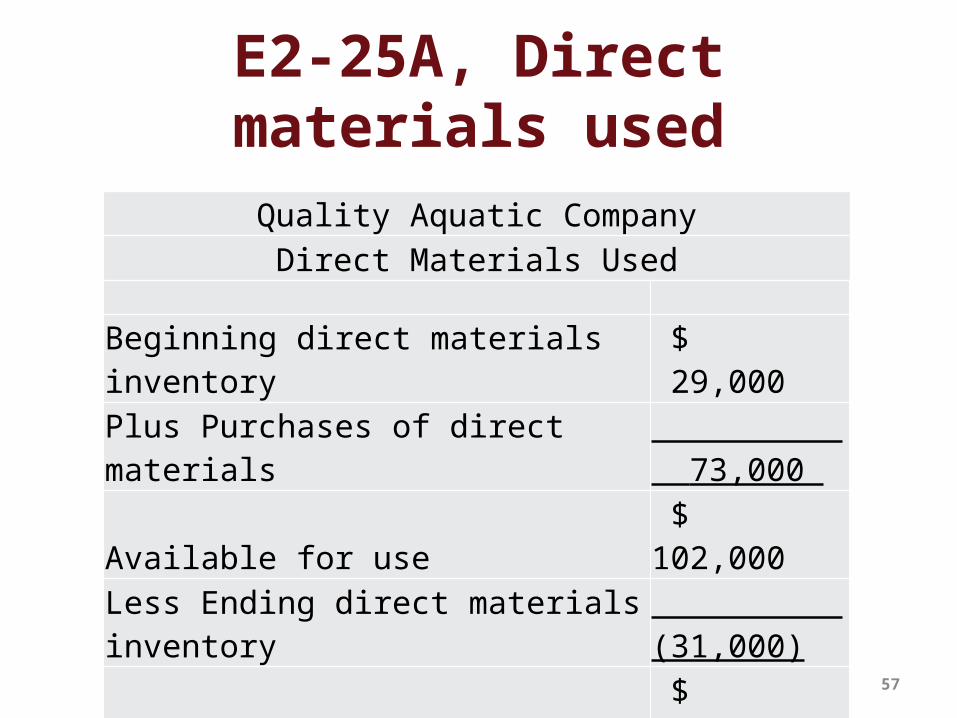
E2-25A, Direct materials used
Quality Aquatic CompanyDirect Materials Used
Beginning direct materials inventory $ 29,000 Plus Purchases of direct materials 73,000 Available for use $ 102,000 Less Ending direct materials inventory (31,000)Direct materials used $ 71,000

Copyright © 2013 Pearson Education, Inc. Publishing as Prentice Hall. 58
E2-25A, Cost of goods manufacturedQuality Aquatic Company
Schedule of Cost of Goods Manufactured
Beginning work in process inventory $ 36,000
Plus: Manufacturing costs incurred:
Direct materials used 71,000
Direct labor 89,000
Manufacturing overhead* 69,500
Cost of goods available $ 265,500
Ending inventory (30,000)
Cost of manufactured $ 235,500
*Manufacturing overhead:
Indirect labor $ 42,000
Insurance on plant 10,500
Deprec - Plant bldg and equip 13,000
Repairs and mtnce - plant 4,000
Manufacturing overhead (total) $ 69,500

Copyright © 2013 Pearson Education, Inc. Publishing as Prentice Hall. 59
E2-25A, Cost of goods sold
Quality Aquatic CompanySchedule of Cost of Goods Sold
Beginning finished goods inventory $ 22,000 Plus: Cost of goods manufactured 235,500 Available for sale $ 257,500 Less: Ending finished goods inventory (28,000)Cost of Goods Sold $ 229,500

Copyright © 2013 Pearson Education, Inc. Publishing as Prentice Hall. 60
Income Statement – Manufacturer
+ Sales- Cost of goods sold= Gross profit- Operating expenses= Operating income
Copyright © 2013 Pearson Education, Inc. Publishing as Prentice Hall. 61
Now turn to E2-26A

Copyright © 2013 Pearson Education, Inc. Publishing as Prentice Hall. 62
E2-26A
Quality Aquatic CompanyIncome Statement
Sales revenue $ 462,000 Cost of goods sold 229,500 Gross profit $ 232,500 Operating expenses: Marketing expenses 83,000 General and admin expenses 26,500 Operating income $ 123,000

Copyright © 2013 Pearson Education, Inc. Publishing as Prentice Hall. 63
Product and Period CostsType of
CompanyInventoriable Product Costs
Period Costs
Service Company NoneAll costs along the
value chain
MerchandiserPurchases plus cost of freight, import duties,
etc.
All costs except total purchases
Manufacturer DM, DL, MOHAll costs except DM,
DL, MOH
Accounting Treatment
Inventory on balance sheet until sold
Immediately expense

Copyright © 2013 Pearson Education, Inc. Publishing as Prentice Hall. 64
Manufacturing Companies’Inventory Accounts
Raw Materials Inventory
+ Beginning inventory+ Purchases & freight
= Ending inventory
- Materials used in work in process

Copyright © 2013 Pearson Education, Inc. Publishing as Prentice Hall. 65
Manufacturing Companies’Inventory Accounts
Work in Process Inventory
+ Beginning inventory
+ Matls used from raw matls
= Ending inventory
- Cost of goods manufactured and sent to finished goods
+ Direct Labor
+ Manufacturing overhead

Copyright © 2013 Pearson Education, Inc. Publishing as Prentice Hall. 66
Manufacturing Companies’Inventory Accounts
Finished Goods Inventory
+ Beginning inventory
+ Cost of goods manufactured
= Ending inventory
- Cost of goods sold
Copyright © 2013 Pearson Education, Inc. Publishing as Prentice Hall. 67
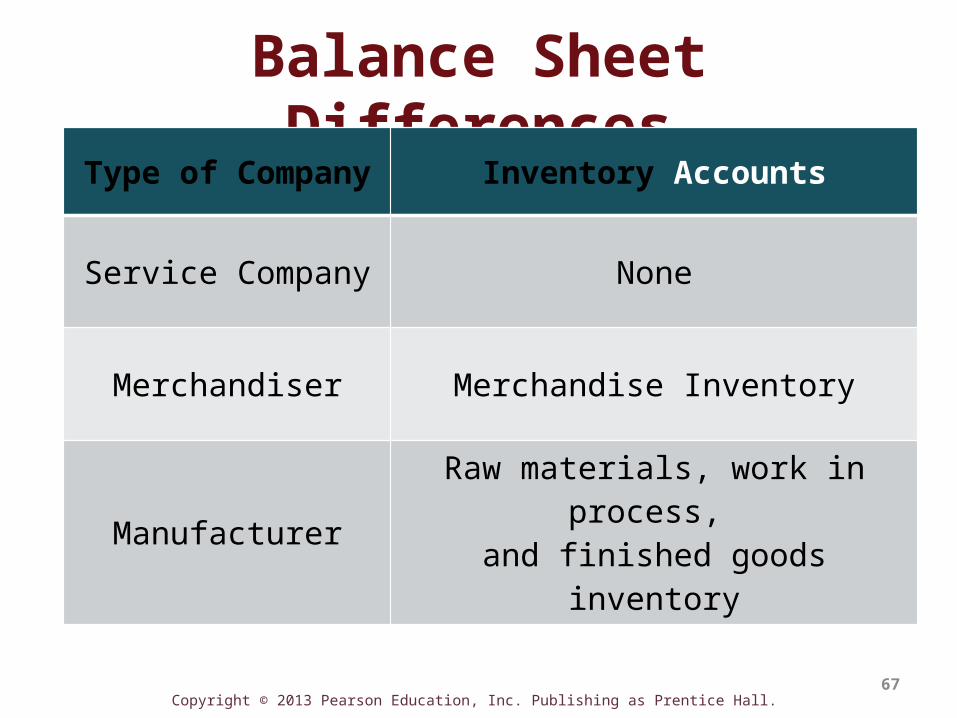
Balance Sheet DifferencesType of Company Inventory Accounts
Service Company None
Merchandiser Merchandise Inventory
Manufacturer Raw materials, work in process, and finished goods inventory

Copyright © 2013 Pearson Education, Inc. Publishing as Prentice Hall. 68
Objective 6Describe costs that are relevant and
irrelevant for decision making

Copyright © 2013 Pearson Education, Inc. Publishing as Prentice Hall. 69
Controllable and Uncontrollable Costs
Controllable Management can influence or change cost
Uncontrollable Management cannot change or influence cost in the short run

Copyright © 2013 Pearson Education, Inc. Publishing as Prentice Hall. 70
Relevant and Irrelevant Costs
Relevant Differential costs, which are costs that differ between alternatives
Irrelevant
Costs which do not differ between alternatives-or-Sunk costs – costs incurred in the past which cannot be changed

Copyright © 2013 Pearson Education, Inc. Publishing as Prentice Hall. 71
Objective 7Classify costs as fixed or variable and calculate total and average costs at
different volumes

Copyright © 2013 Pearson Education, Inc. Publishing as Prentice Hall. 72
Cost Behavior
Variable costs Change in total cost in direct proportion to changes in volume
Fixed costs Stay constant in total cost over a wide range of activity levels

Copyright © 2013 Pearson Education, Inc. Publishing as Prentice Hall. 73
Total Variable Costs
$0
$500
$1,000
$1,500
$2,000
$2,500
$0 $10,000 $20,000 $30,000 $40,000
Total Sales
To
tal
Sal
es
Co
mm
issi
on
s
Assume we pay 5% sales commissions on all sales.The cost of sales commissions increases proportionately with increases in sales.

Copyright © 2013 Pearson Education, Inc. Publishing as Prentice Hall. 74
Total Fixed Costs: Stay Constant in Total Over a Wide Range of Activity Levels
$0
$500
$1,000
$1,500
$2,000
$2,500
$0 $10,000 $20,000 $30,000 $40,000
Total Sales
To
tal S
ales
Sal
arie
s

Copyright © 2013 Pearson Education, Inc. Publishing as Prentice Hall. 75
Total Cost
• Total cost = Fixed costs + (Variable cost per unit x number of units)
Example:Fixed costs = $20,000Variable cost per unit = $50 per unitNumber of units = 100
Total Cost = $20,000 + ($50 x 100) = $25,000

Copyright © 2013 Pearson Education, Inc. Publishing as Prentice Hall. 76
Average Cost
• Total cost ÷ number of units = Average cost
• The average cost per unit is NOT appropriate for predicting total costs at different levels of output.
Example:$25,000 = $250 per unit
100 units

Copyright © 2013 Pearson Education, Inc. Publishing as Prentice Hall. 77
Marginal Cost
• Cost of making one more unit

Copyright © 2013 Pearson Education, Inc. Publishing as Prentice Hall. 78
End of Chapter 2