copyright © 2014 by the segal group, inc. all rights reserved. city of sierra vista, az. city...
TRANSCRIPT

Copyright © 2014 by The Segal Group, Inc. All rights reserved.
City of Sierra Vista, AZ.City Council Presentation
August 12, 2014
2014 COMPENSATION AND CLASSIFICATION STUDY
Presented by: Linda G. Wishard, Senior Consultant

2
Job AnalysisJob Analysis
Job EvaluationJob Evaluation
Custom Market Survey
Custom Market Survey
Salary Structure
Salary Structure
System Administration
System Administration
Goals & Objectives
Goals & Objectives
COMMUNICATIONCOMMUNICATION
Project Overview
3
Job Analysis and Classification Review (FLSA Report)
Job Evaluation
Custom Compensation Survey
Market Comparisons
Development of New Classification/Compensation Plan
Key Deliverables of the Study

4
A thorough review of all classifications completed
Job Description Questionnaires (JDQs) collected to provide accurate and up-to-date job documentation.
Job Evaluation to clarify job relationships and groupings (Internal Equity). Job Evaluation Manual (JEM) completed by supervisors for all positions.
Updated classification system and job titles that reflect current duties, job requirements, and scope of responsibilities.
FLSA Review completed and report provided.
Job Classifications

5
Job Evaluation
Job Evaluation System to establish internal equity completed
Evaluation of positions using factors that are typically paid-for, measurable qualities, and features or requirements common to all jobs.
Performance at an acceptable level is assumed.
Considered what the job requires most of the time under normal circumstances.
Factors consistently applied across departments.
Ratings based on JDQ, Job Evaluation Manual, and Subject Matter Experts.
Results in an internal hierarchy of jobs defining relative value.

6
Compensable Factors
Formal Education This factor measures the minimum formalized training or education that is required for entry into the position.
ExperienceBased on the minimum education required for the job, this factor measures the degree of experience required for entry into the position.
Interpersonal SkillsThis factor measures the job requirements of interaction with others outside direct reporting relationships.
Management/SupervisionThis factor measures the managerial requirements for achieving results through people.
Technical Skills This factor measures the job difficulty in terms of the application of the knowledge required by the job.
Working ConditionsThis factor measures the surroundings or physical conditions under which the work must be performed.
Freedom to ActThis factor measures the degree of freedom to exercise authority as well as assesses the impact of actions.
Fiscal ResponsibilityThis factor measures the accountability for the annual budget and financial management for a department or assigned area of responsibility.
7
Benchmark Organizations
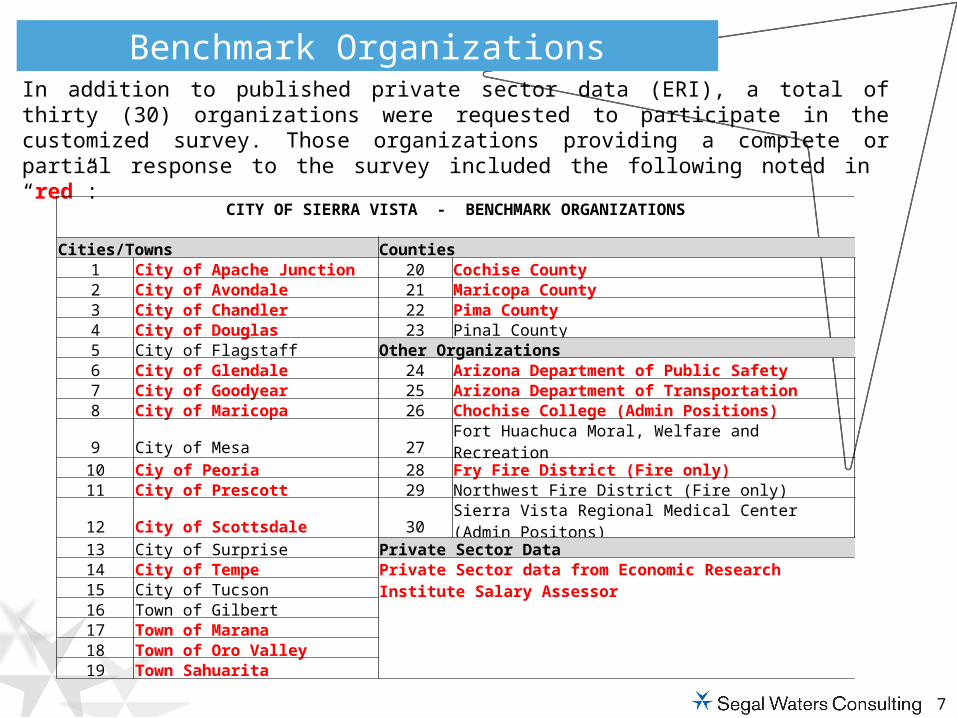
In addition to published private sector data (ERI), a total of thirty (30) organizations were requested to participate in the customized survey. Those organizations providing a complete or partial response to the survey included the following noted in “red”:
CITY OF SIERRA VISTA - BENCHMARK ORGANIZATIONS
Cities/Towns Counties1 City of Apache Junction 20 Cochise County2 City of Avondale 21 Maricopa County3 City of Chandler 22 Pima County4 City of Douglas 23 Pinal County5 City of Flagstaff Other Organizations6 City of Glendale 24 Arizona Department of Public Safety7 City of Goodyear 25 Arizona Department of Transportation8 City of Maricopa 26 Chochise College (Admin Positions)9 City of Mesa 27 Fort Huachuca Moral, Welfare and Recreation
10 Ciy of Peoria 28 Fry Fire District (Fire only)11 City of Prescott 29 Northwest Fire District (Fire only)12 City of Scottsdale 30 Sierra Vista Regional Medical Center (Admin Positons)13 City of Surprise Private Sector Data14 City of Tempe Private Sector data from Economic Research Institute Salary
Assessor15 City of Tucson16 Town of Gilbert 17 Town of Marana 18 Town of Oro Valley 19 Town Sahuarita

8
Base Pay & Structure Analysis Completed
Use of Geographic Differential to adjust for regional differences in cost of labor.
Aged data (3.5%) to October 1, 2014.
Use of weighted average salaries for data point of comparison for general jobs.

9
ERI
Indicator ERI
Indicator City of Sierra Vista 93.6 City of Sierra Vista 93.6
Benchmark OrganizationERI
IndicatorGeo Diff
% Benchmark OrganizationERI
IndicatorGeo Diff
%
Arizona Department of Public Safety 97.2 -3.60% City of Tempe 97.7 -4.10%Arizona Department of Transportation 97.2 -3.60% City of Tucson 93.2 0.40%City of Apache Junction 96.1 -2.50% Cochise College (Admin Positions) 93.6 0.00%City of Avondale 97.9 -4.30% Cochise County 93.2 0.40%City of Chandler 97.8 -4.20% Fort Huachuca Moral, Welfare and Recreation 93.6 0.00%City of Douglas 93.2 0.40% Fry Fire District (Fire only) 93.6 0.00%City of Flagstaff 92.2 1.40% Maricopa County 97.2 -3.60%City of Glendale 97.8 -4.20% Northwest Fire District (Fire only) 93.2 0.40%City of Goodyear 97.3 -3.70% Pima County 93.2 0.40%City of Maricopa 96.7 -3.10% Pinal County 96.2 -2.60%
City of Mesa 97.4 -3.80%Sierra Vista Regional Medical Center (Admin Positons) 93.6 0.00%
City of Peoria 97.7 -4.10% Town of Gilbert 97.3 -3.70%City of Prescott 91.6 2.00% Town of Marana 92.7 0.90%City of Scottsdale 97.4 -3.80% Town of Oro Valley 92.7 0.90%City of Surprise 97.2 -3.60% Town of Sahuarita 92.7 0.90%
Geographic Differentials for Benchmark Organizations (Source: ERI)

10
Market Competitiveness*
Base Salary Grade Midpoint
General Positions:
Nonexempt- 8.7%*-2.1%*
Exempt - 4.3%*-2.9%*
Senior Management -13.6%* -15.5%*
*Competitiveness varies by position

11
Market Competitiveness*
Base Grade Grade
SalaryMinimum Maximum
Public Safety Positions:
Fire- 18.8%* -16.5%*-10.8%*
Police -19.3%* -18.7%-10.2%*
*Competitiveness varies by position
12
Salary Structure Design
Use geographically adjusted, weighted average salaries as midpoint target for structures.
Use job evaluation for placement of positions in structures.
Using market data, develop structures competitive with market at 100% of benchmark average salaries.
Update range spreads (from entry to maximum rate of pay) to reflect market trends (Non-Exempt – 45%; Exempt – 50%; Senior Management – 50%).

13
PROPOSED NON-EXEMPT PAY STRUCTURE
NON-EXEMPT STRUCTURE
Grade
Pay Range
Minimum Midpoint Maximum
200 $26,638 $32,631 $38,625
201 $27,970 $34,263 $40,556
202 $29,368 $35,976 $42,584
203 $30,837 $37,775 $44,713
204 $32,379 $39,664 $46,949
205 $33,997 $41,647 $49,296
206 $35,697 $43,729 $51,761
207 $37,482 $45,916 $54,349
208 $39,356 $48,212 $57,067
209 $41,324 $50,622 $59,920
210 $43,390 $53,153 $62,916
211 $45,560 $55,811 $66,062
212 $47,838 $58,601 $69,365

14
PROPOSED EXEMPT PAY STRUCTURE
EXEMPT STRUCTURE
Grade
Pay Range
Minimum Midpoint Maximum
104 $39,248 $49,060 $58,872
105 $41,995 $52,494 $62,993
106 $44,935 $56,168 $67,402
107 $48,080 $60,100 $72,120
108 $51,446 $64,307 $77,169
109 $55,047 $68,809 $82,570
110 $59,451 $74,313 $89,176
111 $64,207 $80,258 $96,310
112 $69,343 $86,679 $104,015
113 $75,584 $94,480 $113,376
114 $82,387 $102,983 $123,580

15
PROPOSED SENIOR MANAGEMENT PAY STRUCTURE
SENIOR MANAGEMENT
Grade
Pay Range
Minimum Midpoint Maximum
I $97,234 $121,543 $145,851
II $111,819 $139,774 $167,729

16
PROPOSED PUBLIC SAFETY (Exempt)PAY STRUCTURE
FIRE EXEMPT
Grade
Pay Range
Minimum Midpoint Maximum
F5 $77,511 $92,350 $107,188
F6 $90,932 $110,103 $129,273
POLICE EXEMPT
Grade
Pay Range
Minimum Midpoint Maximum
P4 $79,639 $92,838 $106,038
P5 $88,487 $106,940 $125,393
P6 $103,664 $124,035 $144,406

17
PROPOSED PUBLIC SAFETY (Non-Exempt) STEP PAY STRUCTURE
FIRE NONEXEMPT STRUCTURE POLICE NONEXEMPT STEP STRUCTURE
Grade F1 F2 F3 F4 Grade P1 P2 P3
Rank FirefighterFire
InspectorFire
Engineer Captain Rank Officer Corporal Sergeant
2% Steps 2% Steps
1 $40,192 $46,308 $51,246 $59,210 1 $47,075 $51,782 $66,489
2 $40,996 $47,235 $52,271 $60,394 2 $48,016 $52,818 $67,819
3 $41,816 $48,179 $53,316 $61,602 3 $48,977 $53,874 $69,175
4 $42,652 $49,143 $54,383 $62,834 4 $49,956 $54,952 $70,558
5 $43,506 $50,126 $55,470 $64,091 5 $50,955 $56,051 $71,970
6 $44,376 $51,128 $56,580 $65,372 6 $51,974 $57,172 $73,409
7 $45,263 $52,151 $57,711 $66,680 7 $53,014 $58,315 $74,877
8 $46,168 $53,194 $58,866 $68,013 8 $54,074 $59,482 $76,375
9 $47,092 $54,258 $60,043 $69,374 9 $55,156 $60,671 $77,902
10 $48,034 $55,343 $61,244 $70,761 10 $56,259 $61,885 $79,460
11 $48,994 $56,450 $62,469 $72,176 11 $57,384 $63,122 $81,049
12 $49,974 $57,579 $63,718 $73,620 12 $58,532 $64,385 $82,670
13 $50,974 $58,730 $64,992 $75,092 13 $59,702 $65,672 $84,324
14 $51,993 $59,905 $66,292 $76,594 14 $60,896 $66,986 $86,010
15 $53,033 $61,103 $67,618 $78,126 15 $62,114 $68,326
16 $54,094 $62,325 $68,970 $79,689 16 $63,356 $69,692
17 $55,176 $63,571 17 $64,624 $71,086
18 $56,279 $64,843 18 $65,916 $72,508
19 $57,405 $66,140
20 $58,553
21 $59,724

18
Segal Waters - Recommendations
Adopt proposed Classifications, based on job analysis and job evaluation results (internal equity – hierarchy of jobs).
Adopt the proposed pay structures (Exempt, Non-Exempt, Senior Management) at 100% market average based on 50/50 weighting of Custom Survey and Published data.
Adopt the proposed step pay structure for Non-Exempt Public Safety.
Adopt proposed pay administrative guidelines.

19
Segal Waters’ Recommendations (Continued)
Adopt adjustment to incumbent pay to minimum of proposed ranges:
o Estimated cost: $118,634.41o Affects 40 employees
Adopt adjustment to closest step for Non-Exempt Public Safety:o Estimated cost: $85,694.56o Affects 104 employees
Adopt adjustment of 2.0% of the new range minimum for each full year of service (TIP - time in position):
o Estimated cost: $308,174.79o Affects 115 employees
Total Estimated Cost: $512,453.76**Does not include associated benefits costs.

20
Segal Waters’ Recommendations (Continued)
Two-Year Implementation Plan – Optional
Year 1 - Adopt adjustments to move employees to the Minimum of Range or Closest Step
o Estimated cost: $204,328.97o Affects 144 employees
Year 2 - Adopt adjustment of 2.0% of the new range minimum for each full year of service (TIP - time in position):
o Estimated cost: $308,174.79o Affects 115 employees
*does not included associated benefits costs

21
QUESTIONS?