copyright by billy don walker 1977
TRANSCRIPT
Copyright by BILLY DON WALKER 1977

^^J
A COMPARISON OF SIX ALTERNATIVE MODELS FOR
EQUALIZATION OF EDUCATIONAL EXPENDITURES
IN THE TEXAS PUBLIC SCHOOLS
by
BILLY DON WALKER, B.S. IN Ed., M.A.
A DISSERTATION
IN
EDUCATION
Submitted to the Graduate Faculty of Texas Tech University in Partial Fulfillment of the Requirements for
the Degree of
DOCTOR OF EDUCATION
Approved
May, 1977

CONTENTS
LIST OF TABLES iv
I. INTRODUCTION 1
Purpose and Scope 1
The Problem 2
Theoretical Framework 11
Summary 21
II. BACKGROUND OF THE STUDY 23
History of Public School Finance in
Texas, 1876-1976 23
Review of Literature 54
Review of Related Research 82
Summary 87
III. METHODS AND PROCEDURES 89
Design of the Study 89
The Models 91
The Population 99
The Sample 100
Data Collection and Tabulation . . . . 104
Statistical Treatment and Method of
Analysis 104
Summary 105
IV. ANALYSIS OF THE MODELS 106
Dummy Model 106 11
Model One 109
Model Two 110
Model Three 118
Model Four 123
Model Five 12 8
Model Six 132
Comparison of the Models 138
Summary 146
V. SUMMARY, CONCLUSIONS, AND RECOMMENDATIONS 147
Summary 147
Conclusions 152
Recommendations 160
LIST OF REFERENCES 16 8
APPENDIX 175
A. MODEL THREE APPLIED TO EDUCATION SERVICE CENTER REGIONS
B. MODEL SIX APPLIED TO EDUCATION SERVICE CENTER REGIONS
111

LIST OF TABLES
Table Page
1. State, Local, and Total Revenues Generated from the Research Models 9 3
2. Guaranteed Revenue for Given Tax Rates, Number of Districts Selecting, and Revenue Per ADA Per Mill of Effort, Model Six . . 98
3. Characteristics of the Sample . 102
4. Dummy Model—Complete Local Support Based on a Tax Rate of 17.6 Mills 107
5. Model One—Flat Grant of $536.18 per ADA, Ten Mills of Local Leeway Ill
6. Model Two—Foundation Program Allocation of $746.70, Three-Mill Chargeback, Seven Mills Local Leeway 115
7. Model Three--Foundation Program Allocation of $1,097.49, Eight Mill Chargeback, Two Mills Local Leeway 120
8. Model Four—Percentage Equalization Formula, Foundation Support Level of $1,097.49 per ADA, Ten Mills Local Leeway 125
9. Model Five—Flat Grant of $957.21 per ADA, Six-Mill Levy to the State, Four Mills Local Leeway 129
10. Model Six--Power Equalization with Variable State-Guaranteed Revenue per ADA, Kinks Above Ten-Mill Effort 133
11. Descriptive Statistics Accruing from the Six Research Models 138
12. Total Revenue per ADA, By District and Model 142
IV

CHAPTER I
INTRODUCTION
Public school finance in the decade of the 1970s is
in the throes of an egalitarian revolution. The prospects
for change are imminent, if not established fact, in most
states. In a number of instances the courts have ruled
that existing state systems of educational finance are dis
criminatory, irrational, or both. State legislatures are
confronted with a fundamental dilemma; that is, they are
coerced by judicial intervention or political mandate to
work fundamental changes in public school finance systems
when available solutions are meager, untested, or politi
cally unfeasible.
Purpose and Scope
The purpose of this dissertation is to investigate
viable alternative approaches to the development of a
financing plan which would tend to equalize available reve
nue per pupil in the school districts of the state of
Texas as they were organized during the 1975-1976 school
year. Six alternative models are studied as they apply
specifically to the scholastic populations and tax
resources of Texas school districts. Ultimately, recom
mendations are made relative to the most tenable model or

models from statistical comparison and related literature
and research. Although confined to the theoretical realm
in its scope, the explorations could have practical impli
cations, given the current state of flux in Texas public
school finance.
The Problem
Education in the United States in the current decade
is in a substantial measure of economic and fiscal dis
tress. Three basic crises exist, one of which provides
the basis for and major emphasis of this dissertation.
^First, costs in education have been increasing more
rapidly than revenue and, in many cases, too swiftly for
the ability of taxpayers to keep apace. Burrup (19 74) has
observed that "a nationwide taxpayer revolt . . . is no
longer more imaginary than real."
Second, while educational costs have risen precipi
tately and the scope of educational services has dilated at
an unprecedented rate, the public has not ceased to demand
higher quality in both educational processes and products.
Such a state of affairs has serious implications for the
future of education in at least two ways: (1) the very
existence of some educational institutions is threatened,
and (2) the schools are prompted to seek out and to utilize
more efficient methods of operation (Benson, 1975a).

Third, a crisis exists, both in the nation as a
whole and in Texas in particular, which involves the con
cept of equal educational opportunity as measured by
equity in terms of both the allocation and revenue dimen
sions of public school finance. Inequities are apparent
in both expenditures for education and in the tax efforts
required to underwrite the expenditures. While it is evi
dent that inequities in ability to pay, effort exerted,
and actual spending exist among the various states, the
primary focus of efforts at remediation has been on intra
state equity in school finance since education is essen
tially a governmental function of the various states. / Burrup (1974) has summarized the basic reasons for
inequality in educational opportunity; i.e., inequity in
public school finance, as: (1) inadequate school district
organization, creating wide disparities in taxable wealth
among districts; (2) small districts, which are inefficient
in terms of per-pupil costs; (3) differences in ability and
effort among districts, somewhat as a result of inadequate
district structure; and (4) unsound legal and financial
provisions, including methods of allocating state funds for
education in the districts of a state.
It is primarily upon the last cause, with concomitant
reference to differences in local abilities, that interest
has coalesced in recent years although all the reasons have

drawn some measure of attention. All the causes listed by
Burrup are applicable in Texas, where more than a thousand
school districts exist with wealth disparities which would
stun even the most ardent imagination. However, Texas is
not unique, and Jordan and Hanes (1976) have noted that
since 1971 no less than sixteen states, Texas not included,
have enacted new school financing measures in the pursuit
of greater equalization of educational opportunities.
Emphasis upon the legal and financial provisions of
the states has no doubt been enhanced in recent years by
judicial intervention into the financing of education.
Wise (196 8) has explained equal educational opportunity as
a natural extension of litigation favoring school integra
tion, legislative reapportionment, and protection of the
civil rights of the poor. Various state and federal courts
have amplified that theme in a number of landmark decisions
related to public school finance. Some representative
examples serve to elucidate the dilemma created in educa
tional finance.
\ In August, 19 71, in the case of Serrano v. Priest,
the California Supreme Court ruled the California school
finance system unconstitutional on the grounds that it
violated the "equal protection of the law" guaranteed by
both the federal and state constitutions. The decision
was based primarily upon the fact that the school districts
of the state were vastly unequal in local property wealth,
the basic source of educational revenue. Thus was created
in "poor" districts a financial support limitation which
substantially disequalized educational opportunity. The
court held that a child's education should not be depen
dent upon the wealth of the school district in which he
resided, but rather upon the wealth of the state as a
whole. Although the decision had immediate ramifications
for only the state of California, the potential effects
were great, for the facts in the case were duplicated in
almost every state in the nation (Burrup, 1974). Within
five months three similar cases captured the attention of
educators and students of public school finance.
In October, 1971, in Van Dusartz v. Hatfield, a
federal district court in Minnesota declared that state's
school finance system unconstitutional, once again relying
upon the Fourteenth Amendment as a rationale. In January,
1972, in Robinson v. Cahill, a New Jersey Superior Court
struck down that state's school finance system because it
violated the state constitution's "thorough and efficient"
clause relating to education. In an important modification,
that court stated that educational expenditures need not be
absolutely equal but should vary according to differing
pupil needs.
In the interim, in December, 1971, in the case of
Rodriguez v. San Antonio Independent School District, a
federal district court in Texas declared the Texas school
finance system in violation of the "equal protection"
clause of the Fourteenth Amendment in view of the wide
disparities in local property tax wealth; that is, in view
of the existence of "tax high, spend low" districts in the
same state-created system as "tax low, spend high" dis
tricts. The case is discussed at greater length in
Chapter II, but the court's thinking might appropriately
be summarized at this juncture.
As in the Serrano case, the distribution of wealth
in a district structure created by the state was found to
discriminate against students living in "poor" districts.
Upon appeal, the United States Supreme Court in 19 73 over
turned the Rodriguez decision on the principal ground that
education was not a fundamental interest protected by the
Fourteenth Amendment. The Court's decision was foreshad
owed by two earlier cases, Mclnnis v. Shapiro (1968) and
Burruss v. Wilkerson (1970), in which the Court had
affirmed without discussion the lower courts' decisions
that the finance structures of Illinois and Virginia were
not unconstitutional. Nevertheless, even the majority
opinion in the 5-4 decision indicated dismay with the
inequitable Texas system and suggested that state
legislators in Texas and throughout the nation give full
attention to the problem.
By the time of the Supreme Court's Rodriguez deci
sion, there were about thirty Serrano-Rodriguez-type
cases pending in state and federal courts throughout the
country (Education Commission of the States, 19 74). The
Rodriguez reversal stemmed the tide in regard to judicial
review in the federal courts, but recourse was still pos
sible through the state court systems. However, the
Rodriguez decision established a temper which resulted in
several setbacks for the idea of equality through
expenditures. '
In 1973, the Michigan Supreme Court vacated an
earlier (1972) decision in Milliken v. Green, a case which
had voided that state's financing provisions as discrimi
natory. Swift on the heels of this decision came three
other state-level cases in which the constitutionality of
finance structures was upheld: Shofstall v. Hollins
(Arizona, 1973), Northshore School District No. 417 v.
Kinnear (Washington, 1974), and Thompson v. Engleking
(Idaho, 1975). On the other hand, the Robinson v. Cahill
decision was upheld in the New Jersey Supreme Court in
1973, and the Connecticut school finance system was struck
down in 19 74 in Horton v. Meskill. The upshot of the post-
1973 state court decisions is that decisions in the states

8
in reference to constitutionality are of little value as
precedents in other states since the circumstances may
vary.
Two principal outcomes emerged from the educational
equity cases of the early 19 70s. Firsjt, in regard to
Texas, public attention was focused upon the problems of
equity to such a degree that the body politic continued ^
to demand school finance reform even after the Rodriguez
reversal (Yudof and Morgan, 1974). Second, in those
cases which emphasized the discriminatory nature of cer
tain school finance systems, some basic principles of
equity in educational opportunity were established for
future reference. These principles are discussed in
Chapter II.
The dilemma faced by the various state legislatures,
including the Texas Legislature, is framed by deliberation
over two basic tasks, the first of which is the subject of
this dissertation. First, legislators must address the
problem of interdistrict disparities in wealth, school
revenue, and expenditures per pupil. Second, legislators
must address the problem of property tax equity since it
is foreseen that the property tax, at either the state or
local level, will remain a major source of income for
education (Benson, 1975a). State legislatures have little
to guide them save a few significant studies done in recent

years by selected groups; e.g., the President's Commission
on School Finance (1972), the Fleischmann Commission on
School Finance (1973), and the National Education Finance
Project (1969-1973).
Statement of the Problem
In a study conducted by the National Education
Finance Project in 1972, the fifty states were ranked
according to equalization scores based on the N.E.F.P.
typology and scoring method. Texas ranked twenty-eighth
among the states in terms of equalization of public school
expenditures (Johns and Morphet, 1972). In the inter
vening years at least seven of the states ranked below
Texas have taken measures to approach equalization. It is
true that Texas, through the enactment of H.B. 1126 in
1975 (see Chapter II for details), has taken halting move
ments toward equalization, but Texas remains in an unen
viable position in respect to the other states as far as
school finance equity is concerned.
The specific problem addressed by the dissertation is
the comparison of available revenue per student in Texas
school districts from six alternative models of state edu
cational finance. The six models, which are discussed in
more detail below and in Chapter III, are as follows:
Model One: Flat Grant Model, entailing a flat grant of n dollars per ADA (pupils in average

10
daily attendance) and a local tax rate allowable to a maximum of ten mills on the equalized property valuation of each district.
Model Two: Strayer-Haig-Mort Equalization Model, entailing a minimum foundation program allocation of n dollars per ADA, less a three-mill required levy (chargeback), plus seven mills of local leeway as applied to the equalized property valuation of each district.
Model Three; Strayer-Haig-Mort Equalization Model, entailing a minimum foundation program allocation of n dollars per ADA, less an eight-mill required levy (chargeback), plus two mills of local leeway as applied to the equalized property valuation of each district.
Model Four: Percentage Equalization Model, entailing a formula for state aid grants commensurate with each district's equalized property valuation per ADA as a percentage of the statewide average equalized property valuation per ADA.
Model Five: Flat Grant Model, entailing a flat grant of n_ dollars per ADA; a six-mill required local levy, with revenue going to the state for redistribution; and four mills of local leeway as applied to the equalized property valuation in each district.
Model Six: Power Equalization Model, with identical local tax efforts generating identical revenue of n dollars per ADA (tax efforts randomly distributed).
Significance of the Problem
Benson (1975a) has identified three principal issues
in educational finance which will likely have a significant
impact upon the future of public school financing policies :
(1) the improvement of family choice in the selection of
educational services, (2) whether and how the technological
efficiency of schools can be enhanced, and (3) how we
11
distribute educational services to different client groups
and how we raise money to pay for these services. The
dissertation addresses, in part, the last issue. Moreover,
to reiterate the opening statement of this chapter, public
school finance is in a difficult period of transition;
therefore, a study of some of the modes proposed to ease
the transition is both timely and important.
Theoretical Framework
Definitions
Flat Grant Model
Models One and Five in the dissertation are illus
trations of flat grant models. Under a school finance
model of this type, allocations of funds are "flat
amounts" transferred to local districts without considera
tion of local taxpaying ability. In Texas a portion of the
revenue of all public schools is distributed in this
manner; e.g., per capita apportionments from the Available
School Fund. Each district receives a flat amount per
pupil in average daily attendance.
Stayer-Haig-Mort Equalization Model
Models Two and Three in the dissertation are illus
trations of Stayer-Haig-Mort equalization models. Under
this type of model allocations are made to local school

12
districts in inverse proportion to local taxpaying ability.
Stated simply, in theory, more state funds flow to "poor"
districts than to "wealthy" districts. The most commonly
used model for apportioning state funds is the Strayer-
Haig model (Strayer and Haig, 1923), especially as ampli
fied by Mort (1924). In the Strayer-Haig-Mort equalization
scheme the cost of the foundation program which the state
legislature chooses to support is computed; from that cost
is deducted the amount of funds the local district can
raise through a required minimum tax effort. The differ
ence becomes the state allocation to the district. Although
the model appears simple at first inspection, there are
myriad variations which have a profound impact on the
finances of local districts (Johns and Morphet, 1972).
Texas has operated a variation of the Strayer-Haig-Mort
equalization model since 1949.
Percentage Equalization Formula
Model Four in the dissertation is an example of a
percentage equalization model. Under this formula scheme
the state's share of a foundation program is computed by
multiplying the cost of the foundation program of any
single district by 100 percent minus a predetermined per
centage figure, which, in turn, is multiplied by the quo
tient of the equalized property value per ADA (see below

13
for definition) in the district divided by the state
average equalized property valuation per ADA. This pro
cess may be stated in formula motif as:
State Revenue = A x 1 - (D/S x E)
where:
A = Cost of the foundation program
D = Equalized value of property per ADA in the district
S = State average equalized property value per ADA
E = Predetermined constant factor (percentage of state support desired)
Power Equalization Model
Model Six of the dissertation is a power equaliza
tion model. Also known as DPE (District Power Equaliza
tion) , this model guarantees a specific number of dollars
in revenue per ADA for a specific tax rate selected
locally within the parameters of applicable laws. Each
district selecting tax rate N would be guaranteed n dollars
regardless of district wealth; each district selecting tax
rate R would receive r_ dollars per ADA; and so on. In
practice, the model usually has "kinks" built in; that is,
points at which the amount of revenue derived from a cer
tain tax rate declines in utility in comparison to the tax
effort required.
14
Chargeback
A "chargeback" is any given amount of funds which
are "charged back" against a school district's allocation
of state funds; that is, a chargeback constitutes funds
not received from the state. It is the local portion, to
be provided from local funds, of a foundation program (see
Models Two and Three). In Texas, the chargeback feature
of the Foundation School Program is termed the "local fund
assignment." Chargebacks are generally calculated from
minimum legal tax rates; e.g., if the state guarantees a
district $1,000 per pupil and the application of the
minimum legal tax rate in the district yields $400 per
pupil, the $400 figure becomes a chargeback and the dis
trict receives $600 per pupil from the state. The greater
the wealth of the distict, the higher the chargeback, and
the less the amount of state aid.
Local Leeway
Local leeway may be defined as optional tax leeway
allowed a school district between minumum and maximum legal
tax rates.
Mill
A mill is defined as one-tenth of one cent. Tax
rates are generally expressed in terms of "mills per
dollar" or in terms of "dollars, cents, or dollars and

15
cents per $100." A tax rate of ten mills is equal to one
cent per dollar, or $1.00 per $100.
Recapture
Recapture is a term used to define the process of
state collection of certain local tax monies. When a
district's "chargeback" exceeds the amount of funds guar
anteed by the state, the state "recaptures" the excess
funds. In effect, the local district, in such case,
would receive no state aid.
Save-Harmless Provision
A "save-harmless provision" may be defined as a
legal provision which allays the impact of certain school
finance program features upon a district. As a general
rule, such provisions protect affluent districts from
precipitate decreases in state aid during periods of
equalization reform.
Property Tax Circuit-Breaker
The term "circuit-breaker," as applied to property
taxation, represents a specified level at which the impact
of the property tax is "broken" in order to reduce tax
burdens on low-income property holders. Since theories of
taxation hold that property taxes obtain a higher percen
tage of discretionary income of low-income property holders

16
than of high-income property holders, circuit-breakers are
utilized to rectify this point and make the property tax
more progressive. Low-income property holders may be
exempted from property taxes or may be rebated a given
portion of property taxes paid.
Weighted Pupil
The "weighted pupil" method of allocating funds to
school districts grows from a recognition that certain
types of education (i.e., certain types of pupils) are
more costly than others. Therefore, pupils are "weighted"
in some fashion to reflect cost differentials; e.g., for
compensatory education, vocational education, special edu
cation, etc.
ADA
ADA is defined as the abbreviation for "average
daily attendance," usually as applied to "pupils in aver
age daily attendance."
Assumptions
The preeminent assumption of the study is that local
property taxation will be retained as a method of financing
public school operations in Texas. Although it is certain
that a possibility exists for abolition of local property
taxation as a revenue source, and although the petroleum,
sales, and income tax sources in Texas are viable

17
alternatives in respect to revenue possibilities, the
assumption is relatively safe. First, the local property
tax has been too productive of revenue to be abandoned in
the near future (Benson, 1975a). Second, Governor Dolph
Briscoe has on numerous occasions voiced his opposition to
new state taxes; e.g., a state income tax, increased sales
taxes, increased gasoline taxes, etc. However, it is not
realistic to assume that local property taxation as it
presently exists in Texas will continue unabated. Reforms
are already afoot to improve administration of the tax and
to make it more equitable. Such reforms can only serve to
further the effects of equity in regard to educational
expenditures.
A second major assumption of the study is the pre
sumption of 100 percent collection of taxes by local edu
cation agencies. In reality such an assumption would be
unfeasible, not to say Utopian. However, for purposes of
simplicity in the study, 100 percent collection of local
taxes is assumed. In the case of actual implementation of
one of the models investigated, the state might assume a
certain percentage of collections (perhaps 95 percent) and
make allocations accordingly, allowing local education
agencies to add those collections over the given percentage
to their local budgets. Thus would incentives be given for
avid local collection; such incentives would be especially

18
crucial in cases where the state "recaptures" local taxes.
Under current Texas law no allowance is made for uncol
lected or uncollectable taxes in computing the district's
share of the Foundation School Program.
A third major assumption is that future state
efforts at school finance equity will center upon "oper
ating costs"; that is, upon costs inherent in maintaining
and operating the schools. No effort has been made in the
past, nor have any plans been forthcoming, to equalize
expenditures for capital outlay and debt service in Texas.
This is not to say that equalization of capital outlay and
debt service expenditures would not be desirable, but is
merely a reflection upon the urgency of the equalization
of operating expenditures, which comprised 81.7 percent of
public school spending in Texas during the 1975-76 school
year (Texas Research League, 19 76). Therefore, the models
presented in the study are directed at equalizing mainten
ance and operation costs.
A fourth assumption, somewhat more marginal than the
previous three, is that utilization of unweighted pupil
data will not have an adverse effect upon the conclusions
reached by the study. It is likely that the state will at
some future time utilize a weighted pupil or adjusted
instructional unit approach in determining allocations to
local districts. The state already employs an adjusted

19
instructional unit approach in the calculation of local
district personnel entitlements under the Foundation
School Program.
Unweighted pupil data are used in the study for
several reasons. First, weighted pupil data for the school
districts of Texas are unavailable. Second, the assumption
is followed that the most equitable model utilizing
unweighted data will only be enhanced by the use of
weighted pupil data (Johns and others, 19 72), but only sub
sequent research can validate such an assumption insofar as
cost differentials in Texas are concerned. Third, refer
ence to unweighted pupil data serves as an appropriate base
point for comparison of the relative efficacy of the models
tested.
A fifth assumption is that categorical state grants
to districts will be added to, rather than be a part of,
the districts' basic allocations. In addition to its
basic state aid for maintenance and operation, local dis
tricts would receive aid in accordance with demonstrated
needs in areas such as transportation, food service,
technical-vocational education (if not part of a weighted
pupil methodology), community education, compensatory edu
cation (if not part of a weighted pupil methodology), and
others.

20
Delimitations
Two delimitations are established at the outset.
First, the scope of the study is confined to Texas and to
Texas school districts. This delimitation precludes trans
position of the findings of the study to other states, for
each state has separate sets of circumstances such as
number of districts, local tax resources available, range
of affluence, and others. However, it may be pointed out
that the progenitor of this study, the research conducted
by the National Education Finance Project, did not utilize
a real state at all but a prototype state created for
research purposes.
Second, only six models are studied from among the
myriads extant. For various reasons no attempts are made
to investigate the potential effects of proposed school
finance reforms such as full state funding, family power
equalization, contracts, vouchers, decentralization, cen
tralization, district consolidation, and many others. In
most cases, sufficient data are not available for Texas or
the proposed model is not subject to empirical study. Full
state funding is considered a viable model (Benson, 1975b).
However, since the net result of application of such a
model would be absolute equity in the amount of basic state
aid to local education agencies, the model can be ignored
for three reasons: (1) the results are apparent, (2) such

21
a model does not appear to be politically feasible in
Texas in the near future, and (3) it is perhaps good prac
tice to allow for some local tax leeway (Johns and
Morphet, 19 72).
Summary
Public school finance in the current decade is in
the midst of an egalitarian revolution in which judicial,
social, and political pressures have been brought to bear
on state legislatures (including the Texas Legislature) to
fashion more equitable school finance systems in terms of
educational expenditures per pupil. The purpose of the
dissertation is to investigate the effects of six alterna
tive models of public school financial support on educa
tional finance in Texas. The desirability of a more
equitable system in Texas has been emphasized by generic
inequity in public school finance throughout the nation,
the Rodriguez case, aroused public sensibilities, and the
fact that (by some measures) Texas has one of the least
equitable school finance systems among the fifty states.
The models to be investigated include two types of
flat grant models, two types of foundation program equali
zation models (in the Strayer-Haig image), one percentage
equalization model, and one power equalization model. Five
of the models were chosen for their effectiveness or

22
representativeness from among eighteen models studied by
the National Education Finance Project in 19 72. One
model, power equalization, was chosen for its currency
among proposals for school finance reform (Coons, Clune,
and Sugarman, 19 70; Guthrie, 19 75). Five assumptions and
two delimitations are enumerated at the outset.

CHAPTER II
BACKGROUND OF THE STUDY
The background of the research incorporated in the
dissertation lends itself to division into three phases:
(1) the history of public school finance in Texas, 1876-
1976; (2) a review of related literature on equalization
of public school finance and educational opportunities;
and (3) a review of research related to the models utilized
in the study.
History of Public School Finance in Texas, 1876-1976
The concept of public support for education came
early to Texas. By 1876 Texas had a heritage of educa
tional support which included at least three significant
actions. First, the Education Act of 1839, passed during
the presidency of Mirabeau B. Lamar, had initially laid
the foundation for governmental educational support in
Texas and had served as a model for the Morrill Act of
1862 (Connor, 1971). The act had set aside land grants for
each county in the young nation for the support of public
academies. In addition, fifty leagues of land were set
aside for two future universities. However, land was so
abundant that little income was realized. By 1855 only
23
24
forty-one of the ninety-nine counties had even had their
land surveyed. State intent had been good, but it was
apparent that land grants alone could not give proper
emphasis to education (Eby, 1925).
Second, the Texas Constitution of 1845, adopted when
Texas was admitted as a state to the United States, con
tained a strong charge relative to education. The legis
lature was "to establish free schools throughout the State,
and . . . furnished means for their support, by taxation on
property" (Article X, Section 2, 1845). A minimum of one-
tenth of the general revenue was to go to the schools.
These funds were appropriated but were never disbursed.
The number of Texas citizens who actually supported public
schools financed by the state were few, for "free" schools
(those for orphans, paupers, etc.) were viewed as differ
ent from "public" schools by most people (Lane, 1903).
Third, the School Law of 1854 had been passed during
the administration of Governor Elisha M. Pease. This act
set aside $2,000,000 of the state funds realized from the
Compromise of 1850 to establish a permanent endowment fund
for education. To this endowment was later added one-half
the pioblic domain (in 1876) and, still later, all remaining
public lands (in 1899).
In September, 1875, a Constitutional Convention met
in Austin which mirrored statewide sentiment for retrench
ment, economy, and disestablishment of the centralized

25
state government established in 1869 during Radical Recon
struction in Texas (Connor, 1971). There was heated
debate over the education article to be included in the
new state constitution. Despite the fact that educational
measures had been among the strong points of Governor E. J.
Davis' Republican regime, many advances were negated by
the sentiment against centralized authority (Eby, 1925).
Among other things, the new article abolished the office
of the state superintendent, disposed of the centralized
state education agency, revoked the compulsory attendance
law, eliminated the districting of counties, returned the
county school lands to the counties, and limited financial
support for the schools (Article VII, 1876).
The Constitution of 1876 provided for state support
of schools by setting aside a maximum of one-fourth of the
state's general revenue from ad valorem and occupational
taxes. In addition, it stipulated that one-half the
public lands contained in railroad and internal improvement
surveys would be set aside for education, with revenue
going into the permanent school fund. All previous funds
allocated to education but never expended were also placed
in the permanent school fund. At the same time the Consti
tution rendered impractical local taxation for the purpose
of building and maintaining schools by establishing the

26
"community" system of school organization (Article VII,
Section 5, 1876).
In the "community" system of organization parents
and guardians reorganized school districts each year and
applied to the county judge, who appointed the trustees.
This "floating district" system proved untenable for
several reasons. First, local taxation was impossible
since district boundaries were not fixed. For the same
reason no permanent buildings could be constructed. Third,
many small inefficient districts operated in areas not
large enough for one district. Since nothing permanent
resulted, state revenue was dissipated. Fifth, provision
of a new board of trustees each year disallowed transition
and long-range planning. Sixth, parents often crippled
local schools by subscribing to some distant district
without actually participating (Eby, 1925) .
School expenditures from state funds, allocated on
a per capita basis as provided by the Constitution (Article
VII, Section 5, 1876), amounted to $479,400 for 133,568
scholastics ($3.59 per pupil) in 1876-1877. In 1877-1878
spending figures increased to $757,323 for 146,946 schol
astics, or $5.15 per pupil. There was still another
increase during the 1878-1879 school year, to $869,474 for
192,654 scholastics ($4.51 per pupil). The upward trend
under the new Constitution was gradual yet promising.

27
However, a precipitate decline occurred during the 18 79-
1880 school year. Expenditures decreased to $679,317 for
186,786 pupils, or $3.64 per scholastic (Biennial Report,
1880) .
By 1879 many citizens were demanding reform in state
financing of the schools. The dilation of pupil attendance
in public schools had focused attention on the needs for
better teachers, for state and local supervision, for for
mation of permanent districts, and for increased finances.
However, Governor O. M. Roberts was determined to balance
the state budget and eliminate state debts, and he twice
vetoed appropriations bills which included the usual maxi
mum of one-fourth of the general revenue for education.
Roberts insisted on fiscal retrenchment in all areas,
including education, and succeeded in reducing the appro
priation for education to one-sixth of the general revenue
for the biennium encompassing the 1879-1880 and 1880-1881
school years.
Roberts' fiscal policy helped to focus attention on
the need for other sources of revenue for education (Eby,
1925). The other existing source, besides legislative
appropriations, was land. Revenue from the permanent
school fund was not increasing to any marked degree, yet
school population trends were constantly on the rise. Two
remedies were apparent: (1) increasing the amount of the

/^
28
permanent school fund through a rapid increase in land
sales, and (2) resorting to local taxation (Eby, 1925).
Many incorporated towns had already adopted local taxation
for school purposes since taxation by municipal school
districts was permissible. The common schools were forced
to consider the identical prospect. In turn, both remedies
were attempted.
The Four Section Settler Act of 1879 provided for the
sale of school lands to actual settlers at $1.00 per acre.
The Fifty Cent Law of 1879 provided for the sale of unap
propriated public domain at 50<: per acre, with half the
revenue going to the school fund. Over 360,000 acres were
sold during the first nine months after the laws took
effect, but little cash was added to the school fund
because of the long-term notes on the land. In 1883, under
Governor John Ireland, the Fifty Cent Law was repealed, and
the Four Section Settler Act was modified. The bid to
increase school revenues through land sales was acknowl
edged as unsuccessful, and attention turned to local taxa
tion (McKay, 1943) .
In 1883 a constitutional amendment .was passed which
favored the establishment of permanent school districts and
the right of local taxation for school support whenever
local citizens voted to do so. The amendment specified the
sources of revenue for school support: (1) one-fourth of
29
the revenue from state occupational taxes, (2) a poll tax
of $1.00 on all males between the ages of 21 and 60, and
(3) a state ad valorem tax not to exceed 20<: per $100.
In order to qualify for state funds a district had to
operate the schools for a minimum of six months during the
school year (Eby, 1918).
The state school law was rewritten in 1884. It pro
vided for the popular election of a state superintendent,
the organization of all but fifty-three counties into
school districts (those fifty-three retained the "community"
plan), and local taxation in organized districts to a maxi
mum of 20<: per $100 (if approved by a two-thirds vote of
property owners) . The state ad valorem tax of 20<: per $100
was implemented, and provisions were made for the invest
ment of the permanent school fund in order to increase
revenues. Theretofore, the school fund could be invested
only in United States and Texas bonds; county bonds were
added to the list (Cooper, 1934).
In the late 1870s and early 1880s the work of the
Peabody Fund and Dr. Barnas Sears resulted in the estab
lishment of model schools in Houston, Brenham, San Antonio,
and a few other Texas cities. As these "town" schools
developed, so did the idea of local control for town
schools and local taxation for the support of town schools.
30
A series of laws in the period 1875-1881 had the
result of allowing urban centers to exercise more self-
determination relative to schools. An 1875 law gave
"incorporated cities" the right to assume control of the
schools in the city limits, to build schoolhouses, and to
levy local taxes by a vote of the citizens. The Consti
tution of 18 76 vested legal authority for urban school con
trol in the city councils, reaffirmed the authority granted
in 1875, and set a two-thirds vote as a necessary antece
dent to local taxation for school support. A law enacted
in 1879 limited school taxes in the town schools to 50<: per
$100, and still another act in 1881 allowed unincorporated
towns and villages over 200 in population to incorporate
for school purposes. The net effect of these laws was to
grant urban "town" districts an advantage over the rural
"common" school districts (Eby, 1925).
Despite the apparent progress made through the con
stitutional amendment of 18 83 and the concomitant school
law of 1884, little forward movement was realized (Eby,
1925). The responsibility for educational progress was,
in effect, shifted to the counties and local districts. At
the time this movement was thought beneficial because of
tlie success of some town schools, but rural districts dis
played little zeal for the task. The people were generally
ignorant of good standards for schools, the two-thirds vote

31
necessary for local taxation was difficult to muster, and
stagnation remained the hallmark of the rural common
schools for many years (Eby, 1925). Local' control also
provided for a wide spectrum of educational quality and
school support (Connor, 1971). Such was the general rule
during the remainder of the nineteenth century and well
into the twentieth century (Bralley, 1907). In retrospect,
it can be seen that inequities in educational opportuni
ties came to Texas as early as state support did, but it
was reliance upon local property wealth which brought the
inequalities into sharper perspective (Eby, 1925).
The chief cause of the lack of progress was no doubt
absence of input (Eby, 1925). In 1880 the total taxable
wealth of Texas was $825,000,000, and 12.5<: per $100 was
paid to education. By 1900 the taxable wealth was over
$2.3 billion, and still only 19.2<: per $100 went to educa
tion (Henderson, 1907). Many people erroneously believed
that the colossal permanent school fund could handle the
problem, and this delusion undoubtedly created citizen
apathy. Others were merely ignorant. To be sure, some
were even convinced that Texas schools were the best in the
nation, all evidence to the contrary notwithstanding
(Eby, 1925).
By 1900 the discrimination in terms of dollars
expended for education was apparent throughout the state,
32
especially in terms of urban-rural comparisons. In 1900
there were 729,217 scholastics in the state, of which
571,536 (78 percent) were rural students. Rural districts
in 1900 expended an average of $4.97 per pupil compared to
urban spending of $8.35 per pupil. Average school terms
were 9 8 days in rural schools and 162 days in urban
schools. Despite the fact that urban districts had only
22 percent of the state's scholastics, they had about two-
thirds of the school-owned property in Texas ($5,000,000
to $2,600,000). Average salaries in town schools were
$458.50 compared to $226.82 in rural schools. Of the
11,460 rural districts existent in 1900, only 930 were
graded; the remaining 92 percent were one-teacher schools
(Biennial Report, 1900).
Perhaps the most apparent feature of the discrimina
tion against the rural schools was the fact that it was
constitutional and legal. Where the constitutional tax
limit was 50<: per $100 in town districts, the ceiling was
20<: in common districts. Moreover, country schools were
guaranteed only a six-month school term. Towns were
allowed to vote bonded indebtedness; rural schools were not.
Moreover, there were no high schools in the rural areas
(Evans, 1955).
Despite the overriding difficulties, some educational
progress was made during the period 1900-1920 (Connor,

33
1971). The value of school-owned property increased
eight times during the two decades; the number of scholas
tics rose to 1,233,860; and professional personnel
increased from about 15,000 to over 31,000. State per
capita funds increased from $4.50 per pupil to $14.50.
However, Texans' comfortable existence was shaken by a
study in 1920 which revealed that Texas ranked thirty-
ninth among the forty-eight states in both efforts and
results relative to education (Connor, 1971).
Fiscal progress in the early 1900s included a fuller
tax rendition law in 1905 and the addition of personal
property to the tax rolls in 1907. In November, 1908, a
constitutional amendment was passed v;hich allowed common
school districts to utilize local tax monies for equipment
of buildings; abolished the two-thirds vote needed for
local taxation, substituting a simple majority vote; and
increased the tax limitations of common school districts to
50< per $100. However, moves for consolidation of the vast
numbers of districts in the early 1900s failed. In 1901-
1902 there were 7,446 common districts and 288 independent
districts; twenty years later the totals were 7,369 and
858 (Eby, 1925).
Public support of secondary education was slow to
develop and did not begin on a large scale until after
1910 (Connor, 1971). In the rural areas the problem was
34
especially acute. In 1911, during the governorship of
0. B. Colquitt, a rural high school law was passed which
created county boards of education and authorized them
(at local option) to consolidate common districts and
establish rural high schools at local expense. James E.
Ferguson campaigned on a platform which included state
aid for rural high schools and was elected as governor in
1914. The rural high school law was strengthened with
state aid in 1915 (Connor, 19 71). More importantly, the
34th Legislature in 1915 appropriated $1,000,000 for the
biennium for special rural school aid. In order to
receive the aid, a rural district had to tax at its maxi
mum rate of 50C per $100. In effect, the funds offered a
bonus for local effort; they were the first "equalization"
funds distributed by the state. This rural school "equali
zation aid" was legitimatized after the fact by constitu
tional amendment in 1918 (Steen, 1942).
In 1918 another constitutional amendment provided for
free textbooks and a state tax to finance them. Ground
work for this move had been laid with the establishment of
a state textbook selection board in 190 3, the enactment of
a law in 1911 allowing local boards to expend state-derived
funds for textbooks, and enactment of a textbook law in 1915
allowing the use of local funds to buy books. The amendment
of 1918 provided for an increase in the state ad valorem
35
tax from 20C per $100 to 35<: per $100, with the extra 15<:
per $100 earmarked for a textbook fund (Eby, 1925) .
By the early 1920s the modern dilemma of public
school finance in Texas was taking form. Eby (1925)
observed that: "The problem of the equalization of taxa
tion for schools and the problem of equalizing the oppor
tunities of education for all children of the state are
now being more generally discussed." It was already being
noted that disparities in local wealth and local effort
were creating inequities in educational opportunity
(Works, I, 19 25).
In the 1920s most state funds were distributed to
local districts on a per capita basis. These funds com
promised the "available school fund," which consisted of
interest from the permanent school fund, interest from the
different county permanent funds, revenue from the state
ad valorem tax (with 15< per $100 going for textbooks) ,
one-fourth of the occupational taxes, and revenues from
special state taxes on automobiles, oil, etc. To these
per capita funds were added the rural school aid, which was
distributed in a different manner as described above. How
ever, Texans were still slow to reconcile themselves to
local taxation for school purposes (Eby, 1925) . In 1918
Texas ranked forty-fourth among the forty-eight states in
the amount of local support for schools. The average
36
amount per pupil raised by local taxes in 1921-1922 was
only $13.02. In fact, in 1922-1923, fully 11 percent of
the common school districts in Texas levied no taxes at
all (Eby, 1925).
The structure of public school finance in Texas
changed little during the next two decades although state
appropriations continued to increase due to increased reve
nues (Steen, 1942). In 1937 the entire rural school aid
act of 1915 was rewritten, refinanced, and renamed the
"Equalization Fund." In addition, the 1937 law provided
salary aid and transportation aid to rural districts. It
also provided funds for high school tuition for those stu
dents residing in districts without high schools (Evans,
1955).
By 1940-1941 the available school fund provided
almost $40 per child, approximately half of which was
derived from interest earned by the permanent school fund;
by 1948-1949 the per capita apportionment was up to $101
(Texas Research League, 19 56). The remaining portion of
school expenditures, save rural school aid and a small
amount of federal aid, was raised by local school districts
through ad valorem property taxes, the only legal local
school tax (Article VII, Section 3, 1876).
Certain communities and districts in Texas had tax
able wealth sufficient to produce extravagant enrichment

37
at very low tax rates, while others were too poor to
enrich programs at all. Still other districts were tax
havens which levied no taxes whatsoever (Texas Research
League, 1972)." The results were, quite naturally, wide
variations in per pupil expenditures. Equality, other than
the small portion of rural aid, was never much of an issue
until after World War II (Texas Research League, 1972).
By 1947 the pressures for change in Texas public
school finance were irresistible. The post-war world
brought rises in both school enrollments and the cost of
living along with a concomitant fear that educational
revenue could not keep apace under the existing structure.
Moreover, legal attacks on segregation and gross inequities
in spending between white and black students were increas
ing. There were over 5,000 school districts in the state,
the majority of which operated as tax havens (Yudof and
Morgan, 19 74). In addition, the troubling concept of equal
educational opportunity was beginning to filter into the
school finance logic in Texas. The result was the forma
tion of the Gilmer-Aikin Committee in 1947 during the
administration of Governor Beauford Jester. Its charge was
to design a new system for financing the public schools of
the state (Still, 1950). \
The Gilmer-Aikin Committee (1948), in a report
entitled To Have What We Must, publicized the plight of the

38
Texas public schools and the needs for equality, preser
vation of the local control of schools, a minimum salary
schedule for teachers, fairer distribution of tax burdens,
and the concept of a state-supported minimum education.
It proposed the Minimum Foundation Program, a set of for
mulas for allocating state funds for personnel and opera
tions. The aim was "equal minimum educational opportunity,"
not complete equity.
In its essential theory the Minimum Foundation Pro
gram recommended by the Gilmer-Aikin Committee (1948) was
based on the Strayer-Haig-Mort model of "equalization."
In fact, Paul Mort served as a consultant to the legisla
ture during the creation of the law in 1949 (Still, 1950).
By use of a complicated economic index, local education
agencies were assigned their proportionate share of the
20 percent of the Minimum Foundation Program to be financed
locally in the form of a chargeback called the "local fund
assignment." The state, in theory at least, assumed 80
percent of the cost of the total Minimum Foundation Pro
gram. Local districts were free to "enrich" their programs
beyond the state minimum program in keeping with their
local ability and willingness. The proposals were accepted
without radical change and were enacted into law by the
Fifty-first Legislature in 1949.

39
The immediate impact of the Gilmer-Aikin Law was a
significant rise in state support levels. However,
equality was not achieved; in fact, it had not been the
intent of the law except insofar as the Strayer-Haig-Mort
theory was concerned (Yudof and Morgan, 19 74). The pur
pose was to provide a minimum program for every district
with some attention given to the financial abilities of
the local agencies. The law did save many districts from
fiscal chaos. By 1955-1956 the average state contribu
tion was $159 compared to $101 in 1948-1949, the last year
under the "old plan." The Minimum Foundation Program cov
ered about 60 percent of all educational expenditures in
the state in 1955-1956. By 1956-1957 the figure for state
Minimum Foundation Program aid had increased to an average
of $174 per student (Texas Research League, 1957).
Many weaknesses in the Minimum Foundation Program
became apparent soon after enactment of the Gilmer-Aikin
Law. First, a number of small, low-tax-rate districts
were perpetuated by the act. Otherwise, these districts
might have been forced to consolidate with larger dis
tricts. Second, the economic index proved to be a com
plex and inaccurate measure of local district wealth due
to: (1) flaws in the formula itself, not the least of
which was insufficient statistical data; (2) credits
given to certain types of land and to certain districts;

40
and (3) the fact that the index primarily measured income
while district wealth was premised upon taxable property
(Hooker, 1972). Third, the amount of state funds
injected became more a function of the legislative
process than a function of actual costs of an adequate
minimum education. The result was that the Minimum Foun
dation Program covered an ever-decreasing percentage of
the total school expenditures in the state (Yudof and
Morgan, 1974).
By 1965 there were so many deletions, additions,
substitutions, and footnotes to the original Gilmer-
Aikin Law that Texas school finance was aptly described
as "a majority of exceptions" (Texas Research League,
1972). Realizing the need for drastic changes in the
state's public school financing scheme. Governor John
Connally created in 1965 the Governor's Committee on
Public School Education, charging it to develop a long-
range plan which would vault Texas to foremost leadership
in public education. The Governor's Committee was the
first official body in the history of the state to address
itself to the issue of inequities in public school finance
(Yudof and Morgan, 1974).
Against a backdrop of general national concern for
equality in access to school services and about educa
tional outcomes, the Governor's Committee conducted
41
extensive research into nearly every facet of public edu
cation in Texas. The Committee's final report made
numerous proposals and recommendations for reform (Gov
ernor's Committee, 1968), but only a few are listed here
for illustrative purposes:
1. All districts with less than 2,600 students should be consolidated; every district with less than 2,600 students should be at least county-wide. The number of districts in the state would have been reduced to 353, 219 of which would have been county-wide.
2. The state should finance a kindergarten program to be made available first to low-income and non-English-speaking students; opportunities for others would be phased in gradually.
3. The Minimum Foundation Program should be strengthened through additional funds for personnel, operations, textbooks, and materials.
4. The State Board of Education should be redirected to become a policy-setting body, with commensurate authority, for education in the state.
5. All major current expenditure items should be brought under the umbrella of the Minimum Foundation Program so that more equality between "poor" and "wealthy" districts could be achieved.
6. The economic index should be abandoned gradually as a means of calculating local ability and be replaced by measures of equalized property value.
7. The state should adopt a system of guaranteed salary increases for teachers covering a ten-year period.
For its time the report of the Governor's Committee
was radical in scope. Neither did it lack ambition. In

42
regard to public school finance policy, the Committee pro
posed to achieve equalization through the institutional
ized Minimum Foundation Program. Such an ambition was,
in itself, contradictory; however, the immediate effects
likely would have been a large measure of equalization
through massive injections of state aid aimed at a
widened Minimum Foundation Program. The need for many
districts to rely heavily upon local wealth (or the lack
of it) would have been alleviated, thus equalizing expen
ditures to a great extent (Governor's Committee, 1968).
By 196 8, when the Governor's Committee report was
published, John Connally was no longer governor. His
successor, Preston Smith, showed little inclination to
press the issue of school finance reform (Yudof and
Morgan, 19 74). Only three of the Governor's Committee
proposals were enacted into law in 1969: (1) the state-
financed kindergarten program, with a ten-year phase-in
period (Texas Education Code, Section 21.131, amended
1971, 1975); (2) a $400 bonus for vocational teacher
units (Texas Education Code, Section 16.304); and (3) a
teacher's salary scale (Texas Education Code, Chapter 16,
Subchapter D, amended 1973, 1975). The principal^effect
of the teacher salary increase was to suppress movement
toward equalization, for the combined costs of both became
politically unfeasible (Yudof and Morgan, 1974).

43
On December 23, 1971, the United States District
Court for the Western District of Texas handed down a
judicial decision which stunned Texans into a realization
of the ramifications of years of neglect of the problems
of equity in school finance. The case of Rodriguez v.
San Antonio Independent School District had been filed as
a class action suit by residents of the Edgewood Indepen
dent School District in San Antonio in behalf of "all
children throughout Texas who live in school districts
with low property valuations" (Rodriguez v. San Antonio
I.S.D., 1971). The plaintiffs claimed that the method of
financing elementary and secondary education in Texas
deprived their class (school children in poor districts)
of the equal protection of the laws guaranteed by the
Fourteenth Amendment to the U.S. Constitution.
The court, after reviewing evidence of the great
disparities in wealth among Texas school districts, found
merit in the claim and held that "the current system of
financing public education in Texas discriminates on the
basis of wealth by permitting citizens of affluent dis
tricts to provide a higher quality education for their
children, while paying lower taxes" (Rodriguez v. San
Antonio I.S.D., 1971). The court ruled that the Texas
school finance system was unconstitutional and granted
the state legislature two years to develop an equitable
system.

44
On appeal, arguments in the Rodriguez case were
made in the United States Supreme Court in October, 19 72.
In March, 1973, the Court rendered a decision reversing
the lower court's findings by a vote of five to four.
The Texas system was not found to be unconstitutional.
The Court's rationale has been summarized by Hoffman
(1973) as: (1) poor people live in all districts and not
necessarily in districts with low taxable wealth, (2) the
Texas aim to provide an adequate program for each child
in the state was accomplished through the Minimum Founda
tion Program, (3) educational expenditures are not easily
equated to educational quality, and (4) education is not
viewed as a fundamental interest protected by the federal
constitution.
The Supreme Court's reversal of the Rodriguez case
was astounding to many observers of the law and public
school finance. Indeed, the majority opinion, despite the
reversal vote, carried strong encouragement to Texas
legislators to create a better method of state public
school financial support. One dissenting justice, Thurgood
Marshall, expressed concern that the decision went counter
to the trend in many state and federal court decisions in
the early 1970s (San Antonio I.S.D. v. Rodriguez, 1973).
Among these cases were Serrano v. Priest (California, 1971), Van Dusartz v. Hatfield (Minnesota, 1971),

45
In the fifteen-month period from December, 19 71, to
March, 19 73, most Texas educators assumed, not without a
note of terror, that the Supreme Court would uphold the
district court's decision, true to the emerging trend.
Elsewhere in the nation, no less than eleven states drew
up new financing plans for public education in the 2
interim. In each case the intent of the state legisla
ture was to attempt to equalize educational expenditures
across districts (Grubb, 1974).
In the aftermath of the district court decision in
the Rodriguez case, several studies were launched in Texas
Only three actually presented school finance reform plans:
(1) the State Board of Education (Texas Education Agency,
1972, 1973); X2) the Texas State Teachers Association
(1972); and (3) the Joint Interim Senate Committee to
Study School Finance (1973).
The first State Board of Education resource alloca
tion plan ignored the no-wealth discrimination principle
of the Rodriguez decision (Texas Education Agency, 1972).
Caldwell v. Kansas (1972), Milliken v. Green (Michigan, 1972), and Robinson v. Cahill (New Jersey, 1972).
2 The eleven states were California, Colorado,
Florida, Illinois, Kansas, Maine, Michigan, Montana, North Dakota, Utah, and Wisconsin. The flurry of activity was also prompted by the earlier 19 71 suit Serrano v. Priest in which the California Supreme Court struck down that state's school finance system.

46
Three months later the State Board recanted and adopted
a variant form of district power equalization as a proposal
(Texas Education Agency, 1973). The T.S.T.A. proposal
centered around an "improved" Minimum Foundation Program
and did little to address the cogent problem at hand
(T.S.T.A., 1972). The Joint Interim Senate Committee pre
sented twelve alternative schemes resulting from four
allocation plans and three revenue plans (J.I.S.C., 1973).
Its preferred approach was a district power equalization
approach to a new Foundation Program with increased levels
of support, legal minimum tax rates, and legal maximum tax
rates. However, the revenue plan called for increased
local property taxes (J.I.S.C, 1973), a proposal doomed
from its inception.
In Austin the Sixty-third Legislature met in January,
19 73, amid an air of uncertainty. When the Supreme Court's
verdict was learned in March, most of the legislators
breathed a collective sigh of relief and resolved them
selves to enjoy the "stay of execution." One measure
(H.B. 946) was passed in the House of Representatives
which included an equalization feature, but it suffered a
swift demise in the Senate. In all probability it would
have been vetoed by Governor Dolph Briscoe, who was bent
on pursuing a more deliberate course toward equalization
(Yudof and Morgan, 1974).
47
Subsequent to the adjournment of the Sixty-third
Legislature, a number of study groups began preparation
for the Sixth-fourth Legislature in 1975: (1) the Gover
nor's Office of Educational Research and Planning,
headed by Richard Hooker; (2) a Senate study group;
(3) several House study groups; (4) the State Board of
Education; (5) the Texas Research League; (6) the Legis
lative Property Tax Committee; and (7) the Texas Advisory
Commission on Intergovernmental Relations.
When the Sixty-fourth Legislature convened in Janu
ary, 1975, school finance headed the list of major issues
contronting the legislators. Within the school finance
issue, arguments revolved around the key word "equaliza
tion." Moreover, there was renewed cognizance of the fact
that the Minimum Foundation Program encompassed only 55
percent of school expenditures in Texas (Texas Advisory
Commission on Intergovernmental Relations, 1976). However,
the net effect of the intervening studies was that the
legislature was inundated with school finance reform pro
posals of a multiplicity of types.
In finality, the tangible outcome of efforts to
reform Texas public school finance was a compromise bill
(H.B. 1126), hastily constructed in the twilight hours of
the session. In total, H.B. 1126 added about $400,000,000
to the renamed Foundation School Program through increases

48
in salaries for foundation program personnel, transporta
tion funding, operational cost allowances, and categorical
grants for compensatory and driver education (Texas Edu
cation Code, Section 16.004).
The full ramifications of H.B. 1126 are as yet
unknown, but some positive factors are apparent. First,
a state policy was codified which established that:
. . . it is the policy of this state that each student enrolled in the public school system shall have access to programs and services that are appropriate to his educational needs and that are substantially equal to those available to any similar student, notwithstanding varying local economic factors (Texas Education Code, Section 16.001).
Second, the law required that a district had to be
accredited by the Texas Education Agency by 1977-1978 in
order to be eligible to receive Foundation School Program
assistance (Texas Education Code, Section 16.053). Third,
minimum staffing ratios for school districts were codified
(Texas Education Code, Section 16.054). Fourth, and per
haps most important, the chargebacks (local fund assign
ments) of districts were to be calculated on the basis of
actual market value of taxable property as established by
the governor (Texas Education Code, Section 16.252).
Some factors in the new law were revealed as lacking
in foresight, but not all will be enumerated here. As an
example, equalization aid was offered to districts with
local fund assignments per ADA which were less than 125

49
percent of the total statewide local fund assignment per
ADA, to a limit of $70 per ADA or $50,000,000, whichever
was greater (Texas Education Code, Sections 16.301,
16.302):
ax?7y - 1 DLFA/ADA ^^^ ^^-^^^ - ^ - (SLFA/ADA) X 1.25 ^ ^^^ ^ ^^^
In effect, 62.5 percent of the districts in the state
became eligible for equalization aid, and such aid even
tually amounted to only $56 per ADA because of the
$50,000,000 ceiling (T.A.C.I.R., 1976). Nevertheless, a
precedent was established for equalization aid based upon
local tax resources available.
Still another example of the weaknesses in the law
was a provision for $40 per disadvantaged pupil to a limit
of $25,400,000 per year (Texas Education Code, Section
16.176). In effect, districts realized about $39 per dis
advantaged pupil; the Governor's Committee (19 68) had
recommended $100 per disadvantaged pupil as a reasonable
figure before the inflation of school costs during the
1970s. Therefore, state aid for compensatory education
was ineffectual in regard to amount of input.
A third and perhaps most important weakness of the
law was that the chargeback calculation was ineffective in
creating equalization. Although based upon the equalized
50
market value of property, chargeback to districts by 19 76-
1977 was required at a rate equal to 35<: per $100 of valu
ation (Texas Education Code, Section 16.252). Whereas in
1974-1975 the Minimum Foundation Program accounted for
only 55 percent of school expenditures, by 1976-1977 the
percentage was still only about 60 percent (Texas Research
League, 1976). Heavy reliance upon local property tax
wealth without some countermeasure, such as "recapture"
from wealthy districts, was still being perpetuated and was
counterproductive relative to equalization. Increases in
Foundation School Program costs were expended primarily for
salary increases, and salaries accounted for 85.6 percent
of operating costs in 1975-1976 (Texas Research League,
19 76). Allocations for operating costs were not enough to
allay effectively the specter of inflation. In short, the
law only perpetuated, at an inflated scale, the same
inequities apparent since the pre-Gilmer-Aikin era.
In enacting H.B. 1126 the legislature directed the
governor to:
. . . conduct a study to determine methods of allocating state funds to school districts which will insure that each student of this state has access to programs and services that are appropriate to his educational needs regardless of geographic differences and varying local economic factors. . . . The study shall include a determination of each school district's ability to support public education based on the value of taxable property in the district (Texas Education Code, Section 16.001, note).
51
The report of this study, contained in the Preliminary
Report of the Governor's Office, Education Resources
(1976) , was presented to the public simultaneously with
Governor Briscoe's school finance proposals for the
Sixth-fifth Legislature on November 1, 1976. '
The Governor's Plan, as it was known, called for an
increase of $850,000,000 in state aid to schools through
funds providing for: (1) expanded Foundation School Pro
gram allocations, (2) a substantial raise in equalization
aid (to $250,000,000), (3) increased transportation allot
ments, (4) renewal and accountability, and (5) aid for the
improvement of school tax office operations (G.O.E.R.,
1976). In addition, the plan called for a chargeback rate
of 9<J: per $100 in valuation, with the state assuming
90 percent of the cost of the Foundation School Program.
Also presented were the new equalized valuations of prop
erty as determined by the Governor's Office, Education
Resources, headed by John Poerner. Especially hard hit
were districts with large amounts of rural land (Manage
ment Services Associates, 1976a).
Even as the Governor's Plan was being revealed,
other proposals for reform were afoot. Chief among the
new plans was that voted out of the Special House Com
mittee on Alternatives to Public School Finance. It con
tained recommendations that: (1) the state assume
52
100 percent of the cost of the Foundation School Program,
(2) that local districts be required to lower property
taxes to reflect increased state aid, and (3) that local
tax increases beyond legally established local enrichment
limits (15 percent) be submitted to the voters of a dis
trict for approval (Management Services Associates, 1976b)
Governor Briscoe then added to his plan the notion of a
ceiling on local taxes, a move calculated to appease
beleaguered property-taxpayers as well as to point toward
equalization (M.S.A., 1976b).
Chief among the objections to both the Governor's
Plan and the Special House Committee plan was a concern
that both proposals would result in the majority of new
state funds flowing to districts which were larger,
wealthier, or could well afford to support a program
locally without intensive state supplement (M.S.A., 1976b).
Other sources of consternation were the Governor's
obliviousness to the issue of a teacher pay raise and the
Special House Committee's insistence upon a local plebi
scite. To these questions was added the prospect of
increased state taxes to finance the anticipated expendi
tures. The possibility of no-wealth discrimination reform
by the Sixty-fifth Legislature is, then, still
problematical.

53
The long-term prospects for school reform in Texas
are as uncertain as the immediate circumstances. Yudof
and Morgan (1974) have identified several critical factors
which are not current in Texas but which must be present
if reform is to be effected. Two factors are of note.
First, there must be a public consensus that school
finance reform to achieve equity is in the best interest
of all citizens, not just minorities or residents of
"poor" districts.
At present, two philosophies are competing for public
favor: (1) the idea of a free market approach to educa
tional goods and services similar to that taken toward
other private and public goods and services; that is,
since all consumer goods are not equally accessible to all
citizens, education should be no exception; and (2) the
idea of a controlled market in which access to educational
goods and services is equal for all rather than a result
of wealth or poverty in a school district. Especially
crucial to the consensus are legislators, educators, tax
reformers, the governor, and teacher organizations (Yudof
and Morgan, 19 74) .
Second, it is an acknowledged principle that equali
zation of educational expenditures requires large input
from state-derived revenues (Phi Delta Kappa Commission,
1973). Educators must become prepared to act in their own

54
behalf by reversing the current trend of public distrust
and lack of support for the educational system. In effect,
educators must prove themselves accountable and must be
able to justify increased educational expenditures across
the state in terms of increased educational outcomes
(Yudof and Morgan, 197 4).
Review of Literature
Three general areas of literature related to public
school finance will be reviewed as cogent antecedents to
an understanding of the framework of the dissertation:
(1) the development of conceptual theories of state finan
cial support of public schools, (2) the legal aspects of
public school finance, and (3) alternative solutions for
equalization of public school finance. The purpose of the
review of literature is not to present an exhaustive bib
liography on the subject of school finance; rather, the
goal is to bring into sharper focus a few basic ideas and
theories which undergird the study and which provide the
theoretical setting for the research.
Development of Conceptual Theories of State Financial Support of Public Schools
Burrup (1974) has divided the history of state sup
port for public schools into five eras: (1) the era of
local district support and responsibility, with little or
no assistance from the state; (2) the era of emerging

55
state responsibility as reflected through flat grants and
other non-equalizing means of support; (3) the era of
emergence of the Strayer-Haig concept of the foundation
program; (4) the era of refinement of the foundation pro
gram concept; and (5) the presently emerging era of
"power" equalization practices. During the twentieth cen
tury, which encompasses approximately the last four eras,
the conceptualizations of public school finance developed
by Ellwood P. Cubberley and George D. Strayer, Sr., their
students, and the students of their students have been the
guiding theories (Johns and Morphet, 1975).
Cubberley (1906) touched off a movement in school
finance in the early twentieth century which is still
aspiring to emerge--the attempt to discover a state aid
plan for education which insures equality of educational
opportunity (and tax burdens) while simultaneously pro
moting improved quality in education (Thurston and Roe,
1957). Cubberley's doctoral dissertation and subsequent
monograph entitled School Funds and Their Apportionment
(1906) revealed that early twentieth-century patterns of
state support were not merely non-equalizing in effect;
they were, in many cases, actually disequalizing; e.g.,
flat grant models. Most of Cubberley's theories have
become outmoded, but several of his ideas are worthy of
note:

56
1. Education is a state financial responsibility which the state should not and cannot ignore.
2. State financial assistance should be in addition to local effort, not a means of reducing local tax burdens (except in extreme cases).
3. Existing methods of allocating state funds (c. 1905) actually are disequalizing in effect.
4. The number of educational programs in the schools should be expanded, with concomitant increases in state funds going as rewards to those districts offering expanded services. This was Cubberley's "reward for effort" theory.
5. Aggregate days in attendance should be preferred over membership, average daily attendance, etc., in funding formulas since the effect would be to encourage extension of the school year.
6. Distribution of some portion of state funds should be based on teacher units, thereby giving relief to rural districts with low pupil-teacher ratios.
7. The excessive financial burdens of local communities should be equalized by the state since the efforts were for the common benefit.
8. A state school tax best equalizes burdens; state taxation for school support must be accompanied by a rational and wise allocation system (Cubberley, 1906).
It is evident that Cubberley's recommendations were
calculated to improve the overall quality of education,
not merely to provide equity in school finance. In fact,
his equalization theory, based on reward for effort, would
tend to have a disequalizing effect since the services to
be rewarded would most likely be existent in only the

57
wealthiest districts (Johns and Morphet, 1975). Never
theless, Cubberley's niche in school finance theory was
earned through his insistence upon scientific study and
rational distribution schemes.
Cubberley's rudimentary school finance theories were
expanded, amplified, and substantially redirected in the
early 1920's by Strayer and Haig (1923), Mort (1924), and
Updegraff (1922). The first real theory of equalization—
the foundation program concept—was a result of the Educa
tional Finance Inquiry Commission in New York State and
the intensive studies of George D. Strayer and Robert M.
Haig. In their report entitled The Financing of Educa-
tion in the State of New York (1923) , Strayer and Haig
devoted a few pages to a theoretical means of achieving
equality in educational opportunity which was to have a
major impact on school finance in the fifty succeeding
years. The Strayer-Haig theory can be summarized in a few
basic points:
1. A foundation program should be devised to assure an adequate minimum educational program for all children, the funding for which should be a state's foremost priority.
2. The foundation program should be centered upon the "rich district" concept; i.e., each local education agency should levy as a minimum tax rate the tax rate required to support the educational programs of the state's wealthiest district.
3. The foundation program should equalize (be based upon local ability), but only to a point;
58
i.e., local districts should have discretion to spend above the foundation program level.
4. The foundation program should be organized in a way to promote local initiative and efficiency.
5. The foundation program features should be codified in law and applied equally to all districts.
6. The foundation program should comprise the major portion of a state's funds for education.
7. Uniform property assessment must be an antecedent to insure that no district receives additional funds through underassessment of its property values.
8. The program should encourage consolidation and reorganization of districts; however, it should provide for the support of necessary small school districts; e.g., sparse area districts (Strayer and Haig, 1923).
The Strayer-Haig theory for state support of schools
became a model widely adopted in the United States, with
numerous adaptations. In general, compromises to a "true"
foundation program of equalization revolved around three
accommodations which tended to dilute the effects:
(1) the long-standing tradition and/or constitutionality
of flat grants, (2) the reluctance of state legislatures
to provide the massive appropriations needed for a good
foundation program, and (3) the desire of some local agen
cies to expend large amounts above foundation program
levels (Advisory Commission on Intergovernmental Relations,
1969).

59
Paul R. Mort (1924) addressed the problem of defin
ing a satisfactory minimum program to be equalized and of
devising instruments for the measurement of need. The
three broad elements which Mort (1924) felt were acceptable
features in a state-assured program were:
1. Any educational activity found in most or all communities throughout the state;
2. Unusual expenditures for meeting general requirements arising from causes not within the scope of local community control; and
3. Funding for more costly types of education requiring additional offerings or efforts.
Mort also developed complicated regression equations to
estimate, on the basis of average practice, the typical
number of teachers required in both elementary and second
ary schools of various sizes, economies of scale, and other
pertinent statistics. Mort's "typical teacher" later
became the "weighted teacher" or "adjusted instructional
unit" adopted by many states utilizing the foundation pro
gram approach (Johns and Morphet, 1975).
Mort and others (1933) also reported on the effects
of the many adaptations made by states to the "true"
foundation program. They found that in all but a few
states the level of the minimum program was determined
more by local economic ability than by actual educational
needs. In addition, it was revealed that in nearly all
states the minimum program guaranteed by the state was far

60
below the par of programs supported by districts of aver
age wealth. Moreover, it was shown that the various
states were not utilizing available refined measures to
determine needs, thereby thwarting equalization.
Harlan Updegraff (1922) attempted to integrate both
the concept of equalization of educational opportunity and
the idea of reward for effort into a single scheme. His
idea of a variable level foundation program was opposed by
foundation program purists such as Strayer and Mort (Johns
and Morphet, 1975), but Updegraff's model has been redis
covered in recent years and resurrected as "power equaliza
tion" (Coons, Clune, and Sugarman, 1970). Updegraff's
theory was based on several principles:
1. Local support is fundamental, not only because of extensive local tax resources but to protect citizen interest in the schools.
2. Local districts should be organized in such a way as to contain enough taxable wealth to raise an adequate portion of expenses for school programs .
3. The amount of financial support provided by the state should be based upon needs which will vary from state to state.
4. The extent of the state contribution for financing education should be dependent upon local action; i.e., state aid should be increased when the true local tax rate is increased and lowered when the local effort is decreased.
5. Districts should receive state support in inverse proportion to their true taxable valuation (per teacher unit in Updegraff's plan).
61
Updegraff even went so far as to develop allocation for
mulas on a sliding scale that provided increased amounts
of state aid (per teacher unit) for each increase of one-
half mill of local tax effort between three and one-half
and nine mills, with proportionately more state aid going
to districts with lower taxable valuations (Updegraff,
1922) .
Henry Morrison (19 30) held that previous attempts to
equalize educational opportunity, such as those advanced by
Strayer, Haig, and Mort, had failed and would continue to
fail to provide an equitable system of school finance.
Morrison (1930) proposed a model whereby local district
distinctions would be abolished; taxing authority and cen
tral administration would be assumed by the state. Coin-
cidentally, he also asserted that school support should be
financed through a more progressive tax, such as the
income tax, instead of through the more regressive property
tax (Morrison, 1930). Morrison's ideas were not well-
received in an era when the Cubberley-Strayer-Haig-Mort
school of thought occupied the sphere of influence; more
over, his theory was out of step with contemporary politi
cal philosophy. Nevertheless, Morrison provided the
seminal idea of the modern conceptualization of full state
funding of education (Benson, 1975a).
62
Improvements of the application of the foundation
program theory led, during the 1940s and afterward, to the
development of "open-end equalization" theories, espe
cially those espoused by Paul R. Mort and installed in a
few states (Mort and Reusser, 1951). The idea was not
totally new, having been proposed in part by Updegraff
(1922). The basic principles of "open-end equalization"
were and are:
1. A foundation program should be established which provides for equalized participation in a state-assured minimum program, just as suggested in the classical Strayer-Haig concept.
2. Once the state-local ratio of support is established, the same ratio should apply to expenditures beyond the foundation program level.
3. Local boards of education should determine the tax rate to be "equalized," thus preserving local decision-making.
4. Financial effort above the foundation program level (selected locally) would be shared by the state at the same ratio, or percentage, as in the foundation program scheme (Mort and Reusser, 1951).
The fundamental premise of "open-end equalization,"
or "equalized percentage matching," is the sharing of
costs by the local district and the state throughout the
financing program, not just to the level of a guaranteed
minimum program. In effect, Updegraff's (1922) thesis of
combining equalization with reward for effort, two seem
ingly opposed ideas, is incorporated in the theory.

63
Burrup (19 74) has summarized the merits of "equal
ized percentage matching" as: (1) districts are encour
aged to exert adequate tax effort; (2) equalization is
achieved in both spending and tax effort; and (3) ceilings
on tax effort are removed, thereby allowing poor districts
to spend as much as rich districts with the identical tax
rates. The only restriction to an adequately financed
program becomes the willingness of the local district to
tax itself. Nevertheless, adoption of "open-end equaliza
tion" approaches has been slow for many of the same reasons
which have made school finance reform in general slow:
(1) apathy; (2) traditional acceptance of archaic plans;
(3) lack of state leadership in improvement of property
tax administration; (4) too many kinds, numbers, and
sizes of school districts; and (5) fear in a great many
school districts and states of liberalization of school
financing programs (Burrup, 1974).
Two other current conceptual theories of school
finance are "full state funding" and "district power
equalization." The seminal idea of full state funding
was first presented by Morrison (1930), and interest was
revived in the late 1960s by James B. Conant (Fleischmann
Report, I, 1973), the Advisory Commission on Intergovern
mental Relations (1969), the Committee for Economic
Development (1970), and the Fleischmann Commission in New
64
^o^^ (Fleischmann Report, 1973). The basic theory of full
state funding is simple; i.e., the taxing power of local
districts is removed and the state supplies each district
(according to some rational scheme) with the money neces
sary for school operation (Benson, 19 76b). The only
state currently utilizing such a plan is Hawaii; however,
Hawaii is a single school district as opposed to the multi
district arrangements existing in all other states (Tron,
1976).
Benson and Shannon (19 72) have listed some of the
major potential benefits of full state assumption as:
(1) abolition of interdistrict disparities in taxable
wealth and tax rates, (2) provision of a more rational
scheme of resource distribution (based upon student needs
rather than taxable property per pupil), (3) more effi
cient operation of education, (4) movement of collective
bargaining to the state level, and (5) better fiscal
accountability, among other benefits. Two potential
hazards of full state funding might be social class iso
lation and inefficiency of instruction (Benson, 1975b).
Most full state funding proposals place emphasis upon
regional cooperative services (Goldhammer, 1968; Fleisch
mann Report, I, 1973). This proposal, along with pros
pects of state-centered administration, produces the cen
tral controversy over full state assumption--loss of local

65
control (Benson, 1975b). Nevertheless, Benson and
Shannon (19 72) have stated that possibilities for accep
tance are favorable in comparison to other major school
finance configurations.
Although the foundations of "district power equali
zation" are found in Updegraff (1922), true interest in
the financing plan has been aroused only in recent years,
especially by Coons, Clune, and Sugarman (1970). The
basic principle of district power equalization is that at
any specified tax rate every district in a state, regard
less of local tax wealth, would have the same fiscal
resource level per pupil or per ADA as any other district;
that is, there is a state-established schedule of funding
level choices (locally selected) related to specific tax
rates (Guthrie, 1975) . Usual concomitants to such a plan
are codified minimum tax rates, legal maximum tax rates,
"kinks" (manipulation of the tax rate/expenditure scheme
to encourage equalization), and perhaps recapture (Coons,
Clune, and Sugarman, 1970).
The chief advantages of district power equalization,
according to Guthrie (1975), are: (1) a more liberal view
toward equalization, allowing some local differences based
on local preferences; (2) encouragement of local choice
and participation; and (3) avoidance of bureaucratized
central administration of schools. The most obvious

66
hazards of the system are: (1) lack of fiscal neutrality;
i.e., the deliberate encouragement of spending differences;
(2) perpetuation of social class distinctions; and
(3) failure to encourage consolidation (Guthrie, 1975).
In respect to the last shortcoming, a substantial argument
can be made that consolidation does not necessarily pro
duce efficiency or economies of scale anyway, despite the
many myths to the contrary (Sher and Tompkins, 1976).
It has been illustrated that considerable develop
ment of conceptual theories of public school finance,
especially in regard to state support, has occurred during
American history, particularly in the past seventy years.
The major theories may be summarized as: (1) flat grants
and other means of support conducive to only slight
equalization; (2) the Strayer-Haig-Mort foundation program
concept based upon wider principles of equalization (in
many variant forms); (3) open-end equalization, or equal
ized percentage matching schemes; (4) full state funding;
and (5) district power equalization configurations. Plac
ing all recent judicial developments aside, the historical
tendency in school finance is decidedly in the direction
of increased equalization of both educational opportunity
and educational expenditures.
67
Legal Aspects of Public School Finance
The establishment and operation of public school
systems in the United States has long been recognized as
a function of government, as opposed to a function of
private enterprise. The early leaders of the American
government recognized the vital role of education in
establishing and maintaining a democratic system. The
earliest manifestations of this belief were the Northwest
Ordinances of 1787 and 1789, both of which encouraged
education through land grants for school purposes. How
ever, the federal government did not assume the full
responsibility for supporting education; rather, the
actual responsibility devolved upon state governments
(Johns and Morphet, 1975).
For over a century, since the famous Kalamazoo case
of 1874, both federal and state courts have continuously
supported the notion that each state has the authority to
determine how its school funds will be raised and allocated
and that the state has financial responsibility for educa
tion (Burrup, 1974). However, the state must operate
within the provisions of the federal Constitution. In
addition, judicial review has established that: (1) school
property is state property, (2) school funds are state
funds, and (3) school taxes are state taxes (Wise, 1968).

68
Traditionally, state governments have delegated
some control, including specific taxing authority for
school purposes, to local governmental agencies, or
school districts, even though the states retain primary
responsibility. The extent of local control has never
been a permanent arrangement since various states dele
gate differing amounts of control and power to local
agencies; moreover, since the state may withdraw the dele
gated power at its option, local control has been, and
continues to be, rather tenuously instituted. In the
present decade, with states gradually assuming more
financial responsibility for education, the role of local
governing boards has diminished proportionately to the
dilating state role (Burrup, 1974) .
Historically, then, the federal role in education has
been a minor one; i.e., the federal government has exer
cised some interest and support without significant direct
control or responsibility for education. The federal gov
ernment's legal connection with education has also been
indirect, being based principally on the "general welfare"
clause of the Constitution (Johns and Morphet, 1975).
However, the federal judiciary has proved to have a great
impact upon education through judicial review of viola
tions, real or imagined, of the constitutional rights of
citizens by states and their local school districts.
69
Wise (1968) explained the mounting interest in equal
educational opportunity, and concomitant litigation, as a
logical extension of Supreme Court rulings involving
school desegregation (in 1954), legislative reapportion
ment (in 1962), and protection of the civil rights of the
poor (in 1965). In effect, equity in school finance and
educational opportunity was viewed as the "next step"
beyond racial equity, voter equity, and equality before the
law regardless of wealth.
Especially critical to judicial intervention into
public school finance in the past decade has been the
Fourteenth Amendment to the United States Constitution,
which provides that "no state shall make or enforce any
law which shall abridge the privileges or immunities of
citizens of the United States; nor shall any State deprive
any person of life, liberty, or property without due
process of law, nor deny any person within its jurisdic
tion the equal protection of the laws." By 19 68, school
finance programs of states which provided unequal amounts
of money per pupil were subject to confrontation and liti
gation on the grounds that such inequity violated the
"equal protection" clause.
As discussed in Chapter I, the United States Supreme
Court had confirmed the idea of an adequate education for
all children as constitutional (Mclnnis v. Shapiro, 1968;
70
Burruss v. Wilkerson, 1970). No evidence was forthcoming
that unequal expenditures constituted a constitutional
conflict until four major cases captured public attention
in the period 1971 to 1973: Serrano v. Priest (California,
1971); Van Dusartz v. Hatfield (Minnesota, 1972); Robin
son V. Cahill (New Jersey, 1972, 1973); and Rodriguez v.
San Antonio Independent School District (Texas, 1971,
1973). Although three of the cases (all except Rodriguez)
were decided in state courts, and although setbacks to
the idea of equal expenditures resulted in later cases
(e.g., Shofstall v. Hollins), a legal framework of school
finance equity was established. The principles established
are not cogent to any state except where a given ruling
has been made, but Burrup (19 74) has provided an interest
ing summary:
1. The public education of a child shall not depend on wealth other than the wealth of the state as a whole; this means that the quality of a child's education cannot be a function of the wealth of his parents, his neighbors, or the school district.
2. Taxes levied for school purposes must generate the same total numbers of dollars per mill of tax in poor districts as in rich districts.
3. Since educational needs vary from district to district, the state does not have to require all of its school districts to spend the same amount of money or offer identical educational
• programs.
4. Education is considered a fundamental interest of the state.
71
5. Although local property taxes discriminate against the poor, state legislatures are not required to eliminate them in favor of taxes on other sources of revenue.
6. Additional expenditures may be made by schools for programs for exceptional children and compensatory programs for culturally disadvantaged children, and also for other educational needs of children that are significant and worthy of special treatment.
7. There is an implication, though not a direct ruling, that equitability must be established in school district capital-outlay expenditures in a way the same as that required for current expenditures.
8. No specific plan or plans have been mandated to achieve equitability in school finance formulas; states will be allowed a reasonable period of time to revise their laws and bring them within court guidelines.
In summary, the implications are as stated by Shannon (19 72)
relative to the Serrano decision: "Serrano envisions all
people being treated by the law in the same manner, unless
a strong showing can be made that differential treatment is
justified to achieve a valid and significant goal of the
nation or the state."
To reiterate a statement from Chapter I, the U.S.
Supreme Court's reversal of the Rodriguez decision in 19 73
halted the mounting wave of suits against state governments
on the grounds of violation of the Fourteenth Amendment.
Nevertheless, prospects for change through the judiciary
were not obliterated. On the contrary, they were encour
aged. In its Rodriguez decision the Supreme Court stated.

72
"We hardly need add that this Court's action today is not
viewed as placing its judicial imprimatur on the status
quo" (San Antonio I.S.D. v. Rodriguez, 1973). The authority
of state courts to strike down school finance plans in
their respective states was not affected (Shannon, 19 73;
Roos, 1974). As added emphasis to this point, the New
Jersey Supreme Court, shortly after the Rodriguez reversal,
upheld the decision of the lower court in Robinson v.
Cahill that the school finance plan of New Jersey violated
the state constitution.
The rulings of state courts on school financing will,
in all likelihood, continue to supply pressure for school
finance reform V7ith equalization of educational opportu
nity, as measured by expenditures, as a goal. However, the
greatest pressure for reform is coming, and probably will
continue to come, from the electorate due to public aware
ness and knowledge of the inequities of many current school
finance systems. Indeed, the Supreme Court has stated that
"the ultimate solution must come from the lawmakers and
from the democratic pressure of those who elect them"
(San Antonio I.S.D. v. Rodriguez, 1973).
Alternative Solutions for Equalization of Public School Finance
Chapter I emphasized the fact that state legislatures
are under considerable pressure in the 1970s to work

73
fundamental changes in school finance structures. At the
same time, solutions leading to equity in both taxing and
spending are few; those that have been tested have pro
duced only tenuous data. As various states have grappled
with this dilemma in recent years, alternative solutions,
none of which are perfected, have emerged from the
efforts. These solutions provide some light for the path
of future reform and seem worthy of consideration at this
juncture.
The Phi Delta Kappa Commission on Alternative
Designs for Funding Education (1973) has pointed to five
viable alternatives for school finance: (1) local support
alone, (2) full state funding or "almost full state fund
ing," (3) traditional foundation systems, (4) equalized
local initiative systems, and (5) foundation systems sup
plemented with equalized local initiative. The complete
local support model is more theoretical than practical,
but it does illustrate the need for state aid to schools.
To this category could be added flat grant models; such
models are practically utilized, but they serve more to
illustrate the need for equalization than they do to
foster equalization.
Full state funding, as indicated above in the Review
of Literature, has been considered a viable alternative
solution which eliminates geographical considerations,

74
negates district wealth as a factor in spending, requires
greater fiscal investment by the state, and offers pros
pects for transferring school revenue off the property
tax base (Morrison, 1930; Burrup, 1974). However, the
amount of money involved might be prohibitive and imprac
tical in some states, the demonstration effect of "light
house districts" might be lost, a central bureaucracy
might result, local community participation might decrease,
and the public schools would be forced into competing with
other state services (including universities and community
colleges) for funds (Benson, 1975a; P.D.K. Commission,
1973) .
The traditional foundation program system has wide
spread implementation, but the Phi Delta Kappa Commission
has identified substantial arguments against its efficacy.
First, some states have kept the foundation level so low
that local wealth becomes a dominating factor in educa
tional expenditures. Second, without property equaliza
tion, state funds tend to flow to wealthy districts with
low property valuations and low tax rates more than to less
affluent districts with high property valuations and high
tax rates. Third, the system tends to lag behind in an
inflationary economy due to the slow reaction time of
state legislatures to spiraling expenditures. Fourth, the
system makes no allowance for self-imposed tax effort at

75
the local level; no matter how much a district is willing
(or required) to tax itself, the state will provide funds
to the foundation level. Fifth, there are generally no
allowances for cost differentials for different types of
pupils or for various geographical areas.
Equalized local initiative systems are generally of
three types: (1) open-end equalized percentage matching,
(2) percentage equalization of a foundation level, or
(3) district power equalization. In most cases, the
rationale is reward for effort (Coons, Clune, and Sugarman,
1970; Mort and Reusser, 1951). However, such practices
may be counterproductive to equalization and to social
goals (Benson, 1975a; P.D.K. Commission, 1973). The result
might well be more social and geographical stratification
as different districts seek their desired tax levels. In
addition, there is no guarantee, other than legal minimum
tax rates, that local decision-makers will opt for expendi
ture levels adequate to support quality education. Other
drawbacks are lack of attention to municipal tax overbur
den, stimulation of property taxation (forcing more regres-
siveness), forcing municipal services into competition with
education, and financial reward of inefficient high-cost
districts (Benson, 1975a; P.D.K. Commission, 1973).
The Phi Delta Kappa Commission (1973) has announced
a preference for a combination of the foundation system
76
and equalized local initiative similar to those systems
operated in Utah, Florida, and Kansas. The basis for the
recommendation is that the strengths of each model offset
the weaknesses of the other. The most workable alignment
would be provision of a foundation program funded at a
high level and a local initiative system which is "short
and flat"; i.e., that encourages local interest and effort
but not inequity. The state-defined high-level foundation
program would ideally be based upon the needs of children
and would provide for fiscal neutrality among districts.
At the same time, some local initiative would be retained,
but it would not be enough to allow a child's education to
become a function of the tax effort or ability of the
local district.
Grubb (1974) analyzed the alternative solutions
adopted in eleven states in 1972 and 1973 and discovered
five major approaches to equalization: (1) district power
equalization, (2) increased state financial aid, (3) re
strictions on tax rates and expenditure levels, (4) utili
zation of educational need and cost differentials, and
(5) improved property tax administration. Nine of the
eleven states studied adopted some type of district power
equalization, although one state (Florida) later rescinded
its power equalization approach and moved toward full
state funding. In almost all cases the states adopting
77
power equalization approaches retained diverse forms of
non-matching aid as well as the matching aid provided
under DPE. Most states also included save-harmless pro
visions for wealthy districts, and only one state (Maine)
had a recapture provision, although Wisconsin was slated
to implement recapture provisions in 1977-1978 (Grubb,
1974).
Grubb (1974) also found that all eleven states made
radical increases in state aid, an action which would have
reduced wealth disparities to some degree under almost any
school finance system. The fact of increased expenditures
may perhaps be the most significant action taken by this
group of legislatures, for Grubb (1974) predicted failure
for their short-circuited (no recapture) district power
equalization schemes. In regard to restrictions on tax
rates and expenditure levels, those states employing such
provisions all included allowance for voter overrides, a
counterproductive element in the equalization effort. Six
states added educational need differentials (weighted
pupil approaches), but the adjustments were often trivial.
The Florida plan included a correction factor for cost of
living differences, while both Colorado and Michigan took
municipal overburden into account. Three states central
ized property tax administration to provide for uniform
assessments, and one state (Michigan) included a "circuit

78
breaker" provision to allay the regressivity of the
property tax.
Grubb (1974) noted three weaknesses in school finance
reforms in the eleven states studied. First, the lack of
recapture under all but one power equalization scheme was
contrary to principles of equalization. In Illinois, DPE
was optional for other than wealthy districts, with
wealthy districts remaining on the foundation program;
this distinction did reduce expenditure disparities, but
local district wealth remained a distinction between dis
tricts. Second, the allowance of voter overrides of tax
rate limitations encouraged richer districts to override
and to spend more money. Such allowances only served to
preserve distinctions between wealthy and poor districts
since poor districts could not override expenditure limits
and spend resources they did not have available. Third,
the inclusion of save-harmless clauses clearly limited
achievement of equity and provided for dual finance sys
tems in the states (one system for rich districts, another
for poor districts). However, such provisions were, and
still are, a political necessity and justifiable in terms
of providing smooth transition to a new system of state
aid.
Some crucial issues have emerged from recent
attempts at solutions to equalization. One issue has been
79
the lack of reliable indices to determine the fiscal
inputs needed for education of the handicapped, vocational
education, compensatory education, education of the gifted
and talented, etc. Most measures have been intuitive, so
the problem provides fertile ground for the seed of
research relative to products achieved from various inputs
(Benson, 1975a; Grubb, 1974; Burrup, 1974). Still another
issue has been the equalization of revenue for debt ser
vice and construction. Grubb (19 74) found that states
who attempted such equalization took three basic stances:
(1) equalization through a separate DPE schedule, (3) equal
ization through the regular DPE formula, and (3) full state
funding of capital outlay. Burrup (1974) has emphasized
the need for such equalization to eliminate local wealth
as a factor in provision of physical facilities.
A third issue has been municipal overburden, or the
provision of school finance "breaks" to urban districts
with high tax rates for non-school purposes. Benson (1975a)
has illustrated that lack of allowance for municipal over
burden, besides straining the tax resources of cities,
might motivate the shifting of many school services (e.g.,
libraries, health services)into the public sector. Con
versely, provisions for municipal overburden might have the
effect of shifting such services from the public sector
into the schools. Aid for municipal overburden may take
80
several forms, but is of two general types--direct aid to
overburdened districts or reduced chargebacks against
foundation program funding (Benson and Shannon, 19 72).
A fourth issue, price variations, is another on
which data are lacking. Only one state, Florida, employs a
price index factor at present (Grubb, 1974). However,
studies are currently being conducted in Ohio and Michigan;
the "cost of doing business" index being prepared in Michi
gan is expected to contain about thirty variables based on
regional location and size of district (Education U.S.A.,
1976).
A fifth issue, equalization of factors other than
district property wealth (e.g., income), has received
scant attention in recent years. Part of the cause is no
doubt an overreaction to the discrediting of economic
indices in various states, including Texas. Moreover,
since most school districts have as their only source of
revenue the local property tax, many school finance
theorists suggest that measures other than taxable valu
ations are irrelevant (Johns and Morphet, 19 75). However,
a full state funding system, or similar system, which
allows some local leeway but depends upon state income,
sales, or value-added taxes without recourse to property
taxes would need rational measures of other types of
wealth available in various districts.

81
In effect, while state legislatures have sought
means to equalize educational expenditures in recent
years, they have done so in less than comprehensive
fashion. For example. Bean (1974) found that school
finance reform was taking place in nearly every state but
that efforts were being hindered by failure to alter tax
laws, by political opposition to change, and by lack
(either real or perceived) of financial resources. Never
theless, changes have included rapid escalation of the
amounts of state aid to schools and widespread develop
ment of sophisticated state aid formulas. These formulas
have been presented and analyzed by Grubb (1974) and the
Education Commission of the States (1974).
In most cases, alternative solutions to equaliza
tion of educational expenditures will be affected by the
philosophy of the citizens or legislators of a given state.
In many cases, such a philosophy has been lacking as a
precedent to change (Johns and Morphet, 1972; 1975).
Johns and Morphet (1972, 1975) have analyzed the relation
ships between values and beliefs and school finance models,
reaching some cogent conclusions: (1) if the citizens
believe that educational opportunities should be completely
equalized financially, they will prefer a complete state
support model or a completely state equalized model;
(2) if they believe that children have varying needs, they

82
will desire necessary cost differentials to that end;
and (3) if the citizens believe that educational oppor
tunities should be substantially equal, but districts
should be left with some local leeway, they will prefer an
equalization model with some leeway provisions, with less
equalization provided as local leeway increases.
Alternative solutions to equalization of public
school finance, then, are varied and diverse. However,
basic equalization plans observed among the states include:
(1) flat grants, with numerous variations; (2) foundation
program systems, with myriads of variations; (3) equalized
local initiative programs, including equalized percentage
matching, percentage equalization, and district power
equalization; (4) various combinations of the above; and
(5) full state funding, or a variant of full state assump
tions (Tron, 19 76). As shall be observed in the Review
of Related Research below, and in Chapter IV, these ele
mental plans have varying effects upon equalization; that
is, they all equalize to some extent, but some are more
equalizing than others. Differing sets of circumstances
in different states may dictate the most appropriate plan
or combination of plans (Johns and Morphet, 1975).
Review of Related Research
As an integral satellite function of the National
Education Finance Project, Johns and others (1971a) studied
83
eighteen commonly-utilized models of state support for
education. The various models, including flat grant
models, Strayer-Haig equalization models, percentage
equalization models, and a complete local support model,
were applied to the districts of a hypothetical proto
type state. Results of the study indicated that models
creating the greatest measures of equalization were, in
order of most equalizing: (1) full state support model;
(2) Model II-C, a Strayer-Haig model similar to Model
Three of the dissertation; (3) Model V-B, likewise a
Strayer-Haig equalization model similar to Model Three
(with a state tax rather than a chargeback); (4) Model
V-A, again similar to the two indicated immediately above;
and (5) Model IV-B, a flat grant model similar to Model
Five of the dissertation. According to research findings,
the relative ranks of the dissertation models would be:
(1) Model Three, (2) Model Five, (3) Model Four, (4) Model
Two, and (5) Model One; no district power equalization
model was tested by N.E.F.P. (Johns and others, 1971a).
In related studies and reports generated by N.E.F.P.,
Johns and others (1971a; 1971b; 1972) and Johns and Mor
phet (1972) discovered generalizations cogent to the
research undertaken and reported in Chapters III and IV
below. Among the findings, and their relationship with
the dissertation models, are:

84
1. Complete equalization is attained only under: (a) full state funding, or (b) an equalization model which requires districts to contribute the full legal limit of local taxes to the cost of the foundation program. (See Model Three for an approximation of the latter principle.)
2. As the percent of unequalized local revenue is increased, the possibility of equalization decreases. (Compare, for example. Models Two and Three.)
3. State funds distributed by any model provide for some equalization, but some finance models create more equalization than others. (Compare, for example, the Dummy Model with any other research model.)
4. Flat grant models provide for the least equalization of all support models. (See Model One in comparison with the other research models in Chapter IV.)
5. As full state funding is approached, the differences between the equalizing potential of flat grant models (compare Models One and Five) and equalization models (compare Models Two and Three) begin to disappear.
6. A state support model that provides incentives for increasing local taxes by increasing state funds in proportion to increased local tax effort (see, for example. Model Six) tends to disequalize educational opportunities in a state because educational opportunities for children are made dependent upon the willingness of parents or school boards to vote for local taxes.
7. Equalization models which provide for necessary cost differentials (see Chapter I) and for differences in local wealth (all research models except Model One) are the most efficient models for equalizing financial resources in states.
Simler (1973) compared the available revenue per
pupil in the Iowa public schools for 1971-1972 with that
85
available from models developed by the National Education
Finance Project. The purpose of Simler's research was to
develop a financing plan that would tend to equalize
available revenue per pupil in all districts in the state
of Iowa. Simler followed the N.E.F.P. research design,
utilizing a systematic sample of 31 of Iowa's 452 school
districts, and concluded that it would be necessary to
reduce the impact of the property tax in Iowa if equaliza
tion were to occur in terms of expenditures per student.
Horie (1974) designed a similar study to determine
a more equitable method of financing education in the
school districts of Arizona as they were organized in
1971-1972. Horie studied six plans and used the variance
created from application of the models as a method of
analysis. His principal conclusions were: (1) that all
districts should be required to levy the same tax rate,
with surplus funds recaptured by the state; (2) that if a
specific local rate were not required, the tax rate
needed to qualify for state aid should be low (as in the
Strayer-Haig-Mort theories); and (3) that ancillary and
some educational services should be provided by coopera
tive agencies larger than a single school district. Horie
(1974) also found that a plan calling for six regional
unified districts created the least variance but required
the highest tax rate.
86
Jordan and Alexander (19 72) analyzed various alter
native models relative to their constitutionality in terms
of judicial review in the early 1970s. They applied three
criteria: (1) a state support program is unconstitutional
if it makes the quality of a child's education a function
of the wealth of his district; (2) differing costs for
differing groups of pupils with particular needs would be
allowable; and (3) the concept of the pupil's right to
equal access to dollars must be present for a model to be
constitutional. The authors investigated the constitu
tionality of five school finance models: (1) complete
local support, (2) flat grant model, (3) Strayer-Haig
equalization model with high local leeway, (4) Strayer-
Haig model with low local leeway, and (5) complete state
support model.
Jordan and Alexander (19 72) found that a complete
local support model is unacceptable because locally avail
able revenue is totally dependent upon district wealth
rather than the wealth of the state. Although revenue
variations are not as great under a flat grant model, such
a model cannot meet the criteria listed above. A Strayer-
Haig model with high local leeway comes closer to providing
equal access to dollars than the two models previously dis
cussed, but the variance of available revenue is too great
to meet the equal access test. A Strayer-Haig model with

87
a small amount of local leeway does not meet strict tests
of equal access to dollars, but it permits only slight
variance; therefore, it probably would be acceptable. A
complete state support model meets all the tests estab
lished by the courts.
Related research, then, provides some indication of
the potential results of the models under consideration in
the dissertation, with the exception of the district power
equalization model. However, Coons, Clune, and Sugarman
(1970) and Guthrie (1975) have established the efficacy of
such a model in equalizing expenditures, and the model
generally meets the tests of constitutionality. The six
research models are representative of: (1) district power
equalization, (2) flat grant models v/ith and without
equalization features, (3) percentage equalization approach,
and (4) Strayer-Haig-Mort models with and without signifi
cant local leeway. As pointed out in Chapter I, a full
state funding formula was not tested through research since
the results of such a model (equal expenditures) are
readily apparent.
Summary
The history of public school finance in Texas since
1876 is presented as a story of slow development marked by
two important occurrences, the Gilmer-Aikin Law of 1949

88
and the Rodriguez case of 19 71. The Gilmer-Aikin Law
established a minimum foundation program in the state in
the mold of Strayer-Haig-Mort theories of school finance,
and the Rodriguez case emphasized the inequities of the
eventual arrangement in Texas. The review of literature
includes discussions of: (1) the development of concep
tual theories of state support of education, (2) the legal
aspects of public school finance, and (3) alternative
solutions to equalization of public school finance. The
review of related research refers specifically to implica
tions for the models studied in the dissertation, and the
dissertation models are viewed as representative of models
in the literature of school finance and actual practice in
many states.

CHAPTER III
METHODS AND PROCEDURES
The research conducted in the study reported in the
dissertation was pointed toward comparing the relative
impact upon equalization of educational expenditures of
six models of public school finance as applied to the
Texas public schools. The purpose was to identify the
plan, or plans, which tend to equalize available revenue
per pupil in a sample of Texas districts. Previous
research, as discussed in Chapter II, provided direction
in the selection of the models to be analyzed. Moreover,
the research conducted by the National Education Finance
Project (1969-1973) provided the research design of the
study.
Design of the Study
The methods employed and the procedures followed in
conducting the research are identical in most respects to
those methods and procedures suggested by Johns and Morphet
(1972) and utilized by Johns and others (1971a). The steps
may be summarized in a sequential manner.
First, the equalized value ("actual market value")
of taxable property per student in average daily attendance
(ADA) was ascertained for each school district in Texas
89
90
that operated a functional school system during the 1975-
1976 school year. Market value per ADA was computed from
actual approved property values adopted for use by the
Texas Education Agency for 1975-1976 (commonly termed "MSA
values" after Management Services Associates, the Austin-
based consultant firm which calculated the values for the
state). Attendance data used as divisors were actual data
from the Superintendents' Annual Reports submitted for the
school year 1974-1975 and utilized by the Texas Education
Agency in calculating local education agencies' Local Fund
Assignments and entitlements to per capita apportionment
for the 1975-1976 school year.
Second, the districts were arranged in order, based
upon the equalized value of property per student in ADA,
placing the district with the lowest market value per ADA
at the top of the list and the district with the highest
at the bottom. All market value per ADA figures were
roupded to the nearest whole dollar, and each district was
assigned a number, beginning with 1 (lowest market value
per ADA) and culminating with 1,095 (highest market value
per ADA).
Third, a systematic sample of fifty districts was
selected at regular intervals along the continuum created
by the rank-ordering process described above. In order to
enter into the sample, a district must have had an average

91
daily attendance in excess of 150. The rationale for this
criterion and deviations from strict systematic sampling
is discussed at greater length below.
Fourth, the amount of revenue per student in ADA was
calculated for each district in the sample for each of the
six models utilized in the study. These statistics form
the significant data points imperative to the study; that
is, comparison of the various models was based upon compu
tations utilizing the statistic "revenue per ADA."
Fifth, the variance, standard deviation, and other
descriptive statistics (see the complete list below) were
computed for each model with the aid of a computer. Again,
"revenue per ADA" available to each district in the sample
served as the central statistic. Once descriptive statis
tics were available for all six models, comparisons became
feasible.
Sixth, the variances and standard deviations for each
of the six models were compared to determine which model
creates the least amount of variance and, hence, the great
est m.easure of equalization.
The Models
For research purposes all six models utilized in the
study were manipulated to generate the same approximate
amounts of total state aid, total local revenue, and total

92
revenue from both state and local sources. In all models
except Model One, a Flat Grant Model, "recapture" provi
sions were included in computations of revenue per ADA.
Not only was the "recapture" idea necessary in controlling
the total amounts of revenues, but it is also considered
necessary to sound equalization policy (Grubb, 1974).
Model Three was selected as the representative model to
which state aid, local revenue, and total revenue per ADA
statistics would conform for each model.
The actual total of Foundation School Program aid
received by the fifty sample districts during the 1975-
1976 school year was $221,985,000 (Texas Research League,
1976). In Model Three state aid totals $217,485,142; local
revenue totals $284,632,169; and total revenue amounts to
$502,117,311. Comparisons of state, local, and total
revenue figures of all models appear in Table 1.
Model One
Model One is a Flat Grant Model entailing a flat
grant of $536.18 per ADA (per pupil in average daily atten
dance), yielding state support totalling $217,485,860
($536.18 X Total Sample ADA of 405,621). A local tax rate
of ten mills is allowed above the flat grant allocation.
It is assumed that al'l districts in the sample levy the
legal limit; e.g., in the poorest district in the sample

93
TABLE 1
STATE, LOCAL, AND TOTAL REVENUES GENERATED FROM THE RESEARCH MODELS
Mode 1 State Revenue
Local Revenue
Total Revenue
Model One
Model Two
$217,485,860 $2 84,632,168 $502,118,02 8
Model Four
Model Five
Model Six
Dummy Model
217,496,153
Model Three 217,485,142
217,379,382
217,505,826
215,328,931
-0-
284,632,158
284,632,169
284,632,168
284,632,168
284,514,939
$500,895,757
502,128,311
502,117,311
502,011,550
502,137,994
499,843,870
$500,895,757
a local tax rate of ten mills yields $139.05 per ADA in
revenue ($1.00 per $100 x Market Value Per ADA of $13,905).
Property values are equalized, utilizing Market Value Per
ADA as a statistical reference point. Since no chargeback
provisions are included in the model, there is no recapture
of local revenue by the state.
Model Two
Model Two is a Strayer-Haig-Mort Equalization Model
entailing a foundation program allocation of $746.70 per
ADA less a three-mill required levy considered as a charge
back against state aid; i.e., as a "local fund assignment."
94
In districts where revenue from the required local levy
exceeds $7 46.70 per ADA, the state recaptures the excess.
A local leeway tax of seven mills is allowed above the
foundation program allocation. It is assumed that all
districts in the sample levy the maximum allowable tax
rate; e.g., in the poorest district in the sample a local
tax rate of seven mills yields $97.34 per ADA in revenue
(70<: per $100 x Market Value Per ADA of $13,905). Prop
erty values are equalized, utilizing Market Value Per ADA
as a statistical point of reference. Model Two is similar
in some respects to the Foundation School Program alloca
tion scheme utilized in Texas in 1975-1976; e.g., the
three-mill chargeback.
Model Three
Model Three is a Strayer-Haig-Mort Equalization
Model entailing a foundation program allocation of
$1,097.49 per ADA (per pupil in average daily attendance)
less an eight-mill chargeback, or "local fund assignment."
In districts where the required local levy generates
revenue in excess of $1,097.49 per ADA, the overage is
recaptured by the state. A local leeway tax rate of two
mills is allowed above the foundation program allocation.
It is assumed that all districts in the sample levy the
maximum rate; e.g., in the poorest district in the sample
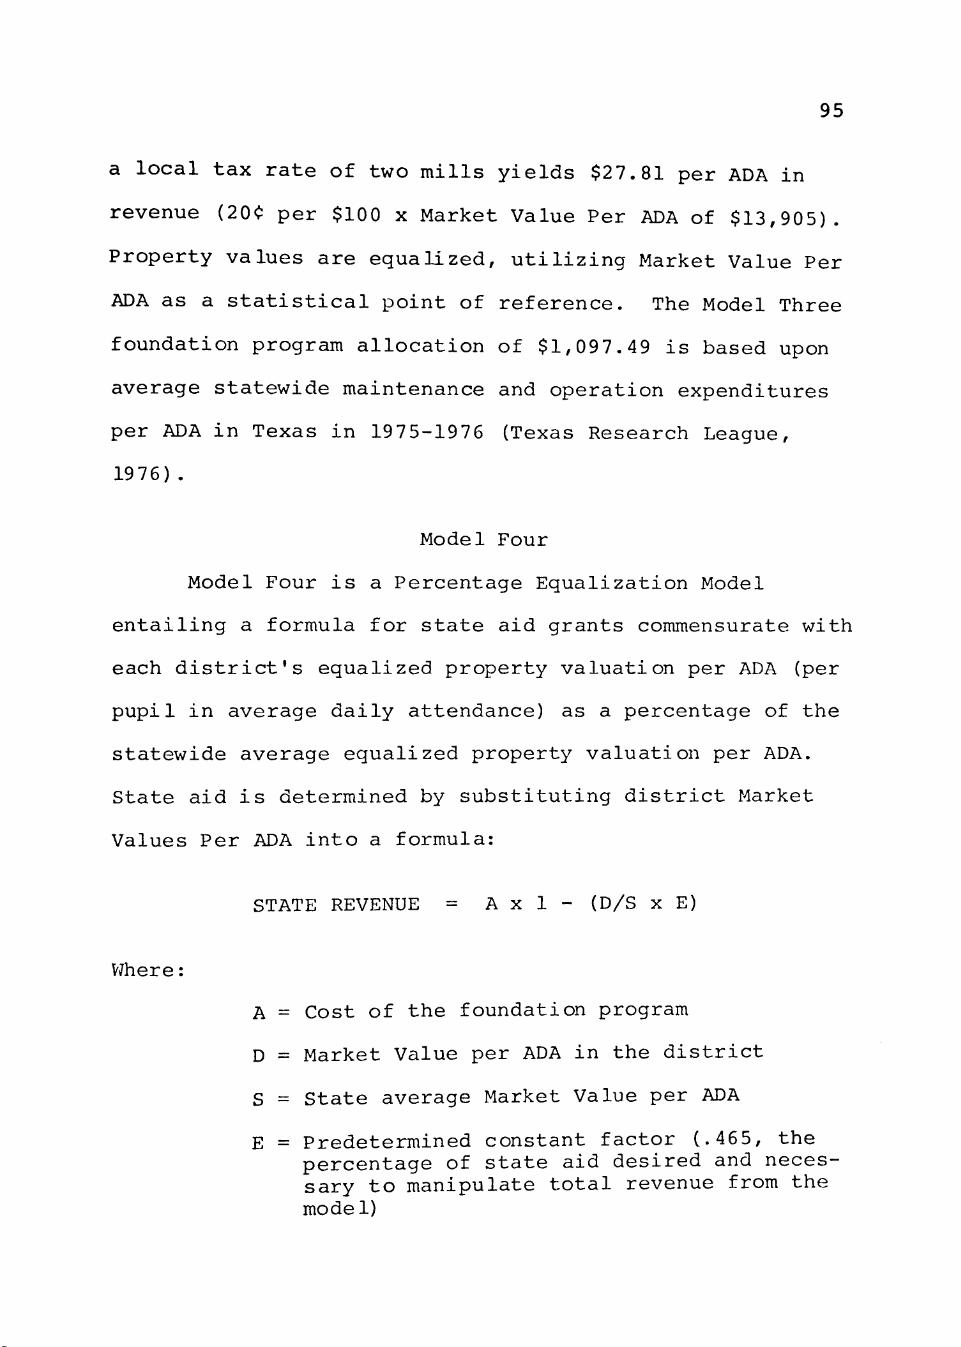
95
a local tax rate of two mills yields $27.81 per ADA in
revenue (20<;: per $100 x Market Value Per ADA of $13,905).
Property values are equalized, utilizing Market Value Per
ADA as a statistical point of reference. The Model Three
foundation program allocation of $1,097.49 is based upon
average statewide maintenance and operation expenditures
per ADA in Texas in 1975-1976 (Texas Research League,
1976) .
Model Four
Model Four is a Percentage Equalization Model
entailing a formula for state aid grants commensurate with
each district's equalized property valuation per ADA (per
pupil in average daily attendance) as a percentage of the
statewide average equalized property valuation per ADA.
State aid is determined by substituting district Market
Values Per ADA into a formula:
STATE REVENUE = A x 1 - (D/S X E)
V7here:
A = Cost of the foundation program
D = Market Value per ADA in the district
S = State average Market Value per ADA
E = Predetermined constant factor (.465, the percentage of state aid desired and necessary to manipulate total revenue from the model)
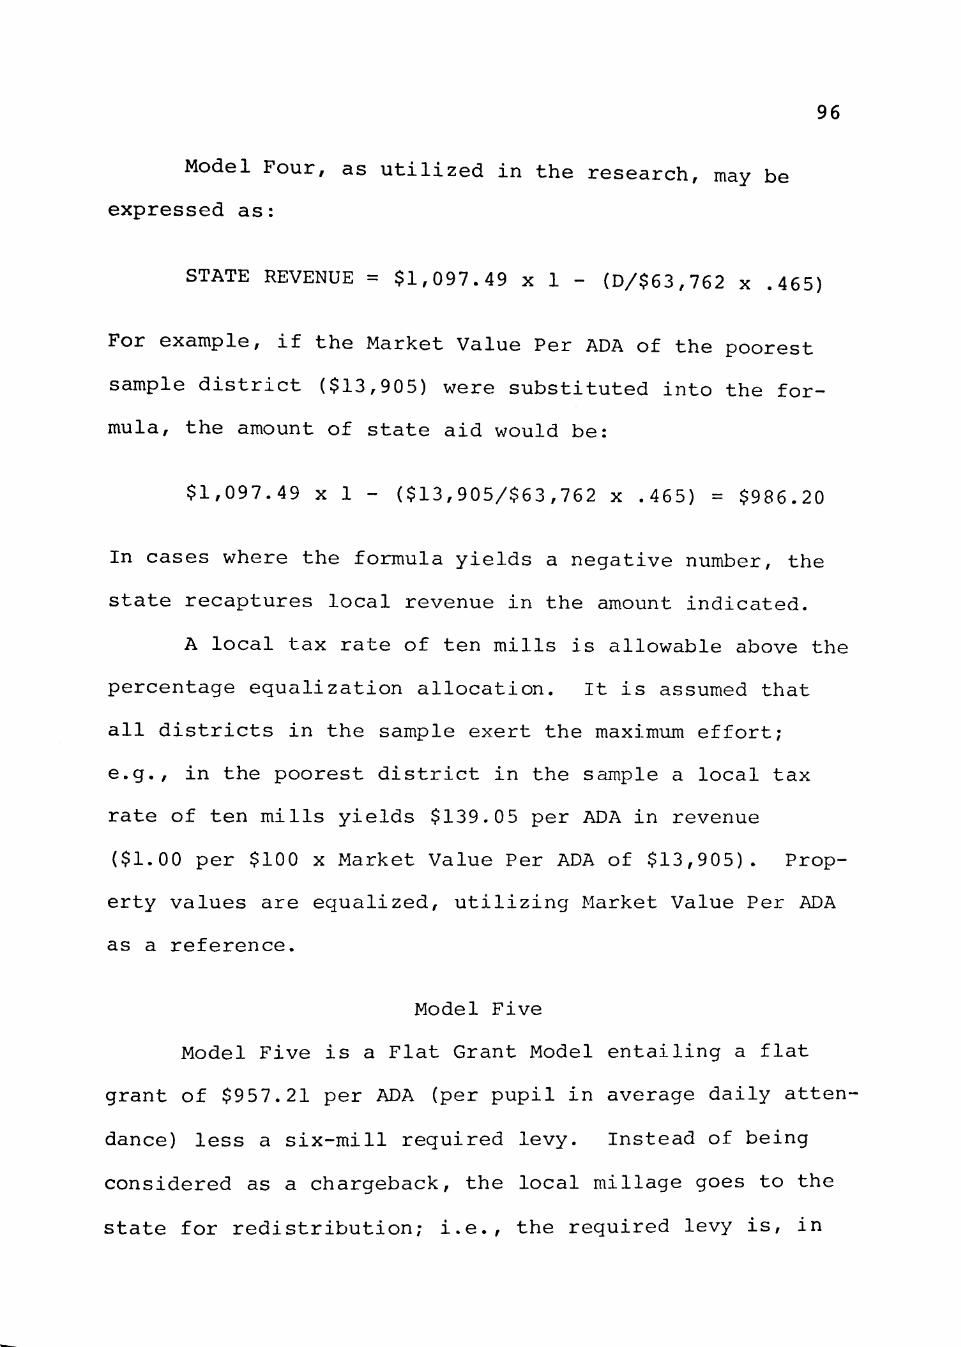
96
Model Four, as utilized in the research, may be
expressed as:
STATE REVENUE = $1,097.49 x 1 - (D/$63,762 x .465)
For example, if the Market Value Per ADA of the poorest
sample district ($13,905) were substituted into the for
mula, the amount of state aid would be:
$1,097.49 X 1 - ($13,905/$63,762 x .465) = $986.20
In cases where the formula yields a negative number, the
state recaptures local revenue in the amount indicated.
A local tax rate of ten mills is allowable above the
percentage equalization allocation. It is assumed that
all districts in the sample exert the maximum effort;
e.g., in the poorest district in the sample a local tax
rate of ten mills yields $139.05 per ADA in revenue
($1.00 per $100 x Market Value Per ADA of $13,905). Prop
erty values are equalized, utilizing Market Value Per ADA
as a reference.
Model Five
Model Five is a Flat Grant Model entailing a flat
grant of $957.21 per ADA (per pupil in average daily atten
dance) less a six-mill required levy. Instead of being
considered as a chargeback, the local millage goes to the
state for redistribution; i.e., the required levy is, in

97
effect, a state property tax. In cases where local
revenue from a six-mill levy exceeds $957.21 per ADA, the
amount above $957.21 has the same effect as in a recapture
provision. A local rate of four mills is allowed above
the six-mill required levy and flat grant allocation. It
is assumed that all districts in the sample levy the legal
limit; e.g., in the poorest district in the sample a local
tax rate of four mills yields $55.62 per ADA in revenue
(40<: per $100 x Market Value Per ADA of $13,905). Property
values are equalized, utilizing Market Value Per ADA as a
statistical point of reference.
Model Six
Model Six is a Power Equalization Model with identi
cal local tax efforts resulting in identical revenue per
ADA (per pupil in average daily attendance). The state
receives the local revenue in excess of guaranteed state
aid; i.e., the state recaptures the difference between
local revenues generated by the selected tax rate and the
state guaranteed amounts for the given rate, if an excess
occurs. The state-guaranteed revenues for given tax
efforts, the number of districts selecting each tax rate,
and the amounts of revenue per ADA for each mill of tax
effort appear in Table 2. It should be noted that "kinks,"
points of declining revenue per ADA per mill of effort,
occur above the ten-mill level.

98
TABLE 2
GUARANTEED REVENUE FOR GIVEN TAX RATES, NUMBER OF DISTRICTS SELECTING, AND REVENUE PER ADA
PER MILL OF EFFORT, MODEL SIX
T -,11,r c n -i- ^ Mn,r«K ^ ^ Guaranteed Revenue Per Locally-Selected Number of „ ,^^ ^ „-TT
r„ - „ ^ r. ^ • Revenue ADA Per Mill Tax Rate Districts Per ADA of Effort
8 mills 6 $ 990.32 $123.79
9 mills 9 1,114.11 123.79
10 mills 25 1,237.90 123.79
11 mills 5 1,349.31 122.66
12 mills 2 1,449.58 120.80
13 mills 1 1,539.82 118.45
14 mills 1 1,621.04 115.79
15 mills 1 1,694.14 112.94
The total amount of state aid generated in Model Six
is more difficult to determine than in the other models
since the selected tax rates would determine the amounts
of state outlay and concomitant recapture of local monies
in both chargebacks and recaptured revenue. For research
purposes, the rates were distributed uniformly through the
sample as illustrated in Chapter IV, Table 10. Property
values are equalized, utilizing Market Value Per ADA as a
statistical point of reference.

99
Dummy Model
The dummy model is a complete local support model
utilized for comparison purposes in order to illustrate
the wide variance among local taxing abilities of the
sample districts. A local tax rate of 17.6 mills is
allowed, generating total revenue of $500,895,757. It is
assumed that all districts in the sample levy the legal
limit; e.g., in the poorest district in the sample a local
tax rate of 17.6 mills yields $244.73 per ADA in revenue
($1.76 per $100 x Market Value Per ADA of $13,905).
Property values are equalized, utilizing Market Value Per
ADA as a statistical point of reference. Since no state
support is reflected in the dunmiy model, there is no
recapture of local revenue by the state.
The Population
The 1,09 5 school districts in Texas which operated
functional school systems during the 1975-1976 academic
year comprise the population of the study. Population
totals include 2,516,406 pupils in average daily atten
dance; total "actual market value" of $160,452,025,803; and
Market Value Per ADA of $63,762. The median Market Value
Per ADA is $67,648. The range of Market Value Per ADA is
$46,649,989 (from a low of $7,293 to a high of $46,657,282).
The interquartile range of Market Value Per ADA is
$78,928 (from $121,100 to $42,172). The mean ADA for the

100
population is 2,298, and the mean actual market value is
$146,531,530 (Texas Education Agency, 1976).
The Sample
A systematic sample of fifty districts was selected
at regular intervals along a continuum created by rank-
ordering the population from lowest Market Value Per ADA
to highest Market Value Per ADA (Johns and others, 19 71a).
In order to enter into the sample, a district must have
had an ADA in excess of 150 during the 1974-1975 school
year. The rationale for this distinction was two-fold:
(1) to exclude districts with excessively small ADA and
concomitant abnormal Market Value Per ADA (Johns and
others, 1971a), and (2) to utilize a distinction (150 ADA)
which is itself codified in law in regard to small dis
tricts (Texas Education Code, Section 17.59).
After the population was listed in rank-ordered
form, each district was assigned a number from 1 (district
with the lowest Market Value Per ADA) to 1,095 (district
with the highest Market Value Per ADA). The list was
entered at the top at a random point between numbers 1
and 22 (at district number 11) as determined from a table
of random numbers. Thereafter, each twenty-second district
was selected unless it failed to meet the criterion dis
cussed above. When a district was singled out by the
sampling technique but failed to meet the criterion, the

101
district nearest the void district in Market Value Per
ADA entered into the sample, provided that the second
district met the criterion. Exceptions may be noted in
Table 3, which includes the rank numbers for sample dis
tricts as taken from the population list.
As indicated on Table 3, the sample schools contain
a total of 405,621 pupils in average daily attendance, or
a mean ADA of 8,112. The mean ADA for the sample is con
siderably higher than the state average of 2,29 8. This
fact is no doubt due to the happenstance of inclusion of
the two largest districts in the state--Houston and Dallas--
in the sample. The total ADA of the sample represents
16.1 percent of the total state ADA even though the number
of sample districts represents only 4.6 percent of the dis
tricts in the state. Likewise, the total market value of
the sample districts ($28,463,216,838) represents 17.7 per
cent of the state total ($160,452,025,803). The mean
Market Value Per ADA for the sample is $70,172 compared to
a state mean of $63,762. The range of Market Value Per ADA
is much less in the sample ($1,508,163) than in the popula
tion (over $46,000,000) since the extreme districts have
been eliminated through sampling. However, the interquar
tile range of Market Value Per ADA is veritably identical
for the sample ($79,405) and the population ($78,928).

102
H
EH
fX4
CO
w EH
O
CO U H H CO H
w u
<:
u
4J Q)
>
Q
(D
u
u
< Q
- p
u •H J-l -P
•H Q
>
0 S
o -p en
•H
fd cu
i n a ^ c T \ o o o D r o o r o o > r ^ v o r o o ^ c N i r H i n v o L o r ^ v r ) C N i n ( N o o o r o * x > r o r ^ r o r - M ' ( N i - l ' = t r H o o ( N O r H r o v D L n M D O ' * L n o ^ c n c — i r H r o c N r o o o m f H ' ^ C N O O m v D r o o v o r o o c r * r O ' ^ c o c N O
r o o m v D o o o ( N ^ < x > r ^ a ^ o c N r o L o r - o o o c N r o v D o o o r o v x >
« ^ ^ o c N i v D r ^ t ^ r o o c N o o ' ^ o o < r > f N ' 5 r r o r H o o ( T i r * - c r > o o o r H ' ^ L O i n ' ^ i n c N O O i — i c r > r - ~ o o i r ) r o i H o o r ^ m ( N o r o r ^ r o o c A ^ O l ^ ^ c ^ J r ^ ^ o o o c T ^ o o c N • ^ a ^ v D C ^ J C J ^ ^ x ) ^ - ( N O V D l n o o c o
m ^ VD
r H r-00
r^ i n t n
• " ^
t ^ i n
KD "^r cr\
CN r-o
• ^
en H
00 00 CM
m ro o
o r-i r^
00 o CM
i H r-a^
VD CN i n
i n CO • ^
r-tn V£>
<y\ r-o^
CNJ VD 00
00 i H cr>
^ CTi H
i n V£) ro
i n <D i n
00 rH r- ro i H C7>
i n (N (N
CO r-\ ro
^ o » ^ { N L n r ^ ^ o o ^ m r ^ ^ o o o o l n ^ ^ o ^ o ^ o ^ > • ^ o ^ ~ r N o ^ r o v D o VO r H C O r H m C M C N r H » X ' r H ' « * r H c r i V D ( N " ^ ' ^ 0 0 ( N r O t ^ O O « ^ ( N CO rH CM rH iH r^
</>
c j \ r H r H ^ r H o o o o o o u 3 i n o o v x 5 c T » r o r H r ^ r H o c M o o L n r o c n i n « ^ ' ^ ' ^ o o r o o ^ r ^ * ^ v D O O U 5 r ^ < T \ r H v x ) " ^ L n L n c r » o r ^ r H v D o o ^ ^ O L n ^ ^ c M ' * r ^ » x > r - ^ o f M C M o r O ' : r r o l n o ^ ^ - l n ^ v £ ) C M o - ) v o
00 rH
CM rH
VD rH CM CM - ^
Q CO Q H CO H
M
Q Q CO CO H
o 0) u (d
0)
Q)
u 0) rH t P i H
fd o p s
Q CO H
to cn a Q
•H CO JH H QA CO > i
(U Q) rH "TU
P^ fd
Q CO H
Q CO (U H rH
rH 4-> -H rH > (L) U) > 5H 0) (U
O U o fd Pi fn
Q CO Q H CO
H Q rH CO (U ' ^ H 13 C
H
d td
o (U
cd rH u fd (D
<C fn f i j
Q CO
fd •H
13 CM I
0) u u
fd rH SH O C3 u
Q CO H
Q CO H
fd
Q CO H
0) rH rH • H >
U (U
CQ
Q CO H
Q CO H
Q ^ CO H
fd
0 0 :% en
C rH TJ O cn
T i :3
rH 0 -p o
c
C3 CO H
T i Q -H CO H
Q) Q) ^
•H
0)
Q CO H
•H T J MH C 15
C fd
rH > i 0 ^
U rH ^ •H
Q CO H
(L) U C (U JH 0
rH ^^ U fiH U CQ S En
> 1 Q -P CO H p:
0 M 0 Xi en P -P 0 Cl
:3 o u t7> tP 0 K
b • H ^:)
Q CO
Q cn CO u H 0)
> fd -H
T) Pi fd
> i CD
o u CM H
Ct o CM
r H a ^ r ^ V D l n r H O O - : i ^ ^ - ^ 0 0 ^ - r H r H V D r H . H C M r H r H C M ^ O r ^ r ^ C M O O O O O O O O O r H O O O O r H O ^ O O O O r H O O O o^Sa^o^c3^o^o^o^a^o^a^o^o^a^o^a^c7^cpa^o^c^coa^cJ^a^ i r - r - o o c o ' ^ c M f n ' ^ o o ^ c M r o L n c M - T o ^ o l n v o ^ H ^ r - o ^ S c ^ S o c N r H i n - : r o o u D C M C M ^ c o r H ' v r c o m c M ^ ' ^ o ^ c ^ r : ^ S ^ O o S c M O r H O r H O O C M O r H O ^ O O C M r H C M O r H O M
, - ^ f O L n r - c J ^ r H C M l n ^ - c y ^ r H r o l n * x » C J ^ r H ^ O L n r - - a ^ r H C M L n ^ - a ^ ^ S S P S S 5 J J o o o f - > l n r - o ^ r H ^ ^ o o o c ^ ^ l n r - o ^ - ^ ^ ' ^ ^ ^ ' ^ ° ^ J - i ; 5 r H r H C M C M r s i c M C M r o n r o r O ' ^ ' ^ - T ^ ^ i n i n
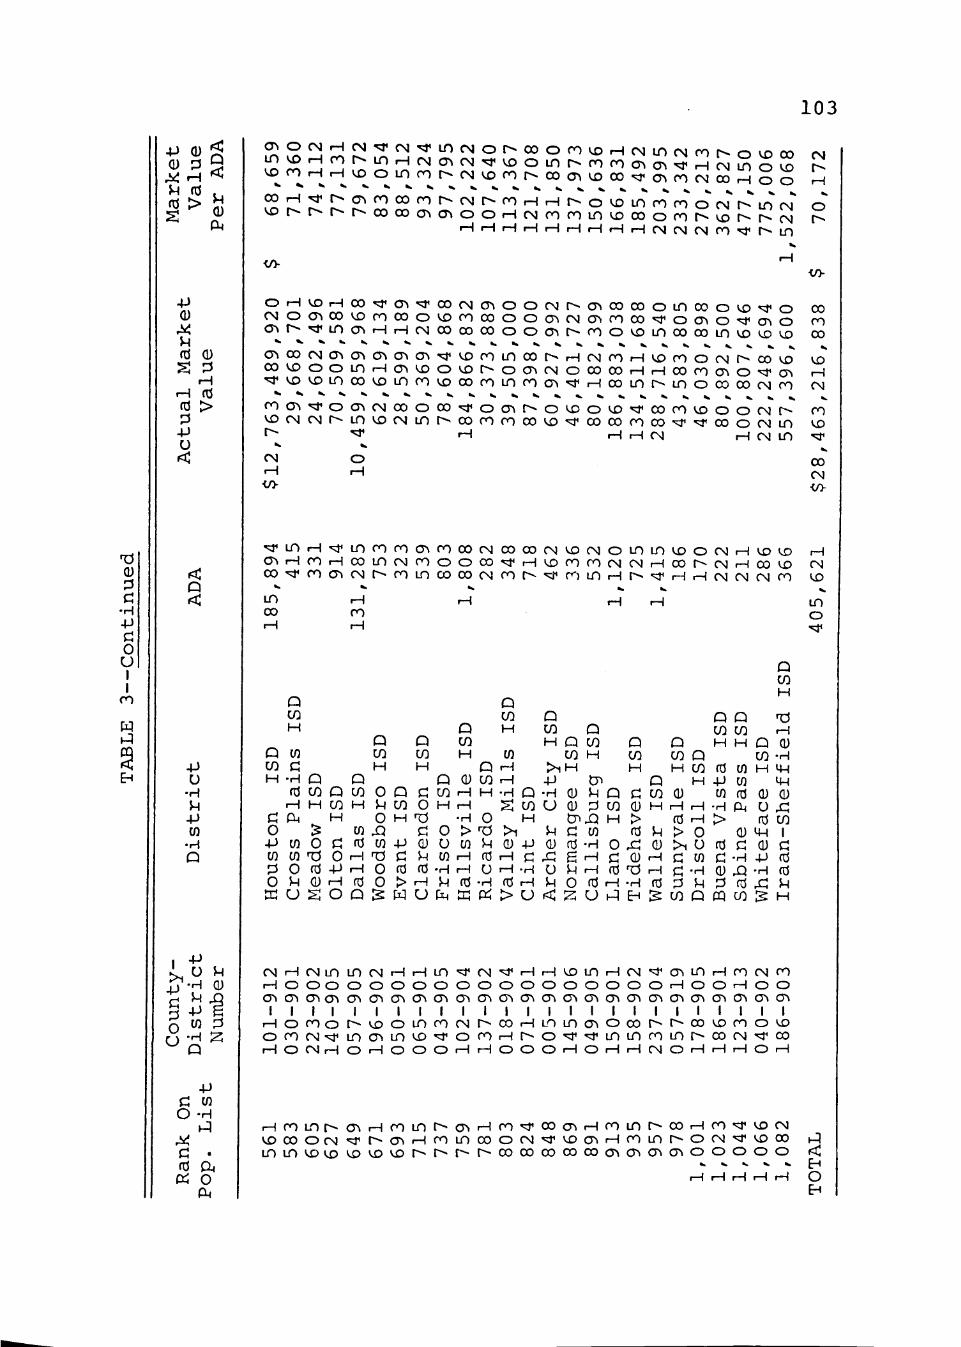
103
(U
•H •P
O U I I
cn
H
+J 0)
u (d fd >
< :
>H
CM
- P
U
fd 0)
rH rH fd td >
-P
u
<
-P
u •H U +J tn
•H Q
Lin
ty-
tric
m
ber
0 ^ 5 u-^2
-p C cn O -H
^q ^ i C . fd a, Pi 0
a<
<T» O CN r H CM ^ CM i n v^ rH ro r^ in rH - " ^ i n c M o r - o o o c o t x j r H C M i n c M o o r ^ o v o o o CM . ^ ^ _ j ^ ^ - . ^ ^ f ^ ' ^ ' ^ o i n r ^ r o r o c r > c r \ ^ r H c M i n o t ^ r-^ r o r H r H v o o i n r o t ^ c M ^ r o r - o o o ^ ^ o o ^ < y » f v i ( M o o r H o o r-I
! ^ ; i ^ ^ I ^ ^ ^ ° ° ^ ^ ^ ' ^ ^ ' - < ' - ^ ^ < = 5 ' ^ ^ ' ^ f ^ o c M r - i n c M v D r - r - r - r - o o o o c h c r > o o r H C M r o r o i n v r ) o o o f ^ r ^ v D r - - [ ^
» H i H r H r H r H r H i H r H r H C V l C N C M P 0 " 5 ^ r ^ CM
i n
</>-
O r H U D r H o o ^ < 3 ^ • > s r o o c M c ^ ^ o o c M r ^ o ^ o o o o o L n c o o ( J D ^ o C N O c s ^ o o t X ) f o o o o * ^ o o o o o o o > c M c r » r o o o r } i o c r > o ^ c r > o o > r ^ ' ^ i n c T > r H r H c s j o o o o o o o o o ^ r ^ r o o » ^ L n o o o o i n * x > ( X ) U D
r o c 5 ^ ^ o c r \ C M o o o o o ' v f o < y » r ^ o > x > o v D « ^ o o r o v o o o r v i r ^ v D C M C M r - - L n « ^ c N i n r - o o r o r o o o v £ > ' s f o o o o c o o D ' s f ^ o o o c N i n f^ "^ rH r H r H C M r H C N i n
CN
</>
o
C M r H C M i n i n C M r H f H i n ' ^ C M " ^ r H O O O O O O O O O O O
r H r H V £ > L n r H C M ' * C r > i n r H r O C M C O O O O O O O O r H O O r H O O
c^>o^<Tlcy^cT>o^o^o^cT^o^c^^cy^o^c^vCJ^o^c7^CT^a^(T^a^o^o^a^a^ i I I I I I I I I I I I
i H o r o o t ^ v o o i n r o c M t ^ o o o r o c M " < ; } ' i n o > L n « X ) " ^ o r o r H r H O C M r H O r H O O O r H r H O
I I I I I I I I I I I I I r H L O L n o ^ o o o i ^ r ^ o o v r ) r o o * x > r~« o o o
^ " " c T L n i n r o L n r - c o c N ' ^ o o r-\<Di-\r-\C^Gr-{r-\ O rH
i H r o L n r ^ c r N r H r o i n r - > c r t r H r o ' = : } ' 0 0 o ^ r H f O i n r ^ o o r H r O ' < : r * j 3 C N v ^ o o o c M • ^ ^ ^ c s ^ f H ^ O l n o o o c M ^ v D a ^ ^ H ^ O L n ^ ^ O ( N ' ^ < ^ o o L n L n v D v x > * ^ v D v D r ^ r ^ r ~ - r ^ o o o o o o o o o o c r > c n o ^ c r » o o o o o
rH rH rH rH
O
V >
00 ro 00
< y » o o r v i c r > c 3 ^ c r » c T \ c r > ' ^ » X ) r o i n o o r - r H r \ j r o r H « X ) r o o c M f ^ c o v D vo o o v £ > o o i n r H o ^ k D O * ^ r - o c r \ C N j o o o o o r H r H o o f o a \ o ^ c r v rH " ^ * j D V D i n o o < v D i n r o < x ) o o r o i n r o o ^ ' < ^ r H o o L n r - - L n o o o o o c M r o CM
ro
00 CM
• < ; 3 ' i n r H " ^ i n r o r o c r * r o o o c N o o o o c M v o c M O L n i n < ^ o c N r H > x > < . D r-i c 7 ^ r H r O r H o o L n c N r o o o c o r } < ( H ^ £ ) r o r o c N C M r H o o r ^ C N r H c o * x ) c j o O ' = : i < r o c j ^ c M t ^ r o L n o o o o c v j c o r ^ " ^ ( ^ ) i n r H r ^ ' ^ r H r H c N C s j c M c o v i
U )
00 r-\
Q CO H
Q in CO c H -H
fd i H
CJ fl^ 0 -P tn
Q CO Q H
^ 0
cn in T5 ^ 0 0 }H
fd 0)
CO H
c
r - I
ro rH
Q CO M
Q CO (H
0 u 0
in ^ fd
0 rH -P rH r-i fd
in ^ 0 0
Q CO M
-P C fd >
r-i rH rH
Q CO Q Q Q
Q M CO Q CO CO P C O H C : ) C O Q Q H H C O H in C O H C O C O Q H Q r - H > ^ M H H C O f d i n
Q C D C O r H 4-) t n Q H + J c n C : c O r H H - H Q - H 0 5 H Q C C O ( U W f d O H r H S C 0 U ( D ; 3 C 0 ( D H H r H - H C I |
n3 - H O H t n j Q H > f d r H >
c : : o > ^ > i ^ c i n f d h > o (u ( U D i n } H C D P ( L ) t d - H O ^ ( D > i U r d c : ; h i n r H f d . H { : ; . C g r H j : ; ( U r H c i n c - H f d - H r H U r H - H U M r H f d ' T J r H ^ ' H (DXJ
Q CO H
Q)
Q CO H
Ti rH
•H i p MH CD
u x: rd 4H 0) 4-J -H
r H ^ 4 f d - H f d r H } H O t d i H - H f d : : 5 > H d f d x : l i ! U S O Q : 2 H U P 4 ! i ! P : i > U r t : s U i ^ E H 3 : c O Q C Q c o IS
CO 1 C fd fd SH H
i n o " ^
< EH O EH

104
Data Collection and Tabulation
Data relating to average daily attendance, actual
market value, and Market Value Per ADA were obtained from
"Rank Order Run/Market Value Official Compilation/Ranked
on MV per ADA" (Texas Education Agency, 19 76), a computer
printout provided by the office of Information Analysis in
the Texas Education Agency. Tabulation of data generated
by the six research models was effected through utiliza
tion of a desk calculator and computer services at Texas
Tech University. These tabulations appear in Chapter IV.
Statistical Treatment and Method of Analysis
Data generated by application of the six research
models to a systematic sample of rank-ordered Texas school
districts were treated for descriptive statistics. Statis
tical computations were accomplished through utilization
of computer services at Texas Tech University and the CON-
DESCRIPTIVE computer program formulated by Nie and others
(1975). Program CONDESCRIPTIVE (descriptive statistics
for continuous variables) provided the following statis
tics: (1) mean, (2) standard error, (3) standard devi
ation, (4) variance, (5) kurtosis, (6) skewness, (7) range,
(8) minimum score, and (9) maximum score. For the pur
poses of the study, the most crucial statistic was the
standard deviation of revenue per ADA for each model since

105
the finance model (or models) which generate the least
amount of variance would be considered the most equalizing.
Summary
The methods and procedures employed in the research
are identical in most respects to those methods and pro
cedures employed in previous school finance research by the
National Education Finance Project. The population (all
1,095 districts in Texas) was listed in rank order accord
ing to Market Value Per ADA, and a systematic sample of
fifty districts was selected. The six research models and
one dummy model were applied to cogent statistical charac
teristics of the fifty sample districts. Yielded were
various descriptive statistics, including the standard
deviation of revenue per ADA for each model. The models
are described in detail and the sample districts are listed,
along with characteristics of the sample, in Table 3.

CHAPTER IV
ANALYSIS OF THE MODELS
The purpose of the research was to investigate the
effects of six alternative models for equalization of
educational expenditures in the Texas public schools.
The crucial comparisons leading to the conclusions of the
study are presented in Tables 11 and 12 below, but sin
gular consideration is given to each model. Moreover, a
dummy model based on complete local support is presented
for comparison purposes.
Dummy Model
The dummy model illustrates the wide disparity in
local property tax wealth in the districts of Texas. In
order to generate the same total revenue resultant in the
six research models, a tax rate of 17.6 mills was required.
Results obtained from the application of the 17.6-mi 11
rate to the sample districts are presented in Table 4
below. The wealthiest district in the sample may be noted
as having 109.46 times the taxable wealth (Market Value
Per ADA) as the least affluent district ($1,522,068 to
$13,905). Since no equalization feature is included in
the model, the result is an identical ratio of revenue per
106

TABLE 4
107
DUMMY MODEL—COMPLETE LOCAL SUPPORT BASED ON A TAX RATE OF 17.6 MILLS
District
Laredo Wells Ranger McAllen Apple Springs Academy Roosevelt Farmersville Aledo Fannindel Pearland Grape Creek-Pulliam Coleman Beckville Judson Cotulla Friendswood Clyde Brownfield Midland Florence Pottsboro Jim Hogg County Floydada Three Rivers Houston Cross Plains Meadow Olton Dallas Woodsboro Evant Clarendon Frisco Hallsville Ricardo Valley Mills
ADA
18,959 341 541
12,744 281 430
1,190 678 748 366
4,285 268
1,076 399
6,413 1,361 2,547
951 2,750 14,592
400 640
1,215 1,363
609 185,894
415 331 914
131,285 753 323 539 803
1,808 282 348
Market Value
(Per ADA)
$ 13,905 20,139 23,169 26,330 28,270 30,338 32,873 34,340 36,123 37,419 39,247 40,816 42,303 43,609 45,322 47,001 48,615 50,336 52,065 53,957 56,366 58,402 60,845 63,252 66,098 68,659 71,360 74,112 77,131 79,672 83,054 88,512 93,324 97,795 102,222 107,640 113,367
Total Revenue (Per ADA)
$
1-1, 1, 1 1 1 1 1 1 1 1 1 1 1 1 1
244.73 354.45 407.77 463.41 497.55 533.95 578.56 604.38 635.76 658.57 690.75 718.36 744.53 767.52 797.67 827.22 855.62 885.91 916.34 949.64 992.04 ,027.88 ,070.87 ,113.24 ,163.32 ,208.40 ,255.94 ,304.37 ,357.51 ,402.23 ,461.75 ,557.81 ,642.50 ,721.19 ,799.11 , 894.46 ,995.26

108
District
Clint Archer City Normangee Callisburg Llano Tidehaven Waller Sunnyvale Driscoll Buena Vista Sabine Pass Whiteface Iraan-Sheffield
TABLE 4-
ADA
718 462 336 532
1,120 725
1,415 186 170 222 211 286 366
Mean Revenue Per ADA
Standard Deviat
Range, Minimum
Ratio, Minimum
lion
to Maximum
to Maximum
Interquartile Range
Ratio, 25th to 75th Pctile.
-Continued
Market Value
(Per ADA)
$ 121,708 131,850 137.973 150,636 166,831 185,492 203,995 233,342 270,213 362,827 477,150 775,006
1,522,068
$ 2,410.17
$ 4,198.61
$26,543.67
1:109.46
$ 1,397.53
1:2.88
Total Revenue (Per ADA)
$ 2,142.06 2,320.56 2,428.32 2,651.19 2,936.23 3,264.66 3,590.31 4,106.82 4,755.75 6,385.76 8,397.84
13,640.10 26,788.40
9
ADA for the two extreme districts ($244.73 to $26,788.40,
or 1:109.46). Such expenditures are markedly unrealistic;
however, the fact is illustrated that Iraan-Sheffield
I.S.D. could generate 10.9 times the total revenue per ADA
as Laredo I.S.D. with an equalized tax rate of only 1.76
mills (or 17.6<: per $100).
The data derived from the application of the dummy
model reveal a mean revenue per ADA of $2,410.17 and a
109
standard deviation of $4,198.61. The full range of
revenue per ADA is $26,543.67 (from $26,788.40 to
$244.73), and the interquartile range is $1,397.53 (from
$2,142.06 to $744.53). An interquartile comparison shows
that Clint I.S.D. (seventy-fifth percentile) would receive
2.88 times the revenue per ADA than would Coleman I.S.D.
(twenty-fifth percentile). The model serves to emphasize
the difficult task of equalizing such disparate wealth;
in view of the extreme variance in local wealth, it is
evident that only extreme measures can accomplish the
task.
Model One
Model One is a Flat Grant Model which illustrates:
(1) the disequalizing effects of flat grant modes of
allocation (Johns and Morphet, 1975), (2) the equalizing
effects of some state aid in comparison to complete local
support, and (3) the equalizing effects of a tax ceiling
which limits expenditures, especially by affluent dis
tricts. Moreover, by comparing Model One with Model Five,
another Flat Grant Model, one may make generalizations
relative to the equalizing effects of larger state finan
cial input. Although the amount and extent of flat grant
allocations in Texas is not great, the inclusion of such
grants in the Foundation School Program allocation scheme
tends to disequalize (Hooker, 1972).
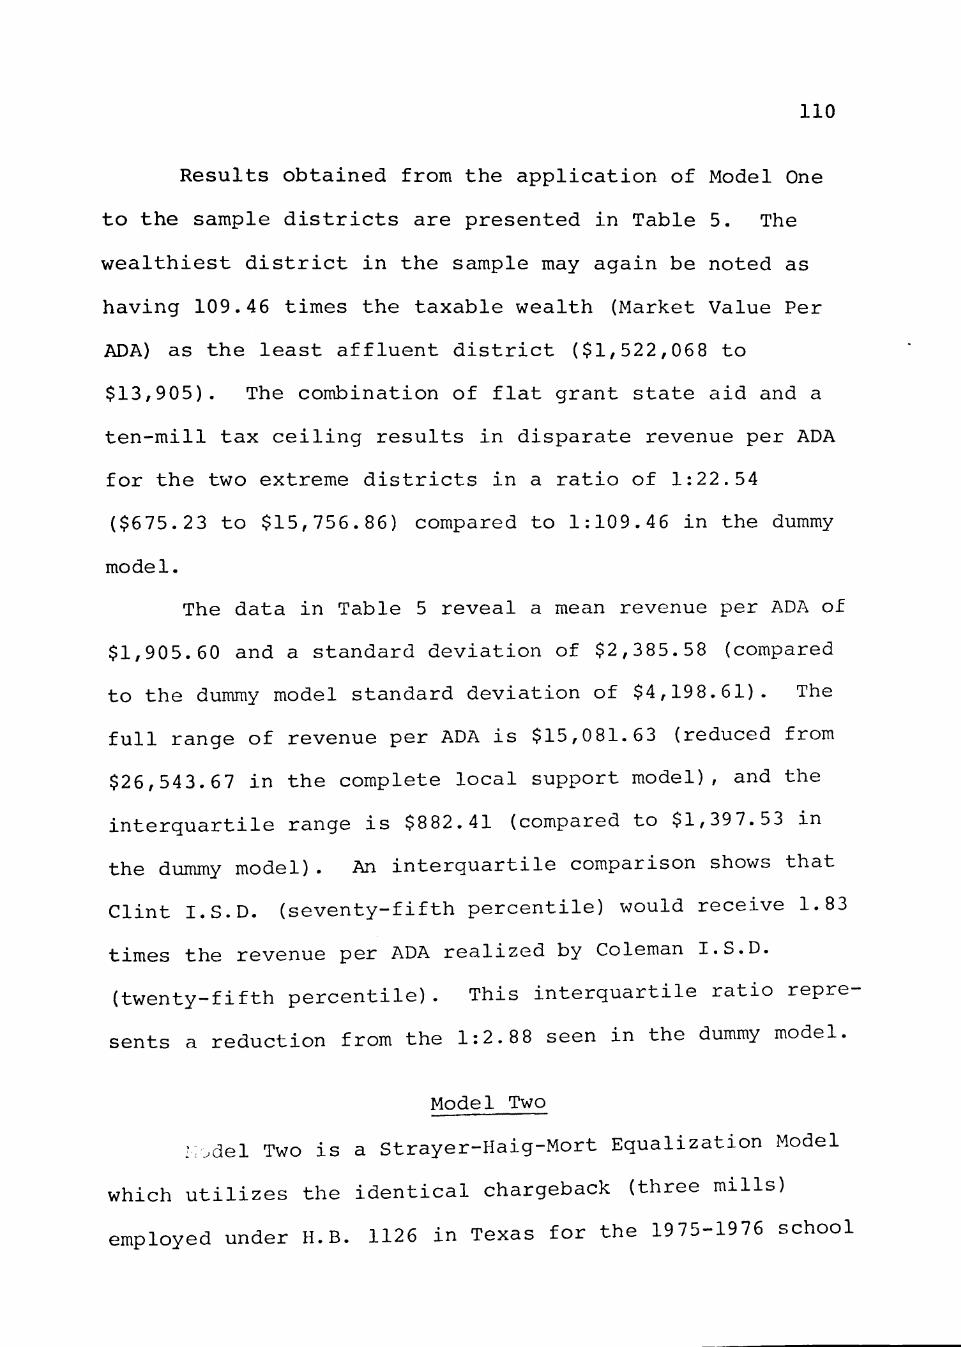
110
Results obtained from the application of Model One
to the sample districts are presented in Table 5. The
wealthiest district in the sample may again be noted as
having 109.46 times the taxable wealth (Market Value Per
ADA) as the least affluent district ($1,522,068 to
$13,905). The combination of flat grant state aid and a
ten-mill tax ceiling results in disparate revenue per ADA
for the two extreme districts in a ratio of 1:22.54
($675.23 to $15,756.86) compared to 1:109.46 in the dummy
model.
The data in Table 5 reveal a mean revenue per ADA of
$1,905.60 and a standard deviation of $2,385.58 (compared
to the dummy model standard deviation of $4,198.61). The
full range of revenue per ADA is $15,081.63 (reduced from
$26,543.67 in the complete local support model), and the
interquartile range is $882.41 (compared to $1,397.53 in
the dummy model). An interquartile comparison shows that
Clint I.S.D. (seventy-fifth percentile) would receive 1.83
times the revenue per ADA realized by Coleman I.S.D.
(twenty-fifth percentile). This interquartile ratio repre
sents a reduction from the 1:2.88 seen in the dummy model.
Model Two
M.del Two is a Strayer-Haig-Mort Equalization Model
which utilizes the identical chargeback (three mills)
employed under H.B. 1126 in Texas for the 1975-1976 school
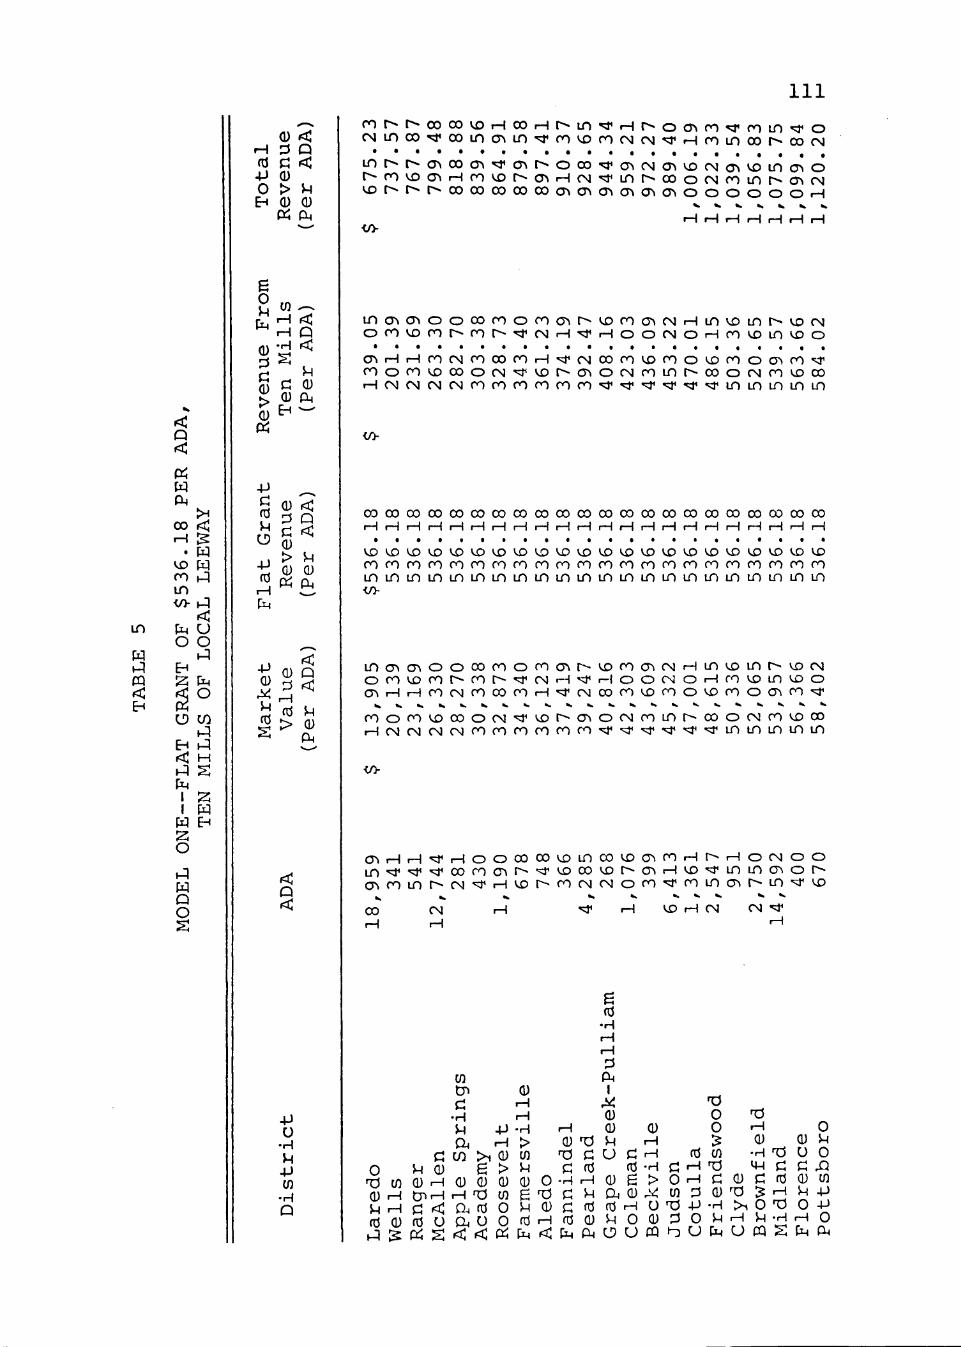
I l l
in
w PI CQ <
Q <
Pi H CM
>H
00 <J rH [2
• H ro ^q in
<:
o o t-q
EH 12; CM
o g O CO
EH h^
PI s
I I
W
O
w o o
:2 :
E H
t H fd 4->
o EH
<U <C :3 Q C < (U > 5H CD Q) P i Cl4
o u
CM
(1) 0) >
Pi
in ^-. r-i f-i
< Q
•H <
JH
(U CM
-P
fd
o -p fd rH CM
-P Q)
M U fd
(u <: ^ c Q) > Q)
Q <C U Q)
Pi Oi
Q) Q
(d > Q)
CM
Q
•P U
•H U 4J in
•H Q
r o r > - r ^ o o o o v D r H c o r H r ^ i n ' ^ r H r ^ o c r > f ^ < : } ' r o i n ^ o r M i n o o ^ o o i n c r > i n - ^ r o u D r o c M o j ' ^ f H r o i n o o r ^ o o c M
ln^>•^>•c7^ooa^"t^a^^-«ooo' ;J^cr^c^^cr>v£)CMo^vDLn(T^o ^ ~ r o v D o ^ r H r o v D r ^ o ^ r H c N " ^ ' L n ^ ^ o o o c N r o L n ^ > • o ^ c M * > D ^ < • ^ ^ ^ ^ o o o o o o o o o o a ^ c ^ ^ o ^ c J ^ c J ^ o ^ o o o o o o r H
</y
L n c T \ o > o o o o r o o r o a ^ r ^ ( ^ r o c 3 > C M r H i n v £ > i n r ^ v x ) C M o r o v o r o r - r o r - - ' s r c M r H ' ^ r H o o c M O r M r o M D i n * x ) o
< r > r H r H r o c M r o o o r O r H ' ^ C M O o r o v £ > r o o > x > r o o c r \ r O ' ^ r o o r o « ^ o o o c M " « c ^ » X ) ^ » a ^ o c N r o L n ^ - • o o o c N r o > X ) c o r H C N C M C M O j r o r o r o r o r o r O ' * ' ^ r r « ^ r ^ ^ i n L n i n L n i n
i/y
O O O O O O O O O O O O O O C O O O O O O O O O O O O O O O C O O O O O C O C X J O O C O r H r H r H r H r H r H r H r H r H r H r H r H i H r H r H r H r H H r H r H r H H
r o r o r o r o r o r o r o r o r o c o r o r o r o r o r o r o r o r o r o r o r o r o L n L n i n L n L n L n L n i n L n L n i n i n i n i n L n i n i n i n t n i n L n L n <jy
i n o > c T \ o o c o r o o r o c n r - - v £ ) r o c r > c M r H i n * x > L n r ^ u 3 C M o r o v D r o r ^ r o r - ^ c M r - H ' * r - ) o o c M O r H r o v £ > i n < j D O a ^ r H ^ H r o c M ^ o c o r o r ^ ' v r c M O o o - ) l ^ f O O V £ > ^ o o c ^ ^ r O ' ; r
r o o r o ' s D o o o c M ' ^ ' s D r ^ o ^ o c M r o L n r ^ o o o c N r o ' ^ o o r H C M O J C M C N r o r o r o r o r o r O ' ^ ' = : r ^ ' < * ^ ' < ^ i n i n L n L n i n
</>
c J ^ p _ l r _ ^ ^ ^ o o o o o o v £ > L n c o v D o ^ r o r H t ^ t H o c M O O L n ^ ' ^ ^ c o f O c r \ r ^ ' * v D o o < ^ r ^ c r > r H » ^ ^ L n L n c r » o r ^ c T i O O i n r ^ c M ^ r H V £ ) r - c o c M C v j o r o " ^ r o i n c r > r ^ i n ' ^ u 3
00 CM r-i
'^ <^ r H CM CM - ^
in t n Q> C rH
•H i-\ U +J -H a rH >
C CO > i 0) in 0 JH QJ S > ^
T ) i n 0 r H ( U ( U ( D C L ) 0 Q) r-i cr>rH rH T3 in £ T:5 h r H f U f c t j O j f d O J H f d a j f d C J C i i O O f d
0 rH
rH CD T3
T3
c •H
c a fd
c fd
r H
u fd 0)
iam
rH rH 13 Oi 1
M Q) Q)
u u 0)
Q) r-\
C rH fd -H
g > Q, Q) M fd U
c fd
TJ 0 0 ^ en
rH TJ 0 rH in
rH O 13 0 Q) :3
t j & c t ; S ' < ' < ( ^ C M < : c M a i O U P Q i ^
13 p
o u
c 0)
•H p CM
^ rH 0 0) 0) ^
•H T 5 U 0 iP d C ^
0) c fd 0 in "•0 ^ rH P +J > i 0 T) 0 -P
rH P -H rH 0 U CQ S CM CM

112
0 0
•H -P
O U I I
in
ffi <
H fd •p 0 EH
Q) < 13 Q C < 0
> u (D Q) (^ CM
O
u CM
0
0 > 0
•P
fd p
in r H r H •H
p C 0 0 CM
-p 0
M U fd
Q
0 r<: J3 Q
0
fd cc; r H ^ CM
P 0 CM
0 Q 13 <
fd >
u 0
CM
P
•P
u •H P -P in
•H Q
r o o v D i ^ o o o c r > o c N O C M r o o o o i n v £ ) o o r H ^ c r > o r o o r H * ^ ^ ^ r ^ r ^ r - r o ' ; r c ^ > ^ > • r o ' ^ r H ^ L n o o < N ^ ^ o ^ l n ^ r H r H > £ » r o
" ^ * * r-i
00 ^ r-i
r-C3 rH
CM CNJ og
<y\ ^ rsi
r^ r-CM
r^ o ro
CM ro ro
^ KD
ro
rH CM • ^
cr> KD • ^
X *
rH i n
00 i n i n
CM r-{
vo
C7 VD KD
ro i n r^
• < *
i n 00
i n r-i cr>
CM "' J' ^ O O CN
rH cr* ro
VD r^ i n
rr> vo 00
00 ro CN
r H r H r H r H r H r H r H r H r H r H r H r H r H r H r H r H r H r H C M C M C M C M C M r O
i n c M o o c r > o c N r H C M " = J ' ( N ^ i n c M o r - o o o r o k £ ) r H c M i n r M r o ^ l n o ^ l n v I 5 r H r o r - l n r H ^ ^ ^ c ^ ^ c M ' * » ^ o l n ^ ^ r o r o c ^ l O ^ • ^ ^ H
o o c M O V D r o r H r H * x > o i n r o r - - ( N * x > r o r ^ o o c y \ > x > o o " 5 3 ' < T i r o c M o r o * ^ o O r H ^ r ^ c 5 ^ r o o o r o t ~ ^ C M r ^ r o r H r H r ^ o v D L n r o r o o v D U 5 V D V D r ^ r ^ r - r - o o o o c r N c r » o o r H C M r o r o i n u 3 o o o r o r - -
r H r H r H r H r H r H r H r H r H C M C N C M
</>
o o o o o o c o o o o o c o o o o o o o o o o o o o o o o o o o o o o o c o o o o o c o c o o o r H I—I I—I I—I r H I—I I—! r H i—I i—I i—I •—I i—I r H i—I i—i i—I i—I i—I r-J i—I i—I i—I i—I
r o r o r o r o r o r o c o r o r o r o r o r o r o r o r o r o r o r o r o r o r o c o r o r o i n i n L n L n i n L n L n i n L n L n L n i n i n i n L n i n L n L n L n L n L O i n L n L o
i n C N O O C T i O C M r H C N ^ C M ' ^ L n C M O r ^ C O O r O V D r H C N i n C M r O • ^ L n c r * i n v r > r H o o r - - L n r H c N O > c M ' ^ u 5 0 L n r ~ ^ r o r o c r \ c r > ^ r H o o c N O v x ) r o r H r H < ^ o i n r o t ^ c N ^ r o r ^ o o o ^ < ^ o o " = * o ^ r o c N
O r o V£) 00 r Ko <D KO yo i-
<j>
' ^ r ^ c y \ r o o o r o t ^ c M r ^ r O i H r H r - - o v D i n r o r o o ^ ^ r ^ r ^ c o o o o ^ a ^ o o r H c M r o r o L n v x l c o o r o l >
T-ir-ir-ir-ir-ir-ir-ir-ir-iCAC^C^
L n c o c r » ' ^ L n r H « ^ i n r o c o a ^ r o o o c M O O O o c M V D C s J o i n i n v D O r H v D O O ^ r H r O r H o o L n c M r o o o o o M ' r H < ^ r o f O C M C M r H o o r - -c N m « ^ c x > ^ r o c y » C M r ^ r o i n o o o o c M c o r ^ " = ^ r o L n r H r ^ ' ^ r H r H
r-i r-{ in 00 r H
CO
> 1 -p c in in 0 P U 0
> tP fd 'H t p i 5 P 0 fd K rd 0
>1 0 S O P
r: o +J in ::3
in c
•H fd
rH CM
^ in 0 in T3 o (d
C
cn rH > i
0 rH 4J tj^ O cl ^ •'-i •'^ ^ '>^ ^ ^ P O r H S U 0 ^ ^ d l l 0 nd -H 0 , t n ^ ^ . ^ 7^
inxi c 0 >^ >^ ^ ^ ^ ^ ^ ^,t 9^ f d i n - P 0 U t n P 0 - P 0 f d - H O 4 : ; 0 > i U O r H T 5 c ; p i n r H f d r H c ; x : B ' H C 0 ^ , 5"^ - P r H O fd fd - H r H U r H - H U P r H f d T f r H ^ - H
• H r H ^ 0 P 0 r H fd 0 > r H P n 3 - H ^ - | ] H 0 f d r H . H ^ ^ H f ^ C M t H K U S O Q ^ W U [ M W P ^ > U f < 2 U K Q E H ^ C 0 Q
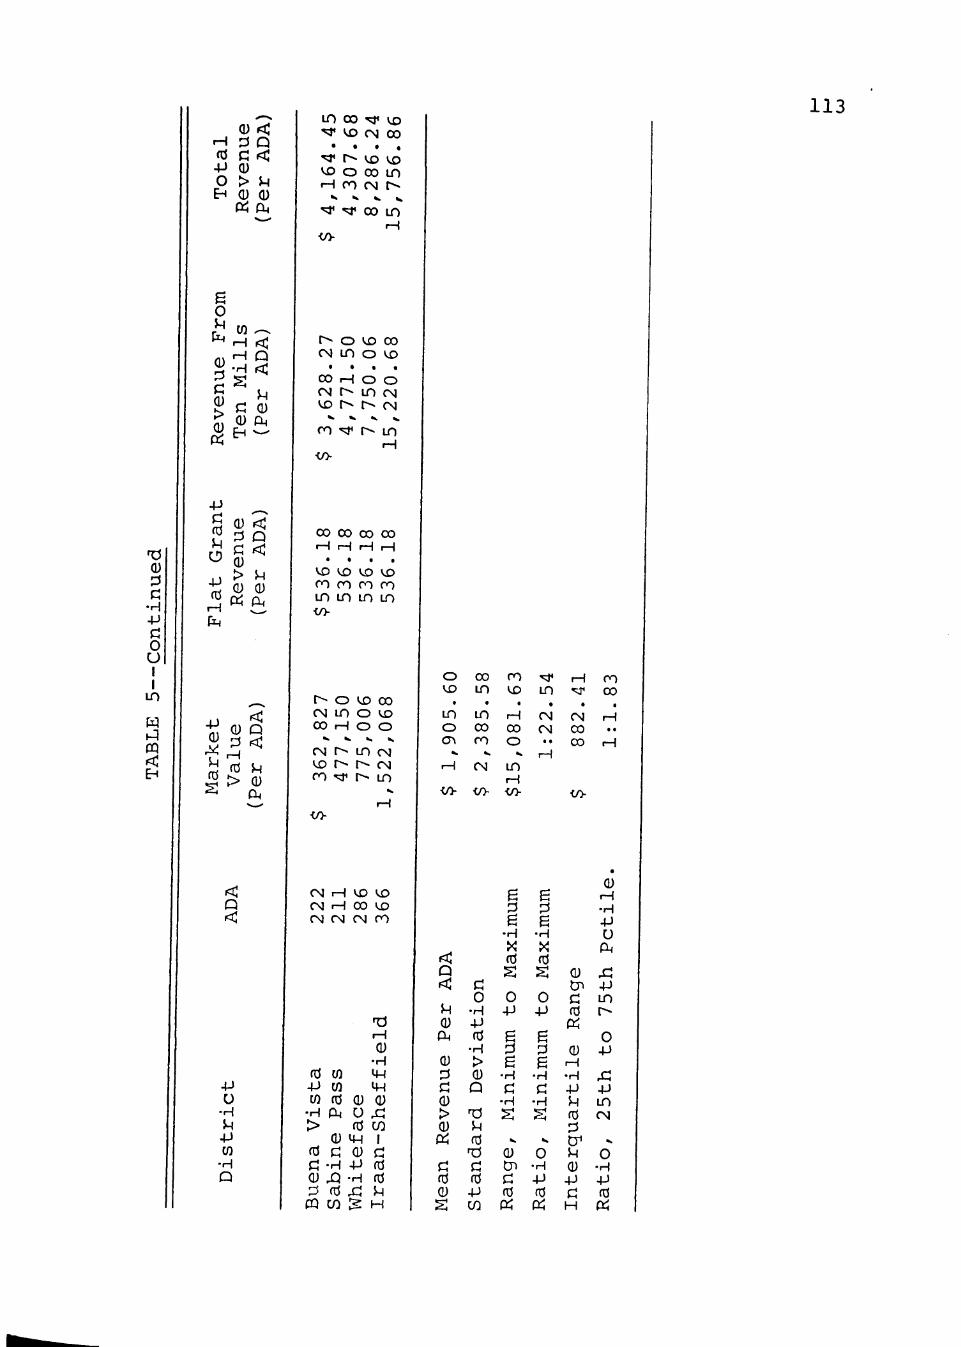
0
C •H -P
O U I I in Ci: PI PQ
r-i fd 4J o EH
0 < P Q C < 0 > P 0 0 P^ CM
B O P C M
0
0 > 0
-P
fd P
-P fd rH C M
in >-{ rH •H S C 0
< Q <:
p 0 04
0 d
< Q
c < 0 > 0
p 0
ft^ a,
-p 0
p fd
0 rH fd >
<:
Q
p 0 CM
G
-p u •H P •P
in -H Q
in 00 " r «^ ^ "^ CM 00 • • • .
^ [^ » ^ (^
^ o 00 in rH ro CN r^
*> •> S K
^ ^ 00 in rH
r^ o *X) CO CM in o »x> • • • •
00 iH O O CM r in CM ^ r^ r^ CN »« ^ ». w
CO - f r>- tn
00 00 00 CO rH rH rH rH • • • •
VD (X> V£) U5 ro ro ro ro in in in in
r o kD 00 CM in o vo 00 rH o o
^ *. ». K
CM r^ in CN »x> r^ r- CM ro M' r in
<o-
113
o 00 ro ^st* rH cn VD in IX) in ^ 00
in in rH CN CM rH O 00 00 CM CO a^ ro o
rH CM in rH
<0- </> -CO
CO
•to-
0 CM r H CM rH CM CM
fd W -P in in fd
• H Cl4 >
VX) X> 00 VX) CM ro
TJ r-i
0 •H m i p
0 0 u ^ fd CO
0 UH 1 fd c a -H 0 X!
0 c: -P fd •H fd
^ fd j:::; P (Q CO :2 H
<: Q <
p 0 CM
0 13 G 0 > 0 p^
a fd 0
s
c 0 •H -p fd
•H > 0 Q
Tl p fd
T3
c fd •p CO
B 0
axim
S 0 -p
B d B
•H C
•H S
K
0 tn a fd P
e d
axim
S 0 -p
g d B
•H C
•H S
K
0 •H -P fd c^
0 tn G fd Q^
0 rH •H •p p fd d CP p 0 -p c H
rH •H
Pet
4: -P in r-
0 +J
^ -P in CN
K
0 • H -P fd pci

114
year. Moreover, it may be illustrated that the amounts of
state aid realized by the sample districts upon applica
tion of Model Two are similar to actual Foundation School
Program state aid received by the districts in 1975-1976.
For example, Laredo I.S.D. received $13,424,500 in Foun
dation School Program aid in 1975-1976 (Texas Research
League, 19 76) ; under Model Two Laredo would receive
$13,365,715 ($704.98 x 18,959). To further illustrate
the point, Houston I.S.D. received $101,790,000 in Foun
dation School Program aid in 1975-1976 (Texas Research
League, 19 76); under Model Two Houston would receive
$100,516,600 ($540.72 x 185,894). The similarities disap
pear as the affluent end of the scale is approached since
affluent districts have excess funds over the chargeback
millage subject to recapture under Model Two. Under the
Foundation School Program such districts would not be
under a recapture provision and would still receive their
per capita apportionment from the State Available Fund.
Results obtained from the application of Model Two
to the sample districts are presented in Table 6. Iraan-
Shef field I.S.D. may still be noted as having 109.46 times
the taxable wealth (Market Value Per ADA) as Laredo I.S.D.
($1,522,068 to $13,905). However, the equalization fea
tures of Model Two (a three-mill chargeback and seven mills
of local leeway) result in disparate revenue per ADA which

115
VD
W PI
< EH
(d
O
e o p
CM
0 i< ^ Q d < 0 > P 0 0 Pi CM
in r H . - V rH < •H Q
• C P > 0 0 0 > CM p::; 0 - ^
CO 0
0 Pi
•H
I 0 0 p
0 -P fd •P
0 CO > B
O P
CM
Q < P 0 P4
- P iCf"
0 '^
u -P m < 0 ^ Q
t^ fd p § > Q)
Q
-P U
•H P -P in
•H Q
?!^S::=!l^^^°°^^^'-'^^^--'o^^ovorH o < x > o o o l n o o o o l n « x ) ^ r 3 ' o o o ^ o ^ ^ > . o o r H ^ c M l n ^ r^ 00 •^ 00 o ro
rH ' ^ <r> (x> r^ - * . « r ^ o ^ < » ^ f N < N r H r o i n r < ( T . r H ^ r H i n ^ ^ ^ ^ t ^ c o c T i o c M r o - ^ i n u D t ^ o o o ^ r H r N j ^ i n o o o o o ^ < T t c r » c r > c r v c r > a ^ o o o o o o o o o r H r H r H r H
•co- r H r H H r H r H r H r H r H r H r H
' « ^ ^ - • o O r H o ^ ^ - r H o o v D r o r o H c M * X ) l n r H O L n * x ) o v D H r o c r > r H r o o o r o i H r o o o c r v r - r - r H C M C N O o o r o " ^ r ^ i n o o
r ^ o c N ' ^ r ^ c M o o c M r H ' ^ i n k D i n r ^ o ^ o c M ' ; r r - ' < : t o o c y ^ ' ^ ^ x ) o o a ^ r H r o M * l n * x ) r ^ o o o ^ o r ^ c N • ^ l n ^ X ) r ^ c J ^ o
r H r H r H r H C N C N ( N C N C M C M r M C M r o c o r o r o r o c o m c o ' ; r
o o c o < T \ r H c r > c r > o o c o r O ' ^ ( X ) i n a \ r ^ r o o t x > c r i o r o o c r i o ^ c N r H r ^ o o * x » o v D c o - < ; j ' c > c M r ^ o o i ^ r ^ c o * > D i n c o ( x > ^
^ v o r ^ r - r H i n o o r o o o " = * c o " ^ o > L n o L n o i n o M ' t ^ r H o o o r ^ » X ) V D i n " < : r ' ^ r o c o c M C M r H r H r H o o o ^ c r > c o r ^ r -r^vo»x>vDVD*x)VD»x)vDU5^£>vx)VD«x>MDvovDLninLnLnLn
•CO-
C M C M r H o ^ r H r H c M C M r ^ » X ) " = r L n r H r o r ^ o - = : r r - f o r ^ O r H r ^ « * i n c r i o o o * X ) o r o c M r ^ ' = j ' o ^ o o c r > o o o o c M c o r H C M
r H o c r > c o ' « : j ' r H o o r o c o ( N r - c M U D O L n r H i n r H ' X > r H < T ( i n ' ? j ' » x > * x ) r ^ o o c r \ o ^ o O r H r H C M C M r o r o ' ^ ' ^ i n L n > x > ( X ) r ^
r H r H r H r H r H r H r H r H r H r H r H r H r H r H r H
l n a ^ c r ^ o o c o r o o r o a ^ ^ - « x > r o o ^ c ^ ] ^ H l n < x > l n r - < x > c M o r o v r > r o r - r o r ^ " N r c M r H " ^ r H o o c N O r H r o v £ ) L n v D O o > r H r H c o c N r o o o r o r H ' ^ C N C o r o * x > r o o * X ) r o o c r > r O ' ^
r o o o o v D O O o c M " ^ v x > r ^ o > o c M r o L n r ^ o o o c M r o < x > o o r H C M C N C N C M r o r o r o r o r o r O " ^ ' ^ ' ' ^ ' ^ ' * ' ^ i n L n L n L n L n
-c/>
0 ^ r H r H ^ r H O O 0 0 C 0 * X > L n 0 0 V D a > r 0 r H r ^ r H O C M O O i n ' ^ ^ ' * o o r o c r > r ^ ' v } ' < s D O O < x ) r ^ o ^ r H « x ) ' ^ i n L n c r > o t ^ o > i r o L n r ^ c N ^ r H * x > r ^ r o r M C M o r o ' ^ r o L n c r > r - - L n ^ » X )
00 CM "^ *X> r H CN CM -J^
n T( 0 p fd PI
tn Cn d
•H p a
0 rH rH
+J -H .H >
jn CO > i 0 in p 0 B
in 0 rH 0 0 rH CnrH rH T J rH C < ; d l fd 0 fd D Cli u
> p 0 0
-
0 cn E n3 0 P o fd
12 p: s <: <c p PH
0 rH
rH 0 13 '13 C
•H C C fd
c fd
rH P fd 0
fd •H rH rH
(^ 1
>i 0 0 0 P rH U C rH
fd -H (D B > QAQ) M
C fd
i H
0 rH in ^
fd rH U T5 P P 0 0 p
< CM & O U m ^ o u
TJ 0 "d 0 rH 0 ^ 0 0 p cn -H T i U 0 T3 MH C C X) c 0 c fd 0 in 0 T3 ^ rH P 4-)
•H > i 0 TJ 0 -P P rH P -H rH 0 CM U P3 S CM CIH

116
0 :3
•H -p
o u I I
<o
PI CQ <
rH fd -P 0 EH
0 < 13 Q C < 0 > P 0 0 Pi PA
B o p
CM
• > 0 Pi
W rH rH •H
< u
S < C 0 > 0 CO
p 0 Pq
0 0 <
0 ^
> P ^ 0 5 0
CM
• H
I 0 0 P
E H
U r< fd Q
S> < 0 Cn P P 0 fd fit
, C ^
u
I-" ^ fd P
5 > 0
-P
o • H P 4-> in
• H Q
c M v D c r > r H c M O o c M o o o o o r ^ < x ) L n o o r - < x > i n r H i n c M ^ v D < r \ c r > v x > ^ r o r o c N ' ^ » X ) ' d ' o c N c r > r M C M r H C M < X ) v x ) i n r H i n r H ' X > O r H
CM
r rH
<T> 00 rH
cy o CM
r-CN CN
KD •^ CM
i n vo CM
VD 00 CM
^ o ro
00 CM ro
vo VD ro
O^ H cr» ro ro ^
CM VD • ^
o o i n
o ' r i n
00 G\ i n
a\ CN vo rH vo t ^
H '^J' O H 00 cr>
i n • ^
o
^ r-r-i
o 00 CO
00 ro vo
r H r H r H r H r H r H r H r H r H r H r H r H r H r H r H r H r H r H r H r H C M C M C M C M
-to-
C M V o c T v r H c N O O c M O O O o o t ^ v o i n o o r ^ v D L n r H i n c M ^ v o c r ^ c y t o > r - v o v o L n r ^ o ^ r ^ c o L n c N i n i n ^ i n c T » c r > o O ' ^ c o ' ; a ' c r \ r o ^
i n c M C M o c r ^ o o m r ^ r H C T i c o ' s r L n r o r o r H c M L n ^ t ^ o o r ^ r o r H C M ' * v D o o < y » r H r o i n o o r H i n o o r H i n c 3 ^ i n c N V D i n v D < T > c N r o c r i " > * " 5 ^ ' * • 5 ^ ' < s ^ l n L n L n l n v o v D v o ^ - ^ ^ r ^ o o c T ^ < 7 ^ 0 r H C M " ^ v o o o
rH rH rH rH rH rH </>
V O ' * r H C N C M V D r H O O " = : 3 ^ V O r O C M r O O O O O O i n C O C r > r H C N C M r ^ ' ^ r H c r \ ' N r r ^ v D c o r o v D L n r H r - ' - r o o r ^ v o L n r H r ^ r - C M C N r ^ v o o ^
^ V D O O O C N ^ L n r ^ r ^ r H V O r O O r O V D r H r H C N ' = : J ' V D O ^ V D r O v o i n ' ^ ' ^ r o c N r H o c T i o o v D i n ' ^ c M O C O L n r o c ^ ' ^ c r i r o ' ^ v o i n L n i n i n L n i n L n i n ' ^ ' = i ' ' « : f ' ^ ' ^ ' ^ ' = : r r o r o r o c M C M r H r H
' ^ v o c T i O o c o ^ c T ^ c M V D ' ^ r ^ o o r ^ c M O C N L n c M r H c n c o c o r o ' ^ L n ^ - c M c ^ l O o o r o o r H l n o ^ c o v D c ^ ^ r H r H l n c ^ ^ o ^ ' * ^ c 3 ^ o v D
C M c y ^ c T i i n ' t ^ c M r H c r i c r N L n c r i r o v D C M O i n i n r o r H o v o r H o o c o o o o o o r H C M c o r O ' = j < v o r ^ c 5 ^ o c M ' = 3 ' V D c r i r H L n o i n r H O r H ^ r H r H C M C M C M C M C M C M C M C M C N r o r o r o r o r o ^ ' = : r i n L n v D r - o o
i n c M o o c n o c M r H c M ' ^ c M ' ^ i n c M o r ^ o o o r o v o r H o j L n c M c o ^ L n c T > i n v D r H c ^ r - - i n r H c M C ^ c \ i " ^ v D O L n r - r o r o c 3 ^ c r > ' * r H c o c M O V D c O r H r H v o o i n r o r - ' r v i v o r o r ^ o o c r t v o c o ' ^ c r i r o c M
o c n v D C O r H - ^ t ^ c s ^ r o o o r o r - C M r ^ r O r H r H r - o v D i n r o r o o v D v o v o v D r ~ - r - r ^ t ^ o o o o c h c r » o o r H r M r o r o i n v o o o o r o r -
. H r H r H r H r H r H r H r H r H C M C M C M
i n c o < T > ' = r L n r H ^ L n r o r o c r \ r o o o c N C o o o c M v o c M o i n i n v D O r H v o o ( T . r H r o r H o o i n r v j c o o o o O ' = ; r r H v o r o r o c M C M r H c o r -c M o o v o o o " ^ c o c r i C N r - - r o i n c o c o c M r o r ^ ' = i ' c o i n r H r - " < ; j ' r H r H
in 00 ro
H-»
p in in 0 5H C CJ 0 -P
> fd tJl <d -H rH Cn'd Pi C CM 0 fd 0 ^ ffi TJ 0 -P in 0
>, 0 in in TJ g 0 P 3 0 fd
•H rH x : 0 P 0
c
0 c P 0 0 TJ
in X! t ; fd in -p 0
0 rH T5 C P -p rH
rH 0 ttJ fD fd 0 > rH
t ^ f r ^ S m U S O C I l l S C i q u
o u in
• H p
CM
0 rH H • H > in
rH rH fd
o p fd u
• H Pi
in r-{ r-\ • H
> i 0 -P
rH C r-i - H td rH
> u
> i •P • H U
P 0 u
P
tn^ fd
p o 2
in •H
fd U
0 > fd
0 ' d • H E H
fd [ 2
0 rH rH fd rH > O >^ U c: in c: -H p p CO Q
X
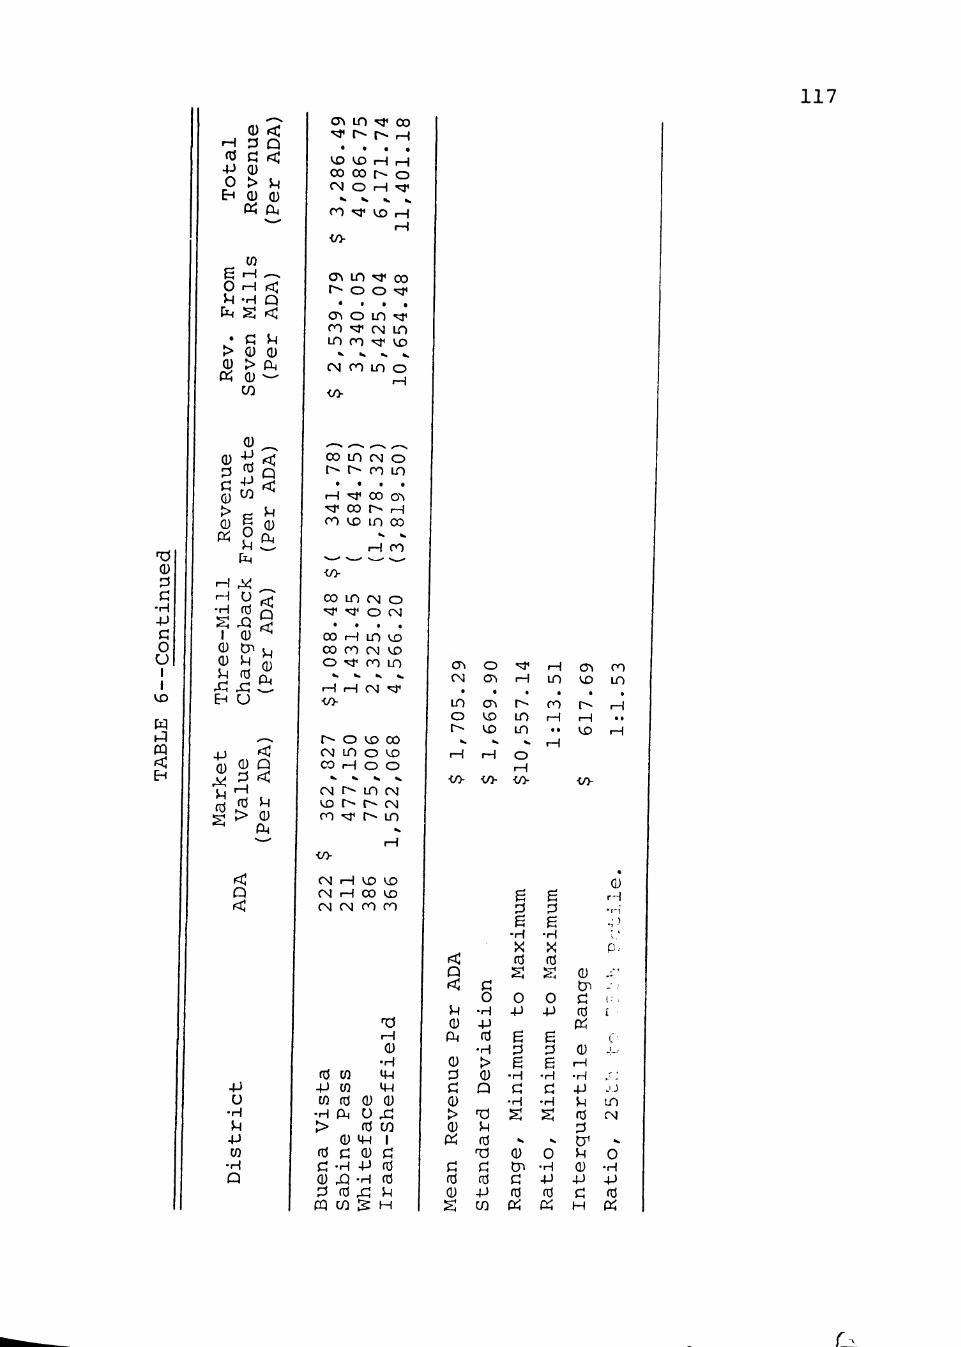
117
'd 0 J3 G
•H -P C 0 U
1 1 1
vo Ciq PI CQ < ^
^^ 0 <C
rH D Q <« G < -P 0 0 > p
EH 0 0) Pi a.
in e r H ^ o rH «: P -H Q t^ ^ <
* G u > 0 0 0 > p Pi 0 —'
CO
^ M 3 ^t^< 0 W > p p 0 S 0 Pi S S P C-
CM
r-\ M
-Mil
ebac:
ADA)
0 Cn ^, ( y S ^ 2 P rC x; c . EH U
- -p ^ Tn 0 Q
Mark(
A
Valu
(Per A
Q <;
-p u •H P -P in
•H Q
o^ in ^ 00 •^ r-« r>- rH
* • • * vo vo r H rH 00 00 r^ o CN O rH " ^
» • * i • . » .
CO ^ V^ r H r H
cr> in ^ 00 r o o ""
• • • • c5 o in ^ CO "vT CN i n in ro •« vo
V V V ».
CN ro in o r H
i/y
CO i n CM o t^ r ro in
• • • . rH - ^ 00 0> •«;r 00 r - rH ro vo in CO
^. K
r-\ ro >—» > v _ ^
</>
CO i n CM o • ^ ' ^ O CM
• . • « 00 rH in vD 00 ro CM vo o <«:t ro in
»• V V ».
rH rH CM ^ -c/>
r^ o VO 00 CM in o vo CO rH O O
2 $ 362,
1
477,
6
775,
6
1,522,
CM rH 00 vo CM CM ro CO
TJ r H 0
•H fd in MH -P in MH in (d 0 0
•H P U ^ > fd CO
0 MH 1 fd f 0 a c; -H -p fd 0 X! -H fd P3 (d ^ p CQ CO 12 H 1
1
cr. CN
in o r--
k.
r H
•co-
< Q <
P 0 P
0 P C 0 > 0 Pi
C fd 0 s
o a>
cr> vo vo
K
r-{
</y
c o •H -P fd
•H > 0 Q
T3 P fd
^ c fd -P CO
-^ r H
r i n i n
K
o r H •c/>
B
aximu:
s: 0 -p
B ^
e • H
a • H
s K
0 cn C (d Pi
r H in
ro r-i
9 •
r H
B
aximu:
S 0 -p
B 13 g
• H C
• H
s: .
0 • H P) fd Pi
o^ ro vo in
r^ rH rH VO ,-i
•c/y
0 r H • ! - l
• s
p.-
0 S' Cn -• C V. fd i Pi
r' 0 -!-
r H •H j : •p -'J P m fd CM :3 cr ^ P 0 0 -H -P -P c fd H Pi
r
118
is reduced to a ratio of 1:13.51 for the two extreme dis
tricts (compared to 1:109.46 in the dummy model and
1:22.54 in Model One).
The data derived from the application of Model Two
reveal a mean revenue per ADA of $1,705.29 and a standard
deviation of $1,669.90 (compared to $2,385.58 in Model
One and $4,198.61 in the dummy model). The full range of
revenue per ADA is $10,557.14, a reduction in range of
$4,52 4.49 from Model One and a 60 percent reduction from
the range seen in the complete local support model. The
interquartile range in Model Two is $617.69, compared to
$882.41 for Model One and $1,397.53 in the dummy model.
An interquartile comparison shows that Clint I.S.D.
(seventy-fifth percentile) would receive 1.53 times the
revenue per ADA as Coleman I.S.D. (twenty-fifth percen
tile). Again, this interquartile ratio illustrates the
equalizing effects of Model Two as compared to both
Model One and the dummy model.
Model Three
Model Three is a Strayer-Haig-Mort Equalization
Model which illustrates, when juxtaposed with Model Two,
the effects of increased chargeback millage and reduced
local leeway. In effect. Model Three points out a vital
characteristic of the Strayer-Haig-Mort theory; i.e..

119
greater equalization results as state spending increases
and reliance upon local wealth is diminished. Model Three
is similar to Model Two in all respects except: (1) an
increased funding level for the foundation program, from
$746.70 per ADA to $1,097.49 per ADA; (2) a higher level
of equalization, from a three-mill chargeback to an eight-
mill chargeback; and (3) less local tax leeway, reduced
from seven mills to two mills.
Results obtained from the application of Model Three
to the sample districts are presented in Table 7. Once
again, the most affluent district in the sample may be
noted as having 109.46 times the Market Value Per ADA as
the poorest district ($1,522,068 to $13,905); however, the
equalization features of Model Three (eight-mill charge
back and two mills of local leeway) result in a ratio of
revenue per ADA between the two extreme districts of
1:3.68 ($1,125.30 to $4,141.63). This 1:3.68 ratio com
pares favorably to the ratios seen in Model Two (1:13.51),
Model One (1:22.54), and the dummy model (1:109.46).
Data in Table 7 reveal a mean revenue per ADA of
$1,371.37 and a standard deviation of $477.12 (compared to
$1,669.90 in Model Two). The full range of revenue per
ADA is reduced from $10,557.14 in Model Two to $3,016.33;
moreover, the interquartile range of revenue per ADA is
lowered from $617.69 to $176.48. An interquartile
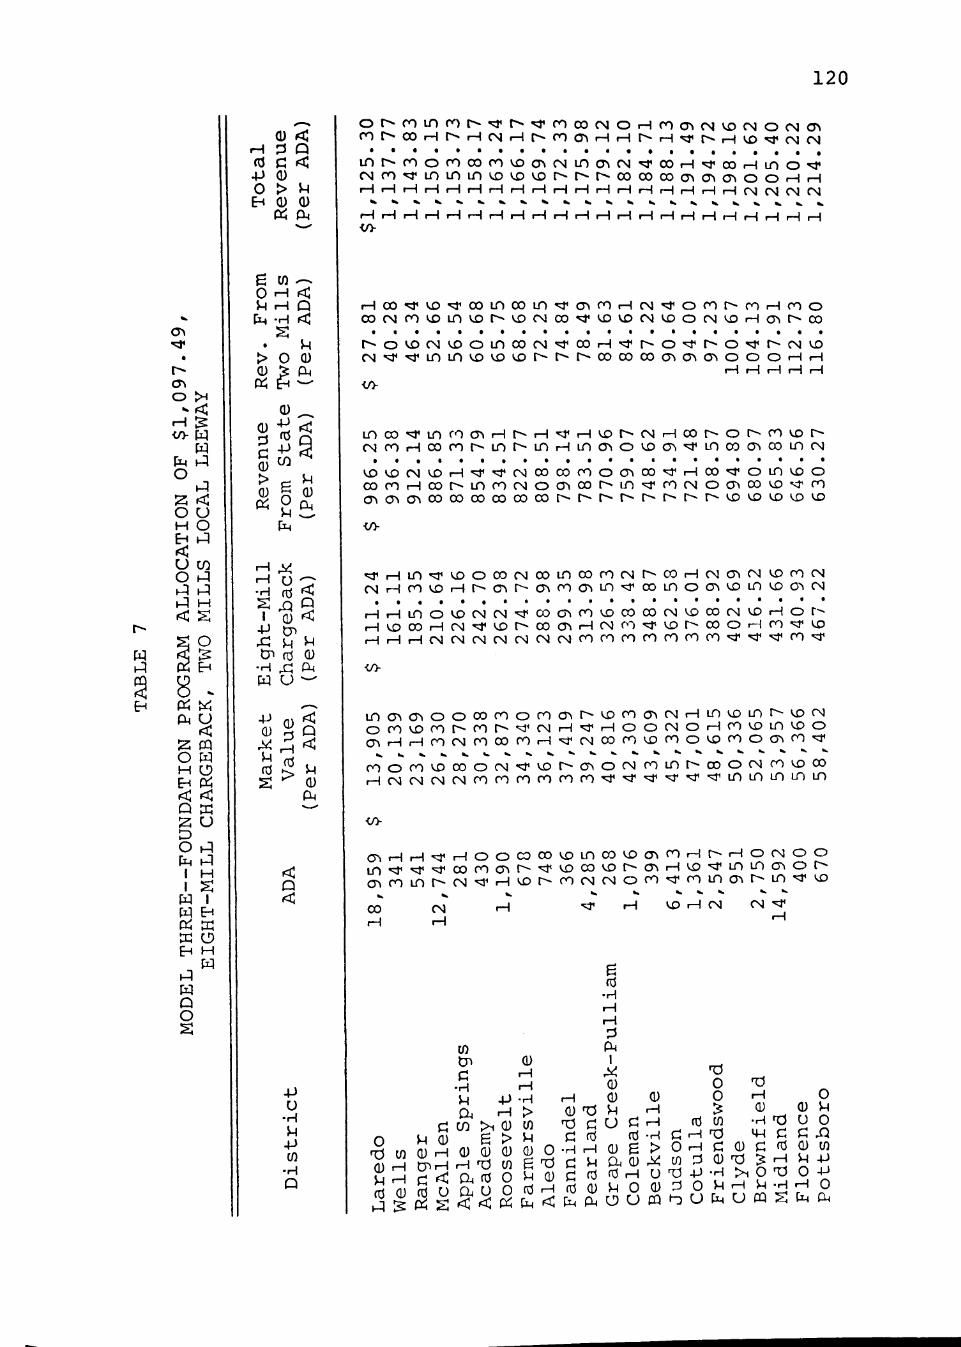
120
Ci^ PI
r H
(d 4J 0 EH
0 < 13 Q C < 0 > P 0 0 Pi CM
B in ^ o rH <: P rH Ci CM -H <
p > O 0 0 > Ci Pi f i ^
0 :3
0 > 0 Pi
CO ^
B o p CM
P 0
fd <
0 <
Cn fd 0 • H ^ (:l CL| u ^
r-i •H
I •p
-P Oj <
,M ^ <;
fd § p
P M
- p u
•H P -P in
•H Q
o r ^ r o i n r o r ^ ' ^ r r ^ ' ^ r o o o c N O r o r ^ o o r H r - r H C N r H r - r o c T i r H r H
rHrOO^CMVOCMOCMO r^ rH ' ; r r ^ rHvo ' i ; i 'CNCN
i n r ^ r o o r o o o r o v o < T » C M i n c r > C M ^ o o r H ^ o o r H L n o ^ C M r o ^ i n i n i n v o v o v o t ^ r ^ r ^ c o o o o o c r > c r > c T » o o r H r H r H r H r H r H i H r H r H r H r H r H r H r H r H r H r H r H r H r H C M C N C M C M
</> r H r H r H r H r H r H r H r H r H r H r H r H r H
i H o O ' ^ v O ' ^ o o L n o o i n ' ^ c T i c o i H c N - ^ o r o r ^ c o r H r o o o o r M c o v o i n v o r ^ v o c M c o ' ^ v o v o c M v o o c N v o r H o ^ r ^ o o
r ^ o v o c N v o o i n o o c M ' ^ t o o r H ' ^ r ^ o - ' ^ r ^ o ^ r ^ c M v o c M ' ^ ' ^ i n i n v o v o v o r ^ r ^ r ^ o o o o o o ( T > < T \ a ^ o o o r H f H
rH rH rH rH rH
i n c o ' ^ L n c o c r i r H r ^ r H ' ^ r H v o C M r o r H c o r o r - L n r ^ i n r H i n c r i
t ^ c M r H c o r - o r ^ r o v o r -o v o c y s - ^ i n c o o ^ o o i n c N
v o v o c N v o r H ' v r ^ c M O o c o r o o c r v o o M ' r H o o x ^ r o L n v o o o o r o r H o o t ^ i n r o c M O c r « o o r - ^ L n ' ^ c o c M O c r « o o v O ' ^ c o c T \ c T t < y i 0 0 o o o o o o o o c o r ^ r ~ ^ r - r ^ r - ^ r ^ c ^ r ^ v o v o v o v o v D
</>
^ ^ L n r ; j i V O O C O C M O O L n C O r O C M r - C O r H C N C 7 ^ C M V D r O C M C M r H r o v o r H r - - c r > r - c r > r o c r i i n ' ^ o o L n o o ^ v o i n v o o ^ c M
i H r H i n O V O C N C M - ^ C O C ^ r O V O C O C O C N V O O O C M V O r H O r ^ r H v o o o r H c ^ l " ^ v o ^ ^ o o c T ^ r H C N r " ) ' ^ v o r ^ c o o r ^ r o ' ^ v o ^ r _ l r H ( s j ( N j f N j c N C M C M C N r o c o r o r o r o r o r O ' ^ ^ " < ^ c O " « ; r
•00-
i n c y \ c r \ o o o o r o o r o c 3 > i r - v D r o a ^ c M r H L n v D L n r ^ v o c M o c o v o r o r - r o r - ^ ' ^ a ' C N r H - ^ r H o o c M O H r o v o i n v D O o v , r H r H c o c M f 0 0 o r O r H " ^ c M C o r o v o r o o v o r o o c r i r O " ^
c o o c o v D c o o c M " « * v o r - c r > o c M r o i n r - - o o o r M f O v o c o r H C M C N C M C M f ^ r o r o r o r o r O " > * " ^ ^ ^ " ^ ' ^ i n L n i n i n i n
</>-
( 7 ^ p _ ^ r _ ^ ^ ^ H O O c ^ o o v o L n c o v o a ^ r o r H r - - r H o ^ ^ ^ o o i n ' = : r ' « ^ " ^ o o c o c r * r - - ' = i ^ v D O o v D r ^ c r i r H v o ^ i n i n < T > o r - -c r > r O L n r ^ c M " < ^ r H v o r - - r o c M C M o r O ' « ^ r o i n c n r ^ i n ' > ^ v o
CO rH
CM ""sT VO CM CM ^ rH
B fd
•H
0 T5 Q) P fd
in rH rH 0
P5 ^
in tr> c •H P CM
C CO P 0 0 rH 0
0 rH rH
+J -H rH >
> i 0 in f= 0
cn rH rH ^d C < CM fd fd o Cij u
> P 0 0 0 m B '^ 0 P 0 fd
Pi S < •< (^ tM
0 r-i
P4 1
X 0
rH 0 0 T5 P T i C U c: C fd fd
•r-\ r-i Q) B d P CM 0 ji; fd fd rH
(d 0 P 0 < CM PM U U
0 rH •H C > o u T 5 0 :3 CQ ^^
fd
o "O O rH ^ 0 in -H
ro UH c: 0 c: 0 T3 ^
•H > i o P rH P CM U CQ
fd rH
• H
0 U c 0 p o
rH CM
O P O XI in -p p o CM

121
T5 0
• H P» C O
u I I
r--
vA CQ < E H
r H (d 4-) 0
EH
0 < 3 P C <C 0 > P 0 0 Pi fl^
B in ^ ^ o rH <; P r-i
CM
• > 0 Pi
a)
enu
> 0 Pi
r-\ rH •H
• H
0
0 -p
sta
B o p
CM
y, u fd
1 0 -P ^ D^
cn p (d
•H ;c: CiH
-p 0
P id
u
0
Q <
P 0 CM
AD
A)
P 0 CM
AD
A)
K 1
0 f l l
r H fd >
P 0 CM
Q
-P U
• H P •P in
•H
o o c r > o ^ r H r H r H L n r o o r H ^ o o r o r ^ c N r H c r > r o v o i n r ^ c o r ^ c M ^ r H o ^ v o o o c M r ^ r - o o v o i n r H o c r i r ^ o j c r » r H ^ t ^ r H ' ^ ' < ; r r H c r k r H
<T\ r H CN
ro CM CN
a\ CN CM
^ CO CM
O •>* ( N
i n '^r CM
r H i n CM
vo i n CM
ro vo CM
•^ r^ CM
•«;r 00 CM
ro a\ CM
r-i o ro
CM r H ro
^ CM CO
o <* ro
r H VO ro
ro r^ ro
CO (T\ ro
rH ro ^
00 vo ^
in "* o vo in in
r^ ro vo
ro CM CO
rH rH rH r H rH r H r H r H r H r H r H r H r H •co-
a > O O C M C M C M V D « ^ v o i n c M c o r ^ c M C M c o
c M L n o ^ • = ^ c o c o c M O ' ^ ^ ^ v o c o < r l O o r o L n o v o i n ^ c N r ^ ^ r ^ c j ^ c N v o o ^ c r i V D ' ^ v o
r H v o c N f ^ c N O O ' ^ c T ^ v o r ^ v o L n ' ^ i n v o r o r o L n r H r o o r ^ v o o L n c N C N r o r o ' ^ ' : 3 ' L n i n v o r ^ o o c r » O r H C M ' ^ v D r ^ o r o r ^ o v o ' ^ c M r H r H r H r H r H r H r H r H r H r H r H r H C M C M C M C M C M C M r O r O r O ' ^ " » ; r L n r ^
-co-
r o t ^ r H C M r H c r » ' * r H v o c y > o r O r H r ^ L n r o c r > c r i O V D L n r ^ i n r H r o ^ ^ • ^ ^ - C M V O l n ^ r H o r o o ^ r H r - r o L n o o v o c M v o r H ' = ^ » * C M C M r H
O r H o o c o v D ' ^ o o c o a ^ O L n c ^ ^ v o o r o c M v o ^ - ^ - v o ' ^ o ^ ' = * l n r H ( T > v o ^ c M O O O v o r o o o L n r H r - r o c r > c N - < ^ v D i n i n i n i n i n ' ^ ' ^ ' ^ r o c o r o c M C M r H r H
</y
o ro CO ro vo vo o rH CN ro in r^ o CO
v o c M c o r ^ c o o L n o o r o o c 3 ^ v o c o c M M < v o o c o c r i i n ^ v o " ^ o c M r ^ o r ^ c M o o o ^ o r o ^ r H L n r o [ ^ r H a > v o c o r - - o v D c 7 ^ c r \ r ^ f ^ v o
v o v D c o c y ^ o c M ^ ~ - r - ^ c o v o c M r ^ r H v D ^ O " = : r r o l n • < = f c o r H V D r ^ c M c o o c M ^ r ^ c 7 ^ r H r o v D O v j < o o r H v o o r ~ - L n o o r o o o r o v D V D O • ^ i n L n i n L n i n v D v o v o t ^ t ^ r ^ c o c o o ^ c r » O r H c M r o ' < ^ v o o o r H c r >
<n- H r H r H r H r H r H r H C N C N
L n r M c o c r \ o c N r H C M ^ C M " ^ i n c M o r ^ c o o c o v o r H C M i n r M f o r - -' ^ i n o ^ L n v o r H r o r ~ - i n r H r v ] < T * c M ' ^ v D o i n r - r o r o c r i C T ^ ' ^ r H C M cocMOVOco rH fHvoOLnco r ^cMVDco r ^ooc r>vDCO '>^c r> rocMCO
o r o v o c o r H - ^ r ^ - c n r o o o r o r ^ c N r ^ r o r H r H r ^ o v o i n r o r o o c M v o v o v o v o r ^ r - r ^ r ^ c o c o c r i o ^ o o r H c N r o r o i n v o o o o r o r ^ v o
i H r H r H r H r H r H r H r H r H C M C N C M r O
i n c o c n - ^ i n r H ' ^ L n r o r o c h r o c o c N o o o o c M v o c M o i n i n v o o c M r H V O O C r . r H f n r H O O L n C M r O O O C O ' > ^ ^ r H V D r o r O C M f N r H O O r - - C M C N j r o v o c o - ^ m c y ^ c M t ^ r o L n o o o o c M r o r - ' ^ r O L n r H r - ' ^ r H r H C M
in 00 ro
-P
:3 O U
in p 0 >
tP fd cm3 0 fd ffi T)
B • H •O
>^ 0
• H Pi
0 0 P
rH x : CM EH
o -p cn 0
o
in
•H fd rH
in in o p u
o fd 0
o p rH
o
in fd
r-{ rH fd Q
o p o
Xi in
O
o IS
•p
fd
o
0 p fd
> rH
0 rH rH •H > in
fd
o p fd u
• H Pi
in
•H
>^ 0
rd >
-P
c •H r-{ U
> 1 -P •H U
P 0
u p <
0 0
fd
p o
cn P
in •H
fd u
0 >
fd
0 TJ •H EH
P 0
r-\ rH fd
0 rH rH fd rH > O
CO
in •H P Q
fd -p in
•H > fd c 0
CQ
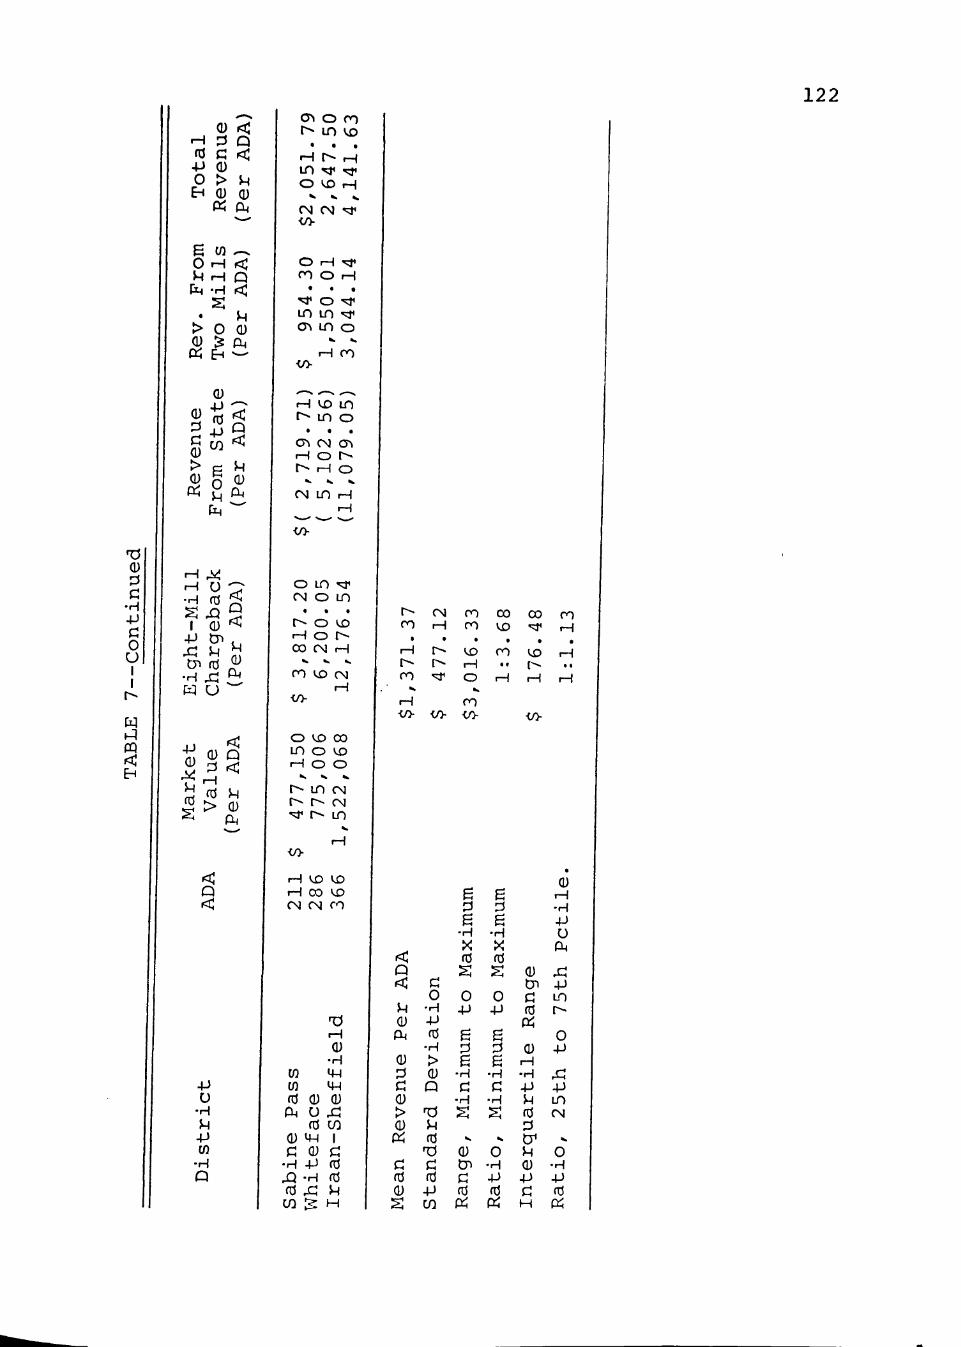
122
0
c; •H •p c o u I I
Ciq PI CQ <
r H fd p» o
E H
0 <C 13 Q C 0 > 0
P
Pi a<
e in ^ o rH <; P rH Q
CM -H <
> O 0 0 ^ fl Pi EH - -
0
0 -P fd <
0 "•' > g P
Pi go. CM ^
rH ^^
• H fd ^
S Xi 9 I 0 ^
•P cn . 4::! P '^ t7> fd ^
•H x : ^
-p 0
p fd
0 Q 0 <
fd >
p 0 Of
< Q
u •H P -P in
•H Q
CJ> o ro i^ in vo
• • • rH r^ ,H i n ^ - ^ O vo rH
»• V V
CN CM ^ •l/>
O rH " * ro o rH
• » . ^ O "^ i n i n "sT cr> i n o
rH ro -co-
r-i ^X> ID r^ i n o
• » . cr> CM cy> rH o r^
r-- rH o
CM i n rH
</>
o i n "^ CM o i n
« • • r- o vo rH o r--00 CN rH
^ V V
r o v o CM
O VO CO i n o vo rH o o
s. ^ V
r- i n CN r-- r-- CM ""^ t ^ i n
•co-
r-i KD KO rH 00 vo CM CM CO
tn in fd
'd rH 0
•H 4H vp 0
0 U fd CO
0 UH I 0 -p •H
•H
fd CO
fd fd P H
1 ^ CM r o 00 CO r o ro rH ro vo 'vj' rH
ro "^
i ^ vo ro vo rH rH o
r-i ro •to- v> co-
i ^ rH
</>
Q <
U 0 fl
0 :3 c: 0 > 0 Pi
fd 0
B -H
o • H -P fd
• H > 0 Q
P fd
fd - p CO
B
B •H X
fd fd
o -p
B
B • H C
•H
O •P
:3
e • H
• H
0 O Cn - H C -P fd fd Pi Pi
0 cn
fd Pi
0 r-i • H •p p fd
p 0 -P
0 rH -H •P
u
-p i n r-
O -P
^ -P i n CM
O • H H-> (d Pi

123
comparison shows that Clint I.S.D. (seventy-fifth percen
tile) would receive only 1.13 times the revenue per ADA
realized by Coleman I.S.D. (twenty-fifth percentile),
compared to 1.53 times under Model Two. It is perhaps
noteworthy that the state would recapture $4,0 54,9 32 from
the most affluent district (366 x $11,079.05); this figure
is approximately three times the recapture from the same
district under Model Two ($1,397,937).
Model Four
Model Four is a Percentage Equalization Model, the
application of which results in revenue per ADA for each
sample district quite similar to that in Model Three (see
Table 8 below). This phenomenon is difficult to explain
in view of the radically different approaches represented
by the two models. In Model Four the constant factor in
the allocation formula was set at .465 (see Chapter III)
in order to generate appropriate dollar figures for both
state and local revenues (see Table 1). In fact, this
constant, when taken in combination with (1) the percen
tage of each district's Market Value Per ADA of the state
average Market Value Per ADA and (2) the ten-mill local
leeway factor (with the percentage equalized allocation
functioning as a chargeback), represents an effect approxi
mately equal to the eight-mill chargeback and two mills of

124
local leeway observed in Model Three. As a final effect,
then, it may be observed that the percentage equalization
approach, when state dollar input is held constant, does
not equalize revenue per ADA any more than a Strayer-Haig-
Mort model with high chargeback-low local leeway provi
sions. For example, Laredo I.S.D. would receive $986.25
per ADA in state aid under Model Three and $9 86.20 under
Model Four (see Tables 7 and 8). This small disparity may
be explained in tejrms of differences in total state expen
ditures for the two models (see Table 1).
Results obtained from the application of Model Four
to the sample districts are presented in Table 8. As
seen in the case of Model Three above, the ratio of
revenue per ADA between the poorest and wealthiest dis
trict is 1:3.68. Again, this compares favorably with the
ratios seen in Model Two (1:13.51), Model One (1:22.54),
and the dummy model (1:109.4 6).
Data derived from the application of Model Four
reveal a mean revenue per ADA of $1,370.86 ($1,371.37 in
Model Three) and a standard deviation of $476.23 ($477.12
in Model Three). The full range of revenue per ADA is
$3,010.72 ($3,016.33 in Model Three), and the interquar
tile range is $175.99 ($176.48 in Model Three). An inter
quartile comparison shows that Clint I.S.D. (seventy-fifth
percentile) would receive 1.13 times the revenue per ADA
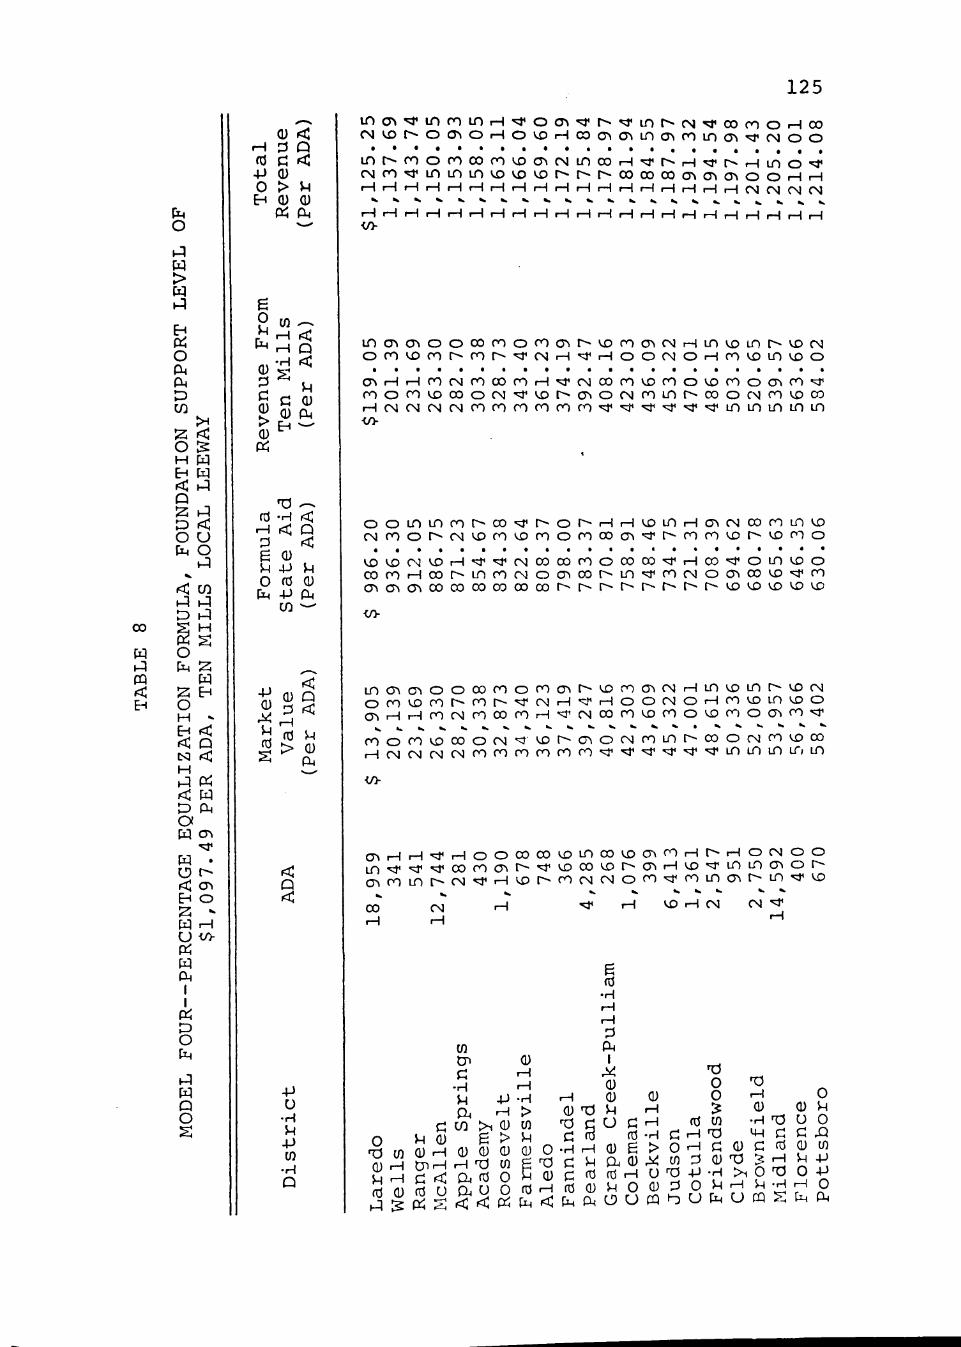
125
i n c r v ^ i n r o i n r H - s ^ o c T ^ ' ^ r ^ ^ i n r ^ r g ' s r o o c o o r H c o
0 0
Ci^ PI PQ < EH
CM O
PI Cxq > ca PI
EH Pi O Cl( CM D CO
>H ^ < O 12 H Ci:i EH ^ < PI
2 PI
O O CM O
P5 K,
< : CO PI PI D PI
o CM S
Ciq 2 ; EH o H -EH <:
N <! hH PI Pi <; Ciq D Oi a CLJ c^^
ENTAGE
1,097.4
u </> Pi Ciq CM 1 1
Pi o CM
PI cq Q O
rH fd +J 0 EH
B
Fro
0 0 c 0 > 0 Pi
Formula
4J 0
P fd S
0 < 0 Q
0 > u 0 0 Pi fl^
""^
ills
ADA)
Ten M
(Per
State Aid
(Per ADA)
Value
Per ADA;
*—'
ADA
-P
u
Distri
CMvo^^oc^»OrHovorHcoc7^c3^ lnc7^ro lnc3^ ' i ^cMOO
i n r ^ r o o r o o o r o v o c T i C N i n o o r H ' ^ r r ^ r H ' ^ r ^ r H i n o ^ c M r o ' ? l ^ l n l n l n v o v D v o ^ - r - • ^ - o o o o o o c 3 ^ c r ^ c ^ o o r H H r H r H r H r H r H r H r H r H r H r H r H r H r H r H r H r H r H r H C M C M C M C N
r-ir-ir-ir-ir-ir-\r-{r-ir-ir-ir-{r-ir-ir-ir-{r-ir-{r-{r-{r-ir-ir-\ •c/>
l n c 3 ^ c ^ ^ o o o o r o o r o o ^ ^ - v o r o o ^ c N r H l n v o l n ^ - v o c M o r o v o r o r - ^ r o r ^ ' ^ c M r H ' ^ r H o o c M O r H r o v o i n v o o
c r ^ r H r H c o c N r o o o r O r H ^ C M C o r o v D r o o v o r o o c n r O ' ^ r o o c o v o c o o c M - ^ v o r ^ c r ^ o c M r o L n r ^ o o o c M r o v D C O r H c M C M C M C M r o r o r o r o r o r o - ' ^ ^ ' s r ' ^ ^ ' ^ i n i n i n L n L n •c/>
o o i n i n r o r ^ c o ' ^ r ^ o i ^ r H r H v o L n r H c r i C M c o r o L n v D c M r o o r ^ c M v o r o v o r o o r o o o c r > " = : } ' r - - c o r o v D r - v o r ' " ) o
V D V D C M V O r H ' ^ ^ C N C O C O r O O C O O O ' ^ r H C O ' v r ' O L n V D O c o r o r H c o ^ ~ ~ l n r o c M O O ^ o o r ^ L n ' s r r o c M O C 7 ^ c o v D " = : J ' r o o ^ c n o ^ c o c o o D c o o o o o r ^ r ^ r - - r ^ r - ^ - ^ ^ r ^ v o v o v D v o v D
-co-
L n c n c r i O O O o r o o r o c r > r - ~ v o r o c n r M r H L n v o i n r ^ v o r M o c o v o c o r - r o r ^ ' ^ c M r H ' ^ r H o o c M O r H r o v o L n v D O Q ^ , r H r H r o c M ^ o o o r O r H ' = : f C M O o r o v o r o o v o r o o c 7 ^ r O ' = r c n o r o v o o o o c M ' ^ v o f ^ c T i O C M r o L n r - c o o c M r o v o o o r H C M C N C M C M f ^ r o r o r o r o r o ^ " ^ ' ^ ' ^ " « ^ ' ^ L n i n i n L r » i n
</>
Q ^ ^ r H - ^ r H o o c o c o v o i n c o v o c n r O r H r ^ r H o c N O O i n - ^ - ^ - ^ c o r o c n r ^ - ' ^ v D O O v o r - c n r H v o ' ^ i n L O c n o r -o ^ r o i n r - c N ^ r H v o r - r o c M C M o r o - ^ r o i n c r i t ^ t n ^ v o
CO CM r-i ^ r H V O r H C M C M ^ rH rH '-^
iam
rH r H 0
Ul (^ Cn 0 1 .
•P -1 ^ 9 3 n } q 4 J - H r H 0 0 O ' T ^ , , P ^ ; ^ > Q j r ^ ^ rH ^ ^ . M ? ^ n
r ^ m ' > . 0 i n T ^ c U C r H fd in - H T ^ U O n P 0 & > P c § f d • H c : - ^ ' 0 ^ g c ^ ^
' 8 l O 0 r ^ 0 0 S 0 O - P r H 0 e > O r H G 0 g C d 0 i n flA _ j ^ r . ^ P ^ r r ) m F ; ' r j r - j ^ n , ( U ^ c n : 3 0 ' l 3 5 r H P - P J ^ : 1 c 3 a , ^ o S 0 C f d ? d r H o ^ P - H > . o ^ O 4 : ; S m f e u a u o f d r H f d 0 P O 0 ^ o 5 ^ 7 ^ i ^ - - ^ ; : ^ P

126
H fd -P o
E H
0 <C 0 Q C < 0 > P 0 0 Pi CM
l n v D ' ^ L n ' * ^ ^ ^ ^ C T ^ o ^ c ^ > c M L n r ^ O l n o c M O f * ^ o ^ c M r H H c r > r ^ ^ L n c T > ' ^ ^ i n c N r H r ^ r ^ i n r o o o ' ^ r ^ c r > c N L n r ^ r ^ r o c r >
00 H CN
ro CN CN
<XS CN CN
' cr> ro ro rsj CM
in •<;r CM
rH in CM
vo in CM
ro vo CN
"^ t^ CN
ro CO CM
CN <y\ CM
rH CM O rH CO ro
ro CN ro
o • ro
o vo ro
CN 00 r^ <y\ ro ro
o ro •^
r-> vo "
^ CO vo o VD ro in in vo
rH r H rH rH rH rH </>
rH r H rH rH H rH rH rH rH rH
B O P
CM
0
0 > 0 Pi
in --s rH < rH O •H <C
P G 0 0 CM
i n CN 00 CTi o " in a\ in vo
CM r H CN - ^ CM rH ro r- in rH
^ i n c M o r ^ o o o r o v o r H c M i n c N r o C M c r > r M ' ^ v o o i n r ^ r o r o o ^ c T » ' ; r r H
o o c N o v o r O r H r H v D O L n r o r - - c M V D r o r ^ c o c T \ v o c o ' ^ c y > r o c M o r o v D C O r H • ^ ^ ^ c 3 ^ r o c o r o ^ ^ c M t ^ r o r H r H ^ ^ o v D l n r o c o o v o v o v D v o t ^ r ^ r ^ r ^ o o o o < T > o > o o r H c M r o r o L n v o o o o c o r ^
r H r H r H r H r H r H r H r H r H C M C N C M
•l/>-
0 0
•H -p c: o u I I
00
Ci:i PI CQ <
fd rH
B u o
CM
•H < :
0 • p fd
- P CO
•P
0 P fd
13 rH fd >
<:
p 0 CM
0 Q <
P 0 CM
o ^ ^ v o v o ^ c M v o c M i n r ^ i n r ^ r o i ^ r o r ^ O r H v o c o r o r o r H C N L n c M • ^ a ^ c o r o ^ H c o t ^ O L n r ^ r o c ^ ^ r H c o c N C O r H r ^ r H C M r H C M
O r H c o r - ^ v D M ' o c T ^ C M c r i O ' ^ c n i L n o r o c M V D c o r ^ r ^ L n o L n r H o ^ v o ' < * C M O c o i n c o o o L n r H r - - c o c y i c N " « ^ o r o c o r o r ^ v o v o i n L n m i n L n ^ ' ^ ^ r o c o r o c M C N r H r H r H c M c o i n t ^ o
</>
L n c M O O o ^ o c M r H o j " > * ( N » * i n c M o r - c o o r o v D r H c M i n c M r o • ' ^ I ' L n c n i n v o r H r o r - L n r H C M c n c M ' ^ v o o i n r - r o r o c n . c r . ' ^ H c o c M O v o r o r H r H v o o i n r o r - C M V o r o r - o o c j ^ v o c o ^ c j ^ r o c M
o r o v o c o r H - ^ r ^ o ^ c o o o c o r - c N r ^ r o r H r H r ^ o v o L n r o r o o v o v o v o v o r ^ c - - t ~ - r - o o c o a > c r > o o H c M r o r o i n v o c o o r o r ^
r H r H r H r H r H r H r H r H r H C N C M C M
i n r o c h ^ i n r H ^ i n r o r o c r ^ r o o o c N o o o o c M v o c M O i n i n v D O ^ H v o o c 7 ^ r H f O r H c o l n ^ M r o o o o o ^ r H v o r o ^ o ^ M C N r H c o t -C M r o v o o o ^ c o c 7 ^ c M r - r o L n c o c o c M r o t ^ ' = : f r o i n r H i ^ ' : 3 ^ r H r H
, H rH i n t H rH rH rH CO ro
-p o
•H
p
in •H Q
> 1 -p
O U
Cn fd
O fd
> 1
•H CM
in P 0 >
•H Pi
0 0 P
EH
O H-> in 13 o
in
•H fd
rH P
in O p u
15 O
fd 0
o -P rH O
in fd
rH rH (d Q
o p O
If)
o o
p
fd >
Ci:i
o
0 p fd
rH U
o u in
• H p
CM
0 rH rH •H > tn
rH rH fd
O
P fd u
•H Pi
in rH rH •H
0
fd >
-P C
•H rH
u
> i 4J •H U
P 0
O P
0 P 0 13
fd B P O 2
in •H
fd u
c: 0 > fd
0 'd • H EH
P 0
rH r-\ fd IS
0 rH fd >
c CO
o o tn H p Q

127
0
•H -P
o u I I
CO
K P!
< EH
o p
CM
0
C 0 > 0 Pi
en - > . rH <C rH •H
P G 0 0 P.
fd
0 B p o
•H <
0 -P fd
CM -P CM CO
P 0
-P 0
P fd
0 0
r "1
fd
< Q <
Pi > M
fin
-P U
• H P -P in
•H Q
rH fd -p u H
-^ 0 <: 3 Q c < 0 > p 0 0 Pi PU
V..
O CM CM r-00 o vo c ^ • . •
rH o ^ in CM in -^ ro 00 O vo rH
*• ^ «. V
rH CM CM "^ V5-
r^ o VD 00 CM i n o vo
• • » . 00 r H O O CN t ^ i n ( N vo r-« r - CM
*• ». V V
ro rj* r-- uo rH
•co-
r- 00 "^ rH ^ * ^ • ^ r^
• • . • ^ r-i ID '^ O CM O CO 00 r-- rH o
»• ^ >» K
rH CM LO rH
-co-
r^ o VD 00 CN i n O VD CO rH O O
CM r-- i n CN vo r^ t ^ CM ro "»3< r- i n
</>
< o <
CN rH vo vo CM rH 00 VD CM CM CM ro
fd in -P tn in fd
•H cu
fd ci
0
•H 0 rQ 0 fd ffl CO
rH 0
• H MH I H
0 0 U ^ fd CO
i p I 0 c -P fd • H fd ^ P
VO CO CN CO c n CO CO CM [ ^ v o cr> r H
O VD O r- r-- rH ro ' ^ o
rH CO •l/> -CO- -C/>
<
<
P 0 P^
0 13 C! 0 > ^
O •H •P fd
•H > 0 Q
0 P^
fd 0
p fd
fd -P CO
B
B •H X fd
o -p
B
B •r-i
•H
0 Cn
fd
CO i n
</>
• H ^' fd
o -p
13 B
• H p;
•H
o •H -P fd Pi Pi
0 rH •H -p
0 u p 0 Cl
0 4:: t j i -P C i n fd r^ Pi
o 0 -p
rH •H X3 -p -p P i n fd rvj
P 0 pi
c: H
o • H 4J fd Pi

128
as Coleman I.S.D. (twenty-fifth percentile); this figure
is identical to that seen for Model Three. Assuming that
the results of Models Three and Four are equal, despite
the facts that Model Four creates slightly less variance
and Model Three generates slightly more revenue for each
district. Model Three would seem to have two advantages
over the percentage equalization approach: (1) Model
Three is a more familiar model, being comparable to the
present Strayer-Haig-Mort model utilized in Texas; and
(2) Model Three statistics are simpler to compute; i.e..
Model Three involves no complicated formula.
Model Five
Model Five is a Flat Grant Model which illustrates
that increased state aid in combination with reduced local
tax leeway, even in a flat grant motif, can lead to equal
ization by diminishing reliance upon disparate local tax
wealth. In Model Five six mills of local tax effort is
remitted to the state; this factor is not a chargeback,
but is, in effect, a state property tax. Moreover, only
four mills of local leeway is allowed compared to ten
mills in Model One. Results obtained from the application
of Model Five appear in Table 9. The ratio of revenue per
ADA for the two extreme districts is 1:6.96 although the
ratio of market value per ADA is 1:109.46 ($1,522,068 to

129
CTi
PI
<
< Q < Pi Pi
in rtj <; CTi
rH fd •P 0 tH
0 0 d 0 > 0
< Q ri:
p 0
P i CM
B O P
CM
• P td
rH CM
cn <
• H
K. ^ 0
0 o ci Cii CM
H->
fd P O
Q < P 0 P
0 -P
rH td rH 4-> •H CO
I X
• H CO
O +J
X fd EH
< :
p 0 0A
0 g < p ^ p fd • ^ 0
S ^ CM
Q
• P
u •H P in
•H Q
r o r - c 7 > r o c r » v o o r - o c r t o r - C N i n o r H r ^ i n r - < ^ r -c o r ^ o o i n c N i n t ^ i n t - - o o c M ' ^ ' ^ v o i n c M v o i n - ^ o v D c N r ^ c y \ C N o o o o o ^ r H v o M ' o v o H o o i n r H o o L n r o c M r H r o ^ v o r ^ r ^ o o c T ^ o o H c M C N r o r o - ^ i n i n v o r ^ o o O O O O O O O O r H r H r H r H r H r H r H H
</>
r H r H r H r H
r H r H r H r H r H r H r H r H r H r H r H H r H
C N V O C O C N O O L n < T » V O C 3 ^ 0 0 0 ^ V O r H ^ C 5 ^ 0 V D ' s r V D r O V O
v o L n v o r o o r O ' N r r O ' > ^ V D c n c M C M ' * c N O ^ r o c M C O ^ i n o c M i n r o r H r H r ^ ' ^ c y i V D r o c T i ' ^ r H c o ^ r H o o i n i n i n c o c T i O r H c N r o r O ' ^ ' ^ i n v o v o t ^ o o c o c n o o r H c M
r H r H r H r H r H r H r H r H r H r H r H r H r H r H C M C M C N C M
•CO-
r H r H r H r H r H r H r H r H r H r H r H r H r H r H r H r H r H r H r H r H r H C N C N C N C N C N C M C M C M C M C N C N C M C N J C M C M C M C M C M C M C N C M
L n L O i n L n i n L n L n i n L n i n L n L n i n L n L n i n i n L n L O i n L n <3^c^^cT^a^c^^cJ^cy^c7^c^^o^c7^a^o^C7^CT^o^<3^cTlCT^c^lcy^ •c/>
r o r O r H o o c M C M " < d * ' N r ' = ^ r H o o o c M i n r o r H a ^ c M c n ' ^ o " ^ o o o a ^ v D o r M o r ^ i n - ^ C T i C O v o a ^ o v o o r o t ^ c N
r o o c 3 > r ^ o ^ c N t ~ - v D v o ' < ^ i n " ^ r o r H r H c M r H C M r M r o o o C O C N r O L n V D C O C T i O r H C M r O ' ^ L O V D r ^ C O c r i O r H C M r O
r H r H r H r H r H r H C M C M C N C M C M C > J C M C M C M C M r o r O r o r O
i n c J > < T i O O C o r o o r o c r » r ~ « v D r o c r > c M r H i n v o L n t ^ v o o r o u 3 r o r ^ r o r - - - ^ C M r H " ^ r H o o c M O r H r o v D i n v o C T ^ r H r H r o c M r o o o r O r H ' ^ c M C o r o v o r o o v o r o o c ^ ^ r o
r o o r o v D c o o c M ^ v D t ^ c T i O C M r o i n r ^ o o o c M r o v o r H C M C M C N C N c o r o r o r o r o r O ' ^ ' ^ ' ^ ' ^ ' ^ ' ^ L n L n L n L n
( y ( P ^ r H - « : f r H o o o o o o v o L n c o v o o ^ r o r H r - r H o c M O i n ' ^ ' ^ • ^ c o c o o ^ ^ ~ - ' ^ v o o o v o r ^ a ^ r H v D ' ^ l n L n c y ^ o a > r o L n t ^ c M " = ^ r H v o r ^ r o c N C M o r O ' < * r o i n c 5 > r ^ i n ' v r
00 CN rH
• ^ v o r H CM CM " ^
0 TiJ in 0 rH P rH fd 0 PI [2
in Cn 0 C rH
•H rH P -P -H CM rH >
C CO > i 0 in P 0 6 > P 0 rH 0 0 0 0 0 CniH i-i Ti m B "^ q; <C Pu fd 0 P (d u CM o 0 fd Pi S < < f^ f^
0 rH <
rH 0 ^ no C
•H
c: c td CM
C fd
rH P fd 0 PH
B fd
•H rH rH 13 fl4 1
^ i 0 0 P
u 0
0 rH
c; H td B
•H >
a 0 ^ fd p O
rH 0
u
td
TJ 0 T) 0 rH 15 0 0 in -H ^3 u
C rH T5 4H C C 0 in
U TD 0 CQ
y h)
rH p p
u u
c 0 c <d 0 0 T) ^ rH P
•H > i 0 T3 O P rH p -H rH CM U CQ S CM
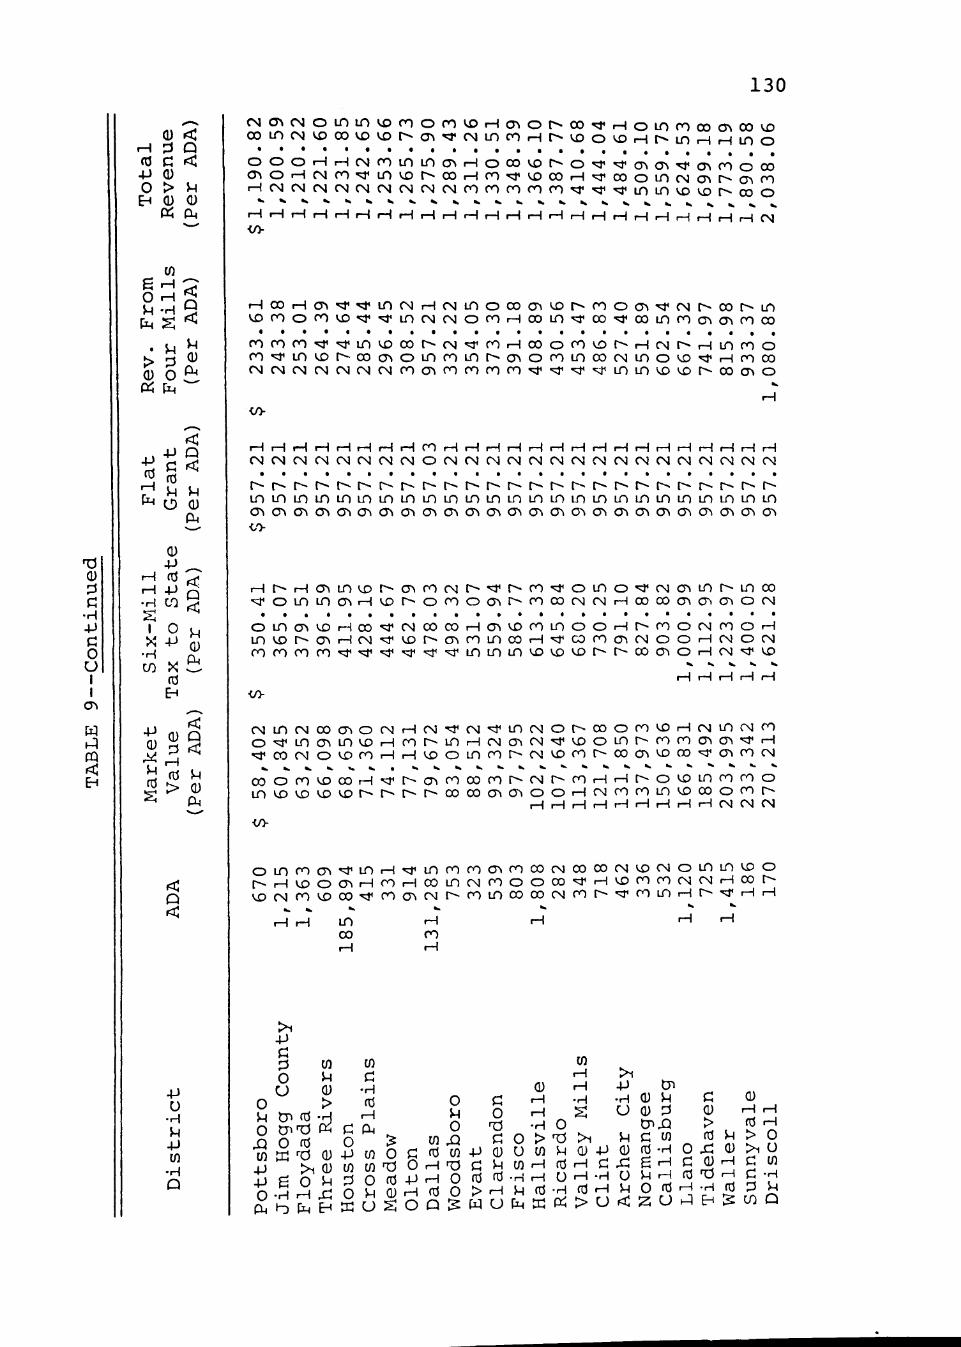
130
T5 0
•H -P
O U I I
<y\
PI CQ < E H
rH fd -P 0 EH
0 0 C 0 > 0
< Q <
P 0
P i CM
in
OrH g P -H 3 CM S ^
> 0 ^ 0 0 ^ Pi CM
-P td
r-i C M
- P C! td P
O
• H
I X
• H CO
4J 0 P td
p <: p 0 a*
0 - p td
CQ
O -P
X td
fd >
Q <
P 0 CM
0 Q
p 0 Pul
p
u •H P -P in
•H P
c M c r » c M o i n i n v o r o o r o v o r H c r > o t ^ o O ' « ; r r H o i n f ^ o o < y > o o v D o o i n c M v o o o v o v o r - c r > ' ^ < N i n r o r H r ^ v o o v o r H r ^ i n r H H i n o o cr> rH
o o CM
O rH CN
rH CM CM
rH CM
ro ^ CM CN
ro in CM
in VD CM
in r-CM
<j\ 00 (Nl
rH r-i ro
O CO ro "^ ro ro
vo vo ro
r-CO ro
o rH ^
^ ^ ' ^
•^ 00 •«;r
<y\ a^ o in in in
' ^ CN VD
rr> m vo
ro o r^ CT\ r^ CO
no ro O
<n-r H r H r H r H r H r H r H r H r H r H r H r H r H r H r H r H r H r H r H r H r H CM
r H o o r H c r » ^ ' * i n c M r H C M i n o o o c j ^ v D r ^ r o o < T > " ^ c N r ^ c o r - - i n v o r o o r o v O ' ^ ' ^ i n c N C M o r o r H o o i n ^ c O ' ? t c o L n r o a \ c j ^ r o c o
r o r o r o ^ ^ L n v o o o r ^ r M ^ r o r H c o o r o v o r ^ r H C N r ^ r H i n r o o r o ' s f L n v o r ~ - c o c r > O L n c o L n r ^ c T N o r o i n c o ( N L n o v D ' ; } ' r H r o c o C M C M C N C N C M C M C M r o c 3 ^ r o r o r o r o ' ; j ^ ^ ' ^ ' N r i n i n v D v o r ^ o o c r v O
</>
r H r H r H r H r H r H r H r H C O r H r H i H r H r H r H r H r H r H r H r H r H r H r H r H r H C M C M C N C M C M C M C M C N O C M C M C M C M C M C M C M C M C N C N C N C s J C M C M C N C M
i n i n L n L n L n L n L n L n L n i n i n L n L n L n i n i n L n L n i n i n L n L n i n i n L n cy^(T^<y^C5^cy^o^(T^c^^CT^c?^c3^o^cT^c5^(T>o^o^cJ^o^c^^c3^c^^c5^c3^cy^
r H t ^ r H c y \ L n v o r ^ a N r o c M t ^ ' ^ r ^ r O ' * o i n o ^ c N c n i n r ^ i n c o ' ^ o i n L n c r > r H v o r ^ o r o o < y ( r ^ r o o o c M r v j r H o o c o c 5 ^ c r . c 3 ~ > o c M
o i n c 7 > v D r H c o ' * C M c o c o r H c 7 ^ v D r o i n o o r H r ~ - r o o c M r o o r H L n v D r - - a > r H C M ' ^ v D r ^ c r \ r o L n c o r H ' > : r c o r o < n c N O O r H C M O C M r o r o r o r o ^ ' ^ ^ ^ ' ^ ' ^ L n i n L n v o v D v o r ^ r ^ o o o ^ O r H C N ^ v o
p^ rH i~i r~H P H
</>
C M i n c N c o a ^ o c N r H f N ' ^ C M ' ^ i n c M o r ^ o o o r o v D r H c M i n c M r o o • ^ L n c T \ l n v o r H r o ^ - - L n r H C M o • ^ c M ' ^ v D O l n ^ ^ c o r o c ^ l c y ^ ' ^ r H ^ c o c M O v o c o r H r H v o O L n c o r ^ C M V o c o r ^ c o c n v D O O ' ^ c r > r o c M
o o o r o v D o o r H " > ^ r - c r i c o c o r o r > - c M t ^ r o r H r H r ^ o v o L n r o r o o l n v o v o v D v o ^ ^ ^ ^ ^ - ^ - » o o o o c 7 ^ c T » o o r H C M ^ o r o L n v o o o o r o r ^
r H r H r H r H r H r H r H r H r H C v l C M C N
i n c o c T i ' ^ L n r H ^ L n r o r o c T N r o c o c M C O C O C M v o c M o i n i n v D O r ^ r H V O O C ^ i r H r O r H v o c N r o v o o O ' s j ' r o c r i
r-i r-i ID 00
o O L n c M r o o o o o ^ r H v o r o r o c M C M r H o o t ^ c M r ^ - r o i n c o c o c M c o r ^ ' ^ r o L n r H r - - " ^
rH rH r-i r-i ro rH
O P O
Xi Ul •P +J O P
> i -P Ci
o u cn td
O td
in p 0 >
in Ci
• H td
B • H Ho
CM
Pi
0) 0 p ^ ^
C (h ^ 0 ^ •P in 0 in in Ti 13 0 td 0 P 0 ffi u S
Ci o -p
in td
rH fd
O P
o p o in
o o IS
0
p)
fd >
Cil
o
0 p td
rH U CM ffi
-H O O > no u in p in rH H r-i p td
in
•H
0 P td rH j : ; U rH - H
•H fd rH
Pi > u
> 1 -p •H
u p 0 u p <
cn p 0
CnX(
td
p
o 2
in H
td U
Ci 0 > td
0
•H
0 rH rH fd >
c:
CO
o u in •H p p
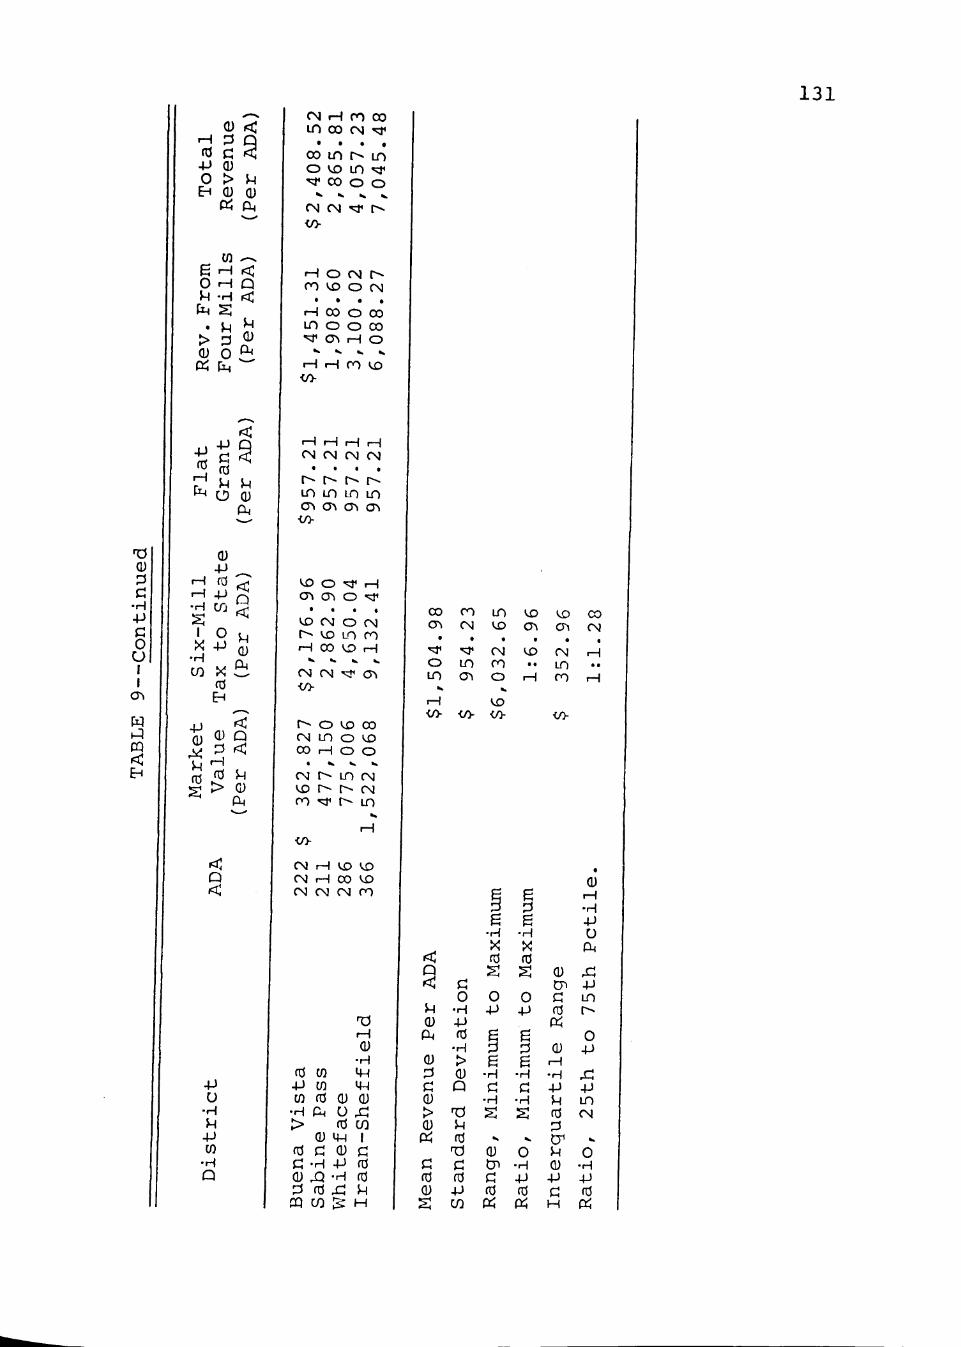
131
0
(3 •H •P n o u I I
cr.
Ciq PI CQ <
fd -P O
EH
0
0 > P 0 0 Pi PM
en ^ B '-i < O rH p p -H <;
0 0 * ^ Pi fH "^
• p td
rH CM
- P
fd p o
<
p 0 p
• H
I X
• H CO
-P 0
P fd
0 •P fd -p CO
o • p
X fd
<
u 0
CM
0 p 0 <
fd >
p 0 eu
p
-P u
•H P -P in
•H P
CM rH ro 00 in 00 CM 'sf
• • . • 00 in r^ in o vo in ^
"^ CO o o
CM CN 'cj' r^
rH o CN r^ ro vo o CM
• • . . rH CO O 00 in o o CO •^ <7 rH o
rH r-i cn KO
CM ( N CM CM . I • .
t^ r- r- r^ in in in in <T> cy\ cT\ a^
-co-
VO O "^ rH C5 O^ O •<;I' • « • •
vo CM O CM ( VO LO ro r-i CO KD r-i »> •. K ..
CM CN "^ O^ •00-
r-- o VO 00 CM in o vo 00 rH O O
• V •» K
CN r^ in CM vo r^ r~« CM ro - r^ in
CM rH vo VD CM rH 00 vo CN CN CM ro
td tn -P in in td
•H CM >
0 fd a C -H 0 JQ 0 fd jri CO
rH 0
-H m vp
0 0 u xi (^ CO
m I 0 Ci p> fd •H fd
p :s M
CO r o i n VD VD CO C3 CM v o CTv CTi CM
'=^ " ^ CM v o CM rH o in ro • • i n •• in a> o rH ro rH rH ( ^ </)- -t/y </>
P <
P 0
P^
0 C3
0 > 0 Pi
td 0
</>
$3 O
•H - P fd
• H > 0
P
P td
fd p> CO
B •H X fd
o •p
B •H Ci
•H
0
Id
B
B -H X fd
o -p
B
B
• H
•H
O •H 4J fd
Pi Pi
0 r-i •H -P
u CM Xi -P in r--
O -P
xi -P in
t d CM
P O 0 -H P> Pi Ci td M Pi
0 cn c td Pi
0 r-i • H P> p
132
$13,905). The ratio does not compare favorably with that
seen in Models Three and Four (1:3.68), but represents
substantial improvement over Model One (1:22.54) and
Model Two (1:13.51).
The data presented in Table 9 reveal a mean revenue
per ADA of $1,504.98 and a standard deviation of $954.23.
Although the standard deviation of revenue per ADA in
Model Five is approximately twice that statistic for
Models Three and Four, it represents substantial improve
ment over the sister model. Model One (S.D. = $1,669.90).
In comparison with Model One, the full range of revenue
per ADA in Model Five is reduced (from $15,081.63 to
$6,032.65); likewise, the interquartile range is reduced
from $882.41 to $352.96. An interquartile comparison
reveals that Clint I.S.D. (seventy-fifth percentile) would
receive 1.28 times the revenue per ADA as Coleman I.S.D.
(twenty-fifth percentile), compared to 1.83 times under
Model One. In its significant effect, then. Model Five is
more equalizing than Models One and Two, yet less equaliz
ing than Models Three and Four (see Table 11).
Model Six
Model Six, to reiterate, is a power equalization
model in which each district selects a given tax rate and
the state guarantees a certain level of revenue per ADA

133
CL! PI
EH
PI
§ H Pi -< <
> 9 < EH
ffi Pi EH Pi O H CLI CM ^ CM CM
P
PI <C P
Pi
8 I I
H <C CO
PI
p o
PI IS o H EH PQ H < > ^
H Pt I
Cil
a Ci:i CLI
Cq H > o CQ < :
CO CM O >^
1 2 CQ H
EH CO
H fd 4-J 0 EH
0 <c 0 P C < 0 > P 0 0 Pi P
p» 0
•H <
0 -P fd -P CO
0 0
c fd
P 0 CM
<:
td
0 - p fd Pi
-P 0 M P fd
f P O ^ P CM CM ^
in
•^ - H
0 P 0 <
td >
p 0
PH
p
-p u
•H P •P in
•H P
H O O O O r H O C M O r H O ^ O H O C M O H O C O O r H O r ^ c J ^ l n G ^ r H c T ^ r o c T ^ r H o ^ H c ^ ^ r o o ^ r o a ^ r H o ^ L O O ^ r H a ^
r H r o - ' ^ r O r H r o c T i r o r H - ^ c j ^ r o - ^ r o c n r o r H r o n r r O r H f ^ r H c M ^ r M r H c M c r > r > j r H r o v D C M r o c N c r \ C M r H C M ' ^ r M r H C M
</> r-i r-i ,-i r-i r-i r-i r H r H r H r H r H r H
c ^ r H i n o o o c N ' ^ o o r H ^ ' N r o o r H ' v i ' c r i r ^ ^ o c o c N C O c r . i n L n v D V D i n r o i n o i ^ ' ^ r ^ c r . o o r ^ c o i n i n c o f o o o o o
o o v O r H " ^ c r \ ' ^ r ^ ' ^ c r « r O L n c n r o r H r - r ^ v D M < ' ^ o o v o r o c o r o r - - r ^ i n r o r s i c 3 > c o v D O C M c o o c M v o t ^ r o c M c 3 ^ 0 L n c T ^ O r H c ^ \ c o a ^ ^ ^ c o r ^ o o r H o o c o o o v o r ^ v D ^ - c o v D v o v D
•co-
• « : j ' c r i r o o r o o o c o o r H o > o v D r o c n o O r H ' ^ v o o o r - c y ^ c N r H c o o r o - ' c j ^ r o c T i ' ^ r H r H r ^ r H r o o L O O i n r o r ^ i n c M O
i n r H c o c O ' ^ r o c N r o i n ^ c o o o L n v o c M o r ^ r o ' ^ c T i r - ' ' ^ C M o r - v o L n o v D ' 5 3 ' C M r - > - c o o v o r o v D r - - r o o r M r o o o o r H C M C M C M r N j r o c N r o r o r o i n ' s j ^ ' ^ ' ^ r O ' ^ ' v r L n v o i n i n i n
c 7 ^ o c M O C J ^ o o ^ o c 7 ^ 0 L O O r ^ o c o o c r ^ o c M O c n o r-i r-i r-i rH rH r H r H r H r H r H rH r H r H r H rH
L n c 3 ^ c r i 0 0 c o f ^ o o r o c T » r - ^ v D r o ( y > c N r H i n v o L n r ^ v D C M O r O V D C O t ^ r O r - ^ ' ^ C M r H ^ ' r H O O C M O r H C O V D l O V D O c r . r H r H c o c M r o o o r O r H ' ^ c M O o r o v D r o o v D r i o c n r o ^
r o o r o v D O O o c M ' ^ v D r ^ c r . o c M r o i n r ^ c o o r ^ j r o v D O D r H C N C M C M C M r o r o r o r o r o r O " N r ' ^ ' v r ^ ' ^ ' < ^ i n i n L O i n L n
C T i r H r H ' ^ r H O O C O O O V O L n C O V D C n C O r H r ^ r H O C M O O L r ) " ^ ' = : r ' ^ o o r o c r > r ^ " ^ v D o o v o r ^ c r \ r H v D ^ i n L n o > o r ^ c n r o L n t ^ ( N ^ r H v D r ^ r o c M C N o r o ' C ^ r o i n c r > r ^ i n ' = i < v D
CO CM •^ v o r H CM CM '=^
O
0 P fd PI
in rH rH 0 [2
in cn 0 ci rH
•H r-i U -P -H PA rH >
c CO > i 0 in p 0 6 > P (D r-i Q) (D (D Q) o CnrH rH ^ in E T5 C < Ci fd O P fd u D^ u 0 fd Pi S <C <: Pi CM
Q) rH rt:
rH 0 TJ
T5 c:
•H
a c fd CM
C td
rH P td Q) Cx
fd •H rH rH 13 CM 1
X 0 0 P
u 0 CM td p o
c td £
0 r-i r-i •H >
0 M r-i 0
u
fd
n3 0 TJ 0 rH ^ 0 in -H T?
d rH TS UH C 0 rH in
U T) 0 P3
P to
P P 0 u
c: 0 c ro Q) Ti "^ r-i
•H > , 0 TJ P rH P -H CM U CQ S
0 0 P U 0 c x> 0 in p p 0 P rH 0 CM CM

134
0
c • H 4->
O u r
P I PQ
EH
rH (0 -P 0 EH
0) < 3
Q) > 0 (<
9 U 0) CM
4J 0
T> ,-^ •H < < Q
0 S -P
(d •P
<
P 0 CM
w
0
0 0
c ^^ td
0'-] <: Pi'd
s p rH ^ 0 fd I CM ^ p ' ^ o r PI f^
0 -p td Pi
-p 0
u fd
0
r-i fd >
m r H rH • H
< P <:
p 0 fU
p
u • H P •P cn
• H P
C M O H O H O - ' ^ O r M O r H O H O C N O C M O H O H O r H O r o c r » r o < 3 > » r H c r > o c r > r o c r » r H < y > r o o ^ o o c r » r o o N H c r » c n < y v r H < y > o r > • o ^ r ^ ^ ^ ^ r H ^ ^ o ^ ^ ' 3 ' ^ ^ c J ^ ^ ^ o ^ ^ • o ^ ' ^ ^ ^ o ^ ^ ^ ' ^ r ^ ^ o ^ m ^ r o ^ ^ r o c N r o < T \ r O r ^ r o ^ ' * r o r o c J ^ r o r H r o • ^ f n r H r o o ^ C M r o c N l H C N V D C N O ^ C M r ^ c N r o r o l n c N c y ^ c M ^ ^ c M c o c N r ^ c N
r H H H r H r H H r H </>
p H r H r H r H r H r H r H r H r H r H r H r H
v D c o r O r H r ^ o O r H o o C T > o o c 3 ^ i n r ^ o i n < N o o r o r H r H o i n r ^ r o i n r o c N r o c o r ^ c N r H o o r ^ r H c r » o o i n o o o ^ o o v o ' d ' r H O ( T » c M
r O i n C N r H r H V D r H r H i n C M ' * C r » ^ r H V O O ' * r H r H O r H C N i n ' v r o o c N l n ^ - » c 3 ^ ' * " « d * C N l n ^ ^ l n c M v o v o c M V D ^ ^ r o c J ^ o o o v D i n v o v o t n ' ^ ' d ' i n ^ r o r o c N C M C M r H rHcM'^vooocr* '^
</>
v o c M c o c 3 ^ ^ C M r o c M r o c M r M L n ^ o r - - o o o r o c N r H r H i n o o r o t ^ i n o i n c N r H o o r - ^ r H a \ c 3 > ' 5 j ' " ^ r ^ o o o r - » r ^ r O ' ^ c 7 > O r H
vocNr>-vDCMrH<y\vo '>* incr i r^ '? j 'voror^ 'NrcrNinooocr iocN o o r o c M o o ^ ' s r r * < T » v o c o r o r » c N t ^ r ^ r H L n r ^ i n v o ' ! * r o o o T ; ) ^ v o r ^ v o v o r > • o ^ ^ v o o o o o o ^ r H O ' * C M O r o r o v o o o r ^ ^ - •
r H r H r H r H r H r H r H r H C N C N C M C N
</>
00 O rH O ON rH rH rH
O -^ O rH rH rH
00 O (Ti O rH O rH rH rH
r O O O O O C T i O r H O C T i O
i n c M o o c r ^ o c M r H c N ^ c N ' ^ L n c M o r ^ o o o r o v o r H c M i n c N r o ' ! ; j * L n c T \ i n v D r H r o r ^ i n r H C M c r » c M ' * v o o i n t ^ r o r o c r » c 3 ^ " ^ r H o o c M O v o r o r H r H v o o t n r o r ^ c N V D r o r ^ c o c 3 ^ v D o o « : l ^ ( 3 ^ r o c N
o o ^ v o o o r H ' ^ [ ^ C J ^ c o o o r o ^ ^ c M ^ ~ r o r H r H r ^ o v o l n r o c o o v o v o v D v o r ^ r ^ r ^ r ^ o o c o c r > c r s o o r H C N r o r o i n v o o o o r o t ^
r H r H r H r H r H r H r H H r H C M C N C M
•l/>
ID cn CT\ "^ rH vo O CTv CN ro vo 00
in
r-{ r-i in 00 rH
^ i n c o r o c j ^ r o c o c N o o o o c M v o c N O i n i n v o o i H r O r H o o i n c M r o o o o o ^ r H v o r o r o c M C M r H o o r ^ • v r r o c 7 > r M r ^ r o i n o o o o r M r o r ^ ' ^ c o i n r H r ^ ' ? r r H r H
r H r-i rH rH
ro
> 1
O
cn fd CnT5 O fd
CO p 0 >
•H Pi
B • H
T3 0 > i 0 O P
r H ^ CM E H
O -P in 0 O
tn c
•H fd
rH CM
in in o p u
15 O
td 0
o -p rH O
tn td
td P
o p o Xi Ul
o o
•p ci td > Cxl
o
0 P fd
rH
u
0
o u in
•H p
CM
• H >
in r-i r-i fd
o P fd u
• H Pi
tn r H r H • H
> 1 0 4J
rH C rH - H td rH
> u
>1 +J • H
u p 0 X, u p <:
cn 0 P 0 0 Cnxi td
e p o 2
in • H rH rH fd u
0 > td x: 0
• H
p 0
rH rH fd
0 rH fd >
Ci
CO
o u in •H p P

0 0
• H -P C O U I I
o
PI p:i <
r-i fd 4J 0 EH
0 0 G 0 > 0 Pi
< P <
P 0 CM
T5 • H
-P 0 0 S -P
fd
CO
p
0 CM
0 0 tn td 0 "i <:
PH ^ ^ p
rH p 0 fd 5 CM u ^ —
0 -p fd Pi
in
rH • H
•P 0
P td
0 p
rH fd p > 0
CM
p
-p u
• H P +J in
•H P
135 fN O rH O CO C7 ro <T>
• . • « o r^ o^ r^ C3 ro "^ ro cr\ CM ro CM
r-i r-i r-i <A-
O O vo CO ro vo r t^
• • . . CN ro in CM rH ro r- 00 o> in rH cr>
*• ». V K
rH ro r- ro
</>
CM o r^ 00 vo in o VD
• • . » CM rH i n o O r- CM CM
C3 r^ i n CM
CM -^ 00 i n r-i
•co
co O rH O r-i r-i r-i
t ^ O VD 00 CM i n O VD 00 M o o
* . ». Vi V.
CM r-« i n CM VD r-- r^ CM ro '=1^ t~-- i n
-co-
CN rH vo VD CN rH 00 VD CM CN CN ro
fd p i in
•H
in tn td CM
> 0
td Ci Ci -H 0 X! 0 fd CQ CO
rH 0
•H i p vp
0 0 U X, td CO
UH I 0 Ci 4J td •H td X^ P IS H
CM
p <
p 0
CM
0 0 0 > 0 Pi
c td 0
vo
o • H p> fd
•H > 0 p
p fd
T3 Ci fd p) CO
CM 00
cr>
CO o^ r o CM •'^ O CM H t ^
-co- </> -l/)-
CM
</>
• H X fd
o -p
B 0 B
• H Ci
• H
• H X fd
o -p
B 0 B
• H ci
• H
0 Cn c: td Pi
0 rH • H -p p td
p 0 -p
Pi Pi H
0 cn Ci td
o •H
fd
0 l-i •H p> u
CM
X -p i n
o -p
xi -p i n CM
o •H pi fd Pi

- 136
for that given rate (see Table 2). The state, in turn,
receives the result of the selected tax rate as applied
to the taxable valuation of the local district; receipt
may be in the form of a chargeback or in the form of
monies remitted to the state, as in Model Five. Again,
it may be noted that the most affluent district in the
sample has 109.46 times the market value per ADA as the
least affluent district ($1,522,068 to $13,905). Never
theless, the equalization features of Model Six (state-
set minimum and maximum tax rates, as well as "kinks"
above ten mills) result in a ratio of revenue per ADA
between the two extreme districts which is only 1:1.71
($990.32 to $1,694.14). This ratio is lower than that
seen in any of the other five research models (see
Table 11) . The results of the application of Model Six
to the sample districts may be observed in Table 10.
The data derived from the application of Model Six
to the sample districts reveal a mean revenue per ADA of
$1,228.34 and a standard deviation of $149.76. The full
range of revenue per ADA is $703.82 (from $990.32 to
$1,694.14), and the interquartile range is $123.79 (from
$1,114.11 to $1,237.90). An interquartile comparison
reveals that the district at the seventy-fifth percentile
would receive 1.11 times the revenue per ADA as realized
by the district at the twenty-fifth percentile. Comparisons

137
between Model Six and the other five research models may
be viewed in Table 11 below. In its significant statisti
cal effect, Model Six is more equalizing than any of the
other research models; however, no allowance is made for
local tax leeway above the state-guaranteed program.
Comparison of the Models
Comparisons of the relative efficacy of the six
research models in equalizing educational expenditures may
be made through reference to the descriptive statistics
accruing from the models and by inspection of the total
revenue per ADA derived by each district from each model.
Descriptive statistics for the research models are pre
sented in Table 11, and total revenue per ADA, by district
and model, appears in Table 12.
Cursory consideration of the descriptive statistics
represented in Table 11 indicates that Model Six, the Power
Equalization Model, is superior to the remaining models in
nearly all respects: (1) smallest standard deviation,
(2) least skewness and kurtosis, (3) smallest range of
scores, (4) lowest ratio of minimum and maximum scores,
(5) lowest interquartile range, and (6) smallest inter
quartile ratio. The fact that Model Six also reveals the
lowest mean revenue per ADA is also significant since the
mean for Model Six ($1,228.34) varies little from the "true
mean" for each model ($1,237.90). The "true mean" may be

r H r-i
cq i-Q CQ <: EH
C=q K EH
s o Pi CM
O 2 CO M PI D M Pi P
u o u s: <
ffi CO o U Pi M !< iri CQ CO CO M U^ EH Pi < EH X CO H
CO Ciq > H EH CM H Pi U CO CQ P
138
0 X
O CO
0 ^
o-
'"' p 0 ^
o °
rH 0 0 0 Ti P O X
rH
0 o
O B
0 0
o o
p O
U-i Ul
o •H -P in •H fd -p CO
0 <: 0 P
<
p 0
Ci 0 > 0 Pi CM
:.34
,2
28
T~i •CO-
.98
,5
04
.76
14
9
.23
95
4
.18
CM
.95
134
.43
r-^
.86
r-i CM
.79
o
.48
• ^
.32
99
0 .8
3
r012
r-i
r694,
r-i
00
,045
,
CM 00
703.
in VD
.032.
r-i
1:1.
VD CTi
1:6.
CTi
123.
vo CT\
352.
r-i r-i
1:1.
CO CM
1:1.
</)-
vo
00
o CO
•co-
ro
CO
rH
CT\ CM •
in o
•CO
ro CN VD
in ro •
vo
VD CO
CM
CO
t
in CM in CM
CN r-i
CO
vo
VD CO •
rH (N
CO o ro •
ID CM
in ro rH
t
ro vo
rH
VO
CM
o rH
o
ro
ro ro •
VD rH
o
CO VD
ro in
00 VD
ro
00
VD
" ro
o
CTi
VD
vo
vo
vo CO CM
VD CO •
r-i CM
00 o •
•«:f - ^ 00
CO
rH
o r-i rH
r-i •
ID in
O rH
,-i ID
cn rH • t
r-i
cr> vo
t
r^ rH VD
ro rH
ro r-i
ro in
o VD
• LO O CTi
r H
00 i n
• i n CO ro CM
r^ ro r--ro ro
vo CO
r H CN
CO ^ "sf
ro CM
i n r^ CN
vo CO
vo i n r-» i n rH
ro vo
r H 00
o
15,
^ i n
• CM CM • •
r H
rH ' v l '
• CN CO CO
CO 00
• • fl
r-i
<A-
c td 0 S
Ci 0
•H +J td
•r-i
> 0 P
n3 P fd
T i Ci fd -P CO
p 0 p p Ciq
^ p fd
T) c td -p CO
in •H in 0 -p p 0 «
in in 0 Ci ^ 0
X CO
e 0 B
• H
c •H S
e CJ
e •H X td S
0 t j i C td Pi
g :3 B B
-H 13 C B
•H -H S X
fd
- s 0 •H 0 -P P fd Pi
0 r-i •H -P P td 0 0 Cri cn P C 0 fd -P Pi C
H
0 r H •H P P td ^ 0 cr-H p p 0 td -p Pi Ci H
139
construed as the actual total dollars in revenue generated
by each model (see Table 1) divided by the sample ADA
(see Table 3).
If the fact is accepted that Models Three and Four
generate identical descriptive statistics, then the ranks
of the models in terms of smallest standard deviation are:
(1) Model Six, (2) Models Three and Four, (4) Model Five,
(5) Model Two, and (6) Model One. Such an ordering is
generally in agreement with that ranking expected and dis
cussed in the Review of Related Research. Model Three, as
pointed out above, would seem to have two advantages over
Model Four: familiarity and simplicity. Therefore, rela
tive ordering, omitting Model Six, might be: Model Three,
Model Four, Model Five, Model Two, Model One. The expected
order from previous research was: Model Three, Model Five,
Model Four, Model Two, Model One.
Several other facts are apparent, some of which have
been alluded to earlier in this chapter. First, a flat
grant model is more equalizing than a complete local sup
port model, but a flat grant model which takes into account
local tax wealth (Model Five) is more equalizing than a
simple flat grant (Model One). Second, a Strayer-Haig-
Mort equalization plan with a high required tax rate and
low local leeway (Model Three) is more equalizing than such
a plan with a low required tax rate and high local leeway
140
(Model Two). Third, at a foundation support level of
$1,097.49 per ADA, a percentage equalization formula with
a constant factor of .465 has the same effect on net state
aid as an eight-mill chargeback (as seen in Model Three).
A less apparent fact is that although Model Six
creates less variance, it provides each district with less
state aid per ADA than Model Three at the eight-mill parti
cipation level; i.e., for any given district in the sample,
the amount of state aid derived from Model Three for eight
mills of effort would always exceed that derived from
Model Six by $107.17. Moreover, there is no local leeway
under Model Six, which accounts, in part, for the smaller
variance created by the model.
Upon first inspection, Model Six appears signifi
cantly more equalizing than Model Three since the standard
deviation for Model Six ($149.76) is less than one-third
of that for Model Three ($477.12). However, further
investigation bears out the point that Model Three is more
equalizing if the great disparities in local district
Market Value Per ADA are reduced. It may be recalled that
the most affluent sample district (Iraan-Sheffield) had a
Market Value Per ADA 109.46 times that of Laredo I.S.D.,
the least affluent sample district. If the wealth dis
parities were reduced, by widespread consolidation for
example, then Model Three might become more effective. To

141
be more specific, if the twenty Education Service Center
regions in Texas were considered as districts, the ratio
of Market Value Per ADA would be reduced from 1:109.46 to
1:5.44. The standard deviation of Model Three as applied
to the total population would be only $59.59 (see Appen
dix A), while that for Model Six would be $124.43 (see
Appendix B). The cogency of this comparison is to illus
trate that Model Six, the DPE model, equalizes well where
wide wealth disparities exist (as in Texas), but it is not
necessarily the best model in all situations.
Table 12 sets out the total revenue per ADA derived
from each model by each sample district. In reviewing
these data one must keep in mind that the total revenue per
ADA realized by each district is the result of ten mills
of local tax effort for all models except Model Six.
Model Six, as seen in Tables 2 and 10, involves variable
tax efforts. If total revenue per ADA under Model Six is
considered at the ten-mill level of effort for all dis
tricts, the resulting total revenue per ADA would be
$1,237.90 in every case. Comparison with other models
then becomes more feasible.
It may be observed in Table 12 that Model Six gener
ates the most total revenue per ADA of any model for each
district in the third and fourth quartiles of wealth
(Laredo through Three Rivers) plus one district in the

142
CN
cq PI PQ < EH
P I H O O S
Q
U H Pi EH CO H P
>H P3
P < :
oi Ci:j PU
D
CQ > Ci:j Pi
PI < EH O
0 X
O CO
0 ^
0
o
p
o CM
rS S ^ P
0 o
O EH
0 0 ^ Ci o o
-p u
• H P -P W
• H P
i H O O O O r H O C M O H O ^ O r H O C M O r H O C O O r H O f M O r H O
^ ^ c J ^ l n o ^ r ^ c y ^ r o c J ^ r - ^ c J ^ r ^ c 5 ^ ^ o c J ^ r o a ^ r ^ c ^ ^ l n c J ^ H o ^ r ^ a ^ t o o ^
r H r O " « ; r r o r H r o c r i r o r H r o < n r o « ; r r o ( T \ r o , H n ^ f * i M c n c i ^ r o 5 ' f o
r H C N ^ C N r H C N O ^ C M H C M V O C M C O C N C ^ C N H C M ^ C M H C M O ^ C N ^ C N H <0-
r-H r-i r-\ ,-{ r^^ r H r H r H r H r H r H r H r H r H r H r H r H r H r H
r o r - ' O r ^ r o C T ^ v D O ^ - » o a ^ o ^ ^ c N m o r ^ r ^ m r » * * r * c N c y > C M O L n o o r ^ o o i n c M L n r ^ i n r ^ o o c N ' ^ ' s j ' v o i n c M V D L n ' ^ o v o o o L n c N V D C o
C N t ^ C J ^ C M O O O O O ' d ' r H V O ^ O V O r H C O i n r H O O i n r O C M O C D O r H r H H r O ' s f v o t ^ r ^ o o c r t o o r H C M C M r o r o - ^ i n i n v o r - o o o ^ O r H C M r o O O O O O O O O r H r H r H r H r H r H r H r H r H r H r H r H r H r H C M C M C M C M
r H H r H r H H H r H r H r H r H r H r H r H r H r H rH rH rH rH
i n ( y » ^ i n r o i n r H ' ^ o c r > < * f ^ ' * i n i ^ c N ' ^ o o r o o r H o o L n v o ' * i n C N v o t ^ o c T H O r H o v o r H o o c r > c r > i n c r i r o i n c r i ' ^ c N o o c r i t ^ ^ i n
i n r * r o o r o o o r o v D c r > c N i n o o r H ' 5 j ' r ^ r H ' > r r ^ r H L n o ^ o o r o o > < ^ C M r o ^ i n L n i n v D v o v D r ^ r ^ r ^ o o c o o o c T i c r i c r i O O r H r H r H C M C M r o r H r H r H r H r H r H r H r H r H r H r H H r H r H r H r H r H r H C M r M r M C N C M C N C s i r s l
r H r H r H r H r H r H r H r H r H r H r H r H r H r H r H r H r H H r H r H H r H r H r H H r H
o ro in CM rH
r-* r-r>-ro rH
ro 00
ro ^ rH
in rH
o in r-i
cn \> cn in rH
r-rH
00 in r^i
• ^
CN
ro vo r-i
I^ ' l' ro 00 rH t^ ro C3
VD vo rH
CT\ CN
vo rH r rH
in r-rH
CM rH
<y\
r-H
O rH H
CM CO r-i
r ** CO r-i
cn r-i
00 00 rH
(y^ ^ r-i
cr> H
CM r "^ cr> rH
vo rH
00
cn r-i
CN VD
rH O CM
O •^
in o CM
CM CN
o rH CM
<T\ CM
<;J* rH CM
00 r-i
cr> rH CN
CJ C3
ro CN CN
o VD
CTi CM <M
r-i OJ
'=J» (') (M
rH r-i r-i r-i r-i rH r-i rH r-i rH rH rH rH rH rH rH
. ^ t ^ o o r H c y ^ r ^ r H o o v D r o c o r H r s ^ v D l n r H O L n v o o v o r H C M V D o ^ r ^ o v o o o o i n o o o o i n v o ' = * ' ^ o o c 3 ^ c n i ^ o o r H ' * c N i n v o ^ r o r o
^ ^ ^ 0 0 r ^ ^ a ^ v o r - - c y ^ c 0 r H C M C M r H r 0 L n r ^ a ^ r H " 5 3 ^ r H l n c N g ^ o ^ ^ -• ^ o o o r O ' ^ i n t - > o o c 7 ^ o r M r o ' v r i n v o i ^ c o c r i r H C M - ^ i n r > > o o o c M 0 0 0 0 C 3 ^ C r > ( T > C r t C T > C r i C r > O O O O O O O O O r H r H r H r H r H r H C M C N
•CO rHt-irHrHrHr-irHrHrHr-irHrHrHrHrH
c o r ^ r - o o c o v o r H O O r H r - - L n " ^ r H r ^ o c r i C O - ^ r o L n ^ o r o p v o r -c M i n o o - ^ o o L n S i n ' 5 o o v o r o c M C M ' ^ r H o o L n o o r - - o o c M v o t ^ H r -
l n r « ^ - c ^ l O O o ^ ^ a ^ r « o c o • ^ o ^ c M a ^ v o c N o ^ v o l n o ^ o ^ c o r ^ c M r ^ | v ^ { o o > S ^ S r - a ^ r H r M ' : ; r i n r - o o o c M f ^ i n r - o ^ c M ^ v o 2 C M ^ I ^ ( « ^ l - ^ O O O O O O O O C O C ^ < T t O ^ C r » < r > C r i O O O O O O r H r H r H r H ( N
rHrHrHrHrHrHrHrHrH
</>
O
0 P fd P I
in rH rH 0 12
Ci p 0 0 rH CnrH C < fd o
Pi s
tn cn Ci
•H P &. CO
0 0 r H ^ Cu fd CM O
> 1 0 g >
0 in o o Pi
0
• H > tn p 0 B p td
CM
0 TJ
O
0
c: • H
ci
td CM
(d rH p td 0 CM
B fd
•H rH rH :3 CM I
M 0 0 p u 0
Ci fd B
CM 0 fd rH P o o o
0
• H > o
in
td
U T 3
0 0 CQ 1-^
C3 pi o
o o in
n3
0 • H MH
0 TJ 15 H > i O P rH P
0 ci td
•H 0 CM U CQ S CM CM
0 O Ci 0 p o
rH
o p o XI Ul p -p o
> i p> Ci 0 Ul o P U 0
> Cn fd "H cnTJ Pi O td K Ti 0
> 1 0 e o p
•H rH x ; h) CM EH
Ci o p in 0 o

143
0 0
•H -P
O U I I
CN
CQ PI CQ < E H
•H 0 X 0 CO
iH O rH <r»
• • rH ^ rH cn
"3
0
O
0 g o o
rH 0 0 0
TJ P
2 - S tH
r H 0 O
O H
0
o
• p u
• H P 4J tn
•H p
' ^ O C N O r H O r H O C N O C N O r H O r H O r H O C M f - J r - i r ^ o o ^ ^ o < 3 ^ H < J ^ r o o ^ o o c 3 ^ r o c 3 ^ H S ? n S I H § ? o S ; ^ §
C N r o < r » r O r H r O ' « ^ r o r o r o c r » r o H r o ^ r o r H V D C N < r » C M r H C N r O C M i n C N c r » C M r H C M r O C M r H ^ K, K ^
r H rH </)•
T-i r-i rH rH rH rH rH ^ *• ^ K * ^ ^
r^ o t^ o> r~ ro cy» ro ^ ro CN <y> CN r o CM
rH rH rH rH rH rH rH rH rH
m v D r o o r o v D r H c r » o r ^ o o ' ; r r H o i n r o o o c r » o o v D C N r H r o o o v o v D t ^ < y > ^ c M i n r o r H t ^ v o o v o r H r ^ L n r H r H i n o L n o o c M ^
c N r o i n i n c r > r H o o o v o r ~ - 0 " ! d ' ' * ( y > < j > ^ < T » r o o o o o o i n r ^ i n ' ^ T i n v o r ^ o o r H r O ' ^ r v D O O r H ^ o o o i n c M c r ^ r ^ o ^ r o o v o i n ^ C N C N C N C N C M r o r o r o r o r o ' i : i ' ' * * ; f L n i n v o v o r ^ o o o ' ^ o o o o r H r H r H r H r H r H r H r H r H r H r H r H r H r H r H r H r H r H i H C M C N C N ' ^ r - *
^ ' N J ' t ^ ^ o ^ a ^ c y ^ c N l n ^ - O l n o c N o ^ o < y ^ c M r H r H o c M C M ^ ^ c j > « N r ' 5 r i n c M r H r ^ r ^ i n r o o o ' N r t ^ c r » c M L n r ^ r ^ r o < r » c o o v o < j ^ c r > i n r H v o r O ' i : j ' r o c M r H C M r o o o c N o o o t ^ ' * r o v D r H O ' * i n r O ' c r i n i n v o r ^ c o c ^ O r H C M - ^ v o t ^ o ^ r o v o o v o r o c M i n ' s f r o C N C N C N C M r M f M C N C M r o r o r o r o r o r o r o - < ; r - ^ i n i n v o o o o v o r H
</> r H i H r H r H r H r H r H r H r H r H r H r H r H r H r H r H r H r H r H C M C M - ^
r H r H L n r o o r H " ^ c o r o r ^ c M r H < y \ r o v o i n r ^ o o r ^ c M " ^ c r i o r o C N r ^ t ^ o o v D i n r H o c r > r ^ c M < j ^ r H ' * t ^ r H ' ! 4 ' ^ r H c y \ r H r ^ i n v D O i n r H V O r O ' ^ - ' c r r O r H C M ^ O r H C O O O r H O O L n ' ^ r ^ r O r H r ^ r H ' ! : j ' ^ i n L O v o r ^ o o c T t O r H C N ' ^ v D r ^ < y > r o v o o v o r o c M i n ^ ' * c M C N C M C M C M C N C N C N c o c o r o r o r o r o r O ' ^ r - ^ i n i n v o o o o v o r H
</> r H r H r H r H r H r H r H r H r H r H r H r H H r H r H C M O J - ' *
CNoocMoooco r ^vD inoo r> -vo in rHLncN*d<vDC3^ (T>c^»Ln ' *oo C N ' ^ V D ' ^ O C M C T l C N C M r H C M V D V O L n r H i n r H V O O r H ^ C ^ r - r H
V 0 i n V 0 ' « ^ 0 0 V 0 C h r H C M O O 0 0 C r > C M r H ' ^ L n " s r O C 0 V D V D r H r H ^ v D O O o c N V D c r i r o v o o « ^ < y > v D r H O r H ' = i ' r ^ o o c o o o c o t ^ o C N C M C M r o r o c o r o ' * ^ L n L n L n v o t ^ o o c r > O r H r o v D C M O r H " ^ ^ , J J ' ^ P ^ r H r H r H r H r H r H r H r H r H r H r H r H C M C M C N C M r O ' > r V O r H
rH </y
o o o c 3 > o c M o c M r o o o o i n v o o o r H ' * c r i o r o o r H i n o o ^ v o r ^cO ' ^CT^ r~> • rO ' ^ rH ' ^ I ^ l noocNVDa^ ln ' * rH rHvo rO ' ; J<vocMoo
c s ^ r ^ r ^ c M ' v D r H c T i ^ o o c N c T ^ r o ' ^ L n o j ' ^ r H v o c n o o ^ r - v o v o ^ ^ - o r o v o c N v o , H L n r H v o l n l n r H - : } ' 0 0 ^ ^ ; V D r o v D O O O u o c N C M r o c o r O " < ; ^ ' * l n l n v o v D ^ ^ o o c T ^ o c M r o l n c o c M r H r o c M ^ -
^ ^ ^ r H r H r H r H r H r H r H r H r H r H H C M C M C M C M C M r O ^ i n C O i n
in ci
•H
Id
tn
o tn T3 o td
o -P
tn fd
p U
0 rH
i H fd O P
- p Ci td >
o c 0 p fd
0 o p o
Xi Ul
o 12 H U CM ^ Pi
O u in
•H p
•H > in
fd
o ' d p fd u H
tn rH rH • H
> 1 0 -P H Ci rH -H fd rH
> u
>1 +J •H
u p 0 r-u p <
0 p 0 0 C n ^ Ci td B p o 2
in • H rH rH td U
Ci 0 > fd
0 td T)
rH -H PI EH
td
0 rH rH fd rH
> o Ci tn
13 P CO P
fd +J tn
•H >
fd Ci 0
0
in tn td CM
rH 0
• H MH MH 0 0
U Id CO
0 MH I 0 P •H
• H
Id ^ CO [2
Ci fd fd p

144
second quartile (Houston I.S.D.). For the remaining
twenty-four sample districts (Cross Plains through Iraan-
Shef field) , Model Six generates the least total revenue
per ADA of any model. This fact can no doubt be attributed
to the equalizing capabilities of Model Six; ie. , Model Six
is the most powerful model for transferring wealth (through
recapture) from affluent districts to poor districts.
Further inspection of the data in Table 12 reveals
that the order of preferred models by the third and fourth
quartiles, according to total revenue per ADA, is:
(1) Model Six, (2) Model Three, (3) Model Four, (4) Model
Five, (5) Model Two, and (6) Model One. This ordering
holds true for each district in the lowest two quartiles
plus Houston I.S.D. in the second quartile. It is note
worthy that such a ranking is identical to that seen above
for least variance created by the models. Again, this fact
is explainable in terms of each model's relative strength
in "robbing from the rich and giving to the poor."
Although such a practice might appear callous, it must be
remembered that judicial review has established that all
school taxes are state taxes (Wise, 1968).
The rank ordering of preferred models for the first
and second quartiles (minus Houston I.S.D.), according to
total revenue per ADA is: (1) Model One, (2) Model Two,
(3) Model Five, (4) Model Three, (5) Model Four, and

^T^W-
145
(6) Model Six. Again, this fact holds true for every dis
trict in the top two quartiles except Houston I.S.D. The
ordering is practically the inverse of that seen above for
the third and fourth quartiles and for the relative effi
cacy of the models in equalizing expenditures. Although
such facts are hardly unexpected in view of the nature of
the models, the fidelity of the research models to prin
ciples of equalization undergirds the conclusions set out
in the following chapter.
A comparison of the models, then, reveals that the
most efficient models in equalizing expenditures are Model
Six, a Power Equalization Model, and Model Three, a
Strayer-Haig equalization model with low local leeway and
high chargeback (or local fund assignment) rate. Moreover,
it is seen that the relative preference of models is
compatible with two principles: (1) the more equalizing a
model is, the more likely it is to be preferred by dis
tricts in the lower half of the wealth continuum; and
(2) the more equalizing a model is, the less likely it is
to be preferred by districts in the upper half of the
wealth continuum. Model Six is seen as superior in all
respects in power to equalize, but Model Three has features
which might be preferred, such as local tax leeway and
simplicity. Model Two, which is similar in some respects
to the present Foundation School Program in Texas, is more

146
highly preferred by affluent districts because of great
local leeway.
Summary
The data generated by the application of the six
research models and a dummy model (complete local support)
to the sample districts are presented in both tabular and
narrative form. The relative efficacy of each model in
equalizing educational expenditures is discussed. Model
Six is seen as the model creating the least variance; that
is, having the smallest standard deviation of total reve
nue per ADA. Model Six is follov/ed by Models Three, Four,
Five, Two,and One. The ordering approximates that expected
after a reviev/ of related research.
It is also seen that Model Six exhibits power to
equalize expenditures when the wealth disparities of dis
tricts are great, but Model Three might be more effica
cious in regional equalization. Moreover, the fact is
presented that the more equalizing a model is, the more
likely it is to be preferred by poor districts in terms of
total revenue per ADA realized for equalized tax effort.
CHAPTER V
SUMMARY, CONCLUSIONS, AND RECOMMENDATIONS
Summary
Public school finance in the 19 70s is in the throes
of an egalitarian revolution. Throughout the nation state
legislatures have worked, and are continuing to work,
fundamental changes in school finance structures in order
to substantially equalize educational opportunities in
respect to available revenue per pupil. Judicial interven
tion, political pressure, and increased public conscious
ness concerning the inequities of many systems have been
the chief impetuses for change. The state of Texas, des
pite its comparatively vast fiscal resources, enjoys no
special position among the states relative to equalization
of school finance; in fact, by some measures, Texas has
one of the least equitable systems.
The purpose of the dissertation is to investigate
alternative approaches to the development of a school
finance plan which would tend to equalize available reve
nue per pupil in the school districts of Texas as they
were organized during the 1975-1976 school year. The
problem is stated in terms of three national issues:
(1) rapid escalation of educational costs juxtaposed with
147

148
relatively stable tax resources available in many school
districts, (2) increased public demand for accountable
educational outputs despite dilating educational responsi
bilities and dwindling resources, and (3) equity in the
allocation and revenue dimensions of public school finance.
Moreover, the problem is also seen in terms of the present
situation in Texas; i.e., the Texas school finance system
is presently undergoing revision, and the revised state
plan should be judicious (in terms of equity) as well as
expeditious. The desirability of a more equitable system
in Texas has been emphasized by generic inequity in school
finance throughout the nation, the Rodriguez case of 19 71
and 1973, aroused public sensibilities, and the fact that
Texas has an inequitable system.
The background of the study is presented in terms of:
(1) the history of public school finance in Texas since
1876, (2) a review of related literature on the development
of conceptual theories of state support for education, the
legal aspects of public school finance, and alternative
solutions for equalizing public school finance; and (3) a
review of research related to the research undertaken in
the dissertation.
The history of public school finance in Texas is
portrayed as a tale of slow development marked by inequi
ties and intermittent crises. For many years inequities

149
centered upon disparities between educational opportuni
ties in urban and rural districts, and some effort was
made by the state to equalize opportunities in rural dis
tricts in the period 1915 to 1949. After World War II,
escalating educational costs as a result of increasing
enrollments and inflation led to widespread school finance
reform through the Gilmer-Aikin Laws of 1949, which insti
tuted a minimum foundation program concept founded on the
Strayer-Haig-Mort theories of equalization. The inequi
ties of the Minimum Foundation Program were accentuated
in 19 71 by Rodriguez v. San Antonio Independent School
District, a case which upheld the constitutionality of the
Texas Minimum Foundation Program, but which also raised
the level of consciousness of the body politic relative
to school finance inequities, subsequently leading to cur
rent reform attempts.
The development of conceptual theories of school
finance is discussed through reference to the financing
plans devised by Cubberley, Strayer, Haig, Mort, Updegraff,
Morrison, and modern theoreticians. The principal theories
which have emerged in the 1900s all point the way toward
equalization: foundation program equalization, percentage
equalization, power equalization, and full state funding.
The legal aspects of school finance are presented within
the scope of basic legal principles and recent court
150
rulings affecting school finance equity. Alternative
solutions discussed include theoretical models and models
actually implemented by various states in the post-Serrano
era.
The review of related research emphasizes the studies
conducted by the National Education Finance Project, and
more especially the research which tested various state
financing models as applied to a hypothetical prototype
state. In addition, attention is given to other research
similar to that undertaken in the dissertation and to
reflections on the constitutionality of various models.
Related research also indicates results which might be
expected from the application of the research models
utilized in the dissertation.
The research design of the study was patterned after
the approach employed by the National Education Finance
Project. The 1,095 school districts in Texas were ranked
from poorest to most affluent in terms of Market Value
Per ADA, utilizing actual data utilized for 1975-1976 by
the Texas Education Agency. From the population was drawn
a systematic sample of fifty districts. The amount of
total revenue (state plus local) generated by each model
was held relatively constant to enhance comparisons of the
models studied. Comparisons were to be made from descrip
tive statistics, principally the standard deviation of
151
revenue per ADA resulting from the" application of each
model.
The models which were applied to the sample of Texas
school districts were: (1) a Dummy Model, based on com
plete local support, which was used for comparison pur
poses; (2) Model One, a Flat Grant Model with no equaliza
tion features; (3) Model Two, a Strayer-Haig-Mort Equaliza
tion Model with a low chargeback rate and high local leeway;
(4) Model Three, a Strayer-Haig-Mort Equalization Model
with a high chargeback rate and low local leeway; (5) Model
Four, a Percentage Equalization Model; (6) Model Five, a
Flat Grant Model with some equalization features; and
(7) Model Six, a Power Equalization Model generating speci
fic revenues from designated local tax efforts.
The analysis of the models entails a presentation of
the data generated by the application of each model to the
sample. This presentation is made in both narrative and
tabular format. In addition, the relative efficacy of each
model in equalizing expenditures (available revenue) is
discussed, and Model Six (Power Equalization Model) is seen
as the most superior model in nearly all respects. Addi
tional comparisons reveal that Model Six may not be the
most efficient model in all cases, but it has substantial
power to equalize highly disparate wealth, such as that
found among Texas school districts. Model Three is also

152
seen as a workable model which has the advantages of some
local tax leeway and familiarity.
Conclusions
The conclusions derived from the study presented in
Chapters I through IV may be differentiated into two cate
gories. First, several conclusions are apparent from the
application of the research models to the sample of Texas
districts. Second, a number of conclusions are evident
from the review of related literature and research. In
both cases the conclusions offer insight into the current
status of public school finance in Texas and offer indica
tions of preferred future directions and needed changes,
some of which are incorporated in the Recommendations
below.
1. Consideration of the Dummy Model (Table 4), which
is based upon complete local support, suggests that the
wealth disparities among Texas school districts are stag
gering in magnitude. It must be concluded that Texas suf
fers under the weight of at least three of the four causes
of school finance inequities listed by Burrup (1974):
(1) inadequate district organization; (2) the existence of
small, inefficient districts, many of which cannot be
justified in terms of geographic isolation, and (3) dif
ferences in ability and effort among districts. It is
^giMmMtiamm

153
likewise evident that efforts to alleviate the fourth
symptom, unsound legal and financial provisions, will be
constrained by the first three. The Governor's Committee
(1968) reached the same conclusion, but no actions were
taken relative to the group's consolidation proposal.
2. A cursory analysis of Model One reveals that a
flat grant approach to financing schools can equalize
available revenue to some extent, but such equalization is
minimal and counterproductive to extensive equalization
(Cubberley, 1906; Johns and Morphet, 1975). Ramifications
of such a notation are not without substance, for Texas
currently utilizes the flat grant method in its constitu
tional and legislative provisions for per capita appor
tionment. In 19 75-19 76, the flat grants in Texas amounted
to more than $200 per pupil in average daily attendance
(Tron, 19 76). Further inequities are actuated by the cal
culation of such funds as a chargeback against districts
receiving state aid (Texas Education Code, Section 16.254)
while wealthy "budget-balance" districts, which receive
no Foundation School Program aid, continue to receive this
flat grant allotment.
3. A conclusion evident from analysis of Model Two
is that a minimum foundation program equalizes to some
extent, especially in comparison with a flat grant model,
but that heavy reliance upon local tax wealth in the model

154
is counterproductive to significant equalization. m
essence, a low chargeback rate tends to disequalize
because the greater portion of the foundation program grant
is made without recourse to local ability. Such a conclu
sion has present and future ramifications. First, the plan
utilized in Texas in 1975-1976 under H.B. 1126 employed a
three-mill chargeback rate, just as in Model Two. Second,
although the chargeback rate was increased to 3.5 mills for
1976-1977 under H.B. 1126, some current proposals, in view
of increased equalized market values for 1977-1978, envi
sion a lower chargeback rate or no chargeback at all (full
state funding of the Foundation School Program). Such
actions must be viewed as regressive in terms of equalizing
the Foundation School Program (T.A.C.I.R., 1976).
4. Model Three illustrates an interesting contrast
to Model Two and forces the conclusion that the higher the
chargeback rate in a foundation program, and the lower the
allowance for local leeway, the greater the equalization.
This conclusion is not revolutionary since it has long
been a guiding principle of public school finance (Johns
and Morphet, 1975) . It is likewise apparent that a plan
such as Model Three has at the root of its feasibility the
corollary need of a high foundation support level since
local leeway is restricted. The notion of a high founda
tion support level, incorporating all reasonable maintenance
155
and operation costs, is not foreign to Texas, having been
suggested on numerous occasions (e.g.. Governor's Com
mittee, 1968; J.I.S.C, 1973).
5. An investigation of Model Four, as it is con
structed in the dissertation, leads to two conclusions:
(1) a percentage equalization method with the same support
level as Model Three will produce substantially the same
available revenue per ADA, and (2) the formula involved in
Model Four is essentially the same as that utilized by
Texas in its State Equalization Aid component (Texas Edu
cation Code, Section 16.302), an "add-on" to the Founda
tion School Program. Therefore, an expanded Strayer-Haig-
Mort model, as exemplified by Model Three, carried out as
"equalized percentage matching" beyond the foundation
level, would have the same effect as State Equalization
Aid on revenue above the foundation level and the added
advantage of greater equalization of the Foundation School
Program. In essence, the current dual system of a plan
for all schools and an additional plan for poor districts
would be eliminated.
6. The preeminent conclusion derived from the
application of Model Five is the fact that a flat grant
model with some equalization provisions has greater power
to equalize than a simple flat grant model (Model One).
Such a point is, of course, apparent at face value. The

156
importance of such an illustration in the research is,
first, to indicate the need to equalize the flat grant
portion of Texas school funds. Second, Model Five reveals
the advantages of a state ad valorem tax over a charge
back; i.e., recapture is covert rather than overt, and the
redistribution of ad valorem tax monies is placed on the
same basis as other state taxes (e.g., sales tax, gasoline
tax), which are not construed as contingent to the geo
graphic area or political subdivision in which they are
collected. Finally, the fact that Model Five is less
equalizing than Models Three, Four, and Six must be con
sidered by those who advocate full state funding of the
Foundation School Program, for such a scheme involves, in
effect, a high-level flat grant without a proviso for a
state tax or a chargeback.
7. Consideration of Model Six leads to the conclu
sion that a district power equalization model would create
the least variance of available revenue per ADA of any
model tested, given the gross disparities in wealth among
Texas districts. Such a model is not without antecedents
in Texas school finance history, having been heavily
endorsed by the Joint Interim Senate Committee to Study
School Finance (1973). However, the timing of the pro
posal, which was released only one day after the Rodriguez
reversal by the Supreme Court, was a decided disadvantage,
mmmt

157
as was the liberal nature of the idea (Yudof and Morgan,
1974). Nevertheless, the efficacy of the model in equal
izing expenditures is substantiated by the research.
Relative advantages and disadvantages of the model, as
well as some pitfalls, are discussed below.
8. The review of related literature indicates five
major approaches to equalization incorporated by states in
the 1970s: (1) district power equalization, in variant
forms; (2) increased state financial aid to schools;
(3) restriction of tax rates through establishment of legal
maximum rates; (4) utilization of cost differentials such
as weighted pupil indices, adjusted instructional unit
indices, cost of living indices, sparsity formulas, etc.;
and (5) improvement of property tax administration.
9. There are at least three weaknesses inherent to
most school finance reform endeavors in the 19 70s, and
these have tended to thwart equalization efforts: (1) lack
of recapture provisions in state aid formulas, (2) allow
ance of voter override of maximum tax rate limitations, and
(3) inclusion of save-harmless provisions in the new struc
tures. The last, although definitely a weakness from a
theoretical point of view, is also viewed as a political
necessity in most cases (Grubb, 1974).
10. The Strayer-Haig-Mort foundation program equal
ization theory was significant in its time, for it led to

158
improved quality in education, but it does not provide for
a high level of equalization in its basic form of minimum
support levels and low required tax rates. The general
weaknesses of the minimum foundation program idea are:
(1) foundation support levels are generally too low and
create excessive reliance upon local wealth; (2) the system
tends to disequalize unless property values are equalized;
(3) the system lags behind in an inflationary economy;
(4) the system makes no allowance for self-imposed tax
efforts; and (5) as a rule, no cost differentials are
included.
11. Although district power equalization exhibits
substantial strength in equalizing available revenue per
student, the theory is not without weaknesses. First,
there is absence of strict fiscal neutrality since dif
ferentiated spending is actually encouraged within a band
of minimum and maximum legal tax rates. In truth, almost
any plan other than full state funding suffers from lack
of fiscal neutrality and provides some degree of wealth
discrimination. Second, the plan may actually disequalize
in some cases because of the differentiated spending
levels. For example, it must be remembered that the sample
districts in Model Six are clustered rather tightly around
one taxing level (ten mills). There is no guarantee that
such a clustering would occur in reality. Also, when
159
applied to less disparate wealth groups, as in the com
parison of Education Service Center regions in Chapter IV,
Model Six may actually be inferior to Model Three. Third,
the method may serve to accentuate social class distinc
tions as various districts establish their self-imposed
taxing levels and spending limits. Fourth, the district
power equalization approach may fail to encourage consoli
dation (see the first conclusion above) and possibly would
reward the inefficiency of high-cost districts. Finally,
the plan would tend to stimulate local property taxation,
which, in view of the regressive nature of the property
tax, would not be recommended (Benson, 1975a; 1975b).
12. Full state funding of education is seen as
having a number of advantages, including fiscal neutrality,
but the system is not without disadvantages: (1) a com
paratively high cost to the state in terms of state tax
resources, especially if the property tax is abandoned;
(2) the demonstration effect of "lighthouse districts"
might be lost; (3) a centralized educational bureaucracy
could well result; (4) local community participation and
interest might decrease; and (5) the public schools would
be placed in competition with other state agencies and
services, including higher education, for funds.
13. Efforts at school finance reform, despite
judicial intervention and increased public sensibilities,
160
have been hampered in Texas and the nation as a whole by:
(1) citizen and legislative apathy; (2) mindless accep
tance of traditional and archaic school finance plans;
(3) lack of informed state leadership; (4) inadequate dis
trict organization; and (5) fear in a great many school
districts and states of the liberalization of school
financing plans.
14. The public school finance system of Texas must
be substantially altered if available revenue per pupil
is to be at least approximately equalized and if the state
school finance system is to attain fidelity with general
principles of school finance equity.
Recommendations
Recommendations are made in respect to two concerns:
(1) preferred future directions and changes in public
school finance in Texas, and (2) suggestions for vitally-
needed research-. Recommendations in regard to the former
concern are, in a large measure, a method of summarizing
the findings of the study. In regard to the latter con
cern, it is certain that the suggestions will not be
exhaustive. Recommendations 1, 2, and 3 should be con
strued as viable alternatives; that is, each of the three
recommendations is faithful to the findings indicated
above.

161
1. Given a state goal that expenditures are to be
equalized, Texas should adopt a district power equaliza
tion approach to public school finance. The shortcomings
of the model have been pointed out above; to this list
must be added a concern over whether parental aspirations
should dictate the quality of a child's education. Never
theless, the model has demonstrated strength to reduce
inequalities in available revenue per ADA among Texas dis
tricts, as indicated in Chapter IV (see Tables 10 and 11).
Moreover, Updegraff (1922); Guthrie (1975); and Coons,
Clune, and Sugarman (1970) have extolled other virtues of
the plan: (1) encouragement of local participation in
educational decision-making; (2) local differences are
based upon local preferences, not upon wealth constraints;
and (3) centralized bureaucratic authority is avoided.
The system also allows utilization of the vast tax
resources available at local levels; i.e., local property
taxes, a domain largely unmolested by other taxing agen
cies. If adopted, the district pov/er equalization
approach should: (1) provide for a high level of support,
based upon need, at each given tax rate since there is no
recourse to additional taxation for maintenance and opera
tion costs; (2) contain a recapture provision; (3) provide
for minimum and maximum legal tax rates to insure equali
zation; (4) involve "kinks" which discourage excessive.

162
disequalizing expenditures; and (5) subsume Recommenda
tion 4 below, as well as subsequent recommendations.
2. In the absence of adoption of a district power
equalization approach, the state should alter its current
Foundation School Program to: (1) reflect a high charge
back, or local fund assignment, rate; (2) limit local
leeway above the foundation provision; (3) provide a high
level of support for the foundation program, based upon
actual maintenance and operation costs rather than politi
cal expediency; (4) incorporate a recapture provision; and
(5) subsume Recommendation 4 below, as well as subsequent
recommendations. Inherent disadvantages of most founda
tion programs can be avoided by: (1) provision of a high
support level, relieving reliance upon local taxation;
(2) equalizing property values across district lines;
(3) responding to actual needs relative to school operat
ing costs; (4) adding an equalized local initiative
provision to reward self-imposed tax efforts (see Recom
mendation 3); and (5) including cost differentials for
different types of pupils, geographic locations, and other
considerations (see below).
3. As an alternative approach to either of the
above recommendations, the state could adopt a combination
of the foundation program approach (as seen in Recommenda
tion 2) and district power equalization (in a more limited

163
sense than seen in Recommendation 1). m such a case, the
foundation program support level would remain high, and
other features mentioned above would be retained except
for the maximum tax limitation. Expenditures above the
foundation program level; i.e., local leeway expenditures
would be equalized through a limited DPE approach. The
district power equalization feature would need to be
"short and flat"; that is, the reward for effort would not
tend to disequalize available revenue per pupil to an
undesirable degree. In surveying Model Three it has been
noted that at eight mills of required effort, disregarding
local leeway, expenditures are equalized. Local leeway is
unequalized, but local leeway is deemed advisable for
local participation reasons. A combination of Model Three
and Model Six, with Model Six applying to expenditures
above the foundation level, would seem to be practicable.
4. Regardless of the financing plan adopted, the
state should continue to improve property tax administra
tion since this tax source, given its productivity of
school revenue, will not likely be abandoned in the near
future. The state should continue efforts to equalize
property assessments in all classes of property across
the state, and should implement plans to improve local
tax offices, to standardize assessments among taxing juris
dictions, and to improve assessment practices. It is

164
further suggested that the state investigate the effects
of various "circuit-breaker" provisions in respect to
property taxation with a view toward reducing the regres
sivity of the property tax. Moreover, consideration should
be given to the study of the possibilities for inclusion of
a municipal overburden provision in the state funding for
mula. In addition, the state must and should conduct
research into the effects of allov/ances in the funding for
mula for: (1) homestead exemptions, (2) other constitu
tional tax exemptions, (3) agricultural use valuation of
property, (4) nontaxable land, (5) uncollected taxes
(within limits), and (6) uncollectable taxes.
5. Regardless of the financing plan adopted, the
state should conduct research into the equalization effects
of a weighted pupil method of allocating funds, continuing
the use of the ADA statistic.
6. Regardless of the financing plan adopted, the
state should provide categorical grants above the founda
tion program (or the basic guarantee, in the case of DPE),
based upon demonstrated need, for: (1) transportation,
(2) community education, (3) textbooks, (4) bilingual edu
cation, (5) driver education, (6) reimbursement for tax
losses (see Recommendation 4), (7) school food services
(for that portion not provided from federal funds), and
(8) school building funds, if Recommendation 7 is adopted.
In each case, full state funding would be warranted.

165
7. Regardless of the financing plan adopted, the
state should give due consideration to the equalization of
capital outlay, construction, and debt service expendi
tures at some future juncture. Thorough research into the
impact of such a concept would determine the method to be
employed; e.g., full state funding according to need,
annual equalized categorical grants, etc.
8. Regardless of the financing plan adopted, the
state should give consideration, after research into the
effects, to inclusion of various cost differentials, sucli
as: (1) sparsity index, (2) cost of living or "cost of
doing business" indices, and (3) municipal overburden
index (see Recommendation 4).
9. Regardless of the financing plan adopted, the
state should avoid aspects of public school finance pro
visions which tend to thwart equalization, given a state
goal of equalization of available revenue per pupil.
Examples might be lack of a recapture provision, voter
overrides of taxing and/or spending limits, and save-
harmless provisions. In the case of the last pitfall,
some provision is needed for orderly and gradual transi
tion, but such save-harmless provisions which become
politically or fiscally expedient should not be of such
permanence as to create a dual school finance system.
166
10. Regardless of the financing plan adopted, the
state should, through constitutional amendment and legis
lative action, discard the flat grant method of distribu
tion of revenues from the Permanent School Fund and
Available School Fund (meaning that portion of the A.S.F.
other than revenue from the P.S.F.). These monies, which
are in excess of one-half billion dollars annually (Tron,
19 76), should remain earmarked for education; however,
they should be allocated in the same manner as other state
aid to the schools.
11. Regardless of the financing plan adopted, the
state should encourage consolidation of non-justifiable
small districts through reinstitution of incentive aid
payments. The need for incentive aid payments is accen
tuated by the fact that district power equalization, a
preferred financing plan (see Recommendation 1), tends to
thwart consolidation (Guthrie, 1975). Incentive aid
should be placed on an "actual needs" basis; that is, con
solidations incurring no additional costs to the receiving
district should not be rewarded.
12. Regardless of the financing plan adopted, the
state should encourage regional cooperation through the
Education Service Center structure for high-cost academic
services and high need/low availability educational ser
vices. Moreover, such services should be adequately
funded by the state.

167
13. The state of Texas should authorize and under
write comprehensive research studies to establish state-
prescribed indicators of need relative to categorical
grants (see Recommendation 6) and cost differentials (see
Recommendations 5 and 8).
14. Recommendations for further research, some of
which are reiterative, are:
viable pupil classifications for weighting purposes;
viable pupil weights for funding purposes;
effects of constitutional property tax exemptions on school revenue;
development of a municipal overburden index based upon Texas-prescribed needs;
development of an improved sparsity index (which rewards only necessary small districts) and related studies of the fiscal effects of rural isolation;
development of regional "cost of doing business" indices;
viable indicators of need relative to transportation, food services, health services, community education, and other categorical grants;
impact and methods of equalizing capital outlay, construction, and debt service costs;
impact of the redistribution of P.S.F. and A.S.F. monies;
- determination of services most efficiently administered on a regional basis; and
- effects of incentive aid payments upon consolidation.

LIST OF REFERENCES
Advisory Commission on Intergovernmental Relations. State Aid to Local Governments. Washington, D.C.: Thi Commission, 1969.
Bean, Scott W. "A Determination of the Extent of Law Changes Affecting Increased Equalization in State School Finance Laws." Doctor's dissertation, Brigham Young University, 19 74.
Benson, Charles S. Education Finance in the Coming Decade. Bloomington, Ind.: Phi Delta Kappa, 1975a.
. Equity in School Financing: Full State Funding. Bloomington, Ind.: Phi Delta Kappa, 1975b.
Benson, Charles S. and Shannon, Thomas A. Schools Without Property Taxes: Hope or Illusion? Bloomington, Ind. Phi Delta Kappa, 19 72.
Biennial Reports of the State Superintendents of Public Instruction. Austin: State Department of Education, 1876-1950.
Boyett, Pennie. "Grant Jones." The Abilenian 5 (Spring 1976) :6~7.
Bralley, F. M. "Local Taxation for Educational Purposes in Texas." Bulletin of the Conference for Education in Texas 1 (September 1907):5-11.
Burrup, Percy E. Financing Education in a Climate of Change. Boston: Allyn and Bacon, 19 74.
Burruss v. Wilkerson, 310 F. Supp. 572 (Virginia), 397 U7S. 44," 90 S. Ct. 812 (1970).
Caldwell v. Kansas, No. 50616 (Kan. Dist. Ct., 1973).
Committee for Economic Development. Educating the Disadvantaged. New York: The Committee, 19 70.
Connor, Seymour V. Texas: A History. New York: Thomas Y. Crowell, 1971.
168
169
Coons, John E.; Clune, William H. Ill; and Sugarman, Stephen D. Private Wealth and Public Education. Cambridge: Harvard University Press, 1970.
Cooper, Lewis B. The Permanent School Fund of Texas. Fort Worth: Texas State Teachers Association,' 1934.
Cubberley, Ellwood P. School Funds and Their Apportion-ment.. New York: Teachers College Press, 1906.
Eby, Frederick. The Development of Education in Texas. New York: Macmillan, 1925.
• Education in Texas: Source Materials. Austin: University of Texas Press, 1918.
Education Commission of the States. Major Changes in School Finance: Statehouse Scorecard. Denver: The Commission, 19 74.
Evans, C. E. The Story of Texas Schools. Austin: Steck, 1955.
Fleischmann Report on the Quality, Cost, and Financing of Elementary and Secondary Education in New York State. 3 vols. New York: Vikincj Press, 19 73.
Gilmer-Aikin Comm.ittee. To Have What We Must. Austin: The Committee, 1948.
Goldhammer, Keith. "Local Provisions for Education." In Designing Education for the Future, No. 5: Emerging Designs for Education, pp. 73-132. Edited by Edgar L. Morphet and David L. Jesser. New York: Citation Press, 1968.
Governor's Committee on Public School Education. The Challenge and the Chance. Austin: The Committee, 1968.
Governor's Office, Education Resource. Preliminary Reporjt of the Governor's Office, Education Resources: Public School Finance. Austin: G.O.E.R., 1976.
Grubb, W. Norton. "The First Round of Legislative Reform in the Post-Serrano World." Law_and Contemporary Problems 38 (Winter-Spring 1974):459-492.

170
Guthrie, James. Equity in School Financing: Power Equalizing. Bloomington, Ind.: Kappa, 1975.
District Phi Delta
Henderson, J. L. "Educational Conditions in Texas and in Other States." Bulletin of the Conference for Education in Texas 1 (September 1907):12-18.
Hoffman, Earl. "What Did the Supreme Court Say in Deciding Rodriguez?" School Management 17 (May 19 73): 9, 12-13.
Hooker, Richard L. Issues in School Finance: Primer. Austin: Boards, 1972.
A Texas Texas Association of School
Horie, William J. "Alternative Plans of Financing Arizona's Public Schools." Doctor's dissertation, Arizona State University, 1974.
Horton V. Meskill, 31 Conn. Sup. 377, 332 A.2d 813 (1974).
Hutchins, Clayton D. "New Developments in School Finance Systems." In Financing Education for Our Changing Population. Edited by the National Education Association Committee on Educational Finance. Washington, D.C: National Education Association, 1961.
Johns, Roe L. , et al. , eds. Alternative Programs for Financing Education. Gainesville, Fla.: National Education Finance Project, 1971a.
Johns, Roe L.; Alexander, Kern; and Jordan, K. Forbis; eds. Financing Education: Fiscal and Legal Alternatives. Columbus, O.: Charles E. Merrill, 1972.
Johns, Roe L. ; Alexander, Kern; and Stellar, Dewey H.; eds. Status and Impact of Educational Finance Programs . Gainesville, Fla.: National Education Finance Project, 1971b.
Johns, Roe L. and Morphet, Edgar L. The Economics and Financing of Education: A Systems Approach. 3rd ed. Englewood Cliffs, N.J.: Prentice-Hall, 1975.
Johns, Roe L. and Morphet, Edgar L. Planning School Finance Programs: A Study Guide. Gainesville, Fla National Education Finance Project, 19 72.

171
Joint Interim Senate Committee to Study School Finance Report on Public School Finann^. Austin: The Committee, 19 73.
Jordan, K. Forbis, and Alexander, Kern. "Constitutionality of Alternative Models." In Planning School Finance Programs: A Study Guide, pp. 67-77. Edited by Roe L. Johns and Edgar L. Morphet. Gainesville, Fla.: National Education Finance Project, 1972.
Jordan, K. Forbis and Hanes, Carol E. "Financing Education m an Era of Limits." Phi Delta Kappan 57 (June 1976):677-678, 681.
Lane, J. J. A History of Education in Texas. Washington, D.C: Government Printing Office, 1903.
Management Services Associates. "Briscoe's New School Program." MSA Tax Correspondent 1 (Early November 1976a):1.
Management Services Associates. "Full State Funding Urged." MSA Tax Correspondent 1 (Late November 1976b):1.
Mclnnis v. Shapiro, 293 F. Supp. 327 (Illinois 1968).
McKay, S. S. Seven Decades of the Constitution of 1876. Lubbock, Tex.: By the author, 19 43.
Milliken v. Green, 389 Mich. 1, 203 N.W.2d 459 (1972), vacated, 390 Mich. 389, 212 N.W.2d, 711 (1973).
Morrison, Henry C School Revenue. Chicago: University of Chicago Press, 1930.
Mort, Paul R. The Measurement of Educational Need. New York: Teachers College Press, 1924.
Mort, Paul R. et al. State Support for Public Education. V7ashington, D.C: American Council on Education, 1933.
Mort, Paul R. and Reusser, Walter C Public School Finance: Its Background, Structure and Operation. 2nd ed. New York: McGraw-Hill, 1951.
Nie, Norman H. et al. SPSS: Statistical Package for the Social Sciences. 2nd ed. New York: McGraw-Hill, 1975.

172
Northshore School District No. 417 v. Kinnear, 84 Wash. 2d 685, 530 P.2d 178 (1974).
Phi Delta Kappa Commission on Alternative Designs for Funding Education. Financing the Public Schools: A Search for Equality. Bloomington, Ind.: Phi Delta Kappa, 19 73.
President's Commission on School Finance. Schools, People, and Money. Washington, D.C: Government Printing Office, 1972.
Robinson v. Cahill, 118 N.J. Super. 223, 287 A.2d (1972), aff'd and modified, 62 N.J. 473, 303 A.2d 273 (1973).
Rodriguez v. San Antonio Independent School District, 337 F. Supp. 280, 286 (W.D. Tex. 1971), rev'd, 411 U.S. 1 (1973).
Roos, Peter D. "The Potential Impact of Rodriguez On Other School Reform Litigation." In Future Directions for School Finance Reform, pp. 268-283. Edited by Betsy Levin. Lexington, Mass.: D. C Heath, 1974.
San Antonio Independent School District v. Rodriguez, 411 U.S.'l (1973).
"School Finance Reform Varies in States." Education U.S.A. 19 (September 13, 1976):12.
Serrano v. Priest, 5 Cal. 3d 584, 487 P.2d 1241 (1971).
Shannon, Thomas A. Has the Fourteenth Done It Again? Washington, D.C: American Association of School Administrators, 19 72.
Shannon, Thomas A. "Rodriguez: A Dream Shattered or a Call for Finance Reform?" Phi Delta Kappan 55 (May 1973):588.
Sher, Jonathan P., and Thompkins, Rachel B. Economy, Efficiency, and Equality: The Myths of Rur^_School and District Consolidation. Washington, D.C: National Institute o£ Education, 1976.
Shofstall V. Hollins, H O Ariz. 88, 515 P.2d 590 (1973).
173
Simler, Ellis L. "A Comparison of Financing Iowa Public Schools for the Year 1971-72 with the Alternative Financing Models Developed by the National Education o^^owa ^igv^""^'" ^^^^^^^ ' dissertation. University
"States Are Searching for Education Money." Education ^'S.A. 19 (January 24, 1977) :153, 160. ~ '
Steen, Ralph W. Twentieth Century Texas: An Economic and Social History. Austin: Steck, 1942. ~
Still, Rae Files. The Gilmer-Aikin Bills: A Study in the Legislative Process. Austin: Steck, 1950.
Strayer, George D. and Haig, Robert M. The Financing of Education in the State of New York. New York: Macmillan, 1923.
Texas Advisory Commission on Intergovernmental Relations. Texas Public Schools and Property Taxes: Steps to Equality and Equity. Austin: The Commission, 19 76.
Texas Constitution of 1845.
Texas Constitution of 1876.
Texas Education Agency. "Rank Order Run/Market Value Official Compilation/Ranked on MV per ADA." Austin: T.E.A., 1976.
Recommendations of Legislative Consideration on Public Education in Texas: Public School Finance Plan. Austin: T.E.A., 1972.
A Special Supplement to Recommendations for Legislative Consideration on Public Education in Texas: Public School Finance Plan. Austin: T.E.A., 1973.
Texas Education Code. Texas Education Agency Bulletin 760. Austin: " T.E.A., 1975.
Texas Research League. Bench Marks for 19 76-77 School District Budgets in Texas. Austin: T.R.L., 1976.
Texas Research League. The Minimum Foundation School Program in Texas. Austin: T.R.L., 1957.
174
The Road VJe Are Traveling. Austin: T.R.L., 1956.
Texas Public School Finance: A Majority of Exceptions. Austin: T.R.L., 1972.
Texas State Teachers Association. Recommendations of the TSTA Committee to Study Public School Program and Finance. Austin: T.S.T.A., 1972.
Thompson v. Engleking, 96 Idaho 793, 537 P.2d 635 (1975).
Thurston, Lee M. and Roe, William H. State School Administration. New York: Harper and Row, 1957.
Tron, Esther 0., ed. Public School Finance Programs, 1975-6. Washington, D.C: Government Printing Office, 1976.
Updegraff, Harlan. Rural School Survey of New York State: Financial Support. Ithaca, N.Y.: By the author, 1922.
Van Dusartz v. Hatfield, 334 F. Supp. 870 (D. Minn. 1971).
Wise, Arthur E. Rich Schools, Poor Schools: The Promise of Equal Educational Opportunity. Chicago: University of Chicago Press, 1968.
Works, George A. et al. Texas Education Survey Report. 2 vols. Austin: Texas Education Survey Commission, 1925.
Yudof, Mark G. and Morgan, Daniel C "Rodriguez v. San Antonio Independent School District: Gathering tne Ayes of Texas- HEhe Politics of School Finance Reform." In Future Directions for School Finance Reform, pp. 85-116. EdTTed by Betsy Levin. Lexington, Mass.: D. C Heath, 1974.

APPENDIX
175
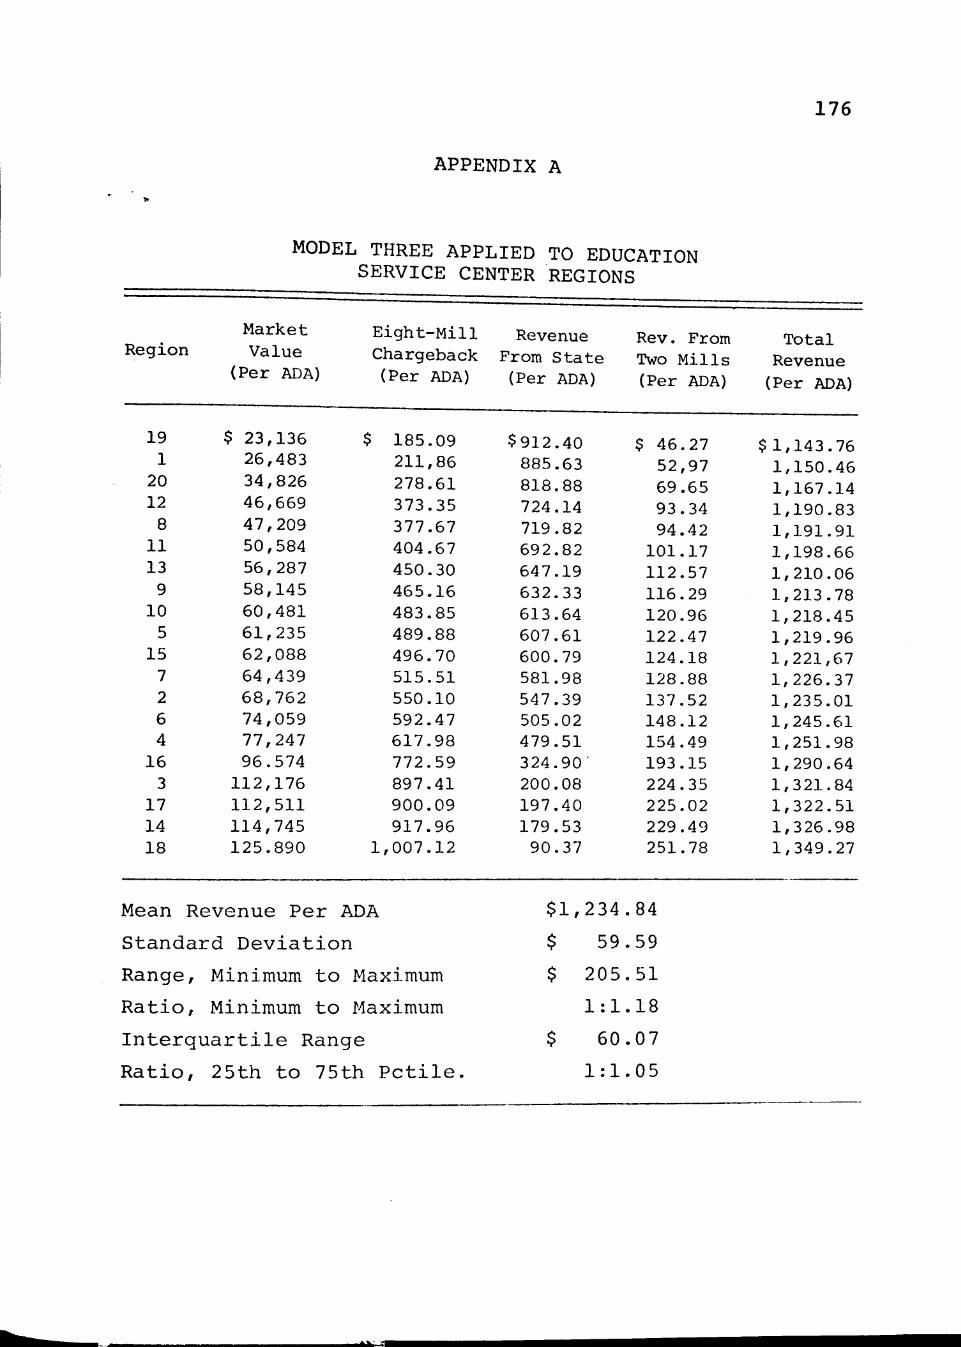
176
APPENDIX A
MODEL THREE APPLIED TO EDUCATION SERVICE CENTER REGIONS
Region
19
1 20 12
8 11 13
9 10
5 15
7 2 6 4
16 3
17 14 18
Market Value
(Per ADA)
$ 23,136 26,483 34,826 46,669 47,209 50,584 56,287 58 ,145 60 ,481 61 ,235 62 ,088 64,439 68 ,762 74,059 77,247 96.574
112,176 112 ,511 114,745 125.890
E i g h t - M i l l Chargeback (Per ADA)
$ 185.09 211,86 278.61 373.35 377.67 404.67 450.30 465.16 483.85 489.88 496.70 515.51 550.10 592.47 617.98 772.59 897.41 900.09 917.96
1 ,007.12
Mean R e v e n u e P e r ADA
S t a n d a r d D e v i a t i o n
R a n g e ,
R a t i o ,
I n t e r q i
R a t i o ,
Minimum t o
Minimum t o
l a r t i l e Rang
Maximum
Maximum
[e
2 5 t h t o 7 5 t h P c t i l e .
Revenue From S t a t e
(Per ADA)
$912.40 885.63 818.88 724.14 719.82 692.82 647.19 632.33 613.64 607.61 600.79 581.98 547.39 505.02 479.51 324.90 200.08 197.40 179.53
90.37
$ 1 , 2 3 4
$ 59
$ 205
1 :1
$ 60
1 :1
Rev. From Two M i l l s (Per ADA)
$ 46.27 52,97 69.65 93.34 94.42
101.17 112.57 116.29 120.96 122.47 124.18 128.88 137.52 148.12 154.49 193.15 224.35 225.02 229.49 251.78
.84
.59
. 5 1
.18
.07
.05
Tota l Revenue
(Per ADA)
$ 1 , 1 4 3 . 7 6 1,150.46 1,167.14 1,190.83 1 ,191.91 1,198.66 1,210.06 1,213.78 1,218.45 1,219.96 1,221,67 1,226.37 1,235.01 1,245.61 1,251.98 1,290.64 1,321.84 1,322.51 1,326.98 1,349.27
-'- '—
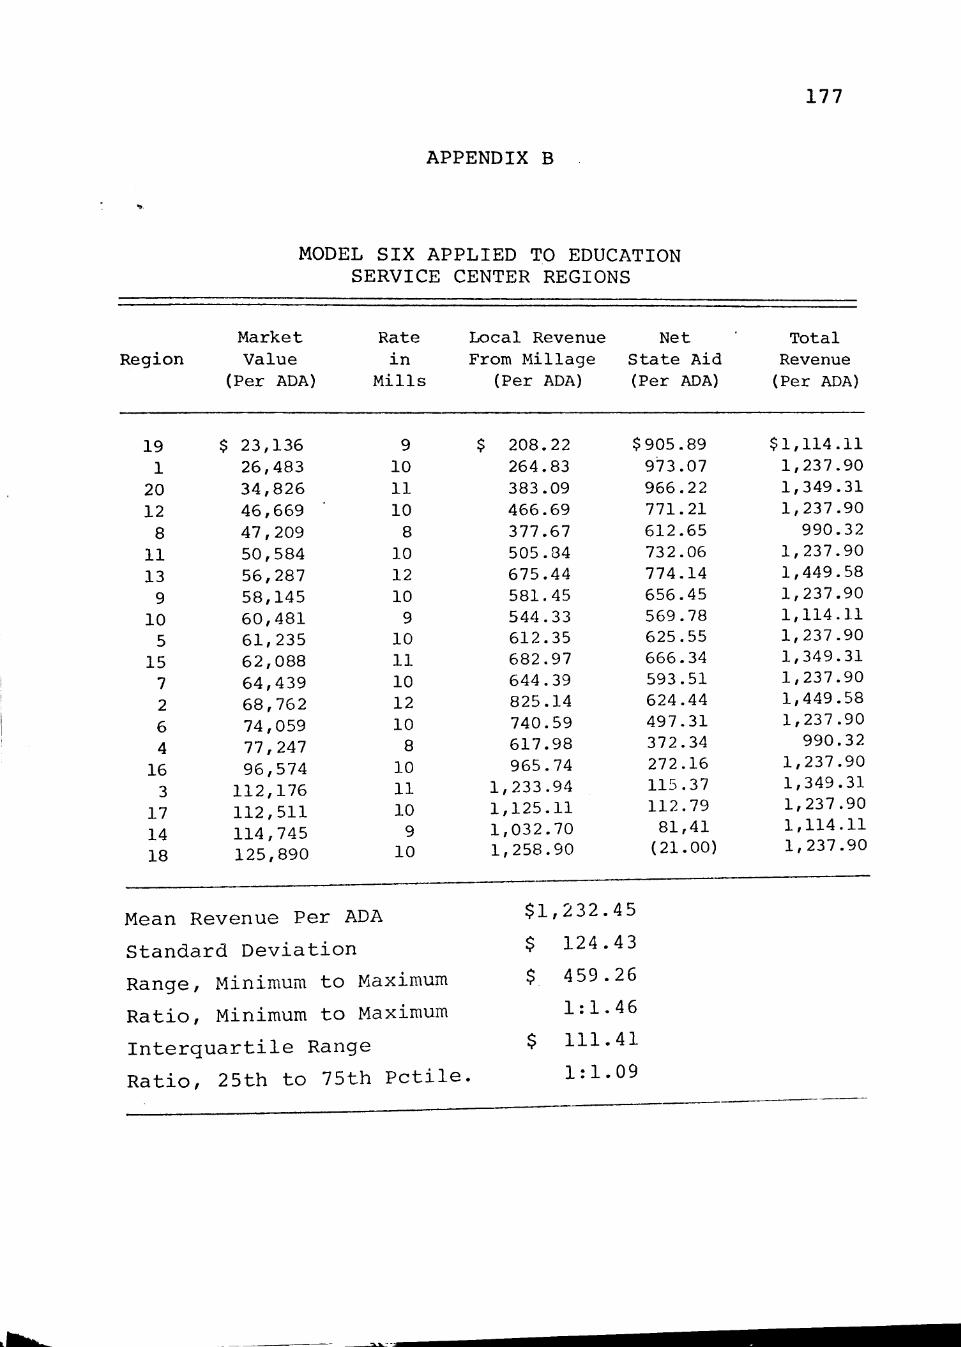
APPENDIX B
177
MODEL SIX APPLIED TO EDUCATION SERVICE CENTER REGIONS
Region
19 1
20 12
8 11 13
9 10
5 15
7 2 6 4
16 3
17 14 18
Market Value
(Per ADA)
$ 23,136 26,483 34 ,826 46,669 47,209 50,584 56,287 58,145 60 ,481 61 ,235 62 ,088 64 ,439 68 ,762 74,059 77,247 96 ,574
112,176 112 ,511 114,745 125,890
Rate i n
M i l l s
9 10 11 10
8 10 12 10
9 10 11 10 12 10
8 10 11 10
9 10
Mean Revenue Per ADA
Standai
Range,
R a t i o ,
I n t e r q '
R a t i o ,
cd D e v i a t i o n
Minimum t o Maximum
Minimum t o Maximum
u a r t i l e Range
25th t o 75th Pctile
Local Revenue From Mi l l age
(Per ADA)
$ 208.22 264.83 383.09 466.69 377.67 505.34 675.44 581.45 544.33 612.35 682.97 644.39 825.14 740.59 617.98 965.74
1,233.94 1 ,125.11 1,032.70 1,258.90
$ 1 , 2 3 2 .
$ 1 2 4 .
$ 4 5 9 .
1 : 1 ,
$ 1 1 1 .
1 : 1 .
Net S t a t e Aid (Per ADA)
$905.89 973.07 966.22 771.21 612.65 732.06 774.14 656.45 569.78 625.55 666.34 593.51 624.44 497.31 372.34 272.16 115.37 112.79
81 ,41 (21.00)
45
43
,26
,46
. 4 1
.09
Tota l Revenue
(Per ADA)
$1 ,114 .11 1,237.90 1,349.31 1,237.90
990.32 1,237.90 1,449.58 1,237.90 1,114.11 1,237.90 1,349.31 1,237.90 1,449.58 1,237.90
990.32 1,237.90 1,349.31 1,237.90 1,114.11 1,237.90
_

fiUkr