copyright by chunxiao zhu 2017
TRANSCRIPT

Copyright
by
Chunxiao Zhu
2017

The Dissertation Committee for Chunxiao Zhu Certifies that this is the approved
version of the following dissertation:
NMR Longitudinal Surface Relaxation Phenomena of Metal Oxide
Nanoparticles in Porous Media
Committee:
Hugh C. Daigle, Supervisor
Steven L. Bryant
Carlos Torres-Verdin
David A. DiCarlo
Thomas E. Milner

NMR Longitudinal Surface Relaxation Phenomena of Metal Oxide
Nanoparticles in Porous Media
by
Chunxiao Zhu
Dissertation
Presented to the Faculty of the Graduate School of
The University of Texas at Austin
in Partial Fulfillment
of the Requirements
for the Degree of
Doctor of Philosophy
The University of Texas at Austin
August 2017

Dedication
This is dedicated to my beloved parents, my dear husband, and little daughter.

v
Acknowledgements
This work was funded by University of Texas at Austin Nanoparticles for
Subsurface Engineering Industry Affiliates Program member companies (Maersk Oil,
Petrobras, Nissan Chemical America Corporation, Baker Hughes, Wintershall, and the
Foundation CMG). I additionally acknowledge Nissan Chemical America Corporation for
providing the zirconia nanoparticle dispersions; and Dr. Jimmie Baran of 3M for providing
the silica nanoparticles. I thank Dr. David Medellin for providing Matlab support to obtain
relaxation time of saturated Boise sandstone cores. The NMR inversion code used in this
study was provided by UT Austin’s Research Consortium on Formation Evaluation. I thank
Dr. Hugo Celio at the Texas Materials Institute at the University of Texas at Austin for
offering DLS ZetaSizer and TGA to test properties of nanoparticles, as well as performing
XPS to check nanoparticles composition and presence of surface coating.

vi
NMR Longitudinal Surface Relaxation Phenomena of Metal Oxide
Nanoparticles in Porous Media
Chunxiao Zhu, Ph.D.
The University of Texas at Austin, 2017
Supervisor: Hugh Daigle
1H Nuclear Magnetic Resonance (NMR) has long been applied in downhole
logging and laboratory analyses to investigate pore size distributions of rocks through
correlation with measured relaxation time distributions. However, due to the inherent
chemical heterogeneity of pore surfaces in rock, the pore surface relaxivity, which links
relaxation time and pore size, varies throughout the pore system. I seek to modify and
control the surface relaxivity in natural porous media through coating of paramagnetic
nanoparticles so that NMR measurements can be used to compute pore sizes directly.
I chose zirconia nanoparticle dispersions with opposite surface charge but similar
size. The absence of surface coating on zirconia nanoparticles simplified the calculation of
nanoparticle surface relaxivity and interactions between nanoparticles and pore walls.
Glass bead packs and Boise sandstone cores were saturated with positively charged
zirconia nanoparticle dispersions in which nanoparticles can be electrostatically adsorbed
onto pore surfaces, while negatively charged zirconia nanoparticle dispersions were
employed as a control group to provide the baseline of nanoparticle retention due to non-
electrostatic attraction. When 1.114 vol. % positively charged zirconia nanoparticles
dispersion was used to saturate a glass bead pack, 11.6% of the nanoparticles were
adsorbed to the bead surfaces and modified the glass bead surface relaxivity.

vii
I performed core flushing with DI water, pure acid and alkali, and compared
properties of zirconia nanoparticles before and after exposure to Boise sandstone. After 2
pore volumes of core flooding, there was around 3% of negatively charged nanoparticles
trapped in Boise sandstone core while around 30% to 40% of positively charged
nanoparticles were retained in Boise sandstone cores. The results indicated that besides van
der Waals attraction, electrostatic attraction is the driving force for retention of
nanoparticles with positive surface charge in sandstone cores. Full coverage of
nanoparticles onto sandstone surface was not achieved. The attachment of nanoparticles
onto sandstone surface changed the mineral surface relaxivity. After contact with Boise
sandstone, nanoparticles themselves exhibited increased relaxivity due to interactions
between nanofluids and mineral surface under different pH conditions. The complicated
interactions between nanofluids and pore surfaces make it difficult to predict sandstone
surface relaxivity with attached nanoparticles.
Since adsorption of nanoparticles changed the pore surface relaxivity, it is crucial
to know nanoparticle relaxivity and factors that may affect the relaxivity of nanoparticles.
T1 values of zirconia nanoparticle dispersions before and after mixing with various Fe(III)
solutions were measured and compared. Adsorption of iron onto zirconia nanoparticles was
confirmed based on measurements of aqueous Fe remaining in supernatants. Adsorbed iron
increases zirconia nanoparticles’ surface relaxivity, as the relaxation rate of zirconia
nanoparticles increased with the amount of adsorbed Fe(III).
Besides adsorbed paramagnetic species, surface coatings also play a role in
changing nanoparticle surface relaxivity. Since organic surface coatings usually give a
small value of relaxivity, it is better to use a nanoparticle core with high relaxivity as to
investigate the effect of organic surface coatings. I examined the relaxation properties of
(3-Aminopropyl)triethoxysilane (APTES) coated Fe3O4 nanoparticles in mixtures with

viii
different D2O volume fractions. Fe3O4 nanoparticles exhibited decreased relaxivity with
more APTES coating. The presence of D2O affects proton-proton relaxation but not
electron-proton relaxation. Comparison of relaxivity of APTES coated Fe3O4 nanoparticles
with different coating amount and D2O volume fractions indicated that at relatively high
Fe concentration, when electron-proton interaction dominates surface relaxation, hydrogen
atoms in the APTES did not significantly alter the surface relaxation mechanism of
nanoparticles. At lower Fe3O4 concentration, proton-proton relaxation brought by APTES
also played a role in the overall relaxation mechanism on nanoparticle surfaces, as more
APTES coating showed lower apparent surface relaxivities with higher D2O volume
fractions in the mixture.

ix
Table of Contents
List of Tables ....................................................................................................... xiii
List of Figures ........................................................................................................xv
Chapter 1 ..................................................................................................................1
Introduction ..............................................................................................................1
1.1 Motivation and objectives .........................................................................1
1.2 Outline of chapters ....................................................................................3
Chapter 2 ..................................................................................................................5
Background ..............................................................................................................5
2.1. Proton nuclear magnetic resonance in porous media ...............................5
2.2. Nanoparticles ...........................................................................................9
2.2.1. Zeta potential model and theory ..................................................9
2.2.2 pH values affect nanoparticle zeta potential and size ...................9
2.2.3 Paramagnetism ............................................................................12
2.3 Relaxation of saturated media involving nanoparticles ..........................13
2.3.1 Dispersion scale ..........................................................................14
2.3.2 Molecular Scale ..........................................................................16
Chapter 3 ................................................................................................................18
Nuclear Magnetic Resonance Investigation of Pore Surface Relaxivity Alteration with
Presence of Paramagnetic Nanoparticles ......................................................18
3.1 Introduction .............................................................................................18
3.2 Theory .....................................................................................................20
3.2.1 Bulk Relaxation of Paramagnetic Nanoparticle Dispersions ......20
3.2.2 Relaxation of Nanoparticle Dispersions in Porous Media ..........22
3.3 Methods...................................................................................................23
3.4 Results .....................................................................................................27
3.4.1 Zirconia Nanoparticles Characterization ....................................27
3.4.2 Bulk Relaxation Rate 1/T1 of Zirconia Nanofluids.....................28

x
3.4.3 Fluids with Glass Bead Packs .....................................................30
Evidence of Adsorption ..............................................................30
Adsorbed Nanoparticles ..............................................................32
3.4.4 Fluids with Boise Sandstone Core Samples................................35
Evidence of adsorption ...............................................................35
Adsorbed Nanoparticles ..............................................................37
3.5 Discussions .............................................................................................38
3.6 Conclusions .............................................................................................40
Chapter 4 ................................................................................................................42
Paramagnetic nanoparticles as NMR contrast agents in sandstone: Importance of
nanofluid-rock interactions ...........................................................................42
4.1 Introduction .............................................................................................42
4.2 Theory of relaxation calculation .............................................................44
4.2.1 Relaxivity of nanoparticles in bulk fluid ....................................44
4.2.2 Retained nanoparticles in Boise sandstone cores........................45
4.3 Methods...................................................................................................48
4.4 Results .....................................................................................................52
4.4.1 Pure fluids in cores: effect of pH ................................................52
4.4.2 Nanoparticle dispersions in cores ...............................................56
Negatively charged nanoparticle dispersion in Boise sandstone 56
Positively charged nanoparticle dispersion in Boise sandstone ..61
4.5 Discussions .............................................................................................66
4.5.1 General observations ...................................................................66
4.5.2 Negatively charged nanoparticles dispersion in Boise sandstone67
4.5.3 Positively charged nanoparticles dispersion in Boise sandstone 71
4.6 Conclusions .............................................................................................74
Chapter 5 ................................................................................................................77
Altering nuclear magnetic resonance surface relaxation on nanoparticles by
adsorption of Fe(III) ......................................................................................77
5.1 Introduction .............................................................................................77

xi
5.2 Relaxation theory ....................................................................................79
5.2.1 Relaxivity of nanoparticles in dispersions ..................................79
5.2.2 Relaxivity of Fe cations in solution ............................................80
5.2.3 Relaxivity of Fe(III) adsorbed on solid surface ..........................80
5.3 Materials and Methods ............................................................................82
5.4 Results and Discussions ..........................................................................85
5.4.1 Proton Relaxation by Fe(III) Ions in Solution ............................85
5.4.2 Proton Relaxation in Fe- Nanoparticles mixture ........................87
5.4.3 Fe(III) and pH in supernatants ....................................................90
5.4.4 Proton Relaxation by Zirconia Nanoparticles with adsorbed Fe(III)
.....................................................................................................93
5.5 Conclusions .............................................................................................99
Chapter 6 ..............................................................................................................102
NMR relaxation of surface-functionalized Fe3O4 nanoparticles .........................102
6.1 Introduction ...........................................................................................102
6.1.1 Proton relaxation by dipole-dipole interactions ........................103
Proton-proton relaxation ...........................................................103
Electron-proton relaxation ........................................................104
6.1.2 Relaxivity of nanoparticles in dispersions ................................104
6.1.3 Relaxation mechanism in A-MNPs ..........................................107
6.2 Materials and Methods ..........................................................................107
6.3 Results ...................................................................................................111
6.3.1 Relaxivities of A-MNPs with different APTES coating amount111
6.3.2 Variations in relaxation rate of A-MNPs with added D2O .......112
6.4 Discussions ...........................................................................................116
6.4.1 Relaxivities of A-MNPs with different APTES coating amount116
6.4.2 Change in relaxation rate of A-MNPs with D2O ......................119
6.5 Conclusions ...........................................................................................121

xii
Chapter 7 ..............................................................................................................123
Synthesis, Conclusions, and Future Work ...........................................................123
7.1 Synthesis ...............................................................................................123
7.1.1 Attachment of nanoparticles onto pore surface and modified pore
surface relaxivity .......................................................................123
Nanoparticle retention limit in porous media ...........................123
Retained nanoparticles and the modified pore surface relaxivity124
7.1.2 Attachment of iron species onto nanoparticle surface ..............126
7.1.3 Attachment of organic surface coatings on nanoparticles ........128
7.2 Conclusions ...........................................................................................132
7.2 Future Work ..........................................................................................139
Appendix A ..........................................................................................................141
Arithmetic Calculations of Error Propagation ............................................141
Appendix B ..........................................................................................................142
Raw NMR data ...........................................................................................142
References ............................................................................................................157

xiii
List of Tables
Table 3.1 DLS ZetaSizer measured size and zeta potential of zirconia nanoparticles in
ZR-AL and ZR-BL at different concentrations. ...............................27
Table 3.2 Parameter values used in calculation of m and s. ................................29
Table 3.3 NMR measured relaxation rate and nanoparticle size of nanofluids before,
in and after contact with Boise sandstone core. ................................37
Table 4.1 List of Boise Sandstone Cores with saturating and flushing fluids. ......52
Table 4.2 T1 and pH values of original fluids and effluents. .................................55
Table 4.3 T1 of ZR-6BL and ZR-7.5BL dispersions before, during and after contact
with Boise sandstone, along with pH value and nanoparticle size, zeta
potential relaxation rate and relaxivity in original dispersion and
effluents.............................................................................................59
Table 4.4 T1 of ZR-6AL and ZR-7.5AL dispersions before, during and after contact
with Boise sandstone, along with pH value and nanoparticle size, zeta
potential relaxation rate, and relaxivity in original dispersion and
effluents.............................................................................................62
Table 5.1 Treatment and measurement performed of different mixture groups. ...84
Table 5.2 ICP measured Fe concentration in supernatants of Fe-NaOH mixtures and
Fe-Zirconia nanoparticles after centrifuging. ...................................90
Table 5.3 pH of supernatant from Fe-Zirconia nanoparticles mixtures and Fe-NaOH
mixtures, and Fe-Silica nanoparticles mixtures. ...............................91
Table 5.4 Surface relaxivity of zirconia nanoparticles with increased amount of
adsorbed Fe(III) under different iron concentrations. .......................93
Table 6.1 T1 of water with different D2O volume fractions. ...............................113

xiv
Table 6.2 DLS measured A-MNP radius with different D2O volume fractions. .113
Table 7.1 Property summary of four nanoparticle dispersions studied in this project.
.........................................................................................................138

xv
List of Figures
Figure 2.1 Mechanism of T1 measurement in inversion recovery experiment. At the
top is the applied magnetic field pulse sequence. A pulse is followed
by a /2 pulse after TI (inversion time), then the resulting free induction
decay’s amplitude is recorded (asterisk). To compute T1, with various
values of TI, many measurements are made and the amplitude of free
induction decay is fitted as function of TI employing Equation (2.2)
(modified from Daigle et al., 2014). ...................................................6
Figure 2.2 Simplified model of electric double layer (EDL) at a silica mineral surface
in aqueous solution (Revil et al., 1999a)...........................................11
Figure 2.3 Mechanisms of relaxation of nanoparticle dispersion in a single spherical
pore. ..................................................................................................13
Figure 2.4 Schematic of mechanism of a two-dimensional random walk of water
molecules coordinated with paramagnetic relaxation sites on the pore
surface (McDonald et al., 2005). ......................................................17
Figure 3.1 TEM image of zirconia nanoparticles in ZR-BL dispersion. ...............24
Figure 3.2 Measured 1/T1 of zirconia nanoparticles with different nanoparticle fluid
volume ratio and size rNP in a) ZR-AL dispersions, and b) ZR-BL
dispersions fit the theory of Equations (3.2 and 3.3) well for suitable
values of m and s. Values and standard deviations of slopes are
obtained via weighted least squares linear regression. .....................29
Figure 3.3 Predicted 1/T1,NP from Equations (3.2) and (3.3) versus measured 1/T1,NP in
a) ZR-AL dispersions, and b) ZR-BL dispersions. ...........................30

xvi
Figure 3.4 Comparison of 1/T1 values of DI water, ZR-6AL and ZR-6BL as prepared
bulk phase; when present in pore space of bead pack; as bulk phase
withdrawn from bead pack. ...............................................................32
Figure 3.5 Calculated relaxation rate of saturated glass bead pack with adsorbed ZR-
6AL nanoparticles. Black line indicates no adsorption, the overall
relaxation rate remains as 1.217 s-1; red line shows how overall
relaxation rate of ZR-6AL saturated glass bead pack decreases with
more attached nanoparticles; green dot is computed from density
measurement of effluent and original fluid and corresponding relaxation
rate of saturated bead pack. ...............................................................34
Figure 3.6 T1 distribution of Boise sandstone cores saturated with DI water, ZR-6AL,
and ZR-6BL. .....................................................................................36
Figure 4.1 Mechanisms of relaxation of nanoparticle dispersion in a single spherical
pore. Sizes of the pore space and nanoparticles are not to scale: (a)
When only pure bulk fluid is present in the pore space, the overall
relaxation rate 1∕T1 is the sum of 1∕T1,fluid and 1∕T1,medium-surface; (b) when
nanoparticles are in pore fluid, 1∕T1 increases by an increment 1∕T1,NP-in-
pore; and (c) some nanoparticles are adsorbed onto the pore surface, and
the measured 1∕T1 equals the summation of 1∕T1,fluid, 1∕T1,NP-in-pore,
1∕T1,medium-surface, and 1∕T1,NP-on-surface. Note that 1∕T1,NP-in-pore is
smaller than in panel (b) because fewer nanoparticles are present in the
bulk fluid. ..........................................................................................48

xvii
Figure 4.2 The T1 distribution of a) Boise sandstone cores saturated with pure fluids
at different pH values: Core #1 saturated with DI water at pH 7, Core #2
and #3 saturated with HNO3 at pH 3.1, Core #4 and #5 are pretreated
with strong TMAH at pH 13.4, and saturated with TMAH at pH 9.1; b)
Boise sandstone Cores #1-#5 after 2 pore volume flooding with selected
fluids. ................................................................................................54
Figure 4.3 Normalized effluent nanoparticle concentration with respect to
nanoparticle concentration in original ZR-6BL and ZR-7.5BL dispersion
(6 wt% and 7.5 wt%) as a function of pore volume flushing in Cores #8,
#9, #12, and #13. Two pore volumes of DI was injected into Cores #8
and #12; 2 pore volumes of water and TMAH at pH 9.1 were used to
flush Core #9 and #13. The T1 value for the effluent (see Table 4.3) was
obtained by measuring the first 0.7 pore volumes commingled. ......57
Figure 4.4 The T1 distribution of Boise sandstone Cores #1, #4, #8, #9, #12, and #13
a) saturated with TMAH at pH 9.1, ZR-6BL, ZR-6BL, ZR-7.5BL, and
ZR-7.5BL, respectively and b) after flushing with two pore volumes of
DI water and TMAH at pH 9.1. Figures are obtained from Matlab via
linear inversion, number of point for T1 distribution was set to 200.58

xviii
Figure 4.5 Normalized effluent nanoparticle concentration with respect to
nanoparticle concentration in the original ZR-6AL and ZR-7.5AL
dispersions (6 wt% and 7.5 wt%) as a function of pore volume flushed in
Cores #6, #7, #10 and #11. Two pore volumes of selected fluid was
injected into Cores #6, #7, #10 and #11, which were originally saturated
with ZR-6AL and ZR-7.5AL. The T1 value for the effluent (see Table
4.4) was obtained by measuring the first 0.7 pore volumes commingled.
...........................................................................................................63
Figure 4.6 The T1 distributions of Boise sandstone Cores #1, #2, #6, #7, #10 and #11
a) saturated with HNO3, ZR-6AL, ZR-6AL, ZR-7.5AL, and ZR-7.5AL,
respectively, and b) Cores #4, #6, #7, #10 and #11 after flushing with
two pore volumes of selected fluids. Figures are obtained from Matlab
via linear inversion, number of point for T1 distribution was set to 200.
...........................................................................................................64
Figure 4.7 Computed possible boundaries (two lines) of Boise sandstone pore surface
relaxivities covered by different fraction of ZR-BL nanoparticles with
12.3 m/s and 18.8 m/s. Experimental determined sandstone pore
surface relaxivities from flushed Boise sandstone cores and
corresponding retained nanoparticle fraction are indicated by scattered
points. Diagram at the bottom shows zoomed in view with x-axis ranges
from 0 to 0.1 and y-axis ranges from 6 to 7.5. ..................................70

xix
Figure 4.8 Computed possible boundaries (two lines) of Boise sandstone pore surface
relaxivities covered by different fraction of ZR-AL nanoparticles with
4.29 m/s and 10.08 m/s. Experimental determined sandstone pore
surface relaxivities from flushed Boise sandstone cores and
corresponding retained nanoparticle fraction are indicated by scattered
points. ................................................................................................73
Figure 5.1 Dependence of overall relaxation rate on Fe(III) concentration in solutions.
...........................................................................................................86
Figure 5.2 Longitudinal relaxation rate of Fe-DI solution and Fe(III)-nanoparticles
mixtures with different Fe(III) concentrations. a) Grouping of relaxation
rates of different mixtures with same Fe concentration; b) Comparison
of measured mixture overall relaxation rate with values assuming no
Fe(III) adsorption onto nanoparticles................................................89
Figure 5.3 Relaxation rates of supernatants from Fe-Zirconia nanoparticles mixtures
and Fe-NaOH mixtures. 5.3a) Grouping of relaxation rates of
supernatants collected from different mixtures with same original Fe
concentration; 5.3b) Comparison of measured supernatant relaxation rate
of mixtures with theoretical values assuming no Fe(III) attached onto
nanoparticles. ....................................................................................92
Figure 5.4 Zirconia nanoparticles relaxivity increases with attached Fe(III). Blue and
Red lines display computed ZR-3AL and ZR-3BL relaxivity with
attached Fe(III), respectively; green dots exhibit the experimental results
from this work for ZR-3AL, purple triangles show experimental data for
ZR-3BL. ............................................................................................97

xx
Figure 5.5 Comparison of theoretical relaxation rates with fully attached of Fe(III)
and none adsorbed Fe(III) from aqueous solution to nanoparticles.
Experimental data falls between the boundaries, indicating occurrence of
adsorption but not to full capacity. ...................................................99
Figure 6.1 Relaxation analysis of NMR via comparing relaxation rates before and
after adding D2O. (Modified from Pfeifer, 1972). ..........................107
Figure 6.2. Procedures of generating Fe3O4 nanoparticles with different APTES
coating .............................................................................................108
Figure 6.3 Computed 1/T1,NP of APTES-coated Fe3O4 nanoparticles from Equation
(6.1) with different nanoparticle fluid volume ratios and sizes rNP in
5.6A-MNPs, 7.5A-MNPs, and 9.8A-MNPs dispersions fit using
Equation (6.2). Relaxivity (slope of linear regression using weighted
least squares) of each group decreases with more extent of APTES
coating. ............................................................................................112
Figure 6.4 Relaxation rate 1/T1 of 5.6A-MNPs and 9.8A-MNPs mixed with different
volume fractions of D2O with a) 0.01 g/L Fe and b) 0.002 g/L Fe. 115
Figure 6.5 More APTES coated on MNPs with increased initial amount of 3-APTES
in the mixture (from left to right) during reactions with MNPs. ....117
Figure 6.6 Overall relaxivity of A-MNPs decreased with less Fe accessible to protons
on nanoparticle surfaces due to attached APTES coating. Red and blue
lines indicate the possible range of A-MNPs relaxivity with fraction of
Fe attached by APTES due to errors in slope and intercept (±1σ)
obtained by linear regression of measured 3 samples. ....................119

xxi
Figure 7.1 Different adsorption mechanisms affecting NMR response of nanoparticles
in porous media. Top: idealized depiction of nanoparticles adsorbed on
grain surfaces. Middle: in reality, some nanoparticles remain in
dispersion while others are adsorbed. Paramagnetic species on the pore
surface additional provide some surface relaxation. Bottom: in even
more detail, paramagnetic species present in the pore fluid and/or
desorbed from the grain surface due to the nanoparticle dispersion
chemistry can attach to nanoparticles, further complicating the NMR
response...........................................................................................131
Figure B-1. T1 relaxation of ZR-AL dispersions with different nanoparticle weight
percentage. x axis is time, y axis is measured sample volume after
correction with H index. .................................................................142
Figure B-2. T1 relaxation of ZR-BL dispersions with different nanoparticle weight
percentage. x axis is time, y axis is measured sample volume after
correction with H index. .................................................................143
Figure B-3. T1 relaxation of 3 saturated Boise sandstone cores: BS1, BS2, BS3. They
are saturated with DI water, ZR-6AL, and ZR-6BL nanoparticle
dispersions, respectively. x axis is time, y axis is measured sample
volume after correction with H index. ............................................144
Figure B-4. T1 relaxation of DI water, HNO3, and TMAH saturated Boise sandstone
cores for Cores #1-#5 after correction with H index. x axis is time, y axis
is measured sample volume after correction with H index. ............145

xxii
Figure B-5. T1 relaxation of DI, HNO3, ZR-6AL, and ZR-7.5AL dispersions saturated
Boise sandstone cores for Cores #1, #2, #6, #7, #10, and #11 after
correction with H index. x axis is time, y axis is measured sample
volume after correction with H index. ............................................146
Figure B-6. T1 relaxation of DI, TMAH, ZR-6BL, and ZR-7.5BL dispersions
saturated Boise sandstone cores for Cores #1, #4, #8, #9, #12, and #13. x
axis is time, y axis is measured sample volume after correction with H
index. ...............................................................................................147
Figure B-7. T1 relaxation of DI water, HNO3, and TMAH saturated Boise sandstone
cores for Cores #1-#5 after core flooding with pre-selected pure fluid for
2 pore volume. x axis is time, y axis is measured sample volume after
correction with H index. .................................................................148
Figure B-8. T1 relaxation of DI, HNO3, ZR-6AL, and ZR-7.5AL saturated Boise
sandstone cores for Cores #1, #2, #6, #7, #10, and #11 after core
flooding with pre-selected pure fluid for 2 pore volume. x axis is time, y
axis is measured sample volume after correction with H index. ....149
Figure B-9. T1 relaxation of DI, TMAH, ZR-6BL, and ZR-7.5BL saturated Boise
sandstone cores for Cores #1, #4, #8, #9, #12, and #13 after core
flooding with pre-selected pure fluid for 2 pore volume. x axis is time, y
axis is measured sample volume after correction with H index. ....150
Figure B-10. T1 relaxation of first 0.7 pore volume effluents from DI water, HNO3,
and TMAH saturated Boise sandstone cores for Cores #1-#5. x axis is
time, y axis is measured sample volume after correction with H index.
.........................................................................................................151
xxiii
Figure B-11. T1 relaxation of first 0.7 pore volume effluents from HNO3, ZR-6AL,
and ZR-7.5AL saturated Boise sandstone cores for Cores #2, #6, #7,
#10, and #11. x axis is time, y axis is measured sample volume after
correction with H index. .................................................................152
Figure B-12. T1 relaxation of first 0.7 pore volume effluents from TMAH, ZR-6BL,
and ZR-7.5BL saturated Boise sandstone cores for Cores #4, #8, #9,
#12, and #13. x axis is time, y axis is measured sample volume after
correction with H index. .................................................................153
Figure B-13. T1 relaxation of 5.6A-MNPs dispersions with different nanoparticle
concentration. x axis is time, y axis is measured sample volume after
correction with H index. .................................................................154
Figure B-14. T1 relaxation of 7.5A-MNPs dispersions with different nanoparticle
concentration. x axis is time, y axis is measured sample volume after
correction with H index. .................................................................155
Figure B-15. T1 relaxation of 9.8A-MNPs dispersions with different nanoparticle
concentration. x axis is time, y axis is measured sample volume after
correction with H index. .................................................................156
1
Chapter 1
Introduction
1.1 MOTIVATION AND OBJECTIVES
In recent years, nuclear magnetic resonance (NMR) has been used to characterize
a wide range of gaseous, liquid and solid materials. NMR is a phenomenon that occurs
when nuclei of some atoms in a static magnetic field are exposed to a second oscillating
electromagnetic field at a particular frequency. Some nuclear with spin will experience this
phenomenon. NMR spectroscopy is used to study physical, chemical, and biological
properties of materials. NMR is frequently used to measure the longitudinal (T1) and
transverse (T2) relaxation times in fluid saturated porous media. NMR relaxation time
distributions may be related to pore size distributions in porous media through calibration
with other quantitative methods such as mercury injection capillary pressure (MICP) tests
or 3-D imaging. Surface relaxivity is the parameter that relates relaxation time to pore size
(Fleury, 2007), and is a function of the surface concentration of paramagnetic and/or
magnetic sites on the pore surface (Kleinberg et al., 1994).
In natural porous media like rocks, the value of this important parameter is often
unknown because the properties of rocks are heterogeneous, so NMR measurements can
typically offer only relative pore size distributions (Nelson, 2009). We seek to modify and
control surface relaxivity in natural porous media so that NMR measurements can be used
to compute pore sizes directly. To control pore surface relaxivity, previous researchers
have used paramagnetic materials to coat pore solid surfaces (Anand and Hirasaki, 2007)
and magnetic particles to attach onto silica gel surfaces and pore surfaces (Bryar et al.,
2000; Cheng et al., 2014).

2
There are many advantages of nanoparticles to be employed to accomplish our goal.
The small size of nanoparticles relative to colloidal particles allows them to be transported
freely through pores with the movement of the pore fluid. In addition, nanoparticles have
relatively large mass compared to dissolved ions, which allows better control of adsorption
and nanoparticle retention in porous media, and they have much lower potential for fluid-
rock interactions than dissolved ions.
Due to the harsh subsurface environment in the oilfield (Carter et al., 2005), proper
surface coating is widely employed to stabilize nanoparticles. However, care must be taken
when using polymer-coated nanoparticles as contrast agents, as studies have reported that
polymer coating affects the relaxivities of nanoparticles (Issa et al., 2011).
The use of paramagnetic nanoparticles as contrast agents to characterize porous
media has focused on measurements of saturated porous media (Bryar et al., 2000; Yu,
2012; Cheng et al., 2014a), and questions regarding relaxation phenomena of nanoparticles
and surface relaxivity alteration of pore walls remain to be answered. When nanoparticles
are present in natural porous media like rocks, van der Waals attraction and electrostatic
attraction can drive adsorption of nanoparticles onto pore surfaces (Caldelas, 2010),
changing the pore surface relaxivity and hence the overall relaxation time of the dispersion-
saturated rock. In addition, iron oxides and paramagnetic ions are commonly present on
the pore surfaces of reservoir rocks (Carmichael, 1982), and after injection of nanoparticle
dispersions into these reservoirs, it is possible that these chemical species may be adsorbed
onto nanoparticles and alter the relaxivities of nanoparticles in the pore fluid and/or
attached on pore surfaces. I seek to attach nanoparticles onto the pore surface to
homogenize and control the pore surface relaxivity. This requires a detailed study of
analyze relaxation properties of nanoparticles and pore surfaces in nanofluid-saturated
porous media.

3
The main objectives of this dissertation are:
1. To attach nanoparticles onto sandstone surfaces via electrostatic attraction, thus
changing and controlling pore surface relaxivity via adsorption of
nanoparticles.
2. To quantify the relationship between adsorbed nanoparticles and alteration of
surface relaxivity of sandstones.
3. To understand how the interactions between nanoparticles and sandstone
surfaces under different pH conditions will affect adsorption and relaxivities of
nanoparticles in porous media, and how this will be reflected in NMR
measurements.
4. To study how surface coating may change nanoparticle relaxivities, which will
provide useful insight for the future use of surface-coated nanoparticles in NMR
measurements.
1.2 OUTLINE OF CHAPTERS
This dissertation contains 7 chapters.
Chapter 1 describes the problems and introduces the motivation and objectives of
this project.
Chapter 2 reviews the methods and theories that have been applied to study
relaxation of protons in pure fluids and in saturated porous media, the main force that drives
adsorption of nanoparticles onto pore surfaces, possible interactions between
nanoparticles’ surfaces and pore surfaces, and alterations of nanoparticle properties due to
surface coating.
Chapter 3 studies the relaxivities of nanoparticles and retention of nanoparticles on
silica porous media (glass bead pack and Boise sandstone cores). Adsorption of positively
4
charged zirconia nanoparticles onto silica surface is confirmed. Silica pore surface
relaxivities were altered due to attachment of nanoparticles.
Chapter 4 presents the changes in surface relaxivities of Boise sandstone cores after
saturating with positively and negatively charged zirconia nanoparticles with different
nanoparticle concentrations and pH values. Retention of nanoparticles in sandstone cores
after core flooding was observed. The results also indicate alterations of zirconia
nanoparticles’ relaxivity after being flushed from Boise sandstone cores.
Chapter 5 studies the interactions of iron ions and uncoated zirconia nanoparticles
and polyethylene glycol (PEG)-coated silica nanoparticles. Increased surface relaxivities
of nanoparticles are shown to be associated with attached iron ions on nanoparticle
surfaces.
Chapter 6 describes how 3-aminopropyl triethoxysilane (APTES) coating on Fe3O4
nanoparticles may reduce the relaxivities of nanoparticles and affect relaxation
mechanisms on nanoparticle surface.
Chapter 7 summarizes this project and provides recommendations for future work.

5
Chapter 2
Background
2.1. PROTON NUCLEAR MAGNETIC RESONANCE IN POROUS MEDIA
The principle of NMR measurement is to use coils with strong currents which can
generate a steady magnetic field that can polarize hydrogen nuclei (Abragam, 1961; Allen
et al., 1998). Hydrogen is mainly present in the pore fluids in natural porous media, so
proton NMR allows us to investigate the pore system and the fluids contained in it
(Kleinberg et al., 1994).
The longitudinal relaxation time T1 is the decay constant for recovery of nuclear
spin magnetization perpendicular to the applied static field. As shown in Figure 2.1, when
exposed to the static field of the NMR device, the nuclear spin magnetization is at its
thermal equilibrium Mz,eq. At time 0, there is a second magnetic field with opposite
direction (180o) to original magnetic field applied, which inverts the initial magnetization
to -Mz,eq, as shown in Equation (2.1):
,(0)Z z eqM M . (2.1)
After the 180o magnetic field pulse, under the original static field, the nuclear spin
states are redistributed to reach the thermal equilibrium state distribution Mz,eq. During this
redistribution, another magnetic field oriented perpendicular to the static field is applied at
different inversion times TI, enabling measurement of the magnetization amplitude. The
record of magnetization amplitude with different TI gives the profile shown in Figure 2.1.
The decay constant is derived from Equation (2.2):
1 1
, ,eq ,eq( ) [ (0)] [1 2 ]
t t
T T
Z Z eq Z Z ZM t M M M e M e
. (2.2)

6
Figure 2.1 Mechanism of T1 measurement in inversion recovery experiment. At the top is
the applied magnetic field pulse sequence. A pulse is followed by a /2
pulse after TI (inversion time), then the resulting free induction decay’s
amplitude is recorded (asterisk). To compute T1, with various values of TI,
many measurements are made and the amplitude of free induction decay is
fitted as function of TI employing Equation (2.2) (modified from Daigle et
al., 2014).
Several mechanisms contribute to magnetic relaxation in porous media: bulk fluid
relaxation, surface relaxation, and diffusion in local magnetic field gradients (Wong, 1999).
Bulk fluid relaxation is due to dipole-dipole coupling among protons in the liquid
(Bloembergen et al., 1948; Brownstein and Tarr, 1979). Surface relaxation is due to
interactions between protons in the pore fluid and unpaired electrons in paramagnetic ions
on the pore surface (Kleinberg et al., 1994), or protons on the pore surface (Washburn,
2014). Diffusion relaxation is due to diffusion of protons within local magnetic fields
7
generated by paramagnetic material in response to the applied static magnetic field. These
three mechanisms act simultaneously to produce the measured magnetization decays.
T1 relaxation is affected by bulk fluid relaxation and surface relaxation. In a single
pore, the decay of magnetization is assumed to be single exponential, so the longitudinal
relaxation rate 1/T1 can be denoted by the sum of different relaxation rates as described in
Equation (2.3): sum of bulk fluid relaxation rate 1/T1,B and surface relaxation rate 1/T1,S
(Carr and Purcell, 1954):
. (2.3)
Since the diffusion relaxation complicates the relationship between T2 and pore
size, I employ T1 in this work.
Because the relaxation rate due to bulk fluid processes is much smaller than the
surface relaxation rate, the relaxation of fluids confined in porous media is mainly
controlled by fluid-grain surface interaction at the surface of pores. In most natural porous
media, the pores are relatively small (order tens of microns and smaller), and diffusion of
fluid molecules to grain pore surfaces is much faster compared to surface relaxation, so the
overall relaxation time is controlled by relaxation at the pore surface (Brownstein and Tarr,
1979). In this case, the relaxation rate in a single pore is spatially uniform and single-
exponential, does not depend on pore shape, and is proportional to surface-to-volume ratio
as described in Equation (2.4):
, (2.4)
where 1 is the longitudinal surface relaxivity of porous medium, S is porous medium
surface area, and V is pore volume. In fluid saturated porous media, T1 may be expressed
by combining Equations (2.3) and (2.4) as
1 1, 1,
1 1 1
B ST T T
1
1,
1
poreS
S
T V

8
. (2.5)
Thus, for each single pore there is a corresponding T1, and the distribution of T1 from NMR
measurements will give pore size distribution in porous medium.
In rocks, due to the presence of paramagnetic materials on the pore surface, the
overall relaxation rate of the pore surface can be explained as in Equation (2.6) (Kleinberg
et al., 1994):
. (2.6)
Here, c is mole fraction of adsorbed water molecules close enough to be relaxed by
paramagnetic sites on the pore surface (surface ions in crystals, paramagnetic crystal
defects, or adsorbed paramagnetic ions) and relaxed with relaxation time of T1,M, and M is
the residence time of water molecules near paramagnetic sites. T1,N is relaxation time of
adsorbed water molecules not relaxed by paramagnetic sites, and N is the corresponding
residence time of water molecules at surface.
Different species of paramagnetic sites may have various values of T1,M and M, so
Equation (2.6) can be re-written in a more general form as below. Here, ci is the fraction
of protons in water molecules relaxed by paramagnetic species i, h is the thickness of one
monolayer of water, and ni is surface fraction of paramagnetic sites i.
. (2.7)
1
1 1,
1 1
poreB
S
T T V
1
1, 1, 1,
1 1
poreS M M N N
S c c
T V T T
11
11, 1, 1,
1
1 1, 1,
11
( )
1
( )
n
ini i
iporeS M M i N N
n
ini i
ipore M M i N N
ccS
T V T T
nnS
hV T T

9
The surface relaxivity is hard to know and is often not a uniform, steady value (Ryu, 2009),
and requires independent pore size measurements (e.g., microtomography images) to
constrain.
2.2. NANOPARTICLES
2.2.1. Zeta potential model and theory
An important factor that controls the stability of nanoparticles in dispersions is zeta
potential, which is used to quantify surface charge magnitude. It is the potential difference
between the dispersion medium and the stationary layer of fluid attached to the dispersed
particle. The sign and magnitude of zeta potentials of different materials will determine the
electrostatic force between them, whether attractive when they have different signs of zeta
potential (one is positive, the other is negative) or repulsive when they have the same sign
of zeta potential. The repulsive forces are required to stabilize nanoparticles in dispersion
against van der Waals attractive forces. Studies of adsorption of ionic surfactants on an
ionogenic surface have shown that the adsorption is mainly controlled by the zeta potential
(Keesom et al., 1998). The retention of surface-treated stabilized paramagnetic iron-oxide
nanoparticles in sedimentary rocks is also controlled by the zeta potential of the
nanoparticles in dispersion (Yu et al., 2010). Previous studies indicate that silica and most
sedimentary rock grains have negative zeta potential when exposed to fluid with various
pH values under laboratory conditions (Kim and Lawler, 2005). Therefore, nanoparticles
with positive zeta potential are the best candidates for adsorption to silicate grain surfaces.
2.2.2 pH values affect nanoparticle zeta potential and size
In porous media, the electrostatic force is responsible for the retention of
nanoparticles by adsorption on the pore surface (Overbeek, 1952). As shown in Figure 2.2,
there is an electrical double layer (EDL) associated with the mineral surface. The outer

10
boundary of the EDL is the location where the particle’s surface charge is neutralized by
the nearest layer in the liquid containing ions of opposite charge to that of the surface (the
counterions). The thickness of the EDL is determined by the concentration of electrolyte
(Prides, 1994). Free electrolyte is in the pore fluid outside the EDL. The relative motion
between the charged mineral surface and its EDL in pore fluid is localized along a shear
plane within the EDL, and controls all electrokinetic phenomena such as the motion of
particles and liquids in porous media under electric fields or chemical potential gradients,
as well as electric fields and currents generated by motion of colloidal particles. Zeta
potential is the electrical potential of the EDL (Overbeek, 1952).
The variation in zeta potential with electrolyte concentration has been studied for
various minerals (Ishido and Mizutani, 1981; Morgan et al., 1989; Revil et al., 1999a,b).
Silicate minerals have negative zeta potential ranging from -10mv to -130mv with different
electrolyte concentrations ranging from 10-6 mol/L to 10-1 mol/L (Gaudin and Fuerstenau,
1955; Li and De Bruyn, 1966). As previously studied (Iler, 2004), silica surfaces contain
two types of surface groups: >Si2O0 (surface siloxal group) and >SiOH0 (surface silanol
group). Here the symbol “>” indicates surface complexes. >SiOH0 undergoes amphoteric
reactions to generate positively charged surface groups (>SiOH2+) when pH is lower than
2, and negatively charged surface groups (>SiO-) when pH is higher than 3 (Revil et al.,
1999a,b). When silica minerals are exposed to electrolyte solutions, there are surface
mineral reactions at silanol surface sites. In the left part of Figure 2.2, the pH value is
between 3 and 8, the main surface groups are siloxane groups (>Si2O0), silanol groups
(>SiOH), and silicic acid groups (>SiO-), and the shear plane is on the mineral surface. In
the right part of Figure 2.2, the pH value is higher than 8, and silicic acid chains generate
longer filaments near the surface due to mineral surface dissolution. This builds a silica gel

11
layer that coats the solid mineral surface and the shear plane is located between the silica
gel and aqueous phases (Revil et al., 1999a,b).
Figure 2.2 Simplified model of electric double layer (EDL) at a silica mineral surface in
aqueous solution (Revil et al., 1999a).
It has been demonstrated that the pH value of a liquid affects nanoparticle zeta
potential and aggregation (Godinez and Darnault, 2011). For small silica particles with
diameters from 0.63 m to 6.3 m, zeta potential changes with pH values: zeta potential
drops from -10 mV to -65 mV as pH increases from 2 to 10 (Nelson, 2009). The zeta
potential of kaolinite is +0.7 mV at pH value of 2 and decreases to -54 mV at pH value of
10 (Vane and Zang, 1997; Daigle and Dugan, 2011). Reservoir brine pH is important to
the zeta potential and aggregation behavior of nanoparticles (Yu et al., 2010; Daigle and
Dugan, 2011). For pure commercial carbon black without surfactants, zeta potential is ~-

12
20 mV at pH ~6, and zeta potential drops to -40 mV when pH increases to 11 (Sis and
Birinci, 2009). Even though nanoparticles are smaller than colloidal particles, similar pH-
zeta potential behavior has been observed. When there are nonionic surfactants used to
stabilize carbon black nanoparticles, zeta potential is -5mV when pH is ~3, and zeta
potential decreases to -20mV when pH increases to 11 (Sis and Birinci, 2009). Lower pH
values generally correspond to higher zeta potential, which could result in stronger
repulsive forces between nanoparticles and inhibit nanoparticle aggregation.
2.2.3 Paramagnetism
Paramagnetism means the magnetic state of an atom with one or more unpaired
electrons. The unpaired electrons can spin in either direction and thus generate magnetic
moments in any direction. When they are placed in a magnetic field, they will be attracted
by the magnetic field due to the electrons' magnetic dipole moments. Most paramagnetic
materials are metals that are weakly attracted by magnets, and will not retain their magnetic
properties after applied magnetic field disappears. Examples are aluminum, tin, and
manganese. When paramagnetic materials are exposed to a magnetic field, they generate a
secondary magnetic field that decreases the relaxation time of protons in the pore fluid.
Paramagnetic nanoparticles mostly are rare earth oxides, hydroxides, and fluorides, which
have been used as magnetic resonance imaging (MRI) contrast agents (Vuong et al., 2012).
Now paramagnetic nanoparticles are widely used in NMR studies (Ryoo et al., 2012).
When there are paramagnetic nanoparticles present in pore fluid and attached on a
grain surface, the contributions to the overall relaxation rate can be split more specifically
from Equation (2.3). As shown in Figure 2.2, in part a, there is pure bulk pore fluid present
in pores, with relaxation contributed by bulk fluid T1,B and pore surface T1,S, corresponding
to the two components in Equation (2.3). In part b, if nanoparticles are present only in the

13
pore fluid, they provide an additional relaxation contribution T1,B-NP. If some nanoparticles
move from bulk pore fluid to be adsorbed onto the pore surface, they provide an additional
surface relaxation time T1,S-NP. Hence the sum of these four relaxation contributions gives
Equation (2.8):
1 1, 1, 1, 1,
1 1 1 1 1
B B NP S S NPT T T T T
. (2.8)
Figure 2.3 Mechanisms of relaxation of nanoparticle dispersion in a single spherical pore.
25 nm magnetite nanoparticles were used to coat fine and coarse sand at different
surface concentrations (Anad and Hirasaki, 2007). The results indicate that the size and
concentration of paramagnetic nanoparticles affect the degree to which they influence the
proton relaxation times. Magnetite particles may be modeled as thin spherical shell of
paramagnetic material.
2.3 RELAXATION OF SATURATED MEDIA INVOLVING NANOPARTICLES
Based on previous work, the effect of paramagnetic nanoparticles on NMR
measurements varies according to the nanoparticle locations, whether in bulk dispersion,

14
or adsorbed on a solid surface. Two models with different spatial scales may be used to
quantify the effect of paramagnetic nanoparticles on longitudinal relaxation.
2.3.1 Dispersion scale
Model 1: Surface relaxation of nanoparticles surface with paramagnetic sites (Bryar
et al., 2000; Zhu, et al., 2016)
We may also treat nanoparticle dispersions as a dilute porous medium in which
solid nanoparticles are the matrix providing surface relaxation (Korb et al., 1997;
McDonald et al., 2005; Zhu et al., 2015), and the bulk fluid in which the nanoparticles are
dispersed provides the bulk fluid relaxation. The overall longitudinal relaxation rate 1/T1
of a nanoparticle dispersion is the sum of the contributions from bulk relaxation rate
1/T1,Fluid and the nanoparticle surface relaxation rate 1/T1,NP (e.g., Carr and Purcell, 1954),
as displayed in Equation (2.9):
. (2.9)
1/T1,Fluid can be calculated from experiments by measuring the relaxation time of
the pure dispersing fluid. When diffusion of water molecules across the pores is fast enough
to maintain uniform magnetization in the pores during signal decay, 1/T1,NP is proportional
to S/V, the ratio of total nanoparticle surface area (S) to total fluid volume (V) in the
dispersion (Senturia and Robinson, 1970), with the constant of proportionality being the
nanoparticles’ surface relaxivity 1,NP. In Equation (2.10), Spore can be calculated from
nanoparticles’ volume VNP and radius rNP assuming that the nanoparticles are spherical.
Vpore is fluid volume which equals total volume of suspension VTotal minus the
nanoparticles’ volume VNP. The parameter is the ratio of the nanoparticles’ volume to the
fluid volume in the dispersion (Zhu et al., 2015):
1 1,Fluid 1,NP
1 1 1
T T T

15
. (2.10)
With various types of paramagnetic sites (surface ions in crystals, paramagnetic
crystal defects, or adsorbed paramagnetic ions) on nanoparticle surfaces, the relaxation rate
of nanoparticles has contributions from paramagnetic and non-paramagnetic parts
(Kleinberg et al., 1994) as shown in Equation (2.11): ci is fraction of water molecules get
close enough and relaxed by paramagnetic locations on surface, T1M is the intrinsic
relaxation time for each paramagnetic site, M is the corresponding residence time of water
molecules, h is thickness of one monolayer of water molecule, ni is surface fraction of
paramagnetic sites on nanoparticle surface. When surface concentrations of paramagnetic
sites ni increase, the overall relaxation rate of nanoparticle will increase accordingly.
. (2.11)
If i is the inherent relaxivity of the different kinds of paramagnetic relaxation sites
on the solid surface, ni is surface concentration of paramagnetic species (Bryar et al., 2000),
and N is the relaxivity of the non-paramagnetic sites, the overall relaxivity ρ1,NP of
nanoparticles with surface coating can be computed using Equation (2.12):
. (2.12)
1, 1, 1,
1,
3
1 3NP
NPNP NP NP
poreNP Total NP NP
VrS
T V V V r
11,
11, 1 1
1
1 1 1
11
( )
1
( )
n
ini i
NP
iporeNP M M i N N
n
ini i
ipore M M i N N
ccS
T V T T
nnS
hV T T
1,
1 1 1
1n n n
NP i i i N N i i N
i i i
n n n

16
2.3.2 Molecular Scale
Model 2: Surface relaxation on surfaces with adsorbed paramagnetic species
(McDonald et al., 2005)
The dominant mechanism of longitudinal surface relaxation is interactions with
paramagnetic relaxation centers on the pore wall (Korb et al., 1997). Since the size of water
molecules is much smaller than the porous medium grains, the pore surface is relatively
flat in the reference frame of the water molecules. As shown in Figure 2.4, during the
surface residence time τs in which the water molecule is close enough to the surface to
interact with paramagnetic ions, the motion of the water molecules may be represented by
a two-dimensional random walk in which the water molecules jump between relaxing sites
on the solid surface with a characteristic time m (translational correlation time) (s>>m).
After s the water molecule leaves the surface and returns back to pore fluid. The
longitudinal relaxation time of protons in the surface relaxing layer may be expressed as
2 2 2 0 1 2
1,
1 2( 1)[ ( ) 3 ( ) 6 ( )]
9I S L I S L I L I S
M
S S J J JT
, (2.13)
where the spectral density functions JL are different from those in Equation (2.11) and are
computed as in Equation (2.13). Here, s is surface density of paramagnetic species and
is the distance of minimum approach, which is taken as the radius of a water molecule.
2 20,1,2
242 2
2
13( ) ln
40( )
s mL m
mm
s
J
. (2.14)

17
Figure 2.4 Schematic of mechanism of a two-dimensional random walk of water
molecules coordinated with paramagnetic relaxation sites on the pore
surface (McDonald et al., 2005).
Previous studies of surface relaxation in porous media modified with paramagnetic
materials (iron or manganese precipitated from solution) have shown that the adsorption
of paramagnetic materials can increase surface relaxivity by factors of 6 to 50 (Kenyon and
Kolleeny, 1995).
If we treat the adsorbed paramagnetic nanoparticles on mineral surfaces as a
uniform layer with a given surface concentration of paramagnetic relaxation sites, the
relaxation rate of that layer is the difference between overall relaxation rate and pore fluid
relaxation rate, and can be easily derived from Equation (2.3).

18
Chapter 3
Nuclear Magnetic Resonance Investigation of Pore Surface Relaxivity
Alteration with Presence of Paramagnetic Nanoparticles1
3.1 INTRODUCTION
1H Nuclear magnetic resonance (NMR) is widely used to characterize a wide range
of gaseous, liquid and solid materials. NMR relaxation time distributions may be related to
pore size distributions in porous media through calibration with other quantitative methods
such as mercury injection capillary pressure (MICP) tests or 3-D imaging. To obtain pore
size distribution, paramagnetic nanoparticles are employed as contrast agents.
25 nm magnetite nanoparticles were employed to saturate fine and coarse sand at
different surface concentrations by Anand and Hirasaki (2008). Their results indicate that
the size and concentration of paramagnetic nanoparticles affect the degree to which they
influence the proton relaxation times. More recent work has shown that superparamagnetic
nanoparticles in porous media change the NMR signal by shortening transverse relaxation
times (Cheng et al., 2014a,b).
An important factor that controls the stability of nanoparticles in dispersions is the
zeta potential, which is used to quantify surface charge magnitude. In porous media,
electrostatic forces are also responsible for the retention of nanoparticles by adsorption on
the pore surface (Overbeek, 1952). Studies of adsorption of ionic surfactants on an
ionogenic surface have shown that the adsorption is mainly controlled by the zeta potential
(Keesom et al., 1988). The retention of surface-treated stabilized paramagnetic iron-oxide
nanoparticles in sedimentary rocks is also controlled by the zeta potential of the
nanoparticles in dispersion (Yu et al., 2010). Previous studies indicate that silica and most
1This chapter is based on: Zhu, C., Daigle, H., & Bryant, S. (2015, September). Nuclear magnetic
resonance investigation of surface relaxivity modification by paramagnetic nanoparticles. In SPE Annual
Technical Conference and Exhibition. Society of Petroleum Engineers. I was the primary author.

19
sedimentary rock grains have negative zeta potential when exposed to fluid with various
pH values under laboratory conditions (Kim and Lawler, 2005). Therefore, nanoparticles
with positive zeta potential are the best candidates for adsorption to silicate grain surfaces.
Previous studies such as Anand and Hirasaki’s work focused on characterization of
transverse relaxation regimes in sandstones corresponding to paramagnetic particles’
concentration and size, and provided a way to quantitatively understand the relaxation of
paramagnetic particles in sandstone due to diffusion in internal magnetic field gradients.
However, the surface relaxivity of pore surface was not studied. We chose zirconia
nanoparticles provided from Nissan Chemical America, because (1) these nanoparticles do
not have surface coating, which may interfere with the relaxivity of nanoparticles; (2) they
are stabilized and dispersed under 2 different pH conditions, giving opposite surface
charge; and (3) they have similar size. In this paper, we measured longitudinal relaxation
time distribution which solely depends on bulk relaxation and surface relaxation. The
objectives of our work are: 1) to understand how dispersed zirconia nanoparticles affect
proton relaxation in bulk fluid, and 2) how adsorbed zirconia nanoparticles change the
surface relaxivity of porous media. We measured relaxation time and particle sizes of
zirconia nanoparticle dispersions at different concentrations, characterized the relationship
of relaxation rate of zirconia nanoparticles and particle sizes and concentrations, and
estimated nanoparticles’ surface relaxivity. We measured and compared relaxation time of
DI water and zirconia nanoparticles under three conditions: the original bulk dispersion,
saturating a silica porous medium, and as effluent flushed from the silica porous medium.
Our results indicated adsorption of nanoparticles onto pore surface leaves fewer
nanoparticles in the pore space and affects surface relaxation at the pore wall.
20
3.2 THEORY
In order to analyze nanoparticles’ relaxation time under different conditions, well
studied equations that characterized nanoparticles with simplified assumptions and models
can be used.
3.2.1 Bulk Relaxation of Paramagnetic Nanoparticle Dispersions
The bulk relaxation behavior of paramagnetic nanoparticle dispersions is similar to
the relaxation behavior of a dilute porous medium in which solid nanoparticles are the
matrix providing surface relaxation (Korb et al., 1997; McDonald et al., 2005). The fluid
within the dispersion has a characteristic bulk relaxation rate 1/T1,Fluid. Paramagnetic ions
on the surface of the nanoparticles create relaxation sites that contribute an additional
surface relaxation rate 1/T1,NP (Korb et al., 1997). We assume that the decay of
magnetization in the dilute medium is single exponential, so the longitudinal relaxation
rate 1/T1 can be denoted by the sum of different relaxation rates (e.g., Carr and Purcell,
1954):
1 1,Fluid 1,NP
1 1 1
T T T
. (3.1)
The bulk fluid relaxation rate is easy to obtain from experiments by measuring the
relaxation time of pure fluid. The surface relaxation rate generated by dispersed
nanoparticles can be modeled and computed as a 2D random walk (McDonald et al., 2005).
The dominant mechanism of longitudinal surface relaxation is interactions with
paramagnetic relaxation centers on the nanoparticle surfaces (Korb et al., 1997). Since
water molecules are much smaller than the nanoparticles, the nanoparticle surfaces are
relatively flat in the reference frame of the water molecules. The longitudinal relaxation
rate of protons near the paramagnetic nanoparticle surfaces may be expressed as
(McDonald et al., 2005):

21
SILILSILSI
NP
JJJSSV
S
T
210222
,1
6319
21
, (3.2)
where δ is the water molecular diameter, S/V is specific surface area of the pore space,
and S are the gyromagnetic ratios of the protons and electrons, respectively, and S
=658.21I, ℏ is the reduced Planck’s constant, S is the spin of paramagnetic ions in the
nanoparticles, and S and I are Larmor angular frequencies of electrons and protons,
respectively. The Fourier spectral density functions J are given by
2 20,1,2
4 22 2
2
13( ) ln
40
s mL m
mm
s
J
, (3.3)
where τs is surface residence time in which the water molecule is close enough to the
surface to interact with paramagnetic ions, τm is the translational correlation time that is a
measure of the time a proton is coordinated with each relaxation site, and σs is the surface
density of relaxation sites. The motion of the water molecules may be represented by a
two-dimensional random walk in which the water molecules jump between relaxing sites
on the solid surface with a characteristic time m (translational correlation time) (s>>m).
The surface density s can be calculated from known properties of paramagnetic
nanoparticles as
s bX , (3.4)
where X is the fraction of paramagnetic atoms in nanoparticles with non-zero spins, is
the number of paramagnetic atoms per gram of dry material of nanoparticles, b is the
density of the solid nanoparticles, and is the distance between paramagnetic atoms in the
nanoparticle crystal structure.
Equation (3.2) may be simplified by introducing the longitudinal surface relaxivity
ρ1, which relates 1/T1,NP to S/V as 1/T1,NP = ρ1(S/V). Since S/V is the ratio of total

22
nanoparticle surface area to total fluid volume in the dispersion, it may be computed from
nanoparticle radius rNP and volume fraction as
1,NP 1,NP 1,NP
1,NP
3
1 3NP
NP
pore Total NP NP
VrS
T V V V r
, (3.5)
where χ is assumed to represent volume of nanoparticles per unit volume of fluid in the
dispersion.
3.2.2 Relaxation of Nanoparticle Dispersions in Porous Media
When nanoparticle dispersions enter a porous medium, it is possible for
nanoparticles to attach to the porous medium surface (Anand and Hirasaki, 2008), thus
affecting the surface relaxation of the porous medium. Some nanoparticles will remain in
the dispersion within the pore space. Again assuming single exponential decay in a single
pore, the overall relaxation rate can be described as
1 1,Bulk 1,Surface 1,Fluid 1,NP in pore 1,Medium surface 1,NP on surface
1 1 1 1 1 1 1
T T T T T T T
, (3.6)
where T1,Bulk is the relaxation time of bulk dispersion in pore space, T1,Surface is the surface
relaxation time at pore wall, T1,NP-in-pore is the relaxation time of nanoparticles remained in
pore space, T1, Medium-surface is the surface relaxation time of the porous medium, and T1,NP-
on-surface is the relaxation time of nanoparticles adsorbed onto pore surface. Adsorbed
nanoparticles will alter both bulk dispersion relaxation time (by reducing the nanoparticle
concentration in the dispersion) and surface relaxation time at the pore wall.
Similarly, in a porous medium saturated with nanoparticle dispersions, when pores
are treated as spheres with radius of rpore, the overall surface relaxation rate can be linked
with pore size using a modified surface relaxivity 1,eff. 1,eff arises from the scenario in
which some of the nanoparticles in dispersion are removed from the pore space and

23
attached to the solid pore wall. With NNP nanoparticles adsorbed onto one spherical pore,
1,eff is related to the relaxivities of the adsorbed nanoparticles and the pore wall. On pore
surface, the altered surface relaxivity may be determined by considering the surface area
that is covered by the projection of an adsorbed nanoparticle onto the pore surface. 1,eff is
calculated from the areally weighted average of medium surface relaxivity 1,Medium-surface
and attached NNP nanoparticles relaxivity 1,NP:
1,eff 1,eff
1,surface
1 3
pore pore
S
T V r
, (3.7)
2 22
1,eff 1,NP 1,Medium surface2 2
4
4 4
pore NP NPNP NP
pore pore
r N rN r
r r
, (3.8)
1,Medium surface
1,Medium surface 1,Medium surface
1 1
3
pore
pore
rV
T S T
. (3.9)
The relaxation rate of the bulk nanoparticle dispersion 1/T1,NP-in-pore with MNP
nanoparticles remaining in the pore can be calculated from the original relaxation rate of
the bulk dispersion 1/T1,NP with (MNP+NNP) nanoparticles:
1,NP in pore 1,NP
1 1 NP
NP NP
M
T T M N
. (3.10)
3.3 METHODS
We used zirconia nanoparticles dispersed in water (ZR-30AL) with 30 wt% of
colloidal zirconium oxide (ZrO2) stabilized with 0.9 wt% HNO3 from Nissan Chemical
America Corporation. The specific gravity was 1.36 and the pH value was 3.2. The original
ZR-30AL was diluted with DI water to obtain dispersions with various zirconia

24
nanoparticles, ranging from 0.3 wt% of ZrO2 to 15 wt% of ZrO2. 6 wt% of ZrO2 in
dispersion (ZR-6AL) was used for further saturation of silica porous media. The
nanoparticles had positive surface charge, with an average zeta potential of +32.5 mV.
Nanoparticle diameters were between 110 and 130 nm measured by a Dynamic Light
Scattering (DLS) ZetaSizer (Malvern Nano ZS).
We also used a 40 wt% dispersion of colloidal ZrO2 (ZR-40BL) from Nissan
Chemical America Corporation. These nanoparticles were dispersed in water and stabilized
with 1 wt% C4H12N.HO. The specific gravity was 1.53 and pH was 9.2. The original ZR-
40BL dispersion was diluted with DI water to reduce the weight concentration of zirconia
nanoparticles to a wide range from 0.4 wt% to 20 wt%. The 6 wt% of ZrO2 in dispersion
(ZR-6BL) was used to saturate silica porous media. The nanoparticles in the ZR-6BL
dispersion had negative surface charge with average zeta potential of -38.8 mV.
Nanoparticle diameters were between 70 and 90 nm. Figure 3.1 shows the Transmission
Electronic Microscope (TEM) images of these particles.
Figure 3.1 TEM image of zirconia nanoparticles in ZR-BL dispersion.

25
The Malvern Nano ZS was used to measure size distribution and surface zeta
potential of zirconia nanoparticles at different concentrations in ZR-AL and ZR-BL. Size
and zeta potential calibrations were performed with calibration standard dispersions before
each measurement. 0.450 mL of zirconia nanoparticle dispersion was placed in a
disposable cell to measure size distribution. The size distribution and average value of
measured size were recorded. A 1.0 mL plastic syringe was used to inject 1 mL of
nanoparticle dispersion into a disposable folded capillary cell to measure zeta potential.
The average volume and distribution of zeta potentials were recorded. Measurements of
each dispersion sample were performed three times and the mean value and standard
deviation were recorded.
NMR measurements were performed at room temperature (20°C) using a 2 MHz
GeoSpec2 benchtop NMR core analysis instrument from Oxford Instruments with an
operating frequency of 2.15 MHz The external magnetic field B0 was 0.05047 Tesla. We
used an inversion recovery measurement to determine the distribution of longitudinal
relaxation times (T1).
In order to check nanoparticles’ retention in porous media, density of zirconia
nanoparticles dispersions ZR-6AL and ZR-6BL before and after saturating porous media
were computed. The mass of 1 mL of dispersion was measured by Mettler Toledo mass
balance. Measurements were repeated 5 times at room temperature, and average values
were used.
Glass beads with diameter of 2 mm were soaked in ethanol to remove dust and other
surface impurities for 10 hours, and then dried in an oven for 14 hours at 135°C. Glass
beads were packed in plastic cylinder to form a column with 1.5” (3.81 cm) in diameter
and 4” (10.16 cm) in length. The porosity of glass bead pack was determined as 38% based
on NMR measurements with DI water as the saturating fluid. Three plastic tubes containing

26
the glass bead packs were oriented vertically, and different saturating fluids were injected
from the bottom of bead pack at constant flow rate of 0.5 mL/min using a Teledyne ISCO
D-Series hydraulic pump. The bottom valves were closed once fluid was observed running
out through the top outlet.
The three Boise Sandstone samples (BS1, BS2, BS3) used in this study were 1.5”
(3.81 cm) in diameter and 3” (7.62 cm) in length. All core samples were oven-dried for 14
hours at 135°C. The porosity of the core samples was computed approximately 29%
according to NMR measurements with DI water as the saturating fluid. All dried core
samples were placed in a sealed container and vacuumed with a Welch vacuum pump for
4 hours. After vacuuming, the saturating fluid was sucked into the sealed container until
the core sample was fully immersed. The core samples were kept immersed in the
saturating fluid under vacuum for 1 additional hour to ensure complete saturation.
To test and check whether there were nanoparticles adsorbed on pore surface, after
measuring the T1 distribution of the saturated porous media we flooded the media with DI
water from bottom to top at a constant flow rate of 0.5 ml per minute. Core flooding was
performed until 1.2 pore volumes (PV) were injected. The first 0.7 PV of effluent was
collected from the top outlet of the bead packs and core samples. The T1 value and
nanoparticle sizes were measured and compared with that of the original fluids.
Error bars for the longitudinal relaxation rate were computed from the standard
deviation of the longitudinal relaxation time obtained from the Matlab inversion. The signal
and noise were extracted from the raw NMR data in the time domain. Random noise with
the same properties (magnitude, mean value and standard deviation) of noise extracted
from raw NMR data was added to the time domain signal. With the added noise, there was
a slightly different magnetization buildup curve compared to the curve obtained directly
from the raw data. A linear inversion regression was then applied to the buildup curve with

27
added noise to compute the T1 value. After repeating this process 100 different times, 100
buildup curves were generated and used to calculate associated T1 values. Based on these
100 computed T1 values, the standard deviation of T1 was recorded and used to compute
the errors in longitudinal relaxation rate.
3.4 RESULTS
3.4.1 Zirconia Nanoparticles Characterization
We measured the size and zeta potential of zirconia nanoparticles at different
concentrations in ZR-AL and ZR-BL. As shown in Table 3.1, zirconia nanoparticles in
diluted dispersions with less stabilizer tend to aggregate and showed bigger nanoparticle
size than well-stabilized nanoparticle dispersions. Zeta potential of nanoparticles in ZR-
AL and ZR-BL at highest concentration were not displayed since dispersions were so dense
that results were too noisy.
Table 3.1 DLS ZetaSizer measured size and zeta potential of zirconia nanoparticles in
ZR-AL and ZR-BL at different concentrations.
ZR-AL
Concentration
(wt%)
Concentration
(vol%)
Average Size
(nm)
Average Zeta potential
(mV)
15.0 3.034 110 N.A
6.0 1.114 113 32.5
3.0 0.542 115 29.8
0.6 0.106 118 35.3
0.3 0.053 128 36.2
ZR-BL
Concentration
(wt%)
Concentration
(vol%)
Average Size
(nm)
Average Zeta Potential
(mV)
20 4.259 80.5 N.A
8.0 1.513 84.6 -36.3
4.0 0.729 85.2 -32.1
0.8 0.142 88.1 -32.8
0.4 0.071 88.3 -34.0

28
3.4.2 Bulk Relaxation Rate 1/T1 of Zirconia Nanofluids
We measured the bulk relaxation rate of DI water, ZR-AL, and ZR-BL with
different concentrations. Those fluids were placed in glass tubes and T1 was measured.
According to Equation (3.1), the relaxation rate of zirconia nanoparticles 1/T1,NP can be
obtained by deducting the pure liquid longitudinal relaxation rate 1/T1,Liquid from the overall
longitudinal relaxation rate 1/T1. Here 1/T1,Liquid is the relaxation rate of DI water, which
was determined as 0.385 s-1. We calculated the 1/T1,NP values of zirconia nanoparticle
dispersions with different concentrations. In Figure 3.2, 1/T1,NP shows a linear relationship
with 3/rNP in both ZR-AL and ZR-BL dispersions. Zirconia nanoparticle surface relaxivity
in ZR-AL was computed as 1.427 ± 0.014 m/s as indicated in Figure 3.2a) according to
Equation (3.5) using the slope of the weighted least squares regression line in Figure 3.2.
Similarly, ZR-BL has relaxivity as 1.095 ± 0.024 m/s. According to the equations in
Appendix A, error bars in 1/T1,NP associated with each point were obtained from the
standard deviations of 1/T1 and 1/T1,Liquid, which were computed from the standard
deviations of T1 and T1,Liquid obtained from Matlab as illustrated in section 3.3. The raw
NMR data for zirconia nanoparticle dispersions with different nanoparticle concentrations
are displayed in the Appendix. We additionally determined the correlation times τm and τs
in Equations (3.2 and 3.3) according to parameter values listed in Table 3.2 by optimizing
the measured 1/T1,NP values at different nanoparticle concentrations. For ZR-AL
dispersions we found τm = 0.233 ns and τs = 2.524 ns, and for ZR-BL dispersions we found
τm = 0.251 ns and τs = 1.528 ns. Figs. 3a and 3b show the predicted nanoparticle relaxation
rate from Equations (3.2 and 3.3) versus the measured relaxation rate in ZR-AL and ZR-
BL, respectively. There is excellent match between fitted and measured values.

29
Table 3.2 Parameter values used in calculation of m and s.
Parameter Value used in Equations (3.2 and 3.3)
B0 0.05047 T
7×10⁻¹⁰ m
I 2.675×10⁸ s-1·T-1
s=(658.21×I) 1.761×10¹¹ s-1·T-1
ℏ 1.055×10⁻³⁴ J·s
S 2.5
I=(I×B0) 1.348×10⁷ s-1
s=(s×B0) 8.874×10⁸ s-1
s 1.028×10¹⁸ m2
Figure 3.2 Measured 1/T1 of zirconia nanoparticles with different nanoparticle fluid
volume ratio and size rNP in a) ZR-AL dispersions, and b) ZR-BL
dispersions fit the theory of Equations (3.2 and 3.3) well for suitable values
of m and s. Values and standard deviations of slopes are obtained via
weighted least squares linear regression.
y = 1.4272xstd of slope = 0.01396
0
0.5
1
1.5
2
2.5
0 0.5 1 1.5 2
1/T
1,N
P(s
-1)
3x/rNP (m-1)
ZR-AL
y = 1.0949xstd of slope = 0.02395
0
0.5
1
1.5
2
2.5
3
0 1 2 3
1/T
1,N
P(s
-1)
3x/rNP (m-1)
ZR-BL
a) b)

30
Figure 3.3 Predicted 1/T1,NP from Equations (3.2) and (3.3) versus measured 1/T1,NP in a)
ZR-AL dispersions, and b) ZR-BL dispersions.
3.4.3 Fluids with Glass Bead Packs
Evidence of Adsorption
The recorded densities of the original ZR-6AL fluid and effluent with 0.7 PV were
1.0631 g/cm3 and 1.0557 g/cm3, respectively; measured densities of ZR-6BL before and
after contact with glass bead pack were 1.0633 g/cm3 and 1.0632 g/cm3, respectively.
Figure 3.4 shows the measured relaxation rates of DI water, ZR-6AL and ZR-6BL in three
states: as bulk fluids before injecting into the glass bead pack, as the saturating fluid within
the glass bead pack, and as effluent flushed from the glass bead pack. The bulk relaxation
rates of DI water, ZR-6AL and ZR-6BL were 0.357, 1.166, and 1.234 s-1, respectively.
When saturating the glass bead pack, the relaxation rates were 0.408, 1.122, and 1.292 s-1,
respectively. Finally, when the fluids were flushed out of the glass bead pack the relaxation
rates were 0.357, 0.850, and 1.237 s-1, respectively. Error bars were calculated from the
standard deviation of the longitudinal relaxation time (T1) of the nanoparticle dispersions

31
before, during, and after contact with the 2 mm glass bead pack by linear regression of raw
data with added noise as described previously.
The 1/T1 value of DI water increased inside the glass bead pack because of the
presence of glass bead surfaces providing additional surface relaxation. The DI water
effluent had the same value of bulk 1/T1 as before saturating the glass bead pack, as
expected. The 1/T1 value of ZR-6BL also increased in the bead pack relative to the bulk
value due to additional surface relaxation on the glass bead surfaces. Effluent ZR-6BL and
the original bulk ZR-6BL showed similar 1/T1 values (1.234 s-1 and 1.235 s-1) and
nanoparticle sizes (84.8 nm and 85.1 nm), suggesting that the zirconia nanoparticle
concentration in the ZR-6BL effluent was the same as that in the original dispersion. The
measured density of the fluid did not change, confirming the absence of adsorption. Since
the nanoparticles in ZR-6BL were negatively charged, we hypothesize that the electrostatic
repulsion between the nanoparticles and glass bead surfaces prevented adsorption.
In contrast to the DI water and ZR-6BL, the 1/T1 value of ZR-6AL decreased inside
the bead pack relative to the original dispersion, and the ZR-6AL effluent had a smaller
1/T1 than the original dispersion. The smaller 1/T1 in the bead pack result is counterintuitive
because the additional surface relaxation contributed by the glass bead surfaces should
have increased the relaxation rate. The explanation is that nanoparticles adsorbed onto the
bead surfaces, reducing their concentration in the aqueous phase. The evidence of
adsorption comes from the smaller 1/T1 of the effluent, which strongly indicates smaller
nanoparticle concentration in the effluent than in the original dispersion. Moreover, the
effluent density was smaller than the density of the original fluid, also consistent with
nanoparticle adsorption on the beads. Since nanoparticles in ZR-6AL were positively
charged, we hypothesize that electrostatic attraction caused adsorption of positively
charged nanoparticles onto the negatively charged glass bead surface. This is consistent

32
with previous studies that have shown that the retention of surface-treated stabilized
paramagnetic iron-oxide nanoparticles in sedimentary rocks is controlled by the zeta
potential of the nanoparticles in dispersion (Yu et al., 2010). Evidently, the reduction in
1/T1 caused by depletion of nanoparticles in the aqueous phase in the pore space dominates
the increase in 1/T1 brought from bead surfaces. The other effect of adsorption in this
experiment is on the surface relaxation rate, which is described next.
Figure 3.4 Comparison of 1/T1 values of DI water, ZR-6AL and ZR-6BL as prepared
bulk phase; when present in pore space of bead pack; as bulk phase
withdrawn from bead pack.
Adsorbed Nanoparticles
Based on relaxation rate of DI water and DI water in the glass bead pack, we were
able to compute the glass bead surface relaxation rate 1/T1,Medium-surface, 0.051 s-1 based on
Equation (3.6). In bead pack with 2 mm glass beads and 38% porosity, we assumed that
the pores could be represented as spheres with the radius of a maximum inscribed sphere
in body-centered cubic packing, which yielded rpore of 0.613 mm. According to Equation
0.3570.408
0.357
1.2341.292
1.235
1.1661.122
0.85
Original Bulk Fluid Fluid in 2mm Glass Bead Pack Effluent
Overall relaxation rate 1/T1 (s-1)
DI water group
ZR-6BL group
ZR-6AL group

33
(3.9), the glass bead surface relaxivity 1,Medium-surface was 10.42 m/s. The fact that the
glass beads had a larger surface relaxivity than the nanoparticles (1.43 m/s) was probably
due to the presence of paramagnetic impurities in the glass beads, as has been noted in
other studies using these particular beads (e.g., Daigle et al., 2014).
To compute the theoretical maximum adsorption amount of nanoparticles onto the
glass bead surface, we assume that the conditions such as zeta potential, pH value,
temperature, and other driving forces such as van der Waals attraction are favorable for
each positively charged nanoparticle to attach onto negatively charged glass bead surface.
A simple geometric method is used. With the assumption that nanoparticles form a dense
packing in a monolayer on the glass bead surface, each nanoparticle covers a projected area
(ℼrNP2) on the bead surface. A hexagonal packing of equal circles in 1 dimension is used to
compute the maximum surface fraction of the glass bead surface that can be occupied by
adsorbed nanoparticles (Chang and Wang, 2010). In the ZR-6AL group, we assumed that
the number of nanoparticles remaining in the bulk fluid was MNP and that the number of
adsorbed nanoparticles on the glass bead surface was NNP. Given that the glass bead pore
radius is computed as 613 m, and the volume fraction of nanoparticles in ZR-6AL is 1.114
%, the total number of nanoparticles with size about 113 nm in dispersion (MNP+NNP) in a
single spherical pore is estimated as 1.42×10⁹. NNP, MNP and 1,eff were computed from
solving Equations (3.6, 3.7, 3.8 and 3.10). According to Equation 3.8, the maximum
surface fraction of nanoparticles is 0.9069, and the corresponding fraction of nanoparticles
in the system attached onto the glass bead surface is computed as 30.0%. When fully
covered by a monolayer of zirconia nanoparticles, the surface relaxivity of the glass bead
is 2.265 m/s, and the overall relaxation rate is 0.934 s-1. As shown in Figure. 3.5, with a
fixed total number of nanoparticles in one pore, the overall relaxation rate of the saturated
pore (1/T1) decreases with adsorption of nanoparticles onto the glass bead surface. The

34
experimental data are consistent with the trend expected for adsorption of nanoparticles in
a close-packed monolayer on the bead surface.
Figure 3.5 Calculated relaxation rate of saturated glass bead pack with adsorbed ZR-6AL
nanoparticles. Black line indicates no adsorption, the overall relaxation rate
remains as 1.217 s-1; red line shows how overall relaxation rate of ZR-6AL
saturated glass bead pack decreases with more attached nanoparticles; green
dot is computed from density measurement of effluent and original fluid and
corresponding relaxation rate of saturated bead pack.
Based on density measurement, we computed that approximately 11.6% of the
nanoparticles in the original dispersion adsorbed onto glass bead surface and modified the
surface relaxivity 1,eff to 7.27 m/s. The smaller relaxivity also contributes to the smaller
value of 1/T1 in the ZR-6AL fluid-saturated bead pack, though in this experiment the
reduced aqueous phase concentration is the dominant effect. The measured relaxation rate
of glass bead pack after core flushing with 1.2 PV of DI water was 0.498 s-1, which is faster
than that of glass bead pack saturated with DI water (0.408 s-1), this may due to part of
0.8
0.85
0.9
0.95
1
1.05
1.1
1.15
1.2
1.25
0 0.1 0.2 0.3 0.4 0.5 0.6 0.7 0.8 0.9 1
1/T
1(s
-1)
Nanoparticles adsorbed on to bead surface / Theoretical adsorption capacity
Overall relaxation rate decrease with attachednanoparticlesOverall relaxation rate without attachment ofnanoparticlesExperimental data

35
nanoparticle desorption during core flushing. Recall Equations (3.5 and 3.8), when
nanoparticles are in fluid, the surface area that proton would access it the whole sphere
surface (4πrNP2), while adsorbed nanoparticles on pore surface only provide projected area
(πrNP2) on pore surface for proton to relax. Relative amount of desorbed nanoparticles was
14%, after 1.2 PV of DI water flushing, effective pore surface relaxivity was 6.05 m/s
with remained 86% of adsorbed nanoparticles, there was 15.4% change in pore surface
relaxivity due to core flooding.
3.4.4 Fluids with Boise Sandstone Core Samples
Evidence of adsorption
DI water, ZR-6AL, and ZR-6BL were used to saturate three Boise sandstone cores
labeled as BS1, BS2, and BS3, respectively. We then measured the T1 distributions of the
three saturated core samples. Figure 3.6 is obtained from a linear inversion calculation
based on NMR raw data displayed in the Appendix. Figure 3.6 shows and compares T1
distribution of Boise sandstone cores BS1, BS2, and BS3 saturated with DI water, ZR-
6AL, and ZR-6BL, respectively. Assuming that the three cores had similar pore structure
and size, different saturating fluids altered relaxation time to different extents: core sample
BS2 saturated with ZR-6BL showed the shortest peak T1 (443.2 ms), core sample BS3
saturated with ZR-6AL gave an intermediate peak T1 (424.3 ms), and the DI water-
saturated core sample (BS1) displayed the longest peak T1 value (1165 ms). The
differences can be explained by different degrees of surface relaxivity alteration in the
different core samples. Note the apparent variation in total porosity (the area under each
curve) among the three samples; this is probably due to differences in hydrogen index due
to different stabilizers in the nanoparticle dispersions as well as the presence of the
nanoparticles themselves, which would tend to lower the hydrogen index of the pore fluid.

36
Figure 3.6 T1 distribution of Boise sandstone cores saturated with DI water, ZR-6AL, and
ZR-6BL.
The bulk relaxation rates, nanoparticle sizes and density of the original fluids before
saturating Boise sandstone cores and the effluents are displayed in Table 3.3. Based on
density measurements (values not shown here), there were less nanoparticles in effluents
than in original fluids. Thus some of the nanoparticles introduced into the cores during
vacuum saturation remained in the core after the injection of 1.2 PV of DI water. This is
expected for the positively charged ZR-6AL nanoparticles and the negatively charged sand
grains in the core. For the negatively charged ZR-6BL nanoparticles, this is presumably
the consequence of mechanical retention or van der Waals attraction. Measured
nanoparticle size in effluents were slightly larger than that in original fluids. According to
Figure 3.2, larger nanoparticle size and smaller nanoparticle concentration should result in
a smaller relaxation rate if nanoparticle relaxivity remained constant. However, the
measured relaxation rates of the effluents did not decrease correspondingly. In fact the
relaxation rate increased for the ZR-6AL fluid. Because ZR-6AL contains HNO3 to
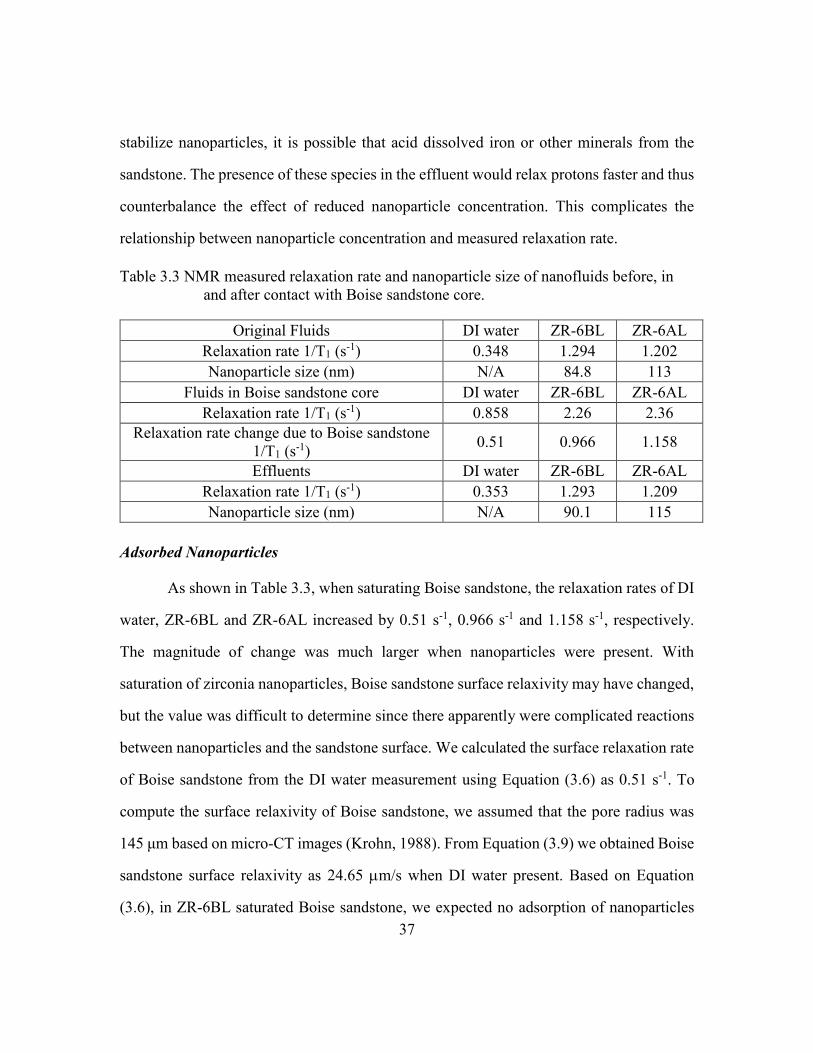
37
stabilize nanoparticles, it is possible that acid dissolved iron or other minerals from the
sandstone. The presence of these species in the effluent would relax protons faster and thus
counterbalance the effect of reduced nanoparticle concentration. This complicates the
relationship between nanoparticle concentration and measured relaxation rate.
Table 3.3 NMR measured relaxation rate and nanoparticle size of nanofluids before, in
and after contact with Boise sandstone core.
Original Fluids DI water ZR-6BL ZR-6AL
Relaxation rate 1/T1 (s-1) 0.348 1.294 1.202
Nanoparticle size (nm) N/A 84.8 113
Fluids in Boise sandstone core DI water ZR-6BL ZR-6AL
Relaxation rate 1/T1 (s-1) 0.858 2.26 2.36
Relaxation rate change due to Boise sandstone
1/T1 (s-1)
0.51 0.966 1.158
Effluents DI water ZR-6BL ZR-6AL
Relaxation rate 1/T1 (s-1) 0.353 1.293 1.209
Nanoparticle size (nm) N/A 90.1 115
Adsorbed Nanoparticles
As shown in Table 3.3, when saturating Boise sandstone, the relaxation rates of DI
water, ZR-6BL and ZR-6AL increased by 0.51 s-1, 0.966 s-1 and 1.158 s-1, respectively.
The magnitude of change was much larger when nanoparticles were present. With
saturation of zirconia nanoparticles, Boise sandstone surface relaxivity may have changed,
but the value was difficult to determine since there apparently were complicated reactions
between nanoparticles and the sandstone surface. We calculated the surface relaxation rate
of Boise sandstone from the DI water measurement using Equation (3.6) as 0.51 s-1. To
compute the surface relaxivity of Boise sandstone, we assumed that the pore radius was
145 μm based on micro-CT images (Krohn, 1988). From Equation (3.9) we obtained Boise
sandstone surface relaxivity as 24.65 m/s when DI water present. Based on Equation
(3.6), in ZR-6BL saturated Boise sandstone, we expected no adsorption of nanoparticles

38
due to electrostatic repulsion, hence 1/T1,NP-on-surface should be zero. If assumed medium
surface relaxivity as 24.65 m/s, to give overall relaxation rate as 2.36 s-1 in ZR-6BL
saturated Boise sandstone core, nanoparticle dispersion in pore fluid should have relaxation
rate as 1.85 s-1, which is higher than original ZR-6BL relaxation rate (1.294 s-1). From
Equation (3.5), the corresponding relaxivity of nanoparticles would be 1.561 m/s, which
is in consistence with our previous guess based on effluent relaxation rate and density
measurements. Increased relaxivity of nanoparticles may be caused by dislodged materials
that relax proton faster from sandstone surface. If constant relaxivity of nanoparticles in
ZR-6BL was assumed, Boise sandstone surface should give an increased surface relaxivity
as 51.52 m/s. However, in ZR-6AL saturated Boise sandstone, when assume fixed
relaxivity of nanoparticles (1.427 m/s) in ZR-6AL, based on Figure 3.2 we calculated
higher nanoparticle concentration in effluent than in original dispersion, which conflicted
with mass conservation. Thus, nanoparticle relaxivity might have changed after contact
with Boise sandstone. To get the best estimate of the changed surface relaxivity of
nanoparticles and sandstone surface, we assumed the relevant amount of adsorbed zirconia
nanoparticles was 11.6% according to the results in siliceous glass bead packs. Effective
sandstone surface relaxivity was computed as 55.16 m/s, nanoparticle surface relaxivity
was changed to 1.60 m/s during interactions with Boise sandstone minerals.
Characterization of nanoparticles in effluent is presented with more details in Chapter 4.
3.5 DISCUSSIONS
Recent NMR works have been focused on measurements of porous media saturated
with nanofluids (Anand and Hirasaki, 2008; Yu, 2012; Cheng et al., 2014a,b), did not study
the effects of nanoparticles brought to pore surface relaxivity. How and to what extent will
the pore surface relaxivity be altered by adsorbed paramagnetic nanoparticles remained

39
unknown. In this work, we try to answer this question by adding different paramagnetic
nanoparticles in pore fluid, and made three measurements: i) a nanoparticle-free fluid
measurement (DI water) to get pore wall effect; ii) the fluid-saturated measurement under
conditions for which the change in aqueous concentration is the dominant effect (this
demonstrates surface adsorption occurred); iii) displace the nanoparticle dispersion with
DI water and isolate the effect of the controlled relaxivity of the pore walls.
This work is a step toward the engineered control of surface relaxivity of porous
media, which in turn would enable more robust inference of pore size distributions from
NMR measurements, especially in logging tools. In our experiments, the known value of
pore size and surface relaxivity of silica porous media enabled us to estimate adsorbed
zirconia nanoparticles and modified surface relaxivity. To realize the end goal of being
able to predict pore size distributions directly from NMR measurements with no prior
knowledge of pore sizes, further work is necessary to understand the link between zeta
potential differences between nanoparticles and substrates, quantity adsorbed, and overall
relaxivity alteration. Once such model is generated and tested, we can use it to simulate,
predict and control concentration of adsorbed nanoparticles on pore surface to fix effective
surface relaxivity to the pre-decided value, followed by the calculation of pore size from
measured relaxation time distribution. The results presented here show promise for this
technique and serve as a proof of the concept that surface relaxivity can be modified in a
predictable manner.
More generally our work helps to understand behavior of nanoparticles in porous
media and will be used in future studies of the pore-scale characteristics in rocks. In
particular, our work highlights the complicated interplay between nanoparticles and rock
surfaces that affect measurements of bulk properties. Understanding these complicating
factors is essential to future applications that depend on coating grain surfaces or fluid

40
interfaces with nanoparticles, such as enhanced oil recovery, imaging oil-water contacts,
and determining interfacial surface areas.
3.6 CONCLUSIONS
We studied the influence of zirconia nanoparticles on NMR response in bulk fluid
dispersion and in porous media. The bulk relaxation rate of nanoparticle dispersions is
proportional to nanoparticle-pure fluid volume ratio and inversely proportional to
nanoparticle size. In nanofluid-saturated porous media (glass bead packs, outcrop
sandstone), electrostatic attraction between grain surfaces and nanoparticles was the main
driving force for adsorption of nanoparticles onto grain surfaces. The two types of
nanoparticles used in this study differed only in their zeta potential (one being positive, the
other negative), and only the positively charge particles adsorbed appreciably onto the
negatively charged silica surfaces of the porous medium. Porous media surface relativities
were altered only by the presence of adsorbed paramagnetic nanoparticles. When 1.114
vol. % positively charged zirconia nanoparticles dispersion was used to saturate a glass
bead pack, 11.6% of the nanoparticles were adsorbed to the bead surfaces and modified the
glass bead surface relaxivity from 10.42 m/s to 7.27 m/s.
Under theoretically favorable conditions where all ZR-6AL nanoparticles are
driven to attach onto the glass bead surface and generate a monolayer with dense packing,
the maximum fraction of nanoparticles that can be attached is 30.0%, occupying 0.9069 of
glass bead surface. The surface relaxivity is altered to 2.265 m/s, and the overall
relaxation rate is 0.934 s-1. In this study, the fraction of retained nanoparticles is 11.6%,
which is much lower than the theoretical maximum value of 30.0%. Note that we did not
consider the hydration layer on the nanoparticles themselves, which may affect attachment
of nanoparticles onto bead surface.

41
DI water flushing was able to wash out 14% of adsorbed nanoparticles from
siliceous surface, change of surface relaxivity due to core flushing was 15.4%. In contrast,
negatively charged zirconia nanoparticles did not alter the relaxivity of the beads. When
positively charged zirconia nanoparticle dispersions were used to saturate a Boise
sandstone core, both pore surface and nanoparticle relaxivity were altered. With the
assumption of fixed relaxivity of nanoparticles in ZR-6AL, retained nanoparticles in Boise
sandstone would be negative, and thus invalidate that assumption. With assumed 11.6% of
positive nanoparticles’ adsorption, Boise sandstone surface relaxivity was modified from
24.65 m/s to 55.16 m/s, and nanoparticle surface relaxivity changed from 1.43 m/s to
1.60 m/s However, mechanical retention of negatively charged nanoparticles in the Boise
sandstone may have caused additional relaxation effects such as increased surface
relaxivity to 1.561 m/s or increased nanoparticle relaxivity from 24.65 m/s to 51.52
m/s. Our work indicated there is a way to control pore surface relaxivity by adsorbed
paramagnetic nanoparticles and served as the foundation to generate a model to link
relaxation time distribution and pore size by altered pore surface relaxivity. But in the
subsurface environment in the oilfield where temperature, pressure, and pH are different
from those of our experiment, the behavior and stability of nanoparticles may be different
from our observation in this study. In addition, the hydration layer present on nanoparticles
may also play a role in affecting attachment of nanoparticles onto the pore surface. Further
work is needed to constrain these effects.
42
Chapter 4
Paramagnetic nanoparticles as NMR contrast agents in sandstone:
Importance of nanofluid-rock interactions2
4.1 INTRODUCTION
In porous media, the nuclear magnetic resonance (NMR) relaxation time
distribution is mainly controlled by interactions near the pore-grain interface for wetting
phase fluids (Foley et al., 1996). Fluid molecules in the pore space have the chance to
interact with pore surface by diffusion, where they are temporarily adsorbed (Korringa et
al., 1962). On the pore surface, generally there are two types of adsorption sites: one
magnetic, including paramagnetic and ferromagnetic, and the other diamagnetic. Magnetic
sites enhance relaxation due to the strong coupling between nuclear magnetic moments and
unpaired electrons and thus control relaxation rate. Magnetic sites in natural rocks are
paramagnetic ions, and most of them are iron (Carmichael, 1982). The concentration of
paramagnetic ions varies with natural sedimentary rocks, so pore surface relaxivity varies
from rock to rock and even within the rock at the pore scale. To control pore surface
relaxivity, we investigated the adsorption of paramagnetic nanoparticles onto pore surface.
Nanoparticles offer advantages over the ferric ions that have been employed in previous
work (Anand and Hirasaki, 2008) since sorption of ions is more difficult to monitor and
quantify, while nanoparticles have several independent mechanisms for attachment: van
der Waals forces, electrostatic attraction, and a tunable chemical affinity for functional
groups or compounds at the rock surface.
Transport and retention behavior of paramagnetic nanoparticles in sedimentary
rocks have been studied by Oldenburg et al. (2000), Prodanović et al. (2010) and Yu et al.
2This chapter is based on: Zhu, C., Daigle, H., & Bryant, S. L. (2016). Paramagnetic nanoparticles as
nuclear magnetic resonance contrast agents in sandstone: Importance of nanofluid-rock
interactions. Interpretation, 4(2), SF55-SF65. I was the primary author.

43
(2014). When stable nanoparticles with virtually zero surface charge and or with negative
charge were individually dispersed in sandstone pores, even though there was no
electrostatic attraction between nanoparticles and silica surface, attachment of
nanoparticles onto pore surface was observed by Yu et al. (2010). The main retention
mechanism is reversible adsorption on pore wall: van der Waals attraction could drive
attachment of nanoparticles onto solid surface, and such attachment can be reversed due to
Brownian diffusion (Rodriguez Pin et al., 2009 and Yu et al., 2010). Nanoparticles that are
unstable tend to aggregate to form clusters when van der Waals attraction overcomes
electrostatic repulsion, which leads to nanoparticle retention when the size of the clusters
become larger than pore throats (Wang et al., 2008). Positively charged nanoparticles tend
to attach onto negatively charged mineral surfaces by electrostatic attraction (Zhu et al.,
2015).
Previous work in Chapter 3 has indicated that positively charged zirconia
nanoparticles adsorb onto glass bead surfaces and decreased the surface relaxivity of the
glass beads due to smaller relaxivity of the nanoparticles, while negatively charged
nanoparticles are not retained in glass bead packs and do not affect the pore surface
relaxivity (Zhu et al., 2015). However, in Boise sandstone, due to the complicated
interactions between the nanoparticle dispersion and mineral surface, the surface
relaxivities of the pore surface and the nanoparticles both change but in opposite directions.
The purpose of our present work is therefore to analyze the interactions of paramagnetic
nanoparticle dispersions and sandstone surface that lead to surface relaxivity alteration, as
well as the factors that control such interactions. In our work we analyzed longitudinal
relaxation time (T1) measurements since the diffusion relaxation additionally complicates
the relationship between transverse relaxation time (T2) and pore size (e.g., Kleinberg and
Horsfield, 1990). We measured longitudinal relaxation time, pH, zeta potential, and

44
nanoparticle size of zirconia nanoparticle dispersions with different surface charge under
various pH values. We then saturated Boise sandstone cores with the different dispersions,
and performed corefloods to displace the dispersions, and collected the effluents. T1, pH
value, zeta potential, and nanoparticle sizes in effluent samples were measured and
compared with the original dispersions to investigate possible interactions between
nanoparticle dispersions and pore surfaces. To isolate the effects of the nanoparticle
dispersion fluids from the effects of the nanoparticles themselves, we used pure deionized
(DI) water, nitric acid, and TMAH as control groups in corefloods. We found that
nanoparticles were able to decrease Boise sandstone surface relaxivity by attachment onto
pore surface. In addition, we found that pH was an important parameter in determining zeta
potential and stability of nanoparticles, and influenced adsorption of nanoparticles on pore
walls. Our work showed that rock’s relaxivity can be changed by attachment of
nanoparticles. This can serve as the foundation to generate a model to link relaxation time
distribution and pore size by altered pore surface relaxivity.
4.2 THEORY OF RELAXATION CALCULATION
4.2.1 Relaxivity of nanoparticles in bulk fluid
We analyzed the longitudinal relaxation of nanoparticle dispersions by
considering them as dilute porous media composed of spherical nanoparticles and
dispersion fluid. Assuming that surface relaxation takes place in the fast diffusion regime
(Brownstein and Tarr, 1979), the nanoparticle surface relaxivity 1,NP can be computed
from Equation (4.1), where pore surface area S that water molecules can access to equals
the surface area of nanoparticle spheres, pore fluid volume V is computed as total
dispersion volume VTotal minus nanoparticle volume VNP, χ is volume of nanoparticles per
unit volume of fluid in the dispersion:
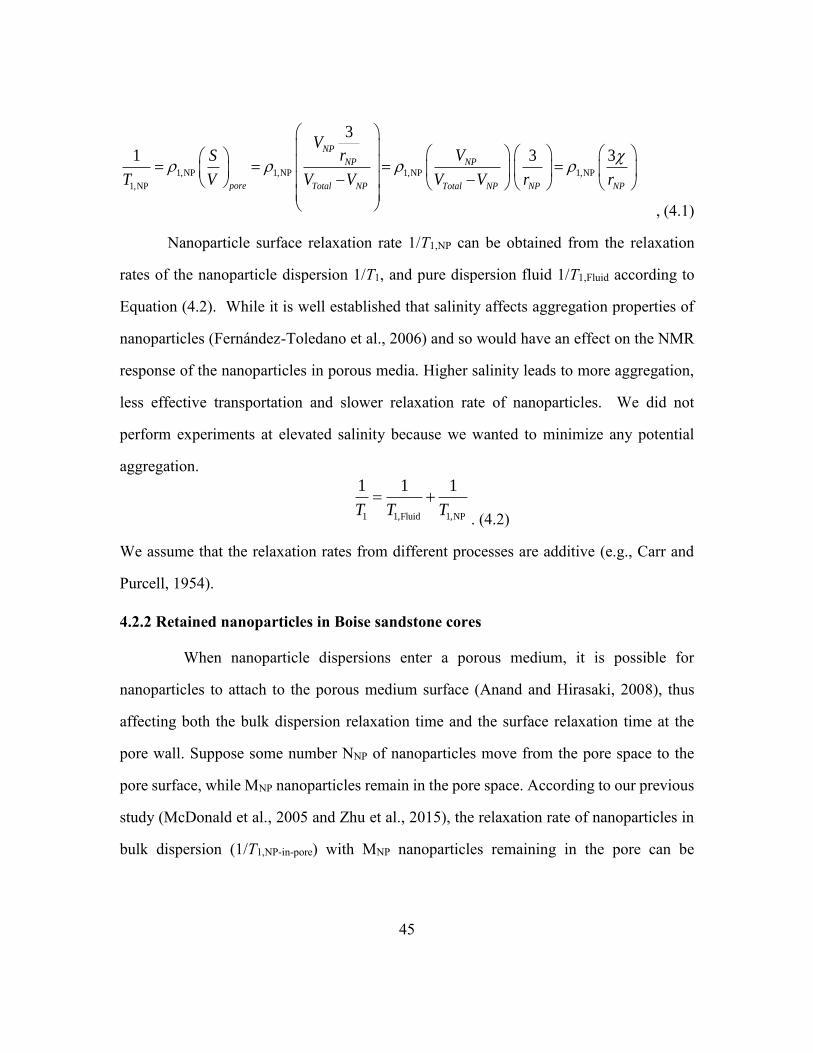
45
1,NP 1,NP 1,NP 1,NP
1,NP
3
1 3 3NP
NP NP
pore Total NP Total NP NP NP
Vr VS
T V V V V V r r
, (4.1)
Nanoparticle surface relaxation rate 1/T1,NP can be obtained from the relaxation
rates of the nanoparticle dispersion 1/T1, and pure dispersion fluid 1/T1,Fluid according to
Equation (4.2). While it is well established that salinity affects aggregation properties of
nanoparticles (Fernández-Toledano et al., 2006) and so would have an effect on the NMR
response of the nanoparticles in porous media. Higher salinity leads to more aggregation,
less effective transportation and slower relaxation rate of nanoparticles. We did not
perform experiments at elevated salinity because we wanted to minimize any potential
aggregation.
1 1,Fluid 1,NP
1 1 1
T T T
. (4.2)
We assume that the relaxation rates from different processes are additive (e.g., Carr and
Purcell, 1954).
4.2.2 Retained nanoparticles in Boise sandstone cores
When nanoparticle dispersions enter a porous medium, it is possible for
nanoparticles to attach to the porous medium surface (Anand and Hirasaki, 2008), thus
affecting both the bulk dispersion relaxation time and the surface relaxation time at the
pore wall. Suppose some number NNP of nanoparticles move from the pore space to the
pore surface, while MNP nanoparticles remain in the pore space. According to our previous
study (McDonald et al., 2005 and Zhu et al., 2015), the relaxation rate of nanoparticles in
bulk dispersion (1/T1,NP-in-pore) with MNP nanoparticles remaining in the pore can be

46
calculated from the original relaxation rate of the bulk dispersion 1/T1,NP with (MNP+NNP)
nanoparticles:
1,NP in pore 1,NP
1 1 NP
NP NP
M
T T M N
. (4.3)
With assumed single exponential decay in a single pore (Brownstein and Tarr,
1979), the overall relaxation rate is the sum of relaxation rates of the bulk dispersion in
pore space and the surface relaxation rate of the pore wall. As shown in Figure 4.1, in a
porous medium saturated with nanoparticle dispersion, relaxation occurs in the pure
dispersion fluid and at the surfaces of nanoparticles still in dispersion, as well as on the
pore surface and on the surfaces of nanoparticles adsorbed to the pore wall. The overall
relaxation rate in the pore is given by
1 1,Bulk 1,Surface 1,Fluid 1,NP in pore 1,Medium surface 1,NP on surface
1 1 1 1 1 1 1
T T T T T T T
, (4.4)
where 1/T1 is the measured relaxation rate of porous media saturated with nanoparticle
dispersion, 1/T1,Bulk is the relaxation rate of nanoparticle dispersion in pore, 1/T1,Surface is
the relaxation rate of pore surface, 1/T1,Fluid is the relaxation time of pure fluid in
nanoparticle dispersion, 1/T1,NP-in-pore is the relaxation rate of nanoparticles in dispersion
located in pores, 1/T1,Medium-surface is the intrinsic relaxation rate on the pore surface in the
absence of nanoparticles, and 1/T1,NP-on-surface is the relaxation rate of adsorbed nanoparticles
on pore surface.
Adsorbed nanoparticles will alter both the bulk dispersion relaxation time (by
reducing the nanoparticle concentration in the dispersion) and the surface relaxation time
at the pore wall. With NNP nanoparticles adsorbed onto one spherical pore, ρ1,eff is related
to the relaxivities of the adsorbed nanoparticles and the pore wall. We know that the
nanoparticles were not perfect spheres, and the surface of the glass beads and Boise

47
sandstone at the nanometer scale may have irregularities that, when combined with the
irregular shape of the nanoparticles, would result in a finite contact area between the
nanoparticles and grains. Therefore, we believe that it is unlikely that the nanoparticles
were in point contact with the grain surfaces in both the case of the glass beads and Boise
sandstone. In addition, small interstices between the adsorbed nanoparticles and the silica
surface may relax protons at a much faster relaxation time (1~50 ms) as shown in Figure
4.4 and Figure 4.6 due to restrictions in Brownian motion of protons in and out of these
interstices. Since the silica grain radius is much larger than nanoparticle radius, we use the
projected area of the nanoparticles on the silica surface to compute the contributed
relaxation of nanoparticles with relaxivity of ρ1,NP, and the remaining accessible silica
surface area provides a relaxivity of ρ1,Medium-surface. ρ1,Medium-surface can be calculated
according to the intrinsic relaxation rate on the pore surface in the absence of nanoparticles
1/T1,Medium-surface and pore radius rpore. ρ1,eff is calculated from the areally weighted average
of medium surface relaxivity ρ1,Medium-surface and attached NNP nanoparticles relaxivity
ρ1,NP, as indicated in Equations (4.5-4.7).
1,eff 1,eff
1,surface
1 3
pore pore
S
T V r
for spherical pores, (4.5)
2 22
1,eff 1,NP 1,Medium surface2 2
4
4 4
pore NP NPNP NP
pore pore
r N rN r
r r
, (4.6)
1,Medium surface
1,Medium surface 1,Medium surface
1 1
3
pore
pore
rV
T S T
. (4.7)
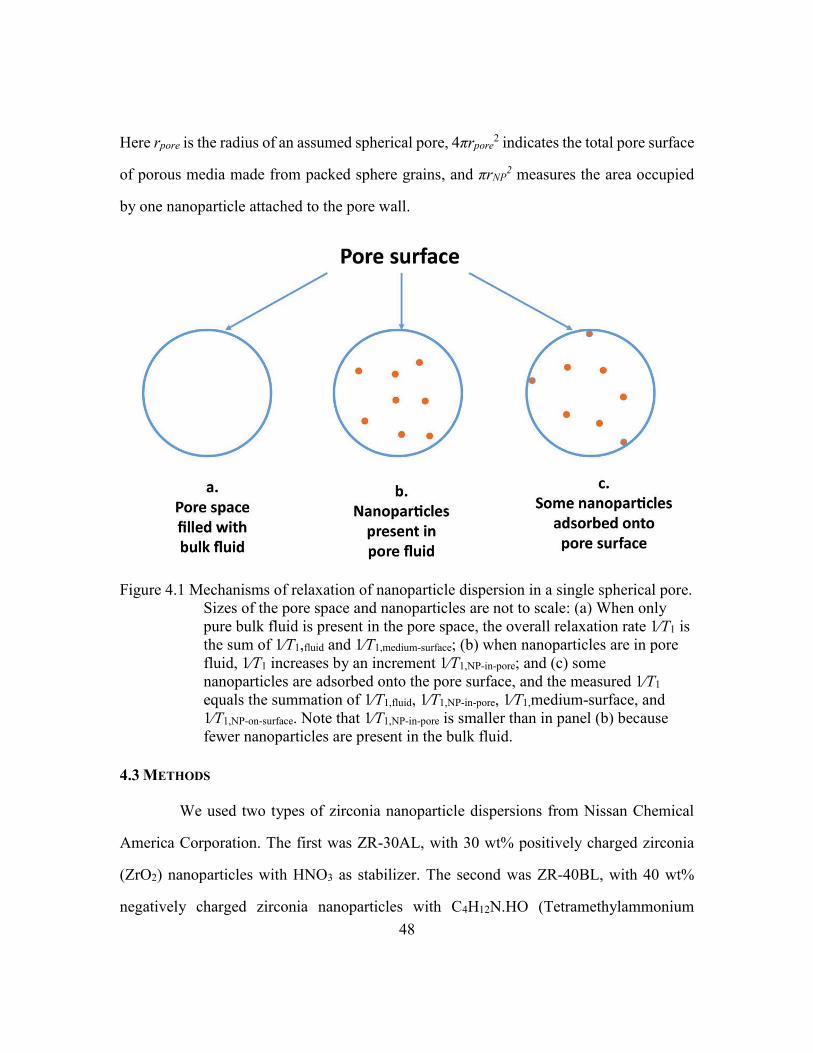
48
Here rpore is the radius of an assumed spherical pore, 4πrpore2 indicates the total pore surface
of porous media made from packed sphere grains, and πrNP2 measures the area occupied
by one nanoparticle attached to the pore wall.
Figure 4.1 Mechanisms of relaxation of nanoparticle dispersion in a single spherical pore.
Sizes of the pore space and nanoparticles are not to scale: (a) When only
pure bulk fluid is present in the pore space, the overall relaxation rate 1∕T1 is
the sum of 1∕T1,fluid and 1∕T1,medium-surface; (b) when nanoparticles are in pore
fluid, 1∕T1 increases by an increment 1∕T1,NP-in-pore; and (c) some
nanoparticles are adsorbed onto the pore surface, and the measured 1∕T1
equals the summation of 1∕T1,fluid, 1∕T1,NP-in-pore, 1∕T1,medium-surface, and
1∕T1,NP-on-surface. Note that 1∕T1,NP-in-pore is smaller than in panel (b) because
fewer nanoparticles are present in the bulk fluid.
4.3 METHODS
We used two types of zirconia nanoparticle dispersions from Nissan Chemical
America Corporation. The first was ZR-30AL, with 30 wt% positively charged zirconia
(ZrO2) nanoparticles with HNO3 as stabilizer. The second was ZR-40BL, with 40 wt%
negatively charged zirconia nanoparticles with C4H12N.HO (Tetramethylammonium

49
Hydroxide: TMAH) as stabilizer. DI water was used to dilute the original zirconia
nanoparticle dispersions into 6 wt% and 7.5 wt%, which we denote as ZR-6AL, ZR-7.5AL,
ZR-6BL, and ZR-7.5BL. pH values were measured with a pH probe and nanoparticle sizes
were measured by dynamic light scattering (DLS). To provide control groups, we prepared
HNO3 solution with the same pH value of ZR-6AL (3.2), and TMAH solution with same
pH value of ZR-6BL (9.1).
A Malvern Nano ZS ZetaSizer was used to measure particle size distribution and
surface zeta potential of the zirconia nanoparticles. Size and zeta potential calibrations were
performed with calibration standard dispersions before each measurement. 450 L of
nanoparticle dispersion was placed in a disposable cell to measure particle size distribution.
Fisher Scientific 1.0 mL plastic syringe was used to inject 0.9 mL of nanoparticle
dispersion into a disposable folded capillary cell for zeta potential measurement. The
average value and distribution of sizes and zeta potentials were recorded. Each sample was
measured three times and the mean value was chosen to be presented.
NMR measurements were performed at room temperature (20°C) using a 2 MHz
GeoSpec2 benchtop NMR core analysis instrument from Oxford Instruments with an
operating frequency of 2.15 MHz The external magnetic field B0 was 0.05047 Tesla.
Inversion recovery measurement was used to determine the distribution of longitudinal
relaxation times (T1). Signal noise ratio (SNR) was set to 100 for each NMR measurement.
To obtain nanoparticle concentration, we determined the density of nanoparticle
dispersions ZR-6AL, ZR-7.5AL, ZR-6BL, and ZR-7.5BL, DI water, HNO3 and TMAH
original fluids and effluents after saturating porous media. The mass of known volume of
dispersion was measured by Mettler-Toledo mass balance with a precision of 0.0001 g.
Measurements were repeated 5 times at room temperature, and average values were used.
Nanoparticle concentration was computed from the density of an effluent sample and that
50
of the corresponding pure dispersion fluids. This method for determining nanoparticle
concentration assuming that the concentration of other fluid components (notably the
dissolved solids) is invariant, and in particular that the acid and base neutralization
reactions in the core do not change the fluid density.
We measured pH with a Thermo Scientific Orion Versa Star pH benchtop meter.
The meter was calibrated with standard pH buffers at pH 4.01, 7.00 and 10.01. The pH
probe was triple rinsed with DI water before measurements of different fluid samples.
We used ten Boise sandstone samples Core #1-#13 in this study, each 1” (2.54 cm)
in diameter and 3” (7.62 cm) in length. All core samples were oven-dried for 24 hours at
135°C. All dried core samples were saturated with various fluids by vacuum pump. Our
preliminary results indicated that ZR-6AL and ZR-7.5AL dispersion remained stable after
contact with Boise sandstone, while nanoparticles in ZR-6BL and ZR-7.5BL dispersion
coagulated and most of nanoparticles were retained in Boise sandstone due to large cluster
size since the ZR-6BL and ZR-7.5BL effluent showed pH value close to 7. Since ZR-6BL
and ZR-7.5BL nanoparticles are stable in dispersion only at pH >8.8, Cores #8, #9, #13
and #13 were pretreated with strong TMAH at pH 13.416 and put into oven to dry for 24
hours at 135°C before saturating with ZR-6BL and ZR-7.5BL. After the pre-treatment,
TMAH residues were able to stay on sandstone surface and provide strong alkaline
condition. To isolate the effect of dried strong alkali left on pore surface, we also pretreated
Core #4 and #5 with strong TMAH at pH 13.4 for same procedure before saturated with
TMAH fluid with pH of 9.1. All saturating fluids for 10 cores were introduced by vacuum
pump. To saturate the cores, oven-dried cores were placed in a vacuum container for 4
hours, after which the saturating fluid was injected and vacuumed for another 1 hour.
To test whether nanoparticles were adsorbed on pore surface, after measuring the
T1 distribution of the saturated core plug we flooded the plug with DI water at a constant
51
flow rate of 0.5 ml per minute. Effluent was collected from the bottom outlet of the
vertically mounted core samples. To identify the effect of pH on the interactions between
nanoparticles and the pore surface, we also flushed all pore fluids (with and without
nanoparticles) with pure solutions at the same pH value. DI water was also used as flushing
fluid as a control. The T1 value, nanoparticle size, zeta potential and concentration were
measured and compared with that of the original fluids.
We used mass balance to measure nanoparticle concentrations. There are three
main reasons that we did not use UV-VIS to measure normalized concentration: The first
reason is that our NP concentrations in the original fluid and effluents were relatively high
and out of the range in which UV-VIS displays a linear relationship with concentration.
The second reason is that we collected very small volumes of effluent at each time, such
as 0.4 ml, which was not enough for the UV-VIS measurement which requires at least 1
ml. Finally, we wanted to collect all effluents and measure the T1 value and Fe
concentration in the effluents, and dilution to make the UV-VIS measurement would have
altered the experimental results.
To identify and isolate the contribution of nanoparticles to the overall relaxation
rate in effluent samples, we additionally centrifuged nanoparticles from the effluents we
collected. Zirconia nanoparticle dispersion effluents were placed in 15ml Fisher Scientific
plastic centrifuge tubes and centrifuged at 10000 rpm for 30 minutes using Beckman
Avanti J-E centrifuge and rotor JA-10. Supernatant fluid was collected to measure T1,
density, and iron concentration.
We used Varian Liberty Series II Axial ICP-OES to measure dissolved iron
concentration in original fluids and effluents after removal of nanoparticles. Wavelengths
for Fe were picked as 234.350 nm, 238.204 nm, and 259,940 nm, 1 mg/L, 2 mg/L, 5 mg/L,
8 mg/L, 10 mg/L, 20 mg/L, 50 mg/L, 80 mg/L and 100 mg/L iron standard solutions were
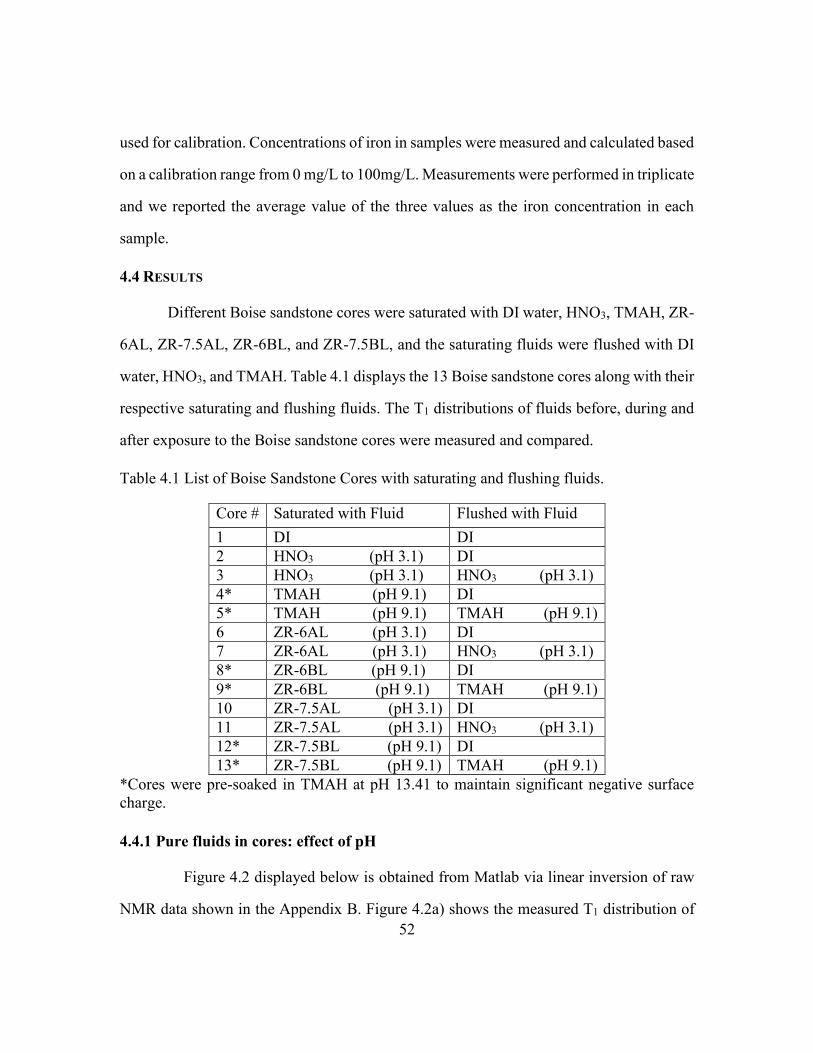
52
used for calibration. Concentrations of iron in samples were measured and calculated based
on a calibration range from 0 mg/L to 100mg/L. Measurements were performed in triplicate
and we reported the average value of the three values as the iron concentration in each
sample.
4.4 RESULTS
Different Boise sandstone cores were saturated with DI water, HNO3, TMAH, ZR-
6AL, ZR-7.5AL, ZR-6BL, and ZR-7.5BL, and the saturating fluids were flushed with DI
water, HNO3, and TMAH. Table 4.1 displays the 13 Boise sandstone cores along with their
respective saturating and flushing fluids. The T1 distributions of fluids before, during and
after exposure to the Boise sandstone cores were measured and compared.
Table 4.1 List of Boise Sandstone Cores with saturating and flushing fluids.
Core # Saturated with Fluid Flushed with Fluid
1 DI DI
2 HNO3 (pH 3.1) DI
3 HNO3 (pH 3.1) HNO3 (pH 3.1)
4* TMAH (pH 9.1) DI
5* TMAH (pH 9.1) TMAH (pH 9.1)
6 ZR-6AL (pH 3.1) DI
7 ZR-6AL (pH 3.1) HNO3 (pH 3.1)
8* ZR-6BL (pH 9.1) DI
9* ZR-6BL (pH 9.1) TMAH (pH 9.1)
10 ZR-7.5AL (pH 3.1) DI
11 ZR-7.5AL (pH 3.1) HNO3 (pH 3.1)
12* ZR-7.5BL (pH 9.1) DI
13* ZR-7.5BL (pH 9.1) TMAH (pH 9.1)
*Cores were pre-soaked in TMAH at pH 13.41 to maintain significant negative surface
charge.
4.4.1 Pure fluids in cores: effect of pH
Figure 4.2 displayed below is obtained from Matlab via linear inversion of raw
NMR data shown in the Appendix B. Figure 4.2a) shows the measured T1 distribution of

53
Boise sandstone cores #1 to #5 saturated with corresponding fluids. Core #1, saturated with
DI water, displayed a modal (peak) T1 value of 0.557 s and was used as a reference sample
against which to check for surface relaxivity alteration caused by pure solutions at different
pH values and addition of nanoparticles. Figure 4.2b) exhibits T1 distribution of Cores #1-
#5 after 2 pore volume flushing with selected fluids. T1 peak value of Cores #1-#5 after
core flooding are 0.534 s, 0.480 s, 0.465 s, 0.424 s, and 0.444 s respectively. After core
flooding, T1 values were slightly shorter comparing to those of saturated cores before
flushing.

54
Figure 4.2 The T1 distribution of a) Boise sandstone cores saturated with pure fluids at
different pH values: Core #1 saturated with DI water at pH 7, Core #2 and
#3 saturated with HNO3 at pH 3.1, Core #4 and #5 are pretreated with strong
TMAH at pH 13.4, and saturated with TMAH at pH 9.1; b) Boise sandstone
Cores #1-#5 after 2 pore volume flooding with selected fluids.
a)
b)

55
Table 4.2 T1 and pH values of original fluids and effluents.
Core # 1 2 3 4 5
Original Fluid T1 (s) 2.743 2.625 2.625 2.659 2.659
Core Saturated with Fluid T1 (s) 0.557 0.503 0.502 0.452 0.469
EffluentT1 (s) 2.630 2.571 2.607 2.183 2.051
Sandstone Surface Relaxation Rate (s-1) 1.430 1.606 1.610 1.833 1.758
Sandstone Surface Relaxivity (m/s) 5.05 5.67 5.69 6.48 6.21
Original Fluid Iron conc. (mg/L) 0 0.020 0.020 0.245 0.245
Effluent Iron conc. (mg/L) 0.071 0.046 0.053 3.594 2.953
Original Fluid pH 7.0 3.1 3.1 9.1 9.1
Effluent pH 7.1 6.9 6.7 9.9 10.0
Table 4.2 summarizes the T1 values of bulk fluid DI water, HNO3 at pH 3.1 and
TMAH at pH 9.1 after pretreated with strong TMAH at three stages of the experiment:
before entering a core, while within a core and after being displaced from a core. We
recorded the peak T1 value of each core saturated with different fluids, the sandstone
surface relaxation rate was calculated correspondingly based on Equation (4.4). Using the
T1 values of original DI water and sandstone Core#1 saturated with DI water, the Boise
sandstone surface relaxation rate was computed from Equations (4.4 and 4.5) as 1.43 s-1
when saturated with DI water. Assuming a median pore radius of 10.6 μm based on Boise
sandstone pore structure studied by Arawole (2015), the Boise sandstone surface relaxivity
was calculated as 5.05 m/s. Mild acid at pH 3.1 increased surface relaxivity slightly to
around 5.7 m/s and after pretreatment with strong alkali, saturation of mild alkali at pH
9.1 also increased sandstone surface relaxivity to around 6.3 m/s.
Each fluid’s and effluent’s pH values were recorded as well. The pH value of DI
water increased slightly from 7 to 7.1 after contact with Core #1. In Core #2 and Core #3,
the pH of the HNO3 effluents increased from 3.1 to values close to 7, indicating that most
of H+ in acid were either attached to negatively charged sandstone surface or reacted with
the mineral surfaces. After contact with Core #4 and Core #5, which were pretreated with

56
TMAH at pH 13.4, the effluent from the saturating fluid (TMAH) at pH 9.1 increased to
pH of 10, probably due to residue of strong TMAH left on sandstone surface that was dried
out was washed into effluent.
Iron concentration in HNO3 increased from 0.02 mg/L to 0.046 mg/L ~ 0.053 mg/L
after contact with Boise sandstone, indicated that acid dissolved some irons. TMAH at pH
9.1 showed increased iron concentration from 0.25 mg/L to 3.0 mg/L ~ 3.6 mg/L. Presence
of more irons in effluents results in shorter relaxation time.
4.4.2 Nanoparticle dispersions in cores
Negatively charged nanoparticle dispersion in Boise sandstone
Figure 4.3 shows the normalized nanoparticle concentration in the effluents with
respect to the concentration in the original ZR-6BL and ZR-7.5BL dispersions (6 wt% and
7.5 wt%) when flushed with DI water in Core #8 and #12 and with TMAH at pH 9.1 in
Core #9 and #13. Comparison of the mass of nanoparticles in the effluents and original
fluids indicated little retention of nanoparticles in Boise sandstone cores, with about 2.8%
and 2.3% of the ZR-6BL and ZR-7.5BL nanoparticles retained in Core #9 and #13 when
flushed by TMAH, and approximately 3.4% and 3.0% of nanoparticles in ZR-6BL and ZR-
7.5BL trapped in Core #8 and #12 after DI water flushing.

57
Figure 4.3 Normalized effluent nanoparticle concentration with respect to nanoparticle
concentration in original ZR-6BL and ZR-7.5BL dispersion (6 wt% and 7.5
wt%) as a function of pore volume flushing in Cores #8, #9, #12, and #13.
Two pore volumes of DI was injected into Cores #8 and #12; 2 pore
volumes of water and TMAH at pH 9.1 were used to flush Core #9 and #13.
The T1 value for the effluent (see Table 4.3) was obtained by measuring the
first 0.7 pore volumes commingled.
As shown in Figure 4.4, a) before core flooding, Boise sandstone Cores #4, #8, #9,
#12, and #13 were saturated respectively with TMAH at pH 9.1, ZR-6BL, ZR-6BL, ZR-
7.5BL and ZR-7.5BL. The corresponding T1 peak values are 0.452 s, 0.115 s, 0.108 s,
0.0803 s, and 0.0724 s; b) after flushing 2 pore volumes, Cores #8, #9, #12 and #13 had T1
peak values (0.378 s, 0.307 s, 0.274 s, and 0.268 s, respectively) close to 0.424 s of Core
#4. This suggests comparable surface relaxivity to that exhibited by Core #4, which was
pretreated with the same strong alkali used to pretreat Cores #8, #9, #12, and #13. The
retained 2.3% to 3.4% of nanoparticles in Cores #8, #9, #12, and #13 after flushing may
contribute to the shortening of the T1 peak value relative to that of Core #4. Therefore, this
0
0.2
0.4
0.6
0.8
1
1.2
0 0.5 1 1.5 2
C/C
0
Flushed pore volume
#8
#9
#12
#13

58
surface relaxivity alteration was likely a direct result of the pretreatment; retained
nanoparticles in the porous media after core flooding played a role in speeding up the
overall relaxation rate. Figure 4.4 was obtained from Matlab processing of raw data
displayed in Appendix B via linear inversion.
Figure 4.4 The T1 distribution of Boise sandstone Cores #1, #4, #8, #9, #12, and #13 a)
saturated with TMAH at pH 9.1, ZR-6BL, ZR-6BL, ZR-7.5BL, and ZR-
7.5BL, respectively and b) after flushing with two pore volumes of DI water
and TMAH at pH 9.1. Figures are obtained from Matlab via linear inversion,
number of point for T1 distribution was set to 200.
a)
b)

59
Table 4.3 T1 of ZR-6BL and ZR-7.5BL dispersions before, during and after contact with
Boise sandstone, along with pH value and nanoparticle size, zeta potential
relaxation rate and relaxivity in original dispersion and effluents.
Core # 8 9 12 13
Original Fluid T1 (s) 0.878 0.832 0.733 0.733
Core Saturated with Fluid T1 (s) 0.115 0.108 0.803 0.724
Effluent T1 (s) 0.121 0.0855 0.058 0.061
Effluent pure dispersion fluid without
nanoparticles T1 (s) 1.44 1.65 1.10 1.37
Original Fluid pH 9.1 9.1 9.1 9.1
Effluent pH 9.5 9.6 9.7 9.9
Iron concentration in Original Fluid without
nanoparticles (mg/L) 0.015 0.015 0.018 0.018
Iron concentration in Effluent without
nanoparticles (mg/L) 2.91 1.58 3.04 2.83
Nanoparticle Relaxation Rate in Original
Fluids (s-1) 0.774 0.774 1.000 1.000
Nanoparticle Relaxivity in Effluents (m/s) 12.34 16.19 17.49 18.82
Nanoparticle Size in Original Fluids (nm) 72.4 72.4 72.7 72.7
Nanoparticle Size in Effluents (nm) 78.0 77.4 78.4 79.0
Nanoparticle Relaxation Rate in Effluents (s-1) 7.60 11.09 16.32 15.66
Nanoparticle Relaxivity in Original Fluids
(m/s) 1.095 1.095 1.095 1.095
Nanoparticle Zeta Potential in Original Fluids
(mV) -28.9 -28.9 -29.3 -29.3
Nanoparticle Zeta Potential in Effluents (mV) -26.1 -25.8 -26.2 -26.2
As shown in Table 4.3, the T1 of ZR-6BL decreased from 0.878 s to 0.121 s and
0.0855 s after contact with sandstone Cores #8 and #9; similarly, T1 of ZR-7.5BL dropped
from 0.733 s to around 0.06 s after being flushed from Cores #12 and #13. This is
inconsistent with small amount of nanoparticle retention in the cores (2.3% to 3.4%), which
would have increased the relaxation times slightly. When ZR-6BL was saturating the
sandstone Core #9, T1 was around 0.108 s, which is longer than that of the effluents: 0.0855
s. For ZR-7.5BL saturated Core #12, T1 peak value was 0.0803 s, while effluent from Core

60
#12 has shorter T1 as 0.058 s. It is possible that this is a result of nanoparticle adsorption
on the mineral surfaces as explained in Chapter 3.
The T1 of the first 0.7 pore volumes of effluent collected from Cores #8, #9, #12
and #13 were 0.121 s, 0.0855s, 0.058s and 0.061 s, respectively. The T1 of the effluents
after removal of nanoparticles by filtration shown in Table 4.3 (1.44 s, 1.65 s, 1.10 s and
1.37 s) were shorter than the effluent T1 from Cores #4 (2.183 s) and Core #5 (2.051 s)
displayed in Table 4.2. But the difference cannot explain the significant drop in T1 of
effluents from ZR-BL saturated cores. This suggests that the much faster relaxation seen
in the effluents was mainly caused by the nanoparticles themselves rather than the
dispersion fluid. For pure fluid in ZR-6BL and ZR-7.5BL effluents after removal of
nanoparticles, iron concentrations were 1.6 mg/L to 3.0 mg/L, smaller than that in TMAH
effluent (3.0 mg/L to 3.6 mg/L). It is possible that irons with positive charge tends to attach
on negatively charged nanoparticles and were removed in the centrifuge procedure. More
iron present will result in shorter relaxation time, this is consistent with T1 measurements
mentioned above. Another possibility is that there were other magnetic species such as Mn
in the effluent that sped up the relaxation, but we did not measure concentration of Mn in
this study.
After deduction of the pure dispersion fluid’s contribution to the overall relaxation
rate, the nanoparticle relaxation rate in the effluents increased by a factor more than 10.
Given the computed nanoparticle concentration based on Figure 4.3, according to
Equations (4.1 and 4.2), the relaxivity of the nanoparticles increased from 1.10 m/s (Zhu
et al., 2015) to 12.3 m/s ~ 16.2 m/s (in effluents wash from Core #8 and #9) and 17.5
m/s ~ 18.8 m/s (in effluents from Core #12 and #13) after contacting with strong alkali-
treated Boise sandstone cores. The dramatic increase in nanoparticle relaxivity was
possibly due to interactions between nanoparticle dispersion and Boise sandstone surface.

61
Alkaline solution with pH larger than 8 brought mineral surface dissolution (Revil et al.,
1999a, b), paramagnetic materials such as iron cations were exposed and attached to
negatively charged nanoparticles. Attached iron onto nanoparticles in ZR-6BL will help
increase nanoparticle relaxivity. With the same nanoparticle concentration in the
nanofluids before core flooding, nanoparticles in effluents flushed by DI water had lower
relaxivities than nanoparticles in effluents flushed by TMAH at pH 9.1. It is possible that
this is due to the higher pH creating a more negative surface charge on the nanoparticles,
promoting more adsorption of metal cations.
Due to the procedures used to pre-treat Cores #8, #9, #12, and #13, there might be
residual TMAH on the sandstone surface after oven drying. This would tend to increase
the pH of the ZR-6BL after contact with Boise sandstone cores. Nanoparticles in the ZR-
6BL and ZR-7.5BL effluents remained stable, with zeta potential increasing slightly by 3
m V ~ 4 mV and size increasing by 5 nm ~ 6 nm.
Positively charged nanoparticle dispersion in Boise sandstone
Figure 4.6a) exhibits T1 profile of Cores #2, #6, #7, #10 and #11 saturated with
HNO3, ZR-6AL, ZR-6AL, ZR-7.5AL, and ZR-7.5AL, respectively. Normalized
nanoparticle concentration in effluents with respect to the concentration of the original ZR-
6AL and ZR-7.5AL dispersions (6 wt% and 7.5 wt%) as a function of flushed pore volume
in Cores #6, #7, #10 and #11 are displayed in Figure 4.5. Based on these measurements we
determined that 40% and 37% of the nanoparticles were retained in Core #6 and #10 after
flushing with 2 pore volumes of DI water, and 35% and 31% of the nanoparticles were
retained in Core #7 and #11 after flushing with 2 pore volumes of HNO3. After flushing,
Boise sandstone cores were put in the NMR probe to measure the T1 distributions. As
shown in Figure 4.6b), with nanoparticles retained in Core #6, #7, #10, and #11, the T1

62
peak values were 0.424 s, 0.322 s, 0.361 s, and 0. 250 s, respectively. The values are shorter
than that of Core #2 after core flooding: 0.480 s. Figure 4.6 is obtained from Matlab
processing linear inversion of NMR raw data displayed in the Appendix B.
Table 4.4 T1 of ZR-6AL and ZR-7.5AL dispersions before, during and after contact with
Boise sandstone, along with pH value and nanoparticle size, zeta potential
relaxation rate, and relaxivity in original dispersion and effluents.
Core # 6 7 10 11
Original Fluid T1 (s) 0.794 0.794 0.676 0.676
Core Saturated with Fluid T1 (s) 0.284 0.299 0.251 0.235
Effluent T1 (s) 0.439 0.178 0.360 0.169
Effluent pure dispersion fluid without
nanoparticles T1 (s) 2.271 1.880 2.210 1.872
Original Fluid pH 3.1 3.1 3.1 3.1
Effluent pH 4.5 4.4 4.3 4.3
Iron concentration in Original Fluid without
nanoparticles (mg/L) 0.022 0.022 0.023 0.023
Iron concentration in Effluent without
nanoparticles (mg/L) 0.035 0.049 0.037 0.047
Nanoparticle Relaxation Rate in Original
Fluids (s-1) 0.895 0.895 1.115 1.115
Nanoparticle Relaxation Rate in Effluents (s-1) 1.84 5.07 2.33 5.38
Nanoparticle Size in Original Fluids (nm) 101 101 101 101
Nanoparticle Size in Effluents (nm) 109 108 104 106
Nanoparticle Relaxivity in Original Fluids
(m/s) 1.427 1.427 1.427 1.427
Nanoparticle Relaxivity in Effluents (m/s) 4.68 10.08 4.29 8.95
Nanoparticle Zeta Potential in Original Fluids
(mV) 32.1 32.1 32.5 32.5
Nanoparticle Zeta Potential in Effluents (mV) 20.1 22.4 21.0 21.9

63
Figure 4.5 Normalized effluent nanoparticle concentration with respect to nanoparticle
concentration in the original ZR-6AL and ZR-7.5AL dispersions (6 wt% and
7.5 wt%) as a function of pore volume flushed in Cores #6, #7, #10 and #11.
Two pore volumes of selected fluid was injected into Cores #6, #7, #10 and
#11, which were originally saturated with ZR-6AL and ZR-7.5AL. The T1
value for the effluent (see Table 4.4) was obtained by measuring the first 0.7
pore volumes commingled.
0
0.2
0.4
0.6
0.8
1
1.2
0 0.5 1 1.5 2
C/C
0
Flushed pore volume
#6
#7
#10
#11

64
Figure 4.6 The T1 distributions of Boise sandstone Cores #1, #2, #6, #7, #10 and #11 a)
saturated with HNO3, ZR-6AL, ZR-6AL, ZR-7.5AL, and ZR-7.5AL,
respectively, and b) Cores #4, #6, #7, #10 and #11 after flushing with two
pore volumes of selected fluids. Figures are obtained from Matlab via linear
inversion, number of point for T1 distribution was set to 200.
Table 4.4 summarizes nanoparticle relaxation rate, nanoparticle size and zeta
potential, and T1 of ZR-6AL and ZR-7.5AL dispersions before and after flooding in Boise
sandstone. T1 of ZR-6AL decreased from 0.794 s to 0.4398 s and 0.178 s after contact with
a)
b)
65
to sandstone Cores # 6 and #7, T1 of ZR-7.5AL dropped from 0.676 s to 0.360s and 0.169
s in the first 0.7 pore volume effluents displaced from Core #10 and #11. After removing
nanoparticles from effluent, the pure dispersion fluid showed shorter T1 (2.271 s, 1.880 s,
2.210 s and 1.872 s) than the effluents from Core #2 (2.571 s) and Core #3 (2.607 s). The
difference may be due to additional interactions between the Boise sandstone surface and
the acidic nanoparticle dispersion that resulted in more paramagnetic species dissolved into
fluid. After subtracting the pure dispersion fluid’s contribution to the overall relaxation
rate, we found that the nanoparticle relaxation rate in the effluents increased by a factor of
2~6. Given the computed nanoparticle concentrations based on Figure 4.3, according to
Equations (4.1 and 4.2), the relaxivity of ZR-6AL increased from 1.43 m/s (Zhu et al.,
2015) to 4.68 m/s, 10.08 m/s, 4.29 m/s, and 8.95 m/s after flooding the Boise
sandstone Cores #6, #7, #10, and #11 respectively. ZR-AL nanoparticles flushed by DI
water have relaxivities lower than 5 m/s, while ZR-AL nanoparticles flushed by HNO3
have higher relaxivity of 9 to 10 m/s. It is possible that at lower pH, more paramagnetic
ions can be removed from the pore surface and be available to adsorb onto nanoparticles.
After being exposed to the sandstone pore surface, the pH value of the effluents
increased by less than 1.5, and the pH difference is much smaller than the acidic fluid (no
nanoparticles) used in Core #2 and Core #3 in which the pH value increased from 3 to
around 7. It is possible that some of the abundant H+ in the ZR-6AL and ZR-7.5AL
dispersions attached to the negatively charged sandstone surface or reacted chemical with
impurities on mineral surface. Since H+ is the stabilizer in ZR-6AL and ZR-7.5AL, H+
were ionically bonded at the nanoparticle surface and within the Stern layer. Due to the
large surface area to volume ratio of the nanoparticles, less H+ was available to be attached
to the sandstone surface when nanoparticles were present, and the pH of the effluents was
relatively larger than that of the pure HNO3 effluents after contact with Core #2 and Core

66
#3. Nanoparticle zeta potential dropped from 32 mV to 20 m V ~ 22 mV, and nanoparticle
size remained similar to that in the original dispersion.
4.5 DISCUSSIONS
4.5.1 General observations
After saturating Boise sandstone cores with pure fluids at different pH, effluents
from Cores #1 to #5 showed shorter T1 compared to that of the original fluid. The decrease
in T1 of DI water after contact with Boise sandstone is probably due to the presence of
dissolved paramagnetic species or mobilized fine mineral particles in the sandstone core
(Keating and Knight, 2008). Cores #2 and #3, which were saturated with HNO3, displayed
enhanced surface relaxivity and increased relaxation rate 1/T1 in the effluents. A possible
explanation is that acid contains more H+ which can react with impurities such as Fe2O3 on
sandstone surface, and dissolve more paramagnetic materials in pore fluid. Iron
concentrations in effluents from Core #2 and Core #3 were relatively higher than original
fluids (0.05 mg/L in effluent versus 0.02 mg/L in original fluids). For Cores #4 and #5
which are pretreated with strong TMAH, relaxivity of sandstone surface increased from
5.05 m/s to larger than 6 m/s. This is probably due to mineral surface dissolution that
occurs when silica cores are saturated with alkaline solution at pH higher than 8 (Revil et
al., 1999a,b). In this situation, paramagnetic ions such as iron in sandstone could be
exposed to pore fluid and dislodged into pore fluid, thereby speed up relaxation in pore
fluid (Foley et al., 1996). Effluents from Cores #4 and #5 showed increased Fe
concentration comparing to that in original fluids (3.0 mg/L ~ 3.5 mg/L comparing to 0.25
mg/L)
Effluents of both ZR-6AL, ZR-7.5AL, ZR-6BL, and ZR-7.5BL had much shorter
relaxation time than the original dispersions despite the fact that part of nanoparticles have

67
been captured in sandstone cores, which should have slowed relaxation in the effluent. The
ways in which sandstone surface relaxivity changed with presence of zirconia nanoparticles
dispersions depended both on the dispersion pH and the surface charge of the nanoparticles.
4.5.2 Negatively charged nanoparticles dispersion in Boise sandstone
Given the negative surface charge of nanoparticles in the original fluids and
effluents, there was an electrostatic repulsive force between the nanoparticles and the
sandstone surface. Nanoparticle retention occurred due to reversible adsorption on pore
surface caused by van der Waals attraction. Brownian diffusion would finally release
attached nanoparticles from pore wall when flushed with a pure fluid containing no
nanoparticles (Yu et al., 2010). According to Equations (4.3, 4.4, 4.5, 4.6, and 4.7) and
altered sandstone surface relaxivity as 6.3 m/s by strong alkali, 13% ~ 19% of ZR-6BL
nanoparticles were initially attached to sandstone surface due to van der Waals attraction
and more than 82% ~ 88% of the attached nanoparticles were removed due to Brownian
motion. For cores saturated with ZR-7.5BL, 15% ~ 21% of ZR-7.5BL nanoparticles were
initially attached to sandstone surface due to van der Waals attraction, while Brownian
motion removed about 80% ~ 86% of the attached nanoparticles.
Along with mineral surface dissolution under strong alkaline condition, it is
possible that after interactions with Boise sandstone surface, the stabilizer TMAH was
consumed during interactions with silica surface, less stabilizer in pore fluid brought more
pure nanoparticles exposed to the bulk fluid and provided more paramagnetic relaxation
sites for protons. Slightly increased nanoparticle size and zeta potential in effluents does
indicate less stability of the nanoparticles, which may due to less stabilizer remained.
Attached iron cations onto nanoparticle surface also played a role in increase nanoparticle
surface relaxivity.

68
The theoretical maximum amount of ZR-BL that can attach onto Boise sandstone
may be computed using a geometrical method by assuming that attached nanoparticles
form a dense pack in a monolayer and occupy a projected area of ℼrNP2 on the pore surface.
According to a hexagonal packing of equal circles, the highest surface fraction that can be
occupied by the projected area of the nanoparticles is 0.9069. In Boise sandstone saturated
with ZR-6BL, I assume that the pores can be simplified as spheres with a median radius of
10.6 m. With nanoparticle size around 72 nm and volume fraction of 1.114%, number of
nanoparticles in ZR-6BL inside a single pore is calculated as 2.73 × 10⁵. Based on
Equations (4.3, 4.4, 4.5, 4.6, and 4.7), the largest number of nanoparticles that can possibly
adsorbed onto the pore surface is 3.15 × 10⁵, where 90.69% of grain surface is covered by
attached nanoparticle monolayer. The corresponding surface relaxivity is about 8.98 m/s
to 10.7 m/s depending on the surface relaxivity of the attached nanoparticles. Our
experimental results indicated that, with 2.8% and 3.4% of 2.73 × 10⁵ ZR-6BL
nanoparticles retained in a single pore of Cores #9 and #8, there are 2.2% and 2.7% of
sandstone pore surface covered by trapped nanoparticles. Similarly, in ZR-7.5BL saturated
Boise sandstone cores, there are 2.73 × 10⁵ nanoparticles inside a single pore with radius
10.6 m, highest possible percentage of attached nanoparticles is 89.7% (3.15 × 10⁵
nanoparticles) when 0.9069 of pore surface is covered by monolayer of attached
nanoparticles. The resulting surface relaxivity would be 16.5 m/s to 17.7 m/s in this
case. With 2.3% and 3.0% of ZR-7.5BL (7843 and 10230 nanoparticles) retained in Cores
#13 and #12, assuming monolayer packing of trapped nanoparticles onto pore surface, the
surface fractions covered by nanoparticles are 2.3% and 3.0%, respectively.
Assuming a monolayer packing of attached ZR-BL nanoparticles, with the lowest
and highest relaxivities determined from effluents, the relaxivity range of the Boise
sandstone pore surface covered with retained nanoparticles is calculated and displayed by

69
lines in Figure 4.7. Theoretical The experimental data fall within the predicted range.
Source of error bars are NMR noise and errors in obtaining longitudinal relaxation rate
(1/T1) of flushing fluid by linear regression of raw data. The scatter observed in the
experimental data points indicates that the nanoparticles may have variable relaxivity
between these bounds, or the pore size in each Boise sandstone cores is not exactly the
same as 10.6 m. When comparing cores contacted with same nanofluids, surface
relaxivities of Cores # 8 and #12 flushed by DI water were close to the lower bound while
the relaxivity values of Cores #9 and #13 after flushing with TMAH were closes to the
upper bound.

70
Figure 4.7 Computed possible boundaries (two lines) of Boise sandstone pore surface
relaxivities covered by different fraction of ZR-BL nanoparticles with 12.3
m/s and 18.8 m/s. Experimental determined sandstone pore surface
relaxivities from flushed Boise sandstone cores and corresponding retained
nanoparticle fraction are indicated by scattered points. Diagram at the
bottom shows zoomed in view with x-axis ranges from 0 to 0.1 and y-axis
ranges from 6 to 7.5.
0
2
4
6
8
10
12
14
16
18
20
0 0.2 0.4 0.6 0.8 1
Po
re s
urf
ace
re
laxiv
ity (
m/s
)
ZR-BL nanoparticles adsorbed on to pore surface / Theoretical adsorption capacity
Nanoparticles with relaxivity of 18.8 um/s -monolayer packingNanoparticles with relaxivity of 12.3 um/s -monolayer packingExperimental data
#8
#9#12
#13
6
6.2
6.4
6.6
6.8
7
7.2
7.4
0 0.02 0.04 0.06 0.08 0.1
Po
re s
urf
ace
rela
xiv
ity (
m/s
)
ZR-BL nanoparticles adsorbed on to pore surface / Theoretical adsorption capacity
Nanoparticles with relaxivity of 18.8 um/s -monolayer packingNanoparticles with relaxivity of 12.3 um/s -monolayer packingExperimental data

71
4.5.3 Positively charged nanoparticles dispersion in Boise sandstone
Core flooding with DI water in Core #6 and Core #10 (37% and 40%) trapped
more fraction of positively charged nanoparticles than in Core #7 and Corex cc #11 (35%
and 31%) flushed by HNO3 at pH 3.1. It is possible that since SiO2 zeta potential drops
from -10 mV to -65 mV as pH increases from 2 to 10 (Li and De Bruyn, 1966), sandstone
surface tends to be more negative at higher pH and attract more positively charged
nanoparticles. Based on Equations (4.3, 4.4, 4.5, 4.6, and 4.7), 49% ~ 52% of nanoparticles
in ZR-6AL were initially attached onto Cores #6 and #7 driven by electrostatic attraction,
Boise sandstone surface relaxivity was altered to about 5 m/s ~ 6.7 m/s. Around 45% ~
50% of ZR-7.5AL were attached onto Cores #10 and #11 before core flooding. Boise
sandstone surface relaxivity changed from 5.05 m/s to around 5.4 m/s as a result of the
attached nanoparticles. The surface relaxivity of the zirconia nanoparticles in effluents
increased from 1.43 m/s to more than 4 m/s (washed with DI water) and approximately
9 m/s (washed with HNO3). After interactions between the nanoparticle dispersion and
the mineral surface, pore fluid pH increased, decreasing the positive charge on nanoparticle
surface and weakening the bond between nanoparticles and pore surface, causing around
20% ~ 30% of adsorbed nanoparticles to desorb back into the fluid. Similar with ZR-BL,
increased surface relaxivity may due to less stabilized condition where part of H+ were
attached onto sandstone surface or reacted with impurities, leaving more paramagnetic
relaxation sites on pure nanoparticles that were accessible to protons. Changes in
nanoparticle size and drops in zeta potential again indicated less stability of the
nanoparticles in dispersion.
We used the same geometric method that was used to calculate largest fraction of
ZR-BL can be adsorbed on the sandstone surface. In Boise sandstone cores saturated with
ZR-6AL, with nanoparticle radius of 101 nm, there are 1.03 × 10⁵ nanoparticles in a

72
spherical pore with radius 10.6 μm. The theoretical maximum number of ZR-AL
nanoparticles that can be adsorbed on the pore surface is 1.60 × 10⁵ to cover 90.69% of the
sandstone pore surface area. The corresponding surface relaxivity is about 4.77 m/s to
9.67 m/s depending on the surface relaxivity of attached nanoparticles. Experimental data
showed that there were 35% and 40% of ZR-6AL (36050 and 41200 nanoparticles) trapped
in Boise sandstone Cores #7 and #6, surface fractions covered by attached nanoparticles
are 20.45% and 23.38% respectively assuming monolayer packing. Similarly, in Boise
sandstone cores saturated with ZR-7.5AL, the number of nanoparticles with radius as 51
nm inside a pore with radius 10.6 m is 1.25 × 10⁵, the highest theoretical amount of
attached nanoparticles is 1.60 × 10⁵ when 0.9069 pore surface is occupied by nanoparticles.
The resulting surface relaxivity would be 4.42 m/s to 7.74 m/s in this case. According
to experimental results, there were 31% and 37% of nanoparticles (38750 and 46250
nanoparticles) retained in Cores #11 and #10, covering 21.99% and 26.42% of pore surface
via monolayer packing.
In Figure 4.8, Boise sandstone surface relaxivities determined experimentally are
indicated by scattered points. Error bars are computed from determination of the
longitudinal relaxation rate (1/T1) of flooding fluid by linear regression of raw data and
noise. The expected surface relaxivity bounds were computed assuming a monolayer
packing of attached ZR-AL nanoparticles with relaxivities of 4.29 m/s and 10.08 m/s.
The ZR-AL nanoparticles flushed with DI water from Cores #6 and #10 have relaxivity
close to 5.9 m/s, while the ZR-AL nanoparticles flushed with HNO3 from Cores #7 and
#11 have relaxivity around 6.4 m/s. The experimental data form Cores #6 and #10 are
located closer to the lower bound, while the computed relaxivities of Cores #7 and #11 are
closer to the upper bound. As before, it is possible that the nanoparticles inside the core
had relaxivity values between the bounds I assumed here.

73
Figure 4.8 Computed possible boundaries (two lines) of Boise sandstone pore surface
relaxivities covered by different fraction of ZR-AL nanoparticles with 4.29
m/s and 10.08 m/s. Experimental determined sandstone pore surface
relaxivities from flushed Boise sandstone cores and corresponding retained
nanoparticle fraction are indicated by scattered points.
In the future, we will inject NP dispersions with positive surface charge that do not
require changing the pH in the sandstone pores. In our experiments, we only pretreated the
sandstone with strong alkali to allow stability of negatively charged nanoparticles, and the
behavior of these nanoparticles is treated as a control group with zero adsorption. Therefore
this treatment would likely not be required in the field.
#6
#7
#10
#11
4
5
6
7
8
9
10
0 0.2 0.4 0.6 0.8 1
Pore
surf
ace r
ela
xiv
ity
(m
/s)
ZR-AL nanoparticles adsorbed on to pore surface / Theoretical adsorption capacity
Nanoparticles with relaxivity of 10.08 um/s - monolayerpacking
Nanoparticles with relaxivity of 4.29 um/s - monolayerpacking
Experimental data

74
4.6 CONCLUSIONS
Our study showed that nanoparticle dispersions in Boise sandstone cores altered
sandstone surface relaxivity, in a complicated way depending on nanoparticles’ surface
charge and pH condition of the dispersions. During contact with 6 wt% and 7.5 wt%
positively charged zirconia nanoparticles at pH 3.1, Boise sandstone surface relaxivity
changed from 5.05 m/s to 5 m/s ~ 6.7 m/s due to 45% ~ 51% adsorbed nanoparticles
onto pore surface. In Boise sandstone pores with pore walls pretreated with TMAH at pH
13.4, sandstone surface relaxivity increased to more than 6 m/s due to strong alkaline
condition, nanoparticle dispersion at pH 9.1 with 6 wt% and 7.5 wt% negatively charged
zirconia nanoparticles temporally increased sandstone surface relaxivity to 7 m/s ~ 10
m/s when approximately 13% ~ 21% of negatively charged nanoparticles were attached
to silica surface driven by Van der Waals attraction. However, after coreflooding, most
attached negatively charged nanoparticles were removed by Brownian diffusion, Boise
sandstone surface relaxivity remained more than 6 m/s as result from strong alkaline
environment.
In this experiment, with a pore radius as small as 10.6 m, the specific surface area
of Boise sandstone is much larger than that of the 2 mm glass bead pack, which has pore
radius around 613 m. This provides more surface area for nanoparticle attachment. In the
2 mm glass bead pack, only up to 30% of ZR-6AL can attach to the bead surface and form
a dense monolayer packing of nanoparticles, while in Boise sandstone, the upper limit is
100% for ZR-6AL. The theoretical maximum amount of adsorbed nanoparticles onto the
pore surface is limited by the density of the hexagonal packing of equal circles:
nanoparticles can only occupy up to 0.9069 of the pore surface via the projected area. In
this limit, the sandstone surface contributes a negligible amount to the surface relaxation
on the pore wall. It should be pointed out that the dense packing of nanoparticles in a

75
monolayer on the pore surface may not be achieved, as it is possible that nanoparticles
attach to some sites of pore surface preferentially due to heterogeneity and localized driving
forces. The electrostatic repulsion between nanoparticles may limit the maximum amount
of nanoparticles that can adsorb on the pore walls below the theoretical maximum predicted
for hexagonal packing. In addition, the hydration layer on nanoparticles and the pore
surface may also affect adsorption. Further experiments should be performed to study the
effects of hydration layers.
Experimental results indicated that pH of nanoparticle dispersions played a role in
interactions with Boise sandstone surface. Acid could increase Boise sandstone surface
relaxivity by reacting with impurities such as Fe2O3 and FeO on mineral surface (Pettijohn,
1963). HNO3 at pH 3.1 increased Boise sandstone surface relaxivity from 5.05 m/s to 5.7
m/s. Alkali can alter Boise sandstone surface relaxivity by mineral surface dissolution
and exposure of paramagnetic impurities to pore fluid. Such alteration can remain for long
period as long as pore fluid condition remains alkaline. TMAH at pH 13.4 increased Boise
sandstone surface relaxivity to higher than 6 m/s.
After contact with Boise sandstone, zirconia nanoparticles with positive and
negative surface charges both showed increased relaxivity. Positively charged
nanoparticles relaxivity increased from 1.43 m/s to 4.3 m/s ~10 m/s. Nanoparticles
with negative surface charge displayed increased relaxivity from 1.10 m/s to 12 m/s ~
19 m/s after contact with TMAH treated Boise sandstone. Such increase in relaxivity were
possibly due to less stabilizer in dispersions after interactions with sandstone surface. Less
stabilizers were ionically bounded with nanoparticles, leaving more specific area of
nanoparticles exposure to bulk fluid and increasing chance of protons to get close to
paramagnetic sites and relaxed faster. Hence increased the effective relaxivity of
nanoparticles. Attachment of iron ions on negatively charged nanoparticles further

76
enhanced nanoparticle relaxivity. Our work helps to understand the behavior of
nanoparticles in porous media through NMR measurements and will be used in future
studies on the pore-scale characteristics in rocks. This work will help advance nanoparticle-
based analyses of fluid-solid or fluid-fluid interfaces through adsorption of nanoparticles.
Applications of this work include imaging oil-water contacts, and determining interfacial
surface areas for many petrophysical and reservoir engineering needs. However, the
differences in temperature and pressure conditions between oilfield subsurface and the
laboratory may lead to different properties of nanoparticles and interactions between
nanoparticles and pores.

77
Chapter 5
Altering nuclear magnetic resonance surface relaxation on
nanoparticles by adsorption of Fe(III)
5.1 INTRODUCTION
Many applications of nuclear magnetic resonance (NMR) have been explored in
recent decades. In the biological and medical areas, NMR is used to obtain images of
anatomy and physiological processes of bodies, which helps in the diagnosis and treatment
of diseases (Mansfield and Pykett, 1978). In the oil and gas industry, NMR is employed to
determine porosity, pore size, permeability, tortuosity, water saturation, and wettability of
reservoir rocks (Hinedi et al., 1997; Freedman et al., 2003; Wang et al., 2005; Daigle and
Johnson, 2016). Pore surface relaxivity is the key parameter that links the NMR signal to
pore size in rock samples (Coates et al., 1999).
With the development of nanotechnology and nanomaterials having the advantage
of small size and large surface area to volume ratio, paramagnetic nanoparticles and
magnetic nanoparticles have been used as enhanced oil recovery agents (Ogolo et al., 2012)
and applied in produced water purification (Ko et al., 2014). They have also been employed
in the characterization of multiphase fluid dynamics in porous media (Prodanović et al.,
2010) and pore connectivity (Cheng et al., 2014b). Their use in NMR has included
application as contrast agents to highlight the pores that contribute the most to flow (Cheng
et al., 2014b) and more robust determination of pore size through alteration of rock surface
properties (Zhu et al., 2016).
Nanoparticles have been widely used in medical and biological sciences as
magnetic resonance imaging (MRI) contrast agents (Na et al., 2009), which help
identification of disease-specific biomarkers at molecular and cellular levels. Coating of
these nanoparticles with various polymers or functional groups is introduced to generate

78
shells that bring compatibility in biological environments and to attach to specific human
tissue (Oh et al., 2006) and other applications. The behavior of these surface coatings often
depends on having precise control on fluid chemistry (Petri-Fink et al., 2008). However,
when nanoparticles are injected into subsurface reservoir rocks, the pore fluid chemistry
cannot be controlled or predicted as easily as in medical applications. The chemistry of
pore fluid and behavior of nanoparticles can vary from site to site. The behavior and
stability of nanoparticles affect NMR response and limit their application in downhole
environments (Carter et al., 2005). Polymer coatings are often used to stabilize
nanoparticles in harsh reservoir conditions (ShamsiJazeyi et al., 2014). While providing
the dispersion stability that is necessary for subsurface applications, the surface properties
of the nanoparticles can take on the properties of those polymers themselves, potentially
completely masking the properties of the nanoparticle core (Gupta and Gupta, 2004).
In the subsurface, anions and cations in the pore fluid can interact with the solid
pore surface. If more paramagnetic ions are present on the pore surface, the relaxivity of
pore surface will increase, which will reduce the NMR relaxation time. Following
adsorption of paramagnetic cations such as Fe(III) and Mn(II), increases in mineral surface
relaxivity have been observed that follow predictions from theory (Kenyon and Kolleeny,
1995; Bryar et al., 2000). Previous studies also indicated that cations could similarly adsorb
onto nanoparticles (Hu et al., 2005) or the surface coating driven by electrostatic attraction
(Zhang et al., 2009). Our previous results in Chapter 4 indicates that attachment of Fe ions
from Boise sandstone pore surface onto zirconia nanoparticles in pores may increase
relaxivities of nanoparticles by a factor of 8 to 12. Research on how adsorbed ions on
nanoparticles can change relaxivity is limited. For practical use of nanoparticles as contrast
agents in the subsurface, it is crucial to understand the way magnetic and paramagnetic
ions affect nanoparticles and corresponding NMR signals.

79
5.2 RELAXATION THEORY
5.2.1 Relaxivity of nanoparticles in dispersions
Relaxation of hydrogen nuclei in nanoparticle dispersions is similar to the
relaxation behavior of a very dilute porous medium in which solid nanoparticles are the
matrix providing surface relaxation (Korb et al., 1997; McDonald et al., 2005; Zhu et al.,
2015), and the bulk fluid in which the nanoparticles are dispersed provides the bulk fluid
relaxation. The overall longitudinal relaxation rate 1/T1 of a nanoparticle dispersion is the
sum of the contributions from bulk relaxation rate 1/T1,Fluid and nanoparticle surface
relaxation rate 1/T1,NP (e.g., Carr and Purcell, 1954):
. (5.1)
The bulk fluid relaxation rate is easy to obtain from experiments by measuring the
relaxation time of pure dispersing fluid.
When diffusion of water molecules across the pores is fast enough to maintain
uniform magnetization in the pores during signal decay, the longitudinal surface relaxivity
ρ1 can be used to link 1/T1,NP to S/V , the ratio of total nanoparticle surface area to total
fluid volume in the dispersion (Senturia and Robinson, 1970). In Equation (5.2), Spore is
nanoparticles’ surface area, which can be calculated from nanoparticles’ volume VNP and
radius rNP assuming that the nanoparticles are spherical. Vpore is fluid volume which equals
total dispersion volume VTotal minus the nanoparticles’ volume VNP. The parameter v is the
ratio of the nanoparticles’ volume to the fluid volume in the dispersion (Zhu et al., 2015).
. (5.2)
1 1,Fluid 1,NP
1 1 1
T T T
1,NP 1,NP 1,NP
1,NP
3
1 3NP
NP
pore Total NP NP
VrS v
T V V V r

80
5.2.2 Relaxivity of Fe cations in solution
For paramagnetic ions in solution, the NMR relaxation theory was first developed
by Solomon (1955) and extended by Bloembergen and Morgan (1961). The overall
longitudinal relaxation rate of aqueous solutions with paramagnetic ions 1/T1,Fluid contains
contributions from the paramagnetic species’ relaxation rates and the pure water bulk
relaxation rate 1/T1,W (Bryar et al., 2000), as indicated in Equation (5.3):
, (5.3)
where T1,M is relaxation time of a hydrogen nucleus in the hydration shell around
the paramagnetic ion, M is the residence time of water molecules in the hydration sphere
that are close enough to the paramagnetic ion to be relaxed, and is the molar fraction of
water molecules in the paramagnetic ions’ hydration shells. The value of is proportional
to paramagnetic ion concentration in the fluid. Therefore, since the relaxation time T1,W is
an intrinsic property of pure water, there is a linear relationship between the overall
relaxation rate 1/T1,Fluid and paramagnetic ion concentrations and number of water
molecules in the hydration shell of a paramagnetic ion.
5.2.3 Relaxivity of Fe(III) adsorbed on solid surface
Given different paramagnetic surface sites, such as surface ions in a crystal lattice,
adsorbed paramagnetic ions, or paramagnetic crystal defects, the surface relaxation rate of
solid nanoparticles, 1/T1,S, contains contributions from paramagnetic relaxation, as well as
from non-magnetic relaxation due for example to homonuclear dipolar interactions
(Pfeifer, 1972). Paramagnetic relaxation is associated with various paramagnetic species
on the surface (Kleinberg et al., 1994) as shown in the middle terms of Equation (5.4),
where i is molar fraction of water molecules located in the inner coordination sphere of
the ith species of adsorbed paramagnetic ion, T1,N is relaxation time of water molecules not
1, 1, 1,
1 1
Fluid M M WT T T

81
interacting with paramagnetic sites, and N is the residence time of water molecules at the
solid surface. There is assumed to be a background of nonmagnetic relaxation on the solid
surface that causes the relaxation of protons not interacting with the paramagnetic sites. As
indicated in the right-hand side of Equation (5.4), surface relaxivity , the parameter
characterizing effectiveness of pore surface relaxation, links surface relaxation rate 1/T1,S
with surface area to volume of the pore (S/V)pore when all water molecules can be relaxed
with the solid surface during lifetime of decay.
. (5.4)
Adsorption of Fe(III) brings more paramagnetic sites to the solid surface, so
relaxivity increases with the fraction of surface occupied by magnetic sites ni, i is the
inherent relaxivity of different kind of magnetic site on solid surface (Bryar et al., 2000) as
shown in Equation (5.5):
. (5.5)
The molar fraction of water molecules coordinated with paramagnetic sites, i, is
related to the surface fraction ni, with the assumption that the maximum distance at which
a proton spin can be relaxed by a paramagnetic ion is the thickness of one monolayer of
water h:
. (5.6)
Combining Equations (5.4), (5.5) and (5.6) gives the surface relaxivity of the ith
paramagnetic species on the solid surface i:
. (5.7)
1
11,S 1, 1,
11
( )
n
ini i
i poreM M i N N
S
T T T V
1 1 1
(1 ) ( )n n n
i i i N N i i N
i i i
n n n
i i
pore
Sn h
V
1( )i
M M i
h
T

82
5.3 MATERIALS AND METHODS
We used zirconia nanoparticles dispersed in water (ZR-30AL) with 30 wt% of
colloidal zirconium oxide (ZrO2) stabilized with 0.9 wt% HNO3 from Nissan Chemical
America Corporation. The pH value was measured as 3.1. The original ZR-30AL was
diluted with DI water to 6 wt% of ZrO2 in dispersion with pH value of 3.13 for further
usage. The nanoparticles have no surface coating and had positive surface charge, with an
average zeta potential of +32.5 mV. Nanoparticle diameters were between 110 and 130 nm
measured by a Dynamic Light Scattering (DLS) ZetaSizer (Malvern Nano ZS).
We also used a 40 wt% dispersion of colloidal ZrO2 (ZR-40BL) from Nissan
Chemical America Corporation. These nanoparticles were dispersed in water and stabilized
with 1 wt% C4H12N.HO. The pH was 9.2. The original ZR-40BL dispersion was diluted
with DI water to reduce the weight concentration of zirconia nanoparticles to 6 wt%, and
pH was measured as 9.1. No surface coating attached on the nanoparticles, they had
negative surface charge with average zeta potential of -38.8 mV. Nanoparticle diameters
were between 70 and 90 nm.
Silica nanoparticle dispersion with poly(ethylene glycol) (PEG) coating was diluted
with DI water to obtain 4 wt% of silica nanoparticles and labeled as Si-4B. The pH value
was 8.8 for the diluted silica nanoparticle dispersion. Nanoparticle size was determined by
DLS Zeta Sizer as 30 nm, and the average zeta potentials of Si-4B was -28.1 mV.
Iron standard solution with Fe(III) concentration of 1000 mg/L in 2% HNO3 was
purchased from ACROS Organics. DI water was used to dilute the Fe standard solution to
different concentrations: 100mg/L, 50mg/L, 18mg/L, and 8mg/L. We used 2% HNO3 to
serially dilute the Fe standard solution to build a calibration curve for inductively coupled
plasma optical emission spectroscopy (ICP-OES) measurements. NMR measurements

83
were performed to obtain Fe3+ relaxation rates with Fe concentrations of 50mg/L, 25mg/L,
9mg/L, and 4mg/L.
15 ml of Fe(III) solutions with different concentrations: 100 mg/L, 50 mg/L, 18
mg/L, and 0 mg/L were mixed with 15 ml of different groups of nanoparticle dispersions:
ZR-6AL, ZR-6BL, Si-4B, and DI water separately. We also introduced a control group of
NaOH solution at pH 9 to isolate the effects of alkaline conditions. All mixtures were kept
for overnight at ambient conditions before further measurements were performed.
Measurements and treatments to different mixtures and solutions are listed in Table 5.1.
A Malvern Nano ZS was used to measure size distribution of nanoparticles mixed
with different concentrations of Fe(III) in ZR-AL and ZR-BL. Size calibrations were
performed with calibration standard dispersions before each measurement. 0.450 mL of
zirconia nanoparticle dispersion was placed in a disposable cell to measure size
distribution. The size distribution and average size value were recorded. Measurements of
each dispersion sample were performed three times and the mean value and standard
deviation were recorded.
We used Beckman Avanti J-E centrifuge and rotor JA-10 to remove nanoparticles.
Zirconia nanoparticles with size 80-110 nm were easily separated from supernatant after
30 minutes of centrifuging at 9,000 RPM. 14,000 RPM is required to remove the smaller
silica nanoparticles (30nm) by centrifugation. Since the maximum rotation speed of rotor
JA-10 is 10,000 RPM, we could not separate the silica nanoparticles with the centrifuge in
this study. After centrifuging Fe-zirconia nanoparticles mixtures and Fe-NaOH mixtures,
12 ml of the supernatants of the corresponding samples were collected for further NMR
and ICP-OES measurements as shown in Table 5.1.
NMR measurements were performed at room temperature (20°C) using a 2 MHz
GeoSpec2 benchtop NMR core analysis instrument from Oxford Instruments with an

84
operating frequency of 2.15 MHz The external magnetic field B0 was 0.05047 T. We used
an inversion recovery measurement to determine the distribution of longitudinal relaxation
times (T1). Samples for which we performed T1 measurements are displayed in Table 5.1.
A Varian Liberty Series II Axial ICP-OES was employed to measure dissolved iron
concentration in Fe-DI mixture and supernatants after centrifuging the Fe-nanoparticles
and Fe-NaOH mixtures. Wavelengths for Fe were picked as 234.350 nm, 238.204 nm, and
259.940 nm. Calibration was generated based on 1 mg/L, 2 mg/L, 5 mg/L, 8 mg/L, 10
mg/L, 20 mg/L, and 50 mg/L iron standard solutions. Concentrations of iron in samples
were measured and calculated employing standard calibration range from 0 mg/L to
50mg/L.
A Thermo Scientific Orion Versa Star pH benchtop meter was used to measure pH
values of different mixtures with various Fe concentrations. The meter was calibrated with
standard pH buffers at pH 4.01, 7.00 and 10.01. The pH probe was triple rinsed with DI
water before and after measurements of different samples.
Table 5.1 Treatment and measurement performed of different mixture groups.
Mixture
labels Contents
NMR
measurement Centrifuge
ICP, NMR and pH measurement
of pure fluid (supernatant) after
centrifuge
Fe-DI
solution
Fe(III) and DI
water
Y
N
Y, w/o centrifuge
Fe-NaOH
mixture
Fe(III) and
NaOH
solution
Y
Y
Y
Fe(III)-Si-
2B
mixture
Fe(III) and
Silica NPs
Y
N
N
Fe(III)-
ZR-3AL
mixture
Fe(III) and
Zirconia NPs
Y
Y
Y
Fe(III)-
ZR-3BL
mixture
Fe(III) and
Zirconia NPs
Y
Y
Y

85
Error bars for the longitudinal relaxation rate were computed from the standard
deviation of the longitudinal relaxation time obtained from the Matlab inversion. The signal
and noise were extracted from the raw NMR data in the time domain. Random noise with
the same properties (magnitude, mean value and standard deviation) of noise extracted
from raw NMR data was added to the time domain signal. With the added noise, there was
a slightly different magnetization buildup curve compared to the curve obtained directly
from the raw data. A linear inversion regression was then applied to the buildup curve with
added noise to compute the T1 value. After repeating this process 100 different times, 100
buildup curves were generated and used to calculate associated T1 values. Based on these
100 computed T1 values, the standard deviation of T1 was recorded and used to compute
the errors in longitudinal relaxation rate.
5.4 RESULTS AND DISCUSSIONS
5.4.1 Proton Relaxation by Fe(III) Ions in Solution
Longitudinal relaxation time of Fe(III) solutions with different Fe concentrations
was measured and computed. The pH value was recorded as 2.4 for each sample. In nitric
acid solution with Fe(III), the first hydration shell of Fe(III) contains 6 water molecules
(Magini and Caminiti, 1977), while the second hydration shell is formed by 12 water
molecules (Caminiti and Magini, 1979). Previous studies indicated that the relaxation rate
of water molecules outside the first hydration shell of paramagnetic ions is insignificant
compared to those in the first hydration shell (Koenig and Brown, 1987). At pH around
2.4, the overall relaxation rate of Fe(III) solution decreased from 18.508 s-1 with 50 mg/L
Fe(III) ions to 0.361 s-1 with zero iron in solution are shown in Figure 5.1. The error bars
of relaxation rate were obtained from the standard deviation of the longitudinal relaxation
times of nanoparticle dispersions by linear regression of the raw data in Matlab as described

86
in section 5.3. Based on the slope calculated from Figure 4.1 and Equation (4.5), along
with the calculated mole fraction of water in the Fe(III) hydration shell, which is 6 times
Fe(III) mole fraction, T1,M+ associated with dissolved magnetic Fe(III) is computed to
be 7.53 s. This value is in good agreement with previous work: Bryar et al. (2000) found
T1,M+ around 8 s for Fe(III) ions at pH around 2.5. Smaller values of T1,M+ may arise
from different pH values where lower pH value increases the number of exchangeable
water molecules in the hydration shell and thus increases the relaxation rate (Bertini et al.,
1993).
Figure 5.1 Dependence of overall relaxation rate on Fe(III) concentration in solutions.
y = 0.3577x + 0.3606R² = 0.9977
0
5
10
15
20
25
0 10 20 30 40 50 60
Overa
ll re
laxation r
ate
1/T
1(s
-1)
Fe concentration (mg/L)
Fe (III) relaxation rate in solution

87
5.4.2 Proton Relaxation in Fe- Nanoparticles mixture
As shown in Figure 5.2a), the relaxation rate of pure Fe-DI solution increased
proportionally with increasing Fe concentration. This indicates that the relaxation
contribution of Fe(III) ions dominates the overall relaxation rate, so hydrogen nuclei get
relaxed faster with higher Fe concentrations, as demonstrated in the previous section. Error
bars for the relaxation rate were obtained based on the standard deviation of the relaxation
times described in section 5.3. For the Fe-NaOH mixture, the relaxation rate remained
similar to that of the Fe-DI solution at the same Fe concentration. When nanoparticles were
present in the Fe-zirconia nanoparticle mixtures, at relatively high Fe concentrations such
as 50 mg/L and 25 mg/L, relaxation rate was lower than that of pure Fe solutions at same
concentrations even with additional surface relaxivity brought from nanoparticles. In
contrast, at low Fe concentration (9 mg/L), Fe-Zirconia nanoparticle mixtures showed
faster relaxation rate than those of pure Fe-DI solutions. The observed amount of change
in relaxation rate in this case cannot be simply explained by the additional contribution of
the nanoparticle surface relaxation rate. For example, with 9 mg/L of Fe in mixture, the
relaxation rate of Fe(III)-ZR-3AL was 3.631 s-1, while the relaxation rate of Fe(III) in
solution at 9 mg/L was 3.252 s-1. The increase from 3.252 s-1 to 3.782 s-1 (0.379 s-1) is
smaller than surface relaxation of pure zirconia nanoparticles in ZR-3AL, which is 0.419
s-1. This may indicate that Fe(III) and nanoparticles interact with each other and the overall
relaxation rate of Fe and nanoparticles is not simply the sum of the relaxation rate of
aqueous Fe(III) in solution and the pure zirconia nanoparticle surface relaxation rate as
indicated by lines in Figure 5.2b).
For Fe-Silica nanoparticle mixtures, the relaxation rate was much slower than that
of pure Fe-DI solution with the same Fe concentrations. This suggests that the addition of
silica nanoparticles causes the Fe(III) in the mixtures to relax proton spins less efficiently
88
so that the overall relaxation rate decreased in the Fe-nanoparticles mixture. From Equation
(5.4), this suggests that the value of decreased after adding silica nanoparticles. A
possible explanation for this is that Fe ions were removed from the aqueous phase and
adsorbed to the nanoparticle surfaces (Zhu et al., 2016), thus altering both the bulk fluid
and surface relaxations. In both types of nanoparticles (silica and zirconia, with and without
surface coating), the overall relaxation rate showed similar trend at high Fe concentration
(25 mg/L ~ 50 mg/L): with presence of nanoparticles, relaxation rate decreased.

89
Figure 5.2 Longitudinal relaxation rate of Fe-DI solution and Fe(III)-nanoparticles
mixtures with different Fe(III) concentrations. a) Grouping of relaxation
rates of different mixtures with same Fe concentration; b) Comparison of
measured mixture overall relaxation rate with values assuming no Fe(III)
adsorption onto nanoparticles.
0
2
4
6
8
10
12
14
16
18
20
50 mg/L Fe (III) 25 mg/L Fe (III) 9 mg/L Fe (III) 0 mg/L Fe (III)
Overall relaxation rate 1/T1 (s-1)
Fe (III)-DI solutionFe (III)-NaOH mixtureFe (III)-ZR-3AL mixtureFe (III)-ZR-3BL mixtureFe (III)-Si-2B mixture
0
2
4
6
8
10
12
14
16
18
20
0 10 20 30 40 50
Ove
rall
rela
xa
tio
n r
ate
(s
-1)
Fe concentration in mixture (mg/L)
ZR-3AL no attachment of Fe(III)
ZR-3BL no attachment of Fe(III)
Si-2B no attachment of Fe(III)
ZR-3AL experimental data
ZR-3BL experimental data
a)
b)

90
5.4.3 Fe(III) and pH in supernatants
To separate the relaxation contribution of nanoparticles in the mixture, we
centrifuged the Fe-Zirconia nanoparticles, collected the supernatant, measured the Fe
concentration with ICP-OES and recorded the NMR results of the supernatant. In the
meantime, Fe-NaOH mixture was used as a control group to isolate effects of pH on Fe
concentrations and relaxation rate in supernatants. However, due to the speed limit of
centrifuge rotor, silica nanoparticles with smaller size (21 nm ~ 35 nm) could not be
removed from the mixture, so we only further studied the Fe-Zirconia nanoparticles
mixture and supernatants in this work.
Table 5.2 ICP measured Fe concentration in supernatants of Fe-NaOH mixtures and Fe-
Zirconia nanoparticles after centrifuging.
Fe conc. in
mixture
(mg/L)
Fe conc. in
Fe-NaOH
supernatant (mg/L)
Fe conc. in
Fe(III) - ZR-3AL
supernatant (mg/L)
Fe conc. in
Fe(III) -ZR-3BL
supernatant (mg/L)
50 49.03 0.9603 0.9019
25 24.89 0.5179 0.5095
9 8.516 0.1043 0.09675
0 0.0366 0.02094 0.02630
We also centrifuged the group of Fe-NaOH mixture at 10,000 RPM for 30 minutes.
As shown in Table 5.2, the supernatant collected from Fe-NaOH mixture contained a
similar Fe concentration to the mixture before centrifuging and we determined that 98% of
the original Fe(III) remained in the supernatant after centrifuging. According to the ICP-
OES results for Fe concentration in Fe-Zirconia nanoparticle mixtures and supernatants
after centrifuging displayed in Table 5.2, there was much less iron remaining in the
supernatant, indicating that Fe(III) was retained on the zirconia nanoparticles’ solid
surface. Adsorption of Fe(III) onto nanoparticles may also explain the decrease in overall
relaxation rate observed with the addition of silica nanoparticles to Fe solutions.

91
Relaxation rates of supernatants from Fe-NaOH and Fe-Zirconia nanoparticle
mixtures are shown in Figure 5.3a). The relaxation rates of the supernatants after removal
of zirconia nanoparticles were smaller than 0.8 s-1, indicating that less Fe(III) was in the
supernatant. This suggests that most of the Fe(III) was attached to the zirconia
nanoparticles’ surface. Figure 5.3b) shows the bounds on overall relaxation rate assuming
no adsorption of Fe(III) (upper bound) and full adsorption of Fe(III) (lower bound). The
measured data for NaOH fall along the upper bound, indicating that all Fe(III) remained in
the supernatant as expected. The data for the two nanoparticle dispersions fall along the
lower bound, indicating that all of the Fe(III) was attached to the nanoparticles. Error bars
for the longitudinal relaxation rate were computed from the standard deviation of relaxation
times as described in section 5.3.
Table 5.3 pH of supernatant from Fe-Zirconia nanoparticles mixtures and Fe-NaOH
mixtures, and Fe-Silica nanoparticles mixtures.
Fe
conc.
in
mixture
(mg/L)
pH of
Fe-NaOH
supernatant
pH of
Fe(III)-
ZR-3AL
supernatant
pH of
Fe(III)-
ZR-3BL
supernatant
pH of Fe-
DI solutions
pH of
Fe(III)- Si-
2B mixtures
50 3.0 2.4 3.0 2.4 2.6
25 3.4 2.5 3.4 2.4 7.1
9 7.2 2.8 7.0 2.4 8.0
0 9.0 3.1 8.7 6.7 9.2
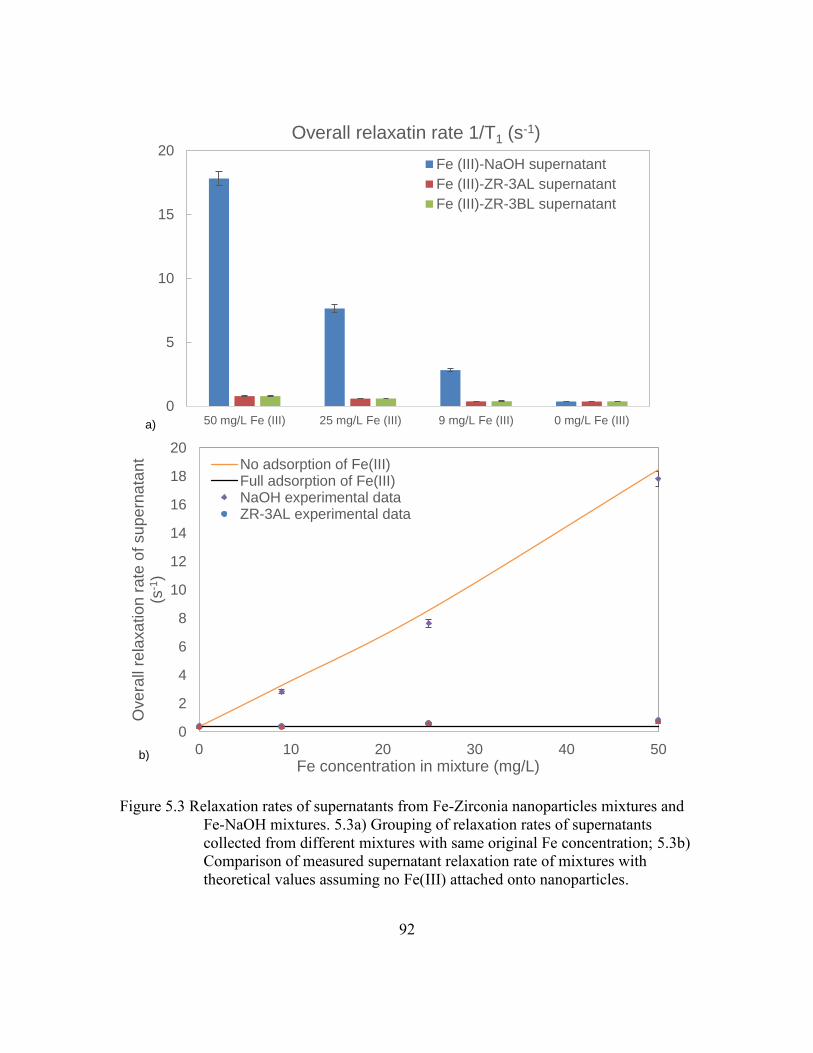
92
Figure 5.3 Relaxation rates of supernatants from Fe-Zirconia nanoparticles mixtures and
Fe-NaOH mixtures. 5.3a) Grouping of relaxation rates of supernatants
collected from different mixtures with same original Fe concentration; 5.3b)
Comparison of measured supernatant relaxation rate of mixtures with
theoretical values assuming no Fe(III) attached onto nanoparticles.
0
5
10
15
20
50 mg/L Fe (III) 25 mg/L Fe (III) 9 mg/L Fe (III) 0 mg/L Fe (III)
Overall relaxatin rate 1/T1 (s-1)
Fe (III)-NaOH supernatant
Fe (III)-ZR-3AL supernatant
Fe (III)-ZR-3BL supernatant
0
2
4
6
8
10
12
14
16
18
20
0 10 20 30 40 50
Ove
rall
rela
xa
tio
n r
ate
of su
pe
rna
tan
t (s
-1)
Fe concentration in mixture (mg/L)
No adsorption of Fe(III)Full adsorption of Fe(III)NaOH experimental dataZR-3AL experimental data
a)
b)

93
The pH values of the supernatants and Fe-DI solution are displayed in Table 5.3.
At low Fe concentration (9 mg/L) the pH value of each mixture group varies from 2.4 in
pure Fe(III) solution to 7.5 in the Fe-NaOH mixture because the Fe standard solution is
significantly diluted. To isolate the effect of pH on Fe(III) relaxivity, the Fe(III)-ZR-3BL
group was compared to the Fe-NaOH group for Fe concentrations ranging from 9 mg/L to
50 mg/L; the Fe(III)-ZR-3AL group was compared to the Fe-DI solution for Fe
concentrations at 25 mg/L and 50 mg/L.
5.4.4 Proton Relaxation by Zirconia Nanoparticles with adsorbed Fe(III)
Table 5.4 Surface relaxivity of zirconia nanoparticles with increased amount of adsorbed
Fe(III) under different iron concentrations.
Fe
conc. in
mixture
(mg/L)
ZR-
3AL
radius
in
mixture
(nm)
Surface
relaxivity
of
ZR-3AL
(m/s)
Adsorbed
Fe(III)
onto
ZR-3AL
(mg)
ZR-
3BL
radius
in
mixture
(nm)
Adsorbed
Fe(III)
onto
ZR-3BL
(mg)
Surface
relaxivity
of
ZR-3BL
(m/s)
Si-2B
radius
in
mixture
(nm)
50 58.2 50.17 1.345 42.9 1.342 35.13 10.35
25 59.7 27.17 0.5974 42.5 0.5976 17.77 17.45
9 57.8 12.27 0.2088 44.0 0.2078 8.430 13.95
0* 59.6 1.427 N.A. 43.3 N.A. 1.095 10.94
Based on Fe concentration measured by ICP-OES in the Fe-Zirconia nanoparticle
mixtures and corresponding supernatants, a mass balance calculation indicates that Fe(III)
adsorbed onto the zirconia nanoparticles (Table 5.4). Before adsorption of Fe, pure zirconia
nanoparticles in dispersion have surface relaxivities of 1.427 m/s for ZR-3AL and 1.095
m/s for ZR-3BL (Zhu, et al., 2015). Relaxation rates of zirconia nanoparticles in the
mixtures were computed using Equation (5.1) by subtracting the supernatant relaxation rate
from the overall relaxation rate of the Fe-Zirconia nanoparticle mixture. We assumed that
the supernatant represented the composition of the dispersing fluid in the presence of

94
nanoparticles. The nanoparticle surface relaxivity was then determined using Equation
(5.2) with nanoparticle sizes obtained from DLS measurements.
As shown in Table 5.4, relaxivity of zirconia nanoparticles increased with the
amount of adsorbed Fe(III). The relaxivity of positively-charged zirconia nanoparticles
increased about 40 fold after exposure to 50 mg/L Fe(III) at pH around 2.4; at pH around
3, the relaxivity of negatively-charged zirconia nanoparticles increased by a factor of 36.
The results indicate that with Fe(III) in solution, even at disparate pH values and
nanoparticle surface charges, adsorption of Fe ions onto nanoparticles increased
nanoparticles relaxivity.
When pH value was above 6, with no surface coating, zirconia nanoparticles in
dispersion were negatively charged (Tang et al., 2000), and the driving force for adsorption
of Fe(III) onto ZR-3BL was likely due to electrostatic attraction between negatively
charged nanoparticle and iron cations (Stuart et al., 1991). Under acidic conditions where
pH value was lower than 6, zirconia nanoparticles with positive surface charge also acted
as a Fe(III) sink, which suggests that electrostatic attraction was not the driving force of
adsorption in these cases. Hydrolysis of Fe3+ in solution builds Fe(OH)3 and polymers of
Fe(III) could have been precipitated at pH values ranging from 1.8 to 3.4 (Dousma and De
Bruyn, 1976). These polymers tend to precipitate on solid surfaces under acidic conditions
(Dai and Hu, 2014).
Although we were not able to perform any measurements on supernatants from the
silica nanoparticle solutions, the behavior observed with the negatively charged zirconia
nanoparticles can be used to inform some interpretations of our measurements. At pH from
5.5 to 9, the PEG coated silica nanoparticles were negatively charged. Therefore, the
increase in relaxation rate can probably be attributed to electrostatically-driven adsorption
of Fe ions onto the nanoparticles.

95
With the assumption that the values of surface relaxivities (i) for pure solid surface
and paramagnetic sites are constant, the surface relaxivity of adsorbed Fe(III) ions can be
computed according to Equations (5.4-5.7). Adsorbed Fe(III) relaxivity on zirconia
nanoparticles was computed as 68 m/s to 78 m/s when assuming there are 3 water
molecules remaining in a hemisphere around Fe(III) after their adsorption on the solid
surface. Similar values with 80 m/s to 120 m/s for surface relaxivity of adsorbed Fe(III)
ions on silica gel surface were obtain by previous studies (Bryar et al., 2000).
To compute the theoretical highest amount of Fe(III) that can be adsorbed onto
nanoparticles, we assume all the conditions such as temperature, viscosity, pressure, pH
value, zeta potential will favor each Fe(III) ions to attach onto nanoparticle surface. We
employ a geometric method where Fe(III) ions and their associated hydration shells are
assumed to be spheres. The attached Fe(III) spheres form a monolayer, and each Fe(III)
sphere makes a project area of ℼrFe(III)2 on the nanoparticle surface. The radius can be
computed from Fe3+’s ionic radius (0.66 Å), the Fe-O distance (2.00 Å) (Persson, 2010),
and the O-H distance in water molecules (0.942 Å) (Csaszar et al., 2005). This yields rFe(III)
of 0.3602 nm. Since zirconia nanoparticles are a very dilute matrix compared to rock, the
volume fraction of zirconia nanoparticles in dispersion is 0.557%. We compute the volume
of Fe(III)-ZR3AL mixture that contains only 1 zirconia nanoparticle with radius of 58.56
nm (mean value computed based on Table 5.4) as 0.151 m3. Given Fe(III) molecular
weight of 55.845 g/mol, theoretically up to 95,883 Fe(III) ions can attach onto the
nanoparticle surface to cover 90.69% of the surface. This would increase the nanoparticle
surface relaxivity to 68.15 m/s. With Fe(III) concentration of 50 mg/L, there are 81,426
Fe(III) atoms in this volume. As indicated in Figure 5.4, if all 81,426 Fe(III) atoms get
adsorbed onto the surface of spherical nanoparticles with radius of 58.56 nm, 3.14 × 10⁻⁶
mol/m2 Fe(III) would be attached on the nanoparticle. With the radius of Fe(III) being

96
0.3602 nm, the nanoparticle surface fraction occupied by Fe(III) is 0.77, according to
Equations (5.4 and 5.5), and the corresponding surface relaxivity is calculated as 58.1 m/s
based on experimental results assuming a linear relationship between nanoparticle
relaxivity and adsorbed Fe(III) amount. Similarly, the maximum number of Fe(III) ions
that can be adsorbed onto ZR-3BL is 52,011, which would cover 90.69% of the
nanoparticle surface and increase the relaxivity as 63.58 m/s. In this study, in the Fe(III)-
ZR3BL mixture with 50 mg/L initial Fe(III) concentration, there was 2.36 × 10⁻⁶ mol/m2
Fe(III) attached onto the nanoparticle. The surface fraction occupied by the Fe(III)
monolayer is 0.564, and the corresponding nanoparticle relaxivity is 40.1 m/s.
In Figure 5.4, assuming monolayer attachment as described in Equations (5.4-5.7),
the relaxivities of ZR-3AL and ZR-3BL should increase linearly with quantity of adsorbed
Fe(III). Experimental data with errors in nanoparticle relaxivity are displayed and
compared with the two theoretical bounds. Errors bars for nanoparticle relaxivity were
determined from the standard deviations of nanoparticle size and relaxation times of
mixture and effluents as described in section 5.3 and equations in Appendix A. The
deviation from linearity observed at lower adsorbed Fe(III) quantities could be caused by
variable relaxivity among different Fe(III) species. We did not consider Fe(III) adsorption
dynamics or mechanisms in the monolayer attachment, and it is possible and that at
different pH values, different Fe(III) species with various inherent relaxivities are
preferentially adsorbed on nanoparticles. The relaxivity of adsorbed Fe(III) used to
compute the theoretical nanoparticle relaxivity is the average value derived from
calculations based on 3 samples in each group with different pH values (pH values shown
in Table 5.3). Differences between this value and the specific values for different Fe(III)
complexes (Bertini et al.,1993; Bryar et al., 2000) may lead to deviation of the experimental
data from the predicted lines. Additionally, the radius of the zirconia nanoparticles used to

97
compute the theoretical lines is the averaged value obtained from 3 samples of each group
shown in Table 5.4. Differences between the measured radius in the experimental data and
the mean value used here also contributes to the deviation of the experimental data from
the trend. Note that the iron concentration in the supernatant of the Si-2B mixtures was not
determined due to the inability of those mixtures to be separated by centrifuge. For this
reason, the surface relaxivity as a function of iron concentration was not determined for
the silica nanoparticles.
Figure 5.4 Zirconia nanoparticles relaxivity increases with attached Fe(III). Blue and Red
lines display computed ZR-3AL and ZR-3BL relaxivity with attached
Fe(III), respectively; green dots exhibit the experimental results from this
work for ZR-3AL, purple triangles show experimental data for ZR-3BL.
0
10
20
30
40
50
60
70
0 0.2 0.4 0.6 0.8 1
Nanopa
rtic
le r
ela
xiv
ity (m
/s)
Attached Fe(III) onto zirconia nanoparticles / Theoretical adsorption capacity
ZR-3AL relaxivity increases with attached Fe(III)
ZR-3AL experimental data
ZR-3BL relaxivity increases with attached Fe(III)
ZR-3BL experiment data

98
According to Figure 5.4, assuming a constant nanoparticle radius of 10.35 nm and
a nanoparticle volume fraction of 0.76%, the maximum percentage of 50 mg/L Fe(III) in
the mixture that can attach onto silica nanoparticle surface is 100%. The attached 1.45 ×
10-6 mol/m2 Fe(III) covers 0.309 of silica nanoparticle surface, and the resulting relaxivity
increased from 0.0722 m/s to around 22 m/s ~ 23 m/s (giving the adsorbed Fe(III)
relaxivity of 68 m/s ~ 78 m/s from previous results).
We were not able to separate Si-2B nanoparticles from mixtures via centrifuge, and
thus were unable to obtain the necessary properties of the supernatant. The measured size
of the silica nanoparticles varies by more than 50% among tested mixtures, as indicated in
Table 5.2. This further complicates computation of silica nanoparticle surface relaxivity
with fractions of attached Fe(III), which requires a relatively constant and representative
value of nanoparticle radius. Hence, the theoretical relaxation rate with full adsorption of
Fe(III) onto the silica surface with different initial Fe(III) concentrations cannot be
determined. The relaxation rate of zirconia nanoparticle and Fe(III) mixture as a function
of Fe concentration are shown in Figure 5.5, along with upper and lower bounds
determined by assuming monolayer adsorption of Fe(III) in hexagonal packing. When
there is no adsorption of Fe(III) onto nanoparticles, the overall relaxation rate is simply the
sum of the nanoparticle surface relaxation rate and the relaxation rate of aqueous Fe(III)
solution. In zirconia nanoparticles and Fe(III) mixtures with different Fe(III) concentration,
when Fe(III) is fully adsorbed onto nanoparticles, the fraction of adsorption capacity can
be determined, and the corresponding value of nanoparticle relaxivity in Figure 5.4 were
used to compute the relaxation rate. As expected, the experimental data fall inside the
envelope between no adsorption and full adsorption of Fe(III). At higher Fe(III)
concentration, the experimental points for ZR-3AL and ZR-3BL are closer to the lower
bound, indicating significant, but not full, Fe(III) adsorption.

99
Figure 5.5 Comparison of theoretical relaxation rates with fully attached of Fe(III) and
none adsorbed Fe(III) from aqueous solution to nanoparticles. Experimental
data falls between the boundaries, indicating occurrence of adsorption but
not to full capacity.
5.5 CONCLUSIONS
This work has shown that paramagnetic ions such as Fe(III) can adsorb onto
nanoparticles regardless of surface coating and surface charge of nanoparticles. Our work
suggests that the silica nanoparticles with PEG surface coating can remove Fe(III) from
aqueous solution, since the relaxation rates of silica nanoparticles dispersed in Fe(III)
solutions is not a simple sum of the nanoparticle and iron solution relaxation rates. Zirconia
0
2
4
6
8
10
12
14
16
18
20
0 10 20 30 40 50
Ove
rall
rela
xa
tio
n r
ate
(s
-1)
Fe concentration in mixture (mg/L)
ZR-3AL no attachment of Fe(III)
ZR-3BL no attachment of Fe(III)
ZR-3AL experimental data
ZR-3BL experimental data
ZR-3AL full attachment of Fe(III)
ZR-3BL full attachment of Fe(III)

100
nanoparticles with positive and negative surface charge can remove more than 90% of
Fe(III) from solutions. Slightly alkaline conditions (pH between 7 and 8) do not play an
important role in precipitating Fe(III) ions. Adsorbed Fe(III) significantly increased the
zirconia nanoparticles’ surface relaxivity. Surface relaxivity of positively charged zirconia
nanoparticles increased from 1.427 m/s to 50.17 m/s with 2.80 × 10⁻⁶ mol/m2 adsorbed
Fe(III) at pH around 2.4. Zirconia nanoparticles with negative surface charge at pH around
3.0 had surface relaxivity increased from 1.095 m/s to 35.13 m/s when 2.07 × 10⁻⁶
mol/m2 Fe(III) was adsorbed. The results show that under various pH conditions ranging
from 2.4 to 7.5, adsorption of Fe(III) species onto nanoparticle surfaces occurred and
increased the relaxivity of the nanoparticles.
Our research indicates that, in natural porous media with pore fluid containing
paramagnetic ions, sorption of these ions to the surface of nanoparticles can significantly
alter the NMR relaxation behavior of the nanoparticles. The phenomenon affects
nanoparticles regardless of surface charge or whether the nanoparticles are coated with
polymers or not. Care must therefore be taken when using nanoparticles as NMR contrast
agents in rock samples both in the laboratory and the subsurface. With the assumption that
attached Fe(III) forms a monolayer packing, the nanoparticle surface has the geometrical
capacity to adsorb all the Fe(III) in the mixture. However, at laboratory conditions, we did
not observe full adsorption of Fe(III) in the tested Fe(III) concentrations. It is possible that
the mixture conditions are not optimized for adsorption of all Fe(III); for example, an
adsorbed Fe cation may prevent other Fe cations from settling next to it due to electrostatic
repulsion. We did not analyze how the hydration layer on nanoparticles affects the
adsorption of Fe(III), and it is possible that the existence of a hydration layer which has
higher density and viscosity than bulk water (Israelachvili and Wennerstrom, 1996) may
play a role in affecting adsorption of hydrated Fe(III). In addition, in the subsurface,

101
temperature, pressure, pH values are different from the conditions in our experiments,
which were performed at room temperature and pressure. The interactions between Fe(III)
and nanoparticles in this case may be different from what we observed in this study.

102
Chapter 6
NMR relaxation of surface-functionalized Fe3O4 nanoparticles
6.1 INTRODUCTION
As indicated in Chapter 5, adsorption of paramagnetic ions onto nanoparticles with
and without surface coating will increase the nanoparticles’ surface relaxivity. On the other
hand, presence of surface coating with low relaxivity may also affect relaxivities of
paramagnetic nanoparticles. With superior magnetic properties, nanoscale dimensions and
nontoxic characteristics, iron oxide nanoparticles are of high interest in nanoscience and
nanotechnology. As superparamagnetic nanoparticles (MNPs), Fe3O4 nanoparticles have
been widely applied in biomedical areas such as magnetic resonance imaging (MRI)
techniques (Babes et al., 1999), tissue repair (Jordan et al., 2001) and targeted drug delivery
(Chertok et al., 2008). In the petroleum industry, applications of Fe3O4 nanoparticles
include use as a nuclear magnetic resonance (NMR) contrast agent (Ogolo et al., 2012),
stabilization of magnetic Pickering emulsions (Zhou et al., 2011), remediation of oil spills
in oceans (Ko et al., 2014), flow assurance in subsea pipelines (Mehta et al., 2014), and
characterization of multiphase fluid dynamics in porous media (Prodanović et al., 2010).
To provide the desired chemical functionality while maintaining dispersion
stability in vivo or in the subsurface, different surface coatings are usually employed in
applications of iron oxide nanoparticles. In natural reservoirs, the environmental conditions
are complicated, and the chemical components are not as well controlled as in biomedical
research. Interactions between nanoparticles, pore fluid and rocks may take place, and
various surface coatings must be used. The properties of nanoparticle cores may be
influenced by the presence of these surface coatings (Lu et al., 2010; Issa et al., 2011).

103
In the subsurface, NMR logging is widely used to characterize properties of
reservoir rocks such as porosity, pore size, permeability, tortuosity, water saturation, and
wettability (Hinedi et al., 1997; Freedman et al., 2003; Wang et al., 2005; Daigle and
Johnson, 2016;). In studies on the use of iron oxide nanoparticles as a contrast agent,
investigation of how surface coatings of Fe3O4 nanoparticles affect NMR properties is
limited. Thus it is crucial to understand the way and to what extent surface coating affects
iron oxide nanoparticles and corresponding NMR signals.
6.1.1 Proton relaxation by dipole-dipole interactions
In NMR, the object of interest is typically a molecule, atom, nucleus, or subatomic
particle. The objects (such as protons, electrons, and NMR-active nuclei) can be thought
of as tiny magnets with north and south poles (dipoles) whose electromagnetic fields
interact through space. This interaction is called dipole-dipole interaction; it is the most
important single mechanism responsible for longitudinal (T1) and transverse (T2) relaxation
in our studies.
In 1H NMR as typically used in downhole applications, dipole-dipole interactions
may be either proton-proton (H-H) or electron-proton (e-H). These are referred to as
homonuclear and heteronuclear dipolar interactions, respectively. A dipolar interaction is
the interaction of the fields from two such spinning particles. If the spins reside on the same
molecule, it is called an intramolecular dipolar interaction; if on different molecules, an
intermolecular interaction (Diehl et al., 1969).
Proton-proton relaxation
In pure water, the principal relaxation mechanism of protons is proton-proton
relaxation. The strength of this homonuclear dipolar interaction is inversely proportional
to the sixth power of distance (1/r6). Hence, short-range intramolecular dipole-dipole

104
interactions are more powerful than long-range intermolecular ones. This generally means
that two ¹H nuclei must approach to within about 0.3 nm of each other for their spins to be
relaxed. In pure water, it is estimated that about 70% of the dipolar interactions are
intramolecular while 30% are intermolecular (Bloembergen, 1956).
Electron-proton relaxation
With the presence of paramagnetic materials, electron-proton relaxation may occur.
Due to its small size, an electron has a much larger gyromagnetic ratio (γ) than a proton,
so electron-proton dipolar interactions are much stronger than proton-proton interactions.
In natural porous media, electron-proton interactions are the dominant surface relaxation
mechanism (Kleinberg et al., 1994).
6.1.2 Relaxivity of nanoparticles in dispersions
We may treat nanoparticle dispersions as dilute porous media in which solid
nanoparticles are the matrix providing surface relaxation (Korb et al., 1997; McDonald et
al., 2005; Zhu et al., 2015), and the bulk fluid in which the nanoparticles are dispersed
provides the bulk fluid relaxation. In this study, we focus on longitudinal relaxation
because it is not affected by diffusion in internal magnetic field gradients generated by the
iron oxide nanoparticles (Anand and Hirasaki, 2008). The insights however are relevant
and transferable to transverse surface relaxation, however. The overall longitudinal
relaxation rate 1/T1 of a nanoparticle dispersion is the sum of the contributions from the
bulk relaxation rate 1/T1,Fluid and the nanoparticle surface relaxation rate 1/T1,NP (e.g., Carr
and Purcell, 1954), as displayed in Equation (6.1):
. (6.1) 1 1,Fluid 1,NP
1 1 1
T T T

105
1/T1,Fluid can be calculated from experiments by measuring the relaxation time of
the pure dispersing fluid. When diffusion of water molecules is fast enough to maintain
uniform magnetization in the pores during signal decay, 1/T1,NP is proportional to S/V, the
ratio of total nanoparticle surface area (S) to total fluid volume (V) in the dispersion
(Senturia and Robinson, 1970), with the constant of proportionality being the
nanoparticles’ surface relaxivity 1,NP. In Equation (6.2), Spore can be calculated from
nanoparticles’ volume VNP and radius rNP assuming that the nanoparticles are spherical.
Vpore is fluid volume, which equals total volume of suspension VTotal minus the
nanoparticles’ volume VNP. The parameter is the ratio of the nanoparticles’ volume to the
fluid volume in the dispersion (Zhu et al., 2015):
. (6.2)
With various types of paramagnetic sites (surface ions in crystals, paramagnetic
crystal defects, or adsorbed paramagnetic ions) on nanoparticle surfaces, the relaxation rate
of nanoparticles includes contributions from paramagnetic and non-paramagnetic parts
(Kleinberg et al., 1994) as shown in Equation (6.3):
. (6.3)
1, 1, 1,
1,
3
1 3NP
NPNP NP NP
poreNP Total NP NP
VrS
T V V V r
11,
11, 1 1
1
1 1 1
11
( )
1
( )
n
ini i
NP
iporeNP M M i N N
n
ini i
ipore M M i N N
ccS
T V T T
nnS
hV T T
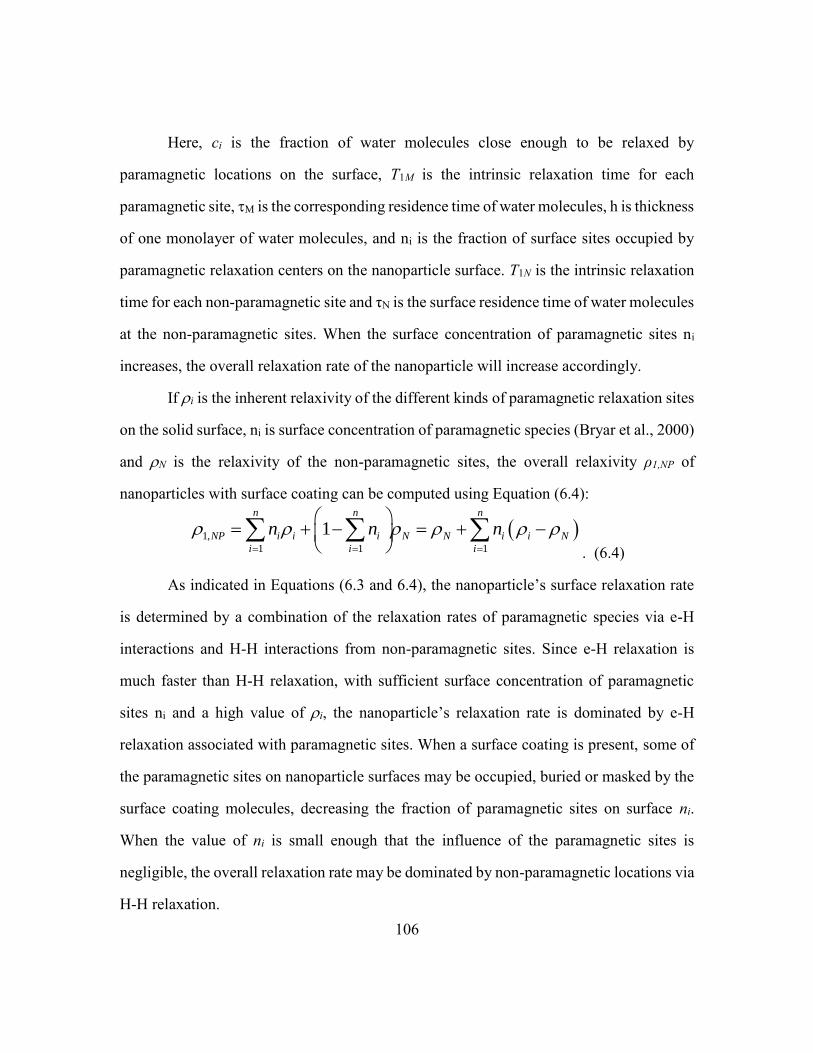
106
Here, ci is the fraction of water molecules close enough to be relaxed by
paramagnetic locations on the surface, T1M is the intrinsic relaxation time for each
paramagnetic site, M is the corresponding residence time of water molecules, h is thickness
of one monolayer of water molecules, and ni is the fraction of surface sites occupied by
paramagnetic relaxation centers on the nanoparticle surface. T1N is the intrinsic relaxation
time for each non-paramagnetic site and τN is the surface residence time of water molecules
at the non-paramagnetic sites. When the surface concentration of paramagnetic sites ni
increases, the overall relaxation rate of the nanoparticle will increase accordingly.
If i is the inherent relaxivity of the different kinds of paramagnetic relaxation sites
on the solid surface, ni is surface concentration of paramagnetic species (Bryar et al., 2000)
and N is the relaxivity of the non-paramagnetic sites, the overall relaxivity ρ1,NP of
nanoparticles with surface coating can be computed using Equation (6.4):
. (6.4)
As indicated in Equations (6.3 and 6.4), the nanoparticle’s surface relaxation rate
is determined by a combination of the relaxation rates of paramagnetic species via e-H
interactions and H-H interactions from non-paramagnetic sites. Since e-H relaxation is
much faster than H-H relaxation, with sufficient surface concentration of paramagnetic
sites ni and a high value of i, the nanoparticle’s relaxation rate is dominated by e-H
relaxation associated with paramagnetic sites. When a surface coating is present, some of
the paramagnetic sites on nanoparticle surfaces may be occupied, buried or masked by the
surface coating molecules, decreasing the fraction of paramagnetic sites on surface ni.
When the value of ni is small enough that the influence of the paramagnetic sites is
negligible, the overall relaxation rate may be dominated by non-paramagnetic locations via
H-H relaxation.
1,
1 1 1
1n n n
NP i i i N N i i N
i i i
n n n

107
6.1.3 Relaxation mechanism in A-MNPs
When D2O is present in the bulk fluid phase along with H2O, the presence of
deuterium changes the relaxation characteristics at the nanoparticle surfaces. The
replacement of covalently bonded hydrogen atoms with deuterium can generate partially
deuterated adsorbate molecules, which will tend to change the rate of 1H-1H dipolar
interactions but not electron-1H dipolar interactions. This phenomenon can be used to
distinguish the relative importance of the different relaxation mechanisms on the
nanoparticle surface. The comparison of relaxation rates as illustrated in Figure 6.1 helps
identify relaxation mechanisms involved in nanoparticle suspensions.
Figure 6.1 Relaxation analysis of NMR via comparing relaxation rates before and after
adding D2O. (Modified from Pfeifer, 1972).
6.2 MATERIALS AND METHODS
The method of Ko et al. (2016) was used to produce amine-functionalized Fe3O4
nanoparticles. A co-precipitation method was used to generate Fe3O4 nanoparticles (Bee et
al., 1995); the general steps are shown in Figure 6.2. In the presence of citric acid,
FeCl2●4H2O and FeCl3●6H2O at a molar ratio of 1:2 were mixed and heated to 90oC. With
vigorous stirring under a N2 atmosphere, ammonium hydroxide was added to induce
nucleation of Fe3O4 nanoparticles. After 2 hours of growth, the mixture was placed in an

108
ice bath to stop the growth of the particles. Deionized (DI) water was used to wash and
disperse the generated Fe3O4 nanoparticles (MNP) for further study and modification.
We used the 3-aminopropyltriethoxysilane (3-APTES) coating process (Bagaria et
al., 2013; Xue et al., 2014) to coat Fe3O4 nanoparticles with amine functional groups.
Hydrolysis of APTES at pH around 4 was performed for 1 hour, then pH was adjusted to
around 8. 20 mL of Fe3O4 nanoparticle dispersion with nanoparticle concentration around
42 g/L (equivalent to 30 g/L Fe) was added slowly to 180 mL of APTES solution. The
mixture was kept at 65oC for 24 hours, and then cooled to room temperature while stirring.
Magnets were used to separate and collect the APTES-coated nanoparticles (A-MNPs)
during the washing steps, and DI water was used to wash and re-suspend A-MNPs back to
20 mL volume (Wang et al., 2014). The process is illustrated in Figure 6.2.
Figure 6.2. Procedures of generating Fe3O4 nanoparticles with different APTES coating
5.6 g, 7.5 g, and 9.8 g of APTES were hydrolyzed in 180 mL solution. After reaction
with 20 mL of MNP dispersion, the corresponding A-MNPs were labeled as 5.6A-MNPs,
7.5A-MNPs and 9.8A-MNPs. The Fe concentration in the A-MNPs was around 30 g/L. DI
water was used to dilute different A-MNP suspensions to 1.0 g/L Fe concentration. Serial
dilution was performed to obtain different Fe concentrations: 0.07 g/L Fe, 0.05 g/L Fe,
0.025 g/L Fe, 0.01 g/L Fe, 0.007 g/L Fe, 0.005 g/L Fe, 0.0025 g/L Fe, and 0.001 g/L Fe.
The corresponding NMR and dynamic light scattering (DLS) size measurements were used

109
to compute the relaxivity of A-MNPs with different coating amounts following the
procedure of Zhu et al. (2015).
To study the possible effect that surface coating may have on the MNPs’ surface
relaxation rate, A-MNPs with the least and most surface coating were compared: 5.6A-
MNPs and 9.8A-MNPs. These two samples were diluted with H2O to obtain 0.1 g/L 0.02
g/L Fe concentration. Each 1 mL of 5.6A-MNPs dispersed in H2O with those two Fe
concentrations was diluted to a total of 10 mL to obtain 0.01 g/L Fe and 0.002 g/L Fe with
different D2O volume fractions of 0 vol%, 30 vol%, 50 vol%, and 70 vol%. The same
procedure was repeated for the 9.8A-MNPs group. We also used mixtures of H2O and D2O
with the same volume fractions as above to obtain the T1 of the bulk fluid in each
dispersion. NMR and DLS measurements were used to calculate normalized T1 values of
MNPs and to study how APTES coating reduces the surface relaxivities of MNPs.
A-MNPs samples were oven-dried at 80oC for 24 hours to obtain nanoparticle
powder. A Mettler Thermogravimetric Analyzer (model number TGA/DSC 1) was used to
measure and calculate the weight of attached APTES on the nanoparticles in each sample.
To prevent oxidation of Fe3O4, we used a N2 stream at 50 mL/min and heated the dried
nanoparticle samples from 30oC to 500oC with a temperature increase of 20oC per minute.
Before and after the TGA measurement, a Kratos X-ray Photoelectron Spectrometer (XPS)
experiment was performed to make sure that there were no amine groups remaining in the
burned samples. The mass percentage of APTES coated on each A-MNP sample was
calculated by the weight loss of each dried A-MNP sample after heating to 500oC under
N2 flow.
A Malvern Nano ZetaSizer was used to measure the size distribution of A-MNPs
with different surface coating amounts, Fe concentrations, and D2O volume fractions. Size
calibrations were performed with calibration standard dispersions before each

110
measurement. 0.45 mL of A-MNP dispersion was placed in a disposable cell to measure
size distribution. The size distribution and average size value were recorded. Measurements
of each sample were performed three times and the mean value and standard deviation were
recorded.
NMR measurements were performed at ambient temperature (20°C) using a 2 MHz
GeoSpec2 benchtop NMR core analysis instrument from Oxford Instruments with an
operating frequency of 2.15 MHz. The external magnetic field B0 was 0.05047 T. We used
an inversion recovery measurement to determine the distribution of longitudinal relaxation
times (T1).
Error bars for the longitudinal relaxation rate were computed from the standard
deviation of the longitudinal relaxation time obtained from the Matlab inversion. The signal
and noise were extracted from the raw NMR data in the time domain. Random noise with
the same properties (magnitude, mean value and standard deviation) of noise extracted
from raw NMR data was added to the time domain signal. With the added noise, there was
a slightly different magnetization buildup curve compared to the curve obtained directly
from the raw data. A linear inversion regression was then applied to the buildup curve with
added noise to compute the T1 value. After repeating this process 100 different times, 100
buildup curves were generated and used to calculate associated T1 values. Based on these
100 computed T1 values, the standard deviation of T1 was recorded and used to compute
the errors in longitudinal relaxation rate.

111
6.3 RESULTS
6.3.1 Relaxivities of A-MNPs with different APTES coating amount
According to the TGA results, after subtraction of the baseline, the weight
percentages of APTES coating for A-MNPs were 1.60 wt% for 5.6A-MNPs, 1.99 wt% for
7.5A-MNPs, and 2.80 wt% for 9.8A-MNPs. We expected to have more APTES coated on
nanoparticles with higher initial added amount of APTES in the MNP suspensions. T1
values of A-MNPs with Fe concentration ranging from 0.001 g/L to 0.07 g/L were
measured and recorded. The T1 of DI water was used to compute 1/T1,NP for each sample
of A-MNPs using Equation (6.1). According to Equation (6.2), with the calculated
nanoparticle relaxation rate 1/T1,NP and values of 3/rNP the relaxivities of A-MNPs can be
determined using the slope of a regression lines. As shown in Figure 6.3, error bars indicate
the errors in longitudinal relaxation rate 1/T1 when linear regression of raw data was
performed. Relaxivities of A-MNPs are 105,000 ± 2,110 m/s, 94,100 ± 1,660 m/s, and
78,300 ± 846 m/s for 5.6-A-MNPs, 7.8A-MNPs and 9.8 A-MNPs respectively. Raw
NMR data for A-MNPs dispersions are displayed in the Appendix B. Error bars associated
with each 1/T1,NP point were obtained based on the standard deviation of the relaxation
times T1 and T1,Fluid obtained after linear regression as described in section 6.2 and
Appendix A. Weighted least squares linear regression was used to compute the relaxivity
and standard deviation for each A-MNP group.

112
Figure 6.3 Computed 1/T1,NP of APTES-coated Fe3O4 nanoparticles from Equation (6.1)
with different nanoparticle fluid volume ratios and sizes rNP in 5.6A-
MNPs, 7.5A-MNPs, and 9.8A-MNPs dispersions fit using Equation (6.2).
Relaxivity (slope of linear regression using weighted least squares) of each
group decreases with more extent of APTES coating.
6.3.2 Variations in relaxation rate of A-MNPs with added D2O
We measured the T1 of bulk DI water mixed with different volumes of D2O. T1
increased from 2,590 ms to 5,340 ms when the percentage of D2O increased from 0 to 70%,
as displayed in Table 6.1.
y = 104702xR2 = 0.9976
y = 94099xR2 = 0.9985
y = 78330xR2 = 0.9993
0
20
40
60
80
100
120
140
0 0.0003 0.0006 0.0009 0.0012 0.0015
1/T
1,N
P(s
-1)
3x/rNP (m-1)
5.6A-MNPs
7.5A-MNPs
9.8A-MNPs

113
Table 6.1 T1 of water with different D2O volume fractions.
D2O volume fraction in water (vol%) T1(ms)
0 2,590
30 3,450
50 3,660
70 5,340
Table 6.2 DLS measured A-MNP radius with different D2O volume fractions.
Nanoparticles radius of A-MNPs 0 vol%
D2O
30 vol%
D2O
50 vol%
D2O
70 vol%
D2O
rNP of 5.6A-MNPs with 0.01 g/L Fe (nm) 54.5 58.0 62.0 64.0
rNP of 9.8A-MNPs with 0.01 g/L Fe (nm) 40.8 42.3 45.3 43.0
rNP of 5.6A-MNPs with 0.002 g/L Fe (nm) 49.6 51.0 52.0 54.5
rNP of 9.8A-MNPs with 0.002 g/L Fe (nm) 51.5 39.2 36.8 41.6
Normalized rNP of 5.6A-MNPs with 0.01 g/L
Fe (Dimensionless) 1 1.06 1.13 1.17
Normalized rNP of 9.8A-MNPs with 0.01 g/L
Fe (Dimensionless) 1 1.04 1.11 1.06
Normalized rNP of 5.6A-MNPs with 0.002
g/L Fe (Dimensionless) 1 1.03 1.04 1.10
Normalized rNP of 9.8A-MNPs with 0.002
g/L Fe (Dimensionless) 1 0.763 0.715 0.810
With the same volume percentage of D2O, the diluted 5.6A-MNPs and 9.8A-MNPs
with Fe concentrations of 0.01 g/L and 0.002 g/L were tested with NMR to obtain A-MNP
nanoparticle surface relaxation rates 1/T1,NP according to Equation (6.1). The DLS results
of A-MNP samples also indicated a slight size change of the same A-MNPs with the same
Fe concentration with different D2O volume fractions, as displayed in Table 6.2.
Nanoparticle size was normalized to the value obtained for the A-MNP dispersion in DI
water.
Based on Equation (6.2), with same nanoparticle concentration and constant
nanoparticle relaxivity, the nanoparticles’ surface relaxation rates are inversely
proportional their size. To isolate the change of surface relaxation rate only brought about
by the addition of D2O, we normalized A-MNP surface relaxation rate by dividing 1/T1,NP
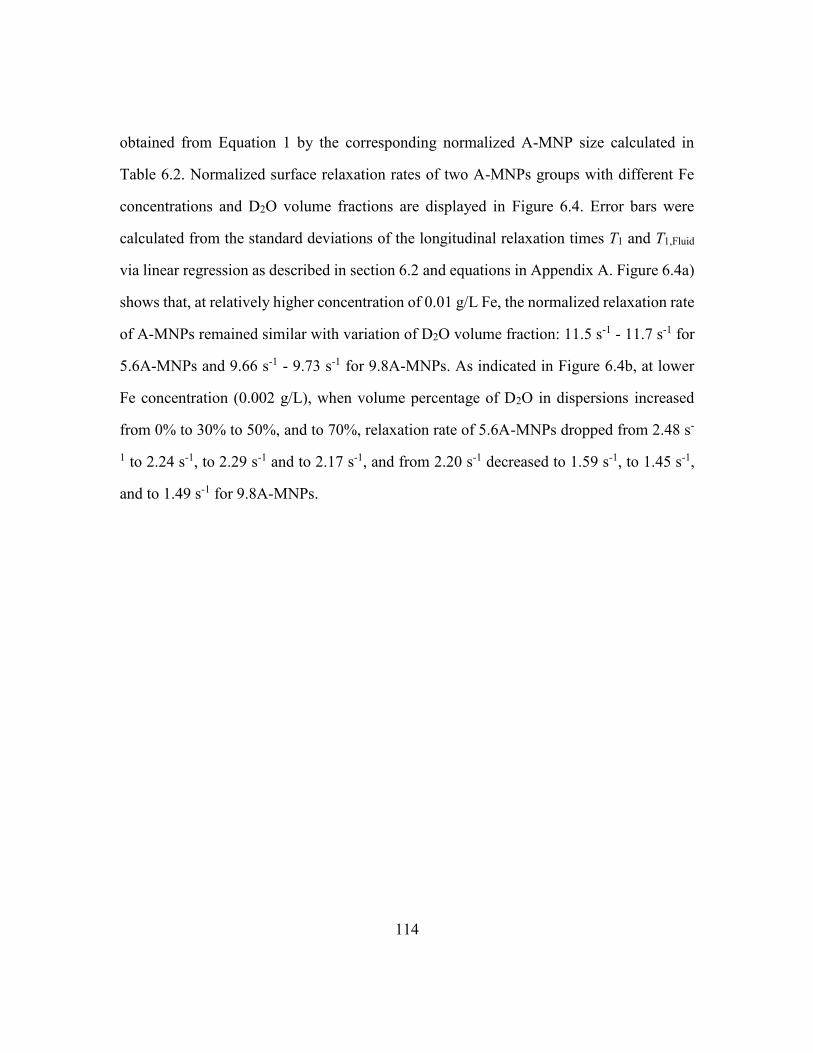
114
obtained from Equation 1 by the corresponding normalized A-MNP size calculated in
Table 6.2. Normalized surface relaxation rates of two A-MNPs groups with different Fe
concentrations and D2O volume fractions are displayed in Figure 6.4. Error bars were
calculated from the standard deviations of the longitudinal relaxation times T1 and T1,Fluid
via linear regression as described in section 6.2 and equations in Appendix A. Figure 6.4a)
shows that, at relatively higher concentration of 0.01 g/L Fe, the normalized relaxation rate
of A-MNPs remained similar with variation of D2O volume fraction: 11.5 s-1 - 11.7 s-1 for
5.6A-MNPs and 9.66 s-1 - 9.73 s-1 for 9.8A-MNPs. As indicated in Figure 6.4b, at lower
Fe concentration (0.002 g/L), when volume percentage of D2O in dispersions increased
from 0% to 30% to 50%, and to 70%, relaxation rate of 5.6A-MNPs dropped from 2.48 s-
1 to 2.24 s-1, to 2.29 s-1 and to 2.17 s-1, and from 2.20 s-1 decreased to 1.59 s-1, to 1.45 s-1,
and to 1.49 s-1 for 9.8A-MNPs.
115
Figure 6.4 Relaxation rate 1/T1 of 5.6A-MNPs and 9.8A-MNPs mixed with different
volume fractions of D2O with a) 0.01 g/L Fe and b) 0.002 g/L Fe.
8
8.5
9
9.5
10
10.5
11
11.5
12
12.5
13
0 vol% 30 vol% 50 vol% 70 vol%
A-MNPs longitudinal relaxation rate (s-1) with 0.01 g/L Fe dispersed with different D2O volume fractions
5.6A-MNPs 9.8A-MNPs
0
0.5
1
1.5
2
2.5
3
0 vol% 30 vol% 50 vol% 70 vol%
A-MNPs longitudinal relaxation rate (s-1) with 0.002 g/L Fe dispersed with different D2O volume fractions
5.6A-MNPs 9.8A-MNPs
a) D2O volume fraction
b) D2O volume fraction

116
6.4 DISCUSSIONS
6.4.1 Relaxivities of A-MNPs with different APTES coating amount
As shown in Figure 6.5, from left to right, we expect MNPs to pick up more APTES
when there is more APTES present in the mixture. More Fe on the surface of nanoparticles
will be occupied by APTES branches, and thus less surface area will remain accessible to
protons in water molecules. As indicated in Equation (6.3), with fewer available
paramagnetic sites on the surface, the relaxivity will decrease accordingly. Among the
three A-MNP samples, 5.6A-MNPs have the least APTES coating with 1.60 wt%, while
9.8A-MNPs have the most APTES with 2.80 wt%. With the additional 1.20 wt% of surface
coating on the 9.8A-MNPs, the surface relaxivity of the A-MNPs decreased by 25.4% from
105,000 m/s to 78,300 m/s. Even with the decreased relaxivity associated with more
coated APTES, the value of 78,300 m/s is significantly higher than other studied
nanoparticles such as ZrO2 nanoparticles, which had relaxivity of 1.10 m/s ~ 1.43 m/s
(Zhu et al., 2015). The relaxivity of other Fe(III) oxides such as Fe2TiO5 with size around
6881 nm was reported to be around 120 m/s (Bryar et al., 2000), which is almost 1000
times smaller than our computed relaxivity of A-MNPs with size around 100 nm. Since
Fe2TiO5 exhibits ferromagnetic-paramagnetic behavior (Enhessari et al., 2014), giving it
smaller magnetic susceptibility than ferromagnetic Fe3O4, at the same nanoparticle size,
concentration and temperature, we expect Fe3O4 to have higher relaxivity than Fe2TiO5. In
addition, as size increases from 100 nm for Fe3O4 to 6881 nm for Fe2TiO5, the specific
surface area decreases dramatically from 11.6 m2/g to 0.1 m2/g. Lower specific area may
result in fewer surface relaxation sites accessible to water molecules and smaller surface
relaxivity.

117
Figure 6.5 More APTES coated on MNPs with increased initial amount of 3-APTES in
the mixture (from left to right) during reactions with MNPs.
Previous studies indicated that Fe3O4 has an inverse spinel structure where Fe3O4
unit cells have a face-centered cubic pattern (Hill et al., 1979), and the lattice parameter
(unit cell edge length) is a=0.8396 nm, with each unit cell containing 8 Fe3O4 molecules
(Cornell and Schwertmann, 2003). With the DLS nanoparticle sizes, along with the
assumption that only Fe in the first layer of the Fe3O4 unit cell surface can be either
accessible to water molecules as relaxation sites or bonded with APTES, we calculated the
number of Fe atoms on the nanoparticle surface that can relax protons. According to Figure
6.2 and Figure 6.5, each APTES branch will covalently bond to 3 Fe atoms on the
nanoparticle’s surface. Given the TGA weight and the molecular weight of burned APTES,
with the nanoparticle’s size it is easy to obtain the number of APTES bonded to each
nanoparticle. Hence the number of Fe atoms masked by APTES can be obtained by
multiplying the number of APTES molecules on one nanoparticle by 3. We further
calculated the fraction of Fe located on the surface of nanoparticles that were occupied by
attached APTES in each A-MNPs group: 24% for 5.6A-MNPs, 30% for 7.5A-MNPs and
43% for 9.8A-MNPs. Since more than half of the surface Fe atoms remained unbonded,

118
surface relaxation may still be dominated by e-H relaxation: protons in the water molecules
are mainly relaxed by magnetic sites (Fe) on the nanoparticle’s surface.
If we assume that there is only one type of magnetic site on the MNPs, based on
Equation (6.4), a linear relationship between magnetic surface site fraction ni and the
overall relaxation rate of the nanoparticles can be obtained. As shown in Figure 6.6, with
more APTES on the nanoparticle surfaces, the magnetic sites fraction decreased, and the
overall relaxation rate of nanoparticles decreased. According to the errors (±1σ) in slope
and intercept, I computed the possible relaxivity range of A-MNPs with different fraction
of Fe attached with APTES, as indicated by red and blue lines. The relaxivity of bare
nanoparticles falls in the range between 121,000 m/s to 151,000 m/s. If all magnetic
sites are covered by APTES, the computed relaxivity of A-MNPs is 1,410 ± 4,670 m/s,
which is about 1.3% of the 5.6A-MNPs relaxivity (105,000 m/s). Note that in this study,
only 3 groups of A-MNPs were used to generate a linear relationship between relaxivity
and fraction of occupied Fe sites on the nanoparticle surface. As a result, there are relatively
large errors in the slope and intercept. More experiments with higher percentage of APTES
coating are needed to better constrain the relaxivity value of MNPs fully covered by
APTES.

119
Figure 6.6 Overall relaxivity of A-MNPs decreased with less Fe accessible to protons on
nanoparticle surfaces due to attached APTES coating. Red and blue lines
indicate the possible range of A-MNPs relaxivity with fraction of Fe
attached by APTES due to errors in slope and intercept (±1σ) obtained by
linear regression of measured 3 samples.
6.4.2 Change in relaxation rate of A-MNPs with D2O
The T1 of H2O-D2O mixtures increased with higher volume fraction of D2O. Since
the intermolecular H-H relaxation contributes 30% of the overall H-H relaxation in bulk
water, with more D2O, the intermolecular H-H relaxation is hindered by the presence of
D2O and decreases the overall relaxation rate, i.e., elongates the relaxation time.
During the process of obtaining normalized surface relaxivity of A-MNPs at the
same concentration with different D2O volume fractions, the relaxation brought by bulk
fluid was deducted and effects from nanoparticle size were filtered by dividing 1/T1,NP by
y = -135994x + 136507R² = 0.9878
-4.00E+04
-2.00E+04
0.00E+00
2.00E+04
4.00E+04
6.00E+04
8.00E+04
1.00E+05
1.20E+05
1.40E+05
1.60E+05
0 0.2 0.4 0.6 0.8 1
Ove
rall
rela
xiv
ity o
f A
-MN
Ps (
s-1
)
Fraction of Fe on nanoparticle surface occupied by APTES

120
the normalized nanoparticle size. At relatively higher Fe concentration (0.01 g/L),
normalized surface relaxation rates of 5.6A-MNPs and 9.8A-MNPs did not vary much with
the change of D2O volume fraction. This situation indicates that nanoparticle surface
relaxation was dominated by e-1H relaxation. With a sufficient amount of Fe3O4, which
relaxes protons by e-1H relaxation, the surface relaxation is not significantly affected by
the presence of D2O. At lower Fe concentration (0.002 g/L), when D2O concentration
increased generally from 0 vol% to 70 vol%, the surface relaxation rate of 5.6A-MNPs
decreased correspondingly from 2.48 s-1 to 2.17 s-1, which is a 12.5% drop; the 9.8A-
MNPs’ surface relaxation rate dropped from 2.20 s-1 to 1.44 s-1, a decrease of 34.5%. With
more APTES coating, the effect of D2O in reducing the surface relaxation rate became
more obvious. With the attachment of APTES, more magnetic sites of Fe are occupied by
APTES and not available to relax 1H from water molecules; in addition, the 1H in APTES
functional groups such as –NH2 may introduce proton-proton relaxation (Ganesan et al.,
1990) which also contributes to the overall surface relaxation of A-MNPs. With more
APTES on the Fe3O4 surface, there is less e-H relaxation on the nanoparticles’ surface;
with lower Fe concentration, e-H relaxation becomes less dominant, so the contribution of
H-H brought from APTES becomes more significant. With the large range of chemical
shift values of –NH2, –H in the amine group of APTES can be exchanged with –D in D2O.
Since D cannot be seen by 1H-NMR, with higher D2O volume fraction, more of the amine
groups in APTES contain deuterium, so the NMR signal and relaxation rate would be
reduced due to the interrupted H-H relaxation. A-MNPs with more APTES attached have
surface relaxation rates more sensitive to the presence and amount of D2O.

121
6.5 CONCLUSIONS
In this work, we computed and compared 3 groups of APTES-coated Fe3O4
nanoparticles (A-MNPs) with different surface coating amount: 1.60 wt% for 5.6A-MNPs,
1.99 wt% for 7.5A-MNPs, and 2.80 wt% for 9.8A-MNPs. The corresponding surface
relaxivities decreased from 105,000 m/s to 94,100 m/s to 78,300 m/s. Among the 3
groups of A-MNPs, only 24% - 43% of the surface magnetic sites were occupied by
APTES branches, leaving most of the surface Fe atoms accessible to water molecules and
providing e-H relaxation which will dominate the overall surface relaxation rate of the
nanoparticles. If all the magnetic sites on the nanoparticle surface are occupied by APTES,
the resulting relaxivity is much smaller (102 m/s). To accurately determine the correct
value of A-MNPs fully covered with APTES, more measurement of A-MNPs with higher
APTES coating amount are required.
The mechanisms by which surface coating reduces nanoparticles’ relaxivity was
studied by diluting A-MNPs with the least and most surface coating using different volume
fractions of D2O. When D2O volume fraction increased from 0 vol% to 70 vol%, with Fe
concentration of 0.002 g/L, 9.8A-MNPs with 2.80 wt% surface coating showed more
reduction in surface relaxation rate (dropped by 34.5%) compared to 5.6A-MNPs with 1.60
wt% surface coating (dropped by 12.5%). This suggests that at very low nanoparticle
concentration, e-H relaxation is less dominant due to the limited amount of Fe3O4;
intermolecular H-H relaxation between 1H in APTES braches and 1H in water molecules
contributed more to nanoparticle surface relaxation. Our results indicate that A-MNPs with
various coating amounts relax protons at nanoparticle surfaces mainly by e-H relaxation
and controls the overall relaxation of suspensions at higher Fe3O4 nanoparticles
concentration. In this study, the maximum amount of APTES attached to nanoparticles was
2.80 wt%, covering only 43% of the Fe3O4 nanoparticle surface. In this case the effect of

122
APTES in reducing relaxivities of the nanoparticle was limited. However, when APTES
coating amount is increased, we would expect more nanoparticle surface occupied by
APTES, leaving less Fe3O4 exposed to water molecules. Therefore, when organic surface
coating is used to add target functional groups onto nanoparticles in oilfield, the presence
of surface coating may affect the NMR signal of porous media, and care should be taken
when using nanoparticles with extensive surface coating. We caution that this experiment
was performed at room temperature and pressure, and the relaxivity of these same A-
MNPS may change when applied in field conditions.

123
Chapter 7
Synthesis, Conclusions, and Future Work
7.1 SYNTHESIS
Recent work focused on NMR measurements of porous media saturated with
nanofluids (e.g., Anand and Hirasaki, 2008; Yu, 2012; Cheng et al., 2014a,b) did not study
how and to what extent the pore surface relaxivity will be altered by adsorbed paramagnetic
nanoparticles. In the meantime, when applying nanoparticles in the oilfield where natural
porous media have more complicated fluid and surface chemistry, there are several factors
such as interactions between natural rock surfaces, pore fluid and nanofluids, attachment
of paramagnetic species, and coating of surface polymers that may affect nanoparticles’
relaxivity (Keating and Knight, 2008; Issa et al., 2011). How the attachment of
paramagnetic species and surface coatings onto nanoparticles change nanoparticles’
surface relaxivity and the NMR signal of nanofluids in porous media remains to be studied.
7.1.1 Attachment of nanoparticles onto pore surface and modified pore surface
relaxivity
In this work, I chose zirconia (ZrO2) nanoparticles without surface coating. There
were two dispersions of zirconia nanoparticles with similar size but different surface
charge: ZR-AL, with positively charged nanoparticles, and ZR-BL, with negatively
charged nanoparticles. I used ZR-6AL and ZR-6BL nanofluids, with 6 wt% nanoparticles,
and ZR-7.5AL and ZR-7.5BL, with 7.5 wt% nanoparticles.
Nanoparticle retention limit in porous media
With the assumption that nanoparticles are spheres, attached nanoparticles will
form a densely packed monolayer, and each adsorbed nanoparticle occupying its projected
area (ℼrNP2) on pore walls. The highest surface fraction that can be occupied by a monolayer
124
of equal spheres is 0.9069. In the 2 mm glass bead pack with pore radius as 613 m, the
maximum possible adsorption fraction of ZR-6AL is about 30%. In Boise sandstone cores,
with much smaller pore radius of 10.6 m, there is much more pore surface provided for
adsorption of nanoparticles. In ZR-6AL saturated Boise sandstone cores, up to 65.8% of
nanoparticles can be adsorbed to the pore walls; for ZR-7.5AL, up to 54.2% of the
nanoparticles can attach to the pore surfaces. Similarly, up to 48.9% of negatively charged
zirconia nanoparticles in the ZR-6BL dispersion can attach onto the pore surface; and
38.0% of nanoparticles in ZR-7.5BL can attach onto the pore surface. With these maximum
extents of attached nanoparticles, the computed surface relaxivities are close to the surface
relaxivity values of the nanoparticles themselves.
Retained nanoparticles and the modified pore surface relaxivity
Density measurement of effluents from Boise sandstone cores indicated that
negatively charged zirconia nanoparticles were trapped in Boise sandstone cores but not in
the glass bead packs. Such different results may due to differences in surface charge and
other properties between the glass bead surface and Boise sandstone surface. In addition,
smaller pores in Boise sandstone can play a role in retaining nanoparticles mechanically
via narrow pore throats (Arawole, 2015). To maintain significant negative surface charge,
a strong alkaline was used to pretreat Boise sandstone cores, and the NMR results indicated
that such treatment increased Boise sandstone surface relaxivity from 5.05 m/s to more
than 6 m/s. In Boise sandstone cores saturated with ZR-6BL and ZR-7.5BL, after flushing
2 pore volumes with DI water, 3.4% and 3.0% of nanoparticles were retained in the cores,
only around 3% of pore surface is occupied by attached nanoparticles assuming monolayer
packing, the resulting pore surface relaxivities were 6.4 m/s and 6.6 m/s. After flushing
2 pore volumes of TMAH at the same pH value as ZR-6BL and ZR-7.5BL, there were

125
2.8% and 2.3% of negatively charged nanoparticles left in the cores, covering about 2% of
pore surface, the corresponding surface relaxivity was about 6.6 m/s and 6.7 m/s. The
results indicated that in this study Boise sandstone pore surface relaxivity alteration was
mainly due to strong alkali condition: with pH higher than 10, dissolution of silica surface
(Revil et al., 1999a, b) may expose buried paramagnetic species and speed up the
relaxation. Since both the nanoparticles and pore surface were negatively charged,
electrical repulsion may prevent the attachment of nanoparticles onto the silica surface,
resulting in very little percentage (around 2% ~ 3%) of negatively charged nanoparticles
being retained in the sandstone. The small retention value is in good agreement with
previous work in which less than 10% of 20 nm silica nanoparticles were retained in Boise
sandstone (Caldelas, 2010). These values do not approach the maximum adsorption limits
calculated above (48.9% for ZR-6BL and 38.0% for ZR-7.5BL). Such retention may due
to van del Waals attractions and mechanical straining.
As indicated in my experiment results, 11.6% of positively charged zirconia
nanoparticles in ZR-6AL were retained in the 2 mm glass bead pack with pore radius as
613 m. The bead surface relaxivity was correspondingly altered from 10.42 m/s to 7.27
m/s. With a calculated maximum fraction of attached nanoparticles of 30%, the resulting
glass bead surface relaxivity would be 2.265 m/s. In contrast, in Boise sandstone, the
smaller pore size (10.6 μm) provided more surface area for attached nanoparticles. I
observed that 40% of ZR-6AL and 37% of ZR-7.5AL were left in Boise sandstone cores
after flushing with 2 pore volumes of DI water, pore surface covered by attached
nanoparticles assuming monolayer packing are 23.38% and 26.42%, respectively. If
homogeneous adsorption is assumed, the changed pore surface relaxivities are computed
to be 5.8 m/s and 5.9 m/s respectively. When flushing with 2 pore volumes of HNO3
under same pH value of nanofluids, there were 35% of ZR-6AL and 31% of ZR-7.5AL

126
trapped in Boise sandstone cores, occupying 20.45% and 21.99% of pore surface. The
altered pore surface relaxivities were 6.4 m/s and 6.5 m/s. The adsorption may be the
result of a force balance between electrostatic attraction and van del Waals attraction. I did
not find the evidence that nanoparticles attached onto pore surface to the full coverage
capacity, so it is possible that my experimental conditions such as zeta potential difference
between surface of nanoparticles and pore walls, electrostatic repulsion between each
nanoparticle, pH values, viscosity, temperature cannot drive the full 100% (for ZR-6AL)
or 100% (for ZR-7.5AL) of nanoparticles’ attachment. The results suggested that there is
a way to control pore surface relaxivity by adsorbed paramagnetic nanoparticles, and serve
as the foundation to generate a model to link relaxation time distribution and pore size by
altered pore surface relaxivity.
My work helps to understand the behavior of nanoparticles in porous media through
NMR measurements and will be used in future studies on the pore-scale characteristics in
rocks. This research part will help advance nanoparticle-based analyses of fluid-solid or
fluid-fluid interfaces through adsorption of nanoparticles. Applications of this work
include imaging oil-water contacts, and determining interfacial surface areas for many
petrophysical and reservoir engineering needs.
7.1.2 Attachment of iron species onto nanoparticle surface
Another interesting finding in the Boise sandstone cores experiments is that the
relaxivity of effluents increased after contact with Boise sandstone cores, and nanofluid
effluents showed a higher increase relative to pure fluid effluents. I measured the iron
concentrations in the original fluids and effluents, and showed that the increased iron
concentration in effluents helps to explain speeded up relaxation (Revil et al., 1999a,b) in
the pure fluid effluents. In the case of nanofluids, the comparison of iron concentration in

127
supernatants of original nanofluids and effluents indicated that the gain in iron
concentration was not enough to support the observed increase in relaxation rate of the
nanofluid effluents. I determined the nanoparticle relaxivity in each effluent: positively
charged nanoparticles increased relaxivity from 1.43 m/s to 4 m/s ~ 10 m/s; negatively
charged nanoparticle relaxivity increased from 1.10 m/s to 12 m/s ~ 19 m/s. I proposed
that paramagnetic species from Boise sandstone cores (Pettijohn, 1963) might also attach
to nanoparticles and increase nanoparticle relaxivity, which also contributed to speeding
up the overall relaxation in effluents.
To testify the hypothesis that iron can attach onto nanoparticles and increase surface
relaxivity. I further conducted the experiments by mixing Fe(III) solution with same
volume of ZR-6AL and ZR-6BL nanofluids. To see if surface coating can help shield
nanoparticles from attachment of iron species, I employed polyethylene glycol (PEG)-
coated silica nanofluids labeled as Si-4B with 4 wt% of silica nanoparticles to mix with
Fe(III) solutions, too. The experiments showed that at as high as 50 mg/L Fe(III) in the
mixture, more than 90% of iron in the aqueous solution can be picked up by nanoparticles
regardless of surface charge sign and the presence of surface coating. Relaxivities of
positively charge nanoparticles increased from 1.43 m/s to 50.17 m/s after 2.80 × 10⁻⁶
mol/m2 attached Fe(III), and negatively charged nanoparticles with original relaxivity of
1.10 m/s showed a modified relaxivity of 35.13m/s after adsorption of 2.07 × 10⁻⁶
mol/m2 Fe(III). A previous study (Bryar et al, 2000) found that after equilibrating with 5
mg/L Fe, silica gel showed an increased relaxivity from 0.0012 m/s to 0.020 m/s with 1
× 10-9 mol/m2 Fe adsorbed. Such attachment of Fe in their results is much more efficient
than our findings for Fe(III) attached onto zirconia nanoparticles. It may be explained by
the difference between types of nanoparticle surface that results in different rotational
correlation times.

128
With the assumption of dense monolayer packing of attached Fe(III) onto
nanoparticles surface, up to 3.14 × 10⁻⁶ mol/m2 Fe(III) can be attached onto ZR-3AL, 2.36
× 10-6 mol/m2 Fe(III) adsorbed on to ZR-3BL, and 1.45 × 10⁻⁶ mol/m2 Fe(III) onto Si-2B
nanoparticles. In this experiment, the attachment of Fe(III) did not reach the calculated
limit which would be 100% of Fe(III), so it is possible that the pH value, viscosity,
temperature, electrostatic repulsion between each cations and other properties were not
able to support 100% adsorption.
The results provided a hint of the possible interactions between nanoparticles and
paramagnetic species in natural porous media: attachment of nanoparticles may affect pore
surface relaxivity, and adsorption of paramagnetic materials onto nanoparticles will
dramatically increase nanoparticle relaxivity and further affect NMR signal of nanofluids
saturated porous media. Attached iron species can speed up nanoparticles’ relaxivity to
about 36 ~ 40 fold, such increase is comparable with previous reported study which
claimed increased by 6 to 50 fold with attached paramagnetic materials (Kenyon and
Kolleeny, 1995). When using nanoparticles as NMR contrast agents, the sorption of
paramagnetic species should be considered before interpretation of NMR results.
7.1.3 Attachment of organic surface coatings on nanoparticles
Given the results that adsorption of paramagnetic materials causes the relaxivity of
nanoparticles with initially low relaxivity to increase dramatically, another question arises:
since adsorbed iron species onto nanoparticles significantly increased the relaxivity of
nanoparticles in porous media, what will happen if organic surface coating with low
relaxivity is attached to iron oxide nanoparticles with initially high relaxivity? To what
extent will the surface coating modify the iron oxide nanoparticle relaxivity?

129
To answer the above questions, I studied three groups of 3-aminopropyl
triethoxysilane (APTES) coated Fe3O4 nanoparticles (A-MNPs) with different surface
coating amounts: 5.6A-MNPs, 7.5A-MNPs and 9.8A-MNPs. Fe sites that relax protons via
electron-proton relaxation can be occupied by APTES branches and cannot relax protons
any more. The results showed that nanoparticle relaxivity decreased from 105,000 m/s
for 5.6A-AMNPs to 94,100 m/s for 7.5A-MNPs to 78,300 m/s for 9.8A-MNPs with as
surface coating amount increased. Previous work has reported decreased relaxivity with
increased PEG surface coating on Mn0.5Zn0.5Gd0.02Fe1.98O4 nanoparticles (Issa et al., 2011).
The fraction of Fe sites taken by APTES are 24%, 30%, and 43% respectively for 5.6A-
MNPs, 7.5A-MNPs and 9.8A-MNPs. With the assumption that nanoparticle surface
relaxivity has a linear relationship with the fraction of available Fe sites accessible to water
molecules, we computed that with no APTES coating, the nanoparticles have surface
relaxivity of 136,656 m/s; with 100% of APTES coating, the resulting relaxivity is 101
m/s. These determined values with 0% and 100% surface coating may be differ from the
true values due to large uncertainties caused by the use of only 3 groups of A-MNPs.
Studies of more groups of A-MNPs with higher surface coating are required to obtain more
accurate estimation of relaxivity for bare and fully covered nanoparticles.
To identify the relaxation mechanisms of A-MNPs, I used D2O in the mixture. The
presence of D will change the fraction of H and hence the proton-proton relaxation brought
by APTES, while electron-proton relaxation will not be affected. The results showed that,
with relatively high nanoparticle concentration (0.01 g/L Fe), 5.6A-MNPs and 9.8A-MNPs
relax protons mainly by electron-proton relaxation, since the presence of D2O and change
in D2O volume fraction did not vary relaxation rate of nanoparticles. In contrast, at
relatively low nanoparticle concentration (0.002 g/L Fe), 5.6A-MNPs and 9.8A-MNPs
exhibited lowered relaxation rates with increased D2O volume fraction. With the higher

130
surface coating in 9.8A-MNPs, the decrease was more significant, indicating that at low
nanoparticle concentration, nanoparticles relax protons also via proton-proton relaxation.
Hence, the presence of APTES coating decreased iron oxide nanoparticle relaxivity by
occupying Fe relaxation sites, but due to the small surface coverage fraction of APTES,
Fe3O4 can still relax protons mostly via electron-proton relaxation. Only in very dilute A-
MNPs will proton-proton relaxation brought from APTES also play a role in relaxing
protons.
In sum, my project studied the possible interactions between nanoparticles and
pores in porous media saturated with nanofluids (as shown in Figure 7.1): adsorption of
nanoparticles onto the pore surface will modify the pore surface relaxivity, while
attachment of paramagnetic species and organic surface coating may affect the relaxivity
of nanoparticles. Pore fluid chemistry is therefore necessary to characterize in any
application of nanoparticles as NMR contrast agents in rocks.
In the course of my experiments, I did not observe full adsorption of nanoparticles
on pore surfaces, of iron on nanoparticle surfaces, or of organic surface coating on
nanoparticle surfaces. Therefore, all the observed behavior lies between two endmembers.
It is possible that in my project, the fluid properties, local surface chemistry, and laboratory
conditions are not sufficient to support full attachment of adsorbates onto surfaces. Given
the variation in behavior between the fully adsorbed and completely desorbed conditions I
computed, constraining and controlling the degree of adsorption of any material described
in this dissertation is essential for any subsurface application of nanoparticles as NMR
contrast agents.

131
Figure 7.1 Different adsorption mechanisms affecting NMR response of nanoparticles in
porous media. Top: idealized depiction of nanoparticles adsorbed on grain
surfaces. Middle: in reality, some nanoparticles remain in dispersion while
others are adsorbed. Paramagnetic species on the pore surface additional
provide some surface relaxation. Bottom: in even more detail, paramagnetic
species present in the pore fluid and/or desorbed from the grain surface due
to the nanoparticle dispersion chemistry can attach to nanoparticles, further
complicating the NMR response.

132
7.2 CONCLUSIONS
To understand the effect of nanoparticles on pore surface relaxivity, I performed
experiments by adding different paramagnetic nanoparticles in pore fluid, and made three
measurements: i) a nanoparticle-free fluid measurement (DI water) to get the pore wall
effect; ii) the fluid-saturated measurement under conditions for which the change in
aqueous concentration is the dominant effect (this demonstrates surface adsorption
occurred); iii) displacing the nanoparticle dispersion with DI water and isolating the effect
of the controlled relaxivity of the pore walls.
The bulk relaxation rate of the nanoparticle dispersions is proportional to
nanoparticle-pure fluid volume ratio, and inversely proportional to nanoparticle size. In
nanofluid-saturated porous media (glass bead packs, outcrop sandstone), electrostatic
attraction between grain surfaces and nanoparticles was the main driving force for
adsorption of nanoparticles onto grain surfaces. The two types of zirconia nanoparticles
used in this study differed only in their zeta potential (one being positive, the other
negative), and only the positively charge particles adsorbed appreciably onto the negatively
charged silica surfaces of the porous medium. Porous media surface relaxivities were
altered only by the presence of adsorbed paramagnetic nanoparticles. When 1.114 vol. %
positively charged zirconia nanoparticles dispersion was used to saturate a glass bead pack,
11.6% of the nanoparticles were adsorbed to the bead surfaces and modified the glass bead
surface relaxivity from 10.42 m/s to 7.27 m/s. DI water flushing was able to wash out
14% of adsorbed nanoparticles from siliceous surface, change of surface relaxivity due to
core flushing was 15.4%. In contrast, negatively charged zirconia nanoparticles did not
alter the relaxivity of the beads.
Zirconia nanoparticle dispersions in Boise sandstone cores altered sandstone
surface relaxivity, in a complicated way depending on nanoparticles’ surface charge and

133
pH condition of the dispersions. During contact with 6 wt% and 7.5 wt% positively charged
zirconia nanoparticles at pH 3.1, Boise sandstone surface relaxivity changed from 5.05
m/s to 5.8 m/s ~ 6.5 m/s due to 31% ~ 40% adsorbed nanoparticles onto pore surface.
In Boise sandstone pores with pore walls pretreated with TMAH at pH 13.4, sandstone
surface relaxivity increased to 6.3 m/s due to strong alkaline condition. With 2.3% ~ 3.4%
retained negatively charged nanoparticles, the sandstone surface relaxivity remained higher
than 6 m/s.
Experimental results indicated that pH of nanoparticle dispersions played a role in
interactions with Boise sandstone surface. Acid could increase Boise sandstone surface
relaxivity by reacting with impurities such as Fe2O3 and FeO on mineral surface (Pettijohn,
1963). HNO3 at pH 3.1 increased Boise sandstone surface relaxivity from 5.05 m/s to 5.7
m/s. Alkali can alter Boise sandstone surface relaxivity by mineral surface dissolution
and exposure of paramagnetic impurities to pore fluid. Such alteration can remain for long
period as long as pore fluid condition remains alkaline. TMAH at pH 13.4 increased Boise
sandstone surface relaxivity to 6.3 m/s.
After contact with Boise sandstone, zirconia nanoparticles with positive and
negative surface charges both showed increased relaxivity. Positively charged
nanoparticles relaxivity increased from 1.43 m/s to 4 m/s ~ 9 m/s. Nanoparticles with
negative surface charge displayed increased relaxivity from 1.10 m/s to 12 m/s ~ 19
m/s after contact with TMAH treated Boise sandstone. Such increase in relaxivity were
possibly due to less stabilizer in dispersions after interactions with sandstone surface. Less
stabilizer was ionically bonded with the nanoparticles, leaving more surface area of the
nanoparticles exposed to bulk fluid and increased the chances for protons to get close to
paramagnetic sites and be relaxed faster. Hence, the effective relaxivity of nanoparticles

134
increased. Attachment of iron ions on negatively charged nanoparticles further enhanced
nanoparticle relaxivity.
After contact with Boise sandstone, the relaxivities of negatively charged zirconia
nanoparticles increased dramatically, indicating attachment of paramagnetic species such
as Fe onto nanoparticles from pore surface. In order to understand the role of Fe ions in
altering nanoparticle surface relaxivity, I designed my experiments by mixing
nanoparticles with and without surface coating into Fe(III) solutions with various Fe(III)
concentrations: i) measure relaxation times of the mixtures and pure Fe (III) solutions at
same concentration (to isolate relaxivity of nanoparticles); ii) measure relaxation time and
Fe(III) concentration of supernatants after centrifuge of nanoparticles (to calculate the
adsorption of Fe(III) onto nanoparticles); iii) compare surface relaxivity of nanoparticles
before and after attachment of Fe(III) to get relationship between adsorbed Fe(III) and
alteration in nanoparticles surface relaxivities.
The results indicate that paramagnetic ions such as Fe(III) can adsorb onto
nanoparticles regardless of surface coating and surface charge of nanoparticles. My work
suggests that the silica nanoparticles with PEG surface coating can remove Fe(III) from
aqueous solution, since the relaxation rates of silica nanoparticles dispersed in Fe(III)
solutions is not a simple sum of the nanoparticle and iron solution relaxation rates. Zirconia
nanoparticles with positive and negative surface charge can remove more than 90% of
Fe(III) from solutions. Slightly alkaline conditions (pH between 7 and 8) do not play an
important role in precipitating Fe(III) ions.
When pH value was above 6, with no surface coating, zirconia nanoparticles in
dispersion were negatively charged (Tang et al., 2000), and the driving force for adsorption
of Fe(III) onto ZR-3BL was likely due to electrostatic attraction between negatively
charged nanoparticle and iron cations (Stuart et al., 1991). Under acidic conditions where

135
pH value was lower than 6, zirconia nanoparticles with positive surface charge also acted
as a Fe(III) sink, which suggests that electrostatic attraction was not the driving force of
adsorption in these cases. Hydrolysis of Fe3+ in solution builds Fe(OH)3 and polymers of
Fe(III) could have been precipitated at pH values ranging from 1.8 to 3.4 (Dousma and De
Bruyn, 1976). These polymers tend to precipitate on solid surfaces under acidic conditions
(Dai and Hu, 2014). Although I was not able to perform any measurements on supernatants
from the silica nanoparticle solutions, the behavior observed with the negatively charged
zirconia nanoparticles can be used to inform some interpretations of our measurements. At
pH from 5.5 to 9, the PEG coated silica nanoparticles were negatively charged. Therefore,
the increase in relaxation rate can probably be attributed to electrostatically-driven
adsorption of Fe ions onto the nanoparticles.
Adsorbed Fe(III) significantly increased the zirconia nanoparticles’ surface
relaxivity. Surface relaxivity of positively charged zirconia nanoparticles increased from
1.427 m/s to 50.17 m/s with 2.80 × 10⁻⁶ mol/m2 adsorbed Fe(III) at pH around 2.4.
Zirconia nanoparticles with negative surface charge at pH around 3.0 had surface relaxivity
increased from 1.095 m/s to 35.13 m/s when 2.07 × 10⁻⁶ mol/m2 Fe(III) was adsorbed.
The results show that under various pH conditions ranging from 2.4 to 7.5, adsorption of
Fe(III) species onto nanoparticle surfaces occurred and increased the relaxivity of the
nanoparticles. My research indicates that, in natural porous media with pore fluid
containing paramagnetic ions, sorption of these ions to the surface of nanoparticles can
significantly alter the NMR relaxation behavior of the nanoparticles. The phenomenon
affects nanoparticles regardless of surface charge or whether the nanoparticles are coated
with polymers or not. Care must therefore be taken when using nanoparticles as NMR
contrast agents in rock samples both in the laboratory and the subsurface.

136
With the observed confirmation that attached Fe onto nanoparticles increases
nanoparticle relaxivity. It leads to another question: whether and how organic surface
coating with low relaxivity will affect iron oxides nanoparticle’s relaxivity. To identify the
effect of surface coating to iron oxides nanoparticles, I employed 3 groups of amine
functionalized Fe3O4 nanoparticles (A-MNPs) designed to attach with different amount of
ATPES. I i) measured coating weight percentage and calculated relaxivities of the 3
samples; ii) added D2O to nanoparticles dispersions to check NMR relaxation mechanisms
of A-MNPs.
The three groups of A-MNPs are coated with different surface coating amount: 1.60
wt% for 5.6A-MNPs, 1.99 wt% for 7.5A-MNPs, and 2.80 wt% for 9.8A-MNPs. The
corresponding surface relaxivities decreased from 105,000 m/s to 94,100 m/s to 78,300
m/s. Among the 3 groups of A-MNPs, only 24% ~ 43% of the surface magnetic sites was
occupied by APTES branches, leaving more than half of the surface Fe atoms accessible
to water molecules and providing e-H relaxation which will dominate the overall surface
relaxation rate of the nanoparticles.
The mechanisms by which surface coating reduces nanoparticles’ relaxivity was
studied by diluting A-MNPs with the least and most surface coating using different volume
fractions of D2O. When D2O volume fraction increased from 0 vol% to 70 vol%, with Fe
concentration of 0.002 g/L, 9.8A-MNPs with 2.80 wt% surface coating showed more
reduction in surface relaxation rate (dropped by 34.5%) compared to 5.6A-MNPs with 1.60
wt% surface coating (dropped by 12.5%). It suggested that at very low nanoparticle
concentration, e-H relaxation is less dominant due to the limited amount of Fe3O4;
intermolecular H-H relaxation between 1H in APTES braches and 1H in water molecules
contributed more to nanoparticle surface relaxation. My results indicate that A-MNPs with
various coating amounts relax protons at nanoparticle surfaces mainly by e-H relaxation

137
and controls the overall relaxation of suspensions at higher Fe3O4 nanoparticles
concentration. In this study, the maximum amount of APTES attached to nanoparticles was
2.80 wt%, covering only 43% of the Fe3O4 nanoparticle surface. In this case the effect of
APTES in reducing relaxivities of the nanoparticle was limited. However, when APTES
coating amount is increased, we would expect more nanoparticle surface occupied by
APTES, leaving less Fe3O4 exposed to water molecules. Therefore, care should be taken
when using nanoparticles with extensive surface coating.
To sum up, this project was intended to coat silica surfaces with a known quantity
of nanoparticles and thus control the pore surface relaxivity. 30% ~ 40% retention of
positively charged zirconia nanoparticles were observed in Boise sandstone cores after
flushing with 2 pore volumes of DI water and HNO3. Assuming a monolayer packing of
nanoparticles on the pore walls, the maximum surface fraction that can be achieved by
attached nanoparticles is 90.69%. With 30% ~ 40% of nanoparticles captured in sandstone
cores, only 20.5% ~ 26.4% of pore surface were covered by attached nanoparticle via
monolayer packing, the pore surface was not covered by nanoparticles to full capacity.
Electrostatic repulsion between nanoparticles may prevent nanoparticles from getting too
close to each other on the pore surface and thus limit the adsorption amount. Due to
interactions between nanofluids and pore surfaces, nanoparticles picked up paramagnetic
ions from the pore surface, causing the nanoparticles’ relaxivities to increase and thus
making the calculation and prediction of altered sandstone surface relaxivity more
complicated. Based on my results, it is currently not practical to coat pore surfaces
completely with a nanoparticle monolayer. Further study on how to prevent adsorption of
paramagnetic species onto nanoparticles, and how to increase nanoparticle attachment to
pore surfaces, is necessary to ensure constant nanoparticle relaxivity and predictable value
of pore surface with attached nanoparticles.

138
Table 7.1 Property summary of four nanoparticle dispersions studied in this project.
Nanoparticles Label Size (nm) Surface charge Relaxivity (m/s)
zirconia ZR-AL 90~110 positive 1.427
zirconia ZR-BL 70~80 negative 1.095
PEG coated Silica Si-B 20~30 negative 0.0722
APTES coated Fe3O4 A-MNPs 70~100 negative 78,300~105,000
In this study, as displayed in Table 7.1, four groups of nanoparticles were studied:
ZR-AL, ZR-BL, Si-B, and A-MNPs. Among those samples, A-MNPs with high relaxivity
will help increase the pore surface relaxivity if attached on to pore surface. However, with
negative surface charge of silica under natural conditions (Revil, 1999a, b), it is not easy
for the negatively charged A-MNPs to adsorb onto pore surface. However, it is possible
that A-MNPs can be employed to attach onto positive pore surfaces and control surface
relaxivity such as calcite. With low relaxivity and negative surface charge, Si-4B is not a
good candidate to coat silica pore surface or control pore surface relaxivity. For zirconia
nanoparticles, ZR-BL nanoparticles were observed to be retained in Boise sandstone at
very low fraction (2% to 3%) and not at all in glass bead packs; ZR-AL was retained better
in glass bead packs (11.6%) and Boise sandstone (30% to 40%), resulting in an appreciable
alteration of pore surface relaxivity via adsorption onto pore surface. However, due to their
relatively small relaxivities, attachment of paramagnetic ions on the zirconia nanoparticles
increased their surface relaxivity, which makes it complicate to link the attached amount
of nanoparticles and altered pore surface relaxivity since the nanoparticle relaxivity is
variable. Hence, even with the evidence that positively charged zirconia nanoparticles can
attach to silica surfaces and alter the pore surface relaxivity, due to their low relaxivity and
vulnerability to the presence of paramagnetic ions, zirconia nanoparticles in this study may

139
need to be modified to increase relaxivity and/or to prevent adsorption of paramagnetic
ions before they can be suitably applied for this purpose.
More generally, my work helps to understand factors that affect nanoparticles’
surface relaxivities and the behavior of nanoparticles in porous media, and will be used in
future studies of the pore-scale characteristics in rocks. In particular, my work highlights
the complicated interplay between nanoparticles and rock surfaces that affect
measurements of bulk properties. Understanding these complicating factors is essential to
future applications that depend on coating grain surfaces or fluid interfaces with
nanoparticles, such as enhanced oil recovery, imaging oil-water contacts, and determining
interfacial surface areas.
7.2 FUTURE WORK
This project is a step toward the engineered control of surface relaxivity of porous
media, which in turn would enable more robust inference of pore size distributions from
NMR measurements, especially using logging tools. In my experiments, factors that many
affect nanoparticles surface relaxivities were studied, however all the possible mechanisms
of Fe(III) adsorbed onto positively charged zirconia nanoparticles were not well studied.
The known value of pore size and surface relaxivity of silica porous media enabled
me to estimate adsorbed zirconia nanoparticles and modified surface relaxivity. To realize
the end goal of being able to predict pore size distributions directly from NMR
measurements with no prior knowledge of pore sizes, further work is necessary to
understand the link between zeta potential differences between nanoparticles and
substrates, quantity adsorbed, and overall relaxivity alteration.
My results indicated adsorption of positively charged nanoparticles onto silica
surface. A separate experiment to study the adsorption of negatively charged nanoparticles

140
onto positive pore surface may broaden the applications and studies of nanoparticle-pore
surface interaction and effect of adsorbed nanoparticles on pore surface relaxivity.
The experimental data showed that, even with an excess amount of nanoparticles
in the pores, full coverage in a monolayer was never observed. It is possible that
electrostatic repulsion between nanoparticles prevents them from settling next to each other
on the pore surface. It will be useful to use DLVO theory to better analyze and predict the
adsorption of nanoparticles on pore walls, and to provide guidance on suitable surface
coatings that can promote this behavior.
In addition, I did not analyze how hydration layers on nanoparticles and pore
surfaces will affect attachment of nanoparticles onto pore walls. Further study is required
to identify the role of the hydration layer in nanoparticle adsorption and relaxation.

141
Appendix A
ARITHMETIC CALCULATIONS OF ERROR PROPAGATION
X: function of u and v (u and v are independent measured varibles from an experiment)
X: standard deviation of X
u: standard deviation of u
v: standard deviation of v
2 2
2 2 2 2 2 2
2 22 22 2 2 2 2 2
2 2 22
2 2
2 2 2 2
X u v u v u v
u v
X uv u v u v
u v
uv u vX
X u u v
u vv
X u v
X X
u v
X uv
X Xv u
u v
uv uv u v
uX
v
X X
u v
22 2
2 4
2 2
2 2
u v
u
v u vX
u
v v
u u u v
v v

142
Appendix B
RAW NMR DATA
Figure B-1. T1 relaxation of ZR-AL dispersions with different nanoparticle weight
percentage. x axis is time, y axis is measured sample volume after correction
with H index.

143
Figure B-2. T1 relaxation of ZR-BL dispersions with different nanoparticle weight
percentage. x axis is time, y axis is measured sample volume after correction
with H index.

144
Figure B-3. T1 relaxation of 3 saturated Boise sandstone cores: BS1, BS2, BS3. They are
saturated with DI water, ZR-6AL, and ZR-6BL nanoparticle dispersions,
respectively. x axis is time, y axis is measured sample volume after
correction with H index.

145
Figure B-4. T1 relaxation of DI water, HNO3, and TMAH saturated Boise sandstone cores
for Cores #1-#5 after correction with H index. x axis is time, y axis is
measured sample volume after correction with H index.

146
Figure B-5. T1 relaxation of DI, HNO3, ZR-6AL, and ZR-7.5AL dispersions saturated
Boise sandstone cores for Cores #1, #2, #6, #7, #10, and #11 after correction
with H index. x axis is time, y axis is measured sample volume after
correction with H index.

147
Figure B-6. T1 relaxation of DI, TMAH, ZR-6BL, and ZR-7.5BL dispersions saturated
Boise sandstone cores for Cores #1, #4, #8, #9, #12, and #13. x axis is time,
y axis is measured sample volume after correction with H index.

148
Figure B-7. T1 relaxation of DI water, HNO3, and TMAH saturated Boise sandstone cores
for Cores #1-#5 after core flooding with pre-selected pure fluid for 2 pore
volume. x axis is time, y axis is measured sample volume after correction
with H index.

149
Figure B-8. T1 relaxation of DI, HNO3, ZR-6AL, and ZR-7.5AL saturated Boise
sandstone cores for Cores #1, #2, #6, #7, #10, and #11 after core flooding
with pre-selected pure fluid for 2 pore volume. x axis is time, y axis is
measured sample volume after correction with H index.

150
Figure B-9. T1 relaxation of DI, TMAH, ZR-6BL, and ZR-7.5BL saturated Boise
sandstone cores for Cores #1, #4, #8, #9, #12, and #13 after core flooding
with pre-selected pure fluid for 2 pore volume. x axis is time, y axis is
measured sample volume after correction with H index.

151
Figure B-10. T1 relaxation of first 0.7 pore volume effluents from DI water, HNO3, and
TMAH saturated Boise sandstone cores for Cores #1-#5. x axis is time, y
axis is measured sample volume after correction with H index.

152
Figure B-11. T1 relaxation of first 0.7 pore volume effluents from HNO3, ZR-6AL, and
ZR-7.5AL saturated Boise sandstone cores for Cores #2, #6, #7, #10, and
#11. x axis is time, y axis is measured sample volume after correction with
H index.

153
Figure B-12. T1 relaxation of first 0.7 pore volume effluents from TMAH, ZR-6BL, and
ZR-7.5BL saturated Boise sandstone cores for Cores #4, #8, #9, #12, and
#13. x axis is time, y axis is measured sample volume after correction with
H index.

154
Figure B-13. T1 relaxation of 5.6A-MNPs dispersions with different nanoparticle
concentration. x axis is time, y axis is measured sample volume after
correction with H index.

155
Figure B-14. T1 relaxation of 7.5A-MNPs dispersions with different nanoparticle
concentration. x axis is time, y axis is measured sample volume after
correction with H index.

156
Figure B-15. T1 relaxation of 9.8A-MNPs dispersions with different nanoparticle
concentration. x axis is time, y axis is measured sample volume after
correction with H index.

157
References
Abragam, A. (1961). Principles of nuclear magnetism. Oxford, UK: Oxford University
Press.
Allen, D., Crary, S., & Freedman, B. (1998). How to use borehole nuclear magnetic
resonance. Oceanographic Literature Review, 3(45), 586-587.
Anand V., Hirasaki, G. J. (2008). Paramagnetic relaxation in sandstones: Distinguishing
T1 and T2 dependence on Surface relaxation, Internal gradients and dependence on
echo Spacing. Journal of Magnetic Resonance, 190(1), 68-65.
Arawole, S. S. (2015). Multiple Approaches To Characterizing Pore Structure For A Range
Of Sandstones Samples.
Babes, L., Denizot, B., Tanguy, G., Le Jeune, J. J., & Jallet, P. (1999). Synthesis of iron
oxide nanoparticles used as MRI contrast agents: a parametric study. Journal of
Colloid and Interface Science, 212(2), 474-482.
Bagaria, H. G., Yoon, K. Y., Neilson, B. M., Cheng, V., Lee, J. H., Worthen, A. J., Xue,
Z., Huh, C., Bryant, S. L., Bielawski, C. W., & Johnston, K. P. (2013). Stabilization
of iron oxide nanoparticles in high sodium and calcium brine at high temperatures
with adsorbed sulfonated copolymers. Langmuir, 29(10), 3195-3206.
Bee, A., Massart, R., & Neveu, S. (1995). Synthesis of very fine maghemite particles.
Journal of Magnetism and Magnetic Materials, 149(1-2), 6-9.
Bertini, I., Capozzi, F., Luchinat, C., & Zhicheng, X. (1993). Nuclear and electron
relaxation of Fe (OH2)63+. Journal of Physical Chemistry, 97(6), 1134-1137.
Bloembergen, N. (1956). Spin relaxation processes in a two-proton system. Physical
Review, 104(6), 1542.
Bloembergen, N., & Morgan, L. O. (1961). Proton relaxation times in paramagnetic
solutions. Effects of electron spin relaxation. The Journal of Chemical
Physics, 34(3), 842-850.
Bloembergen, N., Purcell, E. M., & Pound, R. V. (1948). Relaxation effects in nuclear
magnetic resonance absorption. Physical Review, 73(7), 679.
Brownstein, K. R., & Tarr, C. E. (1979). Importance of classical diffusion in NMR studies
of water in biological cells. Physical Review A, 19(6), 2446.
Bryar, T. R., Daughney, C. J., & Knight, R. J. (2000). Paramagnetic effects of iron (III)
species on nuclear magnetic relaxation of fluid protons in porous media. Journal of
Magnetic Resonance, 142(1), 74-85.
Caldelas, F. M. (2010). Experimental parameter analysis of nanoparticle retention in
porous media (Doctoral dissertation).

158
Caminiti, R., & Magini, M. (1979). An X-ray diffraction study on the first and the second
hydration shell of the Fe (III) ion in nitrate solutions. Chemical Physics
Letters, 61(1), 40-44.
Carmichael, R. S. (1982). CRC Handbook of Physical Properties of Rocks. Boca Raton,
FL: CRC Press, Inc.
Carr, H. Y., & Purcell, E. M. (1954). Effects of diffusion on free precession in nuclear
magnetic resonance experiments. Physical Review, 94(3), 630.
Carter, R. S., Harley, S. J., Power, P. P., & Augustine, M. P. (2005). Use of NMR
spectroscopy in the synthesis and characterization of air-and water-stable silicon
nanoparticles from porous silicon. Chemistry of Materials, 17(11), 2932-2939.
Chang, H. C., & Wang, L. C. (2010). A simple proof of Thue's Theorem on circle packing.
arXiv preprint arXiv:1009.4322.
Cheng, K., Aderibigbe, A., Alfi, M., Heidari, Z., & Killough, J. (2014a). Quantifying the
impact of petrophysical properties on spatial distribution of contrasting
nanoparticle agents. In SPWLA 55th Annual Logging Symposium. Society of
Petrophysicists and Well-Log Analysts.
Cheng, K., Chi, L., & Heidari, Z. (2014b). Improved assessment of pore-size distribution
and pore connectivity in multiple-porosity systems using superparamagnetic iron
oxide nanoparticles and NMR measurements. In SPE Annual Technical Conference
and Exhibition. Society of Petroleum Engineers.
Chertok, B., Moffat, B. A., David, A. E., Yu, F., Bergemann, C., Ross, B. D., & Yang, V.
C. (2008). Iron oxide nanoparticles as a drug delivery vehicle for MRI monitored
magnetic targeting of brain tumors. Biomaterials, 29(4), 487-496.
Coates, G. R., Xiao, L., & Prammer, M. G. (1999). NMR Logging: Principles and
Applications. Houston, TX: Gulf Professional Publishing.
Cornell, R. M., & Schwertmann, U. (2003). The Iron Oxides: Structure, Properties,
Reactions, Occurrences and Uses. New York, NY: John Wiley & Sons.
Császár, A. G., Czakó, G., Furtenbacher, T., Tennyson, J., Szalay, V., Shirin, S. V., Zobov,
N. F. & Polyansky, O. L. (2005). On equilibrium structures of the water molecule.
The Journal of chemical physics, 122(21), 214305.
Dai, C., & Hu, Y. (2014). Fe (III) hydroxide nucleation and growth on quartz in the
presence of Cu (II), Pb (II), and Cr (III): metal hydrolysis and
adsorption. Environmental Science & Technology, 49(1), 292-300.
Daigle, H., & Dugan, B. (2011). An improved technique for computing permeability from
NMR measurements in mudstones. Journal of Geophysical Research: Solid
Earth, 116(B8), B08101.

159
Daigle, H., & Johnson, A. (2016). Combining mercury intrusion and nuclear magnetic
resonance measurements using percolation theory. Transport in Porous
Media, 111(3), 669-679.
Daigle, H., Thomas, B., Rowe, H., & Nieto, M. (2014). Nuclear magnetic resonance
characterization of shallow marine sediments from the Nankai Trough, Integrated
Ocean Drilling Program Expedition 333. Journal of Geophysical Research: Solid
Earth, 119(4), 2631-2650.
Diehl, P. S., Fluck, E., & Kosfeld, R. (1969). NMR: Basic Principles and Progress. Berlin:
Springer-Verlag.
Dousma, J., & De Bruyn, P. L. (1976). Hydrolysis-precipitation studies of iron solutions.
I. Model for hydrolysis and precipitation from Fe (III) nitrate solutions. Journal of
Colloid and Interface Science, 56(3), 527-539.
Enhessari, M., Razi, M. K., Etemad, L., Parviz, A., & Sakhaei, M. (2014). Structural,
optical and magnetic properties of the Fe2TiO5 nanopowders. Journal of
Experimental Nanoscience, 9(2), 167-176.
Fernández-Toledano, J. C., Moncho-Jordá, A., Martínez-López, F., & Hidalgo-Álvarez, R.
(2006). Theory for interactions between particles in monolayers. In Colloidal
Particles at Liquid Interfaces, edited by B. P. Binks & T. S. Horozov, pp. 108-151.
Fleury, M. (2007). NMR surface relaxivity determination using NMR apparent diffusion
curves and BET measurements. In International Symposium of the Society of Core
Analysts, Calgary, Canada.
Foley, I., Farooqui, S. A., & Kleinberg, R. L. (1996). Effect of paramagnetic ions on NMR
relaxation of fluids at solid surfaces. Journal of Magnetic Resonance, Series
A, 123(1), 95-104.
Freedman, R., Heaton, N., Flaum, M., Hirasaki, G. J., Flaum, C., & Hürlimann, M. (2003).
Wettability, saturation, and viscosity from NMR measurements. SPE Journal, 8(4),
317-327.
Ganesan, K., Damle, R., & Ramakrishna, J. (1990). ChemInform Abstract: Proton NMR
study of molecular dynamics in hydrazinium perchlorate. ChemInform,21(20).
Gaudin, A. M., & Fuerstenau, D. W. (1955). Streaming potential studies. Quartz flotation
with anionic collectors. Mining Eng., 7.
Godinez, I. G., & Darnault, C. J. (2011). Aggregation and transport of nano-TiO 2 in
saturated porous media: effects of pH, surfactants and flow velocity. Water
Research, 45(2), 839-851.
Gupta, A. K., & Gupta, M. (2005). Cytotoxicity suppression and cellular uptake
enhancement of surface modified magnetic nanoparticles. Biomaterials, 26(13),
1565-1573.
160
Hill, R. J., Craig, J. R., & Gibbs, G. V. (1979). Systematics of the spinel structure
type. Physics and Chemistry of Minerals, 4(4), 317-339.
Hinedi, Z. R., Chang, A. C., Anderson, M. A., & Borchardt, D. B. (1997). Quantification
of microporosity by nuclear magnetic resonance relaxation of water imbibed in
porous media. Water Resources Research, 33(12), 2697-2704.
Hu, J., Chen, G., & Lo, I. M. (2005). Removal and recovery of Cr (VI) from wastewater
by maghemite nanoparticles. Water Research, 39(18), 4528-4536.
Iler, R. K. (2004). The Chemistry of Silica: Solubility, Polymerization, Colloid and Surface
Properties, and Biochemistry. New York, NY: Wiley.
Ishido, T., & Mizutani, H. (1981). Experimental and theoretical basis of electrokinetic
phenomena in rock‐water systems and its applications to geophysics. Journal of
Geophysical Research: Solid Earth, 86(B3), 1763-1775.
Israelachvili, J., & Wennerstrom, H. (1996). Role of hydration and water structure in
biological and colloidal interactions. Nature, 379(6562), 219.
Issa, B., Qadri, S., Obaidat, I. M., Bowtell, R. W., & Haik, Y. (2011). PEG coating reduces
NMR relaxivity of Mn0.5Zn0.5Gd0.02Fe1.98O4 hyperthermia nanoparticles. Journal of
Magnetic Resonance Imaging, 34(5), 1192-1198.
Jordan, A., Scholz, R., Maier-Hauff, K., Johannsen, M., Wust, P., Nadobny, J., ... &
Lanksch, W. (2001). Presentation of a new magnetic field therapy system for the
treatment of human solid tumors with magnetic fluid hyperthermia. Journal of
Magnetism and Magnetic Materials, 225(1), 118-126.
Keating, K., & Knight, R. (2008). A laboratory study of the effect of magnetite on NMR
relaxation rates. Journal of Applied Geophysics, 66(3), 188-196.
Keesom, W. H., Zelenka, R. L., & Radke, C. J. (1988). A zeta-potential model for ionic
surfactant adsorption on an ionogenic hydrophobic surface. Journal of Colloid and
Interface Science, 125(2), 575-585.
Kenyon, W. E., & Kolleeny, J. A. (1995). NMR surface relaxivity of calcite with adsorbed
Mn2+. Journal of Colloid and Interface Science, 170(2), 502-514.
Kim, J. K., & Lawler, D. F. (2005). Characteristics of zeta potential distribution in silica
particles. Bulletin of the Korean Chemical Society, 26(7), 1083-1089.
Kleinberg, R. L., & Horsfield, M. A. (1990). Transverse relaxation processes in porous
sedimentary rock. Journal of Magnetic Resonance, 88(1), 9-19.
Kleinberg, R. L., Kenyon, W. E., & Mitra, P. P. (1994). Mechanism of NMR relaxation of
fluids in rock. Journal of Magnetic Resonance, Series A, 108(2), 206-214.
Ko, S., Lee, H., & Huh, C. (2016). Efficient removal of enhanced-oil-recovery polymer
from produced water with magnetic nanoparticles and regeneration/reuse of spent
particles. SPE Production & Operations, in press.

161
Ko, S., Prigiobbe, V., Huh, C., Bryant, S. L., Bennetzen, M. V., & Mogensen, K. (2014).
Accelerated oil droplet separation from produced water using magnetic
nanoparticles. In SPE Annual Technical Conference and Exhibition. Society of
Petroleum Engineers.
Koenig, S. H., & Brown, R. D. (1987). Relaxometry of paramagnetic-ions in tissue. Metal
Ions in Biological Systems, 21, 229-270.
Korb, J. P., Whaley-Hodges, M., & Bryant, R. G. (1997). Translational diffusion of liquids
at surfaces of microporous materials: Theoretical analysis of field-cycling magnetic
relaxation measurements. Physical Review E, 56(2), 1934.
Korringa, J., Seevers, D. O., & Torrey, H. C. (1962). Theory of spin pumping and
relaxation in systems with a low concentration of electron spin resonance
centers. Physical Review, 127(4), 1143.
Krohn, C. E. (1988). Fractal measurements of sandstones, shales, and carbonates. Journal
of Geophysical Research, 93(B4), 3297-3305.
Li, H. C., & De Bruyn, P. L. (1966). Electrokinetic and adsorption studies on
quartz. Surface Science, 5(2), 203-220.
Lu, W., Senapati, D., Wang, S., Tovmachenko, O., Singh, A. K., Yu, H., & Ray, P. C.
(2010). Effect of surface coating on the toxicity of silver nanomaterials on human
skin keratinocytes. Chemical Physics Letters, 487(1), 92-96.
Magini, M., & Caminiti, R. (1977). On the structure of highly concentrated iron (III) salt
solutions. Journal of Inorganic and Nuclear Chemistry, 39(1), 91-94.
Mansfield, P., & Pykett, I. L. (1978). Biological and medical imaging by NMR. Journal of
Magnetic Resonance (1969), 29(2), 355-373.
McDonald, P. J., Korb, J. P., Mitchell, J., & Monteilhet, L. (2005). Surface relaxation and
chemical exchange in hydrating cement pastes: a two-dimensional NMR relaxation
study. Physical Review E, 72(1), 011409.
Mehta, P., Huh, C., & Bryant, S. L. (2014, December). Evaluation of superparamagnetic
nanoparticle-based heating for flow assurance in subsea flowlines. In International
Petroleum Technology Conference. International Petroleum Technology
Conference.
Meiboom, S., & Gill, D. (1958). Modified spin‐echo method for measuring nuclear
relaxation times. Review of Scientific Instruments, 29(8), 688-691.
Morgan, F. D., Williams, E. R., & Madden, T. R. (1989). Streaming potential properties of
westerly granite with applications. Journal of Geophysical Research: Solid
Earth, 94(B9), 12449-12461.Na, H. B., Song, I. C., & Hyeon, T. (2009). Inorganic
nanoparticles for MRI contrast agents. Advanced Materials, 21(21), 2133-2148.

162
Nelson, P. H. (2009). Pore-throat sizes in sandstones, tight sandstones, and shales. AAPG
Bulletin, 93(3), 329-340.
Ogolo, N. A., Olafuyi, O. A., & Onyekonwu, M. O. (2012, January). Enhanced oil recovery
using nanoparticles. In SPE Saudi Arabia Section Technical Symposium and
Exhibition. Society of Petroleum Engineers.
Oh, J., Feldman, M. D., Kim, J., Condit, C., Emelianov, S., & Milner, T. E. (2006).
Detection of magnetic nanoparticles in tissue using magneto-motive
ultrasound. Nanotechnology, 17(16), 4183.
Oldenburg, C. M., Borglin, S. E., & Moridis, G. J. (2000). Numerical simulation of
ferrofluid flow for subsurface environmental engineering applications. Transport
in Porous Media, 38(3), 319-344.
Overbeek, J. T. G. (1952). Electrochemistry of the double layer. Colloid Science, 1, 115-
193.
Persson, I. (2010). Hydrated metal ions in aqueous solution: how regular are their
structures?. Pure and Applied Chemistry, 82(10), 1901-1917.
Petri-Fink, A., Steitz, B., Finka, A., Salaklang, J., & Hofmann, H. (2008). Effect of cell
media on polymer coated superparamagnetic iron oxide nanoparticles (SPIONs):
colloidal stability, cytotoxicity, and cellular uptake studies. European Journal of
Pharmaceutics and Biopharmaceutics, 68(1), 129-137.
Pettijohn, F. J. (1963). Data of Geochemistry: Chemical Composition of Sand-Stones--
Excluding Carbonate and Volcanic Sands (No. 440). Washington, DC: US
Government Printing Office.
Pfeifer, H. (1972). Nuclear magnetic resonance and relaxation of molecules adsorbed on
solids. NMR Basic Principles and Progress, 7, 55-153.
Pride, S. (1994). Governing equations for the coupled electromagnetics and acoustics of
porous media. Physical Review B, 50(21), 15678.
Prodanović, M., Ryoo, S., Rahmani, A. R., Kuranov, R. V., Kotsmar, C., Milner, T. E., &
Huh, C. (2010). Effects of magnetic field on the motion of multiphase fluids
containing paramagnetic nanoparticles in porous media. In SPE Improved Oil
Recovery Symposium. Society of Petroleum Engineers.
Revil, A., Pezard, P. A., & Glover, P. W. (1999a). Streaming potential in porous media: 1.
Theory of the zeta potential. Journal of Geophysical Research: Solid
Earth, 104(B9), 20021-20031.
Revil, A., Schwaeger, H., Cathles, L. M., & Manhardt, P. D. (1999b). Streaming potential
in porous media: 2. Theory and application to geothermal systems. Journal of
Geophysical Research: Solid Earth, 104(B9), 20033-20048.

163
Rodriguez Pin, E., Roberts, M., Yu, H., Huh, C., & Bryant, S. L. (2009). Enhanced
migration of surface-treated nanoparticles in sedimentary rocks. In SPE Annual
Technical Conference and Exhibition. Society of Petroleum Engineers.
Ryoo, S., Rahmani, A. R., Yoon, K. Y., Prodanović, M., Kotsmar, C., Milner, T. E., &
Huh, C. (2012). Theoretical and experimental investigation of the motion of
multiphase fluids containing paramagnetic nanoparticles in porous media. Journal
of Petroleum Science and Engineering, 81, 129-144.
Ryu, S. (2009). Effect of inhomogeneous surface relaxivity, pore geometry and internal
field gradient on NMR logging: Exact and perturbative theories and numerical
investigations. In SPWLA 55th Annual Logging Symposium. Society of
Petrophysicists and Well-Log Analysts.
Senturia, S. D., & Robinson, J. D. (1970). Nuclear spin-lattice relaxation of liquids
confined in porous solids. SPE Journal, 10(03), 237-244.
ShamsiJazeyi, H., Miller, C. A., Wong, M. S., Tour, J. M., & Verduzco, R. (2014).
Polymer‐coated nanoparticles for enhanced oil recovery. Journal of Applied
Polymer Science, 131(15).
Sis, H., & Birinci, M. (2009). Effect of nonionic and ionic surfactants on zeta potential and
dispersion properties of carbon black powders. Colloids and Surfaces A:
Physicochemical and Engineering Aspects, 341(1), 60-67.
Solomon, I. (1955). Relaxation processes in a system of two spins. Physical Review, 99(2),
559.
Stuart, M. C., Fleer, G. J., Lyklema, J., Norde, W., & Scheutjens, J. M. H. M. (1991).
Adsorption of ions, polyelectrolytes and proteins. Advances in Colloid and
Interface Science, 34, 477-535.
Tang, F., Huang, X., Zhang, Y., & Guo, J. (2000). Effect of dispersants on surface chemical
properties of nano-zirconia suspensions. Ceramics International, 26, 93-97.
Vane, L. M., & Zang, G. M. (1997). Effect of aqueous phase properties on clay particle
zeta potential and electro-osmotic permeability: Implications for electro-kinetic soil
remediation processes. Journal of Hazardous Materials, 55(1-3), 1-22.
Vuong, Q. L., Van Doorslaer, S., Bridot, J. L., Argante, C., Alejandro, G., Hermann, R.,
Disch, S., Mattea, C., Stapf, S., & Gossuin, Y. (2012). Paramagnetic nanoparticles
as potential MRI contrast agents: characterization, NMR relaxation, simulations
and theory. Magnetic Resonance Materials in Physics, Biology and
Medicine, 25(6), 467-478.
Wang, Q., Prigiobbe, V., Huh, C., Bryant, S. L., Mogensen, K., & Bennetzen, M. V. (2014).
Removal of divalent cations from brine using selective adsorption onto magnetic
nanoparticles. In International Petroleum Technology Conference. International
Petroleum Technology Conference.

164
Wang, R., Pavlin, T., Rosen, M. S., Mair, R. W., Cory, D. G., & Walsworth, R. L. (2005).
Xenon NMR measurements of permeability and tortuosity in reservoir
rocks. Magnetic Resonance Imaging, 23(2), 329-331.
Wang, Y., Li, Y., Fortner, J. D., Hughes, J. B., Abriola, L. M., & Pennell, K. D. (2008).
Transport and retention of nanoscale C60 aggregates in water-saturated porous
media. Environmental Science & Technology, 42(10), 3588-3594.
Washburn, K. E. (2014). Relaxation mechanisms and shales. Concepts in Magnetic
Resonance Part A, 43(3), 57-78.
Wong, P. (1999). Methods in the Physics of Porous Media. San Diego, CA: Academic
Press.
Xue, Z., Foster, E., Wang, Y., Nayak, S., Cheng, V., Ngo, V. W., Pennell, K. D., Bielawski,
C. W., & Johnston, K. P. (2014). Effect of grafted copolymer composition on iron
oxide nanoparticle stability and transport in porous media at high salinity. Energy
& Fuels, 28(6), 3655-3665.
Yu, H., Kotsmar, C., Yoon, K. Y., Ingram, D. R., Johnston, K. P., Bryant, S. L., & Huh, C.
(2010). Transport and retention of aqueous dispersions of paramagnetic
nanoparticles in reservoir rocks. In SPE Improved Oil Recovery Symposium.
Society of Petroleum Engineers.
Yu, H., Yoon, K. Y., Neilson, B. M., Bagaria, H. G., Worthen, A. J., Lee, J. H., Cheng, V.,
Bielawski, K. P., Bryant, S. L., & Huh, C. (2014). Transport and retention of
aqueous dispersions of superparamagnetic nanoparticles in sandstone. Journal of
Petroleum Science and Engineering, 116, 115-123.
Zhang, Y., Chen, Y., Westerhoff, P., & Crittenden, J. (2009). Impact of natural organic
matter and divalent cations on the stability of aqueous nanoparticles. Water
Research, 43(17), 4249-4257.
Zhou, J., Qiao, X., Binks, B. P., Sun, K., Bai, M., Li, Y., & Liu, Y. (2011). Magnetic
Pickering emulsions stabilized by Fe3O4 nanoparticles. Langmuir, 27(7), 3308-
3316.
Zhu, C., Daigle, H., & Bryant, S. (2015). Nuclear magnetic resonance investigation of
surface relaxivity modification by paramagnetic nanoparticles. In SPE Annual
Technical Conference and Exhibition. Society of Petroleum Engineers.
Zhu, C., Daigle, H., & Bryant, S. L. (2016). Paramagnetic nanoparticles as nuclear
magnetic resonance contrast agents in sandstone: Importance of nanofluid-rock
interactions. Interpretation, 4(2), SF55-SF65.