copyright by george brennan mcguirk 2014
TRANSCRIPT

Copyright
by
George Brennan McGuirk
2014

The Thesis Committee for George Brennan McGuirk
Certifies that this is the approved version of the following thesis:
Food Expenditure Measures to Supplement Net Energy Ratios for
Selected Countries 1961 - 2011
APPROVED BY
SUPERVISING COMMITTEE:
Carey W. King
Michael E. Webber
Supervisor:
Co-Supervisor:
Food Expenditure Measures to Supplement Net Energy Ratios for
Selected Countries 1961 - 2011
by
George Brennan McGuirk, B.A.
Thesis
Presented to the Faculty of the Graduate School of
The University of Texas at Austin
in Partial Fulfillment
of the Requirements
for the Degree of
Master of Science in Energy Earth Resources
And
Master of Business Administration
The University of Texas at Austin
August 2014
Dedication
For Oscar. I am sorry for all the long days without a trip to the park you had to endure over
the last three years. I wish you were still my co-pilot for my upcoming adventures in the
mountains.

v
Acknowledgements
The author would like to acknowledge the Jackson School Energy Theme seed
grant to Dr. Carey W. King for funding the research and data gathering efforts associated
with this analysis.
In addition, the author would like to acknowledge the thesis supervising committee
Carey W. King and Michael E. Webber. Their patience, understanding, and thoughtful
insight through this process has surpassed any and all expectations.
Finally, the author would to acknowledge the support of his friends and family who
tolerated the prolonged absences that resulted during the course of this project, and who
were always welcoming when he resurfaced.

vi
Abstract
Food Expenditure Measures to Supplement Net Energy Ratios for
Selected Countries 1961 - 2011
George Brennan McGuirk, MSEER & MBA
The University of Texas at Austin, 2014
Supervisor: Carey W. King
Co-Supervisor: Michael E. Webber
This thesis focuses on the relationship between food expenditures and the economy.
In analogous fashion to Maxwell 2013 which calculated energy expenditures as a
percentage of national and global gross domestic product (GDP), this thesis examined three
available food expenditure datasets to study the relationship between food expenditures as
a percentage of GDP and economic growth. The analysis calculated two metrics, Primary
Consumption Expenditures and Final Consumption Expenditures which were used to
compare the available datasets and create a more robust hybrid dataset containing data for
178 countries with an average time span of 40 years that was used to study the relationship
between global economic growth and food expenditures. Historical evidence does not
suggest that food has imposed a limit on economic growth; however, recent trends over the
past decade associated with biofuel production suggest the global economy has entered a
new era with rapidly rising food prices and expenditures. As food resources continue to be
used as industrial energy inputs, it is critical to include food expenditures in further analysis
of potential impacts energy expenditures may have on economic growth.
vii
Table of Contents
List of Tables ..................................................................................................................... ix List of Figures ......................................................................................................................x List of Equations ................................................................................................................ xi Chapter 1: Introduction and Background ............................................................................1
Thesis Outline .............................................................................................................1 Overview of Thesis .....................................................................................................1 Role of Agriculture in Social and Economic Development........................................4
An Engine of Growth .........................................................................................4 A Limit to Growth .............................................................................................7
Macroeconomics vs. Macroecological Economics .....................................................8 Net Energy Metrics ...................................................................................................10
Chapter 2: Methodology ...................................................................................................13
Description of Data Sources .....................................................................................13 USDA - Consumption Expenditure on Food Consumed at Home ..................13 OECD - National Accounts Expenditure on Food and Non-Alcoholic
Beverages ................................................................................................14 FAO - Agriculture Production Values .............................................................16
Other Background Data ...................................................................................18 Metrics ......................................................................................................................18
Food Consumption – Final Consumption Expenditure Ratio ..........................18
FCE – USDA ..........................................................................................19
FCE – OECD ..........................................................................................20 Food System Input Expenditure – Primary Consumption Expenditure Ratio .20
Gross Agricultural Production Value......................................................23
Import and Export Values .......................................................................26 Data Limitations and Assumptions ..................................................................27
Chapter 3: Results and Interpretation ................................................................................28 Time Series Trends of All Data Sets .........................................................................28
FCE RatioUSDA
- Consumption Expenditure on Food Consumed at Home .....29
FCE RatioOECD – National Accounts Expenditure on Food and Non-Alcoholic
Beverages ................................................................................................32 PCE RatioFAO – Agriculture Production Values ..............................................35 PCE RatioFAO-Clean – Filtered Agriculture Production Values .........................40
Comparison of Global Trends across data sets .........................................................46
Weighted World Average Trends ....................................................................47
PCE-to-FCE Scalars.........................................................................................53 Chapter 4: Discussion of Results .......................................................................................58
Comparing PCE and FCE .........................................................................................58 PCE – FCE Divergence ............................................................................................59 Proposed GDP Expenditure ‘Food’ Dataset .............................................................60

viii
GDP Expenditure ‘Food’ ..........................................................................................61 Chapter 5: Conclusion and Discussion of Further Research .............................................66
Conclusion ................................................................................................................66 Areas for Further Research .......................................................................................67
Appendices .........................................................................................................................69 Appendix I ................................................................................................................69 Appendix II ...............................................................................................................73 Appendix III ..............................................................................................................93 Appendix IV..............................................................................................................96
Bibliography ....................................................................................................................104

ix
List of Tables
Table 1 – Example Calculation of Double Counting Energy Inputs in Agriculture ..........21 Table 2 – Description of Dataset Usage for GDP Expenditure ‘Food’ Creation .............61
x
List of Figures Figure 1 – Portion of World GDP Explained by USDA Dataset 2000-2010 ....................14 Figure 2 – Portion of World GDP Explained by OECD Dataset 1961-2011 ...................15 Figure 3 – Portion of World GDP Explained by FAO Dataset 1961-2011.......................17 Figure 4 – USDA FCE Ratios for Selected Countries 2000-2010.....................................29 Figure 5 – USDA Weighted World Average FCE Ratio Growth Rate 2001-2010 ............31
Figure 6 – OECD FCE Ratios for Selected Countries 1961-2011 ....................................33 Figure 7 – OECD Weighted World Average FCE Ratio Growth Rate 1962-2011 ...........35 Figure 8 – FAO PCE Ratios for Selected Countries 1961-2011 .......................................36 Figure 9 – FAO-Clean PCE Ratios for Selected Countries 1961-2011 ............................43 Figure 10 – FAO Weighted World Average PCE Ratio Growth Rate 1962-2011 ............46
Figure 11 – Weighted World Average PCE and FCE Ratios Comparison 1961-2011 .....47
Figure 12 – Weighted Average FCE and PCE Ratios for OECD Nations 1961-2011 ......49
Figure 13 – Weighted Average FCE and PCE Ratios for Non-OECD Nations 2000-
2010...............................................................................................................51
Figure 14 – Weighted Average FCE &PCE Ratios for Non-OECD Nations 1961-2010 .52 Figure 15 – OECD and Non-OECD Countries Weighted Average PCE-to-FCE Scalar .54
Figure 16 – OECD Countries Average PCE-to-FCE Scalar by Region ...........................55 Figure 17 – Non-OECD Countries Average PCE-to-FCE Scalar by Region ...................57 Figure 18 – All Countries GDP Expenditure ‘Food’ Compared to GDP Growth ............62
Figure 19 – Selected 44 Countries Expenditure Measures Compared to GDP Growth ...64

xi
List of Equations
Equation 1 – General Form of FCE Ratio .........................................................................19 Equation 2 – General Form of Weighted World Average FCE Ratio ...............................19 Equation 3 – General Form of FCE Calculation using USDA Data ................................19 Equation 4 – General Form of FCE Calculation using OECD Data ................................20 Equation 5 – General Form of PCE Calculation ..............................................................22
Equation 6 – General Form of PCE Ratio .........................................................................22 Equation 7 – General Form of Weighted World Average PCE Ratio ...............................22 Equation 7 – PPP-Exchange Ratio Unit Cancellation ......................................................25 Equation 8 – GAP Value Conversion from Int$ to US$ ....................................................26 Equation 9 – Nominal Import and Export Value Conversion............................................26

1
Chapter 1: Introduction and Background
THESIS OUTLINE
The first chapter of this thesis focuses on the role of energy resources – with a focus
on food as a source of energy – in the global economy. It provides a survey of the evolution
of agriculture systems throughout history and the corresponding impact of agricultural
advancement has had on economic growth and general living standards for the global
population. This section also explores the literature on the relationship between energy
consumption and economic growth viewing agricultural production and food resources,
along with other natural resources, as fundamental energy inputs to societal growth and
development. In addition to providing an overview of available datasets, the second chapter
defines two expenditure-to-GDP ratios for food expenses – Primary Consumption
Expenditure (PCE) and Final Consumption Expenditure (FCE) – and outlines methods for
calculation of these ratios for a given set of countries. The third chapter discusses the results
in a series of figures comparing ratios calculated from different datasets in order to identify
patterns which guide decisions about how to use available data in further analysis. The
fourth chapter presents a new, more comprehensive dataset synthesized from the
previously examined data which is used to expand upon the previous scholarship of King
(2010 & 2014) and Maxwell (2013) examining net energy ratios (NER) and the economy.
The final chapter addresses the broader implications of the findings and describes areas for
future research in the area of net energy expenditures and economic growth.
OVERVIEW OF THESIS
According to Joseph Tainter (Tainter and Patzek, 2012, Tainter 1988, Tainter et al.,
2003), energy plays a critical role in the growth and functioning of societies. Based upon
2
analysis of pre-industrial societies, Tainter’s theory posits that as societies grow they must
inherently grow more complex. Societies organize themselves to solve social and
environmental problems, and as the system grows in size it faces new problems that require
it to increase in complexity in order to find solutions to those issues and maintain existing
services. As the complexity of a society grows, it requires more energy and resources to
maintain coordination between the different moving parts.
In this context, the work of King and Maxwell analyzed how fossil fuel and electric
energy consumption interacts with the economy in an attempt to update Tainter’s theory to
account for modern societies powered by industrial energy technologies. As will be
discussed later in this chapter, developed measures such as the Energy Intensity Ratio
(EIR) quantify energy quality, while NERs show how much of national and global gross
domestic product (GDP) is spent securing these energy resources. This work has yielded
intriguing insights into the evolution of global energy resources suggesting that the best
resources have already been exploited (Maxwell, 2013). Time series trend analysis also
points towards the existence of a possible threshold value of GDP spent on energy that may
retard future economic growth. In Tainter’s language, the social and economic systems
may be reaching a level where the energy required to maintain increased growth and
complexity outweighs the benefits of that growth.
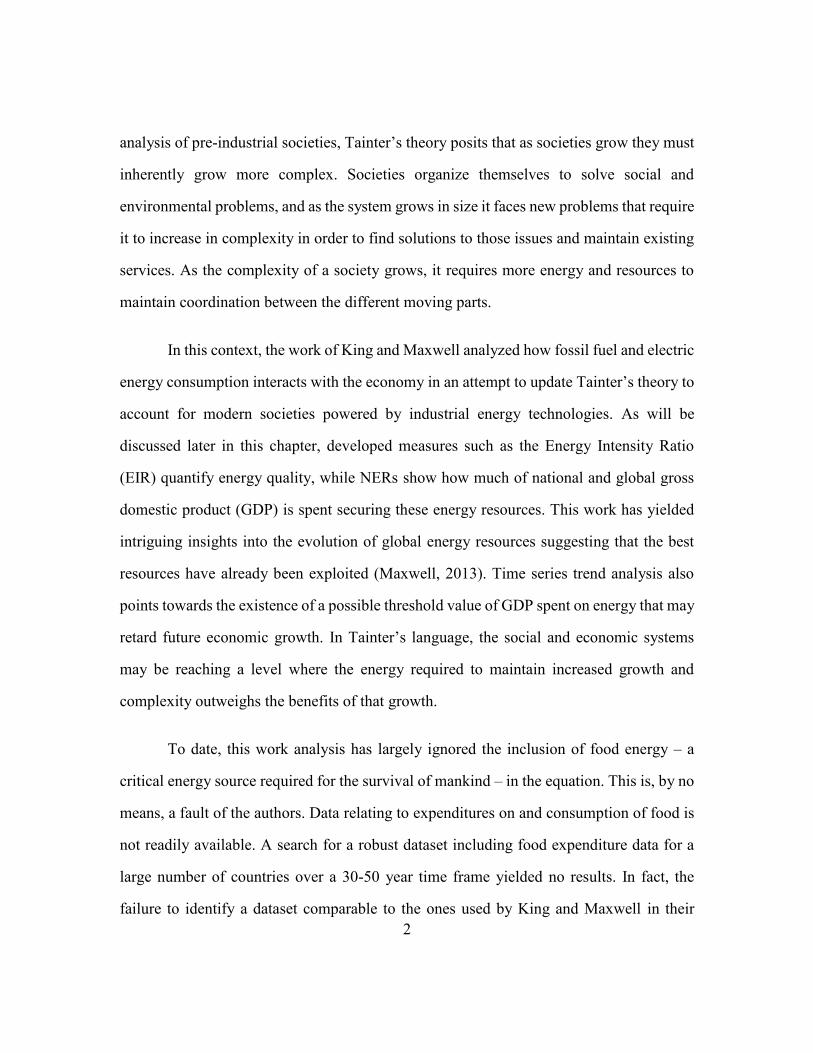
To date, this work analysis has largely ignored the inclusion of food energy – a
critical energy source required for the survival of mankind – in the equation. This is, by no
means, a fault of the authors. Data relating to expenditures on and consumption of food is
not readily available. A search for a robust dataset including food expenditure data for a
large number of countries over a 30-50 year time frame yielded no results. In fact, the
failure to identify a dataset comparable to the ones used by King and Maxwell in their
3
analysis provided the impetus for this thesis. As a complement to the work already
completed and in order to capture a more complete picture of the relationship between
energy and economic performance, this thesis seeks to survey the available data sources,
analyze similarities and differences between trends identified in each dataset, and compile
a more robust hybrid dataset. With this food expenditure dataset established, I can perform
analogous global GDP Expenditure analysis of the ‘energy + food’ system.
As will be discussed in more detail in Chapter 2, I focus on two different accounting
methods for food expenditures due to data limitations. The most intuitive measure relates
to consumption expenditures on food by the end consumer. This ‘output’ measure provides
the most accurate accounting of expenditures on food in an economy as it captures the
value of all food processing and manufacturing that occurs between the farm and the table.
This measure, however, is limited in scope as reliable data is only available for select
countries – mostly highly developed nations – over limited time spans. A second measure
of consumption accounts for the only base inputs of final consumer purchases as they come
off the farm ignoring any value added throughout the food processing system. One benefit
of this primary consumption accounting is that more data is available from a wider variety
of countries over a longer time frame, which allows for more thorough analysis the impact
of food expenditures on the global economy. I also explore the possibility of primary
consumption accounting being a superior method of tallying food expenditures due to
greater inherent stability and less exposure to consumer preferences compared to end
consumer expenditures.
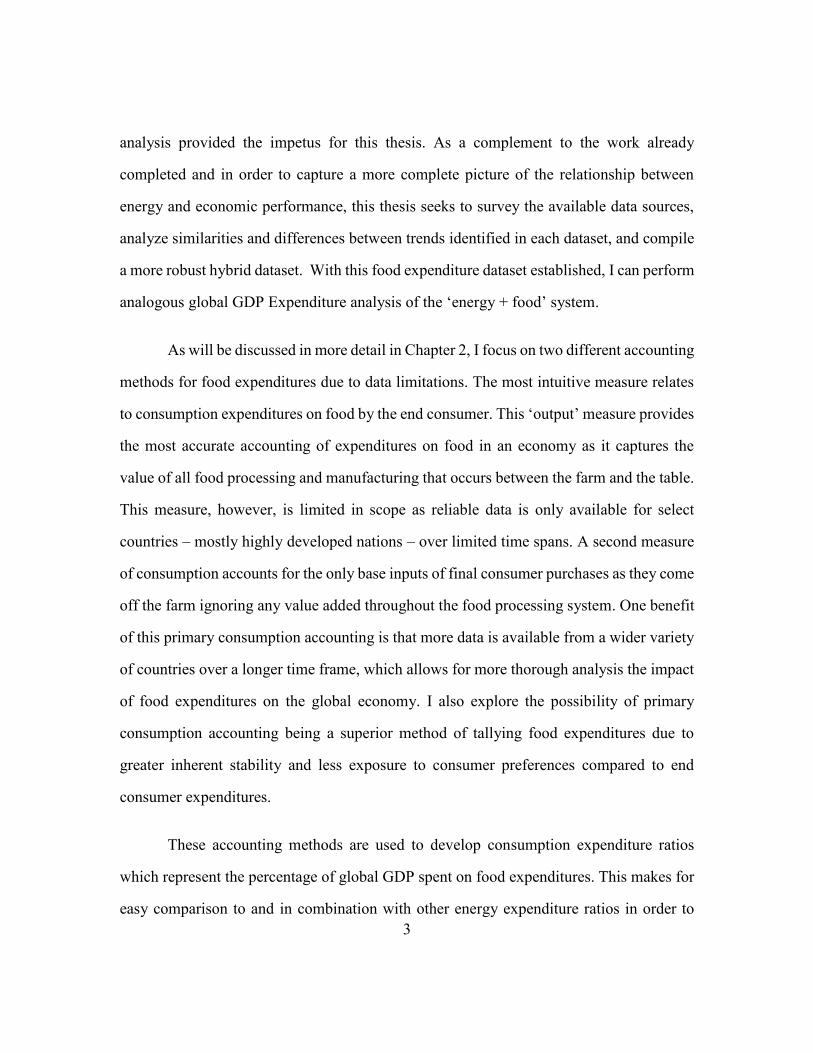
These accounting methods are used to develop consumption expenditure ratios
which represent the percentage of global GDP spent on food expenditures. This makes for
easy comparison to and in combination with other energy expenditure ratios in order to

4
better understand the impact of total ‘energy + food’ expenditures on economic activity.
As far as the author knows, this thesis represents the first attempt to compile food
expenditure data for the 178 countries studied over the time period from 1961-2011. This
large sample size and long time span are adequate to perform trend analysis and fully
compliment other energy expenditure ratio datasets.
One conclusion from this data is that primary consumption accounting measures
have limited usefulness, especially in developed nations. As national food systems
industrialize, it is harder for the end consumer to bypass individual steps along the value
adding food production chain. Additionally, analysis of food expenditure ratios alone may
not provide evidence that society has reach a threshold level of GDP spent on food that
will slow economic growth; however, data does show that the economic relationship
between food production and consumption expenditures has fundamentally changed over
the past decade. The results of using of food in the manufacturing of biofuels may
foreshadow more challenges ahead as we trade food energy for industrial energy to drive
the global economy.
ROLE OF AGRICULTURE IN SOCIAL AND ECONOMIC DEVELOPMENT
An Engine of Growth
The sun has been and will continue to be the biggest source of energy inputs into
the ecological system on the Earth. In fact, more energy reaches the surface of the Earth in
just two hours from solar radiation than is consumed globally each year (Tsao et al. 2006).
For much of the history of the Earth, the main process available to capture and store this
energy has been the process of photosynthesis in plants (Kummel, 2011). As this flow of
energy courses through the ecosystem, autotrophs (plants and algae) capture energy from

5
solar radiation converting it into biomass which is consumed by heterotrophs (animals) to
fuel their biological energy needs (Price, 1995). Other modern industrial energy sources
such as fossil fuels trace their origin back to solar energy originally captured by
photosynthesis that was slowly converted from biomass to much denser energy stores
through geologic processes.
For the majority of human history as with all heterotrophs, energy use and
consumption was limited to the biomass individuals could procure and consume as caloric
energy to fuel their somatic needs (Wrigley, 2011). All species on the Earth are subject to
allometric scaling relationships which dictate their metabolic rates and caloric energy needs
(West et al., 1997). For a species to survive, individuals must gather and consume more
new energy resources than the energy they used to procure those resources (Moses and
Brown, 2003). As humans evolved on the Earth, civilization was limited to a hunter-gather
structure where the bulk of daily activity was dedicated to procuring enough food to
survive, leaving little time for any other endeavors (Ingold et al., 1988). Starting
approximately 10,000 years ago; however, the social structure of human society underwent
a drastic change. Groups of humans in several areas across the world gradually began to
abandon the foraging lifestyle, and instead began to settle in a given location and cultivate
cereal grasses and domesticate animals for meat and milk (Lee & DeVore, 1968).
Agricultural systems first appeared in the Middle East and spread to Asia, Africa,
and Europe (Zohari, 1986). The first staple crops were primarily wheat and barley, and all
initial civilizations relied on this cereal agriculture. It took a few thousand years before
humans started to cultivate other food sources such as fruit trees, vegetables, and other
crops (Zohari, 1986). Around the same time, rice cultivation began in Asia (Stark, 1986).
In the modern world, cereal production remains the main source of food for humans,

6
accounting for two-thirds of protein and calorie intake – Western cultures in Europe and
the Americas favor slightly lower levels of cereal consumption in exchange for more meat,
sugar, and fats (Pedersen et al., 1989).
Shortly after the proliferation of cereal agriculture, the hunter-gatherer societies
began to decline (Pfeiffer, 1977). More highly organized and hierarchical societies
appeared, forming villages and cities, and allowing larger populations to live together as
coordinated units. Compared to hunter-gatherer bands of 20 related people, early
agricultural societies may have had populations ranging from 200 in villages to 10,000 in
cities (Pfeiffer, 1977). Agriculture and the resulting growth of civilization meant an end to
foraging – a time consuming activity which only focused on the short-term goal of
procuring enough food to survive. In its place, socioeconomic classes and job
specializations arose all oriented to future payoffs; “with the coming of large communities,
families no longer cultivated the land for themselves and their immediate needs alone, but
for strangers and for the future” (Pfeiffer 1977:21).
The rise of agriculture allowed humans to start planning for the future for the first
time. As humans began to produce more energy than they needed to simply survive through
agriculture and the domestication of animals, society had greater opportunities to progress.
Leisure allowed mankind to begin its quest for knowledge which led to more technological
advances leading to industrialization that has enabled human society to grow to where it is
today (Smil, 1994). Even in the modern industrial and post-industrial age, agriculture
remains the driver of economic development in late-developing countries (Johnston &
Kilby, 1975, Rosegrant, 2001). The World Bank sees agricultural development policy as
the most effective method to spur the growth in capital, work force, and technological

7
development necessary to raise non-developed nations out of poverty and into the modern
economy (World Bank, 2008).
A Limit to Growth
Despite the importance of agriculture to historic social development and economic
growth, it also possesses the ability to be the downfall of society. As growing populations
depend on an ever more productive agricultural system, any stagnation of productivity
growth may lead to food shortages and starvation. This potential was most famously
discussed in Malthus, 1978 when Thomas Malthus noted that the “increase of population
is necessarily limited by the means of subsistence.” Malthus warned of potential economic
and population collapse in the British Isles due to exponential population growth
outstripping linear growth in food production. Subsequent famines did kill millions, but
complete collapse was averted due to advances in agricultural technologies and population
emigration to distant colonies (Boserup, 1981).
More recently, so-called Malthusians predicted another population and economic
collapse in the 1960’s and 1970s. While outbreaks of famine and disease did occur around
the world, advances in agriculture, medicine, technology, and commerce once again pushed
back the limits to growth. (Bongaarts, 2009). Most notably, the Green Revolution
drastically increased agricultural productivity around the world thanks to advances in
hybrid seed production, fertilizer and pesticide use, irrigation development, and
monoculture specialization of farming (Wilkes & Wilkes, 1972). Combined with economic
globalization over the past four decades, these advances have enabled the human
population to more than double since 1960 (Bongaarts, 2009).
8
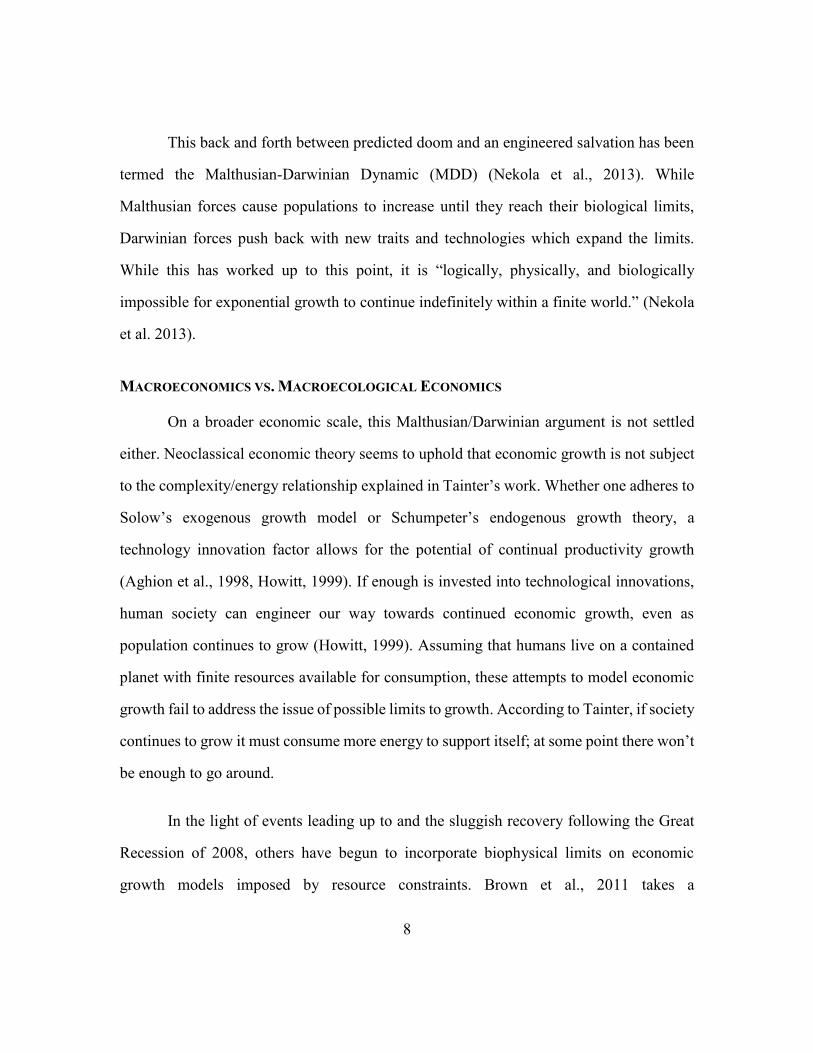
This back and forth between predicted doom and an engineered salvation has been
termed the Malthusian-Darwinian Dynamic (MDD) (Nekola et al., 2013). While
Malthusian forces cause populations to increase until they reach their biological limits,
Darwinian forces push back with new traits and technologies which expand the limits.
While this has worked up to this point, it is “logically, physically, and biologically
impossible for exponential growth to continue indefinitely within a finite world.” (Nekola
et al. 2013).
MACROECONOMICS VS. MACROECOLOGICAL ECONOMICS
On a broader economic scale, this Malthusian/Darwinian argument is not settled
either. Neoclassical economic theory seems to uphold that economic growth is not subject
to the complexity/energy relationship explained in Tainter’s work. Whether one adheres to
Solow’s exogenous growth model or Schumpeter’s endogenous growth theory, a
technology innovation factor allows for the potential of continual productivity growth
(Aghion et al., 1998, Howitt, 1999). If enough is invested into technological innovations,
human society can engineer our way towards continued economic growth, even as
population continues to grow (Howitt, 1999). Assuming that humans live on a contained
planet with finite resources available for consumption, these attempts to model economic
growth fail to address the issue of possible limits to growth. According to Tainter, if society
continues to grow it must consume more energy to support itself; at some point there won’t
be enough to go around.
In the light of events leading up to and the sluggish recovery following the Great
Recession of 2008, others have begun to incorporate biophysical limits on economic
growth models imposed by resource constraints. Brown et al., 2011 takes a

9
marcoecological approach to economic modeling integrating perspectives from physics
and ecology to show that energy resources impose “fundamental constraints on economic
growth and development.” As human population and the global economy has grown
exponentially, data demonstrates a positive correlation between per capita energy use and
per capita gross domestic product (GDP) measures. This scaling relationship points
towards the need for consumption of large amounts of new energy resources to continue to
fuel this growth in the future.
Advancing these findings, Brown et al., 2013 goes one step further claiming that
our current economic paradigm is “no longer compatible with the biophysical limits of the
finite Earth.” Resource scarcity is as much to blame for the failed or stagnating recover
from the Great Recession as are failed fiscal and monetary policies. Analysis reveals that
per capita energy use scales at approximately ¾ power of per capita GDP across and within
nations. As Brown notes, this scaling is almost identical to the ¾ power scaling of
metabolic rates with body mass in mammals first identified by Max Kleiber. It turns out
that Kleiber’s law may shed more quantitative light on the energy requirements of
maintaining social and economic systems. In this light, long-term trends showing
decreasing per capita consumption off life critical resources may not be signs of increased
efficiency in the global economy. Instead they may be warning signs of a growing
population and economy bubble.
Until now, both sides have been correct: some populations have crashed and
cultures have vanished, but our species has been able to endure thanks to behavioral
changes and technological advances which have kept these events localized and not global
(Nekola, 2013). These same behavioral changes and technological innovations – especially
over the last century – have now created an intricately interconnected global society subject
10
to global – not local – scale constraints. In essence, the advances that have saved us in the
past may have painted us into a corner moving forward.
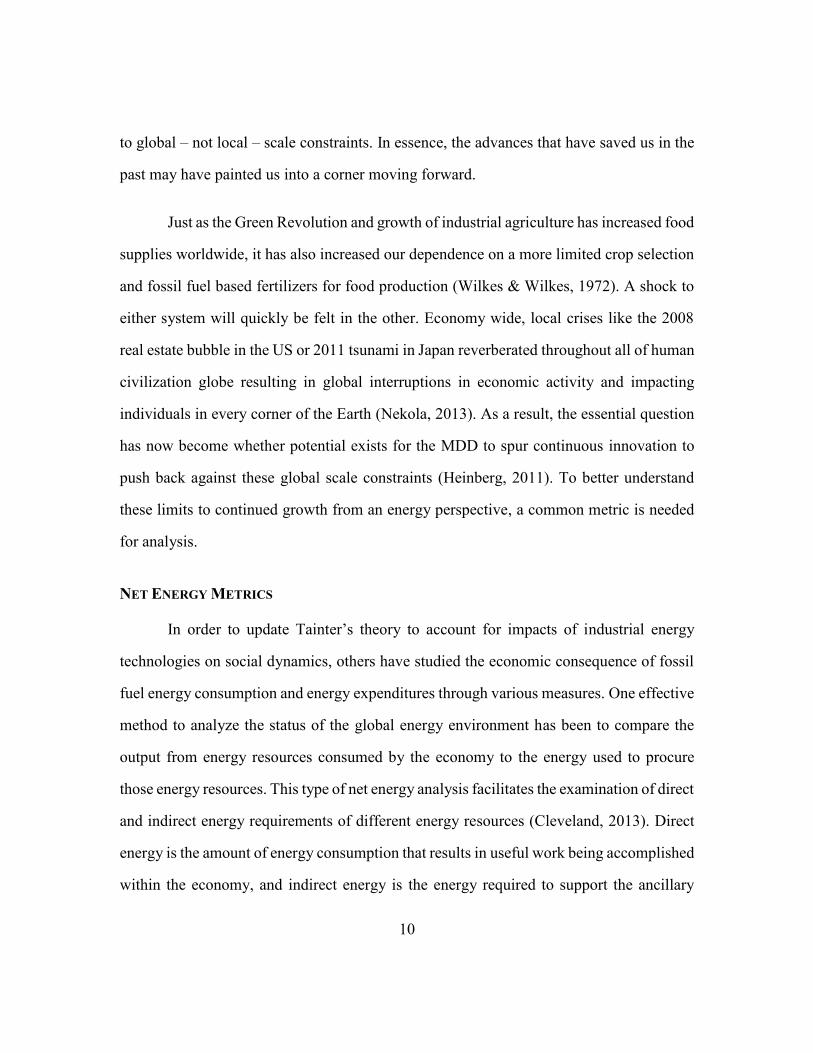
Just as the Green Revolution and growth of industrial agriculture has increased food
supplies worldwide, it has also increased our dependence on a more limited crop selection
and fossil fuel based fertilizers for food production (Wilkes & Wilkes, 1972). A shock to
either system will quickly be felt in the other. Economy wide, local crises like the 2008
real estate bubble in the US or 2011 tsunami in Japan reverberated throughout all of human
civilization globe resulting in global interruptions in economic activity and impacting
individuals in every corner of the Earth (Nekola, 2013). As a result, the essential question
has now become whether potential exists for the MDD to spur continuous innovation to
push back against these global scale constraints (Heinberg, 2011). To better understand
these limits to continued growth from an energy perspective, a common metric is needed
for analysis.
NET ENERGY METRICS
In order to update Tainter’s theory to account for impacts of industrial energy
technologies on social dynamics, others have studied the economic consequence of fossil
fuel energy consumption and energy expenditures through various measures. One effective
method to analyze the status of the global energy environment has been to compare the
output from energy resources consumed by the economy to the energy used to procure
those energy resources. This type of net energy analysis facilitates the examination of direct
and indirect energy requirements of different energy resources (Cleveland, 2013). Direct
energy is the amount of energy consumption that results in useful work being accomplished
within the economy, and indirect energy is the energy required to support the ancillary
11
processes within the energy production services. This type of analysis is used to look at the
way in which different types of energy technologies can perform “useful work” or provide
an increase in relative utility to the user, within a society. Cleveland, 1992 framed a
definition of a metric for net energy analysis as the Energy Return on Energy Invested
(EROI) which is defined as the ratio of energy yielded from a developed energy store to
the energy expended to develop that store.
To date, EROI has remained the conventional measure for net energy analysis and
allows for the comparison of relative utilities of different energy resources to the end user.
Examined from this angle, EROI can be used as a measure of energy quality relating the
economic usefulness of different fuels and electricity. In an economic context; however,
EROI fails to adequately incorporate the laws of supply and demand and the effects of
price signals on fuel choices. King 2010, established EIR – defined as the relative energy
intensity of a fuel to the energy intensity of the overall economy in a given country – as a
reliable proxy for EROI. Additionally, EIR provides a richer interpretation of the role of
energy in the economy. The EIR can be computed in two ways using the unit price of the
energy type or using the annual total expenditures on that fuel type. The latter expenditure
based approach allows for further analysis of global economic productivity dedicated to
energy production through examination of the percentage of global GDP spent on energy
(Maxwell, 2013).
Expanding off King 2010, Maxwell 2013 compiled EIR measures for 44 countries
over the time period of 1978-2010. Through his analysis, Maxwell performed a trend
analysis comparing the percentage of GDP spent on energy in a given year globally to the
year-over-year growth rate in global GDP measures. His analysis provides quantitative
evidence of potential “threshold” values for energy expenditures which have the potential
12
to slow or reverse economic growth. As outlined earlier in this chapter, this thesis hopes to
build a robust dataset of global food expenditure values. Coupled with the energy
expenditure values compiled in Maxwell 2013, this will allow for analysis of global and
national NER trends in the ‘energy + food’ system. This analysis will provide a more
complete understanding of any potential limits to economic growth imposed by global
energy resources. Additionally, this analysis may provide insight into new linkages
between the energy and agricultural sectors which may result in greater economic volatility
in the future.

13
Chapter 2: Methodology
DESCRIPTION OF DATA SOURCES
USDA - Consumption Expenditure on Food Consumed at Home
Perhaps the most detailed and exact data set available on final consumption
expenditure on food and non-alcoholic beverages was compiled by Birgit Meade in the
Economic Research Service at the United States Department of Agriculture (USDA). Table
97—Percent of Household Final Consumption Expenditures Spent on Food, Alcoholic
Beverages, and Tobacco that were Consumed at Home, presents per capita expenditure
values in US$ for food consumed at home for the 84 countries listed in Appendix I from
2000-2010. As mentioned previously, my analysis only examines spending on food and
non-alcoholic beverages consumed at home. As shown in Figure 1, this dataset explains
over 97.5% of global GDP during the 2000-2010 time frame. This data was compiled from
publically available USDA data as well as private EUROMONITOR data.

14
Figure 1 – Portion of World GDP Explained by USDA Dataset 2000-2010
While this data presents the most accurate accounting for actual expenditure on
food consumed at home, reliance on private data sources makes it difficult to duplicate and
the short time series length limited my ability to perform substantive trend analysis. Despite
these limitations, I was able to use this data set to validate or refute some of the findings
from my analysis of more robust data sets described below.
OECD - National Accounts Expenditure on Food and Non-Alcoholic Beverages
A second useful data set for final expenditures on food comes from the
Organization for Economic Cooperation and Development (OECD). The OECD National
Accounts Table 5. Final Consumption Expenditures of Households database had
expenditure values for Food and Non-Alcoholic Beverages, Restaurants and Hotels, and
Alcoholic Beverages, Tobacco, and Narcotics. In order to best match the data available
from the USDA to enable a fairer comparison on the different data sets, I restricted my data

15
set to the Food and Non-Alcoholic Beverages category. This data was presented in Local
Currency Units (LCU’s).
Using OECD National Accounts data for Food and Non-Alcoholic Beverages
expenditures, I was able to obtain total annual expenditure values for 34 countries with
time series length varying from 3 years to 53 years – with an average of 25 years - as
highlighted in Appendix I. As can be seen in Figure 2, the OECD dataset explains a
significantly lower percentage of global GDP when compared to the USDA dataset -
approximately 10% through the 1960’s and 50% from 1970-1990. Significant jumps occur
when new countries join the OECD in 1970 and again in the early 1990’s. Due to the
exclusion of many significant emerging markets – including the BRIC Nations – the dataset
only describes approximately 80% of global GDP since the 1990’s; rising to a high of 83%
in 2004 followed by a downward trend since 2005.
Figure 2 – Portion of World GDP Explained by OECD Dataset 1961-2011
16
While this data presents an accurate accounting for actual expenditure on food
consumed at home for a longer average time series than the USDA data, it focuses on a
smaller, less varied subset of countries. The countries highlighted in this data set are the
most highly developed countries in the world. Sole reliance on this data would ignore
trends present in less developed countries of the world. Despite these limitations, I used
this data set as another validation tool.
FAO - Agriculture Production Values
The primary data source for this work was acquired from the Statistics Division of
the United Nations Food and Agriculture Organization (FAO). Using the FAOSTAT
Agricultural Production and Trade databases, I was able to obtain the value of domestic
food stuffs production for a total of 178 countries listed in Appendix I. These values are
reported at “farm gate”, meaning it accounted for what farmers were paid for their
production. The data also accounted for the value of agricultural imports and exports
enabling me to derive a net value of agricultural consumption for each country. The FAO
dataset was the most robust of the three available with an average time series length per
country of 40 years.
As can be seen in Figure 3, the FAO dataset explains largest percentage of global
GDP when compared to the other available datasets. From the 1960’s through the late
1980’s, the FAO dataset explains over 98% of global GDP. A significant dip occurs
between 1989 and 1991 which is associated with the fall of the Soviet Union. GDP
measures for many of the Soviet Republics states that declared independence begin in
1990, while the FAO database does not include data for those states until 1992. Following

17
the fall of the Soviet Union, global GDP explained by the FAO dataset returns above 98%
rising to over 99% through the 2000’s.
Figure 3 – Portion of World GDP Explained by FAO Dataset 1961-2011
Compared to the other available data sets, the FAO data set proved the most robust.
Both the USDA and OECD data sets had more limited country lists and time series length.
While I used both of these data sets to put the FAO data set in proper context, I relied solely
on the FAO data set for more involved analysis relating food expenditures to social
development metrics due to the i) breadth of country list, ii) length of time series data, and
iii) the closer relationship between the FAO numbers and raw energy inputs in the economy
as described below.

18
Other Background Data
For the purpose of this analysis, I had to convert the varying expenditure measures
noted above into comparable units. In order to standardize different currencies and nominal
expenditure values in real terms to 2005 US$, I obtained data for annual Market Foreign
Exchange (FX) Rates and annual PPP Conversion Factor to Market Exchange Rate Ratios
from the World Bank World Development Index (WDI) database1. National GDP measures
were also obtained from the WDI database. Population data was obtained from the United
Nations Department of Economic and Social Affairs, Population Division2. The nominal
GDP Implicit Price Deflator pegged to 2005 US$ was obtained from the U.S. Energy
Information Administration3.
METRICS
Food Consumption – Final Consumption Expenditure Ratio
As mentioned above, the USDA and OECD offer valuable data sets tracking end-
consumer expenditure on food prepared and consumed at home in various countries. This
Final Consumption Expenditure (FCE) includes money spent at grocery stores and other
markets to buy processed or prepared food and non-alcoholic beverages as well as raw,
unprocessed produce, meat, and dairy products. Spending at restaurants and bars is
excluded. When presented as a ratio of total domestic GDP, the FCE Ratio as presented in
Equation 1, allows for analysis of the efficiency of national food systems at feeding its
populace.
1 http://databank.worldbank.org/data/views/reports/tableview.aspx# 2 http://esa.un.org/wpp/Excel-Data/population.htm 3 http://www.eia.gov/totalenergy/data/annual/showtext.cfm?t=ptb1501

19
𝐹𝐶𝐸 𝑅𝑎𝑡𝑖𝑜𝐶𝑜𝑢𝑛𝑡𝑟𝑦,𝑦𝑒𝑎𝑟 = 𝐹𝐶𝐸𝐶𝑜𝑢𝑛𝑡𝑟𝑦,𝑦𝑒𝑎𝑟
𝐺𝐷𝑃𝐶𝑜𝑢𝑛𝑡𝑟𝑦,𝑦𝑒𝑎𝑟
Equation 1 – General Form of FCE Ratio
A decreasing FCE Ratio indicates that food is becoming relatively cheaper within
a country and that, holding all else constant, a larger portion of the population can afford
to feed itself. Conversely, increasing FCE Ratios signal that food is becoming relatively
more expensive and fewer of the populace can feed itself. Taking a global viewpoint, I also
analyzed world trends by summing all available country FCE’s for a given year and
dividing that by the sum of GDP’s for the same set of countries as shown in Equation 2 to
create a weighted world average FCE Ratio.
𝐹𝐶𝐸 𝑅𝑎𝑡𝑖𝑜𝑊𝑜𝑟𝑙𝑑,𝑦𝑒𝑎𝑟 = ∑ 𝐹𝐶𝐸𝐶𝑜𝑢𝑛𝑡𝑟𝑦,𝑦𝑒𝑎𝑟
∑ 𝐺𝐷𝑃𝐶𝑜𝑢𝑛𝑡𝑟𝑦,𝑦𝑒𝑎𝑟
Equation 2 – General Form of Weighted World Average FCE Ratio
FCE – USDA
Data from the USDA presented in Table 97—Percent of Household Final
Consumption Expenditures Spent on Food, Alcoholic Beverages, and Tobacco that were
Consumed at Home provides per capita expenditures on food and non-alcoholic beverages
in nominal US Dollars (US$). Measures of FCE on food in real 2005 US$ terms were
calculated utilizing nominal per capita expenditure estimates, population estimates from
the U.N., and the Implicit Price Deflator as shown in Equation 3.
𝐹𝐶𝐸𝐶𝑜𝑢𝑛𝑡𝑟𝑦,𝑦𝑒𝑎𝑟 = 𝑃𝑒𝑟 𝐶𝑎𝑝𝑖𝑡𝑎 𝐸𝑥𝑝𝑒𝑛𝑑𝑖𝑡𝑢𝑟𝑒𝐶𝑜𝑢𝑛𝑡𝑟𝑦,𝑦𝑒𝑎𝑟 × 𝑃𝑜𝑝𝑢𝑙𝑎𝑡𝑖𝑜𝑛𝐶𝑜𝑢𝑛𝑡𝑟𝑦.𝑦𝑒𝑎𝑟
𝐼𝑚𝑝𝑙𝑖𝑐𝑖𝑡 𝑃𝑟𝑖𝑐𝑒 𝐷𝑒𝑓𝑙𝑎𝑡𝑜𝑟𝑦𝑒𝑎𝑟
Equation 3 – General Form of FCE Calculation using USDA Data
20
FCE – OECD
Data from the OECD National Accounts Table 5. Final Consumption Expenditures
of Households presents aggregated national expenditures on goods and services. The Food
and Non-Alcoholic Beverages expenditure category provides national expenditures on food
and non-alcoholic beverages in nominal LCU’s. Measures of FCE on food in real 2005
US$ terms were calculated utilizing nominal expenditure values in LCU’s, market
exchange rates from the World Bank (LCU’s/US$), and the Implicit Price Deflator as
shown in Equation 4:
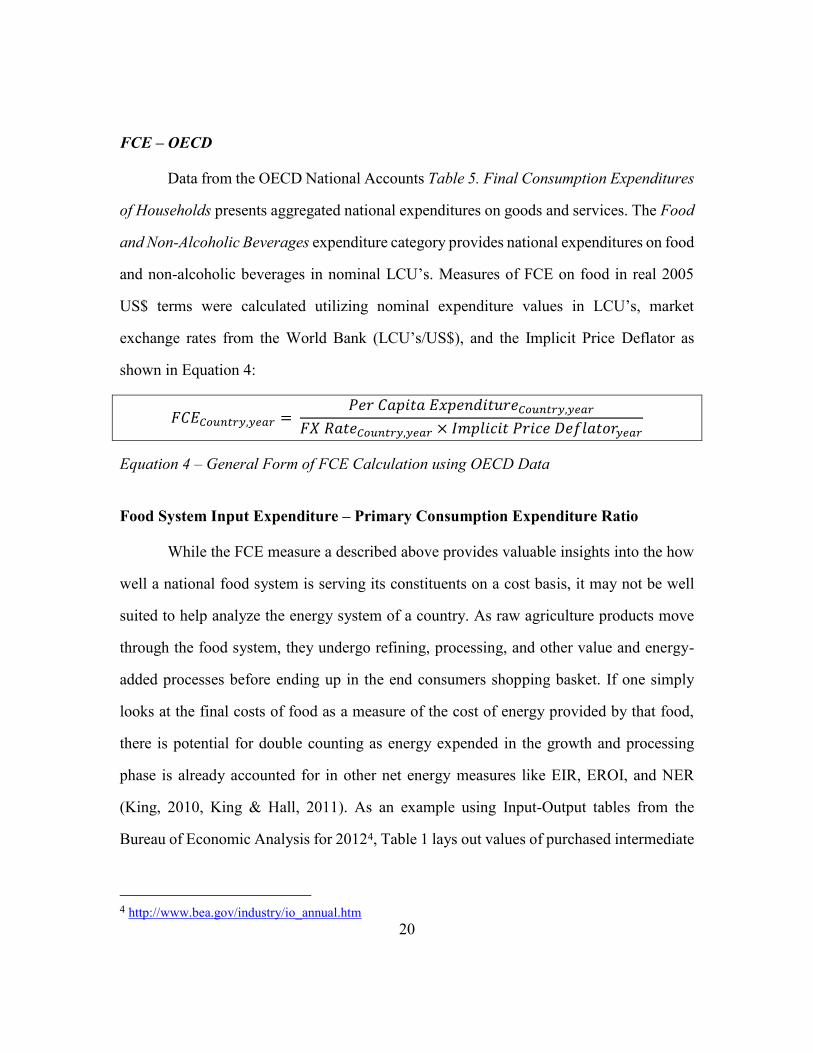
𝐹𝐶𝐸𝐶𝑜𝑢𝑛𝑡𝑟𝑦,𝑦𝑒𝑎𝑟 = 𝑃𝑒𝑟 𝐶𝑎𝑝𝑖𝑡𝑎 𝐸𝑥𝑝𝑒𝑛𝑑𝑖𝑡𝑢𝑟𝑒𝐶𝑜𝑢𝑛𝑡𝑟𝑦,𝑦𝑒𝑎𝑟
𝐹𝑋 𝑅𝑎𝑡𝑒𝐶𝑜𝑢𝑛𝑡𝑟𝑦,𝑦𝑒𝑎𝑟 × 𝐼𝑚𝑝𝑙𝑖𝑐𝑖𝑡 𝑃𝑟𝑖𝑐𝑒 𝐷𝑒𝑓𝑙𝑎𝑡𝑜𝑟𝑦𝑒𝑎𝑟
Equation 4 – General Form of FCE Calculation using OECD Data
Food System Input Expenditure – Primary Consumption Expenditure Ratio
While the FCE measure a described above provides valuable insights into the how
well a national food system is serving its constituents on a cost basis, it may not be well
suited to help analyze the energy system of a country. As raw agriculture products move
through the food system, they undergo refining, processing, and other value and energy-
added processes before ending up in the end consumers shopping basket. If one simply
looks at the final costs of food as a measure of the cost of energy provided by that food,
there is potential for double counting as energy expended in the growth and processing
phase is already accounted for in other net energy measures like EIR, EROI, and NER
(King, 2010, King & Hall, 2011). As an example using Input-Output tables from the
Bureau of Economic Analysis for 20124, Table 1 lays out values of purchased intermediate
4 http://www.bea.gov/industry/io_annual.htm

21
inputs by the farm sector in the United States as a percentage of total farm sector spending
on intermediate goods:
Commodity Code Commodity Description Percent of Total Spending
22 Utilities 1.26%
324 Petroleum and Coal Products 5.51%
325 Chemical Products 6.37%
Table 1 – Example Calculation of Double Counting Energy Inputs in Agriculture
Assuming ‘Chemical Products’ includes fertilizer made from petroleum
derivatives, we can make a conservative estimate stating that purchases of electricity, coal,
petroleum products by the farm sector was approximately 7-8% of total intermediate inputs
for food production. As a result, we would expect to overestimate food expenditures at
wholesale level by 7-8% if we added them to energy expenditures to get “food + energy”
expenditures.
Additionally, global trends in food costs may be distorted as countries develop and
consumers shift from subsistence farming and consumption of raw agricultural goods to
more industrialized agricultural systems and consumption of highly processed food
products. Using FCE poses problems for time series analysis as it may shift to capturing
costs further and further removed from the source over time. This may also lead to higher
variability in the analysis as consumers can shift their preferences and habits quickly in
response to economic conditions. When times a good, people may buy more higher-cost
pre-cooked meals or packaged food products, but if an economic downturn occurs, they
can quickly shift to consumption of cheaper staple foods like rice and beans. As a result,
FCE may fluctuate widely in response to economic conditions in response to consumer
preference.

22
As an alternative to these measures, I propose to use a measure of Primary
Consumption Expenditure (PCE). As defined below in Equation 5, PCE combines gross
agricultural production values with agricultural import and export values to account for the
net consumption of primary agricultural inputs into a national food system before
processing and refinement occurs.
𝑃𝐶𝐸𝐶𝑜𝑢𝑛𝑡𝑟𝑦,𝑦𝑒𝑎𝑟
= 𝐺𝐴𝑃 𝑉𝑎𝑙𝑢𝑒𝐶𝑜𝑢𝑛𝑡𝑟𝑦,𝑦𝑒𝑎𝑟 + 𝐼𝑚𝑝𝑜𝑟𝑡𝑠𝐶𝑜𝑢𝑛𝑡𝑟𝑦,𝑦𝑒𝑎𝑟 − 𝐸𝑥𝑝𝑜𝑟𝑡𝑠𝐶𝑜𝑢𝑛𝑡𝑟𝑦,𝑦𝑒𝑎𝑟
Equation 5 – General Form of PCE Calculation
Similar to the FCE Ratio, the PCE Ratio measures the efficiency of a national
agriculture system by comparing the value of all raw produce that feeds into the national
food system with national GDP measures. As shown below, the general and weighted-
world average PCE Ratios are calculated in the same fashion as the corresponding FCE
Ratios. A lower PCE Ratio means a country is producing (or trading for) all its raw food
needs at a relatively cheaper cost.
𝑃𝐶𝐸 𝑅𝑎𝑡𝑖𝑜𝐶𝑜𝑢𝑛𝑡𝑟𝑦,𝑦𝑒𝑎𝑟 = 𝑃𝐶𝐸𝐶𝑜𝑢𝑛𝑡𝑟𝑦,𝑦𝑒𝑎𝑟
𝐺𝐷𝑃𝐶𝑜𝑢𝑛𝑡𝑟𝑦,𝑦𝑒𝑎𝑟
Equation 6 – General Form of PCE Ratio
𝑃𝐶𝐸 𝑅𝑎𝑡𝑖𝑜𝑊𝑜𝑟𝑙𝑑,𝑦𝑒𝑎𝑟 = ∑ 𝑃𝐶𝐸𝐶𝑜𝑢𝑛𝑡𝑟𝑦,𝑦𝑒𝑎𝑟
∑ 𝐺𝐷𝑃𝐶𝑜𝑢𝑛𝑡𝑟𝑦,𝑦𝑒𝑎𝑟
Equation 7 – General Form of Weighted World Average PCE Ratio
By eliminating accounting for post-farm processing, the PCE measure eliminates
the possibility for double counting energy costs embedded in FCE measures. Additionally,
by only accounting for the value of raw agricultural consumption, the PCE measure also
eliminates variability due to consumer preferences. This may make it a better metric to
23
compare to key instability indices in an effort to understand the tipping point at which food
costs become too great for a society to bear.
In the sections below, I explain how I calculated values for each component of the
PCE using the FAO database.
Gross Agricultural Production Value
Using the FAOSTAT Agricultural Production database, I was able to obtain
estimates for the value of agricultural production in 178 countries. As noted on the FAO
website, the values reported represent gross agricultural production (GAP) values, which
were compiled by multiplying gross production measures in physical weight terms by
output prices per weight. Prices used represented the price at “farm gate” paid to farmers,
thereby eliminating double counting of energy inputs added at different processing stages
throughout the national food system.
Unfortunately, intermediate use of some products within the agricultural sector for
seed and feed purposes could not be accounted for. As a result, the GAP value measure
double counts some production reused as fodder. This double counting is minimal;
however, as production set aside as seed is used as a no-cost input to farm operations the
following year. The only double counting occurs on grain production used a food for
livestock; this is unavoidable and will overstate the PCE value.
GAP values were downloaded using the Value of Agricultural Production database
and selected Aggregated Item: Food (PIN) + (Total) Element Number: 2054. These values
account for all agriculture and livestock production going to into national food systems,
while eliminating byproducts going to different industries such as cotton and wool.

24
The FAO provides estimates for the GAP value in current and constant terms
expressed in US$ or International Dollars (Int$). To produce US$ figures for value of gross
production, the FAO converted estimates from local currencies using official exchange
rates as prevailing in the respective years. The international dollar is a hypothetical unit of
currency that has the same purchasing power parity as that of the US$.
For the purpose of comparative analysis, I chose to use data presented in constant
(2004-2006) US$ terms since this matches the USDA and OECD data sets converted to
2005 US$ as described above. Out of the 178 countries in the FAO database, 133 countries
had GAP value data expressed in 2004-2006 US$. For these countries, no additional
manipulation was needed before using these estimates to determine the first component of
the PCE measure.
For the remaining 45 countries, GAP values were only available in 2004-2005 Int$
values. Prior to calculating the PCE measure, the GAP values for these countries had to be
converted into 2004-2006 US$ values. Figures expressed in international dollars cannot be
converted to another country's currency using current market exchange rates; instead they
must be converted using the country's Purchasing Power Parity (PPP) conversion factor in
conjunction with market exchange rates.
Purchasing Power Parity theory states that exchange rates are in equilibrium when
domestic purchasing powers at the given rates of exchange are equivalent. A bundle of
goods should cost the same in one country as in another once you take the exchange rate
into account; however, foreign exchange rates often do not properly account for differing
price levels between countries. The PPP conversion factor corrects these errors and
represents the number of units of a country's currency required to buy the same amount of
25
goods and services in the domestic market as one US$ would buy in the United States. The
ratio of PPP conversion factor to market exchange rate (PPP-Exchange Ratio) is the result
obtained by dividing the PPP conversion factor by the market exchange rate. The ratio
makes it possible to compare the cost of a bundle of goods across countries. It tells how
many dollars are needed to buy a dollar's worth of goods in the country as compared to the
United States.
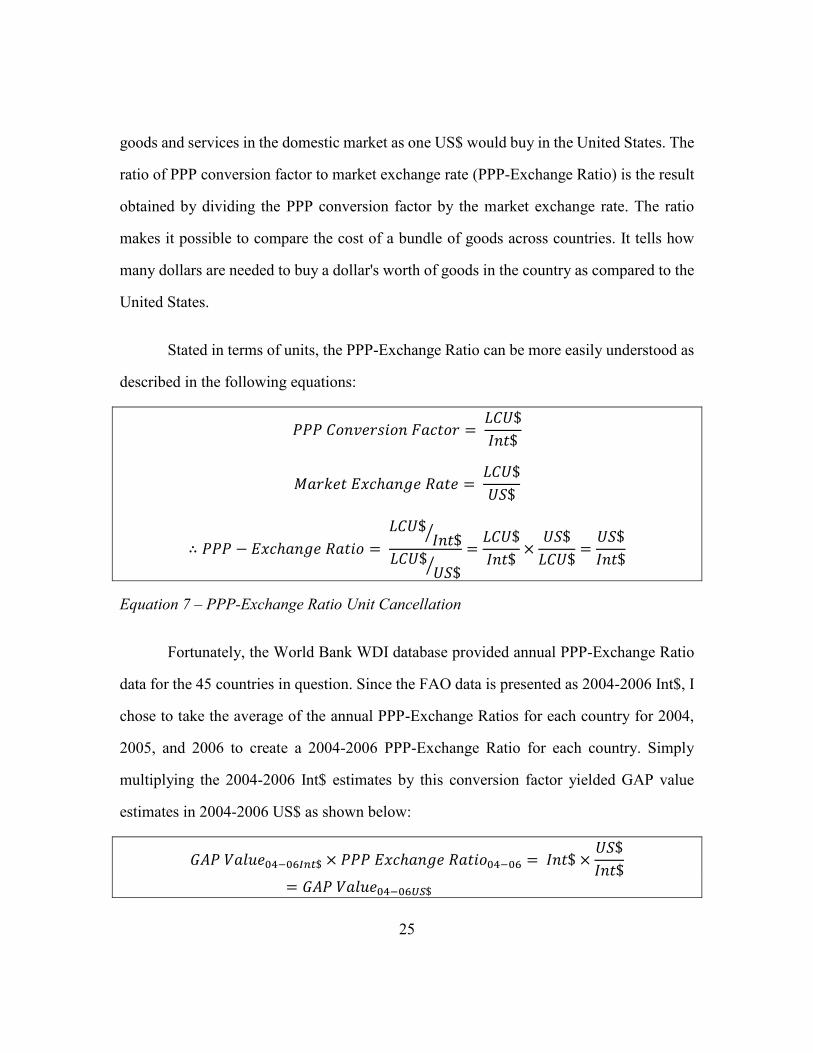
Stated in terms of units, the PPP-Exchange Ratio can be more easily understood as
described in the following equations:
𝑃𝑃𝑃 𝐶𝑜𝑛𝑣𝑒𝑟𝑠𝑖𝑜𝑛 𝐹𝑎𝑐𝑡𝑜𝑟 = 𝐿𝐶𝑈$
𝐼𝑛𝑡$
𝑀𝑎𝑟𝑘𝑒𝑡 𝐸𝑥𝑐ℎ𝑎𝑛𝑔𝑒 𝑅𝑎𝑡𝑒 = 𝐿𝐶𝑈$
𝑈𝑆$
∴ 𝑃𝑃𝑃 − 𝐸𝑥𝑐ℎ𝑎𝑛𝑔𝑒 𝑅𝑎𝑡𝑖𝑜 =
𝐿𝐶𝑈$𝐼𝑛𝑡$⁄
𝐿𝐶𝑈$𝑈𝑆$⁄
=𝐿𝐶𝑈$
𝐼𝑛𝑡$×
𝑈𝑆$
𝐿𝐶𝑈$=
𝑈𝑆$
𝐼𝑛𝑡$
Equation 7 – PPP-Exchange Ratio Unit Cancellation
Fortunately, the World Bank WDI database provided annual PPP-Exchange Ratio
data for the 45 countries in question. Since the FAO data is presented as 2004-2006 Int$, I
chose to take the average of the annual PPP-Exchange Ratios for each country for 2004,
2005, and 2006 to create a 2004-2006 PPP-Exchange Ratio for each country. Simply
multiplying the 2004-2006 Int$ estimates by this conversion factor yielded GAP value
estimates in 2004-2006 US$ as shown below:
𝐺𝐴𝑃 𝑉𝑎𝑙𝑢𝑒04−06𝐼𝑛𝑡$ × 𝑃𝑃𝑃 𝐸𝑥𝑐ℎ𝑎𝑛𝑔𝑒 𝑅𝑎𝑡𝑖𝑜04−06 = 𝐼𝑛𝑡$ ×𝑈𝑆$
𝐼𝑛𝑡$= 𝐺𝐴𝑃 𝑉𝑎𝑙𝑢𝑒04−06𝑈𝑆$
26
Equation 8 – GAP Value Conversion from Int$ to US$
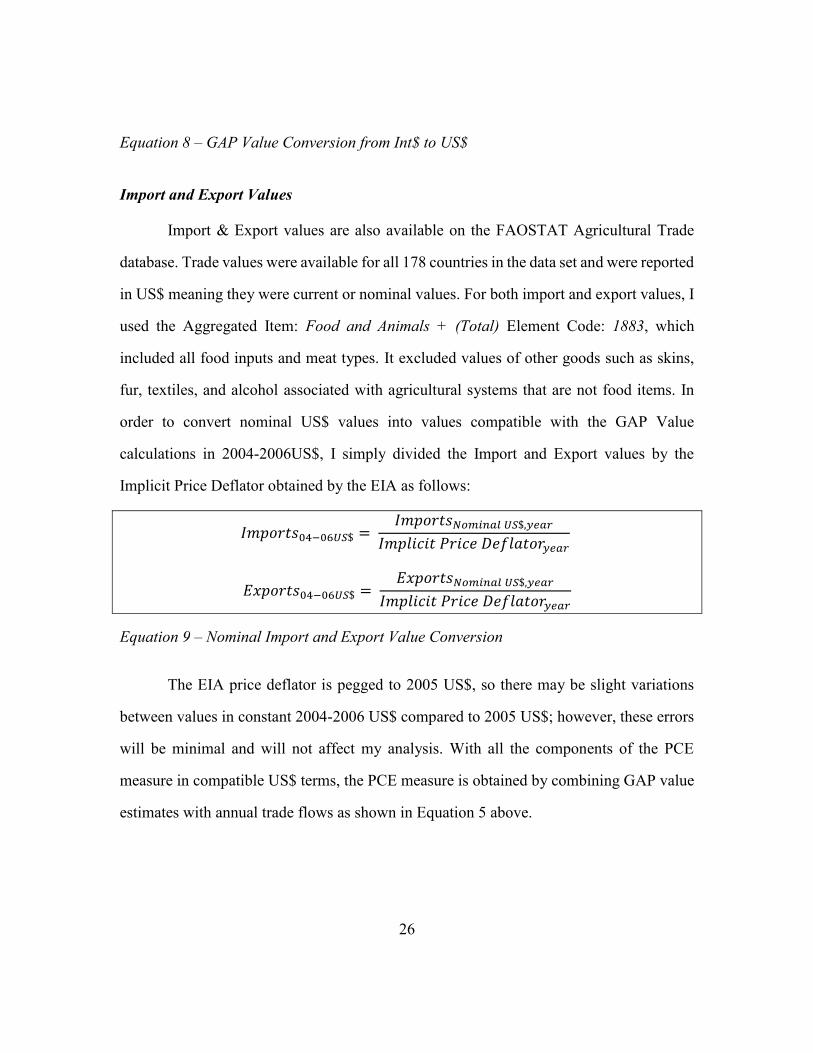
Import and Export Values
Import & Export values are also available on the FAOSTAT Agricultural Trade
database. Trade values were available for all 178 countries in the data set and were reported
in US$ meaning they were current or nominal values. For both import and export values, I
used the Aggregated Item: Food and Animals + (Total) Element Code: 1883, which
included all food inputs and meat types. It excluded values of other goods such as skins,
fur, textiles, and alcohol associated with agricultural systems that are not food items. In
order to convert nominal US$ values into values compatible with the GAP Value
calculations in 2004-2006US$, I simply divided the Import and Export values by the
Implicit Price Deflator obtained by the EIA as follows:
𝐼𝑚𝑝𝑜𝑟𝑡𝑠04−06𝑈𝑆$ = 𝐼𝑚𝑝𝑜𝑟𝑡𝑠𝑁𝑜𝑚𝑖𝑛𝑎𝑙 𝑈𝑆$,𝑦𝑒𝑎𝑟
𝐼𝑚𝑝𝑙𝑖𝑐𝑖𝑡 𝑃𝑟𝑖𝑐𝑒 𝐷𝑒𝑓𝑙𝑎𝑡𝑜𝑟𝑦𝑒𝑎𝑟
𝐸𝑥𝑝𝑜𝑟𝑡𝑠04−06𝑈𝑆$ = 𝐸𝑥𝑝𝑜𝑟𝑡𝑠𝑁𝑜𝑚𝑖𝑛𝑎𝑙 𝑈𝑆$,𝑦𝑒𝑎𝑟
𝐼𝑚𝑝𝑙𝑖𝑐𝑖𝑡 𝑃𝑟𝑖𝑐𝑒 𝐷𝑒𝑓𝑙𝑎𝑡𝑜𝑟𝑦𝑒𝑎𝑟
Equation 9 – Nominal Import and Export Value Conversion
The EIA price deflator is pegged to 2005 US$, so there may be slight variations
between values in constant 2004-2006 US$ compared to 2005 US$; however, these errors
will be minimal and will not affect my analysis. With all the components of the PCE
measure in compatible US$ terms, the PCE measure is obtained by combining GAP value
estimates with annual trade flows as shown in Equation 5 above.
27
In later sections, I also calculate the PCE Ratio at per capita and quintile levels to
explore how key instability measures do or do not correlate better to these metrics as an
explanation for historical societal upheavals witnessed in decades past.
Data Limitations and Assumptions
There are several limitations in the data related to the method in which data are
collected and the transparency of background data available for manipulation. First, both
the USDA and OECD dataset simply report final expenditure values. There is no
background data available to better understand the components of each final expenditure
value. This information would be valuable to analyze the relationships between different
components of the FCE value and PCE values.
Additionally, there are several limitations to the FAO data with how price and
expenditure data are collected. Specifically, the FAO relies on national governments to
report their production values and prices; however, local food policies often distort prices
compared to global market prices. Also, in less developed nations, most food is produced
and consumed from subsistence farming and bartering. It is notoriously hard to accurately
estimate the values with such activities. These limitations are discussed in more detail in
Chapter 3.

28
Chapter 3: Results and Interpretation
The results and data presented in this section correspond to stepwise analysis
conducted as follows. First, I analyze time series trends for FCE and PCE Ratios exhibited
by each dataset individually, and discuss sources of potential distortion in the PCE Ratio
measures. For each measure, there will be a chart which will highlight the weighted world
average, the highest and lowest extreme values, and various other findings of note. A
second chart will show the growth rate for the weighted world average of each dataset in
an attempt to analyze the volatility of the different expenditure measures. Corresponding
data tables with annual country values can be found in Appendix II. Second, I compare
FCE and PCE Ratio measures to validate the significance of the PCE Ratio. I analyze
divergences between the weighted world average for each measure, as well as PCE to FCE
multiples for different regions of the world.
Both FCE and PCE ratios take the following subscript notation procedures for
reference purposes: the first term will be FCE or PCE depending on the measure being
discussed; the source will be noted as the first subscript element (USDA, OECD, or FAO);
country identification will follow using conventional country code abbreviations (the
“World” tag will correspond to the weighted world average); finally, the year will be the
last subscript element if it is necessary to identify for purposes of discussion. For example,
the weighted world average FCE value calculated from the USDA dataset for 2000 would
be referenced as: FCE RatioUSDA,World,2000
.
TIME SERIES TRENDS OF ALL DATA SETS
The first step in my analysis entailed calculating FCE and PCE Ratios using the
available datasets and analyzing noticeable trends in the time series data. Analysis focused

29
on global trends in the weighted world average measures, as well as, localized trends in
selected countries as described below.
FCE RatioUSDA - Consumption Expenditure on Food Consumed at Home
As shown in Figure 4, the weighted world average FCE Ratio for the USDA dataset
decreased from 2000 until 2002 before starting to steadily rise for the remainder of the
decade. The FCE RatioUSDA,World bottomed out at 7.25% in 2002 before rebounding the rest
of the decade and ending at a peak of 9.42% in 2010. This trend is consistent with recent
price and spending escalations noted in the literature (Mitchell, 2008). All annual country
FCE RatioUSDA
values are presented in Table 4 in Appendix II.
Figure 4 – USDA FCE Ratios for Selected Countries 2000-2010

30
The majority of national trends follow a similar trajectory showing lower, stable to
slightly decreasing, FCE Ratios in the early 2000’s that steadily rise after 2002 to peak
values by 2010. The lowest FCE Ratio belongs to Qatar (1.26% in 2001) which has the
lowest FCE Ratio of all nations over the entire dataset due to relatively high GDP
associated with oil exports. The highest FCE Ratio occurred in 2004 when Turkmenistan
hit a peak of 60.22%. The final FCE Ratio distribution is more dispersed and more heavily
skewed upward in 2010 compared to 2000. These trends and driven by steadily increasing
per capita food expenditures coupled with slower GDP growth rates over the same period.
There are a few notable exceptions as noted below:
Turkmenistan stands out and as it follows a reverse trend starting with relatively
low FCE Ratios in the early 2000’s before peaking in 2004 and decreasing to
previous levels by 2010 – this trend was driven by a surge in food expenditures
from 2003-2006 due to limited irrigation water supplies subsequently alleviated by
the construction of the Dostluk dam (FAO 2012);
Bahrain bucks the global trend and exhibits a decreasing FCE Ratio driven by
decreasing food expenditures;
India also has a decreasing FCE Ratio; however, this is a result of strong GDP
growth which outpaces increasing food expenditures;
Georgia and Egypt see the strongest U-shaped trends and both begin and end with
the highest FCE Ratios of all countries in the dataset – Egypt’s FCE Ratio is driven
by falling, then rising food expenditures, while Georgia’s is driven by steadily
increasing food expenditures coupled with strong GDP growth followed by
stagnation.

31
The year-over-year growth rate for the FCE RatioUSDA,World is shown in Figure 5.
While the world average appears relatively stable with a range of 2.17% from 7.25% to
9.42%, the growth rate is much more volatile. With a range of 13.11% from -4.12% to
8.99% and a variance of 0.00177, the FCE RatioUSDA,World growth rate responds strongly to
global economic conditions. A strong negative growth rate in 2001 (-4.12%) shows that
global FCE measures contracted more than global GDP measures. As the economy
recovered, the growth rate surged above 6% from 2002-2003 and again above 8% from
2006-2008 as global FCE expenditure growth outpaced GDP growth.
Figure 5 – USDA Weighted World Average FCE Ratio Growth Rate 2001-2010

32
FCE RatioOECD – National Accounts Expenditure on Food and Non-Alcoholic
Beverages
As shown in Figure 6, the weighted world average FCE Ratio for the OECD dataset
shows a general decreasing trend from 1961 until the early 2000’s before beginning to
follow a growth trajectory mirroring that shown in the USDA dataset. The FCE
RatioOECD,World peaked 1963 at 7.90% before bottoming out at 5.61% in 2001 before
rebounding the rest of the decade and ending close to its peak at 7.68% in 2011. Big
increases in the FCE RatioOECD,World are noted from 1969-1970 and 1993-1995. These
increases are the result of new, less developed nations joining the OECD during those time
periods; less developed nations generally a greater percentage of national income on food
compared to more developed nations (Mitchell, 2008). These jumps represent short-term
adjustments due to expansion of the OECD dataset, and do not signify meaningful changes
in time series trend analysis. All annual country FCE RatioOECD
values are presented in
Table 5 in Appendix II.

33
Figure 6 – OECD FCE Ratios for Selected Countries 1961-2011
Similar to the USDA dataset, the majority of national trends follow a similar
trajectory as the weighted world average, showing a general decreasing trend up until the
early 2000’s before expenditures increase and become more widely distributed and
generally reaching peak values in 2011. Due to the longer time series, national FCE values
vary significantly more than in the USDA dataset. The lowest FCE Ratio belongs to
Luxembourg (3.13% in 2001) which had the lowest FCE Ratios of all countries during the
2000’s. The highest FCE Ratios belong to the Russian Federation which reached 25.82%
in 2011 and Turkey which reached 23.49% in 2010. These trends and driven by higher
GDP growth relative to food expenditures up until the 2000’s. Trends post 2000 are driven
by the same steadily increasing food expenditures coupled with slower GDP growth rates
that drive the trends seen in the USDA data. There are a few noteworthy exceptions as
discussed below:

34
Italy started with the next-to-lowest FCE Ratio of 3.78% in 1972, but experienced
a steadily increasing, rather than decreasing, FCE Ratio from the 1970s until the
beginning of the 2000’s before beginning to mimic global trends for the remainder
of the 2000’s;
The Russian Federation and Turkey exhibit the significantly higher FCE Ratio
growth rates compared to other countries since 2000 – Russian growth is driven
mostly by exploding food expenditures while Turkey’s growth is due more to
slower GDP growth relative to food expenditures;
South Africa has had a consistently elevated FCE Ratio that has experienced two
periods of significant reduction from 1985-1986 and 2000-2003; these reductions
have occurred with only moderate GDP growth due to periods of significant food
expenditure reductions.
South Korea has experienced the most significant FCE Ratio reductions sustained
through 2011 since peaking in 1979 – steadily increasing food prices and
expenditures have been overpowered by more significant GDP growth;
Iceland has also experienced sustained FCE Ratio reductions from 1990 through
2010 due to a general trend of stable to falling food expenditures coupled with GDP
growth.
The year-over-year growth rate for the FCE RatioOECD,World is shown in Figure 7.
Similar to the USDA dataset, the world average FCE Ratio appears relatively stable with a
range of 2.28% from 5.61% to 7.90%, the growth rate is much more volatile. As mentioned
previously, big jumps occur between 1969-1970 and 1993-1995 in response to addition of
data from less developed countries. Excluding those anomalous years, the growth rate for
the FCE RatioOECD,World has a range of 19.09% from -7.03% to 12.06% and a variance of
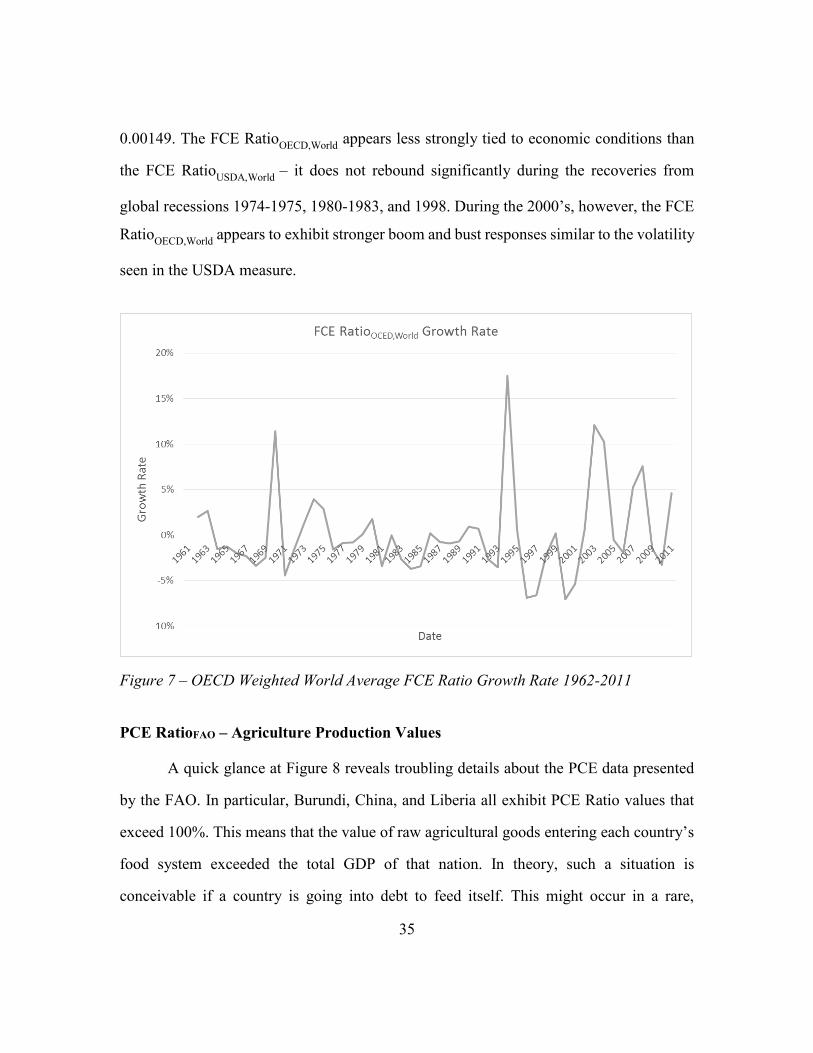
35
0.00149. The FCE RatioOECD,World appears less strongly tied to economic conditions than
the FCE RatioUSDA,World
– it does not rebound significantly during the recoveries from
global recessions 1974-1975, 1980-1983, and 1998. During the 2000’s, however, the FCE
RatioOECD,World
appears to exhibit stronger boom and bust responses similar to the volatility
seen in the USDA measure.
Figure 7 – OECD Weighted World Average FCE Ratio Growth Rate 1962-2011
PCE RatioFAO – Agriculture Production Values
A quick glance at Figure 8 reveals troubling details about the PCE data presented
by the FAO. In particular, Burundi, China, and Liberia all exhibit PCE Ratio values that
exceed 100%. This means that the value of raw agricultural goods entering each country’s
food system exceeded the total GDP of that nation. In theory, such a situation is
conceivable if a country is going into debt to feed itself. This might occur in a rare,

36
catastrophic situation such as a nationwide drought or a blight induced crop failure, PCE
Ratios over 100% could not be sustained for more than a year or two at a time. According
to the FAO data analyzed, Burundi’s PCE Ratio never dips below 100% and is as high as
232% in 1961. Additionally, China and Liberia suffer almost a decade each with PCE Ratio
values over 100%.
Figure 8 – FAO PCE Ratios for Selected Countries 1961-2011
More troubling is a larger number of negative PCE Ratio values exhibited by
several countries. This indicates that some lucky countries are basically getting paid to eat.
Of note, Guyana’s PCE Ratio bottoms out at -73.91% in 1975 and never registers as
positive. Additionally, there is a surge of PCE Ratio values going negative throughout the
1970’s and 1980’s. Referring back to Equation 5, the PCE value for a country is equal to
Agricultural Production + Food Imports – Food Exports. Given that all countries in the

37
FAO dataset have positive GAP values, the only way a country can have a negative PCE
Ratio is if it exports more food product value than its agricultural system produces and
consumes within a year. Again, this can conceivably happen if a country has large
stockpiles from previous years that it exports all at once. Much like PCE Ratios over 100%,
a negative value could only be short lived as stockpiles would quickly be depleted. This is
more unlikely though since most of the countries with negative PCE Ratio values are
underdeveloped countries where storage of agricultural goods is notoriously difficult
leading to excessive waste (Parfitt et al., 2010). All raw annual country PCE RatioFAO
values including all error values are presented in Table 6 in Appendix II.
When initially faced with these anomalous values, several potential sources of error
came to mind. The first quick check was whether the FAO import and export data included
non-food items. For example, if plant derived bio-fuels were included in export values, big
bio-fuel export values could potentially dwarf agricultural production values leading to a
negative PCE Ratio. This, however, would only be theoretically possible in the past decade
or two as bio-fuel production has grown. Closer examination of the components counted
in the import and export data verified that non-food item values were not included.
A similar consideration was examined next. While only food items were included
in the FAO import and export values, it’s important to consider the accounting for value-
added processing that might be associated with imported and exported goods. Are imports
and exports accounted for in raw agricultural input terms or in finished product terms? For
example, if a country only grew cocoa beans and exported expensive refined chocolate
bars, the value of exports would surpass its agricultural production assuming the FAO
valued the exports as chocolate bars and not the cocoa beans that went into them.

38
Component food category lists for FAO GAP and Import and Export values match and do
not include processed/value-added categories in the Import and Export data.
A more plausible explanation presents itself when one considers what prices the
FAO uses in the calculations for GAP, Import, and Export values. As stated on earlier in
this report, the FAO uses prices “at farm-gate” when valuing agricultural production. This
means the GAP value is calculated using national prices. If import and export values are
calculated using international market prices these would most likely differ significantly
from the local prices used to calculate production values, especially for heavily
commoditized agricultural products. After reviewing the FAO Food Balance Sheet
Handbook5, information explicitly citing what prices are used to calculate import and
export values could not be found. Attempts to contact the FAO for clarification on their
calculation methods have not yielded conclusive information. It is noted, however, that
significant trade may go unrecorded across national boundaries, and that exports have the
greatest potential to be under reported since custom administrations focus the majority of
their attention on imports since they are subject to taxes and quantitative controls.
A further literature review revealed a few other potential sources of error in the
FAO datasets. As noted in the FAO Food Balance Sheet Handbook, the sources and
accuracy of basic information used to compile the FAO data present come conceptual
problems. First, production and manufacturing survey may not be conducted regularly in
certain countries, especially less developed nations. Even if the surveys are conducted
regularly, they may only cover a certain portion agricultural products limited to major
commercialized food crops. This makes determining appropriate prices for national
5 ftp://ftp.fao.org/docrep/fao/011/x9892e/x9892e00.pdf

39
agriculture production value calculations very difficult, especially since survey data may
not be granular enough to pick up regional price differences within a country.
Additionally, agricultural production may be under underestimated in a number of
countries while it’s overestimated in others for several reasons. Specifically, agricultural
pricing policies enacted by developing countries are often mirror images of those employed
in developed nations (Bale & Lutz, 1980). Heavy taxation of the agricultural sector in
developing countries distorts reported production downward, while heavy subsidies and
price protection may inflate production reports in developed nations (Anderson &
Swinnen, 2008) & (Anderson & Masters, 2009).
Regardless of policy choices, the poorest countries also face problems associated
with estimating production from subsistence farming. Especially in poor countries, there is
a large amount of subsistence farming, and as pointed out by Mosher (2008) and Wharton
(2008), subsistence farmers are defined as those that sell anywhere between 0-50% of their
farm production on the open market. Given that farmers can progress or regress along this
scale from year to year, it is immensely difficult to accurately extrapolate values of food
production for household consumption. After review of the FAO Food Balance Sheet
Handbook, I could not determine if subsistence farming was included in the values reported
by the FAO. As stated previously, the FAO relied on each country to report their own
estimates individually, and I did not find a definition from the FAO that excluded estimates
for subsistence values. While subsistence farming values are not a significant source of
error in developed nations, given the relatively high FAO PCE value estimates for the least
developed (the most subsistence based) countries, I assume subsistence production value
estimates are included for some countries. Unfortunately I cannot identify which countries
include subsistence values and which ones do not.
40
As noted above, a substantial portion of the negative PCE Ratio values occur in the
1970’s and 1980’s. As discussed in Johnson (1975), this time period saw many national
governments institute agricultural commodity pricing policies in order to try to control
price volatility. This included both trade tariffs and direct price controls. These policies
distort prices across national boundaries, making it very hard to arrive at fair market values
for production and trade, especially when the same governments implementing these
pricing policies are the ones reporting to the FAO. As a result, production and import values
may be under reported due to artificially low domestic prices, while exports are relatively
overvalued when sold abroad.
PCE RatioFAO-Clean – Filtered Agriculture Production Values
Even if efforts to understand the reporting methods for the FAO PCE dataset were
more revealing, many of the issues discussed above would still exist and correcting for
their effects would prove too onerous a task for such a research project. As a result, I
decided to continue on with my analysis from here on out using a filtered version of the
FAO PCE data, referred to as PCE RatioFAO-Clean
. I identified two potential methods for
filtering the data, 1) to remove all data from any country which exhibited an anomalous
value, or 2) simply eliminate only the anomalous values while retaining data that yielded
reasonable results. After consideration, I decided to utilize the latter filter due to the
transitory nature of the distortionary factors discussed above. By allowing for filtering of
individual data points as opposed to whole country datasets, PCE RatioFAO-Clean
is a richer
dataset which theoretically captures more reasonable estimates after the distortionary
factors have been changed or eliminated.
41
After deciding on a filter method, I faced the question of what filter to use – what
is a reasonable PCE Ratio value? Returning to the literature, there are numerous references
to poor countries spending the majority of national GDP on food. The highest estimates of
spending on food were noted in FAO 2011 at levels exceeding 70% of GDP. To account
for the diminished importance of agriculture in the global economy in recent decades, I
decided to inflate the acceptable maximum PCE Ratio value to 80% in order to
accommodate higher ratios in historical data. On the low end, many of the most developed
nations, including the United States, have an agricultural sector that accounts for only about
1% of national GDP6. As a result, I settled on a final filtering range for acceptable PCE
Ratio values of 1%-80% of national GDP. As part of the filtering, I also eliminated stranded
PCE Ratio values – individual, valid data points identified within a band of filtered values
– in an effort to filter for consistency as well. If policy interference or poor data gathering
methods resulted in consistent, invalid measurements surrounding a seemingly valid
measurement, it stands to reason that those same background conditions still held and the
seemingly valid measurement simply beat the filter by happenstance. To summarize, the
filter criteria included the following restrictions:
Elimination of PCE Ratio values < 1% of national GDP,
Elimination of PCE Ratio values > 80% of national GDP,
Elimination of resulting “stranded” valid PCE values,
Any year a PCE value was eliminated for a given country, that country’s GDP
was not included in the global GDP measure for that year.
6 http://www.bea.gov/industry/gdpbyind_data.htm

42
Out of 7,007 initial data points, the 1%-80% and stranded value filter eliminated
462 data points, or just 6.59% of the available data. Thus, filtering had limited effects on
the usefulness of the PCE RatioFAO-Clean
dataset. All annual country PCE RatioFAO-Clean
values are presented in Table 7 in Appendix II with removed values highlighted.
It should be noted that all of Guyana’s data points were caught by the filter.
Guatemala has a stretch of valid PCE Ratio measurements from 2001-2008; however,
every other value from 1961 on was filtered out. Due to the extreme consistency of invalid
measurements for Guatemala, I eliminated the eight valid data points as well. Similarly,
while data was only available for Belgium from 2000-2011, PCE Ratio measurements from
2005-2011 (7 of 12 measurements) were invalid. I eliminated the remaining valid Belgium
measurements following similar logic as I did for Guatemala.
As shown in Figure 9 below, the weighted world average PCE Ratio for the FAO
dataset follows a steady decreasing trend from 1961 to the 2000’s similar to the FCE
RatioOECD,World
. During the 2000’s, the PCE RatioFAO-Clean,World
breaks from the FCE
RatioOECD,World
and continues to decline the rest of the decade. The PCE RatioFAO-Clean,World
peaked 1961 at 7.12% and bottoms out at 4.32% in 2007 and levels out through 2011. A
period of growth in the PCE RatioFAO,World occurs between 1971 and 1975; this is mostly
associated with data for China entering the dataset over this time period skewing the
weighted world average upward due to its high national PCE Ratio. This general decreasing
trend in the PCE RatioFAO-Clean,World
is the result of many of the agricultural advances
coming out of the Green Revolution which resulted in cheaper agricultural production
methods (Evenson, 2003). Steeper declines in the PCE RatioFAO-Clean,World
are concentrated
in the first half of the dataset, while values throughout the 2000’s have remained stable;
this may suggest that the production efficiency gains resulting from the Green Revolution

43
have been fully realized. This idea will be discussed more later in Section 4. All annual
country PCE RatioFAO-Clean
values are presented in Table 5 in Appendix II.
Figure 9 – FAO-Clean PCE Ratios for Selected Countries 1961-2011
Even after filtering, the PCE RatioFAO-Clean
dataset values still much more
distributed than either the USDA or OECD datasets. This is to be expected as the FAO
dataset includes many of the poorer countries not included in the other datasets. Agriculture
makes up a much larger portion of the GDP in these countries, but due to their small size,
their PCE Ratios are outweighed by more developed nations with much lower PCE Ratios
and much larger GDPs. The lowest PCE Ratio values belong to Scandinavian countries
like Denmark and the Netherlands which have had PCE ratios as low as 1-2% ever since
the 1960’s. Recently Ireland has also experienced very low PCE Ratios of approximately
44
1% as its economy has expanded over the 2000’s. The highest PCE Ratios belong to the
predominantly African nations as highlighted in Figure 9. Many of these nations have PCE
Ratios over 50% for the entirety of the dataset time span with peaks close to 80%. These
PCE Ratio trend lines are also more variable than the FCE Ratio prepared from the other
datasets. This may be the result interference from food policies discussed above, or may
simply reflect the variable nature of agriculture coupled with its importance in the
economies of these countries. While it’s harder to pick out trends in this noisier dataset,
there are a few notable observations noted below:
After filtering high values in the 1960’s, China enters the dataset in 1972 with a
PCE Ratio above 75%, but then experiences the fastest, most sustained decline of
any country in the dataset before ending with a PCE Ratio of 12.71% in 2011; this
decline can be attributed to China’s move away from a predominantly agrarian
economy and rapid industrialization over the past 40 years (Macours & Swinnen,
2002);
The United States has experienced one of the smoothest and most continuous
declines in PCE Ratio of any country in the FAO dataset; starting at just over 3.5%
in 1961, the PCE RatioFAO-Clean,US,2011
was the lowest recorded for the US at 1.4%;
Liberia started out as one of the few African nations with a relatively low PCE
Ratio of 15% before experiencing a huge spike through most of the 1990’s; Liberia
was experiencing a civil war from 1989-1996 (Stewart, 2006) which was the cause
of these inflated PCE Ratio numbers; Liberia continues to struggle through present
day having a PCE Ratio over 25%;
Niger’s PCE Ratio has also followed an interesting, ever-increasing trajectory
rising from 34% in 1961 to 77% in 2008; unfortunately, Niger’s economy is largely

45
driven by subsistence farming and mineral export – notably uranium; as global
appetite for uranium has decreased, little else has been able to pick up the slack as
Niger’s GDP has fallen relative to the food needs of its citizens;
Nigeria has similarly struggled with rising PCE Ratio values since the 1970’s; after
peaking in 1968, Nigeria experienced drastic improvements in its PCE Ratio of the
1970’s until it started a steady climb through the 1980s and 1990’s; during this
time, Nigeria experienced a very turbulent political environment consisting of a
failed attempt at democracy, repeated coups, and the reign of a military junta which
resulted in a stagnating economy during this time.
The year-over-year growth rate for the weighted world average PCE RatioFAO-Clean
is shown in Figure 10. Compared to the USDA and OECD datasets, the PCE RatioFAO-
Clean,World appears the most variable with a range of 2.80% from 7.12% to 4.32%. The
growth rate for PCE RatioFAO-Clean,World
, however, is much more stable. As mentioned
previously, the sustained increase from 1971-1975 is largely in response to addition of data
from China into the dataset. Excluding those anomalous years, the growth rate for the PCE
RatioFAO-Clean,World
has a range of 13.13% from -6.76% to 6.36% and a variance of
0.000706. The PCE RatioFAO-Clean,World
appears less strongly tied to economic conditions
than either of the PCE Ratios; especially in the 1960’s as efficiency gains from the Green
Revolution continue to push agriculture costs down improving PCE Ratios worldwide.
Similarly, the PCE RatioFAO-Clean,World
does not rebound as significantly as FCE Ratio
measures during the recoveries from global recessions 1974-1975, 1980-1983, and 1998.
As noted earlier, the PCE RatioFAO-Clean,World
remains fairly stable during the 2000’s with
low growth rates between -2% and 2% and does not experience big swings associated with
more recent recessions.

46
Figure 10 – FAO Weighted World Average PCE Ratio Growth Rate 1962-2011
COMPARISON OF GLOBAL TRENDS ACROSS DATA SETS
As stated in the introduction, the main purpose of this thesis was to create the PCE
RatioFAO-Clean
dataset and to assess the usefulness of the PCE Ratio as a proxy for FCE
Ratio measurements when analyzing total energy expenditures as a possible limit to
economic growth. In order to validate the PCE Ratio as a proxy for the FCE Ratio, I
compared time series trends between datasets and analyze divergences between world
weighted averages for each measure. Additionally, in an effort to improve the usefulness
of PCE Ratio measures, I attempted to establish reasonable scalar estimates between PCE
and FCE Ratios on a global and regional level.

47
Weighted World Average Trends
The initial comparison plots PCE RatioFAO-Clean,World
, FCE RatioUSDA,World
, and FCE
RatioOECD,World
against one another in Figure 11. It should be noted that the PCE RatioFAO-
Clean,World graph in Figure 11 only includes data from China from 1973-2011; data prior to
1973 is excluded due to filtering. Due to China’s large population and GDP, Figure 11 also
includes a second PCE RatioFAO-Clean,World
graph containing additional data from 1961-1972
for China in order to assess trend impacts from the filtered exclusion. Figure 11 verifies
that the jump seen between 1971 and 1973 in PCE-FAO Clean is due to China joining the
dataset and that the downward trend from 1961 to 1971 is actually still present in the data.
Figure 11 – Weighted World Average PCE and FCE Ratios Comparison 1961-2011
One of the more interesting findings is the similarity between trajectories for FCE
RatioOECD,World
and PCE RatioFAO-Clean,World
, at least up until the 2000’s. As noted earlier,
48
the jumps in the FCE RatioOECD,World
that occur in the late 1960’s and early 1990’s are a
result of additional member nations joining the OECD database. Ignoring those anomalous
jumps, the two ratios seem to be moving in concert with FCE RatioOECD,World
exceeding
PCE RatioFAO-Clean,World
by a margin of 1-2.5%. This makes logical sense as one would
expect FCE measures to capture higher spending associated with value-added processing
of raw agricultural goods before purchase by the end-consumer. One anticipates this spread
to grow over time; however, as countries – especially – more developed ones move to
progressively more industrialized food systems with end consumption further and further
removed from initial agricultural production. Unfortunately this trend is not strongly
present between 1961 and 2000.
Following 2000, a disconnect occurs between FCE RatioOECD,World
and PCE
RatioFAO-Clean,World
. FCE RatioOECD,World
starts a steady climb from 2000 through 2011
reaching levels very close to the 1963 maximum, rapidly reversing the reductions realized
over the previous four decades. Meanwhile, PCE RatioFAO-Clean,World
levels off while
fluctuating between 4.32% and 4.52%. There appears to be a fundamental shift in world
food markets during the 2000’s; something that has been noted by others (Mitchell, 2008).
This issue will be discussed more in Section 4, but it may present limits to the utility of the
PCE Ratios as a proxy for FCE Ratios.
When examining FCE RatioUSDA,World
, one notes elevated levels that mirror FCE
RatioOECD,World
almost identically. This is expected as the USDA dataset includes ratios for
many of the less developed nations excluded from the OECD dataset. As a result, these
countries skew the FCE RatioUSDA,World
upward since they spend a greater portion of
income on food compared to more developed nations. In comparison to PCE RatioFAO-
Clean,World, the disconnect that occurs in 2000 is highlighted more starkly.

49
As noted above, the comparisons made in Figure 11 are a bit ambiguous in terms
of validating the use of the PCE Ratio as a proxy for the FCE Ratio. The results are clouded
by mismatches between the countries included in each of the various datasets. In order to
make a cleaner comparison, I created two sub-datasets from the original USDA and FAO-
Clean databases segregating countries into OECD and non-OECD categories according to
their inclusion in the original OECD dataset. Matching the countries included in each of
the three datasets, yielded sub-datasets of the USDA, OECD, and FAO-Clean datasets that
each contained 36 countries.
I created weighted average for each sub-dataset in the same way I created the world
weighted averages for FCE RatioUSDA,World
and PCE RatioFAO-Clean,World
. Figure 12 shows a
plot of the weighted averages of FCE and PCE measure from all three sub-datasets with
matching country lists.
Figure 12 – Weighted Average FCE and PCE Ratios for OECD Nations 1961-2011

50
With matching country data, the trends in Figure 12 become clearer. The weighted
PCE Ratio for OECD nations follows a steeper descending trajectory than that shown in
Figure 11. As a result, the spread between PCE and FCE measures grows from the 1960’s
until the 2000’s as was expected in the discussion above. Again, the weight average PCE
Ratio for OECD nations levels off during the 2000’s fluctuating around 2.7%, while the
FCE Ratio increases following the disconnect.
It should also be noted that the weighted average FCE Ratio for OECD nations
using the FCE RatioUSDA
sub-dataset shifts down to more closely match FCE
RatioOECD,World
almost identically. While this fact does not help validate the use of the PCE
Ratio, it does verify the accuracy of the OECD database, which facilitates reliance on the
FCE RatiosOECD
for comparison to and validation of PCE Ratios prior to 2000.
For Non-OECD countries, I was able to match data from 46 countries between the
USDA and FAO datasets. The weighted average PCE and FCE Ratios for this sub-dataset
in shown in Figure 13 below. Unfortunately, due to the short time span of the USDA
dataset, Figure 13 only shows trends from 2000 until 2010. Compared to the OECD
countries, the non-OECD countries have significantly higher PCE and FCE Ratios as is
expected. The FCE RatioUSDA,Non-OECD
hits a minimum of 13.18% in 2002 before starting
to steadily climb through 2010, reaching a high of 17.19%. The PCE RatioFAO-Clean,Non-OECD
follows a slowly declining trajectory starting at a high of 14.22% in 2000 and ending at
10.64% in 2010.

51
Figure 13 – Weighted Average FCE and PCE Ratios for Non-OECD Nations 2000-2010
Overall, the PCE and FCE Ratios for non-OECD countries appear much more
tightly connected than the relationship described above for OECD countries. Again, this is
expected as less developed nations will be more agrarian with a less industrialize food
system resulting in a smaller spread between agriculture values and end consumption
prices. Interestingly, though, the non-OECD countries also appear to have experienced a
sudden disconnect between PCE and FCE Ratios just like the OECD countries did. This
disconnect, however, was delayed about five years and does not occur until 2005.
Following the disconnect, the PCE Ratio declines sharply for two years before leveling off
while the FCE Ratio experiences sharp growth until 2008 before leveling off itself.
While a longer time series comparison would be enlightening, one is not possible
given the available data. In an attempt to better understand the long-term relationship
between PCE and FCE ratios for non-OECD countries, Figure 14 shows the short-term
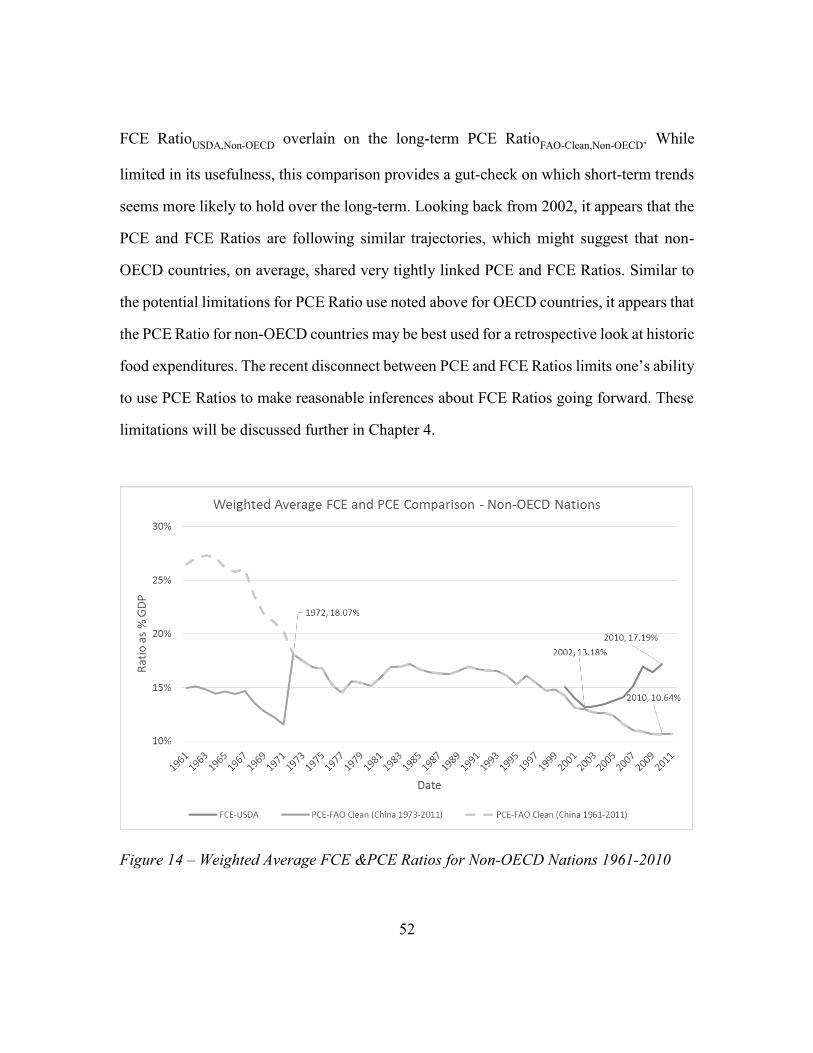
52
FCE RatioUSDA,Non-OECD
overlain on the long-term PCE RatioFAO-Clean,Non-OECD
. While
limited in its usefulness, this comparison provides a gut-check on which short-term trends
seems more likely to hold over the long-term. Looking back from 2002, it appears that the
PCE and FCE Ratios are following similar trajectories, which might suggest that non-
OECD countries, on average, shared very tightly linked PCE and FCE Ratios. Similar to
the potential limitations for PCE Ratio use noted above for OECD countries, it appears that
the PCE Ratio for non-OECD countries may be best used for a retrospective look at historic
food expenditures. The recent disconnect between PCE and FCE Ratios limits one’s ability
to use PCE Ratios to make reasonable inferences about FCE Ratios going forward. These
limitations will be discussed further in Chapter 4.
Figure 14 – Weighted Average FCE &PCE Ratios for Non-OECD Nations 1961-2010

53
Figure 14 also includes a second PCE RatioFAO-Clean,Non-OECD
graph containing data
from China over the 1961-1972 timeframe that was filtered out of the FAO Clean dataset.
It verifies that the large jump seen between 1971 and 1973 in PCE RatioFAO-Clean,Non-OECD
is due to China joining the dataset and that the downward trend from 1967 to 1971 is
actually still present in the data.
PCE-to-FCE Scalars
In addition to the time series trend analysis discussed above, I also examined the
relationships between PCE and FCE Ratios by calculating PCE-to-FCE Scalars. These
scalars are calculated simply by dividing the FCE Ratio by the PCE Ratio for a given
country or region. Since the FCE Ratios for OECD member countries are so similar
between the USDA and OECD datasets, I decided to only use the FCE RatioOECD
datasets
for further PCE Ratio – FCE Ratio comparative analysis for OECD member countries. I
used the FCE RatioUSDA
datasets for PCE Ratio – FCE Ratio comparative analysis for non-
OECD member countries. Tabular presentation of scalar data is offered in Appendix III.
Figure 15 shows the PCE-to-FCE Scalars for both OECD and non-OECD nations.
Examining the PCE-to-FCE Scalar for OECD countries, one sees the effect of the
decoupling that occurred in 2000. Beginning in 1961 at 1.16, the scalar gradually increased
over the next 20 year to approximately 2 by 1980, where it hovered for the next 20 years
(except for a spike in the early 1990’s) until 2000. In the 10 year between 2001 and 2011,
the PCE-to-FCE Scalar jumped as much as it had the previous 40 years from 2 to 2.89 in
2011. This reaffirms the conclusion that food markets in developed nations have undergone
a fundamental change since 2000.

54
Figure 15 – OECD and Non-OECD Countries Weighted Average PCE-to-FCE Scalar
The PCE-to-FCE Scalar for non-OECD countries is also rising rather quickly.
While we do not have data available for a historic comparison, one can assume that the
PCE-to-FCE Scalar cannot go lower than 1 by definition – in a perfectly subsistent system,
the PCE Value would equal the FCE Value resulting in a PCE-to-FCE Scalar of 1as people
consumed exactly as much as they produced. Fluctuations around 1 may be expected due
to data irregularities. Therefore, it may be reasonable to assume the PCE-to-FCE ratio for
non-OECD nations had remained fairly stable around 1 for the previous 40 years before
experiencing a 60% increase from 2000 to 2010. Again, this indicates that the PCE Ratio
may be becoming a less useful tool for analysis in recent years as it is further removed from
actual final food consumption values.
Breaking down the PCE-to-FCE Scalar analysis on a regional level reveals
additional interesting trends worth noting. As shown in Figure 16, regional PCE-to-FCE
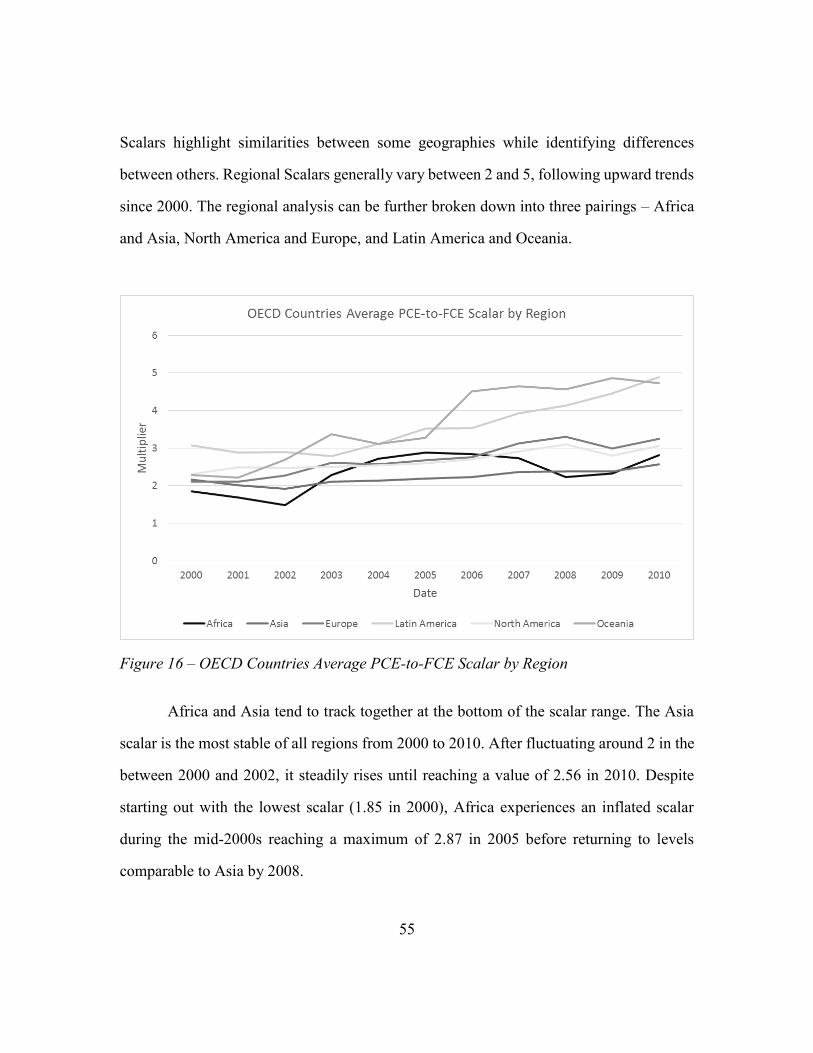
55
Scalars highlight similarities between some geographies while identifying differences
between others. Regional Scalars generally vary between 2 and 5, following upward trends
since 2000. The regional analysis can be further broken down into three pairings – Africa
and Asia, North America and Europe, and Latin America and Oceania.
Figure 16 – OECD Countries Average PCE-to-FCE Scalar by Region
Africa and Asia tend to track together at the bottom of the scalar range. The Asia
scalar is the most stable of all regions from 2000 to 2010. After fluctuating around 2 in the
between 2000 and 2002, it steadily rises until reaching a value of 2.56 in 2010. Despite
starting out with the lowest scalar (1.85 in 2000), Africa experiences an inflated scalar
during the mid-2000s reaching a maximum of 2.87 in 2005 before returning to levels
comparable to Asia by 2008.

56
The European and North American scalars track the most closely with each other
when compared to the other pairings. North America experiences a steady PCE-to-FCE
Scalar increase as well rising from 2.31 in 2000 to a peak of 3.10 in 2008 before settling
just above 3 in 2010. The Europe scalar experiences slightly stronger growth starting at 2.1
in 2000, peaking at 3.3 in 2008, and settling at 3.24 in 2010. This close relationship is most
likely due to strong cultural ties between nations in each region and tight linkages between
these western economies.
Oceania starts off with a scalar similar to that of North America and Europe in the
low 2’s before racing up to join Latin America with a scalar above 3 by 2003 before maxing
out close to 5 at 4.86 in 2009. Latin America starts out with a stable scalar around 3 which
then experiences steady growth after 2003 until it ends at a high of 4.89 in 2010. These
elevated PCE-to-FCE Scalars may result from the geographic isolation of Oceania nations
and the rugged terrain in Latin American countries which makes transportation and
importation of food products more expensive due to higher fuel costs.
Figure 17 presents a regional analysis of PCE-to-FCE Scalars for non-OECD
countries. North America and Oceania do not appear since the only nations in each region
with data are included in the OECD country analysis. Compared to all the regional scalars
for OECD nations, the non-OECD scalars are lower as is expected due to less industrialized
national food systems. Africa has the lowest scalar which shows only modest increases
from about 1.25 to just over 1.5, which is no surprise given that the least developed African
nations are among the poorest in the world. Asia has a similarly stable, but slightly higher,
scalar that ranges from 1.6 in 2000 to 2.25 in 2010. The Europe scalar experiences the
strongest growth throughout the 2000s, more than doubling from 1.26 to 2.56 in ten years.
Finally, similar to the OECD scalars, Latin America has the highest scalar of any region

57
throughout the 2000s despite a strong dip from 2001-2003. The Latin America scalar
reaches a maximum of 3.88 in 2010. Again, this may be due to excessive transportation
costs for food products due to the rugged terrain in the region separating farm land from
urban development.
Figure 17 – Non-OECD Countries Average PCE-to-FCE Scalar by Region

58
Chapter 4: Discussion of Results
In this chapter, I offer a discussion of the meaning of the results described in
Chapter 3. I discuss possible explanations for some of the trends noted, as well as, an
explanation for what may have changed during the 2000’s to cause the drastic changes in
trends noted over the past decade. Following this discussion, I offer my suggestion for how
to best use the available datasets to better understand the potential constraints on economic
growth resulting from rising food costs. Finally I combine my work with that of others
(King and Maxwell) to create a more complete analysis of total global energy expenditure
and its effect on economic growth.
COMPARING PCE AND FCE
Initially, I had posited that PCE measures may provide more insight into economic
impacts associated with changes in food markets. My reasoning concluded that as
consumers hit budgetary limits, their preferences would shift and they might buy cheaper,
less processed food items. As a result, PCE values would more accurately reflect minimum
food expenditure levels, providing a stable and conservative measure to use for analysis.
This proposition; however, did not account for several central tenants of modern
industrialize agro-food systems.
First, as national agro-food systems industrialize, food distribution infrastructure
changes and consumer choice is limited. In order to improve production efficiency,
industrial agro-food systems have transformed community farms into large monoculture
operations far from population centers producing commoditized goods for wholesale
59
purchase by big food producers not end consumers (Wilkes & Wilkes, 1972). As the
industry as evolved, it has shifted from a manufacturer (farmer) driven industry to one
organized and managed by the retail arm (grocery store chains) (Burch & Lawrence, 2005).
As a result, a monopsony has formed in food distribution channels where food producers
are forced to sell to a small number of globally-focused retailers who can and do exercise
extreme purchasing power over the market (Burch & Lawrence, 2005). As a result,
consumers are forced into the mainstream retail sector and don’t have the ability to buy
directly.
To a certain extent, though, things are shifting in this market as more consumers
become more concerned with how and where their food is produced (Weatherell et al.,
2003). There is a growing interest in more socially embedded food systems like community
supported agriculture that involve more face-to-face interaction between producers and
consumers (Hinrichs, 2001). These options are still currently limited, and even when they
are available often come with a higher price tag than conventional mainstream retail food
options. As Watts et al., 2005 highlights, these more embedded systems are usually weaker
systems since they focus on the food offered as opposed to ways to more efficiently
distribute the food they produce.
PCE – FCE DIVERGENCE
As noted numerous times in Chapter 3, there was an easily identifiable change in
the relationship between PCE and FCE measures for both OECD and non-OECD nations
in the 2000s. While there are some dissenting opinions (Ajanovic, 2011), the majority of
the literature points towards use of food for fuel as feedstock into biofuel production as a
main driving force behind rapidly escalating food prices in both OECD and non-OECD
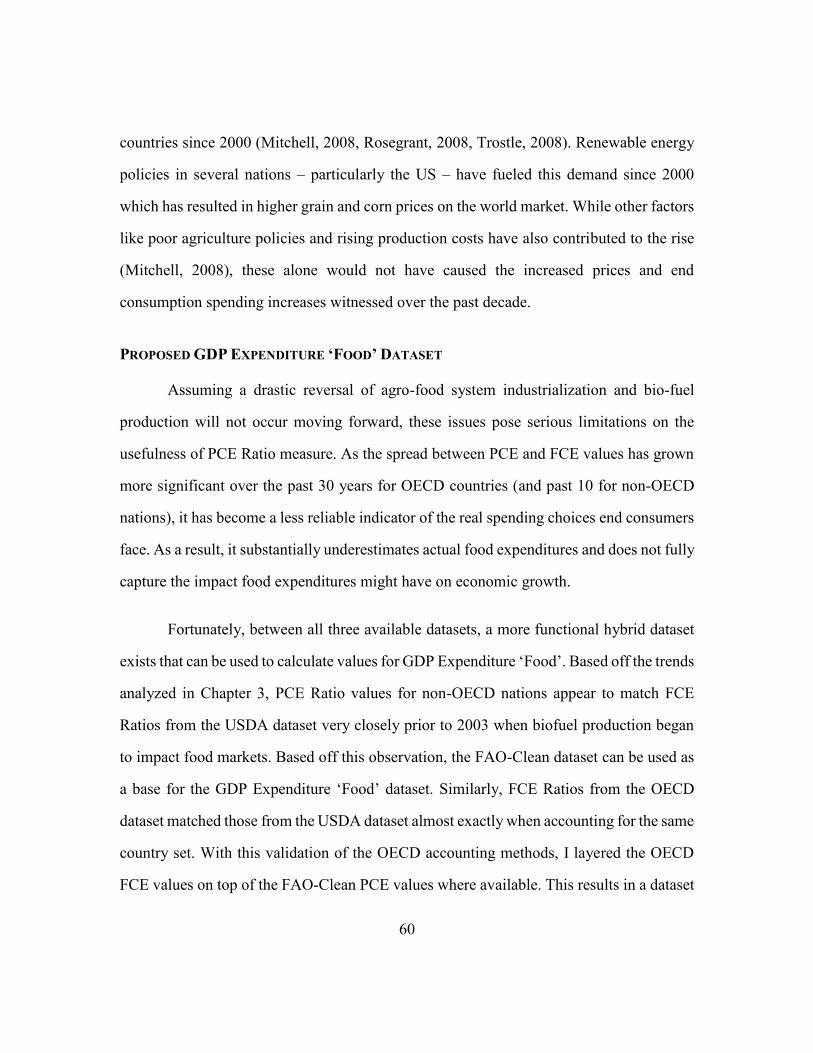
60
countries since 2000 (Mitchell, 2008, Rosegrant, 2008, Trostle, 2008). Renewable energy
policies in several nations – particularly the US – have fueled this demand since 2000
which has resulted in higher grain and corn prices on the world market. While other factors
like poor agriculture policies and rising production costs have also contributed to the rise
(Mitchell, 2008), these alone would not have caused the increased prices and end
consumption spending increases witnessed over the past decade.
PROPOSED GDP EXPENDITURE ‘FOOD’ DATASET
Assuming a drastic reversal of agro-food system industrialization and bio-fuel
production will not occur moving forward, these issues pose serious limitations on the
usefulness of PCE Ratio measure. As the spread between PCE and FCE values has grown
more significant over the past 30 years for OECD countries (and past 10 for non-OECD
nations), it has become a less reliable indicator of the real spending choices end consumers
face. As a result, it substantially underestimates actual food expenditures and does not fully
capture the impact food expenditures might have on economic growth.
Fortunately, between all three available datasets, a more functional hybrid dataset
exists that can be used to calculate values for GDP Expenditure ‘Food’. Based off the trends
analyzed in Chapter 3, PCE Ratio values for non-OECD nations appear to match FCE
Ratios from the USDA dataset very closely prior to 2003 when biofuel production began
to impact food markets. Based off this observation, the FAO-Clean dataset can be used as
a base for the GDP Expenditure ‘Food’ dataset. Similarly, FCE Ratios from the OECD
dataset matched those from the USDA dataset almost exactly when accounting for the same
country set. With this validation of the OECD accounting methods, I layered the OECD
FCE values on top of the FAO-Clean PCE values where available. This results in a dataset

61
that has uses PCE values as a proxy for FCE values for non-OECD nations, while using
more accurate FCE values for OECD nations. Finally, I layered the USDA FCE values on
top of this combined dataset. As mentioned, this did not alter FCE values for OECD nations
significantly. It did register a significant increase over PCE values for the non-OECD
nations included in the USDA dataset, but that is a more accurate depiction of the actual
situation following the divergence in non-OECD PCE and FCE values. The USDA dataset
did not include data for almost 96 countries in the FAO-Clean dataset. The resulting
continued reliance on FAO PCE values results in a conservative underestimate for the
actual FCE value for these countries, but inclusion of these countries still provides more
information than if they were excluded. Table 2 provides a summary of the data sources
used for each type of country while compiling the hybrid dataset:
Country Type 1961-1999 2000-2010
OECD Member Nation
OECD FCE Ratio if available;
FAO PCE Ratio when no
OECD data was available
USDA FCE Ratio if available;
OECD FCE Ratio when no
USDA data was available
Non-OECD Nation FAO PCE Ratio
USDA FCE Ratio if available;
FAO PCE Ratio when no
USDA data was available
Table 2 – Description of Dataset Usage for GDP Expenditure ‘Food’ Compilation
GDP EXPENDITURE ‘FOOD’
Utilizing this hybrid dataset, I was able to create a GDP Expenditure ‘Food’
measure for the global economy as shown in Figure 18 below – tabular data presented in
Appendix IV. This was done in the same manner in which I created the original PCE and
FCE Ratios for the global economy. I summed all available consumption data in the GDP
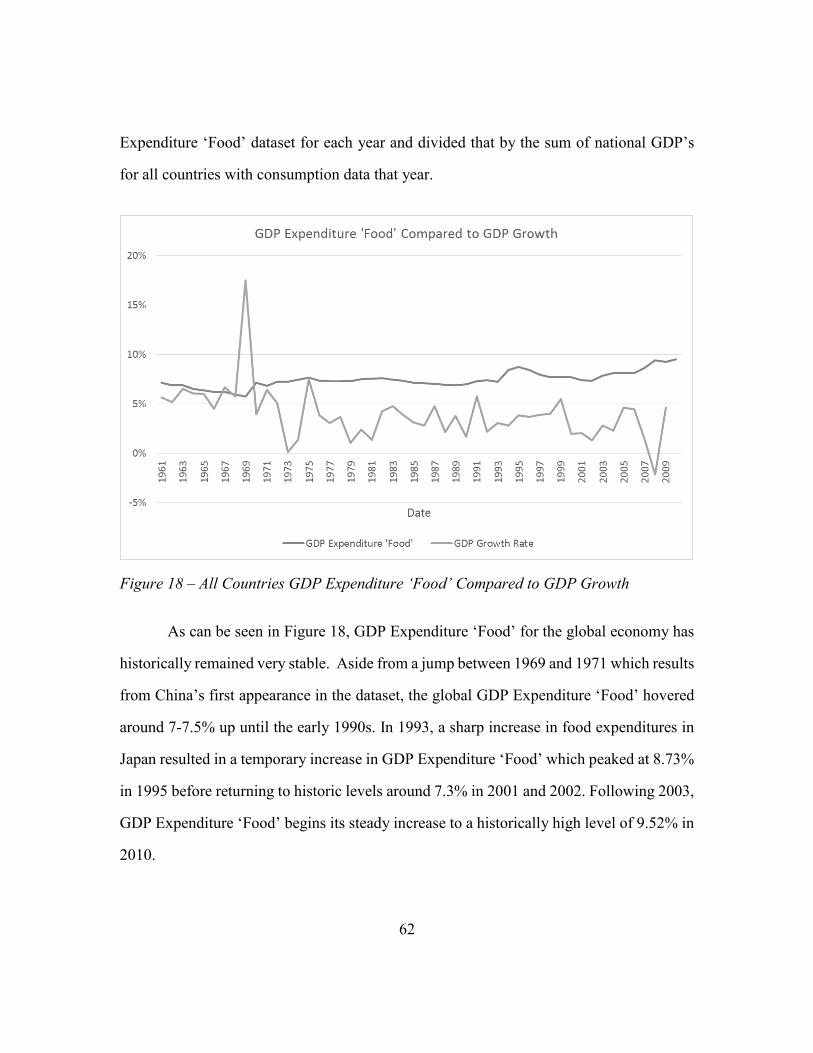
62
Expenditure ‘Food’ dataset for each year and divided that by the sum of national GDP’s
for all countries with consumption data that year.
Figure 18 – All Countries GDP Expenditure ‘Food’ Compared to GDP Growth
As can be seen in Figure 18, GDP Expenditure ‘Food’ for the global economy has
historically remained very stable. Aside from a jump between 1969 and 1971 which results
from China’s first appearance in the dataset, the global GDP Expenditure ‘Food’ hovered
around 7-7.5% up until the early 1990s. In 1993, a sharp increase in food expenditures in
Japan resulted in a temporary increase in GDP Expenditure ‘Food’ which peaked at 8.73%
in 1995 before returning to historic levels around 7.3% in 2001 and 2002. Following 2003,
GDP Expenditure ‘Food’ begins its steady increase to a historically high level of 9.52% in
2010.

63
For comparison, Figure 18 also includes a measure of the global GDP growth rate.
The stability of GDP Expenditure ‘Food’ indicates that it has limited impact on GDP
growth, at least historically. During the past decade; however, increase food expenditures
associated with price increases due to biofuel production may also point toward the
existence of a threshold value where food expenditures begin to hinder economic growth.
It may not be a coincidence that historically high food expenditures coincide with the Great
Recession and one of the most tepid economic recoveries in history.
To expand upon Maxwell, 2013, I created a subset of the GDP Expenditure ‘Food’
dataset which only included data for the same countries Maxwell examined GDP
Expenditure ‘Energy’ values for from 1978-2010. Figure 19 shows the resulting
information. The GDP Expenditure ‘Energy’ data is a direct replication of the data
analyzed by Maxwell. GDP Expenditure ‘Energy + Food’ was calculated simply by adding
GDP Expenditure ‘Energy’ and GDP Expenditure ‘Food’ together. The GDP growth rate
has been adjusted compared to Figure 18 due to the smaller country list included in the
dataset.
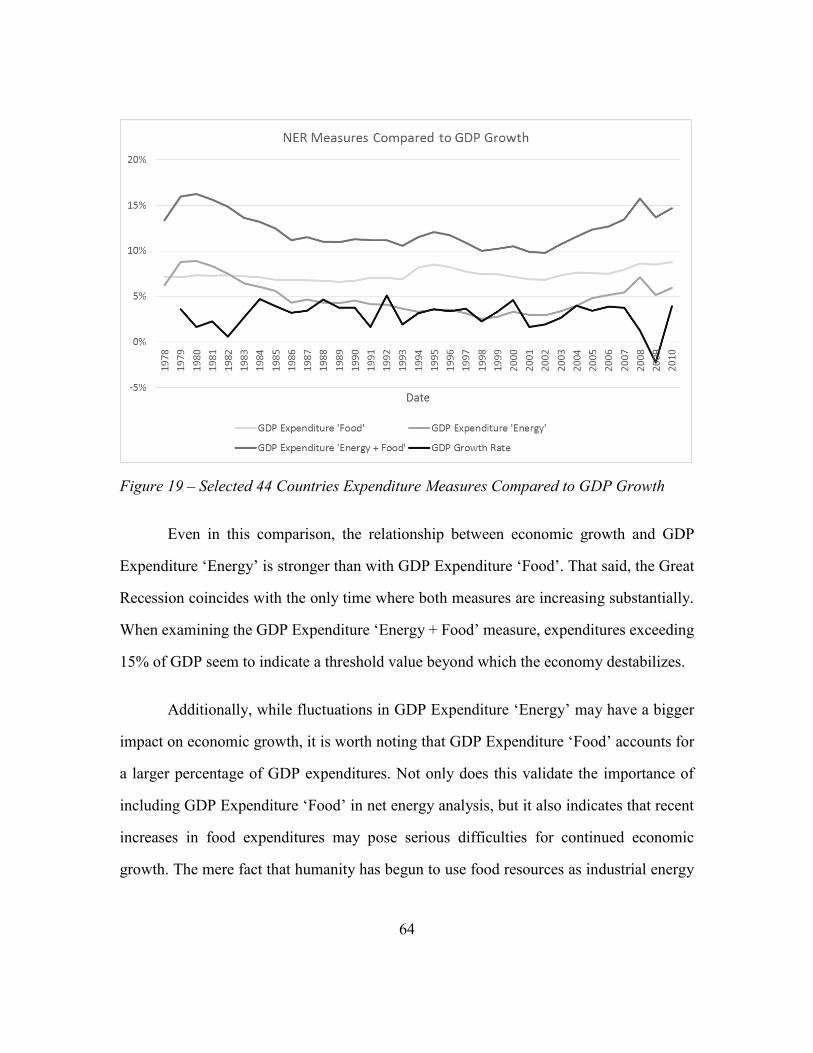
64
Figure 19 – Selected 44 Countries Expenditure Measures Compared to GDP Growth
Even in this comparison, the relationship between economic growth and GDP
Expenditure ‘Energy’ is stronger than with GDP Expenditure ‘Food’. That said, the Great
Recession coincides with the only time where both measures are increasing substantially.
When examining the GDP Expenditure ‘Energy + Food’ measure, expenditures exceeding
15% of GDP seem to indicate a threshold value beyond which the economy destabilizes.
Additionally, while fluctuations in GDP Expenditure ‘Energy’ may have a bigger
impact on economic growth, it is worth noting that GDP Expenditure ‘Food’ accounts for
a larger percentage of GDP expenditures. Not only does this validate the importance of
including GDP Expenditure ‘Food’ in net energy analysis, but it also indicates that recent
increases in food expenditures may pose serious difficulties for continued economic
growth. The mere fact that humanity has begun to use food resources as industrial energy

65
resources may be proof enough that we’re approaching limits to the type of growth the
Earth can sustain.

66
Chapter 5: Conclusion and Discussion of Further Research
CONCLUSION
This thesis calculated PCE and FCE values for various countries using three
different datasets from the USDA, OECD, and FAO. While FCE values from the USDA
and OECD datasets provide a much more accurate view of food expenditures, their limited
breadth makes time series analysis difficult. As a result, the FAO PCE values were
calculated to serve as a proxy since the FAO dataset included data from more countries
over a long time frame.
This work was performed to try to analyze what, if any, effects food expenditures
have on economic performance. This work builds off the work of King and Maxwell who
calculated the EIR and NER for fossil fuel and electricity energy consumption and
expenditures. Food represents an energy source critical to human survival which as to-date
been left out of analysis of the impact of energy consumption on economic growth.
This analysis was conducted from a macroecological economic perspective to
address the possibility of existing constraints to economic growth imposed by energy
resources. As noted earlier in this paper, per capita consumption of critical resources has
been declining over past decades. While this may signal more efficient resource use, human
and societal system require energy consumption scaled with the rate of population and
economic growth (Brown et al., 2013). These declining consumption trends may actually
indicate that human society is reaching resource constraints on a global scale that may
hinder future growth.

67
The resulting end product of the analysis conducted in this paper is a hybrid dataset
made up of components of all three datasets considered. This hybrid represents the most
accurate estimates of actual food expenditures available for the given time frame and
country set. Use of this hybrid dataset allowed for calculation of GDP Expenditure ‘Food’
and GDP Expenditure ‘Energy + Food’ values in order to better understand the limits to
growth. Findings indicate that increased expenditures on energy have a more detrimental
effect on economic growth; however, food expenditures have remained much more stable
over since 1960. The recent trend towards increasing food expenditures resulting from use
of food resources in biofuel production may indicate that society is entering a new
environment where food expenditures may also pose limits to growth.
AREAS FOR FURTHER RESEARCH
One area for further research would be to further strengthen the GDP Expenditure
‘Food’ dataset. As described earlier in this paper, coming up with good estimates of food
expenditures is notoriously difficult. It may not be possible to build a better historic dataset,
but efforts should be made to continue and even expand calculations of global food
expenditures moving forward. This may be best performed using private data available
from Euromonitor in similar fashion to the USDA dataset built by Birgit Meade. As
mentioned above, recent trends towards using food resources as feedstock into biofuel
production signals a new era for food expenditures. It will be critical to monitor these trends
going forward.
Another interesting research topic could focus on expanding the GDP Expenditure
‘Energy + Food’/economic performance comparison to include more measure than just
GDP growth rates. Other measures of interest may include debt, interest rates, and total
68
factor productivity. Expanding these comparisons may shed light on possible feedback
loops between different parts of the economic system.
Finally, it may be educational to make comparisons between food expenditures and
some non-economic factors such as equality and state stability indices. For one, famines
and food shortages have caused riots in regions of the world (Mitchell, 2008). Even if rising
food prices and expenditures do not have a significant impact on economic performance
directly, increased national and regional instability may result if the poor have to spend
disproportionate amounts of their income on food. Such events may send strong ripples
through the tightly interconnected global economy.

69
Appendices
APPENDIX I
Table 1. USDA Dataset Country List – All 2000 – 2010 Time Span
Algeria Costa Rica Indonesia
New
Zealand Spain
Argentina Croatia Iran Nigeria Sweden
Australia Czech Republic Ireland Norway Switzerland
Austria Denmark Israel Pakistan Taiwan
Azerbaijan
Dominican
Republic Italy Peru Thailand
Bahrain Ecuador Japan Philippines Tunisia
Belarus Egypt Jordan Poland Turkey
Belgium Estonia Kazakhstan Portugal Turkmenistan
Bolivia Finland Kenya Qatar Ukraine
Bosnia-
Herzegovina France Kuwait Romania
United Arab
Emirates
Brazil Georgia Latvia Russia
United
Kingdom
Bulgaria Germany Lithuania Saudi Arabia United States
Cameroon Greece Macedonia Singapore Uruguay
Canada Guatemala Malaysia Slovakia Uzbekistan
Chile Hong Kong Mexico Slovenia Venezuela
China Hungary Morocco South Africa Vietnam
Colombia India Netherlands South Korea

70
Table 2. OECD Dataset Country List
Country
Start
Date
End
Date
Total
Years Country
Start
Date
End
Date
Total
Years
Australia 1959 2012 53 Japan 2001 2011 10
Austria 1976 2012 36 Korea 1970 2012 42
Belgium 1995 2012 17 Luxembourg 1995 2012 17
Canada 1970 2010 40 Mexico 2003 2012 9
Chile 2008 2011 3 Netherlands 1980 2012 32
Czech Republic 1993 2012 19 New Zealand 1987 2011 24
Denmark 1966 2012 46 Norway 1970 2012 42
Estonia 1995 2012 17 Poland 1995 2012 17
Finland 1975 2012 37 Portugal 1995 2012 17
France 1959 2012 53 Slovak Republic 1995 2012 17
Germany 1991 2012 21 Slovenia 1995 2012 17
Greece 2005 2011 6 Spain 1995 2012 17
Hungary 1995 2012 17 Sweden 1980 2012 32
Iceland 1990 2012 22 Switzerland 1990 2011 21
Ireland 1995 2012 17 Turkey 1998 2012 14
Israel 2006 2012 6 United Kingdom 1995 2012 17
Italy 1970 2012 42 United States 1970 2012 42

71
Table 3. FAO Dataset Country List
Country Start Date End Date Total Years Country Start Date End Date Total Years
Afghanistan 2002 2011 10 Dem. Rep. Congo 1961 2011 51
Albania 1980 2011 32 Denmark 1961 2011 51
Algeria 1961 2011 51 Dominica 1977 2011 35
Angola 1985 2011 27 Dominican Republic 1961 2011 51
Antigua and Barbuda 1977 2011 35 Ecuador 1961 2011 51
Argentina 1961 2011 51 Egypt 1961 2011 51
Armenia 1992 2011 20 El Salvador 1965 2011 47
Australia 1961 2011 51 Equatorial Guinea 1985 2011 27
Austria 1961 2011 51 Eritrea 1993 2011 19
Azerbaijan 1992 2011 20 Estonia 1993 2011 19
Bahamas 1961 2011 51 Ethiopia 1993 2011 19
Bahrain 1980 2011 32 Fiji 1961 2011 51
Bangladesh 1961 2011 51 Finland 1961 2011 51
Barbados 1961 2011 51 France 1961 2011 51
Belarus 1992 2011 20 Gabon 1961 2011 51
Belgium 2000 2011 12 Gambia 1966 2011 46
Belize 1961 2011 51 Georgia 1992 2011 20
Benin 1961 2011 51 Germany 1970 2011 42
Bermuda 1961 2011 51 Ghana 1961 2011 51
Bhutan 1980 2011 32 Greece 1961 2011 51
Bolivia 1961 2011 51 Grenada 1977 2011 35
Bosnia and Herzegovina 1994 2011 18 Guatemala 1961 2011 51
Botswana 1961 2011 51 Guinea 1986 2011 26
Brazil 1961 2011 51 Guinea-Bissau 1970 2011 42
Brunei Darussalam 1974 2011 38 Guyana 1961 2011 51
Bulgaria 1980 2011 32 Haiti 1998 2011 14
Burkina Faso 1961 2011 51 Honduras 1961 2011 51
Burundi 1961 2011 51 Hungary 1961 2011 51
Cabo Verde 1980 2011 32 Iceland 1961 2011 51
Cambodia 1993 2011 19 India 1961 2011 51
Cameroon 1961 2011 51 Indonesia 1961 2011 51
Canada 1961 2011 51 Iran 1965 2011 47
Central African Republic 1961 2011 51 Iraq 2000 2011 12
Chad 1961 2011 51 Ireland 1970 2011 42
Chile 1961 2011 51 Israel 1961 2011 51
China 1961 2011 51 Italy 1961 2011 51
Colombia 1961 2011 51 Japan 1961 2011 51
Comoros 1980 2011 32 Jordan 1975 2011 37
Congo 1961 2011 51 Kazakhstan 1992 2011 20
Costa Rica 1961 2011 51 Kenya 1961 2011 51
Côte d Ivoire 1961 2011 51 Kiribati 1970 2011 42
Croatia 1995 2011 17 Kuwait 1992 2011 20
Cuba 1970 2011 42 Kyrgyzstan 1992 2011 20
Cyprus 1975 2011 37 Lao 1984 2011 28
Czech Republic 1993 2011 19 Latvia 1992 2011 20

72
Table 3. FAO Dataset Country List (Cont.)
Country Start Date End Date Total Years Country Start Date End Date Total Years
Lebanon 1988 2011 24 Saudi Arabia 1968 2011 44
Lesotho 1961 2011 51 Senegal 1961 2011 51
Liberia 1961 2011 51 Serbia 2006 2011 6
Lithuania 1992 2011 20 Seychelles 1961 2011 51
Luxembourg 2000 2011 12 Sierra Leone 1961 2011 51
Macedonia 1992 2011 20 Singapore 1961 2011 51
Madagascar 1961 2011 51 Slovakia 1993 2011 19
Malawi 1961 2011 51 Slovenia 1992 2011 20
Malaysia 1961 2011 51 Solomon Islands 1990 2011 22
Maldives 2001 2011 11 South Africa 1961 2011 51
Mali 1967 2011 45 Spain 1961 2011 51
Malta 1970 2011 42 Sri Lanka 1961 2011 51
Mauritania 1961 2011 51 St. Kitts and Nevis 1977 2011 35
Mauritius 1976 2011 36 St. Lucia 1980 2011 32
Mexico 1961 2011 51 St. Vincent and the Grenadines 1961 2011 51
Moldova 1992 2011 20 Sudan 1961 2011 51
Mongolia 1981 2011 31 Suriname 1975 2011 37
Montenegro 2006 2011 6 Swaziland 1970 2011 42
Morocco 1966 2011 46 Sweden 1961 2011 51
Mozambique 1980 2011 32 Switzerland 1970 2011 42
Namibia 1980 2011 32 Tajikistan 1992 2011 20
Nepal 1961 2011 51 Tanzania 1988 2011 24
Netherlands 1961 2011 51 Thailand 1965 2011 47
New Zealand 1970 2011 42 Timor-Leste 1999 2011 13
Nicaragua 1961 2011 51 Togo 1961 2011 51
Niger 1961 2011 51 Tonga 1981 2011 31
Nigeria 1961 2011 51 Trinidad and Tobago 1961 2011 51
Norway 1961 2011 51 Tunisia 1961 2011 51
Oman 1961 2011 51 Turkey 1961 2011 51
Pakistan 1961 2011 51 Turkmenistan 1992 2011 20
Panama 1961 2011 51 Tuvalu 1990 2011 22
Papua New Guinea 1961 2011 51 Uganda 1982 2011 30
Paraguay 1961 2011 51 Ukraine 1992 2011 20
Peru 1961 2011 51 United Arab Emirates 1975 2011 37
Philippines 1961 2011 51 United Kingdom 1961 2011 51
Poland 1990 2011 22 United States of America 1961 2011 51
Portugal 1961 2011 51 Uruguay 1961 2011 51
Qatar 2000 2011 12 Uzbekistan 1992 2011 20
Rep. Korea 1961 2011 51 Vanuatu 1979 2011 33
Romania 1980 2011 32 Venezuela 1961 2011 51
Russian Federation 1992 2011 20 Viet Nam 1984 2011 28
Rwanda 1961 2011 51 Yemen 1990 2011 22
Samoa 1982 2011 30 Zambia 1961 2011 51
Sao Tome and Principe 2001 2011 11 Zimbabwe 1961 2011 51

73
APPENDIX II
Table 4. FCE Ratios USDA Dataset
Country 2000 2001 2002 2003 2004 2005 2006 2007 2008 2009 2010
Algeria 15% 14% 14% 14% 16% 15% 15% 16% 19% 18% 19%
Argentina 28% 27% 10% 12% 12% 12% 12% 13% 15% 14% 14%
Australia 5% 5% 5% 6% 6% 6% 7% 7% 7% 7% 9%
Austria 5% 4% 5% 6% 6% 6% 6% 6% 7% 7% 6%
Azerbaijan 34% 30% 28% 27% 26% 22% 22% 23% 29% 29% 30%
Bahrain 7% 6% 6% 6% 5% 5% 5% 5% 5% 5% 5%
Belarus 19% 19% 20% 20% 21% 24% 25% 27% 32% 27% 26%
Belgium 5% 5% 5% 7% 7% 7% 6% 7% 7% 7% 7%
Bolivia 27% 25% 23% 21% 20% 20% 21% 22% 25% 26% 25%
Bosnia and Herzegovina 26% 26% 27% 31% 32% 32% 32% 35% 40% 37% 35%
Brazil 13% 11% 10% 11% 12% 15% 18% 20% 22% 22% 26%
Bulgaria 14% 14% 13% 15% 16% 16% 15% 18% 19% 19% 18%
Cameroon 24% 24% 26% 31% 33% 33% 34% 38% 42% 38% 36%
Canada 4% 4% 4% 5% 5% 5% 5% 6% 6% 6% 6%
Chile 13% 11% 10% 10% 12% 13% 14% 14% 15% 15% 16%
China 13% 12% 11% 11% 11% 10% 9% 10% 11% 11% 11%
Colombia 12% 12% 12% 10% 11% 12% 12% 14% 16% 15% 17%
Costa Rica 17% 18% 17% 16% 15% 16% 15% 16% 19% 20% 23%
Croatia 10% 12% 13% 15% 16% 16% 16% 17% 19% 19% 18%
Czech Republic 6% 6% 7% 8% 8% 8% 8% 9% 11% 10% 10%
Denmark 4% 4% 4% 5% 6% 5% 5% 6% 6% 6% 6%
Dominican Republic 25% 24% 22% 17% 18% 24% 22% 22% 23% 22% 22%
Ecuador 12% 14% 15% 15% 14% 14% 14% 14% 14% 15% 14%
Egypt 45% 40% 35% 28% 28% 30% 31% 35% 40% 45% 49%
Estonia 8% 8% 8% 9% 11% 11% 10% 11% 14% 14% 12%
Finland 5% 5% 5% 6% 6% 6% 6% 6% 7% 7% 7%
France 6% 6% 6% 8% 8% 8% 8% 8% 9% 9% 8%
Georgia 39% 34% 27% 27% 33% 31% 39% 38% 44% 41% 44%
Germany 5% 5% 5% 6% 7% 6% 6% 6% 7% 7% 6%
Greece 8% 9% 10% 13% 13% 13% 13% 14% 15% 15% 15%
Guatemala 29% 26% 28% 28% 29% 32% 32% 34% 39% 37% 38%
Hong Kong 9% 9% 8% 8% 7% 7% 7% 7% 7% 7% 7%
Hungary 6% 7% 8% 9% 9% 9% 9% 11% 12% 10% 10%
India 24% 23% 21% 22% 20% 20% 19% 21% 20% 18% 19%
Indonesia 24% 22% 25% 27% 25% 22% 26% 28% 29% 28% 32%
Iran 11% 10% 11% 10% 11% 12% 12% 13% 18% 18% 17%
Ireland 4% 3% 4% 4% 4% 4% 4% 4% 5% 5% 4%
Israel 10% 10% 9% 10% 9% 9% 9% 10% 12% 11% 11%
Italy 7% 6% 7% 8% 9% 9% 9% 9% 10% 10% 9%
Japan 10% 9% 9% 9% 9% 8% 7% 7% 8% 9% 9%
Jordan 35% 33% 32% 31% 33% 35% 35% 38% 39% 37% 40%
Kazakhstan 18% 16% 14% 16% 17% 18% 20% 22% 28% 24% 23%

74
Table 4. FCE Ratios USDA Dataset (Cont.)
Country 2000 2001 2002 2003 2004 2005 2006 2007 2008 2009 2010
Kenya 35% 33% 31% 33% 32% 34% 37% 39% 44% 43% 41%
Kuwait 4% 4% 4% 4% 4% 4% 4% 4% 5% 5% 6%
Latvia 12% 12% 12% 13% 13% 13% 13% 14% 17% 17% 13%
Lithuania 14% 13% 14% 16% 17% 17% 17% 18% 19% 17% 15%
Macedonia 17% 17% 21% 26% 26% 27% 27% 30% 36% 34% 33%
Malaysia 8% 8% 7% 7% 7% 7% 7% 7% 8% 7% 8%
Mexico 13% 15% 15% 15% 15% 16% 16% 17% 17% 14% 16%
Morocco 24% 21% 21% 24% 25% 25% 25% 27% 30% 30% 29%
Netherlands 4% 4% 4% 5% 5% 5% 5% 5% 6% 6% 5%
New Zealand 5% 5% 5% 7% 8% 8% 8% 9% 9% 8% 9%
Nigeria 16% 20% 27% 29% 25% 30% 28% 27% 29% 23% 24%
Norway 4% 4% 4% 5% 5% 5% 5% 6% 6% 6% 6%
Pakistan 33% 29% 29% 29% 30% 30% 31% 32% 32% 35% 38%
Peru 20% 20% 19% 19% 20% 19% 19% 19% 21% 21% 22%
Philippines 29% 26% 26% 25% 25% 26% 28% 30% 33% 32% 34%
Poland 11% 12% 12% 11% 12% 13% 13% 14% 17% 13% 14%
Portugal 8% 8% 8% 10% 11% 11% 11% 12% 13% 12% 11%
Qatar 1% 1% 1% 1% 2% 2% 2% 2% 3% 2% 2%
Rep. Korea 8% 7% 7% 7% 7% 8% 8% 8% 7% 6% 7%
Romania 14% 14% 14% 17% 19% 21% 22% 26% 28% 23% 23%
Russian Federation 10% 12% 12% 12% 15% 16% 17% 18% 23% 21% 22%
Saudi Arabia 7% 7% 7% 6% 6% 6% 6% 7% 7% 8% 8%
Singapore 3% 3% 3% 3% 3% 3% 3% 3% 3% 3% 3%
Slovakia 9% 9% 9% 11% 11% 10% 10% 11% 12% 12% 11%
Slovenia 6% 7% 7% 9% 9% 9% 8% 9% 10% 10% 10%
South Africa 10% 8% 7% 11% 13% 13% 13% 13% 11% 11% 13%
Spain 6% 6% 7% 8% 9% 9% 8% 9% 9% 9% 8%
Sweden 5% 4% 5% 6% 6% 6% 6% 6% 6% 6% 6%
Switzerland 5% 5% 5% 6% 6% 6% 6% 6% 6% 6% 6%
Thailand 15% 13% 14% 15% 15% 15% 16% 17% 18% 17% 19%
Tunisia 19% 18% 19% 21% 22% 21% 20% 21% 22% 21% 21%
Turkey 14% 11% 12% 15% 16% 17% 16% 18% 20% 18% 19%
Turkmenistan 15% 28% 28% 40% 60% 53% 49% 28% 25% 18% 18%
Ukraine 16% 17% 18% 18% 19% 25% 28% 34% 43% 34% 35%
United Arab Emirates 4% 4% 4% 4% 5% 6% 6% 6% 6% 7% 8%
United Kingdom 5% 5% 5% 5% 6% 5% 5% 6% 6% 5% 5%
United States (ERS) 4% 4% 4% 4% 4% 4% 4% 4% 4% 4% 4%
Uruguay 18% 17% 13% 12% 13% 14% 15% 16% 19% 18% 21%
Uzbekistan 39% 30% 22% 19% 18% 17% 21% 22% 22% 25% 25%
Venezuela 14% 15% 12% 13% 13% 14% 15% 19% 24% 31% 33%
Viet Nam 26% 24% 23% 23% 23% 23% 24% 26% 32% 31% 30%
Total 7.60% 7.29% 7.25% 7.72% 8.00% 8.01% 8.00% 8.52% 9.29% 9.12% 9.42%
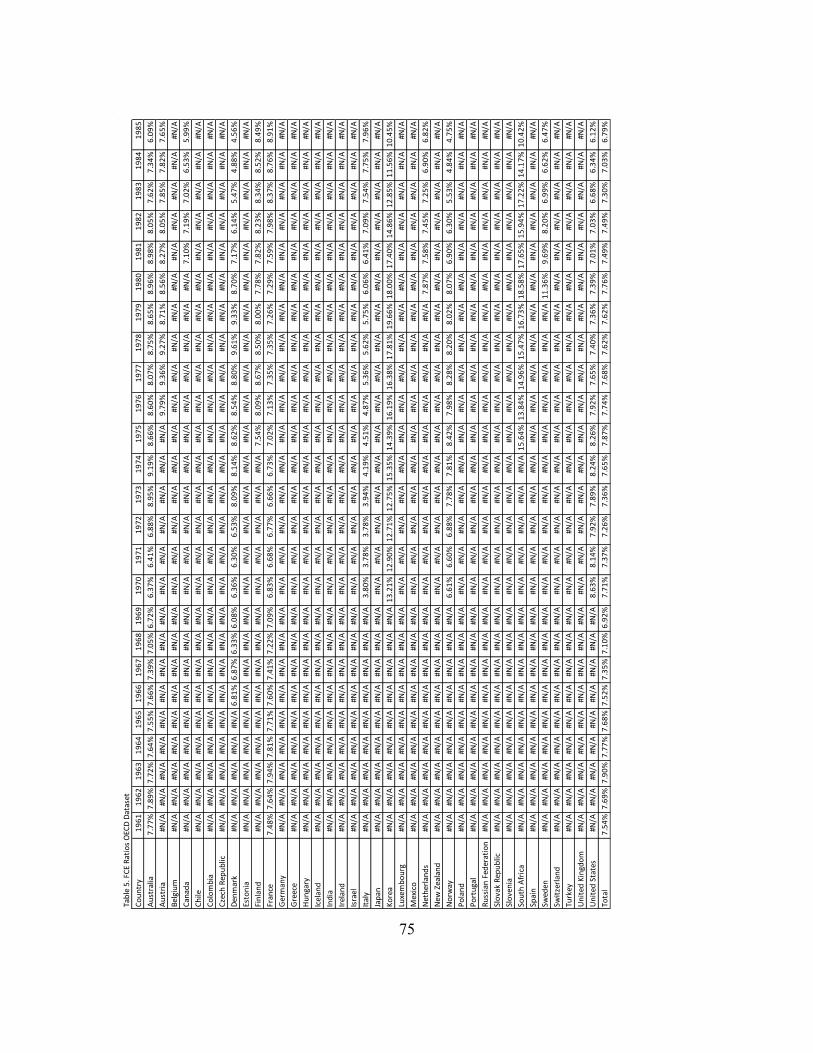
75
Tab
le 5
. FC
E R
atio
s O
ECD
Dat
aset
Co
un
try
19
61
19
62
19
63
19
64
19
65
19
66
19
67
19
68
19
69
19
70
19
71
19
72
19
73
19
74
19
75
19
76
19
77
19
78
19
79
19
80
19
81
19
82
19
83
19
84
19
85
Au
stra
lia7
.77
%7
.89
%7
.72
%7
.64
%7
.55
%7
.66
%7
.39
%7
.05
%6
.72
%6
.37
%6
.41
%6
.88
%8
.95
%9
.19
%8
.66
%8
.60
%8
.07
%8
.75
%8
.65
%8
.96
%8
.98
%8
.05
%7
.62
%7
.34
%6
.09
%
Au
stri
a#N
/A#N
/A#N
/A#N
/A#N
/A#N
/A#N
/A#N
/A#N
/A#N
/A#N
/A#N
/A#N
/A#N
/A#N
/A9
.79
%9
.36
%9
.27
%8
.71
%8
.56
%8
.27
%8
.05
%7
.85
%7
.82
%7
.65
%
Bel
giu
m#N
/A#N
/A#N
/A#N
/A#N
/A#N
/A#N
/A#N
/A#N
/A#N
/A#N
/A#N
/A#N
/A#N
/A#N
/A#N
/A#N
/A#N
/A#N
/A#N
/A#N
/A#N
/A#N
/A#N
/A#N
/A
Can
ada
#N/A
#N/A
#N/A
#N/A
#N/A
#N/A
#N/A
#N/A
#N/A
#N/A
#N/A
#N/A
#N/A
#N/A
#N/A
#N/A
#N/A
#N/A
#N/A
#N/A
7.1
0%
7.1
9%
7.0
2%
6.5
3%
5.9
9%
Ch
ile#N
/A#N
/A#N
/A#N
/A#N
/A#N
/A#N
/A#N
/A#N
/A#N
/A#N
/A#N
/A#N
/A#N
/A#N
/A#N
/A#N
/A#N
/A#N
/A#N
/A#N
/A#N
/A#N
/A#N
/A#N
/A
Co
lom
bia
#N/A
#N/A
#N/A
#N/A
#N/A
#N/A
#N/A
#N/A
#N/A
#N/A
#N/A
#N/A
#N/A
#N/A
#N/A
#N/A
#N/A
#N/A
#N/A
#N/A
#N/A
#N/A
#N/A
#N/A
#N/A
Cze
ch R
epu
blic
#N/A
#N/A
#N/A
#N/A
#N/A
#N/A
#N/A
#N/A
#N/A
#N/A
#N/A
#N/A
#N/A
#N/A
#N/A
#N/A
#N/A
#N/A
#N/A
#N/A
#N/A
#N/A
#N/A
#N/A
#N/A
Den
mar
k#N
/A#N
/A#N
/A#N
/A#N
/A6
.81
%6
.87
%6
.33
%6
.08
%6
.36
%6
.30
%6
.53
%8
.09
%8
.14
%8
.62
%8
.54
%8
.80
%9
.61
%9
.33
%8
.70
%7
.17
%6
.14
%5
.47
%4
.88
%4
.56
%
Esto
nia
#N/A
#N/A
#N/A
#N/A
#N/A
#N/A
#N/A
#N/A
#N/A
#N/A
#N/A
#N/A
#N/A
#N/A
#N/A
#N/A
#N/A
#N/A
#N/A
#N/A
#N/A
#N/A
#N/A
#N/A
#N/A
Fin
lan
d#N
/A#N
/A#N
/A#N
/A#N
/A#N
/A#N
/A#N
/A#N
/A#N
/A#N
/A#N
/A#N
/A#N
/A7
.54
%8
.09
%8
.67
%8
.50
%8
.00
%7
.78
%7
.82
%8
.23
%8
.34
%8
.52
%8
.49
%
Fran
ce7
.48
%7
.64
%7
.94
%7
.81
%7
.71
%7
.60
%7
.41
%7
.22
%7
.09
%6
.83
%6
.68
%6
.77
%6
.66
%6
.73
%7
.02
%7
.13
%7
.35
%7
.35
%7
.26
%7
.29
%7
.59
%7
.98
%8
.37
%8
.76
%8
.91
%
Ger
man
y#N
/A#N
/A#N
/A#N
/A#N
/A#N
/A#N
/A#N
/A#N
/A#N
/A#N
/A#N
/A#N
/A#N
/A#N
/A#N
/A#N
/A#N
/A#N
/A#N
/A#N
/A#N
/A#N
/A#N
/A#N
/A
Gre
ece
#N/A
#N/A
#N/A
#N/A
#N/A
#N/A
#N/A
#N/A
#N/A
#N/A
#N/A
#N/A
#N/A
#N/A
#N/A
#N/A
#N/A
#N/A
#N/A
#N/A
#N/A
#N/A
#N/A
#N/A
#N/A
Hu
nga
ry#N
/A#N
/A#N
/A#N
/A#N
/A#N
/A#N
/A#N
/A#N
/A#N
/A#N
/A#N
/A#N
/A#N
/A#N
/A#N
/A#N
/A#N
/A#N
/A#N
/A#N
/A#N
/A#N
/A#N
/A#N
/A
Icel
and
#N/A
#N/A
#N/A
#N/A
#N/A
#N/A
#N/A
#N/A
#N/A
#N/A
#N/A
#N/A
#N/A
#N/A
#N/A
#N/A
#N/A
#N/A
#N/A
#N/A
#N/A
#N/A
#N/A
#N/A
#N/A
Ind
ia#N
/A#N
/A#N
/A#N
/A#N
/A#N
/A#N
/A#N
/A#N
/A#N
/A#N
/A#N
/A#N
/A#N
/A#N
/A#N
/A#N
/A#N
/A#N
/A#N
/A#N
/A#N
/A#N
/A#N
/A#N
/A
Irel
and
#N/A
#N/A
#N/A
#N/A
#N/A
#N/A
#N/A
#N/A
#N/A
#N/A
#N/A
#N/A
#N/A
#N/A
#N/A
#N/A
#N/A
#N/A
#N/A
#N/A
#N/A
#N/A
#N/A
#N/A
#N/A
Isra
el#N
/A#N
/A#N
/A#N
/A#N
/A#N
/A#N
/A#N
/A#N
/A#N
/A#N
/A#N
/A#N
/A#N
/A#N
/A#N
/A#N
/A#N
/A#N
/A#N
/A#N
/A#N
/A#N
/A#N
/A#N
/A
Ital
y#N
/A#N
/A#N
/A#N
/A#N
/A#N
/A#N
/A#N
/A#N
/A3
.80
%3
.78
%3
.78
%3
.94
%4
.19
%4
.51
%4
.87
%5
.36
%5
.62
%5
.75
%6
.06
%6
.41
%7
.09
%7
.54
%7
.75
%7
.96
%
Jap
an#N
/A#N
/A#N
/A#N
/A#N
/A#N
/A#N
/A#N
/A#N
/A#N
/A#N
/A#N
/A#N
/A#N
/A#N
/A#N
/A#N
/A#N
/A#N
/A#N
/A#N
/A#N
/A#N
/A#N
/A#N
/A
Ko
rea
#N/A
#N/A
#N/A
#N/A
#N/A
#N/A
#N/A
#N/A
#N/A
13
.21
%1
2.9
0%
12
.71
%1
2.7
5%
15
.35
%1
4.3
9%
16
.19
%1
6.3
8%
17
.81
%1
9.6
6%
18
.00
%1
7.4
0%
14
.86
%1
2.8
5%
11
.56
%1
0.4
5%
Luxe
mb
ou
rg#N
/A#N
/A#N
/A#N
/A#N
/A#N
/A#N
/A#N
/A#N
/A#N
/A#N
/A#N
/A#N
/A#N
/A#N
/A#N
/A#N
/A#N
/A#N
/A#N
/A#N
/A#N
/A#N
/A#N
/A#N
/A
Mex
ico
#N/A
#N/A
#N/A
#N/A
#N/A
#N/A
#N/A
#N/A
#N/A
#N/A
#N/A
#N/A
#N/A
#N/A
#N/A
#N/A
#N/A
#N/A
#N/A
#N/A
#N/A
#N/A
#N/A
#N/A
#N/A
Net
her
lan
ds
#N/A
#N/A
#N/A
#N/A
#N/A
#N/A
#N/A
#N/A
#N/A
#N/A
#N/A
#N/A
#N/A
#N/A
#N/A
#N/A
#N/A
#N/A
#N/A
7.8
7%
7.5
8%
7.4
5%
7.2
5%
6.9
0%
6.8
2%
New
Zea
lan
d#N
/A#N
/A#N
/A#N
/A#N
/A#N
/A#N
/A#N
/A#N
/A#N
/A#N
/A#N
/A#N
/A#N
/A#N
/A#N
/A#N
/A#N
/A#N
/A#N
/A#N
/A#N
/A#N
/A#N
/A#N
/A
No
rway
#N/A
#N/A
#N/A
#N/A
#N/A
#N/A
#N/A
#N/A
#N/A
6.6
1%
6.6
0%
6.8
8%
7.7
8%
7.8
1%
8.4
2%
7.9
8%
8.2
8%
8.2
0%
8.0
2%
8.0
7%
6.9
0%
6.3
0%
5.5
3%
4.8
4%
4.7
5%
Po
lan
d#N
/A#N
/A#N
/A#N
/A#N
/A#N
/A#N
/A#N
/A#N
/A#N
/A#N
/A#N
/A#N
/A#N
/A#N
/A#N
/A#N
/A#N
/A#N
/A#N
/A#N
/A#N
/A#N
/A#N
/A#N
/A
Po
rtu
gal
#N/A
#N/A
#N/A
#N/A
#N/A
#N/A
#N/A
#N/A
#N/A
#N/A
#N/A
#N/A
#N/A
#N/A
#N/A
#N/A
#N/A
#N/A
#N/A
#N/A
#N/A
#N/A
#N/A
#N/A
#N/A
Ru
ssia
n F
eder
atio
n#N
/A#N
/A#N
/A#N
/A#N
/A#N
/A#N
/A#N
/A#N
/A#N
/A#N
/A#N
/A#N
/A#N
/A#N
/A#N
/A#N
/A#N
/A#N
/A#N
/A#N
/A#N
/A#N
/A#N
/A#N
/A
Slo
vak
Rep
ub
lic#N
/A#N
/A#N
/A#N
/A#N
/A#N
/A#N
/A#N
/A#N
/A#N
/A#N
/A#N
/A#N
/A#N
/A#N
/A#N
/A#N
/A#N
/A#N
/A#N
/A#N
/A#N
/A#N
/A#N
/A#N
/A
Slo
ven
ia#N
/A#N
/A#N
/A#N
/A#N
/A#N
/A#N
/A#N
/A#N
/A#N
/A#N
/A#N
/A#N
/A#N
/A#N
/A#N
/A#N
/A#N
/A#N
/A#N
/A#N
/A#N
/A#N
/A#N
/A#N
/A
Sou
th A
fric
a#N
/A#N
/A#N
/A#N
/A#N
/A#N
/A#N
/A#N
/A#N
/A#N
/A#N
/A#N
/A#N
/A#N
/A1
5.6
4%
13
.84
%1
4.9
6%
15
.47
%1
6.7
3%
18
.58
%1
7.6
5%
15
.94
%1
7.2
2%
14
.17
%1
0.4
2%
Spai
n#N
/A#N
/A#N
/A#N
/A#N
/A#N
/A#N
/A#N
/A#N
/A#N
/A#N
/A#N
/A#N
/A#N
/A#N
/A#N
/A#N
/A#N
/A#N
/A#N
/A#N
/A#N
/A#N
/A#N
/A#N
/A
Swed
en#N
/A#N
/A#N
/A#N
/A#N
/A#N
/A#N
/A#N
/A#N
/A#N
/A#N
/A#N
/A#N
/A#N
/A#N
/A#N
/A#N
/A#N
/A#N
/A1
1.3
6%
9.6
9%
8.2
0%
6.9
9%
6.6
2%
6.4
7%
Swit
zerl
and
#N/A
#N/A
#N/A
#N/A
#N/A
#N/A
#N/A
#N/A
#N/A
#N/A
#N/A
#N/A
#N/A
#N/A
#N/A
#N/A
#N/A
#N/A
#N/A
#N/A
#N/A
#N/A
#N/A
#N/A
#N/A
Turk
ey#N
/A#N
/A#N
/A#N
/A#N
/A#N
/A#N
/A#N
/A#N
/A#N
/A#N
/A#N
/A#N
/A#N
/A#N
/A#N
/A#N
/A#N
/A#N
/A#N
/A#N
/A#N
/A#N
/A#N
/A#N
/A
Un
ited
Kin
gdo
m#N
/A#N
/A#N
/A#N
/A#N
/A#N
/A#N
/A#N
/A#N
/A#N
/A#N
/A#N
/A#N
/A#N
/A#N
/A#N
/A#N
/A#N
/A#N
/A#N
/A#N
/A#N
/A#N
/A#N
/A#N
/A
Un
ited
Sta
tes
#N/A
#N/A
#N/A
#N/A
#N/A
#N/A
#N/A
#N/A
#N/A
8.6
3%
8.1
4%
7.9
2%
7.8
9%
8.2
4%
8.2
6%
7.9
2%
7.6
5%
7.4
0%
7.3
6%
7.3
9%
7.0
1%
7.0
3%
6.6
8%
6.3
4%
6.1
2%
Tota
l7
.54
%7
.69
%7
.90
%7
.77
%7
.68
%7
.52
%7
.35
%7
.10
%6
.92
%7
.71
%7
.37
%7
.26
%7
.36
%7
.65
%7
.87
%7
.74
%7
.68
%7
.62
%7
.62
%7
.76
%7
.49
%7
.49
%7
.30
%7
.03
%6
.79
%
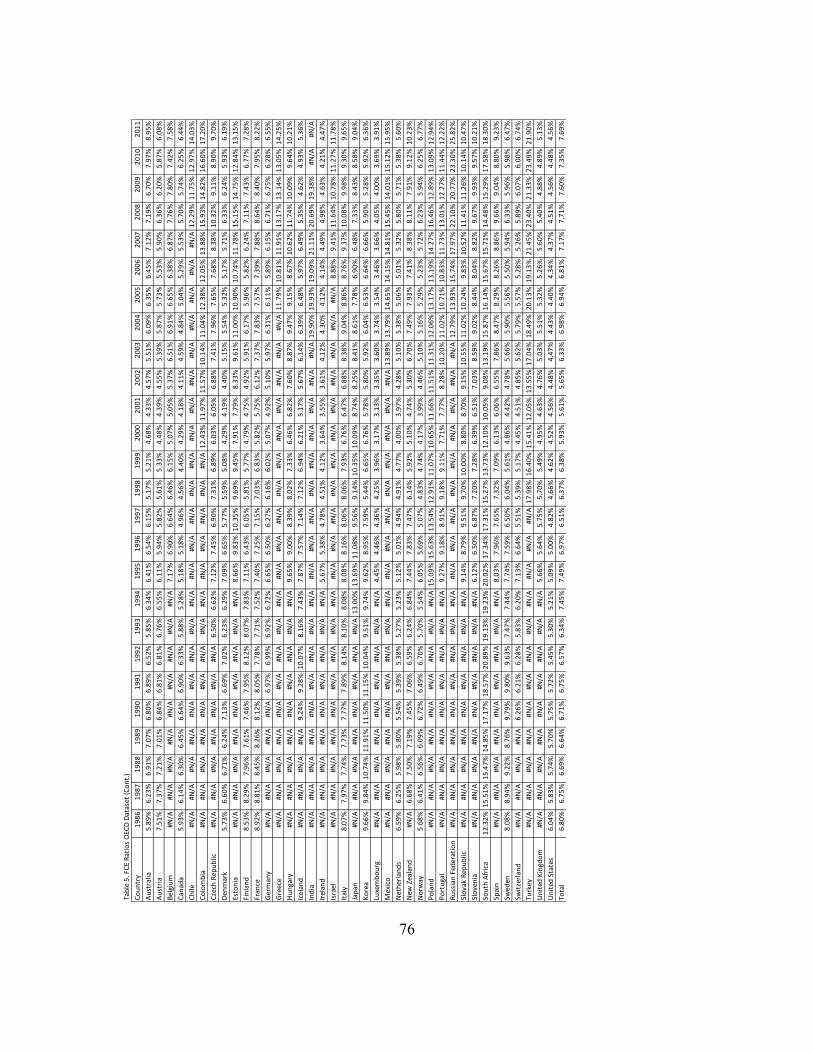
76
Tab
le 5
. FC
E R
atio
s O
ECD
Dat
aset
(C
on
t.)
Co
un
try
19
86
19
87
19
88
19
89
19
90
19
91
19
92
19
93
19
94
19
95
19
96
19
97
19
98
19
99
20
00
20
01
20
02
20
03
20
04
20
05
20
06
20
07
20
08
20
09
20
10
20
11
Au
stra
lia5
.89
%6
.23
%6
.91
%7
.07
%6
.80
%6
.89
%6
.52
%5
.85
%6
.34
%6
.41
%6
.54
%6
.15
%5
.17
%5
.21
%4
.68
%4
.33
%4
.57
%5
.51
%6
.09
%6
.35
%6
.45
%7
.12
%7
.19
%6
.70
%7
.97
%8
.95
%
Au
stri
a7
.51
%7
.37
%7
.21
%7
.01
%6
.84
%6
.81
%6
.81
%6
.76
%6
.55
%6
.11
%5
.94
%5
.82
%5
.61
%5
.33
%4
.48
%4
.39
%4
.55
%5
.39
%5
.87
%5
.73
%5
.53
%5
.90
%6
.36
%6
.20
%5
.87
%6
.08
%
Bel
giu
m#N
/A#N
/A#N
/A#N
/A#N
/A#N
/A#N
/A#N
/A#N
/A7
.17
%6
.90
%6
.64
%6
.46
%6
.15
%5
.07
%5
.05
%5
.37
%6
.51
%6
.91
%6
.65
%6
.38
%6
.87
%7
.76
%7
.80
%7
.42
%7
.58
%
Can
ada
5.9
3%
6.1
4%
6.3
0%
6.4
5%
6.6
4%
6.9
0%
6.3
3%
5.8
8%
5.2
8%
5.1
8%
5.1
8%
4.9
6%
4.5
6%
4.4
0%
4.2
9%
4.1
8%
4.1
1%
4.5
9%
4.8
4%
5.0
4%
5.2
9%
5.5
3%
5.7
0%
5.7
4%
6.2
5%
6.4
4%
Ch
ile#N
/A#N
/A#N
/A#N
/A#N
/A#N
/A#N
/A#N
/A#N
/A#N
/A#N
/A#N
/A#N
/A#N
/A#N
/A#N
/A#N
/A#N
/A#N
/A#N
/A#N
/A#N
/A1
2.2
9%
11
.75
%1
2.9
7%
14
.03
%
Co
lom
bia
#N/A
#N/A
#N/A
#N/A
#N/A
#N/A
#N/A
#N/A
#N/A
#N/A
#N/A
#N/A
#N/A
#N/A
12
.43
%1
1.9
7%
11
.57
%1
0.1
4%
11
.04
%1
2.3
8%
12
.05
%1
3.8
8%
15
.93
%1
4.8
2%
16
.60
%1
7.2
0%
Cze
ch R
epu
blic
#N/A
#N/A
#N/A
#N/A
#N/A
#N/A
#N/A
6.5
0%
6.6
2%
7.1
2%
7.4
5%
6.9
0%
7.3
1%
6.8
9%
6.0
3%
6.0
5%
6.8
8%
7.4
1%
7.9
6%
7.6
5%
7.6
8%
8.3
8%
10
.32
%9
.11
%8
.90
%9
.70
%
Den
mar
k5
.73
%6
.60
%6
.71
%6
.24
%7
.13
%6
.69
%7
.02
%6
.23
%6
.29
%7
.09
%6
.65
%5
.77
%5
.59
%5
.08
%4
.29
%4
.19
%4
.40
%5
.15
%5
.54
%5
.32
%5
.17
%5
.71
%6
.33
%6
.24
%5
.93
%6
.19
%
Esto
nia
#N/A
#N/A
#N/A
#N/A
#N/A
#N/A
#N/A
#N/A
#N/A
8.6
6%
9.8
3%
10
.35
%9
.69
%9
.45
%7
.91
%7
.79
%8
.33
%9
.61
%1
1.0
0%
10
.90
%1
0.7
4%
11
.78
%1
5.1
5%
14
.75
%1
2.8
4%
13
.15
%
Fin
lan
d8
.53
%8
.29
%7
.96
%7
.61
%7
.46
%7
.95
%8
.12
%8
.07
%7
.83
%7
.11
%6
.43
%6
.05
%5
.81
%5
.77
%4
.79
%4
.75
%4
.92
%5
.91
%6
.17
%5
.96
%5
.82
%6
.24
%7
.11
%7
.43
%6
.77
%7
.28
%
Fran
ce8
.92
%8
.81
%8
.45
%8
.26
%8
.12
%8
.05
%7
.78
%7
.71
%7
.52
%7
.40
%7
.25
%7
.15
%7
.03
%6
.83
%5
.82
%5
.75
%6
.12
%7
.37
%7
.83
%7
.57
%7
.39
%7
.88
%8
.64
%8
.40
%7
.95
%8
.22
%
Ger
man
y#N
/A#N
/A#N
/A#N
/A#N
/A6
.97
%6
.99
%6
.92
%6
.72
%6
.65
%6
.50
%6
.27
%6
.16
%6
.02
%5
.07
%4
.92
%5
.10
%5
.97
%6
.31
%6
.11
%5
.89
%6
.15
%6
.71
%6
.75
%6
.28
%6
.55
%
Gre
ece
#N/A
#N/A
#N/A
#N/A
#N/A
#N/A
#N/A
#N/A
#N/A
#N/A
#N/A
#N/A
#N/A
#N/A
#N/A
#N/A
#N/A
#N/A
#N/A
11
.79
%1
0.8
1%
11
.91
%1
3.1
7%
13
.14
%1
3.0
5%
14
.25
%
Hu
nga
ry#N
/A#N
/A#N
/A#N
/A#N
/A#N
/A#N
/A#N
/A#N
/A9
.65
%9
.00
%8
.39
%8
.02
%7
.33
%6
.46
%6
.82
%7
.60
%8
.87
%9
.47
%9
.15
%8
.67
%1
0.6
2%
11
.74
%1
0.0
9%
9.6
4%
10
.21
%
Icel
and
#N/A
#N/A
#N/A
#N/A
9.2
4%
9.2
8%
10
.07
%8
.16
%7
.43
%7
.87
%7
.57
%7
.14
%7
.12
%6
.94
%6
.21
%5
.17
%5
.67
%6
.14
%6
.39
%6
.48
%5
.97
%6
.49
%5
.35
%4
.62
%4
.93
%5
.36
%
Ind
ia#N
/A#N
/A#N
/A#N
/A#N
/A#N
/A#N
/A#N
/A#N
/A#N
/A#N
/A#N
/A#N
/A#N
/A#N
/A#N
/A#N
/A#N
/A1
9.9
0%
19
.93
%1
9.0
9%
21
.11
%2
0.6
9%
19
.38
%#N
/A#N
/A
Irel
and
#N/A
#N/A
#N/A
#N/A
#N/A
#N/A
#N/A
#N/A
#N/A
5.6
7%
5.3
8%
4.7
8%
4.5
1%
4.1
2%
3.6
4%
3.5
5%
3.6
1%
4.1
2%
4.3
0%
4.1
2%
4.1
4%
4.4
9%
4.9
8%
4.6
3%
4.2
1%
4.4
7%
Isra
el#N
/A#N
/A#N
/A#N
/A#N
/A#N
/A#N
/A#N
/A#N
/A#N
/A#N
/A#N
/A#N
/A#N
/A#N
/A#N
/A#N
/A#N
/A#N
/A#N
/A8
.88
%9
.41
%1
1.6
4%
10
.78
%1
1.2
7%
11
.78
%
Ital
y8
.07
%7
.97
%7
.74
%7
.73
%7
.77
%7
.89
%8
.14
%8
.10
%8
.08
%8
.08
%8
.16
%8
.06
%8
.06
%7
.93
%6
.76
%6
.47
%6
.88
%8
.38
%9
.04
%8
.86
%8
.76
%9
.37
%1
0.0
8%
9.9
8%
9.3
0%
9.6
5%
Jap
an#N
/A#N
/A#N
/A#N
/A#N
/A#N
/A#N
/A#N
/A1
3.0
0%
13
.69
%1
1.0
8%
9.5
6%
9.1
4%
10
.35
%1
0.0
9%
8.7
4%
8.2
5%
8.4
1%
8.6
1%
7.7
8%
6.9
0%
6.4
8%
7.3
3%
8.4
3%
8.5
8%
9.0
4%
Ko
rea
9.6
6%
9.8
4%
10
.74
%1
1.9
1%
11
.50
%1
1.1
5%
10
.04
%9
.51
%9
.74
%9
.62
%8
.95
%7
.59
%5
.44
%6
.65
%6
.76
%5
.78
%5
.80
%5
.92
%6
.04
%6
.53
%6
.64
%6
.66
%5
.90
%5
.28
%5
.92
%6
.36
%
Luxe
mb
ou
rg#N
/A#N
/A#N
/A#N
/A#N
/A#N
/A#N
/A#N
/A#N
/A4
.45
%4
.46
%4
.36
%4
.25
%3
.96
%3
.17
%3
.13
%3
.35
%3
.60
%3
.74
%3
.54
%3
.46
%3
.66
%4
.05
%4
.00
%3
.69
%3
.91
%
Mex
ico
#N/A
#N/A
#N/A
#N/A
#N/A
#N/A
#N/A
#N/A
#N/A
#N/A
#N/A
#N/A
#N/A
#N/A
#N/A
#N/A
#N/A
13
.89
%1
3.7
9%
14
.65
%1
4.1
5%
14
.81
%1
5.4
5%
14
.01
%1
5.1
2%
15
.95
%
Net
her
lan
ds
6.5
9%
6.2
5%
5.9
8%
5.8
0%
5.5
4%
5.3
9%
5.3
8%
5.2
7%
5.2
3%
5.1
2%
5.0
1%
4.9
4%
4.9
1%
4.7
7%
4.0
0%
3.9
7%
4.2
8%
5.1
0%
5.3
8%
5.0
6%
5.0
1%
5.3
2%
5.8
0%
5.7
1%
5.3
8%
5.6
0%
New
Zea
lan
d#N
/A6
.68
%7
.50
%7
.19
%7
.45
%7
.06
%6
.59
%6
.24
%6
.84
%7
.44
%7
.83
%7
.47
%6
.14
%5
.92
%5
.10
%4
.74
%5
.30
%6
.70
%7
.49
%7
.93
%7
.41
%8
.38
%8
.11
%7
.91
%9
.12
%1
0.2
3%
No
rway
5.6
8%
6.4
1%
6.5
6%
6.0
9%
6.7
2%
6.4
9%
6.7
0%
5.7
0%
5.5
4%
6.0
5%
5.6
9%
5.0
7%
4.8
3%
4.7
4%
4.1
7%
3.9
9%
4.4
6%
5.1
0%
5.1
6%
5.2
9%
5.2
3%
5.7
2%
6.2
3%
5.9
4%
6.2
5%
6.7
7%
Po
lan
d#N
/A#N
/A#N
/A#N
/A#N
/A#N
/A#N
/A#N
/A#N
/A1
5.0
9%
15
.63
%1
3.5
4%
12
.91
%1
1.0
7%
10
.65
%1
1.6
6%
11
.51
%1
1.3
1%
12
.06
%1
3.1
7%
13
.19
%1
4.2
7%
16
.46
%1
2.8
9%
13
.09
%1
2.9
4%
Po
rtu
gal
#N/A
#N/A
#N/A
#N/A
#N/A
#N/A
#N/A
#N/A
#N/A
9.2
7%
9.1
8%
8.9
1%
9.1
8%
9.1
1%
7.7
1%
7.7
7%
8.2
8%
10
.20
%1
1.0
2%
10
.71
%1
0.8
3%
11
.73
%1
3.0
1%
12
.27
%1
1.4
4%
12
.22
%
Ru
ssia
n F
eder
atio
n#N
/A#N
/A#N
/A#N
/A#N
/A#N
/A#N
/A#N
/A#N
/A#N
/A#N
/A#N
/A#N
/A#N
/A#N
/A#N
/A#N
/A#N
/A1
2.7
9%
13
.93
%1
5.7
4%
17
.97
%2
2.1
0%
20
.77
%2
3.3
0%
25
.82
%
Slo
vak
Rep
ub
lic#N
/A#N
/A#N
/A#N
/A#N
/A#N
/A#N
/A#N
/A#N
/A9
.14
%8
.79
%9
.51
%9
.70
%1
0.0
0%
8.8
0%
8.7
0%
9.1
5%
10
.55
%1
1.0
2%
10
.24
%9
.83
%1
0.5
2%
11
.41
%1
1.2
6%
10
.14
%1
0.4
7%
Slo
ven
ia#N
/A#N
/A#N
/A#N
/A#N
/A#N
/A#N
/A#N
/A#N
/A6
.12
%6
.50
%6
.87
%7
.20
%7
.28
%6
.39
%6
.51
%7
.03
%8
.59
%9
.02
%8
.44
%8
.04
%8
.82
%9
.67
%9
.93
%9
.57
%1
0.2
1%
Sou
th A
fric
a1
2.3
2%
15
.51
%1
5.4
7%
14
.85
%1
7.1
7%
18
.57
%2
0.8
9%
19
.13
%1
9.2
3%
20
.02
%1
7.3
4%
17
.31
%1
5.2
7%
13
.73
%1
2.1
0%
10
.05
%9
.08
%1
3.1
9%
15
.87
%1
6.1
4%
15
.67
%1
5.7
1%
14
.48
%1
5.2
9%
17
.58
%1
8.3
0%
Spai
n#N
/A#N
/A#N
/A#N
/A#N
/A#N
/A#N
/A#N
/A#N
/A8
.03
%7
.96
%7
.65
%7
.32
%7
.09
%6
.13
%6
.06
%6
.55
%7
.86
%8
.47
%8
.29
%8
.26
%8
.86
%9
.66
%9
.04
%8
.80
%9
.23
%
Swed
en8
.08
%8
.94
%9
.22
%8
.76
%9
.79
%9
.80
%9
.63
%7
.47
%7
.44
%7
.74
%7
.59
%6
.50
%6
.04
%5
.61
%4
.86
%4
.42
%4
.78
%5
.66
%5
.90
%5
.56
%5
.50
%5
.94
%6
.33
%5
.96
%5
.98
%6
.47
%
Swit
zerl
and
#N/A
#N/A
#N/A
#N/A
6.2
6%
6.2
1%
6.2
8%
5.8
3%
6.2
0%
7.1
3%
6.6
4%
5.5
1%
5.3
9%
5.1
7%
4.4
5%
4.5
1%
4.8
5%
5.6
2%
5.7
9%
5.5
7%
5.2
8%
5.2
6%
5.8
9%
6.0
7%
6.0
0%
6.7
4%
Turk
ey#N
/A#N
/A#N
/A#N
/A#N
/A#N
/A#N
/A#N
/A#N
/A#N
/A#N
/A#N
/A1
7.9
8%
16
.40
%1
5.4
1%
12
.05
%1
3.5
5%
17
.04
%1
8.4
9%
20
.13
%1
9.1
3%
21
.45
%2
3.4
0%
21
.33
%2
3.4
9%
21
.90
%
Un
ited
Kin
gdo
m#N
/A#N
/A#N
/A#N
/A#N
/A#N
/A#N
/A#N
/A#N
/A5
.66
%5
.64
%5
.75
%5
.70
%5
.49
%4
.95
%4
.63
%4
.76
%5
.03
%5
.51
%5
.32
%5
.26
%5
.60
%5
.40
%4
.88
%4
.89
%5
.13
%
Un
ited
Sta
tes
6.0
4%
5.8
3%
5.7
4%
5.7
0%
5.7
5%
5.7
2%
5.4
5%
5.3
0%
5.2
1%
5.0
9%
5.0
0%
4.8
2%
4.6
6%
4.6
2%
4.5
2%
4.5
6%
4.4
8%
4.4
7%
4.4
3%
4.4
0%
4.3
4%
4.3
7%
4.5
1%
4.5
6%
4.4
8%
4.5
6%
Tota
l6
.80
%6
.75
%6
.69
%6
.64
%6
.71
%6
.75
%6
.57
%6
.34
%7
.45
%7
.49
%6
.97
%6
.51
%6
.37
%6
.38
%5
.93
%5
.61
%5
.65
%6
.33
%6
.98
%6
.94
%6
.81
%7
.17
%7
.71
%7
.60
%7
.35
%7
.69
%

77
Tab
le 6
. PC
E R
atio
s FA
O D
atas
et -
Del
eted
Val
ues
Sh
aded
Co
un
try
19
61
19
62
19
63
19
64
19
65
19
66
19
67
19
68
19
69
19
70
19
71
19
72
19
73
19
74
19
75
19
76
19
77
19
78
19
79
19
80
19
81
19
82
19
83
19
84
19
85
Afg
han
ista
n--
----
----
----
----
----
----
----
----
----
----
----
----
Alb
ania
----
----
----
----
----
----
----
----
----
--1
6.2
5%
16
.93
%1
7.2
5%
18
.23
%1
7.0
4%
16
.65
%
Alg
eria
23
.51
%2
8.7
3%
20
.42
%1
8.7
0%
19
.53
%1
4.7
7%
15
.10
%1
6.7
4%
14
.50
%1
3.2
6%
16
.22
%1
2.6
5%
12
.19
%1
5.0
4%
18
.11
%1
3.7
4%
12
.84
%1
2.7
7%
12
.53
%1
5.0
6%
14
.31
%1
2.4
6%
11
.82
%1
0.8
0%
12
.34
%
An
gola
----
----
----
----
----
----
----
----
----
----
----
----
5.0
9%
An
tigu
a an
d B
arb
ud
a--
----
----
----
----
----
----
----
--1
1.5
2%
13
.16
%1
2.8
3%
15
.10
%1
4.8
0%
14
.12
%1
3.3
1%
13
.69
%1
1.3
3%
Arg
enti
na
9.6
8%
8.9
1%
9.7
1%
7.1
9%
5.3
7%
6.7
1%
8.9
3%
8.2
5%
7.8
7%
7.1
6%
6.2
6%
6.1
4%
4.0
2%
3.8
0%
6.3
5%
6.4
0%
4.5
3%
6.3
1%
5.2
3%
4.9
0%
4.3
7%
7.3
4%
5.1
7%
6.9
8%
8.0
6%
Arm
enia
----
----
----
----
----
----
----
----
----
----
----
----
--
Au
stra
lia3
.23
%3
.38
%3
.56
%2
.74
%2
.66
%3
.48
%2
.46
%3
.36
%3
.17
%2
.80
%2
.63
%2
.18
%2
.00
%0
.99
%0
.77
%1
.33
%1
.54
%2
.42
%1
.98
%0
.08
%0
.67
%0
.94
%2
.60
%2
.16
%1
.90
%
Au
stri
a6
.06
%5
.92
%6
.01
%5
.80
%5
.20
%5
.36
%5
.13
%5
.08
%4
.62
%4
.35
%4
.14
%3
.79
%4
.13
%3
.92
%3
.94
%3
.88
%3
.90
%3
.97
%3
.82
%3
.89
%3
.56
%3
.70
%3
.33
%3
.41
%3
.26
%
Aze
rbai
jan
----
----
----
----
----
----
----
----
----
----
----
----
--
Bah
amas
5.2
9%
4.6
5%
4.5
4%
4.7
4%
4.4
4%
4.9
4%
4.7
0%
4.7
1%
5.9
7%
6.3
2%
5.8
6%
6.3
6%
6.4
7%
7.9
4%
8.1
1%
8.3
0%
5.6
4%
4.7
1%
4.9
1%
6.3
1%
4.9
6%
6.7
3%
5.6
2%
5.2
5%
5.0
5%
Bah
rain
----
----
----
----
----
----
----
----
----
--6
.21
%5
.62
%6
.22
%6
.08
%5
.98
%5
.69
%
Ban
glad
esh
23
.96
%2
1.0
1%
25
.94
%2
2.5
3%
20
.43
%2
0.7
0%
24
.13
%2
2.5
8%
23
.28
%2
1.9
4%
22
.15
%2
5.8
5%
32
.68
%2
8.7
0%
31
.31
%2
6.3
8%
23
.73
%2
5.3
9%
22
.38
%2
5.3
5%
22
.15
%2
3.1
0%
22
.53
%2
1.5
4%
23
.19
%
Bar
bad
os
5.4
2%
5.7
1%
3.0
7%
5.4
1%
5.2
9%
5.0
3%
4.7
7%
5.7
1%
5.9
9%
6.4
7%
6.7
1%
7.4
1%
7.1
1%
5.9
3%
2.9
2%
6.5
6%
6.9
7%
7.4
6%
6.5
8%
5.4
3%
7.3
8%
7.0
7%
7.5
1%
6.6
1%
6.2
0%
Bel
aru
s--
----
----
----
----
----
----
----
----
----
----
----
----
Bel
giu
m--
----
----
----
----
----
----
----
----
----
----
----
----
Bel
ize
9.8
2%
21
.50
%1
0.7
4%
8.6
5%
15
.83
%1
4.1
5%
17
.23
%1
8.3
9%
18
.57
%2
0.6
4%
20
.88
%1
1.8
8%
9.2
3%
-0.2
4%
-17
.95
%1
3.4
7%
8.1
6%
4.0
3%
7.4
6%
-2.7
3%
10
.24
%9
.62
%7
.88
%8
.58
%1
2.3
9%
Ben
in1
6.8
8%
16
.63
%1
6.3
1%
15
.67
%1
5.4
1%
15
.35
%1
5.8
2%
15
.61
%1
4.4
3%
13
.93
%1
4.5
5%
14
.57
%1
4.2
1%
13
.21
%1
3.6
0%
15
.85
%1
5.7
1%
16
.45
%1
7.0
7%
16
.06
%1
5.4
4%
15
.62
%1
6.1
8%
16
.56
%1
5.0
6%
Ber
mu
da
5.5
7%
5.2
6%
5.5
1%
4.9
5%
4.9
8%
4.7
0%
3.9
4%
4.0
8%
3.9
3%
3.7
6%
3.8
1%
4.1
8%
4.5
2%
4.9
9%
4.3
9%
4.1
6%
3.5
7%
3.7
9%
3.7
6%
3.6
0%
3.6
2%
3.5
0%
3.5
7%
3.6
4%
3.4
9%
Bh
uta
n--
----
----
----
----
----
----
----
----
----
96
.91
%9
3.6
4%
91
.70
%8
4.5
5%
85
.64
%7
4.4
9%
Bo
livia
14
.50
%1
4.5
1%
14
.63
%1
3.1
0%
13
.43
%1
2.0
4%
11
.68
%1
4.4
1%
13
.76
%1
4.3
5%
13
.62
%1
3.3
8%
11
.96
%1
3.4
8%
14
.36
%1
2.3
7%
11
.57
%1
2.6
0%
12
.04
%1
2.9
0%
15
.18
%1
5.0
6%
12
.85
%1
5.3
2%
17
.30
%
Bo
snia
an
d H
erze
govi
na
----
----
----
----
----
----
----
----
----
----
----
----
--
Bo
tsw
ana
4.6
0%
5.5
2%
3.6
5%
-2.1
7%
0.0
6%
-0.6
4%
2.9
9%
4.4
0%
5.5
3%
3.0
7%
3.8
2%
1.8
6%
-6.6
5%
-4.9
8%
-4.7
9%
-2.0
3%
0.2
3%
3.5
6%
-1.5
1%
6.4
1%
2.1
1%
1.4
3%
3.2
9%
3.7
8%
2.2
4%
Bra
zil
5.2
5%
6.0
0%
5.8
0%
6.3
1%
6.5
9%
5.9
3%
6.7
5%
6.0
0%
5.4
1%
5.0
1%
4.7
9%
3.9
0%
2.9
4%
2.9
7%
3.2
3%
2.8
7%
2.1
3%
2.6
6%
3.0
7%
2.7
7%
3.0
6%
3.6
5%
3.4
2%
3.3
5%
3.9
3%
Bru
nei
Dar
uss
alam
----
----
----
----
----
----
--1
.62
%1
.85
%1
.49
%1
.39
%1
.40
%1
.29
%1
.67
%2
.28
%2
.09
%2
.05
%2
.07
%1
.84
%
Bu
lgar
ia--
----
----
----
----
----
----
----
----
----
15
.92
%1
9.9
2%
18
.57
%1
9.0
1%
20
.73
%1
9.5
8%
Bu
rkin
a Fa
so3
2.1
4%
34
.12
%3
5.4
9%
38
.97
%3
3.3
6%
38
.23
%3
5.1
9%
35
.12
%3
4.1
9%
35
.92
%3
3.0
0%
39
.98
%3
9.4
8%
40
.76
%3
5.0
5%
29
.33
%3
1.8
1%
34
.98
%3
2.7
2%
31
.22
%3
4.8
0%
32
.14
%3
0.4
3%
32
.78
%3
7.9
2%
Bu
run
di
23
1.9
0%
21
4.3
5%
21
5.2
4%
20
4.5
1%
20
6.5
7%
20
1.4
2%
18
0.8
6%
18
5.4
8%
18
9.1
6%
15
0.0
3%
15
3.8
0%
14
7.6
9%
15
3.7
7%
14
7.4
6%
15
9.8
8%
13
9.0
5%
12
0.4
2%
12
7.6
7%
11
6.8
6%
12
6.3
6%
11
8.9
6%
11
7.0
2%
11
1.6
0%
11
0.7
9%
11
1.2
6%
Cab
o V
erd
e--
----
----
----
----
----
----
----
----
----
91
.47
%6
7.3
9%
64
.71
%5
2.6
3%
56
.01
%5
2.3
9%
Cam
bo
dia
----
----
----
----
----
----
----
----
----
----
----
----
--
Cam
ero
on
22
.49
%2
2.0
9%
20
.78
%2
2.2
8%
21
.56
%2
1.0
0%
25
.40
%2
3.2
5%
20
.00
%2
4.1
0%
26
.35
%2
7.5
3%
23
.31
%1
9.2
1%
19
.01
%1
7.5
3%
12
.23
%8
.31
%9
.13
%1
0.1
3%
13
.46
%1
4.7
4%
13
.50
%1
1.0
7%
11
.50
%
Can
ada
3.7
6%
4.2
1%
4.0
7%
3.2
2%
3.4
7%
3.2
2%
3.4
2%
3.6
1%
3.7
6%
3.2
6%
3.2
0%
2.9
6%
2.6
8%
2.3
1%
2.5
1%
2.6
6%
2.8
2%
2.8
3%
2.4
9%
2.1
0%
2.1
5%
2.1
7%
1.9
8%
2.0
5%
2.3
9%
Cen
tral
Afr
ican
Rep
ub
lic1
6.1
4%
17
.03
%1
8.5
0%
14
.61
%1
8.2
1%
15
.80
%1
8.0
3%
18
.29
%1
7.7
7%
17
.32
%1
7.7
0%
18
.09
%2
1.7
7%
18
.67
%2
1.1
6%
18
.14
%1
3.5
3%
16
.26
%1
8.7
6%
18
.66
%2
3.7
1%
18
.96
%2
2.9
4%
18
.91
%1
7.4
0%
Ch
ad1
0.4
5%
10
.54
%1
2.1
7%
11
.51
%1
2.1
8%
13
.31
%1
3.7
4%
14
.06
%1
2.6
1%
11
.93
%1
1.4
3%
11
.29
%1
2.9
6%
12
.84
%1
1.2
3%
8.0
2%
7.5
3%
7.5
1%
9.2
6%
7.2
9%
6.8
5%
9.5
4%
7.5
9%
7.8
4%
8.1
1%
Ch
ile1
0.3
9%
10
.07
%1
0.2
8%
9.9
0%
9.6
0%
9.8
6%
9.1
6%
9.1
7%
8.7
3%
8.6
7%
8.1
0%
8.7
4%
8.8
2%
12
.81
%9
.52
%1
0.4
6%
8.0
9%
8.2
6%
8.4
2%
8.4
8%
8.2
2%
7.8
8%
7.7
6%
6.8
6%
5.3
1%
Ch
ina
10
7.7
5%
11
9.9
7%
11
7.7
2%
11
0.7
5%
10
1.2
3%
96
.96
%1
03
.52
%1
06
.64
%9
1.5
2%
83
.11
%8
1.0
2%
77
.17
%7
8.3
8%
77
.72
%7
2.5
3%
73
.63
%7
1.1
9%
69
.87
%6
9.2
9%
65
.12
%6
4.9
1%
64
.79
%6
1.7
8%
57
.59
%4
9.8
9%
Co
lom
bia
5.0
9%
5.1
1%
5.4
4%
4.3
2%
5.0
6%
5.3
8%
5.4
6%
5.3
4%
5.3
3%
4.3
2%
5.8
2%
5.0
6%
4.0
5%
4.4
3%
4.4
7%
4.0
3%
1.8
6%
0.8
1%
1.2
2%
0.8
9%
4.3
4%
4.1
7%
4.6
3%
3.9
9%
4.0
9%
Co
mo
ros
----
----
----
----
----
----
----
----
----
--1
2.2
7%
8.3
8%
4.1
8%
4.6
1%
11
.29
%3
.27
%
Co
ngo
20
.02
%2
0.0
3%
22
.00
%2
1.6
8%
23
.59
%2
1.3
1%
23
.37
%2
2.9
7%
18
.76
%1
7.2
5%
17
.58
%1
4.7
6%
14
.46
%1
3.2
7%
13
.28
%1
3.4
5%
14
.04
%1
4.6
0%
14
.55
%1
3.1
2%
10
.72
%1
0.2
6%
9.3
2%
9.0
8%
9.6
2%
Co
sta
Ric
a0
.40
%-0
.23
%0
.29
%-0
.25
%1
.67
%0
.41
%0
.75
%1
.85
%1
.79
%1
.80
%4
.99
%1
.59
%0
.54
%0
.00
%-0
.28
%-1
.83
%-8
.11
%-6
.29
%-5
.37
%-2
.66
%-1
.82
%-0
.73
%2
.59
%0
.07
%1
.18
%
Cô
te d
Ivo
ire
6.6
3%
10
.88
%4
.85
%1
.89
%7
.17
%5
.01
%6
.55
%1
.52
%3
.56
%2
.74
%4
.80
%5
.74
%4
.20
%-1
.91
%1
.67
%-7
.47
%-1
3.0
3%
-11
.59
%-7
.92
%-7
.38
%-0
.58
%3
.23
%5
.38
%0
.14
%-3
.47
%
Cro
atia
----
----
----
----
----
----
----
----
----
----
----
----
--
Cu
ba
----
----
----
----
---6
.38
%-3
.74
%-2
.20
%-8
.16
%-2
2.9
7%
-32
.02
%-2
5.5
9%
-20
.79
%-2
5.1
9%
-25
.01
%-2
6.1
1%
-17
.39
%-1
6.6
6%
-17
.34
%-1
3.6
8%
-14
.10
%
Cyp
rus
----
----
----
----
----
----
----
14
.40
%1
1.2
8%
8.5
8%
9.4
1%
8.9
5%
9.3
5%
9.6
7%
8.3
1%
9.6
2%
8.2
3%
8.3
2%

78 Ta
ble
6. P
CE
Rat
ios
FAO
Dat
aset
(C
on
t.)
- D
elet
ed V
alu
es S
had
ed
Co
un
try
19
86
19
87
19
88
19
89
19
90
19
91
19
92
19
93
19
94
19
95
19
96
19
97
19
98
19
99
20
00
20
01
20
02
20
03
20
04
20
05
20
06
20
07
20
08
20
09
20
10
20
11
Afg
han
ista
n--
----
----
----
----
----
----
----
--1
7.1
5%
17
.82
%1
6.7
1%
18
.42
%1
7.3
3%
15
.87
%2
0.9
2%
14
.25
%1
3.0
1%
15
.47
%
Alb
ania
15
.95
%1
5.4
9%
16
.31
%1
6.4
6%
19
.09
%2
5.4
6%
33
.53
%3
4.6
4%
30
.70
%2
8.7
4%
28
.84
%2
7.8
5%
26
.35
%2
5.2
1%
22
.92
%2
1.9
3%
22
.12
%2
2.1
8%
22
.51
%2
0.9
6%
21
.09
%2
1.0
9%
20
.94
%2
0.0
7%
20
.50
%2
0.9
2%
Alg
eria
11
.48
%1
1.6
8%
11
.44
%1
4.1
1%
11
.94
%1
2.8
0%
13
.24
%1
3.1
5%
14
.49
%1
4.0
3%
14
.12
%1
2.4
7%
12
.87
%1
2.3
2%
11
.82
%1
1.8
2%
11
.77
%1
2.1
9%
13
.06
%1
2.4
6%
12
.60
%1
2.5
6%
14
.51
%1
4.4
8%
14
.31
%1
7.4
6%
An
gola
4.3
0%
4.8
6%
4.9
4%
5.3
9%
5.4
2%
5.1
1%
5.8
7%
6.7
3%
6.7
9%
6.4
3%
6.3
1%
5.9
5%
5.8
0%
4.9
3%
5.0
7%
5.4
0%
5.8
6%
6.2
0%
6.4
3%
6.1
5%
5.5
5%
5.0
9%
5.8
1%
5.5
5%
5.6
5%
6.7
7%
An
tigu
a an
d B
arb
ud
a9
.74
%9
.30
%9
.41
%8
.71
%8
.78
%7
.80
%8
.16
%7
.20
%6
.61
%6
.87
%6
.35
%6
.47
%5
.83
%5
.07
%4
.96
%4
.56
%4
.66
%4
.38
%4
.18
%8
.06
%5
.00
%5
.30
%5
.81
%6
.74
%7
.10
%9
.28
%
Arg
enti
na
8.8
1%
8.7
2%
8.2
2%
7.6
4%
8.5
7%
8.4
2%
7.4
7%
7.2
9%
7.8
2%
7.4
4%
7.0
7%
5.4
1%
6.4
6%
7.9
4%
7.6
5%
8.3
8%
8.7
6%
8.2
5%
6.8
9%
7.1
6%
6.2
6%
5.3
7%
2.6
9%
2.5
0%
3.7
9%
1.3
0%
Arm
enia
----
----
----
40
.03
%3
6.0
1%
38
.53
%3
9.4
1%
41
.28
%3
4.2
7%
32
.91
%3
0.4
1%
27
.64
%2
6.7
4%
23
.12
%2
0.9
9%
22
.40
%2
1.5
3%
19
.13
%2
0.5
1%
20
.74
%2
2.7
6%
21
.07
%2
2.7
2%
Au
stra
lia2
.08
%2
.24
%2
.21
%1
.90
%1
.76
%1
.90
%2
.30
%2
.20
%1
.65
%2
.15
%1
.71
%1
.67
%2
.19
%2
.36
%2
.14
%2
.33
%1
.73
%2
.38
%1
.52
%1
.99
%1
.33
%1
.79
%1
.61
%1
.77
%1
.44
%1
.44
%
Au
stri
a3
.41
%3
.42
%3
.38
%3
.12
%3
.13
%3
.07
%3
.00
%2
.93
%3
.01
%2
.99
%2
.79
%2
.78
%2
.65
%2
.61
%2
.32
%2
.33
%2
.20
%2
.23
%2
.27
%2
.19
%2
.03
%2
.09
%2
.01
%2
.12
%2
.05
%2
.20
%
Aze
rbai
jan
----
----
----
15
.39
%1
6.2
3%
18
.20
%2
1.7
2%
24
.92
%2
0.2
2%
19
.54
%1
9.1
4%
18
.93
%1
9.0
0%
18
.05
%1
7.3
5%
16
.43
%1
3.0
8%
10
.34
%8
.89
%8
.93
%8
.13
%8
.16
%8
.49
%
Bah
amas
5.2
1%
5.3
6%
5.2
3%
4.8
4%
4.5
2%
5.0
2%
4.5
0%
4.1
6%
4.3
0%
4.5
9%
4.7
3%
4.4
0%
4.2
2%
4.1
5%
5.2
5%
4.4
6%
3.1
0%
2.5
8%
2.9
5%
4.3
3%
4.6
0%
4.7
4%
5.0
4%
5.2
4%
4.2
1%
4.1
2%
Bah
rain
5.1
4%
4.8
1%
4.4
9%
4.5
4%
4.4
0%
3.6
6%
3.9
2%
3.6
4%
3.5
3%
3.2
5%
2.8
2%
3.2
8%
1.8
9%
1.7
7%
2.9
7%
3.5
3%
3.4
5%
2.9
2%
2.7
2%
2.9
7%
2.1
2%
2.3
1%
2.6
9%
2.4
5%
3.1
5%
3.3
1%
Ban
glad
esh
20
.33
%2
0.1
3%
21
.03
%2
1.4
8%
20
.20
%1
9.5
6%
18
.87
%1
7.9
5%
16
.49
%1
7.4
4%
17
.34
%1
6.5
1%
16
.57
%1
9.3
7%
17
.70
%1
6.3
5%
16
.28
%1
6.4
8%
15
.57
%1
5.9
9%
15
.28
%1
5.8
0%
16
.16
%1
6.0
8%
16
.77
%1
6.8
1%
Bar
bad
os
5.8
4%
5.9
3%
5.7
3%
6.2
9%
5.9
3%
6.2
8%
5.5
0%
5.6
3%
5.5
7%
6.0
5%
5.1
5%
5.3
7%
3.7
8%
5.4
8%
4.5
8%
5.4
3%
5.3
7%
5.9
9%
5.1
0%
6.1
1%
5.7
4%
5.8
9%
6.3
2%
6.1
6%
6.6
8%
6.9
5%
Bel
aru
s--
----
----
--2
5.2
8%
26
.59
%2
4.6
6%
27
.33
%2
7.8
5%
23
.63
%2
0.9
6%
19
.42
%1
9.7
8%
17
.90
%1
7.4
5%
16
.68
%1
6.7
7%
14
.88
%1
4.6
7%
13
.67
%1
3.8
5%
12
.84
%1
1.1
1%
9.6
3%
Bel
giu
m--
----
----
----
----
----
----
--1
.53
%1
.38
%1
.44
%1
.40
%1
.18
%0
.97
%0
.73
%0
.73
%0
.63
%0
.77
%0
.53
%0
.58
%
Bel
ize
8.1
4%
7.7
2%
6.7
9%
2.9
3%
2.4
7%
4.1
8%
7.0
1%
8.9
2%
6.1
6%
4.6
1%
5.4
4%
6.1
9%
6.5
8%
4.8
5%
6.5
9%
7.6
3%
9.2
2%
8.8
2%
8.3
7%
8.5
0%
7.3
2%
7.9
4%
8.3
4%
7.7
6%
9.3
9%
8.0
1%
Ben
in1
5.5
3%
14
.69
%1
7.1
4%
17
.61
%1
8.8
2%
19
.82
%2
2.3
5%
20
.47
%1
9.3
7%
19
.46
%1
8.8
5%
18
.63
%1
8.6
6%
18
.80
%1
7.4
8%
16
.85
%1
7.8
1%
18
.73
%1
9.0
9%
19
.02
%2
1.0
6%
19
.63
%2
2.4
1%
18
.41
%1
6.3
9%
21
.92
%
Ber
mu
da
3.2
3%
3.0
5%
2.8
1%
2.6
6%
2.5
1%
2.4
0%
2.9
9%
2.7
7%
4.1
9%
2.5
3%
2.3
7%
2.2
1%
2.0
6%
1.6
3%
1.4
8%
1.3
3%
1.3
5%
1.2
9%
1.2
6%
1.2
8%
1.6
5%
1.7
3%
2.0
1%
2.0
0%
1.8
5%
2.0
1%
Bh
uta
n6
8.2
2%
59
.28
%4
5.1
2%
43
.64
%4
5.7
3%
46
.25
%4
3.8
4%
45
.56
%4
4.6
6%
41
.83
%4
3.0
2%
42
.93
%3
9.4
5%
38
.57
%2
4.8
3%
23
.06
%2
0.0
5%
21
.26
%2
4.4
4%
27
.70
%2
5.8
4%
22
.13
%1
9.8
5%
18
.00
%1
8.9
5%
19
.08
%
Bo
livia
16
.31
%1
7.7
2%
16
.31
%1
5.5
2%
13
.43
%1
5.6
3%
15
.10
%1
5.3
8%
14
.65
%1
6.3
0%
14
.94
%1
3.9
2%
13
.86
%1
4.2
0%
14
.80
%1
4.1
7%
14
.24
%1
4.8
0%
12
.41
%1
3.9
2%
13
.47
%1
3.4
8%
13
.05
%1
3.0
8%
12
.49
%1
2.9
4%
Bo
snia
an
d H
erze
govi
na
----
----
----
----
48
.83
%4
0.3
1%
23
.97
%2
1.2
3%
17
.86
%1
4.8
4%
12
.71
%1
4.2
2%
14
.52
%1
3.1
0%
16
.53
%1
7.1
2%
15
.79
%1
5.5
3%
17
.03
%1
6.3
0%
15
.32
%1
6.3
7%
Bo
tsw
ana
1.4
2%
2.9
3%
3.4
6%
2.2
9%
3.4
9%
3.5
6%
4.2
9%
3.7
6%
3.4
8%
4.2
8%
4.2
3%
3.6
2%
3.3
3%
3.2
9%
3.3
5%
2.9
4%
2.7
5%
2.9
9%
2.1
0%
1.9
8%
2.1
8%
2.3
5%
2.8
0%
3.0
2%
2.7
2%
3.5
6%
Bra
zil
3.9
9%
4.0
4%
4.1
9%
4.5
6%
4.6
1%
4.9
8%
5.2
3%
5.1
1%
5.1
6%
5.4
3%
5.0
3%
5.1
4%
5.3
0%
5.5
9%
5.7
6%
5.7
1%
5.9
4%
6.3
1%
5.6
7%
5.2
5%
5.0
8%
4.8
7%
4.7
1%
4.7
8%
4.2
1%
3.7
5%
Bru
nei
Dar
uss
alam
1.9
8%
2.3
0%
2.4
8%
2.2
8%
2.3
0%
2.2
6%
2.2
6%
2.2
8%
2.5
9%
2.4
3%
2.4
1%
2.8
2%
2.7
4%
2.0
6%
2.0
4%
2.0
2%
2.3
1%
2.4
3%
2.1
5%
2.1
8%
2.0
9%
1.8
8%
2.4
8%
2.4
8%
2.6
6%
2.8
4%
Bu
lgar
ia2
0.5
2%
18
.65
%1
7.1
7%
18
.99
%1
7.3
7%
19
.37
%1
7.6
2%
15
.76
%1
4.8
5%
15
.14
%1
4.3
8%
16
.34
%1
5.1
9%
15
.31
%1
3.8
6%
13
.08
%1
0.4
3%
8.4
5%
9.8
7%
7.6
5%
7.7
6%
6.6
9%
7.6
2%
7.7
8%
7.2
1%
7.2
0%
Bu
rkin
a Fa
so3
6.9
5%
34
.76
%3
8.8
7%
36
.67
%3
5.3
0%
41
.19
%4
1.2
3%
40
.83
%3
9.7
6%
38
.76
%3
9.7
3%
32
.98
%3
4.5
6%
34
.32
%2
8.7
8%
32
.76
%3
1.1
5%
32
.29
%2
7.4
5%
29
.84
%2
8.8
4%
24
.00
%2
9.2
5%
26
.26
%2
8.0
8%
23
.99
%
Bu
run
di
10
6.1
5%
11
5.5
8%
10
7.8
0%
10
8.9
8%
11
1.9
0%
10
8.1
3%
11
1.6
0%
11
8.3
2%
10
3.5
7%
11
8.3
9%
13
5.9
8%
13
8.7
4%
12
1.3
2%
13
1.8
0%
13
0.2
7%
13
8.0
8%
13
7.8
0%
14
3.4
0%
13
2.7
0%
12
9.1
4%
12
5.0
3%
12
3.2
2%
11
8.4
5%
12
0.8
0%
11
5.8
5%
11
1.3
9%
Cab
o V
erd
e6
6.2
7%
84
.32
%7
9.6
7%
77
.82
%7
4.2
1%
67
.60
%7
4.1
1%
63
.79
%5
0.7
3%
52
.17
%4
3.8
5%
41
.42
%3
8.4
0%
37
.87
%3
0.3
1%
32
.06
%2
9.2
8%
31
.68
%3
0.4
5%
29
.76
%2
9.5
1%
28
.56
%2
9.4
8%
28
.77
%2
8.0
8%
28
.71
%
Cam
bo
dia
----
----
----
--4
7.9
2%
43
.22
%4
7.0
4%
45
.77
%4
4.3
7%
42
.92
%4
2.7
1%
39
.55
%3
6.9
7%
34
.29
%3
5.9
2%
33
.10
%3
6.8
2%
40
.81
%3
7.7
5%
41
.22
%4
3.1
1%
43
.57
%4
9.1
2%
Cam
ero
on
11
.02
%1
1.0
9%
12
.69
%1
3.6
4%
16
.02
%1
7.8
5%
20
.03
%2
1.7
1%
21
.59
%2
0.9
3%
20
.49
%2
0.3
9%
21
.91
%2
1.6
6%
22
.10
%2
1.8
6%
21
.57
%2
1.1
4%
21
.71
%2
4.8
5%
27
.08
%2
9.0
1%
29
.34
%3
0.1
6%
29
.95
%3
1.7
4%
Can
ada
2.6
3%
2.4
2%
1.9
7%
2.3
5%
2.4
0%
2.4
1%
2.2
5%
2.5
2%
2.4
6%
2.3
2%
2.1
9%
2.1
8%
2.3
2%
2.3
4%
2.1
0%
1.8
6%
1.8
9%
2.0
2%
1.9
6%
2.0
1%
1.9
3%
1.8
2%
1.7
6%
2.0
2%
1.9
8%
1.9
0%
Cen
tral
Afr
ican
Rep
ub
lic2
0.2
3%
21
.03
%2
2.4
6%
20
.71
%2
5.1
7%
26
.47
%2
8.7
3%
29
.29
%2
8.7
5%
27
.15
%3
2.1
1%
29
.76
%3
1.1
6%
28
.23
%3
2.4
2%
32
.30
%3
1.3
1%
32
.96
%3
3.0
7%
33
.13
%3
1.6
0%
30
.80
%3
0.7
4%
29
.62
%2
7.5
4%
27
.71
%
Ch
ad1
1.1
3%
11
.29
%1
1.4
0%
10
.72
%1
1.9
9%
12
.30
%1
1.6
9%
12
.39
%1
1.1
9%
12
.62
%1
3.5
1%
12
.83
%1
4.7
4%
13
.47
%1
2.7
2%
13
.69
%1
2.6
0%
12
.18
%8
.70
%8
.42
%8
.26
%7
.75
%8
.36
%8
.35
%7
.77
%7
.34
%
Ch
ile4
.54
%4
.76
%4
.74
%4
.37
%4
.25
%4
.16
%3
.90
%4
.05
%4
.06
%3
.71
%3
.49
%3
.63
%3
.46
%3
.35
%3
.49
%3
.28
%2
.99
%3
.16
%2
.99
%2
.91
%3
.04
%2
.68
%2
.67
%2
.05
%2
.14
%2
.16
%
Ch
ina
47
.44
%4
4.8
8%
41
.28
%4
1.0
7%
42
.87
%4
0.1
6%
36
.81
%3
4.5
0%
32
.16
%3
1.8
0%
30
.89
%2
8.6
0%
28
.09
%2
6.9
4%
25
.52
%2
4.0
2%
22
.90
%2
1.0
5%
20
.50
%1
8.9
5%
17
.29
%1
5.7
5%
15
.36
%1
4.4
1%
13
.43
%1
2.7
1%
Co
lom
bia
1.5
6%
4.3
7%
4.7
7%
5.2
2%
5.4
8%
5.3
3%
5.3
7%
5.8
3%
5.0
1%
5.5
0%
5.9
2%
5.0
7%
5.1
8%
6.1
2%
6.2
2%
6.7
5%
6.7
2%
6.7
6%
6.5
2%
5.8
0%
5.9
1%
5.8
8%
6.0
6%
5.6
0%
5.5
4%
5.3
7%
Co
mo
ros
3.9
9%
7.7
3%
6.2
3%
9.1
9%
10
.30
%7
.79
%9
.71
%7
.58
%1
2.9
9%
15
.63
%1
5.2
4%
14
.82
%1
4.6
0%
14
.63
%1
0.7
3%
10
.38
%1
2.1
4%
7.4
9%
8.7
4%
13
.61
%1
3.3
4%
16
.14
%1
7.6
7%
16
.74
%1
9.7
9%
15
.26
%
Co
ngo
10
.23
%9
.78
%1
0.7
2%
10
.17
%9
.84
%1
0.6
1%
11
.19
%1
1.2
5%
10
.82
%1
1.5
3%
11
.78
%1
1.0
7%
11
.43
%1
1.2
9%
11
.27
%1
0.7
1%
10
.95
%1
1.7
3%
12
.55
%1
0.7
4%
11
.18
%1
1.8
2%
11
.71
%1
2.4
3%
10
.83
%1
3.8
2%
Co
sta
Ric
a-0
.74
%0
.89
%1
.93
%4
.71
%6
.18
%5
.29
%6
.03
%5
.67
%4
.36
%1
.47
%3
.04
%2
.81
%2
.55
%4
.45
%5
.22
%6
.46
%6
.36
%5
.66
%5
.38
%5
.27
%6
.55
%5
.25
%4
.77
%4
.82
%4
.76
%5
.65
%
Cô
te d
Ivo
ire
-5.4
4%
1.0
8%
6.7
3%
6.1
2%
10
.53
%1
1.6
1%
13
.60
%1
2.8
4%
13
.13
%1
0.0
7%
7.9
2%
8.5
4%
7.7
7%
8.8
6%
13
.21
%1
1.8
2%
6.8
5%
7.0
3%
9.8
2%
11
.05
%1
2.6
4%
11
.14
%1
0.1
7%
4.7
2%
4.6
5%
5.5
0%
Cro
atia
----
----
----
----
--7
.60
%7
.22
%6
.75
%6
.27
%6
.82
%5
.83
%6
.35
%6
.39
%5
.26
%5
.89
%4
.92
%5
.07
%5
.15
%5
.80
%5
.79
%5
.40
%5
.82
%
Cu
ba
-14
.60
%-1
1.1
8%
-10
.48
%-8
.45
%-9
.87
%-2
.80
%0
.15
%1
.95
%1
.78
%2
.14
%1
.66
%1
.99
%2
.77
%3
.64
%3
.61
%3
.10
%3
.63
%4
.19
%4
.33
%4
.64
%3
.60
%4
.17
%5
.19
%4
.02
%3
.58
%3
.96
%
Cyp
rus
7.5
4%
7.1
6%
7.7
5%
7.5
9%
6.6
6%
6.4
4%
7.0
6%
7.2
2%
6.6
6%
6.8
3%
7.3
1%
6.9
3%
6.7
8%
6.7
3%
6.4
5%
6.2
2%
6.3
4%
6.1
3%
6.3
3%
6.1
1%
5.8
9%
6.2
1%
6.6
7%
6.0
4%
6.0
3%
6.1
8%

79 Ta
ble
6. P
CE
Rat
ios
FAO
Dat
aset
- D
elet
ed V
alu
es S
had
ed
Co
un
try
19
61
19
62
19
63
19
64
19
65
19
66
19
67
19
68
19
69
19
70
19
71
19
72
19
73
19
74
19
75
19
76
19
77
19
78
19
79
19
80
19
81
19
82
19
83
19
84
19
85
Cze
ch R
epu
blic
----
----
----
----
----
----
----
----
----
----
----
----
--
Dem
. Rep
. Co
ngo
15
.56
%1
3.2
9%
13
.24
%1
2.7
2%
14
.04
%1
3.3
0%
12
.58
%1
2.3
1%
12
.06
%1
2.4
9%
11
.72
%1
1.6
9%
11
.89
%1
2.8
2%
12
.59
%1
2.6
9%
10
.70
%1
1.6
9%
13
.50
%1
3.4
6%
16
.16
%1
5.1
3%
15
.32
%1
4.0
7%
15
.64
%
Den
mar
k2
.96
%2
.96
%2
.42
%2
.36
%2
.12
%2
.09
%2
.20
%2
.44
%2
.08
%2
.12
%2
.02
%1
.68
%0
.94
%1
.02
%0
.19
%1
.12
%1
.57
%0
.70
%0
.62
%0
.46
%0
.96
%1
.19
%1
.43
%1
.77
%1
.64
%
Do
min
ica
----
----
----
----
----
----
----
----
8.5
8%
8.2
8%
11
.34
%1
5.8
4%
10
.83
%9
.10
%7
.41
%8
.96
%6
.75
%
Do
min
ican
Rep
ub
lic7
.75
%4
.44
%4
.79
%6
.70
%1
1.7
9%
10
.92
%9
.14
%9
.70
%1
0.0
4%
8.2
4%
8.2
4%
5.8
3%
5.3
2%
2.2
6%
-5.1
9%
4.2
2%
1.5
9%
5.4
1%
4.4
5%
5.7
7%
2.9
6%
6.1
6%
7.4
4%
6.8
5%
7.5
3%
Ecu
ado
r7
.57
%6
.56
%6
.71
%8
.12
%7
.28
%6
.72
%6
.28
%7
.13
%7
.65
%7
.54
%6
.86
%5
.83
%4
.95
%3
.80
%4
.68
%2
.89
%0
.52
%-0
.39
%0
.21
%2
.98
%4
.15
%6
.56
%6
.54
%6
.27
%5
.67
%
Egyp
t3
1.0
1%
35
.26
%3
3.8
5%
30
.78
%2
8.7
7%
30
.56
%2
9.2
2%
26
.90
%2
2.9
8%
22
.73
%2
5.1
8%
24
.79
%2
4.2
4%
37
.06
%3
6.3
5%
30
.47
%2
6.0
6%
28
.83
%2
5.1
6%
27
.18
%3
3.0
8%
28
.11
%2
6.4
1%
26
.49
%2
4.0
0%
El S
alva
do
r--
----
--0
.52
%1
.10
%0
.26
%0
.87
%1
.75
%0
.66
%1
.72
%0
.03
%0
.60
%-0
.33
%0
.55
%-3
.87
%-7
.55
%-1
.58
%-4
.03
%-4
.96
%-0
.05
%1
.07
%0
.97
%3
.43
%1
.35
%
Equ
ato
rial
Gu
inea
----
----
----
----
----
----
----
----
----
----
----
----
4.0
2%
Erit
rea
----
----
----
----
----
----
----
----
----
----
----
----
--
Esto
nia
----
----
----
----
----
----
----
----
----
----
----
----
--
Eth
iop
ia--
----
----
----
----
----
----
----
----
----
----
----
----
Fiji
18
.47
%1
7.5
8%
10
.09
%9
.83
%1
9.3
1%
20
.76
%1
7.2
2%
17
.52
%1
6.0
1%
15
.74
%1
4.8
5%
12
.24
%1
4.7
1%
6.2
3%
1.1
8%
8.6
7%
6.9
0%
8.5
9%
5.7
8%
-2.7
4%
6.4
4%
8.0
7%
8.6
6%
11
.44
%1
2.4
2%
Fin
lan
d6
.01
%5
.84
%6
.35
%5
.84
%5
.48
%5
.24
%5
.07
%4
.91
%4
.57
%4
.49
%3
.94
%3
.76
%3
.73
%3
.86
%4
.18
%4
.00
%3
.74
%3
.83
%3
.77
%3
.86
%3
.03
%3
.38
%3
.03
%2
.87
%2
.77
%
Fran
ce8
.54
%9
.45
%8
.32
%7
.82
%7
.81
%7
.07
%7
.07
%6
.89
%5
.94
%6
.19
%5
.51
%4
.96
%5
.16
%4
.56
%4
.62
%4
.65
%4
.50
%4
.49
%4
.60
%4
.08
%3
.78
%4
.33
%4
.05
%4
.12
%4
.05
%
Gab
on
4.4
5%
4.4
4%
4.3
6%
4.0
7%
4.0
0%
3.8
2%
3.7
0%
3.7
0%
3.3
9%
3.1
6%
2.8
9%
2.8
3%
2.6
5%
2.6
3%
2.6
4%
2.0
0%
2.5
6%
3.6
9%
3.4
8%
3.6
4%
3.7
0%
4.0
2%
3.5
3%
3.3
0%
3.5
3%
Gam
bia
----
----
--5
4.4
9%
48
.74
%5
1.1
4%
49
.72
%4
9.9
4%
52
.79
%4
8.1
8%
48
.49
%4
6.1
2%
40
.79
%4
5.4
9%
33
.39
%4
6.4
7%
37
.11
%4
2.3
9%
48
.80
%5
0.2
8%
34
.76
%3
7.3
7%
36
.23
%
Geo
rgia
----
----
----
----
----
----
----
----
----
----
----
----
--
Ger
man
y--
----
----
----
----
4.4
3%
4.2
7%
4.2
4%
4.3
3%
4.1
6%
4.1
9%
4.1
5%
4.1
7%
4.1
9%
4.0
2%
3.8
2%
3.4
4%
3.5
4%
3.4
0%
3.4
1%
3.2
5%
Gh
ana
30
.10
%3
1.5
7%
28
.38
%3
2.1
5%
27
.43
%4
1.0
2%
35
.85
%3
5.4
6%
33
.21
%2
8.2
8%
37
.75
%3
4.6
9%
31
.07
%2
9.8
9%
23
.84
%2
3.5
6%
7.9
9%
8.6
2%
12
.76
%1
7.2
3%
33
.07
%3
4.2
8%
43
.11
%4
9.7
0%
45
.36
%
Gre
ece
17
.61
%1
3.4
7%
15
.01
%1
3.0
2%
13
.14
%1
2.8
1%
12
.54
%1
1.5
8%
10
.69
%1
0.8
8%
10
.03
%9
.56
%9
.24
%1
0.7
4%
10
.38
%8
.96
%8
.72
%8
.72
%8
.29
%9
.22
%9
.59
%1
0.1
2%
9.7
2%
9.5
6%
10
.17
%
Gre
nad
a--
----
----
----
----
----
----
----
--1
.27
%1
.01
%-0
.92
%3
.96
%5
.25
%6
.40
%4
.30
%6
.19
%5
.61
%
Gu
atem
ala
-3.6
1%
-3.0
2%
-3.6
5%
-2.8
8%
-3.8
0%
-4.6
8%
-2.0
3%
-1.9
6%
-2.4
9%
-3.1
3%
-2.5
3%
-2.6
6%
-3.9
1%
-4.3
9%
-4.3
5%
-6.0
1%
-10
.88
%-7
.11
%-5
.71
%-6
.52
%-3
.41
%-3
.34
%-4
.03
%-3
.67
%-3
.38
%
Gu
inea
----
----
----
----
----
----
----
----
----
----
----
----
--
Gu
inea
-Bis
sau
----
----
----
----
--1
8.1
2%
20
.90
%1
8.4
7%
24
.67
%2
5.9
6%
19
.99
%1
7.7
4%
17
.71
%2
4.1
5%
17
.85
%1
8.1
8%
21
.10
%1
5.9
8%
15
.67
%1
3.8
7%
12
.44
%
Gu
yan
a-4
1.2
7%
-40
.64
%-5
6.6
6%
-36
.82
%-2
5.7
4%
-25
.61
%-2
7.6
3%
-24
.12
%-2
7.4
7%
-20
.62
%-2
5.1
8%
-27
.29
%-1
4.3
4%
-60
.22
%-7
3.9
1%
-30
.95
%-2
6.1
4%
-34
.21
%-2
7.9
1%
-35
.78
%-2
9.4
5%
-25
.08
%-2
0.5
1%
-23
.87
%-1
9.2
3%
Hai
ti--
----
----
----
----
----
----
----
----
----
----
----
----
Ho
nd
ura
s1
2.1
2%
10
.94
%1
1.3
3%
11
.01
%4
.07
%4
.45
%7
.08
%7
.23
%1
0.6
2%
10
.35
%9
.25
%1
1.4
3%
9.3
1%
12
.64
%1
0.0
1%
3.2
7%
-1.1
0%
-1.6
4%
-1.3
5%
-1.7
2%
2.7
3%
3.3
1%
3.9
7%
3.2
2%
2.0
3%
Hu
nga
ry1
8.4
1%
18
.28
%1
7.4
1%
16
.42
%1
1.2
4%
11
.08
%1
0.1
4%
10
.36
%9
.55
%8
.68
%9
.26
%8
.16
%6
.82
%7
.55
%7
.06
%6
.70
%7
.13
%7
.06
%6
.17
%6
.83
%6
.32
%6
.58
%6
.95
%7
.50
%7
.26
%
Icel
and
9.1
6%
8.9
7%
8.2
8%
7.9
4%
7.8
7%
6.8
4%
7.2
1%
7.2
4%
6.6
1%
6.5
8%
5.9
4%
5.8
8%
6.0
3%
6.4
3%
6.3
8%
5.8
6%
5.4
6%
5.3
1%
5.0
7%
4.8
2%
4.4
9%
4.2
5%
4.2
4%
4.0
2%
3.9
7%
Ind
ia4
3.0
2%
41
.31
%3
9.7
3%
38
.29
%3
8.1
8%
38
.60
%3
8.0
2%
38
.27
%3
6.5
5%
36
.08
%3
5.9
2%
34
.40
%3
5.9
7%
34
.61
%3
5.8
7%
34
.96
%3
2.8
7%
32
.49
%3
2.6
0%
31
.66
%3
2.3
3%
31
.30
%3
3.0
4%
32
.57
%3
1.4
2%
Ind
on
esia
29
.74
%3
1.8
2%
30
.13
%3
1.6
5%
28
.81
%2
9.0
8%
27
.96
%2
9.6
6%
27
.94
%2
8.3
1%
26
.44
%2
4.8
2%
26
.48
%2
4.7
4%
22
.99
%2
1.6
4%
19
.56
%1
9.6
6%
18
.42
%1
8.7
5%
19
.49
%1
8.4
6%
18
.22
%1
7.2
7%
16
.99
%
Iran
----
----
13
.17
%1
2.1
9%
10
.65
%1
0.5
2%
9.1
3%
8.6
8%
8.2
4%
7.7
5%
7.8
8%
9.8
2%
11
.37
%8
.81
%9
.30
%9
.40
%1
0.5
6%
12
.82
%1
5.7
6%
14
.30
%1
2.4
8%
12
.86
%1
2.2
8%
Iraq
----
----
----
----
----
----
----
----
----
----
----
----
--
Irel
and
----
----
----
----
--6
.90
%6
.72
%5
.37
%3
.96
%4
.91
%3
.42
%3
.77
%3
.76
%2
.35
%2
.19
%2
.44
%3
.78
%4
.63
%5
.09
%5
.24
%5
.11
%
Isra
el6
.83
%6
.45
%5
.78
%6
.94
%5
.80
%6
.50
%5
.89
%5
.74
%5
.03
%5
.37
%5
.10
%4
.84
%5
.61
%6
.38
%6
.01
%5
.27
%5
.16
%4
.70
%4
.92
%4
.55
%4
.39
%4
.53
%4
.56
%4
.52
%4
.00
%
Ital
y6
.98
%6
.49
%6
.75
%6
.67
%6
.76
%6
.67
%6
.59
%6
.02
%5
.97
%5
.72
%5
.79
%5
.47
%5
.97
%5
.50
%5
.70
%5
.09
%5
.11
%5
.15
%5
.09
%5
.18
%4
.65
%4
.55
%4
.93
%4
.33
%4
.36
%
Jap
an1
0.9
3%
10
.38
%9
.81
%9
.01
%8
.53
%7
.78
%7
.39
%6
.73
%5
.81
%5
.85
%5
.37
%5
.33
%5
.12
%5
.50
%5
.46
%4
.99
%5
.11
%4
.85
%4
.76
%4
.41
%4
.23
%4
.07
%3
.94
%3
.93
%3
.69
%
Jord
an--
----
----
----
----
----
----
--2
6.5
6%
27
.60
%2
4.6
2%
24
.39
%2
1.1
7%
19
.05
%1
9.0
1%
19
.94
%1
9.5
4%
18
.25
%1
7.6
5%
Kaz
akh
stan
----
----
----
----
----
----
----
----
----
----
----
----
--
Ken
ya4
7.3
2%
43
.37
%3
8.6
6%
37
.05
%3
9.6
5%
31
.62
%3
2.2
3%
32
.38
%2
9.3
9%
32
.00
%2
9.3
9%
24
.31
%2
1.8
8%
22
.49
%2
3.0
2%
18
.73
%5
.47
%1
3.4
0%
15
.47
%1
6.7
1%
17
.09
%2
1.8
3%
20
.28
%1
5.6
2%
20
.69
%
Kir
ibat
i--
----
----
----
----
16
.68
%1
8.8
6%
16
.18
%1
7.2
4%
14
.85
%1
0.5
6%
15
.15
%1
5.3
9%
17
.27
%1
9.8
1%
36
.17
%3
7.3
5%
31
.75
%2
4.8
1%
30
.76
%3
0.2
6%
Ku
wai
t--
----
----
----
----
----
----
----
----
----
----
----
----
Kyr
gyzs
tan
----
----
----
----
----
----
----
----
----
----
----
----
--
Lao
----
----
----
----
----
----
----
----
----
----
----
--4
5.0
0%
42
.43
%

80 Ta
ble
6. P
CE
Rat
ios
FAO
Dat
aset
(C
on
t.)
- D
elet
ed V
alu
es S
had
ed
Co
un
try
19
86
19
87
19
88
19
89
19
90
19
91
19
92
19
93
19
94
19
95
19
96
19
97
19
98
19
99
20
00
20
01
20
02
20
03
20
04
20
05
20
06
20
07
20
08
20
09
20
10
20
11
Cze
ch R
epu
blic
----
----
----
--6
.34
%5
.72
%5
.62
%5
.83
%5
.57
%5
.51
%5
.44
%4
.85
%4
.86
%4
.73
%4
.23
%4
.71
%4
.17
%3
.83
%3
.88
%3
.95
%4
.08
%3
.86
%3
.85
%
Dem
. Rep
. Co
ngo
12
.96
%1
5.2
3%
16
.10
%1
6.6
1%
19
.14
%2
1.5
1%
25
.00
%2
9.2
7%
30
.45
%2
6.1
2%
26
.30
%2
7.5
0%
27
.30
%2
8.1
5%
30
.36
%3
0.7
2%
30
.18
%2
9.4
3%
29
.04
%2
7.1
0%
27
.89
%2
5.5
9%
24
.91
%2
5.7
0%
23
.72
%2
3.8
2%
Den
mar
k1
.34
%0
.98
%1
.02
%0
.98
%0
.52
%0
.55
%0
.31
%0
.98
%0
.53
%0
.44
%0
.51
%0
.67
%0
.94
%1
.13
%1
.17
%1
.07
%1
.17
%1
.08
%0
.88
%0
.99
%0
.73
%0
.81
%0
.92
%0
.95
%1
.06
%1
.03
%
Do
min
ica
1.4
0%
-0.6
5%
-1.2
5%
5.0
3%
3.2
7%
2.4
4%
2.0
9%
3.1
4%
4.7
4%
6.7
0%
8.4
8%
7.4
6%
6.0
7%
5.3
5%
7.7
9%
7.7
1%
8.1
8%
8.5
3%
8.1
6%
8.4
8%
7.8
4%
9.6
6%
9.2
3%
9.3
2%
9.3
0%
8.8
3%
Do
min
ican
Rep
ub
lic7
.46
%8
.57
%8
.27
%8
.85
%8
.23
%8
.70
%8
.90
%8
.45
%7
.65
%8
.13
%7
.84
%7
.45
%6
.89
%7
.05
%6
.84
%7
.44
%7
.45
%6
.90
%6
.85
%6
.96
%6
.94
%6
.80
%6
.73
%6
.39
%6
.12
%6
.28
%
Ecu
ado
r4
.52
%5
.70
%6
.45
%6
.82
%6
.70
%5
.93
%7
.05
%7
.69
%6
.63
%6
.93
%7
.37
%7
.83
%7
.91
%8
.52
%9
.89
%9
.71
%9
.25
%8
.57
%9
.07
%8
.33
%8
.33
%8
.74
%8
.53
%7
.38
%8
.17
%7
.44
%
Egyp
t2
2.9
4%
20
.76
%2
1.5
4%
20
.66
%2
2.4
9%
21
.11
%2
0.9
4%
20
.39
%2
0.8
1%
21
.79
%2
2.6
0%
21
.92
%2
1.2
2%
21
.05
%2
0.3
3%
18
.81
%1
9.6
0%
18
.98
%1
8.1
5%
18
.84
%1
9.0
6%
19
.51
%1
9.5
8%
17
.29
%1
7.7
8%
18
.74
%
El S
alva
do
r0
.39
%3
.28
%3
.60
%6
.60
%5
.80
%7
.41
%8
.17
%6
.61
%6
.06
%5
.22
%6
.36
%4
.93
%5
.93
%6
.50
%7
.08
%8
.01
%8
.37
%8
.44
%8
.86
%8
.48
%8
.82
%8
.86
%9
.69
%9
.37
%8
.67
%7
.90
%
Equ
ato
rial
Gu
inea
5.5
7%
6.7
7%
7.9
6%
8.6
3%
11
.13
%1
1.9
3%
10
.83
%1
0.9
1%
8.3
4%
8.3
6%
6.0
7%
4.0
1%
2.8
2%
2.3
5%
1.9
0%
1.2
8%
1.2
0%
1.1
5%
0.9
0%
0.8
9%
0.9
8%
0.8
9%
1.0
3%
1.0
8%
1.1
2%
1.3
7%
Erit
rea
----
----
----
--5
3.6
4%
61
.89
%5
1.1
6%
49
.42
%4
6.4
8%
63
.17
%5
1.2
8%
48
.20
%4
7.4
4%
37
.24
%4
8.2
1%
50
.82
%5
9.0
4%
54
.69
%6
2.9
1%
50
.75
%5
6.6
4%
54
.79
%5
5.8
7%
Esto
nia
----
----
----
--1
0.2
7%
9.9
4%
10
.26
%1
1.9
6%
9.6
8%
9.3
7%
8.1
4%
7.7
2%
7.1
0%
6.3
0%
6.8
1%
6.5
5%
5.6
3%
5.5
6%
5.2
8%
5.5
0%
6.5
8%
5.9
0%
5.4
3%
Eth
iop
ia--
----
----
----
34
.77
%3
4.3
0%
35
.09
%3
7.2
1%
34
.09
%3
2.0
2%
34
.99
%3
5.1
9%
37
.83
%4
0.1
5%
47
.29
%4
0.2
0%
39
.36
%3
6.2
7%
32
.29
%3
4.0
2%
33
.83
%3
2.3
7%
28
.79
%
Fiji
11
.18
%6
.84
%8
.64
%9
.72
%1
1.2
8%
8.5
3%
11
.07
%1
2.3
0%
11
.14
%1
0.2
3%
8.8
8%
12
.24
%1
2.2
6%
10
.84
%1
2.5
4%
11
.77
%1
2.3
1%
12
.17
%1
3.0
2%
13
.22
%1
3.6
4%
14
.62
%1
4.6
5%
14
.16
%1
5.9
6%
16
.66
%
Fin
lan
d2
.95
%2
.71
%2
.76
%2
.69
%2
.61
%2
.59
%2
.57
%2
.43
%2
.48
%2
.43
%2
.48
%2
.40
%2
.22
%2
.25
%2
.08
%1
.97
%2
.03
%2
.07
%2
.01
%2
.08
%1
.93
%1
.97
%2
.12
%2
.41
%2
.20
%2
.30
%
Fran
ce4
.03
%3
.97
%3
.46
%3
.25
%3
.11
%3
.04
%3
.14
%2
.89
%2
.86
%2
.75
%2
.85
%2
.82
%2
.79
%2
.80
%2
.72
%2
.63
%2
.67
%2
.40
%2
.55
%2
.40
%2
.27
%2
.15
%2
.15
%2
.40
%2
.25
%2
.15
%
Gab
on
3.3
2%
4.1
1%
3.7
1%
3.2
5%
2.9
7%
3.2
9%
3.6
4%
3.3
7%
2.7
5%
3.1
6%
3.0
8%
2.8
7%
3.0
1%
3.0
5%
3.1
7%
3.0
8%
2.7
7%
2.4
2%
3.3
2%
3.4
8%
3.5
1%
3.8
4%
4.4
4%
4.5
0%
4.4
6%
4.9
1%
Gam
bia
39
.36
%3
7.8
7%
38
.18
%4
0.1
6%
36
.63
%4
1.7
3%
36
.87
%3
5.8
0%
34
.65
%3
6.3
6%
30
.21
%3
3.3
2%
29
.50
%3
4.2
9%
32
.54
%2
8.6
8%
24
.70
%2
5.6
2%
37
.59
%3
7.6
4%
36
.99
%2
6.4
0%
26
.80
%2
7.0
5%
33
.57
%2
2.1
7%
Geo
rgia
----
----
----
24
.49
%3
2.5
6%
33
.87
%4
4.8
7%
43
.41
%3
9.0
7%
33
.00
%3
2.4
3%
27
.42
%2
7.7
0%
26
.35
%2
6.3
7%
25
.31
%2
4.7
0%
16
.93
%1
8.4
0%
18
.13
%1
4.6
7%
14
.91
%1
6.0
1%
Ger
man
y3
.38
%3
.27
%3
.14
%2
.92
%2
.86
%2
.61
%2
.51
%2
.24
%2
.27
%2
.32
%2
.33
%2
.18
%2
.14
%2
.09
%1
.95
%1
.89
%1
.86
%1
.84
%1
.89
%1
.80
%1
.68
%1
.63
%1
.61
%1
.71
%1
.58
%1
.60
%
Gh
ana
43
.59
%4
4.1
3%
45
.88
%5
0.6
1%
41
.01
%6
1.7
3%
60
.20
%6
2.3
5%
57
.61
%6
2.2
9%
57
.27
%5
8.2
7%
60
.96
%6
3.0
4%
60
.56
%6
1.7
8%
64
.95
%5
9.4
4%
58
.22
%5
9.5
7%
53
.82
%5
0.6
1%
54
.23
%5
5.7
8%
55
.40
%4
3.2
7%
Gre
ece
9.3
2%
9.9
1%
10
.06
%9
.87
%8
.68
%9
.65
%9
.52
%9
.47
%9
.87
%1
0.1
6%
9.7
9%
9.1
7%
8.7
3%
9.1
1%
8.6
0%
8.0
6%
7.9
5%
7.1
8%
7.5
1%
7.4
4%
6.8
6%
6.6
1%
6.8
8%
6.6
7%
6.3
1%
6.9
6%
Gre
nad
a1
.85
%0
.32
%1
.38
%4
.19
%5
.88
%6
.40
%6
.53
%8
.88
%8
.47
%8
.69
%1
0.3
3%
7.2
2%
6.7
4%
4.1
3%
3.8
3%
2.9
8%
4.9
4%
4.1
2%
7.1
9%
5.7
8%
6.7
6%
6.5
2%
6.9
0%
8.0
0%
7.7
9%
7.3
3%
Gu
atem
ala
-4.4
2%
-2.1
2%
-2.6
5%
-1.6
9%
-0.9
0%
-0.4
3%
-0.0
2%
0.3
4%
0.0
0%
-1.5
1%
-0.4
8%
-1.0
3%
-1.0
3%
-0.3
8%
-0.4
2%
1.6
1%
2.0
2%
1.9
8%
2.3
0%
1.5
4%
2.0
6%
1.5
1%
1.6
5%
0.3
9%
0.0
5%
-0.1
2%
Gu
inea
52
.21
%5
1.7
1%
51
.34
%5
1.7
4%
51
.81
%5
2.8
0%
54
.90
%5
3.9
4%
55
.38
%5
4.8
9%
53
.39
%5
2.2
0%
49
.13
%4
8.9
2%
49
.32
%4
8.1
4%
48
.71
%5
1.5
5%
52
.15
%5
2.9
9%
53
.70
%5
6.3
7%
55
.30
%5
4.8
5%
57
.29
%5
5.9
8%
Gu
inea
-Bis
sau
13
.92
%1
5.8
9%
15
.33
%1
5.1
7%
12
.71
%1
2.3
0%
17
.04
%1
3.7
0%
9.5
1%
11
.60
%1
0.5
7%
7.2
3%
12
.28
%8
.98
%1
1.5
6%
10
.57
%1
2.1
3%
13
.41
%1
3.5
5%
8.0
6%
15
.54
%1
3.7
3%
8.1
0%
13
.03
%1
8.0
9%
-0.4
0%
Gu
yan
a-2
3.4
8%
-25
.29
%-1
7.2
1%
-21
.15
%-1
7.0
3%
-22
.74
%-2
9.4
0%
-22
.53
%-2
4.7
1%
-24
.53
%-2
9.3
3%
-20
.09
%-1
7.0
7%
-28
.56
%-1
3.0
4%
-8.1
6%
-8.3
4%
-13
.45
%-1
5.4
9%
-8.1
9%
-11
.71
%-1
3.9
9%
-12
.99
%-9
.89
%-1
4.3
3%
-13
.72
%
Hai
ti--
----
----
----
----
----
--1
4.7
4%
14
.01
%1
3.4
1%
13
.01
%1
4.2
5%
14
.35
%1
5.7
4%
15
.87
%1
7.8
1%
17
.44
%1
9.9
9%
18
.45
%2
3.9
8%
18
.54
%
Ho
nd
ura
s-0
.58
%2
.77
%3
.50
%4
.32
%5
.32
%8
.11
%9
.44
%1
0.8
8%
14
.71
%1
1.5
6%
15
.43
%1
4.9
0%
10
.30
%1
5.2
5%
11
.80
%1
3.7
0%
15
.46
%1
6.6
4%
15
.72
%1
6.1
2%
15
.68
%1
5.1
5%
15
.28
%1
5.0
9%
11
.70
%8
.86
%
Hu
nga
ry7
.10
%7
.08
%7
.06
%6
.86
%6
.46
%6
.69
%5
.14
%5
.72
%5
.66
%4
.61
%5
.37
%5
.19
%5
.12
%5
.25
%4
.77
%5
.08
%4
.46
%3
.74
%4
.91
%4
.15
%3
.92
%2
.63
%3
.29
%3
.32
%2
.33
%2
.22
%
Icel
and
4.0
6%
3.6
9%
3.5
4%
3.2
8%
3.2
8%
3.5
1%
3.6
8%
3.3
7%
3.3
8%
3.4
6%
3.3
7%
3.2
5%
3.1
9%
2.9
9%
2.8
8%
2.7
8%
2.9
1%
3.0
2%
3.0
1%
2.9
7%
3.0
1%
3.2
1%
3.1
7%
3.0
2%
2.8
5%
3.1
6%
Ind
ia3
0.5
2%
28
.99
%2
9.0
5%
28
.98
%2
7.6
1%
27
.84
%2
7.3
0%
26
.96
%2
6.4
2%
24
.51
%2
3.7
3%
23
.36
%2
2.5
6%
21
.91
%2
0.9
0%
20
.59
%1
8.2
7%
18
.55
%1
6.9
6%
16
.25
%1
5.7
4%
15
.20
%1
4.8
7%
13
.85
%1
3.2
4%
12
.73
%
Ind
on
esia
16
.98
%1
6.6
3%
16
.47
%1
6.3
4%
15
.46
%1
4.6
4%
15
.08
%1
4.1
2%
13
.45
%1
4.8
0%
13
.93
%1
2.3
6%
13
.80
%1
4.3
5%
13
.84
%1
3.6
8%
13
.93
%1
4.3
7%
14
.53
%1
3.8
1%
14
.15
%1
4.0
0%
13
.46
%1
3.5
8%
13
.22
%1
3.6
1%
Iran
13
.35
%1
3.7
5%
14
.35
%1
5.8
0%
14
.92
%1
3.5
2%
13
.91
%1
4.4
3%
14
.01
%1
5.3
2%
14
.51
%1
4.6
6%
13
.84
%1
3.5
0%
12
.46
%1
2.7
7%
12
.62
%1
2.0
3%
11
.75
%1
1.8
3%
11
.39
%1
1.0
3%
10
.74
%1
1.7
3%
10
.48
%1
0.3
8%
Iraq
----
----
----
----
----
----
----
4.8
6%
4.4
6%
4.1
8%
5.4
5%
4.1
2%
5.4
6%
5.2
8%
4.8
7%
7.7
9%
6.6
8%
7.7
6%
7.4
5%
Irel
and
4.6
5%
2.3
7%
1.6
4%
1.3
2%
2.1
8%
2.4
2%
0.7
4%
1.0
9%
0.5
0%
-0.7
1%
1.0
6%
2.0
1%
2.1
3%
1.9
9%
1.4
3%
2.1
8%
1.9
0%
1.6
1%
0.9
2%
0.7
8%
0.6
1%
1.0
0%
1.1
6%
1.6
0%
1.5
3%
1.2
6%
Isra
el3
.96
%3
.75
%3
.80
%4
.01
%3
.78
%3
.46
%3
.65
%3
.56
%3
.56
%3
.61
%3
.71
%3
.57
%3
.40
%3
.32
%3
.28
%3
.28
%3
.55
%3
.41
%3
.55
%3
.39
%3
.14
%3
.10
%3
.46
%3
.10
%3
.10
%3
.30
%
Ital
y4
.29
%4
.39
%3
.98
%4
.01
%3
.62
%3
.97
%3
.86
%3
.58
%3
.50
%3
.39
%3
.37
%3
.28
%3
.19
%3
.29
%3
.06
%2
.89
%2
.82
%2
.86
%3
.15
%2
.99
%2
.81
%2
.76
%2
.81
%2
.99
%2
.82
%2
.91
%
Jap
an3
.67
%3
.51
%3
.33
%3
.21
%2
.99
%2
.81
%2
.91
%2
.81
%3
.01
%2
.93
%2
.81
%2
.67
%2
.53
%2
.59
%2
.54
%2
.42
%2
.43
%2
.34
%2
.36
%2
.36
%2
.22
%2
.24
%2
.40
%2
.48
%2
.37
%2
.53
%
Jord
an1
5.9
7%
16
.13
%1
6.8
2%
13
.71
%2
2.0
4%
19
.66
%1
8.5
8%
17
.82
%1
6.5
8%
15
.86
%1
5.4
7%
14
.97
%1
4.9
8%
13
.38
%1
3.9
5%
12
.36
%1
2.6
3%
12
.33
%1
3.8
7%
11
.91
%1
1.6
6%
13
.22
%1
4.8
6%
12
.15
%1
2.4
3%
13
.44
%
Kaz
akh
stan
----
----
----
17
.93
%1
6.2
0%
16
.84
%1
3.7
8%
11
.81
%1
1.1
7%
10
.11
%1
2.4
8%
10
.65
%1
1.6
9%
10
.98
%9
.73
%9
.20
%9
.68
%9
.14
%8
.35
%7
.11
%9
.39
%7
.44
%1
0.5
6%
Ken
ya1
9.1
8%
20
.31
%2
0.5
2%
22
.85
%2
1.6
5%
23
.00
%2
5.3
1%
21
.88
%2
4.2
4%
20
.97
%1
7.6
6%
21
.47
%2
0.0
1%
23
.09
%2
2.2
3%
25
.08
%2
4.3
8%
24
.28
%2
3.8
4%
27
.14
%2
6.4
2%
24
.68
%2
4.8
2%
27
.36
%2
5.6
8%
27
.08
%
Kir
ibat
i3
0.1
4%
35
.84
%3
2.9
0%
30
.31
%2
7.2
3%
32
.30
%3
1.2
0%
29
.66
%2
9.2
6%
38
.27
%3
6.1
5%
30
.35
%2
7.3
2%
28
.53
%2
3.8
2%
22
.10
%2
4.4
6%
23
.37
%2
7.0
7%
39
.76
%4
7.4
1%
62
.35
%5
2.1
4%
37
.34
%3
6.1
5%
43
.12
%
Ku
wai
t--
----
----
--3
.36
%2
.70
%2
.60
%2
.59
%2
.72
%2
.58
%2
.57
%2
.47
%2
.34
%2
.23
%1
.52
%1
.43
%1
.51
%1
.62
%1
.73
%1
.85
%2
.11
%1
.99
%2
.08
%2
.36
%
Kyr
gyzs
tan
----
----
----
59
.08
%5
7.3
3%
58
.93
%5
8.4
9%
62
.53
%5
9.4
6%
62
.98
%6
4.4
0%
63
.37
%6
2.6
3%
60
.93
%5
8.4
1%
55
.38
%5
5.4
2%
55
.57
%5
3.7
6%
52
.98
%5
1.6
3%
52
.95
%5
2.6
1%
Lao
41
.71
%4
0.3
6%
36
.50
%3
7.2
1%
37
.54
%3
4.7
1%
37
.91
%3
4.7
2%
38
.65
%3
1.1
6%
33
.11
%3
4.2
6%
34
.47
%3
6.8
0%
46
.26
%4
5.2
1%
50
.70
%4
5.3
2%
44
.61
%4
5.5
1%
42
.43
%4
2.7
2%
39
.79
%4
1.5
8%
40
.11
%3
9.5
5%

81 Ta
ble
6. P
CE
Rat
ios
FAO
Dat
aset
- D
elet
ed V
alu
es S
had
ed
Co
un
try
19
61
19
62
19
63
19
64
19
65
19
66
19
67
19
68
19
69
19
70
19
71
19
72
19
73
19
74
19
75
19
76
19
77
19
78
19
79
19
80
19
81
19
82
19
83
19
84
19
85
Latv
ia--
----
----
----
----
----
----
----
----
----
----
----
----
Leb
ano
n--
----
----
----
----
----
----
----
----
----
----
----
----
Leso
tho
36
.56
%3
3.0
7%
32
.10
%2
8.0
5%
31
.10
%2
7.6
6%
24
.14
%2
3.1
0%
21
.51
%2
5.1
2%
26
.62
%2
5.9
5%
23
.39
%2
4.7
1%
36
.25
%3
7.7
4%
33
.81
%3
2.7
2%
34
.09
%3
8.9
1%
35
.04
%3
5.9
7%
43
.64
%3
6.5
6%
25
.77
%
Lib
eria
15
.06
%1
6.0
2%
17
.63
%1
4.1
7%
16
.15
%1
4.1
1%
14
.58
%1
4.0
5%
11
.37
%1
3.5
9%
13
.82
%1
2.0
8%
14
.21
%1
5.2
2%
14
.91
%1
4.3
1%
8.4
2%
11
.55
%1
2.9
7%
13
.68
%1
6.8
6%
16
.06
%1
6.6
8%
17
.05
%1
3.3
7%
Lith
uan
ia--
----
----
----
----
----
----
----
----
----
----
----
----
Luxe
mb
ou
rg--
----
----
----
----
----
----
----
----
----
----
----
----
Mac
edo
nia
----
----
----
----
----
----
----
----
----
----
----
----
--
Mad
agas
car
23
.15
%2
1.2
1%
25
.65
%2
5.2
8%
26
.12
%2
5.1
7%
24
.95
%2
2.7
9%
25
.74
%2
1.9
1%
22
.04
%2
1.6
6%
21
.78
%2
6.3
8%
19
.81
%2
2.6
8%
16
.63
%1
8.8
2%
19
.38
%1
9.1
7%
30
.74
%3
3.1
7%
33
.20
%3
0.5
6%
34
.10
%
Mal
awi
70
.91
%7
6.4
0%
75
.95
%7
9.7
6%
73
.80
%6
5.4
0%
71
.23
%7
0.2
2%
69
.73
%6
9.3
8%
69
.32
%6
9.5
0%
71
.35
%6
4.5
8%
60
.12
%5
9.1
6%
59
.06
%5
6.0
0%
50
.83
%4
8.2
0%
53
.79
%5
9.2
8%
48
.08
%4
4.4
4%
45
.07
%
Mal
aysi
a2
1.1
4%
19
.27
%2
0.3
2%
19
.82
%1
7.6
4%
16
.03
%1
5.7
2%
15
.43
%1
4.8
1%
14
.73
%1
3.8
4%
13
.88
%1
4.5
2%
16
.46
%1
5.3
2%
13
.37
%1
2.8
9%
13
.40
%1
3.1
8%
13
.57
%1
3.4
8%
13
.35
%1
1.9
1%
11
.58
%1
1.8
8%
Mal
div
es--
----
----
----
----
----
----
----
----
----
----
----
----
Mal
i--
----
----
--6
3.5
2%
60
.51
%6
5.6
5%
62
.98
%6
0.8
1%
53
.24
%5
6.8
3%
69
.96
%6
0.0
6%
48
.91
%4
4.8
5%
49
.76
%4
3.5
5%
49
.37
%5
5.7
0%
63
.07
%5
8.4
9%
53
.72
%6
7.9
1%
Mal
ta--
----
----
----
----
22
.01
%2
3.3
3%
22
.49
%2
6.5
4%
27
.71
%2
2.0
3%
17
.70
%1
5.0
1%
13
.87
%1
3.6
0%
15
.52
%1
1.9
3%
11
.14
%9
.62
%9
.05
%8
.97
%
Mau
rita
nia
9.4
4%
10
.83
%1
0.1
8%
8.7
9%
8.1
9%
7.2
7%
8.1
3%
8.3
7%
7.8
3%
7.1
4%
7.7
4%
8.1
8%
14
.14
%1
6.1
6%
17
.72
%1
6.9
9%
18
.46
%1
7.4
0%
15
.42
%1
6.9
2%
16
.29
%2
0.9
5%
22
.62
%1
9.0
3%
18
.38
%
Mau
riti
us
----
----
----
----
----
----
----
--3
.09
%1
.49
%6
.38
%3
.57
%-1
.50
%1
2.2
0%
11
.00
%5
.55
%7
.91
%9
.19
%
Mex
ico
4.9
4%
5.1
0%
5.0
3%
4.4
8%
4.4
2%
4.5
8%
4.3
7%
4.1
4%
4.0
1%
4.1
7%
4.1
3%
4.1
0%
4.0
6%
4.3
4%
4.4
7%
3.7
4%
4.0
1%
4.0
8%
3.6
8%
4.4
9%
4.4
2%
3.9
3%
4.4
9%
4.1
6%
4.1
3%
Mo
ldo
va--
----
----
----
----
----
----
----
----
----
----
----
----
Mo
ngo
lia--
----
----
----
----
----
----
----
----
----
--2
4.7
6%
25
.28
%2
3.2
4%
21
.20
%2
4.4
9%
Mo
nte
neg
ro--
----
----
----
----
----
----
----
----
----
----
----
----
Mo
rocc
o--
----
----
24
.07
%2
4.0
4%
28
.42
%2
0.4
4%
21
.18
%2
3.2
4%
21
.14
%1
9.1
6%
24
.71
%2
3.7
9%
19
.93
%1
6.0
3%
18
.16
%1
7.5
6%
17
.98
%1
9.3
3%
19
.00
%1
7.1
1%
17
.65
%1
6.7
3%
Mo
zam
biq
ue
----
----
----
----
----
----
----
----
----
--5
1.0
8%
49
.58
%5
3.6
4%
68
.70
%7
5.8
1%
77
.34
%
Nam
ibia
----
----
----
----
----
----
----
----
----
--5
.87
%4
.16
%6
.59
%7
.26
%7
.92
%8
.30
%
Nep
al3
6.6
7%
37
.51
%3
8.1
7%
28
.10
%3
3.2
7%
30
.91
%3
0.9
3%
32
.69
%3
8.0
3%
43
.24
%4
0.0
0%
40
.75
%4
1.4
3%
46
.10
%4
6.2
5%
44
.11
%4
5.1
0%
46
.69
%4
4.1
3%
50
.15
%4
7.6
5%
44
.28
%5
5.8
9%
50
.49
%4
7.3
3%
Net
her
lan
ds
3.2
8%
3.2
3%
3.1
8%
2.9
6%
2.3
5%
2.5
5%
2.7
8%
2.4
8%
2.3
6%
2.1
9%
2.0
1%
1.7
2%
1.3
4%
1.6
5%
1.1
8%
1.1
5%
1.5
2%
1.3
1%
1.4
1%
1.4
4%
1.3
1%
1.7
6%
1.9
9%
2.2
8%
2.4
0%
New
Zea
lan
d--
----
----
----
----
3.0
6%
3.0
8%
1.9
1%
0.9
3%
0.2
2%
2.5
8%
3.0
0%
2.3
1%
2.4
3%
0.9
2%
1.0
8%
0.5
1%
1.4
0%
1.4
4%
2.3
2%
3.5
3%
Nic
arag
ua
6.9
6%
6.1
5%
5.2
1%
5.5
9%
5.1
6%
6.4
1%
6.1
6%
6.5
1%
5.8
0%
4.9
3%
5.1
2%
3.5
6%
4.1
1%
5.2
4%
4.4
9%
0.6
0%
-0.5
4%
-0.2
0%
-3.6
2%
2.5
5%
6.0
7%
5.3
7%
5.8
7%
7.5
4%
7.6
9%
Nig
er3
4.0
8%
34
.18
%3
2.6
0%
32
.97
%2
9.8
1%
32
.75
%3
6.4
2%
32
.03
%3
7.8
3%
34
.25
%3
4.4
2%
36
.06
%3
4.6
6%
40
.41
%3
5.0
7%
41
.01
%4
2.5
4%
42
.38
%4
0.0
5%
43
.61
%4
6.1
8%
44
.28
%4
7.9
3%
41
.89
%4
9.2
1%
Nig
eria
58
.82
%5
8.2
9%
56
.90
%5
5.4
8%
55
.48
%5
7.2
4%
69
.50
%7
2.3
5%
64
.90
%5
6.8
4%
45
.85
%3
8.4
6%
38
.60
%3
7.4
9%
40
.64
%3
5.1
0%
33
.47
%3
5.6
3%
34
.93
%3
6.4
1%
42
.98
%4
2.8
6%
44
.07
%4
5.9
7%
45
.11
%
No
rway
4.3
7%
4.4
9%
4.7
1%
4.3
6%
4.0
2%
3.9
5%
3.7
3%
3.7
5%
3.3
5%
3.4
2%
3.1
7%
3.1
2%
3.2
8%
3.5
2%
3.0
9%
3.1
7%
3.1
3%
3.0
7%
2.8
8%
3.0
0%
2.7
0%
2.6
3%
2.3
3%
2.2
9%
2.1
2%
Om
an6
.13
%5
.32
%5
.34
%5
.57
%5
.79
%5
.56
%3
.54
%1
.96
%1
.66
%1
.59
%1
.89
%1
.73
%3
.41
%4
.07
%4
.13
%3
.82
%4
.40
%4
.68
%5
.30
%6
.36
%5
.77
%5
.88
%5
.14
%4
.67
%4
.07
%
Pak
ista
n4
9.8
9%
48
.14
%4
4.7
5%
44
.25
%4
4.3
4%
38
.16
%4
0.4
8%
42
.72
%3
8.2
2%
35
.65
%3
5.6
2%
36
.85
%3
6.1
1%
34
.90
%3
5.5
6%
34
.33
%3
3.0
7%
31
.82
%3
3.5
2%
28
.61
%2
7.3
2%
27
.51
%2
7.0
4%
25
.61
%2
6.0
5%
Pan
ama
11
.22
%1
2.3
4%
11
.59
%1
0.2
0%
8.5
7%
7.6
0%
6.4
7%
5.8
6%
5.3
5%
4.9
2%
6.0
1%
5.4
9%
6.0
0%
6.4
4%
4.3
5%
5.5
0%
5.8
9%
5.0
2%
5.4
9%
4.1
9%
4.3
5%
5.0
4%
4.7
8%
5.3
7%
5.7
5%
Pap
ua
New
Gu
inea
37
.84
%3
6.0
7%
34
.28
%3
2.4
2%
30
.15
%3
0.9
4%
28
.77
%2
7.8
5%
25
.33
%2
3.6
2%
23
.05
%2
4.1
1%
22
.47
%2
0.7
6%
20
.77
%2
2.7
1%
8.0
6%
10
.34
%1
1.1
3%
16
.83
%2
4.1
7%
25
.05
%2
2.0
0%
20
.89
%2
1.8
1%
Par
agu
ay2
9.8
9%
29
.44
%2
6.8
2%
27
.64
%2
5.8
8%
27
.33
%2
6.1
5%
25
.52
%2
5.4
2%
24
.86
%2
2.7
7%
18
.85
%1
5.3
1%
17
.42
%1
5.7
6%
19
.53
%1
9.8
7%
18
.84
%1
9.1
8%
17
.18
%1
7.9
6%
18
.59
%2
0.0
5%
20
.18
%2
1.3
6%
Per
u5
.73
%5
.80
%5
.43
%5
.73
%6
.50
%6
.22
%6
.19
%5
.48
%6
.17
%5
.51
%5
.64
%5
.16
%4
.40
%4
.59
%4
.42
%4
.85
%4
.14
%3
.92
%3
.72
%5
.22
%5
.95
%5
.44
%6
.08
%5
.25
%4
.81
%
Ph
ilip
pin
es1
6.9
6%
17
.09
%1
6.1
3%
16
.18
%1
7.4
2%
16
.61
%1
6.9
9%
15
.89
%1
6.3
9%
15
.13
%1
4.9
9%
14
.50
%1
3.4
8%
11
.03
%1
2.7
7%
13
.37
%1
2.1
2%
13
.66
%1
3.2
7%
11
.66
%1
2.4
9%
13
.43
%1
2.6
5%
13
.63
%1
5.0
3%
Po
lan
d--
----
----
----
----
----
----
----
----
----
----
----
----
Po
rtu
gal
14
.47
%1
6.0
4%
15
.35
%1
4.5
5%
14
.37
%1
1.3
2%
11
.48
%1
0.6
4%
9.9
6%
9.9
6%
8.5
6%
8.0
9%
7.9
7%
9.6
4%
9.2
5%
8.0
4%
7.0
0%
6.7
9%
7.8
8%
7.2
2%
7.0
5%
6.9
1%
5.9
2%
6.2
9%
6.1
6%
Qat
ar--
----
----
----
----
----
----
----
----
----
----
----
----
Rep
. Ko
rea
35
.18
%3
1.6
0%
33
.77
%3
5.7
6%
33
.38
%3
1.8
7%
28
.16
%2
5.5
2%
26
.37
%2
3.9
5%
22
.62
%2
1.4
1%
20
.23
%2
0.3
8%
21
.04
%1
9.9
9%
19
.24
%1
8.5
6%
18
.18
%1
4.8
7%
17
.07
%1
5.0
4%
14
.23
%1
3.5
6%
12
.87
%
Ro
man
ia--
----
----
----
----
----
----
----
----
----
17
.09
%1
8.2
4%
18
.92
%1
7.4
3%
18
.25
%1
7.1
4%
Ru
ssia
n F
eder
atio
n--
----
----
----
----
----
----
----
----
----
----
----
----
Rw
and
a5
3.3
6%
67
.33
%5
7.2
2%
58
.28
%6
0.4
8%
64
.79
%7
4.3
0%
66
.77
%6
6.0
6%
64
.75
%6
5.4
9%
64
.96
%6
3.5
5%
61
.02
%7
1.9
6%
57
.24
%5
2.7
4%
56
.03
%4
9.5
1%
54
.52
%5
5.0
1%
57
.87
%5
3.0
8%
51
.71
%5
9.2
2%
Sam
oa
----
----
----
----
----
----
----
----
----
----
--1
7.2
2%
14
.31
%1
4.4
1%
15
.29
%
Sao
To
me
and
Pri
nci
pe
----
----
----
----
----
----
----
----
----
----
----
----
--
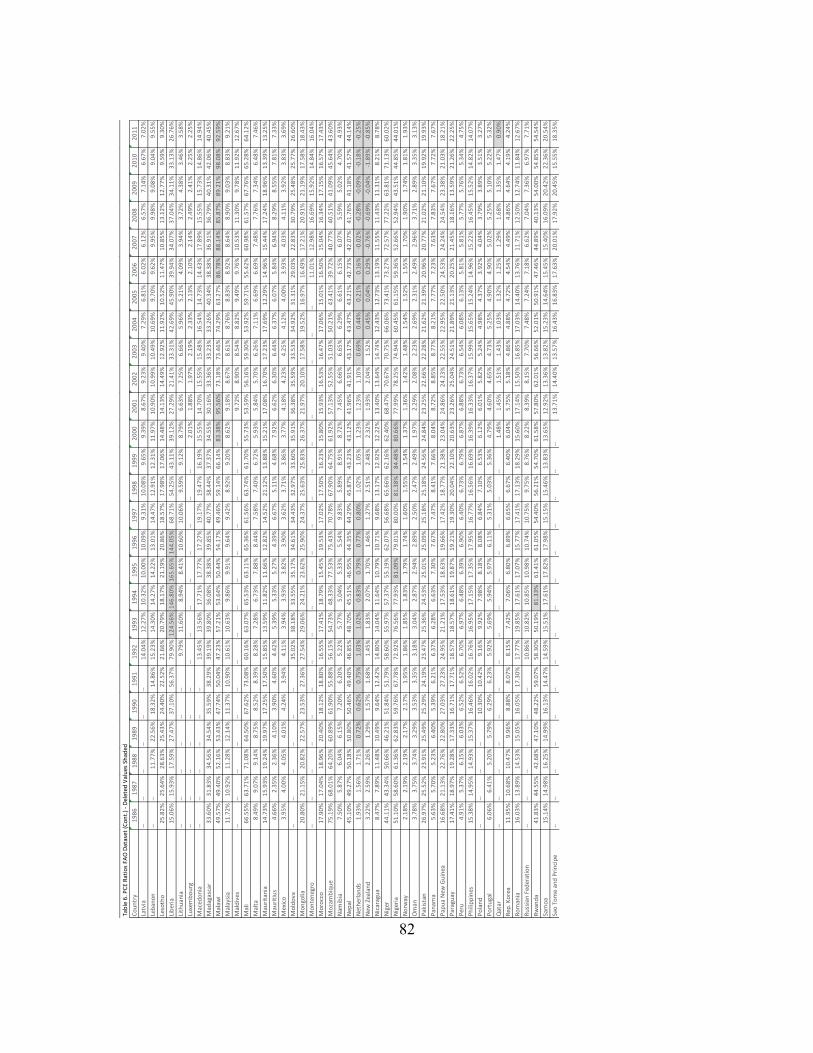
82 Ta
ble
6. P
CE
Rat
ios
FAO
Dat
aset
(C
on
t.)
- D
elet
ed V
alu
es S
had
ed
Co
un
try
19
86
19
87
19
88
19
89
19
90
19
91
19
92
19
93
19
94
19
95
19
96
19
97
19
98
19
99
20
00
20
01
20
02
20
03
20
04
20
05
20
06
20
07
20
08
20
09
20
10
20
11
Latv
ia--
----
----
--1
4.0
4%
12
.27
%1
0.3
2%
10
.00
%1
0.0
9%
9.3
1%
10
.08
%9
.65
%9
.39
%8
.67
%9
.23
%9
.40
%7
.29
%6
.81
%6
.02
%6
.12
%6
.57
%7
.14
%6
.67
%7
.02
%
Leb
ano
n--
--1
1.7
7%
22
.56
%1
8.3
2%
14
.86
%1
5.2
3%
14
.30
%1
4.2
7%
14
.22
%1
3.0
1%
14
.47
%1
2.9
1%
12
.31
%1
1.9
7%
10
.90
%1
0.9
9%
10
.49
%1
0.6
9%
9.7
0%
9.6
2%
9.9
5%
9.9
8%
9.0
8%
9.0
4%
9.5
5%
Leso
tho
25
.82
%2
5.6
4%
28
.63
%2
5.4
3%
24
.40
%2
2.5
2%
21
.66
%2
0.7
9%
18
.17
%2
1.1
9%
20
.86
%1
8.5
7%
17
.98
%1
7.0
6%
14
.48
%1
4.1
3%
14
.49
%1
2.9
2%
11
.92
%1
0.5
2%
11
.47
%1
0.8
5%
13
.12
%1
2.7
7%
9.5
9%
9.3
0%
Lib
eria
15
.06
%1
5.9
3%
17
.59
%2
7.4
7%
37
.10
%5
6.3
7%
79
.90
%1
24
.56
%1
46
.80
%1
65
.65
%1
44
.05
%6
8.7
1%
54
.25
%4
3.1
1%
39
.12
%2
7.2
9%
21
.41
%3
3.3
1%
42
.69
%4
5.9
0%
39
.94
%3
4.0
7%
37
.04
%3
4.1
1%
33
.13
%2
6.7
6%
Lith
uan
ia--
----
----
--9
.79
%1
1.6
0%
8.9
4%
8.4
1%
10
.60
%1
0.0
6%
9.5
9%
9.1
2%
8.7
9%
6.6
3%
7.2
5%
6.6
6%
5.9
6%
5.2
1%
4.0
9%
3.9
4%
3.7
2%
4.3
8%
3.4
6%
3.5
8%
Luxe
mb
ou
rg--
----
----
----
----
----
----
--2
.01
%1
.88
%1
.97
%2
.19
%2
.33
%2
.13
%2
.10
%2
.14
%2
.49
%2
.41
%2
.25
%2
.25
%
Mac
edo
nia
----
----
----
13
.45
%1
3.5
6%
17
.71
%1
7.7
7%
17
.27
%1
9.1
7%
19
.47
%1
6.1
9%
15
.55
%1
4.7
0%
15
.55
%1
5.4
8%
16
.54
%1
4.7
3%
14
.43
%1
7.8
9%
15
.55
%1
5.7
3%
14
.86
%1
4.9
4%
Mad
agas
car
33
.60
%3
1.8
3%
34
.56
%3
4.5
4%
35
.59
%3
8.2
9%
39
.19
%3
9.8
0%
36
.08
%3
8.3
8%
39
.85
%4
0.7
7%
38
.44
%3
7.3
7%
34
.55
%3
0.1
6%
33
.36
%3
3.2
3%
33
.26
%4
0.3
4%
38
.38
%3
6.9
1%
36
.79
%4
0.3
1%
42
.06
%4
0.4
5%
Mal
awi
49
.57
%4
9.4
0%
52
.16
%5
3.4
3%
47
.74
%5
0.0
4%
47
.23
%5
7.2
1%
53
.64
%5
0.4
4%
54
.17
%4
9.4
6%
59
.14
%6
6.1
4%
83
.38
%9
5.5
6%
73
.18
%7
3.4
6%
74
.29
%6
3.2
7%
86
.78
%8
8.1
4%
85
.87
%8
9.2
1%
98
.08
%9
2.5
9%
Mal
aysi
a1
1.7
2%
10
.92
%1
1.2
8%
12
.14
%1
1.3
7%
10
.90
%1
0.6
1%
10
.63
%9
.86
%9
.91
%9
.64
%9
.42
%8
.92
%9
.20
%8
.62
%9
.18
%8
.67
%8
.61
%8
.76
%8
.83
%8
.92
%8
.64
%8
.90
%9
.03
%8
.83
%9
.21
%
Mal
div
es--
----
----
----
----
----
----
----
9.7
2%
8.9
0%
8.5
4%
8.8
2%
9.4
9%
9.7
6%
10
.53
%1
1.3
0%
9.7
8%
11
.92
%1
2.6
7%
Mal
i6
6.5
5%
63
.71
%7
1.0
8%
64
.50
%6
7.6
2%
73
.08
%6
0.1
6%
63
.07
%6
5.5
3%
63
.11
%6
5.3
6%
61
.56
%6
3.7
4%
61
.70
%5
5.7
3%
53
.59
%5
6.1
6%
59
.30
%5
3.9
2%
59
.71
%5
5.4
2%
60
.98
%6
1.5
7%
67
.76
%6
5.2
8%
64
.12
%
Mal
ta8
.49
%9
.07
%9
.14
%8
.75
%8
.52
%8
.39
%8
.28
%7
.28
%6
.73
%7
.88
%8
.44
%7
.58
%7
.40
%6
.72
%5
.93
%5
.84
%5
.70
%6
.26
%7
.11
%6
.69
%6
.69
%7
.48
%7
.76
%7
.34
%6
.48
%7
.46
%
Mau
rita
nia
14
.73
%1
5.9
3%
19
.24
%1
9.9
7%
17
.25
%1
7.5
0%
15
.85
%1
3.5
9%
11
.82
%1
1.6
6%
12
.82
%1
4.5
2%
21
.12
%1
3.8
8%
15
.21
%1
7.0
8%
16
.70
%1
7.2
3%
17
.69
%1
2.2
9%
14
.96
%1
5.4
4%
17
.24
%1
8.9
6%
13
.39
%1
3.2
5%
Mau
riti
us
4.6
6%
2.3
5%
2.3
6%
4.1
0%
3.9
0%
4.6
0%
4.4
2%
5.3
9%
5.3
3%
5.2
7%
4.3
9%
6.6
7%
5.1
1%
4.6
8%
7.9
2%
6.6
2%
6.3
0%
6.4
4%
6.3
7%
6.0
7%
5.8
4%
6.9
4%
8.2
9%
8.5
5%
7.8
1%
7.3
3%
Mex
ico
3.9
5%
4.0
0%
4.0
5%
4.0
1%
4.2
4%
3.9
4%
4.1
1%
3.9
4%
3.9
3%
3.8
2%
3.9
0%
3.6
2%
3.7
1%
3.8
6%
3.7
7%
4.1
8%
4.2
3%
4.2
5%
4.1
2%
4.0
0%
3.9
3%
4.0
3%
4.1
1%
3.9
2%
3.8
3%
3.6
9%
Mo
ldo
va--
----
----
--3
5.0
2%
38
.18
%3
3.5
5%
35
.17
%3
4.6
1%
34
.43
%3
2.9
7%
33
.60
%3
5.9
1%
36
.38
%3
5.5
9%
33
.53
%3
4.9
2%
31
.31
%2
9.0
3%
22
.83
%3
0.7
9%
25
.48
%2
5.7
7%
26
.60
%
Mo
ngo
lia2
0.8
0%
21
.15
%2
0.8
2%
22
.57
%2
3.5
3%
27
.36
%2
7.5
4%
29
.06
%2
4.2
1%
23
.62
%2
5.9
0%
24
.37
%2
5.6
3%
25
.83
%2
6.3
7%
21
.97
%2
0.1
0%
17
.58
%1
9.5
2%
16
.97
%1
6.4
9%
17
.21
%2
0.9
1%
21
.19
%1
7.5
8%
18
.43
%
Mo
nte
neg
ro--
----
----
----
----
----
----
----
----
----
--1
1.0
1%
12
.98
%1
6.6
9%
15
.92
%1
4.8
4%
16
.04
%
Mo
rocc
o1
7.9
0%
17
.04
%1
8.9
6%
20
.40
%1
8.1
2%
18
.80
%1
6.5
5%
17
.41
%1
8.7
9%
15
.45
%1
9.5
3%
17
.02
%1
7.5
0%
16
.23
%1
5.8
0%
15
.93
%1
6.5
3%
16
.47
%1
7.0
6%
15
.01
%1
6.5
0%
15
.04
%1
6.3
4%
17
.15
%1
6.5
7%
17
.43
%
Mo
zam
biq
ue
75
.19
%6
8.0
1%
64
.20
%6
0.8
9%
61
.90
%5
5.8
8%
56
.15
%5
4.7
3%
48
.33
%7
7.5
3%
75
.43
%7
0.7
8%
67
.90
%6
4.7
5%
61
.92
%5
7.1
3%
52
.55
%5
1.0
3%
50
.21
%4
3.4
1%
39
.72
%4
0.7
7%
40
.51
%4
1.0
9%
45
.64
%4
3.6
0%
Nam
ibia
7.5
0%
5.8
7%
6.0
4%
6.1
5%
7.2
0%
6.2
0%
5.2
2%
5.7
7%
5.0
4%
5.3
3%
5.5
4%
9.8
3%
5.8
9%
8.9
1%
8.7
2%
7.4
5%
6.6
6%
6.6
5%
6.2
9%
6.6
1%
6.1
5%
6.0
7%
5.5
9%
5.0
2%
4.7
0%
4.9
3%
Nep
al4
5.1
0%
49
.27
%5
0.1
8%
50
.80
%5
0.4
6%
49
.40
%4
6.8
5%
48
.70
%4
5.5
1%
46
.95
%4
4.3
5%
44
.29
%4
5.8
7%
43
.23
%4
3.1
2%
41
.96
%4
1.9
1%
43
.17
%4
3.4
7%
43
.21
%4
2.7
3%
42
.07
%4
1.7
6%
41
.18
%4
1.5
7%
44
.14
%
Net
her
lan
ds
1.9
3%
1.5
6%
1.7
1%
0.7
2%
0.6
2%
0.7
5%
1.0
3%
1.0
2%
0.8
3%
0.7
9%
0.7
7%
0.8
0%
1.0
2%
1.0
5%
1.2
3%
1.2
3%
1.1
0%
0.6
9%
0.4
4%
0.2
1%
0.1
6%
-0.0
2%
-0.2
8%
-0.0
9%
-0.1
8%
-0.2
5%
New
Zea
lan
d3
.22
%2
.59
%2
.26
%1
.29
%1
.57
%1
.68
%1
.45
%1
.83
%2
.07
%1
.70
%1
.46
%1
.27
%2
.51
%2
.48
%2
.32
%1
.93
%2
.04
%1
.52
%0
.45
%0
.04
%0
.29
%-0
.76
%-0
.69
%-0
.04
%-1
.89
%-0
.85
%
Nic
arag
ua
8.4
7%
7.8
9%
11
.48
%1
0.4
9%
9.6
4%
12
.42
%1
4.8
0%
14
.04
%1
1.6
4%
10
.79
%1
0.7
1%
9.6
8%
13
.17
%1
2.9
2%
12
.22
%1
3.4
0%
13
.64
%1
4.7
4%
12
.43
%1
2.7
3%
13
.19
%1
1.5
5%
11
.43
%1
1.3
1%
8.2
1%
8.7
8%
Nig
er4
4.1
1%
43
.34
%5
0.6
6%
46
.21
%5
1.8
4%
51
.79
%5
8.6
0%
55
.97
%5
7.3
7%
55
.19
%6
2.0
7%
56
.68
%6
5.6
6%
62
.16
%6
2.4
0%
68
.47
%7
0.6
7%
70
.75
%6
6.0
6%
73
.41
%7
3.2
7%
72
.57
%7
7.2
2%
63
.81
%7
1.1
3%
60
.02
%
Nig
eria
51
.10
%5
8.6
0%
61
.36
%6
2.8
3%
59
.76
%6
7.7
8%
72
.92
%7
6.5
6%
77
.93
%8
1.0
9%
79
.01
%8
0.0
0%
81
.38
%8
4.4
8%
80
.66
%7
7.9
9%
78
.25
%7
4.9
4%
60
.45
%6
1.1
5%
59
.36
%5
2.6
6%
52
.94
%4
3.5
1%
44
.85
%4
4.0
1%
No
rway
2.1
8%
2.1
9%
2.1
9%
2.1
7%
2.1
7%
1.9
5%
1.8
6%
1.8
5%
1.8
3%
1.7
9%
1.7
4%
1.6
0%
1.5
5%
1.5
4%
1.3
7%
1.3
6%
1.4
2%
1.4
8%
1.5
4%
1.5
2%
1.5
5%
1.7
0%
1.9
0%
1.7
4%
1.8
1%
1.9
3%
Om
an3
.78
%3
.75
%3
.74
%3
.29
%3
.53
%3
.35
%3
.18
%3
.04
%2
.87
%2
.94
%2
.89
%2
.50
%2
.47
%2
.49
%1
.97
%2
.29
%2
.08
%2
.23
%2
.69
%2
.31
%2
.49
%2
.96
%3
.71
%2
.89
%3
.35
%3
.13
%
Pak
ista
n2
6.9
7%
25
.52
%2
3.9
1%
25
.49
%2
5.2
9%
24
.19
%2
3.4
7%
25
.36
%2
4.5
3%
25
.01
%2
5.0
9%
25
.18
%2
5.1
8%
24
.56
%2
4.8
4%
23
.25
%2
2.6
6%
22
.28
%2
1.6
2%
21
.39
%2
0.9
6%
20
.77
%2
1.0
2%
21
.10
%1
9.9
2%
19
.93
%
Pan
ama
5.6
3%
5.7
0%
5.2
3%
6.4
0%
5.3
9%
6.2
1%
6.3
7%
6.2
8%
6.6
3%
7.3
0%
7.6
7%
7.4
7%
8.4
1%
7.6
6%
8.0
4%
8.7
2%
8.8
5%
8.7
7%
8.2
1%
7.7
7%
7.2
3%
7.6
3%
7.8
3%
7.6
7%
7.7
2%
7.6
7%
Pap
ua
New
Gu
inea
16
.68
%2
1.1
3%
22
.76
%2
2.8
0%
27
.03
%2
7.2
3%
24
.95
%2
1.2
1%
17
.53
%1
8.6
3%
19
.66
%1
7.4
2%
18
.77
%2
1.3
8%
23
.04
%2
4.8
6%
24
.23
%2
2.5
5%
22
.95
%2
2.5
0%
24
.53
%2
4.2
4%
24
.54
%2
3.3
8%
21
.03
%1
8.2
1%
Par
agu
ay1
7.4
1%
18
.97
%1
9.2
8%
17
.33
%1
6.7
1%
17
.71
%1
8.5
7%
18
.57
%1
8.6
1%
19
.87
%1
9.2
1%
19
.30
%2
0.0
4%
22
.10
%2
0.6
3%
23
.26
%2
5.0
4%
24
.51
%2
1.8
9%
21
.13
%2
0.2
5%
21
.45
%1
8.1
6%
13
.59
%2
1.2
6%
22
.25
%
Per
u4
.91
%5
.37
%6
.15
%6
.03
%6
.52
%6
.52
%6
.70
%6
.97
%6
.48
%6
.39
%6
.90
%6
.40
%6
.73
%6
.79
%6
.87
%6
.88
%6
.73
%6
.54
%6
.08
%6
.13
%5
.81
%5
.81
%5
.77
%5
.76
%5
.34
%4
.75
%
Ph
ilip
pin
es1
5.3
8%
14
.95
%1
4.9
3%
15
.37
%1
6.4
6%
16
.02
%1
6.7
6%
16
.95
%1
7.1
5%
17
.35
%1
7.9
5%
16
.77
%1
6.5
6%
16
.69
%1
6.3
9%
16
.33
%1
6.3
7%
15
.99
%1
5.6
5%
15
.24
%1
4.9
6%
15
.22
%1
6.4
5%
15
.52
%1
4.8
2%
14
.07
%
Po
lan
d--
----
--1
0.3
0%
10
.42
%9
.16
%9
.92
%7
.98
%8
.18
%8
.08
%6
.84
%7
.10
%6
.53
%6
.12
%6
.01
%5
.82
%5
.24
%4
.98
%4
.37
%3
.92
%4
.04
%3
.79
%3
.89
%3
.51
%3
.27
%
Po
rtu
gal
6.0
6%
6.4
1%
5.2
0%
5.7
9%
6.2
9%
6.2
3%
5.9
2%
5.6
9%
5.9
4%
5.9
7%
6.1
1%
5.3
1%
5.0
3%
5.3
6%
4.7
9%
4.6
0%
4.6
5%
4.7
3%
5.2
5%
4.9
0%
4.9
0%
5.0
2%
5.2
5%
5.1
0%
5.2
2%
5.3
2%
Qat
ar--
----
----
----
----
----
----
--1
.48
%1
.45
%1
.51
%1
.43
%1
.03
%1
.32
%1
.25
%1
.29
%1
.68
%1
.35
%1
.47
%0
.90
%
Rep
. Ko
rea
11
.95
%1
0.6
8%
10
.47
%9
.96
%8
.88
%8
.07
%8
.15
%7
.42
%7
.06
%6
.80
%6
.89
%6
.65
%6
.67
%6
.40
%6
.04
%5
.75
%5
.18
%4
.86
%4
.88
%4
.72
%4
.54
%4
.49
%4
.86
%4
.64
%4
.19
%4
.24
%
Ro
man
ia1
6.0
3%
13
.89
%1
4.5
3%
15
.05
%1
6.0
5%
17
.30
%1
7.7
7%
19
.85
%1
7.6
1%
17
.07
%1
5.7
7%
17
.41
%1
7.1
3%
18
.29
%1
5.6
0%
17
.14
%1
5.5
0%
16
.85
%1
7.0
3%
14
.40
%1
3.7
6%
11
.71
%1
2.5
0%
12
.74
%1
1.8
4%
12
.67
%
Ru
ssia
n F
eder
atio
n--
----
----
--1
0.8
6%
10
.82
%1
0.8
5%
10
.98
%1
0.7
4%
10
.75
%9
.75
%8
.76
%8
.22
%8
.39
%8
.15
%7
.70
%7
.48
%7
.24
%7
.18
%6
.62
%7
.04
%7
.36
%6
.97
%7
.71
%
Rw
and
a4
1.8
3%
44
.55
%4
2.6
8%
47
.10
%4
8.2
2%
59
.07
%5
8.3
0%
50
.19
%8
1.3
3%
61
.41
%6
1.0
5%
54
.40
%5
6.2
1%
54
.70
%6
1.5
8%
57
.80
%6
2.0
1%
56
.66
%5
2.0
1%
50
.91
%4
7.4
6%
44
.89
%4
0.1
3%
54
.00
%5
4.8
5%
54
.54
%
Sam
oa
15
.14
%1
4.9
8%
16
.25
%1
4.9
9%
16
.13
%1
4.4
7%
14
.59
%1
5.5
1%
17
.61
%1
7.8
2%
17
.98
%1
5.1
5%
15
.46
%1
3.8
3%
13
.65
%1
2.9
2%
13
.36
%1
3.8
2%
15
.23
%1
4.6
4%
15
.45
%1
5.4
0%
16
.09
%2
0.4
2%
22
.36
%2
0.5
4%
Sao
To
me
and
Pri
nci
pe
----
----
----
----
----
----
----
--1
3.7
1%
14
.40
%1
3.5
7%
16
.43
%1
6.8
3%
17
.63
%2
0.0
1%
17
.92
%2
0.4
5%
15
.55
%1
8.3
5%

83 Ta
ble
6. P
CE
Rat
ios
FAO
Dat
aset
- D
elet
ed V
alu
es S
had
ed
Co
un
try
19
61
19
62
19
63
19
64
19
65
19
66
19
67
19
68
19
69
19
70
19
71
19
72
19
73
19
74
19
75
19
76
19
77
19
78
19
79
19
80
19
81
19
82
19
83
19
84
19
85
Sau
di A
rab
ia--
----
----
----
2.8
1%
2.8
3%
2.6
6%
3.0
2%
1.9
4%
1.9
4%
1.9
5%
1.9
2%
2.1
4%
2.5
7%
3.3
3%
3.6
6%
4.2
0%
4.4
1%
5.1
0%
5.1
0%
5.8
3%
4.6
3%
Sen
egal
25
.46
%2
5.9
7%
27
.39
%2
7.4
6%
27
.86
%2
5.5
5%
27
.11
%2
1.7
8%
24
.75
%1
6.5
7%
23
.43
%1
4.8
4%
22
.55
%2
8.5
1%
24
.65
%2
2.0
0%
14
.70
%2
3.5
8%
17
.92
%1
9.5
8%
24
.33
%1
8.1
8%
15
.06
%1
6.0
8%
17
.66
%
Serb
ia--
----
----
----
----
----
----
----
----
----
----
----
----
Seyc
hel
les
6.0
7%
6.2
8%
5.7
9%
5.7
7%
5.6
0%
6.0
6%
7.0
6%
5.1
8%
3.1
7%
4.5
5%
5.4
8%
5.3
2%
7.4
3%
9.5
6%
9.1
4%
8.4
0%
7.3
2%
8.1
6%
7.7
4%
9.0
4%
8.4
5%
8.9
6%
6.9
8%
7.1
1%
5.9
4%
Sier
ra L
eon
e1
5.6
8%
16
.98
%1
8.2
5%
16
.16
%1
7.1
4%
16
.74
%1
8.6
0%
15
.30
%1
4.5
1%
15
.21
%1
3.6
7%
10
.83
%1
3.3
7%
18
.38
%1
1.5
5%
11
.21
%6
.24
%1
1.0
2%
10
.30
%1
0.6
8%
12
.43
%1
3.3
8%
10
.81
%8
.88
%8
.86
%
Sin
gap
ore
13
.74
%1
1.6
4%
11
.85
%1
2.3
8%
12
.00
%1
1.3
9%
9.3
3%
9.9
9%
9.2
1%
8.2
4%
7.8
6%
8.0
5%
9.1
0%
8.7
5%
8.0
9%
8.8
0%
7.4
3%
6.1
0%
6.6
0%
5.7
1%
5.4
6%
5.0
1%
5.2
1%
4.1
4%
4.1
5%
Slo
vaki
a--
----
----
----
----
----
----
----
----
----
----
----
----
Slo
ven
ia--
----
----
----
----
----
----
----
----
----
----
----
----
Solo
mo
n Is
lan
ds
----
----
----
----
----
----
----
----
----
----
----
----
--
Sou
th A
fric
a6
.46
%5
.60
%5
.62
%5
.26
%5
.59
%5
.85
%5
.88
%4
.76
%5
.43
%4
.93
%5
.22
%4
.78
%4
.00
%3
.91
%3
.67
%4
.20
%4
.54
%4
.49
%4
.27
%3
.50
%4
.39
%4
.38
%4
.78
%5
.32
%5
.08
%
Spai
n7
.46
%6
.70
%7
.41
%6
.44
%6
.26
%6
.40
%5
.66
%5
.65
%5
.24
%5
.21
%5
.18
%5
.06
%5
.25
%5
.33
%5
.33
%4
.86
%4
.67
%4
.99
%5
.06
%5
.17
%4
.60
%5
.16
%4
.81
%5
.18
%4
.98
%
Sri L
anka
3.3
6%
2.4
2%
3.5
0%
14
.98
%4
.34
%1
0.2
5%
11
.51
%1
2.4
5%
13
.38
%1
5.5
3%
13
.66
%1
3.9
9%
14
.89
%2
0.3
0%
21
.32
%1
3.9
9%
8.5
3%
9.4
0%
14
.34
%1
6.9
0%
14
.39
%1
1.9
5%
13
.58
%6
.36
%1
0.8
1%
St. K
itts
an
d N
evis
----
----
----
----
----
----
----
----
-3.5
3%
-5.1
0%
-1.8
6%
-4.0
0%
-2.3
8%
1.5
0%
2.6
2%
1.2
3%
5.1
5%
St. L
uci
a--
----
----
----
----
----
----
----
----
----
13
.63
%1
2.5
9%
13
.39
%1
1.4
5%
8.1
8%
6.5
5%
St. V
ince
nt
and
th
e G
ren
adin
es5
.54
%5
.89
%7
.09
%7
.87
%7
.30
%7
.24
%8
.52
%7
.87
%8
.59
%1
0.1
0%
13
.33
%1
0.9
3%
10
.15
%7
.95
%1
2.5
1%
5.6
1%
6.5
0%
5.4
8%
8.9
7%
11
.01
%3
.98
%4
.34
%-0
.04
%-6
.61
%-1
3.4
2%
Sud
an5
2.2
7%
49
.05
%5
4.0
0%
54
.67
%4
9.4
0%
51
.37
%5
7.4
3%
51
.48
%5
3.8
7%
54
.42
%5
5.3
3%
58
.35
%6
1.3
7%
60
.52
%5
5.7
3%
47
.27
%4
5.1
6%
50
.75
%5
0.6
5%
56
.96
%5
6.6
2%
44
.92
%4
6.6
6%
43
.80
%6
0.7
5%
Suri
nam
e--
----
----
----
----
----
----
--4
.64
%6
.52
%6
.91
%6
.18
%5
.04
%5
.61
%7
.75
%6
.97
%7
.19
%7
.94
%6
.03
%
Swaz
ilan
d--
----
----
----
----
-6.7
2%
-6.6
8%
-10
.79
%-1
4.0
8%
-34
.35
%-3
0.3
7%
-19
.61
%-1
6.3
7%
-16
.66
%-2
2.1
9%
-37
.26
%-1
9.0
8%
-9.8
8%
-10
.95
%-4
.66
%0
.22
%
Swed
en3
.86
%3
.78
%3
.69
%3
.62
%3
.43
%3
.31
%3
.24
%3
.19
%2
.77
%2
.90
%2
.71
%2
.63
%2
.75
%2
.83
%2
.71
%2
.96
%3
.16
%3
.11
%3
.04
%2
.94
%2
.67
%2
.49
%2
.33
%2
.37
%2
.18
%
Swit
zerl
and
----
----
----
----
--3
.25
%3
.19
%3
.10
%3
.50
%3
.47
%3
.66
%3
.68
%3
.63
%3
.76
%3
.73
%3
.56
%3
.32
%3
.52
%3
.23
%3
.21
%3
.04
%
Tajik
ista
n--
----
----
----
----
----
----
----
----
----
----
----
----
Tan
zan
ia--
----
----
----
----
----
----
----
----
----
----
----
----
Thai
lan
d--
----
--3
5.5
8%
38
.94
%3
0.7
2%
31
.54
%3
2.3
4%
29
.69
%2
7.7
3%
24
.00
%2
5.0
5%
16
.00
%1
9.2
9%
16
.31
%1
4.2
9%
17
.08
%1
4.2
5%
14
.16
%1
2.0
4%
11
.66
%1
4.5
9%
13
.55
%1
5.7
7%
Tim
or-
Lest
e--
----
----
----
----
----
----
----
----
----
----
----
----
Togo
42
.42
%4
3.4
6%
45
.66
%3
5.0
4%
34
.19
%3
3.0
9%
31
.80
%2
9.4
4%
24
.49
%2
3.3
9%
26
.74
%2
5.0
6%
25
.68
%2
2.0
6%
23
.36
%2
2.8
7%
18
.46
%1
6.7
2%
24
.26
%2
3.0
2%
27
.08
%3
0.2
8%
30
.27
%2
9.5
0%
29
.05
%
Ton
ga--
----
----
----
----
----
----
----
----
----
--2
2.1
4%
18
.20
%1
7.3
8%
15
.79
%1
6.1
5%
Trin
idad
an
d T
ob
ago
6.4
6%
6.6
6%
5.7
6%
5.6
2%
6.3
1%
6.4
8%
6.0
8%
5.3
8%
5.7
4%
5.3
8%
5.4
9%
5.5
3%
6.0
8%
5.6
6%
4.7
4%
5.6
8%
6.0
0%
6.1
2%
6.2
5%
6.6
1%
6.8
5%
7.1
5%
7.7
1%
7.6
9%
6.8
0%
Tun
isia
29
.35
%2
7.4
5%
26
.82
%2
5.5
9%
24
.26
%2
0.9
6%
24
.68
%2
0.8
0%
18
.39
%2
0.6
2%
23
.16
%1
9.1
7%
22
.02
%2
3.1
5%
24
.16
%2
0.6
7%
20
.97
%1
9.3
4%
18
.32
%2
0.7
3%
18
.73
%1
6.2
7%
18
.63
%1
6.6
7%
16
.99
%
Turk
ey2
7.5
2%
26
.44
%2
5.4
6%
23
.59
%2
2.7
1%
22
.27
%2
1.1
8%
20
.81
%1
9.8
4%
20
.61
%2
0.2
2%
18
.91
%1
6.5
8%
17
.95
%1
8.0
0%
16
.90
%1
5.9
9%
16
.26
%1
6.4
9%
17
.38
%1
6.4
8%
16
.84
%1
5.5
9%
16
.29
%1
5.8
9%
Turk
men
ista
n--
----
----
----
----
----
----
----
----
----
----
----
----
Tuva
lu--
----
----
----
----
----
----
----
----
----
----
----
----
Uga
nd
a--
----
----
----
----
----
----
----
----
----
----
14
.16
%1
5.4
4%
12
.86
%1
6.1
7%
Ukr
ain
e--
----
----
----
----
----
----
----
----
----
----
----
----
Un
ited
Ara
b E
mir
ates
----
----
----
----
----
----
----
1.8
8%
1.8
6%
1.6
8%
1.8
8%
1.7
8%
1.7
5%
1.6
8%
1.7
8%
1.6
2%
1.5
8%
1.6
1%
Un
ited
Kin
gdo
m4
.77
%4
.96
%4
.90
%4
.76
%4
.54
%4
.35
%4
.27
%3
.87
%3
.77
%3
.78
%3
.74
%3
.63
%3
.67
%4
.02
%3
.85
%3
.43
%3
.64
%3
.40
%3
.52
%3
.43
%3
.09
%3
.09
%2
.88
%2
.86
%2
.63
%
Un
ited
Sta
tes
of
Am
eric
a3
.56
%3
.36
%3
.29
%3
.13
%3
.02
%2
.87
%2
.99
%3
.00
%2
.93
%2
.83
%2
.92
%2
.70
%2
.24
%2
.24
%2
.33
%2
.34
%2
.52
%2
.27
%2
.21
%1
.99
%2
.05
%2
.32
%2
.01
%2
.16
%2
.30
%
Uru
guay
11
.83
%1
1.5
2%
11
.44
%1
1.8
8%
9.7
2%
9.6
3%
10
.02
%1
1.4
7%
10
.41
%1
1.1
1%
9.8
7%
8.7
3%
8.3
7%
10
.34
%8
.64
%7
.95
%6
.63
%6
.71
%6
.79
%5
.31
%4
.90
%6
.70
%6
.90
%7
.55
%8
.20
%
Uzb
ekis
tan
----
----
----
----
----
----
----
----
----
----
----
----
--
Van
uat
u--
----
----
----
----
----
----
----
----
--3
2.7
6%
34
.69
%3
4.0
1%
28
.25
%2
5.8
5%
27
.03
%2
4.6
9%
Ven
ezu
ela
5.9
7%
5.5
9%
5.3
5%
5.4
6%
5.5
5%
5.5
4%
5.7
9%
5.3
8%
5.7
6%
5.6
7%
5.7
2%
5.8
7%
5.9
0%
6.4
5%
6.5
4%
6.3
4%
7.1
0%
6.6
4%
6.5
7%
7.8
1%
8.1
2%
8.1
1%
7.4
8%
7.3
8%
7.4
3%
Vie
t N
am--
----
----
----
----
----
----
----
----
----
----
----
30
.49
%2
9.5
1%
Yem
en--
----
----
----
----
----
----
----
----
----
----
----
----
Zam
bia
6.4
7%
6.0
7%
5.8
3%
5.4
8%
4.6
7%
6.0
8%
4.5
5%
6.0
5%
6.9
9%
6.6
7%
9.2
4%
7.2
9%
5.5
0%
6.5
6%
7.0
0%
5.9
5%
5.6
8%
5.0
1%
6.5
4%
8.9
1%
5.4
4%
5.2
1%
5.0
9%
5.1
2%
5.0
0%
Zim
bab
we
6.7
7%
5.7
1%
7.2
0%
6.5
0%
2.6
9%
5.3
4%
3.7
3%
2.9
5%
3.6
4%
2.7
4%
3.7
2%
2.4
8%
-0.0
7%
-0.2
6%
-6.2
8%
-0.2
4%
0.2
0%
0.1
5%
-0.5
8%
1.9
9%
1.6
9%
1.5
8%
1.5
6%
4.2
9%
4.3
6%
Wo
rld
To
tal
7.9
1%
7.7
4%
7.6
3%
7.3
0%
7.1
1%
6.8
9%
6.8
5%
6.6
0%
6.2
7%
5.9
8%
5.8
5%
5.5
0%
5.3
3%
5.3
5%
5.4
5%
5.1
9%
5.1
6%
5.1
3%
5.0
6%
4.9
8%
5.0
0%
5.2
3%
5.1
2%
5.1
5%
5.0
7%

84 Ta
ble
6. P
CE
Rat
ios
FAO
Dat
aset
(C
on
t.)
- D
elet
ed V
alu
es S
had
ed
Co
un
try
19
86
19
87
19
88
19
89
19
90
19
91
19
92
19
93
19
94
19
95
19
96
19
97
19
98
19
99
20
00
20
01
20
02
20
03
20
04
20
05
20
06
20
07
20
08
20
09
20
10
20
11
Sau
di A
rab
ia4
.18
%4
.59
%4
.30
%4
.15
%3
.96
%3
.79
%3
.64
%3
.39
%3
.36
%3
.80
%3
.81
%3
.81
%3
.63
%3
.63
%3
.70
%3
.56
%3
.71
%3
.71
%3
.54
%3
.76
%3
.64
%3
.86
%4
.03
%3
.35
%3
.87
%3
.87
%
Sen
egal
16
.98
%1
6.9
6%
15
.94
%1
8.5
5%
18
.95
%1
5.9
6%
15
.41
%1
5.9
0%
15
.37
%1
7.5
3%
16
.65
%1
3.8
9%
14
.23
%1
6.6
1%
14
.60
%1
4.7
1%
11
.25
%1
5.0
1%
15
.04
%1
6.2
2%
13
.53
%1
5.7
3%
24
.07
%1
7.5
4%
17
.37
%1
5.1
3%
Serb
ia--
----
----
----
----
----
----
----
----
----
--1
2.7
6%
10
.61
%1
2.0
0%
11
.63
%1
0.6
1%
10
.18
%
Seyc
hel
les
6.4
1%
6.6
2%
6.8
6%
6.4
0%
6.3
2%
5.7
7%
6.6
2%
5.9
8%
5.8
8%
6.5
7%
6.9
7%
6.9
5%
5.4
5%
4.7
0%
5.0
6%
3.4
3%
4.2
2%
5.9
2%
4.3
4%
5.9
9%
6.9
6%
6.3
0%
5.5
1%
4.6
4%
4.5
0%
4.7
2%
Sier
ra L
eon
e1
2.3
5%
10
.97
%1
3.5
4%
15
.60
%1
5.7
6%
14
.51
%1
7.6
6%
17
.25
%2
1.5
5%
22
.48
%2
6.5
5%
24
.41
%2
3.2
7%
20
.96
%1
7.5
2%
22
.48
%2
2.1
2%
21
.66
%1
7.8
2%
16
.82
%1
9.6
3%
16
.75
%2
0.2
0%
19
.03
%1
9.9
6%
21
.85
%
Sin
gap
ore
3.6
4%
3.2
9%
3.0
9%
2.8
9%
3.0
9%
2.8
6%
2.8
1%
2.6
6%
1.9
8%
1.8
3%
2.0
1%
1.7
5%
1.3
1%
1.4
9%
1.3
3%
1.5
1%
1.2
9%
1.2
7%
1.1
4%
1.1
0%
1.0
2%
1.1
7%
1.3
0%
1.1
2%
1.1
9%
1.2
0%
Slo
vaki
a--
----
----
----
6.9
4%
6.1
8%
5.5
5%
5.9
2%
5.6
2%
5.2
0%
4.8
2%
4.3
0%
4.3
8%
4.1
7%
3.7
7%
4.0
1%
3.7
5%
3.2
7%
3.1
0%
3.6
9%
3.4
7%
3.1
5%
2.9
7%
Slo
ven
ia--
----
----
--3
.77
%4
.82
%5
.09
%5
.29
%5
.28
%4
.83
%4
.57
%4
.45
%4
.03
%3
.80
%3
.93
%3
.90
%4
.14
%3
.96
%3
.67
%3
.80
%3
.92
%4
.07
%3
.82
%4
.21
%
Solo
mo
n Is
lan
ds
----
----
17
.29
%1
7.3
7%
16
.00
%1
4.9
0%
14
.65
%1
4.2
3%
14
.93
%1
5.5
6%
13
.81
%1
4.0
4%
16
.49
%1
9.1
3%
19
.43
%1
8.6
1%
21
.19
%2
4.5
2%
25
.08
%2
3.3
9%
25
.00
%2
2.7
7%
27
.67
%2
2.9
4%
Sou
th A
fric
a4
.89
%5
.16
%5
.19
%4
.88
%5
.05
%5
.25
%5
.15
%5
.45
%5
.27
%4
.83
%5
.19
%5
.07
%4
.73
%4
.96
%5
.29
%4
.80
%5
.00
%4
.75
%4
.78
%4
.62
%4
.53
%4
.62
%4
.92
%4
.77
%4
.62
%4
.56
%
Spai
n4
.75
%4
.73
%4
.29
%4
.37
%4
.49
%4
.22
%4
.22
%4
.02
%3
.78
%3
.35
%3
.92
%3
.90
%3
.73
%3
.63
%3
.66
%3
.48
%3
.46
%3
.47
%3
.27
%2
.91
%2
.96
%2
.94
%2
.82
%2
.88
%2
.81
%2
.89
%
Sri L
anka
12
.36
%9
.21
%1
0.7
5%
11
.59
%9
.66
%9
.42
%1
0.3
4%
10
.40
%1
0.6
8%
10
.38
%8
.28
%6
.85
%6
.21
%6
.81
%6
.38
%6
.37
%6
.32
%6
.20
%5
.73
%5
.23
%7
.21
%7
.05
%5
.29
%4
.64
%4
.67
%4
.61
%
St. K
itts
an
d N
evis
2.4
7%
1.3
2%
3.1
6%
2.4
9%
4.2
5%
4.0
7%
2.4
0%
3.1
8%
2.6
7%
2.8
6%
4.6
1%
2.4
9%
3.6
3%
3.4
7%
6.6
8%
5.5
3%
4.8
5%
5.4
1%
4.7
5%
4.8
5%
6.1
6%
6.5
1%
6.1
1%
6.7
8%
6.3
0%
5.2
0%
St. L
uci
a-0
.17
%4
.47
%-0
.37
%3
.74
%0
.64
%4
.62
%3
.45
%6
.15
%7
.40
%7
.03
%6
.82
%9
.73
%8
.78
%7
.03
%8
.33
%8
.15
%7
.07
%8
.44
%8
.54
%8
.39
%8
.29
%8
.47
%8
.07
%3
.98
%7
.65
%7
.73
%
St. V
ince
nt
and
th
e G
ren
adin
es-1
4.9
2%
-5.4
5%
-11
.20
%-5
.77
%-7
.70
%-4
.99
%-6
.89
%-0
.66
%1
.25
%-0
.51
%2
.60
%3
.82
%2
.26
%0
.96
%0
.77
%4
.05
%4
.54
%5
.08
%5
.37
%5
.65
%5
.62
%7
.27
%8
.95
%8
.09
%9
.53
%8
.70
%
Sud
an5
4.2
3%
42
.02
%5
1.9
6%
40
.67
%4
1.3
2%
49
.87
%5
0.1
3%
42
.93
%5
1.5
1%
47
.71
%5
0.1
7%
46
.47
%4
8.3
9%
47
.22
%4
7.9
4%
49
.84
%4
7.4
9%
49
.39
%4
8.0
0%
47
.65
%4
5.5
0%
40
.00
%3
9.7
3%
38
.70
%3
6.6
9%
4.3
7%
Suri
nam
e7
.39
%8
.15
%7
.88
%9
.41
%1
1.1
0%
12
.37
%1
2.0
5%
11
.94
%1
0.7
9%
11
.03
%1
0.8
2%
10
.73
%1
3.2
5%
10
.69
%9
.78
%1
0.3
5%
8.8
6%
8.5
2%
9.4
9%
9.2
7%
9.8
9%
10
.35
%9
.00
%9
.43
%9
.44
%1
0.5
5%
Swaz
ilan
d-6
.48
%-1
4.0
0%
-11
.84
%-7
.63
%-1
2.0
2%
-11
.01
%-7
.63
%-5
.56
%-6
.03
%-6
.60
%-6
.49
%-4
.69
%-1
.87
%1
.02
%-1
.01
%-1
.41
%2
.96
%3
.19
%3
.77
%5
.00
%-3
.05
%3
.81
%2
.67
%3
.81
%2
.99
%2
.10
%
Swed
en2
.35
%2
.22
%2
.31
%2
.24
%2
.29
%2
.18
%2
.21
%2
.32
%2
.29
%2
.13
%2
.15
%2
.05
%1
.98
%1
.89
%1
.71
%1
.68
%1
.71
%1
.78
%1
.82
%1
.72
%1
.67
%1
.76
%1
.90
%1
.90
%1
.75
%1
.86
%
Swit
zerl
and
3.1
1%
3.0
1%
3.0
4%
2.8
6%
2.7
7%
2.7
5%
2.8
0%
2.6
6%
2.6
0%
2.6
2%
2.6
6%
2.4
3%
2.4
7%
2.2
7%
2.2
3%
2.1
2%
2.2
0%
2.2
1%
2.2
0%
2.0
9%
2.0
3%
2.0
0%
2.0
7%
2.0
5%
1.9
4%
2.0
2%
Tajik
ista
n--
----
----
--4
2.7
0%
43
.21
%4
6.4
8%
51
.34
%5
0.6
1%
51
.62
%4
5.0
3%
45
.90
%5
0.6
6%
44
.32
%4
6.5
8%
44
.78
%4
7.3
0%
50
.10
%5
0.9
8%
47
.40
%4
9.6
9%
56
.18
%5
5.3
0%
54
.62
%
Tan
zan
ia--
--1
3.5
9%
13
.65
%1
3.6
5%
14
.43
%1
4.5
1%
13
.67
%1
2.7
9%
13
.12
%1
2.6
7%
12
.75
%1
5.0
9%
12
.74
%1
2.3
9%
13
.14
%1
5.6
0%
12
.72
%1
4.3
0%
12
.74
%1
3.9
2%
12
.86
%1
1.1
8%
11
.22
%1
2.0
4%
12
.64
%
Thai
lan
d1
3.1
8%
12
.13
%1
0.9
1%
8.7
6%
8.3
6%
8.6
5%
8.2
5%
8.5
6%
7.9
8%
6.7
7%
6.4
8%
7.0
4%
8.1
8%
8.2
8%
9.4
1%
9.4
4%
9.0
9%
8.4
9%
6.6
2%
6.9
4%
6.6
4%
6.4
5%
4.6
8%
4.9
5%
4.6
2%
3.3
9%
Tim
or-
Lest
e--
----
----
----
----
----
----
16
.41
%1
6.2
5%
15
.79
%1
6.2
1%
16
.72
%1
5.1
2%
13
.34
%1
4.8
1%
14
.81
%1
1.9
1%
13
.12
%1
0.7
9%
11
.66
%
Togo
28
.67
%2
7.6
6%
32
.38
%3
3.7
7%
33
.77
%3
3.3
6%
35
.33
%4
8.2
3%
42
.14
%3
9.5
8%
37
.79
%3
2.6
5%
33
.21
%3
2.7
3%
32
.95
%3
6.4
8%
37
.42
%3
6.3
9%
36
.20
%3
7.2
5%
40
.61
%3
4.2
2%
41
.24
%3
4.4
4%
37
.44
%4
4.1
7%
Ton
ga1
5.4
6%
14
.96
%1
7.2
8%
14
.61
%1
3.5
0%
7.7
7%
10
.70
%1
1.7
5%
12
.15
%1
1.2
0%
13
.84
%1
3.9
9%
15
.08
%1
1.8
6%
13
.10
%1
3.2
6%
12
.09
%1
0.8
0%
13
.76
%1
4.7
9%
14
.54
%1
8.3
4%
16
.66
%1
6.3
0%
17
.65
%1
6.0
0%
Trin
idad
an
d T
ob
ago
6.1
7%
5.9
5%
4.6
5%
4.3
8%
4.3
3%
4.2
7%
4.3
3%
3.7
1%
3.2
9%
3.4
2%
3.4
2%
3.1
7%
3.1
8%
2.9
6%
2.8
7%
3.0
7%
2.9
0%
2.6
6%
2.6
1%
2.6
0%
2.3
2%
2.6
4%
3.0
4%
2.9
8%
3.1
0%
3.8
3%
Tun
isia
16
.54
%1
6.2
9%
15
.50
%1
6.8
1%
17
.38
%1
8.0
8%
15
.65
%1
6.5
0%
13
.00
%1
4.1
9%
17
.75
%1
3.6
8%
15
.06
%1
4.4
9%
12
.63
%1
1.5
8%
11
.39
%1
3.5
4%
11
.92
%1
1.6
2%
12
.05
%1
2.1
6%
12
.17
%1
0.2
2%
10
.21
%1
1.0
1%
Turk
ey1
6.1
5%
14
.23
%1
4.5
7%
14
.06
%1
4.0
1%
13
.43
%1
2.7
2%
11
.97
%1
2.4
7%
11
.70
%1
1.8
9%
10
.49
%1
1.3
8%
11
.21
%1
1.2
7%
10
.71
%1
1.0
0%
10
.30
%9
.44
%8
.90
%8
.81
%8
.17
%8
.27
%8
.61
%8
.22
%7
.97
%
Turk
men
ista
n--
----
----
--4
3.8
9%
50
.08
%6
1.3
9%
65
.31
%4
8.3
9%
55
.17
%6
1.7
8%
64
.61
%6
6.7
5%
69
.92
%8
4.0
3%
89
.05
%8
5.4
6%
84
.67
%7
3.9
7%
75
.18
%6
3.0
2%
63
.50
%5
4.1
9%
43
.86
%
Tuva
lu--
----
--7
.73
%1
0.4
2%
10
.03
%7
.96
%9
.42
%1
0.3
4%
11
.40
%1
0.4
1%
8.6
6%
8.2
0%
9.2
4%
8.3
7%
15
.98
%1
3.3
3%
18
.57
%2
2.6
9%
16
.56
%1
3.6
7%
14
.56
%1
6.2
9%
16
.35
%1
1.1
6%
Uga
nd
a1
3.7
9%
21
.49
%2
3.5
1%
25
.11
%3
0.0
0%
29
.95
%2
9.8
6%
28
.26
%2
4.7
6%
19
.65
%1
5.6
8%
18
.39
%1
9.7
2%
19
.54
%2
2.4
6%
23
.26
%2
2.2
3%
23
.58
%2
1.1
0%
19
.48
%1
7.3
2%
15
.86
%1
3.7
5%
13
.90
%1
3.1
4%
11
.86
%
Ukr
ain
e--
----
----
--1
8.4
7%
21
.52
%2
2.0
5%
23
.09
%2
4.3
1%
25
.68
%2
3.6
6%
21
.59
%2
3.9
8%
22
.05
%2
0.9
5%
19
.52
%1
8.3
8%
17
.53
%1
7.3
4%
15
.29
%1
6.4
2%
18
.23
%1
8.3
9%
19
.67
%
Un
ited
Ara
b E
mir
ates
2.0
1%
2.0
8%
2.0
4%
2.1
7%
1.6
5%
1.5
9%
1.7
6%
1.6
6%
2.0
3%
2.0
0%
1.9
8%
1.6
5%
1.7
6%
1.8
8%
1.7
2%
1.6
3%
1.9
1%
1.7
5%
1.9
1%
0.9
7%
2.0
8%
2.2
7%
2.9
6%
3.0
4%
3.0
3%
3.5
9%
Un
ited
Kin
gdo
m2
.65
%2
.58
%2
.56
%2
.42
%2
.56
%2
.51
%2
.54
%2
.24
%2
.10
%2
.03
%2
.04
%1
.95
%1
.94
%1
.91
%1
.73
%1
.66
%1
.71
%1
.76
%1
.83
%1
.82
%1
.82
%1
.87
%1
.99
%1
.95
%1
.91
%1
.99
%
Un
ited
Sta
tes
of
Am
eric
a2
.24
%2
.12
%1
.78
%1
.82
%1
.90
%1
.88
%1
.91
%1
.74
%1
.92
%1
.70
%1
.70
%1
.76
%1
.73
%1
.73
%1
.69
%1
.63
%1
.61
%1
.61
%1
.64
%1
.57
%1
.54
%1
.50
%1
.44
%1
.58
%1
.52
%1
.40
%
Uru
guay
6.6
6%
7.1
0%
7.1
7%
6.2
9%
4.9
4%
5.8
7%
7.0
9%
6.2
6%
6.6
9%
6.0
9%
6.2
2%
5.4
0%
4.8
2%
6.9
9%
7.0
2%
6.5
5%
7.4
6%
6.7
6%
5.8
8%
5.5
5%
4.9
4%
4.2
3%
1.5
7%
2.6
1%
4.3
5%
4.2
2%
Uzb
ekis
tan
----
----
----
22
.71
%1
8.9
3%
20
.44
%2
0.2
3%
20
.63
%1
4.9
9%
15
.10
%1
3.0
9%
12
.21
%1
0.6
8%
11
.23
%1
0.6
5%
10
.14
%1
0.4
7%
9.9
6%
10
.67
%1
2.3
4%
10
.93
%1
0.3
0%
10
.58
%
Van
uat
u2
4.2
7%
24
.37
%2
3.4
1%
21
.69
%2
3.2
9%
20
.29
%2
0.6
4%
19
.94
%1
7.0
0%
18
.02
%1
9.8
4%
20
.28
%2
0.7
4%
17
.75
%1
5.7
3%
16
.77
%1
6.1
6%
15
.92
%1
6.2
8%
16
.11
%1
5.2
7%
16
.53
%1
6.9
3%
15
.49
%1
9.1
1%
18
.89
%
Ven
ezu
ela
6.9
5%
7.2
6%
7.8
7%
7.3
4%
6.8
8%
6.7
4%
6.7
0%
6.7
6%
6.6
4%
6.7
0%
6.9
7%
6.8
0%
7.4
0%
8.1
3%
8.3
3%
8.4
6%
8.8
1%
9.9
1%
8.4
7%
8.1
5%
8.1
6%
8.8
6%
9.9
9%
9.1
6%
8.5
7%
8.1
1%
Vie
t N
am2
7.9
3%
28
.24
%2
8.6
6%
26
.01
%2
4.9
7%
24
.92
%2
3.8
1%
23
.92
%2
2.0
9%
20
.54
%1
9.2
2%
17
.85
%1
7.4
3%
18
.40
%1
9.4
1%
19
.83
%2
0.9
7%
20
.80
%1
9.6
8%
18
.90
%1
8.3
0%
17
.79
%1
6.1
8%
16
.90
%1
6.5
2%
15
.29
%
Yem
en--
----
--2
4.8
3%
22
.54
%2
5.2
0%
25
.10
%2
1.1
9%
20
.09
%2
2.7
7%
17
.10
%1
8.2
9%
17
.07
%1
7.1
9%
17
.15
%1
7.3
6%
17
.51
%1
7.0
3%
17
.19
%1
8.2
6%
21
.88
%2
3.2
4%
22
.45
%2
2.3
4%
26
.11
%
Zam
bia
4.3
5%
4.3
8%
5.3
5%
5.2
3%
5.1
1%
4.6
5%
6.6
0%
5.7
3%
5.2
5%
5.3
7%
5.4
4%
5.0
3%
7.0
5%
4.7
4%
4.6
0%
4.4
4%
5.0
7%
5.7
1%
3.8
4%
3.7
3%
4.9
8%
2.7
0%
3.1
3%
3.6
5%
3.4
2%
2.4
3%
Zim
bab
we
2.5
1%
0.8
9%
2.6
1%
3.1
9%
2.1
2%
2.7
2%
8.5
7%
6.0
3%
0.0
0%
0.8
0%
3.1
7%
2.2
6%
2.3
2%
3.4
6%
3.6
6%
5.0
7%
5.7
7%
7.3
8%
11
.32
%6
.78
%2
3.1
0%
11
.22
%1
5.5
5%
20
.08
%2
1.5
6%
20
.83
%
Wo
rld
To
tal
5.0
1%
4.9
0%
4.7
2%
4.6
8%
4.7
1%
4.7
1%
5.0
0%
4.9
2%
4.9
0%
4.8
3%
4.8
6%
4.7
2%
4.7
0%
4.7
0%
4.5
4%
4.4
8%
4.4
6%
4.4
4%
4.4
3%
4.3
3%
4.2
6%
4.2
1%
4.3
2%
4.4
3%
4.3
1%
4.2
8%

85 Ta
ble
7. P
CE
Rat
ios
FAO
-Cle
an D
atas
et
Co
un
try
19
61
19
62
19
63
19
64
19
65
19
66
19
67
19
68
19
69
19
70
19
71
19
72
19
73
19
74
19
75
19
76
19
77
19
78
19
79
19
80
19
81
19
82
19
83
19
84
19
85
Afg
han
ista
n--
----
----
----
----
----
----
----
----
----
----
----
----
Alb
ania
----
----
----
----
----
----
----
----
----
--1
6.2
5%
16
.93
%1
7.2
5%
18
.23
%1
7.0
4%
16
.65
%
Alg
eria
23
.51
%2
8.7
3%
20
.42
%1
8.7
0%
19
.53
%1
4.7
7%
15
.10
%1
6.7
4%
14
.50
%1
3.2
6%
16
.22
%1
2.6
5%
12
.19
%1
5.0
4%
18
.11
%1
3.7
4%
12
.84
%1
2.7
7%
12
.53
%1
5.0
6%
14
.31
%1
2.4
6%
11
.82
%1
0.8
0%
12
.34
%
An
gola
----
----
----
----
----
----
----
----
----
----
----
----
5.0
9%
An
tigu
a an
d B
arb
ud
a--
----
----
----
----
----
----
----
--1
1.5
2%
13
.16
%1
2.8
3%
15
.10
%1
4.8
0%
14
.12
%1
3.3
1%
13
.69
%1
1.3
3%
Arg
enti
na
9.6
8%
8.9
1%
9.7
1%
7.1
9%
5.3
7%
6.7
1%
8.9
3%
8.2
5%
7.8
7%
7.1
6%
6.2
6%
6.1
4%
4.0
2%
3.8
0%
6.3
5%
6.4
0%
4.5
3%
6.3
1%
5.2
3%
4.9
0%
4.3
7%
7.3
4%
5.1
7%
6.9
8%
8.0
6%
Arm
enia
----
----
----
----
----
----
----
----
----
----
----
----
--
Au
stra
lia3
.23
%3
.38
%3
.56
%2
.74
%2
.66
%3
.48
%2
.46
%3
.36
%3
.17
%2
.80
%2
.63
%2
.18
%2
.00
%--
--1
.33
%1
.54
%2
.42
%1
.98
%--
----
2.6
0%
2.1
6%
1.9
0%
Au
stri
a6
.06
%5
.92
%6
.01
%5
.80
%5
.20
%5
.36
%5
.13
%5
.08
%4
.62
%4
.35
%4
.14
%3
.79
%4
.13
%3
.92
%3
.94
%3
.88
%3
.90
%3
.97
%3
.82
%3
.89
%3
.56
%3
.70
%3
.33
%3
.41
%3
.26
%
Aze
rbai
jan
----
----
----
----
----
----
----
----
----
----
----
----
--
Bah
amas
5.2
9%
4.6
5%
4.5
4%
4.7
4%
4.4
4%
4.9
4%
4.7
0%
4.7
1%
5.9
7%
6.3
2%
5.8
6%
6.3
6%
6.4
7%
7.9
4%
8.1
1%
8.3
0%
5.6
4%
4.7
1%
4.9
1%
6.3
1%
4.9
6%
6.7
3%
5.6
2%
5.2
5%
5.0
5%
Bah
rain
----
----
----
----
----
----
----
----
----
--6
.21
%5
.62
%6
.22
%6
.08
%5
.98
%5
.69
%
Ban
glad
esh
23
.96
%2
1.0
1%
25
.94
%2
2.5
3%
20
.43
%2
0.7
0%
24
.13
%2
2.5
8%
23
.28
%2
1.9
4%
22
.15
%2
5.8
5%
32
.68
%2
8.7
0%
31
.31
%2
6.3
8%
23
.73
%2
5.3
9%
22
.38
%2
5.3
5%
22
.15
%2
3.1
0%
22
.53
%2
1.5
4%
23
.19
%
Bar
bad
os
5.4
2%
5.7
1%
3.0
7%
5.4
1%
5.2
9%
5.0
3%
4.7
7%
5.7
1%
5.9
9%
6.4
7%
6.7
1%
7.4
1%
7.1
1%
5.9
3%
2.9
2%
6.5
6%
6.9
7%
7.4
6%
6.5
8%
5.4
3%
7.3
8%
7.0
7%
7.5
1%
6.6
1%
6.2
0%
Bel
aru
s--
----
----
----
----
----
----
----
----
----
----
----
----
Bel
giu
m--
----
----
----
----
----
----
----
----
----
----
----
----
Bel
ize
9.8
2%
21
.50
%1
0.7
4%
8.6
5%
15
.83
%1
4.1
5%
17
.23
%1
8.3
9%
18
.57
%2
0.6
4%
20
.88
%1
1.8
8%
9.2
3%
----
13
.47
%8
.16
%4
.03
%7
.46
%--
10
.24
%9
.62
%7
.88
%8
.58
%1
2.3
9%
Ben
in1
6.8
8%
16
.63
%1
6.3
1%
15
.67
%1
5.4
1%
15
.35
%1
5.8
2%
15
.61
%1
4.4
3%
13
.93
%1
4.5
5%
14
.57
%1
4.2
1%
13
.21
%1
3.6
0%
15
.85
%1
5.7
1%
16
.45
%1
7.0
7%
16
.06
%1
5.4
4%
15
.62
%1
6.1
8%
16
.56
%1
5.0
6%
Ber
mu
da
5.5
7%
5.2
6%
5.5
1%
4.9
5%
4.9
8%
4.7
0%
3.9
4%
4.0
8%
3.9
3%
3.7
6%
3.8
1%
4.1
8%
4.5
2%
4.9
9%
4.3
9%
4.1
6%
3.5
7%
3.7
9%
3.7
6%
3.6
0%
3.6
2%
3.5
0%
3.5
7%
3.6
4%
3.4
9%
Bh
uta
n--
----
----
----
----
----
----
----
----
----
----
----
--7
4.4
9%
Bo
livia
14
.50
%1
4.5
1%
14
.63
%1
3.1
0%
13
.43
%1
2.0
4%
11
.68
%1
4.4
1%
13
.76
%1
4.3
5%
13
.62
%1
3.3
8%
11
.96
%1
3.4
8%
14
.36
%1
2.3
7%
11
.57
%1
2.6
0%
12
.04
%1
2.9
0%
15
.18
%1
5.0
6%
12
.85
%1
5.3
2%
17
.30
%
Bo
snia
an
d H
erze
govi
na
----
----
----
----
----
----
----
----
----
----
----
----
--
Bo
tsw
ana
4.6
0%
5.5
2%
3.6
5%
----
--2
.99
%4
.40
%5
.53
%3
.07
%3
.82
%1
.86
%--
----
----
----
6.4
1%
2.1
1%
1.4
3%
3.2
9%
3.7
8%
2.2
4%
Bra
zil
5.2
5%
6.0
0%
5.8
0%
6.3
1%
6.5
9%
5.9
3%
6.7
5%
6.0
0%
5.4
1%
5.0
1%
4.7
9%
3.9
0%
2.9
4%
2.9
7%
3.2
3%
2.8
7%
2.1
3%
2.6
6%
3.0
7%
2.7
7%
3.0
6%
3.6
5%
3.4
2%
3.3
5%
3.9
3%
Bru
nei
Dar
uss
alam
----
----
----
----
----
----
--1
.62
%1
.85
%1
.49
%1
.39
%1
.40
%1
.29
%1
.67
%2
.28
%2
.09
%2
.05
%2
.07
%1
.84
%
Bu
lgar
ia--
----
----
----
----
----
----
----
----
----
15
.92
%1
9.9
2%
18
.57
%1
9.0
1%
20
.73
%1
9.5
8%
Bu
rkin
a Fa
so3
2.1
4%
34
.12
%3
5.4
9%
38
.97
%3
3.3
6%
38
.23
%3
5.1
9%
35
.12
%3
4.1
9%
35
.92
%3
3.0
0%
39
.98
%3
9.4
8%
40
.76
%3
5.0
5%
29
.33
%3
1.8
1%
34
.98
%3
2.7
2%
31
.22
%3
4.8
0%
32
.14
%3
0.4
3%
32
.78
%3
7.9
2%
Bu
run
di
----
----
----
----
----
----
----
----
----
----
----
----
--
Cab
o V
erd
e--
----
----
----
----
----
----
----
----
----
--6
7.3
9%
64
.71
%5
2.6
3%
56
.01
%5
2.3
9%
Cam
bo
dia
----
----
----
----
----
----
----
----
----
----
----
----
--
Cam
ero
on
22
.49
%2
2.0
9%
20
.78
%2
2.2
8%
21
.56
%2
1.0
0%
25
.40
%2
3.2
5%
20
.00
%2
4.1
0%
26
.35
%2
7.5
3%
23
.31
%1
9.2
1%
19
.01
%1
7.5
3%
12
.23
%8
.31
%9
.13
%1
0.1
3%
13
.46
%1
4.7
4%
13
.50
%1
1.0
7%
11
.50
%
Can
ada
3.7
6%
4.2
1%
4.0
7%
3.2
2%
3.4
7%
3.2
2%
3.4
2%
3.6
1%
3.7
6%
3.2
6%
3.2
0%
2.9
6%
2.6
8%
2.3
1%
2.5
1%
2.6
6%
2.8
2%
2.8
3%
2.4
9%
2.1
0%
2.1
5%
2.1
7%
1.9
8%
2.0
5%
2.3
9%
Cen
tral
Afr
ican
Rep
ub
lic1
6.1
4%
17
.03
%1
8.5
0%
14
.61
%1
8.2
1%
15
.80
%1
8.0
3%
18
.29
%1
7.7
7%
17
.32
%1
7.7
0%
18
.09
%2
1.7
7%
18
.67
%2
1.1
6%
18
.14
%1
3.5
3%
16
.26
%1
8.7
6%
18
.66
%2
3.7
1%
18
.96
%2
2.9
4%
18
.91
%1
7.4
0%
Ch
ad1
0.4
5%
10
.54
%1
2.1
7%
11
.51
%1
2.1
8%
13
.31
%1
3.7
4%
14
.06
%1
2.6
1%
11
.93
%1
1.4
3%
11
.29
%1
2.9
6%
12
.84
%1
1.2
3%
8.0
2%
7.5
3%
7.5
1%
9.2
6%
7.2
9%
6.8
5%
9.5
4%
7.5
9%
7.8
4%
8.1
1%
Ch
ile1
0.3
9%
10
.07
%1
0.2
8%
9.9
0%
9.6
0%
9.8
6%
9.1
6%
9.1
7%
8.7
3%
8.6
7%
8.1
0%
8.7
4%
8.8
2%
12
.81
%9
.52
%1
0.4
6%
8.0
9%
8.2
6%
8.4
2%
8.4
8%
8.2
2%
7.8
8%
7.7
6%
6.8
6%
5.3
1%
Ch
ina
----
----
----
----
----
--7
7.1
7%
78
.38
%7
7.7
2%
72
.53
%7
3.6
3%
71
.19
%6
9.8
7%
69
.29
%6
5.1
2%
64
.91
%6
4.7
9%
61
.78
%5
7.5
9%
49
.89
%
Co
lom
bia
5.0
9%
5.1
1%
5.4
4%
4.3
2%
5.0
6%
5.3
8%
5.4
6%
5.3
4%
5.3
3%
4.3
2%
5.8
2%
5.0
6%
4.0
5%
4.4
3%
4.4
7%
4.0
3%
1.8
6%
----
--4
.34
%4
.17
%4
.63
%3
.99
%4
.09
%
Co
mo
ros
----
----
----
----
----
----
----
----
----
--1
2.2
7%
8.3
8%
4.1
8%
4.6
1%
11
.29
%3
.27
%
Co
ngo
20
.02
%2
0.0
3%
22
.00
%2
1.6
8%
23
.59
%2
1.3
1%
23
.37
%2
2.9
7%
18
.76
%1
7.2
5%
17
.58
%1
4.7
6%
14
.46
%1
3.2
7%
13
.28
%1
3.4
5%
14
.04
%1
4.6
0%
14
.55
%1
3.1
2%
10
.72
%1
0.2
6%
9.3
2%
9.0
8%
9.6
2%
Co
sta
Ric
a--
----
----
----
1.8
5%
1.7
9%
1.8
0%
4.9
9%
1.5
9%
----
----
----
----
----
----
--
Cô
te d
Ivo
ire
6.6
3%
10
.88
%4
.85
%1
.89
%7
.17
%5
.01
%6
.55
%1
.52
%3
.56
%2
.74
%4
.80
%5
.74
%4
.20
%--
----
----
----
----
----
--
Cro
atia
----
----
----
----
----
----
----
----
----
----
----
----
--
Cu
ba
----
----
----
----
----
----
----
----
----
----
----
----
--
Cyp
rus
----
----
----
----
----
----
----
14
.40
%1
1.2
8%
8.5
8%
9.4
1%
8.9
5%
9.3
5%
9.6
7%
8.3
1%
9.6
2%
8.2
3%
8.3
2%

86 Ta
ble
7. P
CE
Rat
ios
FAO
-Cle
an D
atas
et (
Co
nt.
)
Co
un
try
19
86
19
87
19
88
19
89
19
90
19
91
19
92
19
93
19
94
19
95
19
96
19
97
19
98
19
99
20
00
20
01
20
02
20
03
20
04
20
05
20
06
20
07
20
08
20
09
20
10
20
11
Afg
han
ista
n--
----
----
----
----
----
----
----
--1
7.1
5%
17
.82
%1
6.7
1%
18
.42
%1
7.3
3%
15
.87
%2
0.9
2%
14
.25
%1
3.0
1%
15
.47
%
Alb
ania
15
.95
%1
5.4
9%
16
.31
%1
6.4
6%
19
.09
%2
5.4
6%
33
.53
%3
4.6
4%
30
.70
%2
8.7
4%
28
.84
%2
7.8
5%
26
.35
%2
5.2
1%
22
.92
%2
1.9
3%
22
.12
%2
2.1
8%
22
.51
%2
0.9
6%
21
.09
%2
1.0
9%
20
.94
%2
0.0
7%
20
.50
%2
0.9
2%
Alg
eria
11
.48
%1
1.6
8%
11
.44
%1
4.1
1%
11
.94
%1
2.8
0%
13
.24
%1
3.1
5%
14
.49
%1
4.0
3%
14
.12
%1
2.4
7%
12
.87
%1
2.3
2%
11
.82
%1
1.8
2%
11
.77
%1
2.1
9%
13
.06
%1
2.4
6%
12
.60
%1
2.5
6%
14
.51
%1
4.4
8%
14
.31
%1
7.4
6%
An
gola
4.3
0%
4.8
6%
4.9
4%
5.3
9%
5.4
2%
5.1
1%
5.8
7%
6.7
3%
6.7
9%
6.4
3%
6.3
1%
5.9
5%
5.8
0%
4.9
3%
5.0
7%
5.4
0%
5.8
6%
6.2
0%
6.4
3%
6.1
5%
5.5
5%
5.0
9%
5.8
1%
5.5
5%
5.6
5%
6.7
7%
An
tigu
a an
d B
arb
ud
a9
.74
%9
.30
%9
.41
%8
.71
%8
.78
%7
.80
%8
.16
%7
.20
%6
.61
%6
.87
%6
.35
%6
.47
%5
.83
%5
.07
%4
.96
%4
.56
%4
.66
%4
.38
%4
.18
%8
.06
%5
.00
%5
.30
%5
.81
%6
.74
%7
.10
%9
.28
%
Arg
enti
na
8.8
1%
8.7
2%
8.2
2%
7.6
4%
8.5
7%
8.4
2%
7.4
7%
7.2
9%
7.8
2%
7.4
4%
7.0
7%
5.4
1%
6.4
6%
7.9
4%
7.6
5%
8.3
8%
8.7
6%
8.2
5%
6.8
9%
7.1
6%
6.2
6%
5.3
7%
2.6
9%
2.5
0%
3.7
9%
1.3
0%
Arm
enia
----
----
----
40
.03
%3
6.0
1%
38
.53
%3
9.4
1%
41
.28
%3
4.2
7%
32
.91
%3
0.4
1%
27
.64
%2
6.7
4%
23
.12
%2
0.9
9%
22
.40
%2
1.5
3%
19
.13
%2
0.5
1%
20
.74
%2
2.7
6%
21
.07
%2
2.7
2%
Au
stra
lia2
.08
%2
.24
%2
.21
%1
.90
%1
.76
%1
.90
%2
.30
%2
.20
%1
.65
%2
.15
%1
.71
%1
.67
%2
.19
%2
.36
%2
.14
%2
.33
%1
.73
%2
.38
%1
.52
%1
.99
%1
.33
%1
.79
%1
.61
%1
.77
%1
.44
%1
.44
%
Au
stri
a3
.41
%3
.42
%3
.38
%3
.12
%3
.13
%3
.07
%3
.00
%2
.93
%3
.01
%2
.99
%2
.79
%2
.78
%2
.65
%2
.61
%2
.32
%2
.33
%2
.20
%2
.23
%2
.27
%2
.19
%2
.03
%2
.09
%2
.01
%2
.12
%2
.05
%2
.20
%
Aze
rbai
jan
----
----
----
15
.39
%1
6.2
3%
18
.20
%2
1.7
2%
24
.92
%2
0.2
2%
19
.54
%1
9.1
4%
18
.93
%1
9.0
0%
18
.05
%1
7.3
5%
16
.43
%1
3.0
8%
10
.34
%8
.89
%8
.93
%8
.13
%8
.16
%8
.49
%
Bah
amas
5.2
1%
5.3
6%
5.2
3%
4.8
4%
4.5
2%
5.0
2%
4.5
0%
4.1
6%
4.3
0%
4.5
9%
4.7
3%
4.4
0%
4.2
2%
4.1
5%
5.2
5%
4.4
6%
3.1
0%
2.5
8%
2.9
5%
4.3
3%
4.6
0%
4.7
4%
5.0
4%
5.2
4%
4.2
1%
4.1
2%
Bah
rain
5.1
4%
4.8
1%
4.4
9%
4.5
4%
4.4
0%
3.6
6%
3.9
2%
3.6
4%
3.5
3%
3.2
5%
2.8
2%
3.2
8%
1.8
9%
1.7
7%
2.9
7%
3.5
3%
3.4
5%
2.9
2%
2.7
2%
2.9
7%
2.1
2%
2.3
1%
2.6
9%
2.4
5%
3.1
5%
3.3
1%
Ban
glad
esh
20
.33
%2
0.1
3%
21
.03
%2
1.4
8%
20
.20
%1
9.5
6%
18
.87
%1
7.9
5%
16
.49
%1
7.4
4%
17
.34
%1
6.5
1%
16
.57
%1
9.3
7%
17
.70
%1
6.3
5%
16
.28
%1
6.4
8%
15
.57
%1
5.9
9%
15
.28
%1
5.8
0%
16
.16
%1
6.0
8%
16
.77
%1
6.8
1%
Bar
bad
os
5.8
4%
5.9
3%
5.7
3%
6.2
9%
5.9
3%
6.2
8%
5.5
0%
5.6
3%
5.5
7%
6.0
5%
5.1
5%
5.3
7%
3.7
8%
5.4
8%
4.5
8%
5.4
3%
5.3
7%
5.9
9%
5.1
0%
6.1
1%
5.7
4%
5.8
9%
6.3
2%
6.1
6%
6.6
8%
6.9
5%
Bel
aru
s--
----
----
--2
5.2
8%
26
.59
%2
4.6
6%
27
.33
%2
7.8
5%
23
.63
%2
0.9
6%
19
.42
%1
9.7
8%
17
.90
%1
7.4
5%
16
.68
%1
6.7
7%
14
.88
%1
4.6
7%
13
.67
%1
3.8
5%
12
.84
%1
1.1
1%
9.6
3%
Bel
giu
m--
----
----
----
----
----
----
--1
.53
%1
.38
%1
.44
%1
.40
%1
.18
%--
----
----
----
Bel
ize
8.1
4%
7.7
2%
6.7
9%
2.9
3%
2.4
7%
4.1
8%
7.0
1%
8.9
2%
6.1
6%
4.6
1%
5.4
4%
6.1
9%
6.5
8%
4.8
5%
6.5
9%
7.6
3%
9.2
2%
8.8
2%
8.3
7%
8.5
0%
7.3
2%
7.9
4%
8.3
4%
7.7
6%
9.3
9%
8.0
1%
Ben
in1
5.5
3%
14
.69
%1
7.1
4%
17
.61
%1
8.8
2%
19
.82
%2
2.3
5%
20
.47
%1
9.3
7%
19
.46
%1
8.8
5%
18
.63
%1
8.6
6%
18
.80
%1
7.4
8%
16
.85
%1
7.8
1%
18
.73
%1
9.0
9%
19
.02
%2
1.0
6%
19
.63
%2
2.4
1%
18
.41
%1
6.3
9%
21
.92
%
Ber
mu
da
3.2
3%
3.0
5%
2.8
1%
2.6
6%
2.5
1%
2.4
0%
2.9
9%
2.7
7%
4.1
9%
2.5
3%
2.3
7%
2.2
1%
2.0
6%
1.6
3%
1.4
8%
1.3
3%
1.3
5%
1.2
9%
1.2
6%
1.2
8%
1.6
5%
1.7
3%
2.0
1%
2.0
0%
1.8
5%
2.0
1%
Bh
uta
n6
8.2
2%
59
.28
%4
5.1
2%
43
.64
%4
5.7
3%
46
.25
%4
3.8
4%
45
.56
%4
4.6
6%
41
.83
%4
3.0
2%
42
.93
%3
9.4
5%
38
.57
%2
4.8
3%
23
.06
%2
0.0
5%
21
.26
%2
4.4
4%
27
.70
%2
5.8
4%
22
.13
%1
9.8
5%
18
.00
%1
8.9
5%
19
.08
%
Bo
livia
16
.31
%1
7.7
2%
16
.31
%1
5.5
2%
13
.43
%1
5.6
3%
15
.10
%1
5.3
8%
14
.65
%1
6.3
0%
14
.94
%1
3.9
2%
13
.86
%1
4.2
0%
14
.80
%1
4.1
7%
14
.24
%1
4.8
0%
12
.41
%1
3.9
2%
13
.47
%1
3.4
8%
13
.05
%1
3.0
8%
12
.49
%1
2.9
4%
Bo
snia
an
d H
erze
govi
na
----
----
----
----
48
.83
%4
0.3
1%
23
.97
%2
1.2
3%
17
.86
%1
4.8
4%
12
.71
%1
4.2
2%
14
.52
%1
3.1
0%
16
.53
%1
7.1
2%
15
.79
%1
5.5
3%
17
.03
%1
6.3
0%
15
.32
%1
6.3
7%
Bo
tsw
ana
1.4
2%
2.9
3%
3.4
6%
2.2
9%
3.4
9%
3.5
6%
4.2
9%
3.7
6%
3.4
8%
4.2
8%
4.2
3%
3.6
2%
3.3
3%
3.2
9%
3.3
5%
2.9
4%
2.7
5%
2.9
9%
2.1
0%
1.9
8%
2.1
8%
2.3
5%
2.8
0%
3.0
2%
2.7
2%
3.5
6%
Bra
zil
3.9
9%
4.0
4%
4.1
9%
4.5
6%
4.6
1%
4.9
8%
5.2
3%
5.1
1%
5.1
6%
5.4
3%
5.0
3%
5.1
4%
5.3
0%
5.5
9%
5.7
6%
5.7
1%
5.9
4%
6.3
1%
5.6
7%
5.2
5%
5.0
8%
4.8
7%
4.7
1%
4.7
8%
4.2
1%
3.7
5%
Bru
nei
Dar
uss
alam
1.9
8%
2.3
0%
2.4
8%
2.2
8%
2.3
0%
2.2
6%
2.2
6%
2.2
8%
2.5
9%
2.4
3%
2.4
1%
2.8
2%
2.7
4%
2.0
6%
2.0
4%
2.0
2%
2.3
1%
2.4
3%
2.1
5%
2.1
8%
2.0
9%
1.8
8%
2.4
8%
2.4
8%
2.6
6%
2.8
4%
Bu
lgar
ia2
0.5
2%
18
.65
%1
7.1
7%
18
.99
%1
7.3
7%
19
.37
%1
7.6
2%
15
.76
%1
4.8
5%
15
.14
%1
4.3
8%
16
.34
%1
5.1
9%
15
.31
%1
3.8
6%
13
.08
%1
0.4
3%
8.4
5%
9.8
7%
7.6
5%
7.7
6%
6.6
9%
7.6
2%
7.7
8%
7.2
1%
7.2
0%
Bu
rkin
a Fa
so3
6.9
5%
34
.76
%3
8.8
7%
36
.67
%3
5.3
0%
41
.19
%4
1.2
3%
40
.83
%3
9.7
6%
38
.76
%3
9.7
3%
32
.98
%3
4.5
6%
34
.32
%2
8.7
8%
32
.76
%3
1.1
5%
32
.29
%2
7.4
5%
29
.84
%2
8.8
4%
24
.00
%2
9.2
5%
26
.26
%2
8.0
8%
23
.99
%
Bu
run
di
----
----
----
----
----
----
----
----
----
----
----
----
----
Cab
o V
erd
e6
6.2
7%
--7
9.6
7%
77
.82
%7
4.2
1%
67
.60
%7
4.1
1%
63
.79
%5
0.7
3%
52
.17
%4
3.8
5%
41
.42
%3
8.4
0%
37
.87
%3
0.3
1%
32
.06
%2
9.2
8%
31
.68
%3
0.4
5%
29
.76
%2
9.5
1%
28
.56
%2
9.4
8%
28
.77
%2
8.0
8%
28
.71
%
Cam
bo
dia
----
----
----
--4
7.9
2%
43
.22
%4
7.0
4%
45
.77
%4
4.3
7%
42
.92
%4
2.7
1%
39
.55
%3
6.9
7%
34
.29
%3
5.9
2%
33
.10
%3
6.8
2%
40
.81
%3
7.7
5%
41
.22
%4
3.1
1%
43
.57
%4
9.1
2%
Cam
ero
on
11
.02
%1
1.0
9%
12
.69
%1
3.6
4%
16
.02
%1
7.8
5%
20
.03
%2
1.7
1%
21
.59
%2
0.9
3%
20
.49
%2
0.3
9%
21
.91
%2
1.6
6%
22
.10
%2
1.8
6%
21
.57
%2
1.1
4%
21
.71
%2
4.8
5%
27
.08
%2
9.0
1%
29
.34
%3
0.1
6%
29
.95
%3
1.7
4%
Can
ada
2.6
3%
2.4
2%
1.9
7%
2.3
5%
2.4
0%
2.4
1%
2.2
5%
2.5
2%
2.4
6%
2.3
2%
2.1
9%
2.1
8%
2.3
2%
2.3
4%
2.1
0%
1.8
6%
1.8
9%
2.0
2%
1.9
6%
2.0
1%
1.9
3%
1.8
2%
1.7
6%
2.0
2%
1.9
8%
1.9
0%
Cen
tral
Afr
ican
Rep
ub
lic2
0.2
3%
21
.03
%2
2.4
6%
20
.71
%2
5.1
7%
26
.47
%2
8.7
3%
29
.29
%2
8.7
5%
27
.15
%3
2.1
1%
29
.76
%3
1.1
6%
28
.23
%3
2.4
2%
32
.30
%3
1.3
1%
32
.96
%3
3.0
7%
33
.13
%3
1.6
0%
30
.80
%3
0.7
4%
29
.62
%2
7.5
4%
27
.71
%
Ch
ad1
1.1
3%
11
.29
%1
1.4
0%
10
.72
%1
1.9
9%
12
.30
%1
1.6
9%
12
.39
%1
1.1
9%
12
.62
%1
3.5
1%
12
.83
%1
4.7
4%
13
.47
%1
2.7
2%
13
.69
%1
2.6
0%
12
.18
%8
.70
%8
.42
%8
.26
%7
.75
%8
.36
%8
.35
%7
.77
%7
.34
%
Ch
ile4
.54
%4
.76
%4
.74
%4
.37
%4
.25
%4
.16
%3
.90
%4
.05
%4
.06
%3
.71
%3
.49
%3
.63
%3
.46
%3
.35
%3
.49
%3
.28
%2
.99
%3
.16
%2
.99
%2
.91
%3
.04
%2
.68
%2
.67
%2
.05
%2
.14
%2
.16
%
Ch
ina
47
.44
%4
4.8
8%
41
.28
%4
1.0
7%
42
.87
%4
0.1
6%
36
.81
%3
4.5
0%
32
.16
%3
1.8
0%
30
.89
%2
8.6
0%
28
.09
%2
6.9
4%
25
.52
%2
4.0
2%
22
.90
%2
1.0
5%
20
.50
%1
8.9
5%
17
.29
%1
5.7
5%
15
.36
%1
4.4
1%
13
.43
%1
2.7
1%
Co
lom
bia
1.5
6%
4.3
7%
4.7
7%
5.2
2%
5.4
8%
5.3
3%
5.3
7%
5.8
3%
5.0
1%
5.5
0%
5.9
2%
5.0
7%
5.1
8%
6.1
2%
6.2
2%
6.7
5%
6.7
2%
6.7
6%
6.5
2%
5.8
0%
5.9
1%
5.8
8%
6.0
6%
5.6
0%
5.5
4%
5.3
7%
Co
mo
ros
3.9
9%
7.7
3%
6.2
3%
9.1
9%
10
.30
%7
.79
%9
.71
%7
.58
%1
2.9
9%
15
.63
%1
5.2
4%
14
.82
%1
4.6
0%
14
.63
%1
0.7
3%
10
.38
%1
2.1
4%
7.4
9%
8.7
4%
13
.61
%1
3.3
4%
16
.14
%1
7.6
7%
16
.74
%1
9.7
9%
15
.26
%
Co
ngo
10
.23
%9
.78
%1
0.7
2%
10
.17
%9
.84
%1
0.6
1%
11
.19
%1
1.2
5%
10
.82
%1
1.5
3%
11
.78
%1
1.0
7%
11
.43
%1
1.2
9%
11
.27
%1
0.7
1%
10
.95
%1
1.7
3%
12
.55
%1
0.7
4%
11
.18
%1
1.8
2%
11
.71
%1
2.4
3%
10
.83
%1
3.8
2%
Co
sta
Ric
a--
--1
.93
%4
.71
%6
.18
%5
.29
%6
.03
%5
.67
%4
.36
%1
.47
%3
.04
%2
.81
%2
.55
%4
.45
%5
.22
%6
.46
%6
.36
%5
.66
%5
.38
%5
.27
%6
.55
%5
.25
%4
.77
%4
.82
%4
.76
%5
.65
%
Cô
te d
Ivo
ire
--1
.08
%6
.73
%6
.12
%1
0.5
3%
11
.61
%1
3.6
0%
12
.84
%1
3.1
3%
10
.07
%7
.92
%8
.54
%7
.77
%8
.86
%1
3.2
1%
11
.82
%6
.85
%7
.03
%9
.82
%1
1.0
5%
12
.64
%1
1.1
4%
10
.17
%4
.72
%4
.65
%5
.50
%
Cro
atia
----
----
----
----
--7
.60
%7
.22
%6
.75
%6
.27
%6
.82
%5
.83
%6
.35
%6
.39
%5
.26
%5
.89
%4
.92
%5
.07
%5
.15
%5
.80
%5
.79
%5
.40
%5
.82
%
Cu
ba
----
----
----
--1
.95
%1
.78
%2
.14
%1
.66
%1
.99
%2
.77
%3
.64
%3
.61
%3
.10
%3
.63
%4
.19
%4
.33
%4
.64
%3
.60
%4
.17
%5
.19
%4
.02
%3
.58
%3
.96
%
Cyp
rus
7.5
4%
7.1
6%
7.7
5%
7.5
9%
6.6
6%
6.4
4%
7.0
6%
7.2
2%
6.6
6%
6.8
3%
7.3
1%
6.9
3%
6.7
8%
6.7
3%
6.4
5%
6.2
2%
6.3
4%
6.1
3%
6.3
3%
6.1
1%
5.8
9%
6.2
1%
6.6
7%
6.0
4%
6.0
3%
6.1
8%
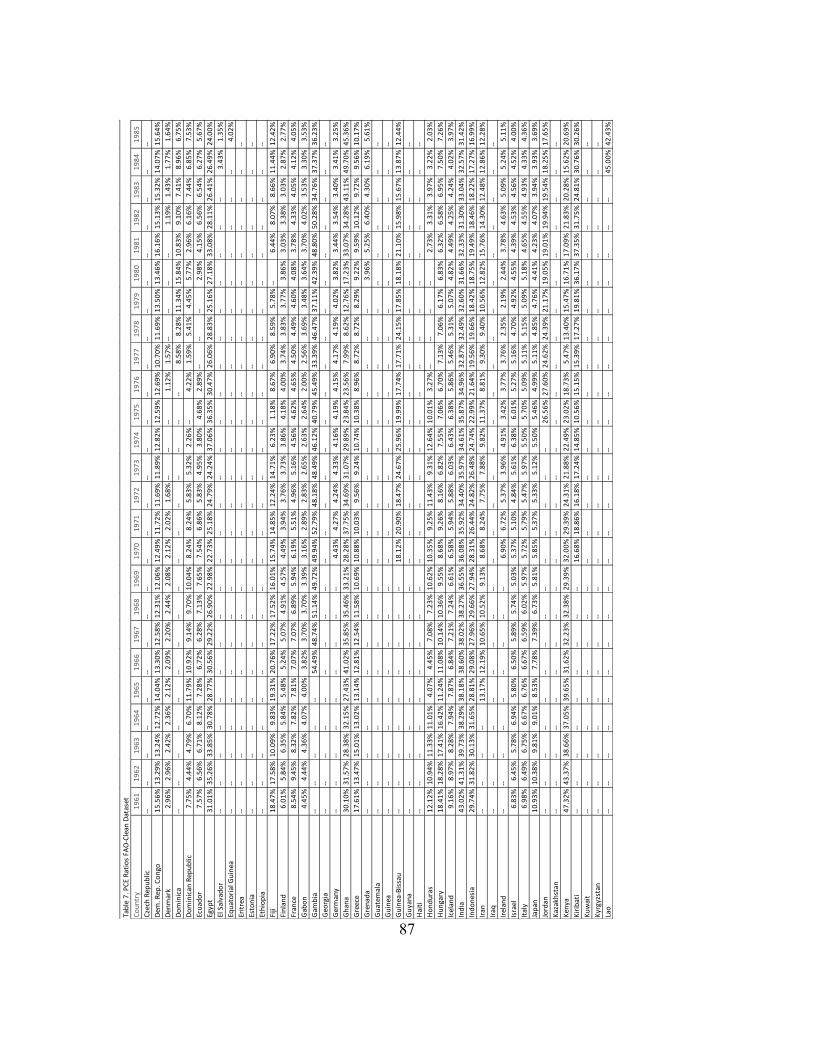
87 Ta
ble
7. P
CE
Rat
ios
FAO
-Cle
an D
atas
et
Co
un
try
19
61
19
62
19
63
19
64
19
65
19
66
19
67
19
68
19
69
19
70
19
71
19
72
19
73
19
74
19
75
19
76
19
77
19
78
19
79
19
80
19
81
19
82
19
83
19
84
19
85
Cze
ch R
epu
blic
----
----
----
----
----
----
----
----
----
----
----
----
--
Dem
. Rep
. Co
ngo
15
.56
%1
3.2
9%
13
.24
%1
2.7
2%
14
.04
%1
3.3
0%
12
.58
%1
2.3
1%
12
.06
%1
2.4
9%
11
.72
%1
1.6
9%
11
.89
%1
2.8
2%
12
.59
%1
2.6
9%
10
.70
%1
1.6
9%
13
.50
%1
3.4
6%
16
.16
%1
5.1
3%
15
.32
%1
4.0
7%
15
.64
%
Den
mar
k2
.96
%2
.96
%2
.42
%2
.36
%2
.12
%2
.09
%2
.20
%2
.44
%2
.08
%2
.12
%2
.02
%1
.68
%--
----
1.1
2%
1.5
7%
----
----
1.1
9%
1.4
3%
1.7
7%
1.6
4%
Do
min
ica
----
----
----
----
----
----
----
----
8.5
8%
8.2
8%
11
.34
%1
5.8
4%
10
.83
%9
.10
%7
.41
%8
.96
%6
.75
%
Do
min
ican
Rep
ub
lic7
.75
%4
.44
%4
.79
%6
.70
%1
1.7
9%
10
.92
%9
.14
%9
.70
%1
0.0
4%
8.2
4%
8.2
4%
5.8
3%
5.3
2%
2.2
6%
--4
.22
%1
.59
%5
.41
%4
.45
%5
.77
%2
.96
%6
.16
%7
.44
%6
.85
%7
.53
%
Ecu
ado
r7
.57
%6
.56
%6
.71
%8
.12
%7
.28
%6
.72
%6
.28
%7
.13
%7
.65
%7
.54
%6
.86
%5
.83
%4
.95
%3
.80
%4
.68
%2
.89
%--
----
2.9
8%
4.1
5%
6.5
6%
6.5
4%
6.2
7%
5.6
7%
Egyp
t3
1.0
1%
35
.26
%3
3.8
5%
30
.78
%2
8.7
7%
30
.56
%2
9.2
2%
26
.90
%2
2.9
8%
22
.73
%2
5.1
8%
24
.79
%2
4.2
4%
37
.06
%3
6.3
5%
30
.47
%2
6.0
6%
28
.83
%2
5.1
6%
27
.18
%3
3.0
8%
28
.11
%2
6.4
1%
26
.49
%2
4.0
0%
El S
alva
do
r--
----
----
----
----
----
----
----
----
----
----
----
3.4
3%
1.3
5%
Equ
ato
rial
Gu
inea
----
----
----
----
----
----
----
----
----
----
----
----
4.0
2%
Erit
rea
----
----
----
----
----
----
----
----
----
----
----
----
--
Esto
nia
----
----
----
----
----
----
----
----
----
----
----
----
--
Eth
iop
ia--
----
----
----
----
----
----
----
----
----
----
----
----
Fiji
18
.47
%1
7.5
8%
10
.09
%9
.83
%1
9.3
1%
20
.76
%1
7.2
2%
17
.52
%1
6.0
1%
15
.74
%1
4.8
5%
12
.24
%1
4.7
1%
6.2
3%
1.1
8%
8.6
7%
6.9
0%
8.5
9%
5.7
8%
--6
.44
%8
.07
%8
.66
%1
1.4
4%
12
.42
%
Fin
lan
d6
.01
%5
.84
%6
.35
%5
.84
%5
.48
%5
.24
%5
.07
%4
.91
%4
.57
%4
.49
%3
.94
%3
.76
%3
.73
%3
.86
%4
.18
%4
.00
%3
.74
%3
.83
%3
.77
%3
.86
%3
.03
%3
.38
%3
.03
%2
.87
%2
.77
%
Fran
ce8
.54
%9
.45
%8
.32
%7
.82
%7
.81
%7
.07
%7
.07
%6
.89
%5
.94
%6
.19
%5
.51
%4
.96
%5
.16
%4
.56
%4
.62
%4
.65
%4
.50
%4
.49
%4
.60
%4
.08
%3
.78
%4
.33
%4
.05
%4
.12
%4
.05
%
Gab
on
4.4
5%
4.4
4%
4.3
6%
4.0
7%
4.0
0%
3.8
2%
3.7
0%
3.7
0%
3.3
9%
3.1
6%
2.8
9%
2.8
3%
2.6
5%
2.6
3%
2.6
4%
2.0
0%
2.5
6%
3.6
9%
3.4
8%
3.6
4%
3.7
0%
4.0
2%
3.5
3%
3.3
0%
3.5
3%
Gam
bia
----
----
--5
4.4
9%
48
.74
%5
1.1
4%
49
.72
%4
9.9
4%
52
.79
%4
8.1
8%
48
.49
%4
6.1
2%
40
.79
%4
5.4
9%
33
.39
%4
6.4
7%
37
.11
%4
2.3
9%
48
.80
%5
0.2
8%
34
.76
%3
7.3
7%
36
.23
%
Geo
rgia
----
----
----
----
----
----
----
----
----
----
----
----
--
Ger
man
y--
----
----
----
----
4.4
3%
4.2
7%
4.2
4%
4.3
3%
4.1
6%
4.1
9%
4.1
5%
4.1
7%
4.1
9%
4.0
2%
3.8
2%
3.4
4%
3.5
4%
3.4
0%
3.4
1%
3.2
5%
Gh
ana
30
.10
%3
1.5
7%
28
.38
%3
2.1
5%
27
.43
%4
1.0
2%
35
.85
%3
5.4
6%
33
.21
%2
8.2
8%
37
.75
%3
4.6
9%
31
.07
%2
9.8
9%
23
.84
%2
3.5
6%
7.9
9%
8.6
2%
12
.76
%1
7.2
3%
33
.07
%3
4.2
8%
43
.11
%4
9.7
0%
45
.36
%
Gre
ece
17
.61
%1
3.4
7%
15
.01
%1
3.0
2%
13
.14
%1
2.8
1%
12
.54
%1
1.5
8%
10
.69
%1
0.8
8%
10
.03
%9
.56
%9
.24
%1
0.7
4%
10
.38
%8
.96
%8
.72
%8
.72
%8
.29
%9
.22
%9
.59
%1
0.1
2%
9.7
2%
9.5
6%
10
.17
%
Gre
nad
a--
----
----
----
----
----
----
----
----
----
3.9
6%
5.2
5%
6.4
0%
4.3
0%
6.1
9%
5.6
1%
Gu
atem
ala
----
----
----
----
----
----
----
----
----
----
----
----
--
Gu
inea
----
----
----
----
----
----
----
----
----
----
----
----
--
Gu
inea
-Bis
sau
----
----
----
----
--1
8.1
2%
20
.90
%1
8.4
7%
24
.67
%2
5.9
6%
19
.99
%1
7.7
4%
17
.71
%2
4.1
5%
17
.85
%1
8.1
8%
21
.10
%1
5.9
8%
15
.67
%1
3.8
7%
12
.44
%
Gu
yan
a--
----
----
----
----
----
----
----
----
----
----
----
----
Hai
ti--
----
----
----
----
----
----
----
----
----
----
----
----
Ho
nd
ura
s1
2.1
2%
10
.94
%1
1.3
3%
11
.01
%4
.07
%4
.45
%7
.08
%7
.23
%1
0.6
2%
10
.35
%9
.25
%1
1.4
3%
9.3
1%
12
.64
%1
0.0
1%
3.2
7%
----
----
2.7
3%
3.3
1%
3.9
7%
3.2
2%
2.0
3%
Hu
nga
ry1
8.4
1%
18
.28
%1
7.4
1%
16
.42
%1
1.2
4%
11
.08
%1
0.1
4%
10
.36
%9
.55
%8
.68
%9
.26
%8
.16
%6
.82
%7
.55
%7
.06
%6
.70
%7
.13
%7
.06
%6
.17
%6
.83
%6
.32
%6
.58
%6
.95
%7
.50
%7
.26
%
Icel
and
9.1
6%
8.9
7%
8.2
8%
7.9
4%
7.8
7%
6.8
4%
7.2
1%
7.2
4%
6.6
1%
6.5
8%
5.9
4%
5.8
8%
6.0
3%
6.4
3%
6.3
8%
5.8
6%
5.4
6%
5.3
1%
5.0
7%
4.8
2%
4.4
9%
4.2
5%
4.2
4%
4.0
2%
3.9
7%
Ind
ia4
3.0
2%
41
.31
%3
9.7
3%
38
.29
%3
8.1
8%
38
.60
%3
8.0
2%
38
.27
%3
6.5
5%
36
.08
%3
5.9
2%
34
.40
%3
5.9
7%
34
.61
%3
5.8
7%
34
.96
%3
2.8
7%
32
.49
%3
2.6
0%
31
.66
%3
2.3
3%
31
.30
%3
3.0
4%
32
.57
%3
1.4
2%
Ind
on
esia
29
.74
%3
1.8
2%
30
.13
%3
1.6
5%
28
.81
%2
9.0
8%
27
.96
%2
9.6
6%
27
.94
%2
8.3
1%
26
.44
%2
4.8
2%
26
.48
%2
4.7
4%
22
.99
%2
1.6
4%
19
.56
%1
9.6
6%
18
.42
%1
8.7
5%
19
.49
%1
8.4
6%
18
.22
%1
7.2
7%
16
.99
%
Iran
----
----
13
.17
%1
2.1
9%
10
.65
%1
0.5
2%
9.1
3%
8.6
8%
8.2
4%
7.7
5%
7.8
8%
9.8
2%
11
.37
%8
.81
%9
.30
%9
.40
%1
0.5
6%
12
.82
%1
5.7
6%
14
.30
%1
2.4
8%
12
.86
%1
2.2
8%
Iraq
----
----
----
----
----
----
----
----
----
----
----
----
--
Irel
and
----
----
----
----
--6
.90
%6
.72
%5
.37
%3
.96
%4
.91
%3
.42
%3
.77
%3
.76
%2
.35
%2
.19
%2
.44
%3
.78
%4
.63
%5
.09
%5
.24
%5
.11
%
Isra
el6
.83
%6
.45
%5
.78
%6
.94
%5
.80
%6
.50
%5
.89
%5
.74
%5
.03
%5
.37
%5
.10
%4
.84
%5
.61
%6
.38
%6
.01
%5
.27
%5
.16
%4
.70
%4
.92
%4
.55
%4
.39
%4
.53
%4
.56
%4
.52
%4
.00
%
Ital
y6
.98
%6
.49
%6
.75
%6
.67
%6
.76
%6
.67
%6
.59
%6
.02
%5
.97
%5
.72
%5
.79
%5
.47
%5
.97
%5
.50
%5
.70
%5
.09
%5
.11
%5
.15
%5
.09
%5
.18
%4
.65
%4
.55
%4
.93
%4
.33
%4
.36
%
Jap
an1
0.9
3%
10
.38
%9
.81
%9
.01
%8
.53
%7
.78
%7
.39
%6
.73
%5
.81
%5
.85
%5
.37
%5
.33
%5
.12
%5
.50
%5
.46
%4
.99
%5
.11
%4
.85
%4
.76
%4
.41
%4
.23
%4
.07
%3
.94
%3
.93
%3
.69
%
Jord
an--
----
----
----
----
----
----
--2
6.5
6%
27
.60
%2
4.6
2%
24
.39
%2
1.1
7%
19
.05
%1
9.0
1%
19
.94
%1
9.5
4%
18
.25
%1
7.6
5%
Kaz
akh
stan
----
----
----
----
----
----
----
----
----
----
----
----
--
Ken
ya4
7.3
2%
43
.37
%3
8.6
6%
37
.05
%3
9.6
5%
31
.62
%3
2.2
3%
32
.38
%2
9.3
9%
32
.00
%2
9.3
9%
24
.31
%2
1.8
8%
22
.49
%2
3.0
2%
18
.73
%5
.47
%1
3.4
0%
15
.47
%1
6.7
1%
17
.09
%2
1.8
3%
20
.28
%1
5.6
2%
20
.69
%
Kir
ibat
i--
----
----
----
----
16
.68
%1
8.8
6%
16
.18
%1
7.2
4%
14
.85
%1
0.5
6%
15
.15
%1
5.3
9%
17
.27
%1
9.8
1%
36
.17
%3
7.3
5%
31
.75
%2
4.8
1%
30
.76
%3
0.2
6%
Ku
wai
t--
----
----
----
----
----
----
----
----
----
----
----
----
Kyr
gyzs
tan
----
----
----
----
----
----
----
----
----
----
----
----
--
Lao
----
----
----
----
----
----
----
----
----
----
----
--4
5.0
0%
42
.43
%

88 Ta
ble
7. P
CE
Rat
ios
FAO
-Cle
an D
atas
et (
Co
nt.
)
Co
un
try
19
86
19
87
19
88
19
89
19
90
19
91
19
92
19
93
19
94
19
95
19
96
19
97
19
98
19
99
20
00
20
01
20
02
20
03
20
04
20
05
20
06
20
07
20
08
20
09
20
10
20
11
Cze
ch R
epu
blic
----
----
----
--6
.34
%5
.72
%5
.62
%5
.83
%5
.57
%5
.51
%5
.44
%4
.85
%4
.86
%4
.73
%4
.23
%4
.71
%4
.17
%3
.83
%3
.88
%3
.95
%4
.08
%3
.86
%3
.85
%
Dem
. Rep
. Co
ngo
12
.96
%1
5.2
3%
16
.10
%1
6.6
1%
19
.14
%2
1.5
1%
25
.00
%2
9.2
7%
30
.45
%2
6.1
2%
26
.30
%2
7.5
0%
27
.30
%2
8.1
5%
30
.36
%3
0.7
2%
30
.18
%2
9.4
3%
29
.04
%2
7.1
0%
27
.89
%2
5.5
9%
24
.91
%2
5.7
0%
23
.72
%2
3.8
2%
Den
mar
k1
.34
%--
----
----
----
----
----
--1
.13
%1
.17
%1
.07
%1
.17
%1
.08
%--
----
----
--1
.06
%1
.03
%
Do
min
ica
1.4
0%
----
5.0
3%
3.2
7%
2.4
4%
2.0
9%
3.1
4%
4.7
4%
6.7
0%
8.4
8%
7.4
6%
6.0
7%
5.3
5%
7.7
9%
7.7
1%
8.1
8%
8.5
3%
8.1
6%
8.4
8%
7.8
4%
9.6
6%
9.2
3%
9.3
2%
9.3
0%
8.8
3%
Do
min
ican
Rep
ub
lic7
.46
%8
.57
%8
.27
%8
.85
%8
.23
%8
.70
%8
.90
%8
.45
%7
.65
%8
.13
%7
.84
%7
.45
%6
.89
%7
.05
%6
.84
%7
.44
%7
.45
%6
.90
%6
.85
%6
.96
%6
.94
%6
.80
%6
.73
%6
.39
%6
.12
%6
.28
%
Ecu
ado
r4
.52
%5
.70
%6
.45
%6
.82
%6
.70
%5
.93
%7
.05
%7
.69
%6
.63
%6
.93
%7
.37
%7
.83
%7
.91
%8
.52
%9
.89
%9
.71
%9
.25
%8
.57
%9
.07
%8
.33
%8
.33
%8
.74
%8
.53
%7
.38
%8
.17
%7
.44
%
Egyp
t2
2.9
4%
20
.76
%2
1.5
4%
20
.66
%2
2.4
9%
21
.11
%2
0.9
4%
20
.39
%2
0.8
1%
21
.79
%2
2.6
0%
21
.92
%2
1.2
2%
21
.05
%2
0.3
3%
18
.81
%1
9.6
0%
18
.98
%1
8.1
5%
18
.84
%1
9.0
6%
19
.51
%1
9.5
8%
17
.29
%1
7.7
8%
18
.74
%
El S
alva
do
r--
3.2
8%
3.6
0%
6.6
0%
5.8
0%
7.4
1%
8.1
7%
6.6
1%
6.0
6%
5.2
2%
6.3
6%
4.9
3%
5.9
3%
6.5
0%
7.0
8%
8.0
1%
8.3
7%
8.4
4%
8.8
6%
8.4
8%
8.8
2%
8.8
6%
9.6
9%
9.3
7%
8.6
7%
7.9
0%
Equ
ato
rial
Gu
inea
5.5
7%
6.7
7%
7.9
6%
8.6
3%
11
.13
%1
1.9
3%
10
.83
%1
0.9
1%
8.3
4%
8.3
6%
6.0
7%
4.0
1%
2.8
2%
2.3
5%
1.9
0%
1.2
8%
1.2
0%
1.1
5%
----
----
1.0
3%
1.0
8%
1.1
2%
1.3
7%
Erit
rea
----
----
----
--5
3.6
4%
61
.89
%5
1.1
6%
49
.42
%4
6.4
8%
63
.17
%5
1.2
8%
48
.20
%4
7.4
4%
37
.24
%4
8.2
1%
50
.82
%5
9.0
4%
54
.69
%6
2.9
1%
50
.75
%5
6.6
4%
54
.79
%5
5.8
7%
Esto
nia
----
----
----
--1
0.2
7%
9.9
4%
10
.26
%1
1.9
6%
9.6
8%
9.3
7%
8.1
4%
7.7
2%
7.1
0%
6.3
0%
6.8
1%
6.5
5%
5.6
3%
5.5
6%
5.2
8%
5.5
0%
6.5
8%
5.9
0%
5.4
3%
Eth
iop
ia--
----
----
----
34
.77
%3
4.3
0%
35
.09
%3
7.2
1%
34
.09
%3
2.0
2%
34
.99
%3
5.1
9%
37
.83
%4
0.1
5%
47
.29
%4
0.2
0%
39
.36
%3
6.2
7%
32
.29
%3
4.0
2%
33
.83
%3
2.3
7%
28
.79
%
Fiji
11
.18
%6
.84
%8
.64
%9
.72
%1
1.2
8%
8.5
3%
11
.07
%1
2.3
0%
11
.14
%1
0.2
3%
8.8
8%
12
.24
%1
2.2
6%
10
.84
%1
2.5
4%
11
.77
%1
2.3
1%
12
.17
%1
3.0
2%
13
.22
%1
3.6
4%
14
.62
%1
4.6
5%
14
.16
%1
5.9
6%
16
.66
%
Fin
lan
d2
.95
%2
.71
%2
.76
%2
.69
%2
.61
%2
.59
%2
.57
%2
.43
%2
.48
%2
.43
%2
.48
%2
.40
%2
.22
%2
.25
%2
.08
%1
.97
%2
.03
%2
.07
%2
.01
%2
.08
%1
.93
%1
.97
%2
.12
%2
.41
%2
.20
%2
.30
%
Fran
ce4
.03
%3
.97
%3
.46
%3
.25
%3
.11
%3
.04
%3
.14
%2
.89
%2
.86
%2
.75
%2
.85
%2
.82
%2
.79
%2
.80
%2
.72
%2
.63
%2
.67
%2
.40
%2
.55
%2
.40
%2
.27
%2
.15
%2
.15
%2
.40
%2
.25
%2
.15
%
Gab
on
3.3
2%
4.1
1%
3.7
1%
3.2
5%
2.9
7%
3.2
9%
3.6
4%
3.3
7%
2.7
5%
3.1
6%
3.0
8%
2.8
7%
3.0
1%
3.0
5%
3.1
7%
3.0
8%
2.7
7%
2.4
2%
3.3
2%
3.4
8%
3.5
1%
3.8
4%
4.4
4%
4.5
0%
4.4
6%
4.9
1%
Gam
bia
39
.36
%3
7.8
7%
38
.18
%4
0.1
6%
36
.63
%4
1.7
3%
36
.87
%3
5.8
0%
34
.65
%3
6.3
6%
30
.21
%3
3.3
2%
29
.50
%3
4.2
9%
32
.54
%2
8.6
8%
24
.70
%2
5.6
2%
37
.59
%3
7.6
4%
36
.99
%2
6.4
0%
26
.80
%2
7.0
5%
33
.57
%2
2.1
7%
Geo
rgia
----
----
----
24
.49
%3
2.5
6%
33
.87
%4
4.8
7%
43
.41
%3
9.0
7%
33
.00
%3
2.4
3%
27
.42
%2
7.7
0%
26
.35
%2
6.3
7%
25
.31
%2
4.7
0%
16
.93
%1
8.4
0%
18
.13
%1
4.6
7%
14
.91
%1
6.0
1%
Ger
man
y3
.38
%3
.27
%3
.14
%2
.92
%2
.86
%2
.61
%2
.51
%2
.24
%2
.27
%2
.32
%2
.33
%2
.18
%2
.14
%2
.09
%1
.95
%1
.89
%1
.86
%1
.84
%1
.89
%1
.80
%1
.68
%1
.63
%1
.61
%1
.71
%1
.58
%1
.60
%
Gh
ana
43
.59
%4
4.1
3%
45
.88
%5
0.6
1%
41
.01
%6
1.7
3%
60
.20
%6
2.3
5%
57
.61
%6
2.2
9%
57
.27
%5
8.2
7%
60
.96
%6
3.0
4%
60
.56
%6
1.7
8%
64
.95
%5
9.4
4%
58
.22
%5
9.5
7%
53
.82
%5
0.6
1%
54
.23
%5
5.7
8%
55
.40
%4
3.2
7%
Gre
ece
9.3
2%
9.9
1%
10
.06
%9
.87
%8
.68
%9
.65
%9
.52
%9
.47
%9
.87
%1
0.1
6%
9.7
9%
9.1
7%
8.7
3%
9.1
1%
8.6
0%
8.0
6%
7.9
5%
7.1
8%
7.5
1%
7.4
4%
6.8
6%
6.6
1%
6.8
8%
6.6
7%
6.3
1%
6.9
6%
Gre
nad
a1
.85
%--
1.3
8%
4.1
9%
5.8
8%
6.4
0%
6.5
3%
8.8
8%
8.4
7%
8.6
9%
10
.33
%7
.22
%6
.74
%4
.13
%3
.83
%2
.98
%4
.94
%4
.12
%7
.19
%5
.78
%6
.76
%6
.52
%6
.90
%8
.00
%7
.79
%7
.33
%
Gu
atem
ala
----
----
----
----
----
----
----
--1
.61
%2
.02
%1
.98
%2
.30
%1
.54
%2
.06
%1
.51
%1
.65
%--
----
Gu
inea
52
.21
%5
1.7
1%
51
.34
%5
1.7
4%
51
.81
%5
2.8
0%
54
.90
%5
3.9
4%
55
.38
%5
4.8
9%
53
.39
%5
2.2
0%
49
.13
%4
8.9
2%
49
.32
%4
8.1
4%
48
.71
%5
1.5
5%
52
.15
%5
2.9
9%
53
.70
%5
6.3
7%
55
.30
%5
4.8
5%
57
.29
%5
5.9
8%
Gu
inea
-Bis
sau
13
.92
%1
5.8
9%
15
.33
%1
5.1
7%
12
.71
%1
2.3
0%
17
.04
%1
3.7
0%
9.5
1%
11
.60
%1
0.5
7%
7.2
3%
12
.28
%8
.98
%1
1.5
6%
10
.57
%1
2.1
3%
13
.41
%1
3.5
5%
8.0
6%
15
.54
%1
3.7
3%
8.1
0%
13
.03
%1
8.0
9%
--
Gu
yan
a--
----
----
----
----
----
----
----
----
----
----
----
----
--
Hai
ti--
----
----
----
----
----
--1
4.7
4%
14
.01
%1
3.4
1%
13
.01
%1
4.2
5%
14
.35
%1
5.7
4%
15
.87
%1
7.8
1%
17
.44
%1
9.9
9%
18
.45
%2
3.9
8%
18
.54
%
Ho
nd
ura
s--
2.7
7%
3.5
0%
4.3
2%
5.3
2%
8.1
1%
9.4
4%
10
.88
%1
4.7
1%
11
.56
%1
5.4
3%
14
.90
%1
0.3
0%
15
.25
%1
1.8
0%
13
.70
%1
5.4
6%
16
.64
%1
5.7
2%
16
.12
%1
5.6
8%
15
.15
%1
5.2
8%
15
.09
%1
1.7
0%
8.8
6%
Hu
nga
ry7
.10
%7
.08
%7
.06
%6
.86
%6
.46
%6
.69
%5
.14
%5
.72
%5
.66
%4
.61
%5
.37
%5
.19
%5
.12
%5
.25
%4
.77
%5
.08
%4
.46
%3
.74
%4
.91
%4
.15
%3
.92
%2
.63
%3
.29
%3
.32
%2
.33
%2
.22
%
Icel
and
4.0
6%
3.6
9%
3.5
4%
3.2
8%
3.2
8%
3.5
1%
3.6
8%
3.3
7%
3.3
8%
3.4
6%
3.3
7%
3.2
5%
3.1
9%
2.9
9%
2.8
8%
2.7
8%
2.9
1%
3.0
2%
3.0
1%
2.9
7%
3.0
1%
3.2
1%
3.1
7%
3.0
2%
2.8
5%
3.1
6%
Ind
ia3
0.5
2%
28
.99
%2
9.0
5%
28
.98
%2
7.6
1%
27
.84
%2
7.3
0%
26
.96
%2
6.4
2%
24
.51
%2
3.7
3%
23
.36
%2
2.5
6%
21
.91
%2
0.9
0%
20
.59
%1
8.2
7%
18
.55
%1
6.9
6%
16
.25
%1
5.7
4%
15
.20
%1
4.8
7%
13
.85
%1
3.2
4%
12
.73
%
Ind
on
esia
16
.98
%1
6.6
3%
16
.47
%1
6.3
4%
15
.46
%1
4.6
4%
15
.08
%1
4.1
2%
13
.45
%1
4.8
0%
13
.93
%1
2.3
6%
13
.80
%1
4.3
5%
13
.84
%1
3.6
8%
13
.93
%1
4.3
7%
14
.53
%1
3.8
1%
14
.15
%1
4.0
0%
13
.46
%1
3.5
8%
13
.22
%1
3.6
1%
Iran
13
.35
%1
3.7
5%
14
.35
%1
5.8
0%
14
.92
%1
3.5
2%
13
.91
%1
4.4
3%
14
.01
%1
5.3
2%
14
.51
%1
4.6
6%
13
.84
%1
3.5
0%
12
.46
%1
2.7
7%
12
.62
%1
2.0
3%
11
.75
%1
1.8
3%
11
.39
%1
1.0
3%
10
.74
%1
1.7
3%
10
.48
%1
0.3
8%
Iraq
----
----
----
----
----
----
----
4.8
6%
4.4
6%
4.1
8%
5.4
5%
4.1
2%
5.4
6%
5.2
8%
4.8
7%
7.7
9%
6.6
8%
7.7
6%
7.4
5%
Irel
and
4.6
5%
2.3
7%
1.6
4%
1.3
2%
2.1
8%
2.4
2%
----
----
1.0
6%
2.0
1%
2.1
3%
1.9
9%
1.4
3%
2.1
8%
1.9
0%
1.6
1%
----
--1
.00
%1
.16
%1
.60
%1
.53
%1
.26
%
Isra
el3
.96
%3
.75
%3
.80
%4
.01
%3
.78
%3
.46
%3
.65
%3
.56
%3
.56
%3
.61
%3
.71
%3
.57
%3
.40
%3
.32
%3
.28
%3
.28
%3
.55
%3
.41
%3
.55
%3
.39
%3
.14
%3
.10
%3
.46
%3
.10
%3
.10
%3
.30
%
Ital
y4
.29
%4
.39
%3
.98
%4
.01
%3
.62
%3
.97
%3
.86
%3
.58
%3
.50
%3
.39
%3
.37
%3
.28
%3
.19
%3
.29
%3
.06
%2
.89
%2
.82
%2
.86
%3
.15
%2
.99
%2
.81
%2
.76
%2
.81
%2
.99
%2
.82
%2
.91
%
Jap
an3
.67
%3
.51
%3
.33
%3
.21
%2
.99
%2
.81
%2
.91
%2
.81
%3
.01
%2
.93
%2
.81
%2
.67
%2
.53
%2
.59
%2
.54
%2
.42
%2
.43
%2
.34
%2
.36
%2
.36
%2
.22
%2
.24
%2
.40
%2
.48
%2
.37
%2
.53
%
Jord
an1
5.9
7%
16
.13
%1
6.8
2%
13
.71
%2
2.0
4%
19
.66
%1
8.5
8%
17
.82
%1
6.5
8%
15
.86
%1
5.4
7%
14
.97
%1
4.9
8%
13
.38
%1
3.9
5%
12
.36
%1
2.6
3%
12
.33
%1
3.8
7%
11
.91
%1
1.6
6%
13
.22
%1
4.8
6%
12
.15
%1
2.4
3%
13
.44
%
Kaz
akh
stan
----
----
----
17
.93
%1
6.2
0%
16
.84
%1
3.7
8%
11
.81
%1
1.1
7%
10
.11
%1
2.4
8%
10
.65
%1
1.6
9%
10
.98
%9
.73
%9
.20
%9
.68
%9
.14
%8
.35
%7
.11
%9
.39
%7
.44
%1
0.5
6%
Ken
ya1
9.1
8%
20
.31
%2
0.5
2%
22
.85
%2
1.6
5%
23
.00
%2
5.3
1%
21
.88
%2
4.2
4%
20
.97
%1
7.6
6%
21
.47
%2
0.0
1%
23
.09
%2
2.2
3%
25
.08
%2
4.3
8%
24
.28
%2
3.8
4%
27
.14
%2
6.4
2%
24
.68
%2
4.8
2%
27
.36
%2
5.6
8%
27
.08
%
Kir
ibat
i3
0.1
4%
35
.84
%3
2.9
0%
30
.31
%2
7.2
3%
32
.30
%3
1.2
0%
29
.66
%2
9.2
6%
38
.27
%3
6.1
5%
30
.35
%2
7.3
2%
28
.53
%2
3.8
2%
22
.10
%2
4.4
6%
23
.37
%2
7.0
7%
39
.76
%4
7.4
1%
62
.35
%5
2.1
4%
37
.34
%3
6.1
5%
43
.12
%
Ku
wai
t--
----
----
--3
.36
%2
.70
%2
.60
%2
.59
%2
.72
%2
.58
%2
.57
%2
.47
%2
.34
%2
.23
%1
.52
%1
.43
%1
.51
%1
.62
%1
.73
%1
.85
%2
.11
%1
.99
%2
.08
%2
.36
%
Kyr
gyzs
tan
----
----
----
59
.08
%5
7.3
3%
58
.93
%5
8.4
9%
62
.53
%5
9.4
6%
62
.98
%6
4.4
0%
63
.37
%6
2.6
3%
60
.93
%5
8.4
1%
55
.38
%5
5.4
2%
55
.57
%5
3.7
6%
52
.98
%5
1.6
3%
52
.95
%5
2.6
1%
Lao
41
.71
%4
0.3
6%
36
.50
%3
7.2
1%
37
.54
%3
4.7
1%
37
.91
%3
4.7
2%
38
.65
%3
1.1
6%
33
.11
%3
4.2
6%
34
.47
%3
6.8
0%
46
.26
%4
5.2
1%
50
.70
%4
5.3
2%
44
.61
%4
5.5
1%
42
.43
%4
2.7
2%
39
.79
%4
1.5
8%
40
.11
%3
9.5
5%
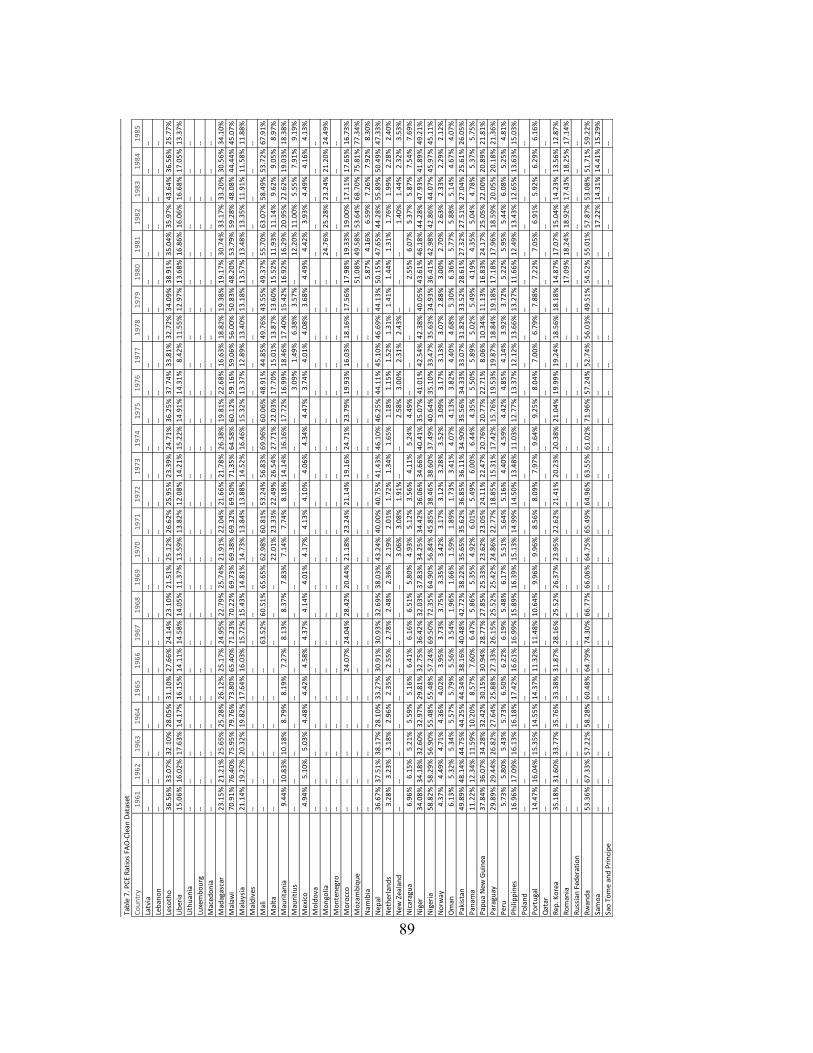
89 Ta
ble
7. P
CE
Rat
ios
FAO
-Cle
an D
atas
et
Co
un
try
19
61
19
62
19
63
19
64
19
65
19
66
19
67
19
68
19
69
19
70
19
71
19
72
19
73
19
74
19
75
19
76
19
77
19
78
19
79
19
80
19
81
19
82
19
83
19
84
19
85
Latv
ia--
----
----
----
----
----
----
----
----
----
----
----
----
Leb
ano
n--
----
----
----
----
----
----
----
----
----
----
----
----
Leso
tho
36
.56
%3
3.0
7%
32
.10
%2
8.0
5%
31
.10
%2
7.6
6%
24
.14
%2
3.1
0%
21
.51
%2
5.1
2%
26
.62
%2
5.9
5%
23
.39
%2
4.7
1%
36
.25
%3
7.7
4%
33
.81
%3
2.7
2%
34
.09
%3
8.9
1%
35
.04
%3
5.9
7%
43
.64
%3
6.5
6%
25
.77
%
Lib
eria
15
.06
%1
6.0
2%
17
.63
%1
4.1
7%
16
.15
%1
4.1
1%
14
.58
%1
4.0
5%
11
.37
%1
3.5
9%
13
.82
%1
2.0
8%
14
.21
%1
5.2
2%
14
.91
%1
4.3
1%
8.4
2%
11
.55
%1
2.9
7%
13
.68
%1
6.8
6%
16
.06
%1
6.6
8%
17
.05
%1
3.3
7%
Lith
uan
ia--
----
----
----
----
----
----
----
----
----
----
----
----
Luxe
mb
ou
rg--
----
----
----
----
----
----
----
----
----
----
----
----
Mac
edo
nia
----
----
----
----
----
----
----
----
----
----
----
----
--
Mad
agas
car
23
.15
%2
1.2
1%
25
.65
%2
5.2
8%
26
.12
%2
5.1
7%
24
.95
%2
2.7
9%
25
.74
%2
1.9
1%
22
.04
%2
1.6
6%
21
.78
%2
6.3
8%
19
.81
%2
2.6
8%
16
.63
%1
8.8
2%
19
.38
%1
9.1
7%
30
.74
%3
3.1
7%
33
.20
%3
0.5
6%
34
.10
%
Mal
awi
70
.91
%7
6.4
0%
75
.95
%7
9.7
6%
73
.80
%6
5.4
0%
71
.23
%7
0.2
2%
69
.73
%6
9.3
8%
69
.32
%6
9.5
0%
71
.35
%6
4.5
8%
60
.12
%5
9.1
6%
59
.06
%5
6.0
0%
50
.83
%4
8.2
0%
53
.79
%5
9.2
8%
48
.08
%4
4.4
4%
45
.07
%
Mal
aysi
a2
1.1
4%
19
.27
%2
0.3
2%
19
.82
%1
7.6
4%
16
.03
%1
5.7
2%
15
.43
%1
4.8
1%
14
.73
%1
3.8
4%
13
.88
%1
4.5
2%
16
.46
%1
5.3
2%
13
.37
%1
2.8
9%
13
.40
%1
3.1
8%
13
.57
%1
3.4
8%
13
.35
%1
1.9
1%
11
.58
%1
1.8
8%
Mal
div
es--
----
----
----
----
----
----
----
----
----
----
----
----
Mal
i--
----
----
--6
3.5
2%
60
.51
%6
5.6
5%
62
.98
%6
0.8
1%
53
.24
%5
6.8
3%
69
.96
%6
0.0
6%
48
.91
%4
4.8
5%
49
.76
%4
3.5
5%
49
.37
%5
5.7
0%
63
.07
%5
8.4
9%
53
.72
%6
7.9
1%
Mal
ta--
----
----
----
----
22
.01
%2
3.3
3%
22
.49
%2
6.5
4%
27
.71
%2
2.0
3%
17
.70
%1
5.0
1%
13
.87
%1
3.6
0%
15
.52
%1
1.9
3%
11
.14
%9
.62
%9
.05
%8
.97
%
Mau
rita
nia
9.4
4%
10
.83
%1
0.1
8%
8.7
9%
8.1
9%
7.2
7%
8.1
3%
8.3
7%
7.8
3%
7.1
4%
7.7
4%
8.1
8%
14
.14
%1
6.1
6%
17
.72
%1
6.9
9%
18
.46
%1
7.4
0%
15
.42
%1
6.9
2%
16
.29
%2
0.9
5%
22
.62
%1
9.0
3%
18
.38
%
Mau
riti
us
----
----
----
----
----
----
----
--3
.09
%1
.49
%6
.38
%3
.57
%--
12
.20
%1
1.0
0%
5.5
5%
7.9
1%
9.1
9%
Mex
ico
4.9
4%
5.1
0%
5.0
3%
4.4
8%
4.4
2%
4.5
8%
4.3
7%
4.1
4%
4.0
1%
4.1
7%
4.1
3%
4.1
0%
4.0
6%
4.3
4%
4.4
7%
3.7
4%
4.0
1%
4.0
8%
3.6
8%
4.4
9%
4.4
2%
3.9
3%
4.4
9%
4.1
6%
4.1
3%
Mo
ldo
va--
----
----
----
----
----
----
----
----
----
----
----
----
Mo
ngo
lia--
----
----
----
----
----
----
----
----
----
--2
4.7
6%
25
.28
%2
3.2
4%
21
.20
%2
4.4
9%
Mo
nte
neg
ro--
----
----
----
----
----
----
----
----
----
----
----
----
Mo
rocc
o--
----
----
24
.07
%2
4.0
4%
28
.42
%2
0.4
4%
21
.18
%2
3.2
4%
21
.14
%1
9.1
6%
24
.71
%2
3.7
9%
19
.93
%1
6.0
3%
18
.16
%1
7.5
6%
17
.98
%1
9.3
3%
19
.00
%1
7.1
1%
17
.65
%1
6.7
3%
Mo
zam
biq
ue
----
----
----
----
----
----
----
----
----
--5
1.0
8%
49
.58
%5
3.6
4%
68
.70
%7
5.8
1%
77
.34
%
Nam
ibia
----
----
----
----
----
----
----
----
----
--5
.87
%4
.16
%6
.59
%7
.26
%7
.92
%8
.30
%
Nep
al3
6.6
7%
37
.51
%3
8.1
7%
28
.10
%3
3.2
7%
30
.91
%3
0.9
3%
32
.69
%3
8.0
3%
43
.24
%4
0.0
0%
40
.75
%4
1.4
3%
46
.10
%4
6.2
5%
44
.11
%4
5.1
0%
46
.69
%4
4.1
3%
50
.15
%4
7.6
5%
44
.28
%5
5.8
9%
50
.49
%4
7.3
3%
Net
her
lan
ds
3.2
8%
3.2
3%
3.1
8%
2.9
6%
2.3
5%
2.5
5%
2.7
8%
2.4
8%
2.3
6%
2.1
9%
2.0
1%
1.7
2%
1.3
4%
1.6
5%
1.1
8%
1.1
5%
1.5
2%
1.3
1%
1.4
1%
1.4
4%
1.3
1%
1.7
6%
1.9
9%
2.2
8%
2.4
0%
New
Zea
lan
d--
----
----
----
----
3.0
6%
3.0
8%
1.9
1%
----
2.5
8%
3.0
0%
2.3
1%
2.4
3%
----
--1
.40
%1
.44
%2
.32
%3
.53
%
Nic
arag
ua
6.9
6%
6.1
5%
5.2
1%
5.5
9%
5.1
6%
6.4
1%
6.1
6%
6.5
1%
5.8
0%
4.9
3%
5.1
2%
3.5
6%
4.1
1%
5.2
4%
4.4
9%
----
----
2.5
5%
6.0
7%
5.3
7%
5.8
7%
7.5
4%
7.6
9%
Nig
er3
4.0
8%
34
.18
%3
2.6
0%
32
.97
%2
9.8
1%
32
.75
%3
6.4
2%
32
.03
%3
7.8
3%
34
.25
%3
4.4
2%
36
.06
%3
4.6
6%
40
.41
%3
5.0
7%
41
.01
%4
2.5
4%
42
.38
%4
0.0
5%
43
.61
%4
6.1
8%
44
.28
%4
7.9
3%
41
.89
%4
9.2
1%
Nig
eria
58
.82
%5
8.2
9%
56
.90
%5
5.4
8%
55
.48
%5
7.2
4%
69
.50
%7
2.3
5%
64
.90
%5
6.8
4%
45
.85
%3
8.4
6%
38
.60
%3
7.4
9%
40
.64
%3
5.1
0%
33
.47
%3
5.6
3%
34
.93
%3
6.4
1%
42
.98
%4
2.8
6%
44
.07
%4
5.9
7%
45
.11
%
No
rway
4.3
7%
4.4
9%
4.7
1%
4.3
6%
4.0
2%
3.9
5%
3.7
3%
3.7
5%
3.3
5%
3.4
2%
3.1
7%
3.1
2%
3.2
8%
3.5
2%
3.0
9%
3.1
7%
3.1
3%
3.0
7%
2.8
8%
3.0
0%
2.7
0%
2.6
3%
2.3
3%
2.2
9%
2.1
2%
Om
an6
.13
%5
.32
%5
.34
%5
.57
%5
.79
%5
.56
%3
.54
%1
.96
%1
.66
%1
.59
%1
.89
%1
.73
%3
.41
%4
.07
%4
.13
%3
.82
%4
.40
%4
.68
%5
.30
%6
.36
%5
.77
%5
.88
%5
.14
%4
.67
%4
.07
%
Pak
ista
n4
9.8
9%
48
.14
%4
4.7
5%
44
.25
%4
4.3
4%
38
.16
%4
0.4
8%
42
.72
%3
8.2
2%
35
.65
%3
5.6
2%
36
.85
%3
6.1
1%
34
.90
%3
5.5
6%
34
.33
%3
3.0
7%
31
.82
%3
3.5
2%
28
.61
%2
7.3
2%
27
.51
%2
7.0
4%
25
.61
%2
6.0
5%
Pan
ama
11
.22
%1
2.3
4%
11
.59
%1
0.2
0%
8.5
7%
7.6
0%
6.4
7%
5.8
6%
5.3
5%
4.9
2%
6.0
1%
5.4
9%
6.0
0%
6.4
4%
4.3
5%
5.5
0%
5.8
9%
5.0
2%
5.4
9%
4.1
9%
4.3
5%
5.0
4%
4.7
8%
5.3
7%
5.7
5%
Pap
ua
New
Gu
inea
37
.84
%3
6.0
7%
34
.28
%3
2.4
2%
30
.15
%3
0.9
4%
28
.77
%2
7.8
5%
25
.33
%2
3.6
2%
23
.05
%2
4.1
1%
22
.47
%2
0.7
6%
20
.77
%2
2.7
1%
8.0
6%
10
.34
%1
1.1
3%
16
.83
%2
4.1
7%
25
.05
%2
2.0
0%
20
.89
%2
1.8
1%
Par
agu
ay2
9.8
9%
29
.44
%2
6.8
2%
27
.64
%2
5.8
8%
27
.33
%2
6.1
5%
25
.52
%2
5.4
2%
24
.86
%2
2.7
7%
18
.85
%1
5.3
1%
17
.42
%1
5.7
6%
19
.53
%1
9.8
7%
18
.84
%1
9.1
8%
17
.18
%1
7.9
6%
18
.59
%2
0.0
5%
20
.18
%2
1.3
6%
Per
u5
.73
%5
.80
%5
.43
%5
.73
%6
.50
%6
.22
%6
.19
%5
.48
%6
.17
%5
.51
%5
.64
%5
.16
%4
.40
%4
.59
%4
.42
%4
.85
%4
.14
%3
.92
%3
.72
%5
.22
%5
.95
%5
.44
%6
.08
%5
.25
%4
.81
%
Ph
ilip
pin
es1
6.9
6%
17
.09
%1
6.1
3%
16
.18
%1
7.4
2%
16
.61
%1
6.9
9%
15
.89
%1
6.3
9%
15
.13
%1
4.9
9%
14
.50
%1
3.4
8%
11
.03
%1
2.7
7%
13
.37
%1
2.1
2%
13
.66
%1
3.2
7%
11
.66
%1
2.4
9%
13
.43
%1
2.6
5%
13
.63
%1
5.0
3%
Po
lan
d--
----
----
----
----
----
----
----
----
----
----
----
----
Po
rtu
gal
14
.47
%1
6.0
4%
15
.35
%1
4.5
5%
14
.37
%1
1.3
2%
11
.48
%1
0.6
4%
9.9
6%
9.9
6%
8.5
6%
8.0
9%
7.9
7%
9.6
4%
9.2
5%
8.0
4%
7.0
0%
6.7
9%
7.8
8%
7.2
2%
7.0
5%
6.9
1%
5.9
2%
6.2
9%
6.1
6%
Qat
ar--
----
----
----
----
----
----
----
----
----
----
----
----
Rep
. Ko
rea
35
.18
%3
1.6
0%
33
.77
%3
5.7
6%
33
.38
%3
1.8
7%
28
.16
%2
5.5
2%
26
.37
%2
3.9
5%
22
.62
%2
1.4
1%
20
.23
%2
0.3
8%
21
.04
%1
9.9
9%
19
.24
%1
8.5
6%
18
.18
%1
4.8
7%
17
.07
%1
5.0
4%
14
.23
%1
3.5
6%
12
.87
%
Ro
man
ia--
----
----
----
----
----
----
----
----
----
17
.09
%1
8.2
4%
18
.92
%1
7.4
3%
18
.25
%1
7.1
4%
Ru
ssia
n F
eder
atio
n--
----
----
----
----
----
----
----
----
----
----
----
----
Rw
and
a5
3.3
6%
67
.33
%5
7.2
2%
58
.28
%6
0.4
8%
64
.79
%7
4.3
0%
66
.77
%6
6.0
6%
64
.75
%6
5.4
9%
64
.96
%6
3.5
5%
61
.02
%7
1.9
6%
57
.24
%5
2.7
4%
56
.03
%4
9.5
1%
54
.52
%5
5.0
1%
57
.87
%5
3.0
8%
51
.71
%5
9.2
2%
Sam
oa
----
----
----
----
----
----
----
----
----
----
--1
7.2
2%
14
.31
%1
4.4
1%
15
.29
%
Sao
To
me
and
Pri
nci
pe
----
----
----
----
----
----
----
----
----
----
----
----
--

90 Ta
ble
7. P
CE
Rat
ios
FAO
-Cle
an D
atas
et (
Co
nt.
)
Co
un
try
19
86
19
87
19
88
19
89
19
90
19
91
19
92
19
93
19
94
19
95
19
96
19
97
19
98
19
99
20
00
20
01
20
02
20
03
20
04
20
05
20
06
20
07
20
08
20
09
20
10
20
11
Latv
ia--
----
----
--1
4.0
4%
12
.27
%1
0.3
2%
10
.00
%1
0.0
9%
9.3
1%
10
.08
%9
.65
%9
.39
%8
.67
%9
.23
%9
.40
%7
.29
%6
.81
%6
.02
%6
.12
%6
.57
%7
.14
%6
.67
%7
.02
%
Leb
ano
n--
--1
1.7
7%
22
.56
%1
8.3
2%
14
.86
%1
5.2
3%
14
.30
%1
4.2
7%
14
.22
%1
3.0
1%
14
.47
%1
2.9
1%
12
.31
%1
1.9
7%
10
.90
%1
0.9
9%
10
.49
%1
0.6
9%
9.7
0%
9.6
2%
9.9
5%
9.9
8%
9.0
8%
9.0
4%
9.5
5%
Leso
tho
25
.82
%2
5.6
4%
28
.63
%2
5.4
3%
24
.40
%2
2.5
2%
21
.66
%2
0.7
9%
18
.17
%2
1.1
9%
20
.86
%1
8.5
7%
17
.98
%1
7.0
6%
14
.48
%1
4.1
3%
14
.49
%1
2.9
2%
11
.92
%1
0.5
2%
11
.47
%1
0.8
5%
13
.12
%1
2.7
7%
9.5
9%
9.3
0%
Lib
eria
15
.06
%1
5.9
3%
17
.59
%2
7.4
7%
37
.10
%5
6.3
7%
79
.90
%--
----
--6
8.7
1%
54
.25
%4
3.1
1%
39
.12
%2
7.2
9%
21
.41
%3
3.3
1%
42
.69
%4
5.9
0%
39
.94
%3
4.0
7%
37
.04
%3
4.1
1%
33
.13
%2
6.7
6%
Lith
uan
ia--
----
----
--9
.79
%1
1.6
0%
8.9
4%
8.4
1%
10
.60
%1
0.0
6%
9.5
9%
9.1
2%
8.7
9%
6.6
3%
7.2
5%
6.6
6%
5.9
6%
5.2
1%
4.0
9%
3.9
4%
3.7
2%
4.3
8%
3.4
6%
3.5
8%
Luxe
mb
ou
rg--
----
----
----
----
----
----
--2
.01
%1
.88
%1
.97
%2
.19
%2
.33
%2
.13
%2
.10
%2
.14
%2
.49
%2
.41
%2
.25
%2
.25
%
Mac
edo
nia
----
----
----
13
.45
%1
3.5
6%
17
.71
%1
7.7
7%
17
.27
%1
9.1
7%
19
.47
%1
6.1
9%
15
.55
%1
4.7
0%
15
.55
%1
5.4
8%
16
.54
%1
4.7
3%
14
.43
%1
7.8
9%
15
.55
%1
5.7
3%
14
.86
%1
4.9
4%
Mad
agas
car
33
.60
%3
1.8
3%
34
.56
%3
4.5
4%
35
.59
%3
8.2
9%
39
.19
%3
9.8
0%
36
.08
%3
8.3
8%
39
.85
%4
0.7
7%
38
.44
%3
7.3
7%
34
.55
%3
0.1
6%
33
.36
%3
3.2
3%
33
.26
%4
0.3
4%
38
.38
%3
6.9
1%
36
.79
%4
0.3
1%
42
.06
%4
0.4
5%
Mal
awi
49
.57
%4
9.4
0%
52
.16
%5
3.4
3%
47
.74
%5
0.0
4%
47
.23
%5
7.2
1%
53
.64
%5
0.4
4%
54
.17
%4
9.4
6%
59
.14
%6
6.1
4%
----
73
.18
%7
3.4
6%
74
.29
%6
3.2
7%
----
----
----
Mal
aysi
a1
1.7
2%
10
.92
%1
1.2
8%
12
.14
%1
1.3
7%
10
.90
%1
0.6
1%
10
.63
%9
.86
%9
.91
%9
.64
%9
.42
%8
.92
%9
.20
%8
.62
%9
.18
%8
.67
%8
.61
%8
.76
%8
.83
%8
.92
%8
.64
%8
.90
%9
.03
%8
.83
%9
.21
%
Mal
div
es--
----
----
----
----
----
----
----
9.7
2%
8.9
0%
8.5
4%
8.8
2%
9.4
9%
9.7
6%
10
.53
%1
1.3
0%
9.7
8%
11
.92
%1
2.6
7%
Mal
i6
6.5
5%
63
.71
%7
1.0
8%
64
.50
%6
7.6
2%
73
.08
%6
0.1
6%
63
.07
%6
5.5
3%
63
.11
%6
5.3
6%
61
.56
%6
3.7
4%
61
.70
%5
5.7
3%
53
.59
%5
6.1
6%
59
.30
%5
3.9
2%
59
.71
%5
5.4
2%
60
.98
%6
1.5
7%
67
.76
%6
5.2
8%
64
.12
%
Mal
ta8
.49
%9
.07
%9
.14
%8
.75
%8
.52
%8
.39
%8
.28
%7
.28
%6
.73
%7
.88
%8
.44
%7
.58
%7
.40
%6
.72
%5
.93
%5
.84
%5
.70
%6
.26
%7
.11
%6
.69
%6
.69
%7
.48
%7
.76
%7
.34
%6
.48
%7
.46
%
Mau
rita
nia
14
.73
%1
5.9
3%
19
.24
%1
9.9
7%
17
.25
%1
7.5
0%
15
.85
%1
3.5
9%
11
.82
%1
1.6
6%
12
.82
%1
4.5
2%
21
.12
%1
3.8
8%
15
.21
%1
7.0
8%
16
.70
%1
7.2
3%
17
.69
%1
2.2
9%
14
.96
%1
5.4
4%
17
.24
%1
8.9
6%
13
.39
%1
3.2
5%
Mau
riti
us
4.6
6%
2.3
5%
2.3
6%
4.1
0%
3.9
0%
4.6
0%
4.4
2%
5.3
9%
5.3
3%
5.2
7%
4.3
9%
6.6
7%
5.1
1%
4.6
8%
7.9
2%
6.6
2%
6.3
0%
6.4
4%
6.3
7%
6.0
7%
5.8
4%
6.9
4%
8.2
9%
8.5
5%
7.8
1%
7.3
3%
Mex
ico
3.9
5%
4.0
0%
4.0
5%
4.0
1%
4.2
4%
3.9
4%
4.1
1%
3.9
4%
3.9
3%
3.8
2%
3.9
0%
3.6
2%
3.7
1%
3.8
6%
3.7
7%
4.1
8%
4.2
3%
4.2
5%
4.1
2%
4.0
0%
3.9
3%
4.0
3%
4.1
1%
3.9
2%
3.8
3%
3.6
9%
Mo
ldo
va--
----
----
--3
5.0
2%
38
.18
%3
3.5
5%
35
.17
%3
4.6
1%
34
.43
%3
2.9
7%
33
.60
%3
5.9
1%
36
.38
%3
5.5
9%
33
.53
%3
4.9
2%
31
.31
%2
9.0
3%
22
.83
%3
0.7
9%
25
.48
%2
5.7
7%
26
.60
%
Mo
ngo
lia2
0.8
0%
21
.15
%2
0.8
2%
22
.57
%2
3.5
3%
27
.36
%2
7.5
4%
29
.06
%2
4.2
1%
23
.62
%2
5.9
0%
24
.37
%2
5.6
3%
25
.83
%2
6.3
7%
21
.97
%2
0.1
0%
17
.58
%1
9.5
2%
16
.97
%1
6.4
9%
17
.21
%2
0.9
1%
21
.19
%1
7.5
8%
18
.43
%
Mo
nte
neg
ro--
----
----
----
----
----
----
----
----
----
--1
1.0
1%
12
.98
%1
6.6
9%
15
.92
%1
4.8
4%
16
.04
%
Mo
rocc
o1
7.9
0%
17
.04
%1
8.9
6%
20
.40
%1
8.1
2%
18
.80
%1
6.5
5%
17
.41
%1
8.7
9%
15
.45
%1
9.5
3%
17
.02
%1
7.5
0%
16
.23
%1
5.8
0%
15
.93
%1
6.5
3%
16
.47
%1
7.0
6%
15
.01
%1
6.5
0%
15
.04
%1
6.3
4%
17
.15
%1
6.5
7%
17
.43
%
Mo
zam
biq
ue
75
.19
%6
8.0
1%
64
.20
%6
0.8
9%
61
.90
%5
5.8
8%
56
.15
%5
4.7
3%
48
.33
%7
7.5
3%
75
.43
%7
0.7
8%
67
.90
%6
4.7
5%
61
.92
%5
7.1
3%
52
.55
%5
1.0
3%
50
.21
%4
3.4
1%
39
.72
%4
0.7
7%
40
.51
%4
1.0
9%
45
.64
%4
3.6
0%
Nam
ibia
7.5
0%
5.8
7%
6.0
4%
6.1
5%
7.2
0%
6.2
0%
5.2
2%
5.7
7%
5.0
4%
5.3
3%
5.5
4%
9.8
3%
5.8
9%
8.9
1%
8.7
2%
7.4
5%
6.6
6%
6.6
5%
6.2
9%
6.6
1%
6.1
5%
6.0
7%
5.5
9%
5.0
2%
4.7
0%
4.9
3%
Nep
al4
5.1
0%
49
.27
%5
0.1
8%
50
.80
%5
0.4
6%
49
.40
%4
6.8
5%
48
.70
%4
5.5
1%
46
.95
%4
4.3
5%
44
.29
%4
5.8
7%
43
.23
%4
3.1
2%
41
.96
%4
1.9
1%
43
.17
%4
3.4
7%
43
.21
%4
2.7
3%
42
.07
%4
1.7
6%
41
.18
%4
1.5
7%
44
.14
%
Net
her
lan
ds
1.9
3%
1.5
6%
1.7
1%
----
----
----
----
--1
.02
%1
.05
%1
.23
%1
.23
%1
.10
%--
----
----
----
----
New
Zea
lan
d3
.22
%2
.59
%2
.26
%1
.29
%1
.57
%1
.68
%1
.45
%1
.83
%2
.07
%1
.70
%1
.46
%1
.27
%2
.51
%2
.48
%2
.32
%1
.93
%2
.04
%1
.52
%--
----
----
----
--
Nic
arag
ua
8.4
7%
7.8
9%
11
.48
%1
0.4
9%
9.6
4%
12
.42
%1
4.8
0%
14
.04
%1
1.6
4%
10
.79
%1
0.7
1%
9.6
8%
13
.17
%1
2.9
2%
12
.22
%1
3.4
0%
13
.64
%1
4.7
4%
12
.43
%1
2.7
3%
13
.19
%1
1.5
5%
11
.43
%1
1.3
1%
8.2
1%
8.7
8%
Nig
er4
4.1
1%
43
.34
%5
0.6
6%
46
.21
%5
1.8
4%
51
.79
%5
8.6
0%
55
.97
%5
7.3
7%
55
.19
%6
2.0
7%
56
.68
%6
5.6
6%
62
.16
%6
2.4
0%
68
.47
%7
0.6
7%
70
.75
%6
6.0
6%
73
.41
%7
3.2
7%
72
.57
%7
7.2
2%
63
.81
%7
1.1
3%
60
.02
%
Nig
eria
51
.10
%5
8.6
0%
61
.36
%6
2.8
3%
59
.76
%6
7.7
8%
72
.92
%7
6.5
6%
77
.93
%--
79
.01
%8
0.0
0%
----
--7
7.9
9%
78
.25
%7
4.9
4%
60
.45
%6
1.1
5%
59
.36
%5
2.6
6%
52
.94
%4
3.5
1%
44
.85
%4
4.0
1%
No
rway
2.1
8%
2.1
9%
2.1
9%
2.1
7%
2.1
7%
1.9
5%
1.8
6%
1.8
5%
1.8
3%
1.7
9%
1.7
4%
1.6
0%
1.5
5%
1.5
4%
1.3
7%
1.3
6%
1.4
2%
1.4
8%
1.5
4%
1.5
2%
1.5
5%
1.7
0%
1.9
0%
1.7
4%
1.8
1%
1.9
3%
Om
an3
.78
%3
.75
%3
.74
%3
.29
%3
.53
%3
.35
%3
.18
%3
.04
%2
.87
%2
.94
%2
.89
%2
.50
%2
.47
%2
.49
%1
.97
%2
.29
%2
.08
%2
.23
%2
.69
%2
.31
%2
.49
%2
.96
%3
.71
%2
.89
%3
.35
%3
.13
%
Pak
ista
n2
6.9
7%
25
.52
%2
3.9
1%
25
.49
%2
5.2
9%
24
.19
%2
3.4
7%
25
.36
%2
4.5
3%
25
.01
%2
5.0
9%
25
.18
%2
5.1
8%
24
.56
%2
4.8
4%
23
.25
%2
2.6
6%
22
.28
%2
1.6
2%
21
.39
%2
0.9
6%
20
.77
%2
1.0
2%
21
.10
%1
9.9
2%
19
.93
%
Pan
ama
5.6
3%
5.7
0%
5.2
3%
6.4
0%
5.3
9%
6.2
1%
6.3
7%
6.2
8%
6.6
3%
7.3
0%
7.6
7%
7.4
7%
8.4
1%
7.6
6%
8.0
4%
8.7
2%
8.8
5%
8.7
7%
8.2
1%
7.7
7%
7.2
3%
7.6
3%
7.8
3%
7.6
7%
7.7
2%
7.6
7%
Pap
ua
New
Gu
inea
16
.68
%2
1.1
3%
22
.76
%2
2.8
0%
27
.03
%2
7.2
3%
24
.95
%2
1.2
1%
17
.53
%1
8.6
3%
19
.66
%1
7.4
2%
18
.77
%2
1.3
8%
23
.04
%2
4.8
6%
24
.23
%2
2.5
5%
22
.95
%2
2.5
0%
24
.53
%2
4.2
4%
24
.54
%2
3.3
8%
21
.03
%1
8.2
1%
Par
agu
ay1
7.4
1%
18
.97
%1
9.2
8%
17
.33
%1
6.7
1%
17
.71
%1
8.5
7%
18
.57
%1
8.6
1%
19
.87
%1
9.2
1%
19
.30
%2
0.0
4%
22
.10
%2
0.6
3%
23
.26
%2
5.0
4%
24
.51
%2
1.8
9%
21
.13
%2
0.2
5%
21
.45
%1
8.1
6%
13
.59
%2
1.2
6%
22
.25
%
Per
u4
.91
%5
.37
%6
.15
%6
.03
%6
.52
%6
.52
%6
.70
%6
.97
%6
.48
%6
.39
%6
.90
%6
.40
%6
.73
%6
.79
%6
.87
%6
.88
%6
.73
%6
.54
%6
.08
%6
.13
%5
.81
%5
.81
%5
.77
%5
.76
%5
.34
%4
.75
%
Ph
ilip
pin
es1
5.3
8%
14
.95
%1
4.9
3%
15
.37
%1
6.4
6%
16
.02
%1
6.7
6%
16
.95
%1
7.1
5%
17
.35
%1
7.9
5%
16
.77
%1
6.5
6%
16
.69
%1
6.3
9%
16
.33
%1
6.3
7%
15
.99
%1
5.6
5%
15
.24
%1
4.9
6%
15
.22
%1
6.4
5%
15
.52
%1
4.8
2%
14
.07
%
Po
lan
d--
----
--1
0.3
0%
10
.42
%9
.16
%9
.92
%7
.98
%8
.18
%8
.08
%6
.84
%7
.10
%6
.53
%6
.12
%6
.01
%5
.82
%5
.24
%4
.98
%4
.37
%3
.92
%4
.04
%3
.79
%3
.89
%3
.51
%3
.27
%
Po
rtu
gal
6.0
6%
6.4
1%
5.2
0%
5.7
9%
6.2
9%
6.2
3%
5.9
2%
5.6
9%
5.9
4%
5.9
7%
6.1
1%
5.3
1%
5.0
3%
5.3
6%
4.7
9%
4.6
0%
4.6
5%
4.7
3%
5.2
5%
4.9
0%
4.9
0%
5.0
2%
5.2
5%
5.1
0%
5.2
2%
5.3
2%
Qat
ar--
----
----
----
----
----
----
--1
.48
%1
.45
%1
.51
%1
.43
%1
.03
%1
.32
%1
.25
%1
.29
%1
.68
%1
.35
%1
.47
%--
Rep
. Ko
rea
11
.95
%1
0.6
8%
10
.47
%9
.96
%8
.88
%8
.07
%8
.15
%7
.42
%7
.06
%6
.80
%6
.89
%6
.65
%6
.67
%6
.40
%6
.04
%5
.75
%5
.18
%4
.86
%4
.88
%4
.72
%4
.54
%4
.49
%4
.86
%4
.64
%4
.19
%4
.24
%
Ro
man
ia1
6.0
3%
13
.89
%1
4.5
3%
15
.05
%1
6.0
5%
17
.30
%1
7.7
7%
19
.85
%1
7.6
1%
17
.07
%1
5.7
7%
17
.41
%1
7.1
3%
18
.29
%1
5.6
0%
17
.14
%1
5.5
0%
16
.85
%1
7.0
3%
14
.40
%1
3.7
6%
11
.71
%1
2.5
0%
12
.74
%1
1.8
4%
12
.67
%
Ru
ssia
n F
eder
atio
n--
----
----
--1
0.8
6%
10
.82
%1
0.8
5%
10
.98
%1
0.7
4%
10
.75
%9
.75
%8
.76
%8
.22
%8
.39
%8
.15
%7
.70
%7
.48
%7
.24
%7
.18
%6
.62
%7
.04
%7
.36
%6
.97
%7
.71
%
Rw
and
a4
1.8
3%
44
.55
%4
2.6
8%
47
.10
%4
8.2
2%
59
.07
%5
8.3
0%
50
.19
%--
61
.41
%6
1.0
5%
54
.40
%5
6.2
1%
54
.70
%6
1.5
8%
57
.80
%6
2.0
1%
56
.66
%5
2.0
1%
50
.91
%4
7.4
6%
44
.89
%4
0.1
3%
54
.00
%5
4.8
5%
54
.54
%
Sam
oa
15
.14
%1
4.9
8%
16
.25
%1
4.9
9%
16
.13
%1
4.4
7%
14
.59
%1
5.5
1%
17
.61
%1
7.8
2%
17
.98
%1
5.1
5%
15
.46
%1
3.8
3%
13
.65
%1
2.9
2%
13
.36
%1
3.8
2%
15
.23
%1
4.6
4%
15
.45
%1
5.4
0%
16
.09
%2
0.4
2%
22
.36
%2
0.5
4%
Sao
To
me
and
Pri
nci
pe
----
----
----
----
----
----
----
--1
3.7
1%
14
.40
%1
3.5
7%
16
.43
%1
6.8
3%
17
.63
%2
0.0
1%
17
.92
%2
0.4
5%
15
.55
%1
8.3
5%

91 Ta
ble
7. P
CE
Rat
ios
FAO
-Cle
an D
atas
et
Co
un
try
19
61
19
62
19
63
19
64
19
65
19
66
19
67
19
68
19
69
19
70
19
71
19
72
19
73
19
74
19
75
19
76
19
77
19
78
19
79
19
80
19
81
19
82
19
83
19
84
19
85
Sau
di A
rab
ia--
----
----
----
2.8
1%
2.8
3%
2.6
6%
3.0
2%
1.9
4%
1.9
4%
1.9
5%
1.9
2%
2.1
4%
2.5
7%
3.3
3%
3.6
6%
4.2
0%
4.4
1%
5.1
0%
5.1
0%
5.8
3%
4.6
3%
Sen
egal
25
.46
%2
5.9
7%
27
.39
%2
7.4
6%
27
.86
%2
5.5
5%
27
.11
%2
1.7
8%
24
.75
%1
6.5
7%
23
.43
%1
4.8
4%
22
.55
%2
8.5
1%
24
.65
%2
2.0
0%
14
.70
%2
3.5
8%
17
.92
%1
9.5
8%
24
.33
%1
8.1
8%
15
.06
%1
6.0
8%
17
.66
%
Serb
ia--
----
----
----
----
----
----
----
----
----
----
----
----
Seyc
hel
les
6.0
7%
6.2
8%
5.7
9%
5.7
7%
5.6
0%
6.0
6%
7.0
6%
5.1
8%
3.1
7%
4.5
5%
5.4
8%
5.3
2%
7.4
3%
9.5
6%
9.1
4%
8.4
0%
7.3
2%
8.1
6%
7.7
4%
9.0
4%
8.4
5%
8.9
6%
6.9
8%
7.1
1%
5.9
4%
Sier
ra L
eon
e1
5.6
8%
16
.98
%1
8.2
5%
16
.16
%1
7.1
4%
16
.74
%1
8.6
0%
15
.30
%1
4.5
1%
15
.21
%1
3.6
7%
10
.83
%1
3.3
7%
18
.38
%1
1.5
5%
11
.21
%6
.24
%1
1.0
2%
10
.30
%1
0.6
8%
12
.43
%1
3.3
8%
10
.81
%8
.88
%8
.86
%
Sin
gap
ore
13
.74
%1
1.6
4%
11
.85
%1
2.3
8%
12
.00
%1
1.3
9%
9.3
3%
9.9
9%
9.2
1%
8.2
4%
7.8
6%
8.0
5%
9.1
0%
8.7
5%
8.0
9%
8.8
0%
7.4
3%
6.1
0%
6.6
0%
5.7
1%
5.4
6%
5.0
1%
5.2
1%
4.1
4%
4.1
5%
Slo
vaki
a--
----
----
----
----
----
----
----
----
----
----
----
----
Slo
ven
ia--
----
----
----
----
----
----
----
----
----
----
----
----
Solo
mo
n Is
lan
ds
----
----
----
----
----
----
----
----
----
----
----
----
--
Sou
th A
fric
a6
.46
%5
.60
%5
.62
%5
.26
%5
.59
%5
.85
%5
.88
%4
.76
%5
.43
%4
.93
%5
.22
%4
.78
%4
.00
%3
.91
%3
.67
%4
.20
%4
.54
%4
.49
%4
.27
%3
.50
%4
.39
%4
.38
%4
.78
%5
.32
%5
.08
%
Spai
n7
.46
%6
.70
%7
.41
%6
.44
%6
.26
%6
.40
%5
.66
%5
.65
%5
.24
%5
.21
%5
.18
%5
.06
%5
.25
%5
.33
%5
.33
%4
.86
%4
.67
%4
.99
%5
.06
%5
.17
%4
.60
%5
.16
%4
.81
%5
.18
%4
.98
%
Sri L
anka
3.3
6%
2.4
2%
3.5
0%
14
.98
%4
.34
%1
0.2
5%
11
.51
%1
2.4
5%
13
.38
%1
5.5
3%
13
.66
%1
3.9
9%
14
.89
%2
0.3
0%
21
.32
%1
3.9
9%
8.5
3%
9.4
0%
14
.34
%1
6.9
0%
14
.39
%1
1.9
5%
13
.58
%6
.36
%1
0.8
1%
St. K
itts
an
d N
evis
----
----
----
----
----
----
----
----
----
----
--1
.50
%2
.62
%1
.23
%5
.15
%
St. L
uci
a--
----
----
----
----
----
----
----
----
----
13
.63
%1
2.5
9%
13
.39
%1
1.4
5%
8.1
8%
6.5
5%
St. V
ince
nt
and
th
e G
ren
adin
es5
.54
%5
.89
%7
.09
%7
.87
%7
.30
%7
.24
%8
.52
%7
.87
%8
.59
%1
0.1
0%
13
.33
%1
0.9
3%
10
.15
%7
.95
%1
2.5
1%
5.6
1%
6.5
0%
5.4
8%
8.9
7%
11
.01
%3
.98
%4
.34
%--
----
Sud
an5
2.2
7%
49
.05
%5
4.0
0%
54
.67
%4
9.4
0%
51
.37
%5
7.4
3%
51
.48
%5
3.8
7%
54
.42
%5
5.3
3%
58
.35
%6
1.3
7%
60
.52
%5
5.7
3%
47
.27
%4
5.1
6%
50
.75
%5
0.6
5%
56
.96
%5
6.6
2%
44
.92
%4
6.6
6%
43
.80
%6
0.7
5%
Suri
nam
e--
----
----
----
----
----
----
--4
.64
%6
.52
%6
.91
%6
.18
%5
.04
%5
.61
%7
.75
%6
.97
%7
.19
%7
.94
%6
.03
%
Swaz
ilan
d--
----
----
----
----
----
----
----
----
----
----
----
----
Swed
en3
.86
%3
.78
%3
.69
%3
.62
%3
.43
%3
.31
%3
.24
%3
.19
%2
.77
%2
.90
%2
.71
%2
.63
%2
.75
%2
.83
%2
.71
%2
.96
%3
.16
%3
.11
%3
.04
%2
.94
%2
.67
%2
.49
%2
.33
%2
.37
%2
.18
%
Swit
zerl
and
----
----
----
----
--3
.25
%3
.19
%3
.10
%3
.50
%3
.47
%3
.66
%3
.68
%3
.63
%3
.76
%3
.73
%3
.56
%3
.32
%3
.52
%3
.23
%3
.21
%3
.04
%
Tajik
ista
n--
----
----
----
----
----
----
----
----
----
----
----
----
Tan
zan
ia--
----
----
----
----
----
----
----
----
----
----
----
----
Thai
lan
d--
----
--3
5.5
8%
38
.94
%3
0.7
2%
31
.54
%3
2.3
4%
29
.69
%2
7.7
3%
24
.00
%2
5.0
5%
16
.00
%1
9.2
9%
16
.31
%1
4.2
9%
17
.08
%1
4.2
5%
14
.16
%1
2.0
4%
11
.66
%1
4.5
9%
13
.55
%1
5.7
7%
Tim
or-
Lest
e--
----
----
----
----
----
----
----
----
----
----
----
----
Togo
42
.42
%4
3.4
6%
45
.66
%3
5.0
4%
34
.19
%3
3.0
9%
31
.80
%2
9.4
4%
24
.49
%2
3.3
9%
26
.74
%2
5.0
6%
25
.68
%2
2.0
6%
23
.36
%2
2.8
7%
18
.46
%1
6.7
2%
24
.26
%2
3.0
2%
27
.08
%3
0.2
8%
30
.27
%2
9.5
0%
29
.05
%
Ton
ga--
----
----
----
----
----
----
----
----
----
--2
2.1
4%
18
.20
%1
7.3
8%
15
.79
%1
6.1
5%
Trin
idad
an
d T
ob
ago
6.4
6%
6.6
6%
5.7
6%
5.6
2%
6.3
1%
6.4
8%
6.0
8%
5.3
8%
5.7
4%
5.3
8%
5.4
9%
5.5
3%
6.0
8%
5.6
6%
4.7
4%
5.6
8%
6.0
0%
6.1
2%
6.2
5%
6.6
1%
6.8
5%
7.1
5%
7.7
1%
7.6
9%
6.8
0%
Tun
isia
29
.35
%2
7.4
5%
26
.82
%2
5.5
9%
24
.26
%2
0.9
6%
24
.68
%2
0.8
0%
18
.39
%2
0.6
2%
23
.16
%1
9.1
7%
22
.02
%2
3.1
5%
24
.16
%2
0.6
7%
20
.97
%1
9.3
4%
18
.32
%2
0.7
3%
18
.73
%1
6.2
7%
18
.63
%1
6.6
7%
16
.99
%
Turk
ey2
7.5
2%
26
.44
%2
5.4
6%
23
.59
%2
2.7
1%
22
.27
%2
1.1
8%
20
.81
%1
9.8
4%
20
.61
%2
0.2
2%
18
.91
%1
6.5
8%
17
.95
%1
8.0
0%
16
.90
%1
5.9
9%
16
.26
%1
6.4
9%
17
.38
%1
6.4
8%
16
.84
%1
5.5
9%
16
.29
%1
5.8
9%
Turk
men
ista
n--
----
----
----
----
----
----
----
----
----
----
----
----
Tuva
lu--
----
----
----
----
----
----
----
----
----
----
----
----
Uga
nd
a--
----
----
----
----
----
----
----
----
----
----
14
.16
%1
5.4
4%
12
.86
%1
6.1
7%
Ukr
ain
e--
----
----
----
----
----
----
----
----
----
----
----
----
Un
ited
Ara
b E
mir
ates
----
----
----
----
----
----
----
1.8
8%
1.8
6%
1.6
8%
1.8
8%
1.7
8%
1.7
5%
1.6
8%
1.7
8%
1.6
2%
1.5
8%
1.6
1%
Un
ited
Kin
gdo
m4
.77
%4
.96
%4
.90
%4
.76
%4
.54
%4
.35
%4
.27
%3
.87
%3
.77
%3
.78
%3
.74
%3
.63
%3
.67
%4
.02
%3
.85
%3
.43
%3
.64
%3
.40
%3
.52
%3
.43
%3
.09
%3
.09
%2
.88
%2
.86
%2
.63
%
Un
ited
Sta
tes
of
Am
eric
a3
.56
%3
.36
%3
.29
%3
.13
%3
.02
%2
.87
%2
.99
%3
.00
%2
.93
%2
.83
%2
.92
%2
.70
%2
.24
%2
.24
%2
.33
%2
.34
%2
.52
%2
.27
%2
.21
%1
.99
%2
.05
%2
.32
%2
.01
%2
.16
%2
.30
%
Uru
guay
11
.83
%1
1.5
2%
11
.44
%1
1.8
8%
9.7
2%
9.6
3%
10
.02
%1
1.4
7%
10
.41
%1
1.1
1%
9.8
7%
8.7
3%
8.3
7%
10
.34
%8
.64
%7
.95
%6
.63
%6
.71
%6
.79
%5
.31
%4
.90
%6
.70
%6
.90
%7
.55
%8
.20
%
Uzb
ekis
tan
----
----
----
----
----
----
----
----
----
----
----
----
--
Van
uat
u--
----
----
----
----
----
----
----
----
--3
2.7
6%
34
.69
%3
4.0
1%
28
.25
%2
5.8
5%
27
.03
%2
4.6
9%
Ven
ezu
ela
5.9
7%
5.5
9%
5.3
5%
5.4
6%
5.5
5%
5.5
4%
5.7
9%
5.3
8%
5.7
6%
5.6
7%
5.7
2%
5.8
7%
5.9
0%
6.4
5%
6.5
4%
6.3
4%
7.1
0%
6.6
4%
6.5
7%
7.8
1%
8.1
2%
8.1
1%
7.4
8%
7.3
8%
7.4
3%
Vie
t N
am--
----
----
----
----
----
----
----
----
----
----
----
30
.49
%2
9.5
1%
Yem
en--
----
----
----
----
----
----
----
----
----
----
----
----
Zam
bia
6.4
7%
6.0
7%
5.8
3%
5.4
8%
4.6
7%
6.0
8%
4.5
5%
6.0
5%
6.9
9%
6.6
7%
9.2
4%
7.2
9%
5.5
0%
6.5
6%
7.0
0%
5.9
5%
5.6
8%
5.0
1%
6.5
4%
8.9
1%
5.4
4%
5.2
1%
5.0
9%
5.1
2%
5.0
0%
Zim
bab
we
6.7
7%
5.7
1%
7.2
0%
6.5
0%
2.6
9%
5.3
4%
3.7
3%
2.9
5%
3.6
4%
2.7
4%
3.7
2%
2.4
8%
----
----
----
--1
.99
%1
.69
%1
.58
%1
.56
%4
.29
%4
.36
%
Wo
rld
To
tal
7.1
2%
6.9
5%
6.8
1%
6.4
6%
6.2
8%
6.0
6%
6.0
5%
5.8
5%
5.5
7%
5.3
5%
5.2
1%
5.5
1%
5.4
0%
5.5
3%
5.6
4%
5.2
6%
5.2
4%
5.2
6%
5.2
0%
5.1
8%
5.1
6%
5.3
4%
5.1
6%
5.1
9%
5.1
1%
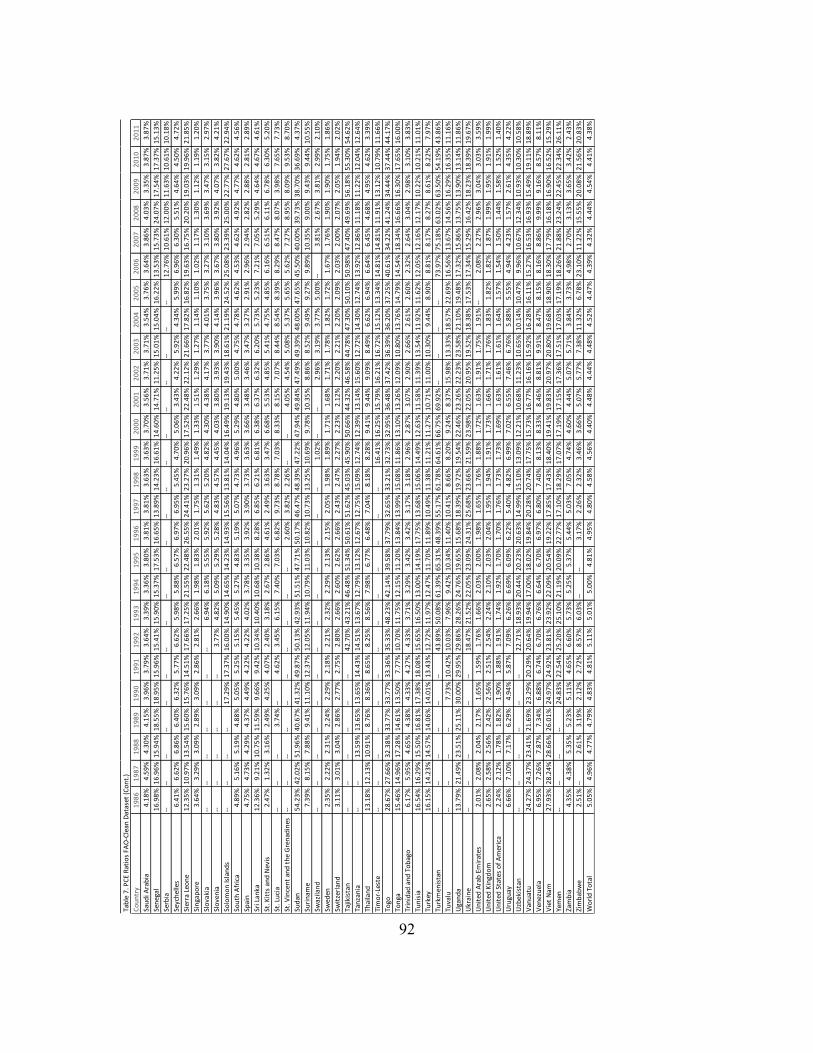
92
Tab
le 7
. PC
E R
atio
s FA
O-C
lean
Dat
aset
(C
on
t.)
Co
un
try
19
86
19
87
19
88
19
89
19
90
19
91
19
92
19
93
19
94
19
95
19
96
19
97
19
98
19
99
20
00
20
01
20
02
20
03
20
04
20
05
20
06
20
07
20
08
20
09
20
10
20
11
Sau
di A
rab
ia4
.18
%4
.59
%4
.30
%4
.15
%3
.96
%3
.79
%3
.64
%3
.39
%3
.36
%3
.80
%3
.81
%3
.81
%3
.63
%3
.63
%3
.70
%3
.56
%3
.71
%3
.71
%3
.54
%3
.76
%3
.64
%3
.86
%4
.03
%3
.35
%3
.87
%3
.87
%
Sen
egal
16
.98
%1
6.9
6%
15
.94
%1
8.5
5%
18
.95
%1
5.9
6%
15
.41
%1
5.9
0%
15
.37
%1
7.5
3%
16
.65
%1
3.8
9%
14
.23
%1
6.6
1%
14
.60
%1
4.7
1%
11
.25
%1
5.0
1%
15
.04
%1
6.2
2%
13
.53
%1
5.7
3%
24
.07
%1
7.5
4%
17
.37
%1
5.1
3%
Serb
ia--
----
----
----
----
----
----
----
----
----
--1
2.7
6%
10
.61
%1
2.0
0%
11
.63
%1
0.6
1%
10
.18
%
Seyc
hel
les
6.4
1%
6.6
2%
6.8
6%
6.4
0%
6.3
2%
5.7
7%
6.6
2%
5.9
8%
5.8
8%
6.5
7%
6.9
7%
6.9
5%
5.4
5%
4.7
0%
5.0
6%
3.4
3%
4.2
2%
5.9
2%
4.3
4%
5.9
9%
6.9
6%
6.3
0%
5.5
1%
4.6
4%
4.5
0%
4.7
2%
Sier
ra L
eon
e1
2.3
5%
10
.97
%1
3.5
4%
15
.60
%1
5.7
6%
14
.51
%1
7.6
6%
17
.25
%2
1.5
5%
22
.48
%2
6.5
5%
24
.41
%2
3.2
7%
20
.96
%1
7.5
2%
22
.48
%2
2.1
2%
21
.66
%1
7.8
2%
16
.82
%1
9.6
3%
16
.75
%2
0.2
0%
19
.03
%1
9.9
6%
21
.85
%
Sin
gap
ore
3.6
4%
3.2
9%
3.0
9%
2.8
9%
3.0
9%
2.8
6%
2.8
1%
2.6
6%
1.9
8%
1.8
3%
2.0
1%
1.7
5%
1.3
1%
1.4
9%
1.3
3%
1.5
1%
1.2
9%
1.2
7%
1.1
4%
1.1
0%
1.0
2%
1.1
7%
1.3
0%
1.1
2%
1.1
9%
1.2
0%
Slo
vaki
a--
----
----
----
6.9
4%
6.1
8%
5.5
5%
5.9
2%
5.6
2%
5.2
0%
4.8
2%
4.3
0%
4.3
8%
4.1
7%
3.7
7%
4.0
1%
3.7
5%
3.2
7%
3.1
0%
3.6
9%
3.4
7%
3.1
5%
2.9
7%
Slo
ven
ia--
----
----
--3
.77
%4
.82
%5
.09
%5
.29
%5
.28
%4
.83
%4
.57
%4
.45
%4
.03
%3
.80
%3
.93
%3
.90
%4
.14
%3
.96
%3
.67
%3
.80
%3
.92
%4
.07
%3
.82
%4
.21
%
Solo
mo
n Is
lan
ds
----
----
17
.29
%1
7.3
7%
16
.00
%1
4.9
0%
14
.65
%1
4.2
3%
14
.93
%1
5.5
6%
13
.81
%1
4.0
4%
16
.49
%1
9.1
3%
19
.43
%1
8.6
1%
21
.19
%2
4.5
2%
25
.08
%2
3.3
9%
25
.00
%2
2.7
7%
27
.67
%2
2.9
4%
Sou
th A
fric
a4
.89
%5
.16
%5
.19
%4
.88
%5
.05
%5
.25
%5
.15
%5
.45
%5
.27
%4
.83
%5
.19
%5
.07
%4
.73
%4
.96
%5
.29
%4
.80
%5
.00
%4
.75
%4
.78
%4
.62
%4
.53
%4
.62
%4
.92
%4
.77
%4
.62
%4
.56
%
Spai
n4
.75
%4
.73
%4
.29
%4
.37
%4
.49
%4
.22
%4
.22
%4
.02
%3
.78
%3
.35
%3
.92
%3
.90
%3
.73
%3
.63
%3
.66
%3
.48
%3
.46
%3
.47
%3
.27
%2
.91
%2
.96
%2
.94
%2
.82
%2
.88
%2
.81
%2
.89
%
Sri L
anka
12
.36
%9
.21
%1
0.7
5%
11
.59
%9
.66
%9
.42
%1
0.3
4%
10
.40
%1
0.6
8%
10
.38
%8
.28
%6
.85
%6
.21
%6
.81
%6
.38
%6
.37
%6
.32
%6
.20
%5
.73
%5
.23
%7
.21
%7
.05
%5
.29
%4
.64
%4
.67
%4
.61
%
St. K
itts
an
d N
evis
2.4
7%
1.3
2%
3.1
6%
2.4
9%
4.2
5%
4.0
7%
2.4
0%
3.1
8%
2.6
7%
2.8
6%
4.6
1%
2.4
9%
3.6
3%
3.4
7%
6.6
8%
5.5
3%
4.8
5%
5.4
1%
4.7
5%
4.8
5%
6.1
6%
6.5
1%
6.1
1%
6.7
8%
6.3
0%
5.2
0%
St. L
uci
a--
----
3.7
4%
--4
.62
%3
.45
%6
.15
%7
.40
%7
.03
%6
.82
%9
.73
%8
.78
%7
.03
%8
.33
%8
.15
%7
.07
%8
.44
%8
.54
%8
.39
%8
.29
%8
.47
%8
.07
%3
.98
%7
.65
%7
.73
%
St. V
ince
nt
and
th
e G
ren
adin
es--
----
----
----
----
--2
.60
%3
.82
%2
.26
%--
--4
.05
%4
.54
%5
.08
%5
.37
%5
.65
%5
.62
%7
.27
%8
.95
%8
.09
%9
.53
%8
.70
%
Sud
an5
4.2
3%
42
.02
%5
1.9
6%
40
.67
%4
1.3
2%
49
.87
%5
0.1
3%
42
.93
%5
1.5
1%
47
.71
%5
0.1
7%
46
.47
%4
8.3
9%
47
.22
%4
7.9
4%
49
.84
%4
7.4
9%
49
.39
%4
8.0
0%
47
.65
%4
5.5
0%
40
.00
%3
9.7
3%
38
.70
%3
6.6
9%
4.3
7%
Suri
nam
e7
.39
%8
.15
%7
.88
%9
.41
%1
1.1
0%
12
.37
%1
2.0
5%
11
.94
%1
0.7
9%
11
.03
%1
0.8
2%
10
.73
%1
3.2
5%
10
.69
%9
.78
%1
0.3
5%
8.8
6%
8.5
2%
9.4
9%
9.2
7%
9.8
9%
10
.35
%9
.00
%9
.43
%9
.44
%1
0.5
5%
Swaz
ilan
d--
----
----
----
----
----
----
1.0
2%
----
2.9
6%
3.1
9%
3.7
7%
5.0
0%
--3
.81
%2
.67
%3
.81
%2
.99
%2
.10
%
Swed
en2
.35
%2
.22
%2
.31
%2
.24
%2
.29
%2
.18
%2
.21
%2
.32
%2
.29
%2
.13
%2
.15
%2
.05
%1
.98
%1
.89
%1
.71
%1
.68
%1
.71
%1
.78
%1
.82
%1
.72
%1
.67
%1
.76
%1
.90
%1
.90
%1
.75
%1
.86
%
Swit
zerl
and
3.1
1%
3.0
1%
3.0
4%
2.8
6%
2.7
7%
2.7
5%
2.8
0%
2.6
6%
2.6
0%
2.6
2%
2.6
6%
2.4
3%
2.4
7%
2.2
7%
2.2
3%
2.1
2%
2.2
0%
2.2
1%
2.2
0%
2.0
9%
2.0
3%
2.0
0%
2.0
7%
2.0
5%
1.9
4%
2.0
2%
Tajik
ista
n--
----
----
--4
2.7
0%
43
.21
%4
6.4
8%
51
.34
%5
0.6
1%
51
.62
%4
5.0
3%
45
.90
%5
0.6
6%
44
.32
%4
6.5
8%
44
.78
%4
7.3
0%
50
.10
%5
0.9
8%
47
.40
%4
9.6
9%
56
.18
%5
5.3
0%
54
.62
%
Tan
zan
ia--
--1
3.5
9%
13
.65
%1
3.6
5%
14
.43
%1
4.5
1%
13
.67
%1
2.7
9%
13
.12
%1
2.6
7%
12
.75
%1
5.0
9%
12
.74
%1
2.3
9%
13
.14
%1
5.6
0%
12
.72
%1
4.3
0%
12
.74
%1
3.9
2%
12
.86
%1
1.1
8%
11
.22
%1
2.0
4%
12
.64
%
Thai
lan
d1
3.1
8%
12
.13
%1
0.9
1%
8.7
6%
8.3
6%
8.6
5%
8.2
5%
8.5
6%
7.9
8%
6.7
7%
6.4
8%
7.0
4%
8.1
8%
8.2
8%
9.4
1%
9.4
4%
9.0
9%
8.4
9%
6.6
2%
6.9
4%
6.6
4%
6.4
5%
4.6
8%
4.9
5%
4.6
2%
3.3
9%
Tim
or-
Lest
e--
----
----
----
----
----
----
16
.41
%1
6.2
5%
15
.79
%1
6.2
1%
16
.72
%1
5.1
2%
13
.34
%1
4.8
1%
14
.81
%1
1.9
1%
13
.12
%1
0.7
9%
11
.66
%
Togo
28
.67
%2
7.6
6%
32
.38
%3
3.7
7%
33
.77
%3
3.3
6%
35
.33
%4
8.2
3%
42
.14
%3
9.5
8%
37
.79
%3
2.6
5%
33
.21
%3
2.7
3%
32
.95
%3
6.4
8%
37
.42
%3
6.3
9%
36
.20
%3
7.2
5%
40
.61
%3
4.2
2%
41
.24
%3
4.4
4%
37
.44
%4
4.1
7%
Ton
ga1
5.4
6%
14
.96
%1
7.2
8%
14
.61
%1
3.5
0%
7.7
7%
10
.70
%1
1.7
5%
12
.15
%1
1.2
0%
13
.84
%1
3.9
9%
15
.08
%1
1.8
6%
13
.10
%1
3.2
6%
12
.09
%1
0.8
0%
13
.76
%1
4.7
9%
14
.54
%1
8.3
4%
16
.66
%1
6.3
0%
17
.65
%1
6.0
0%
Trin
idad
an
d T
ob
ago
6.1
7%
5.9
5%
4.6
5%
4.3
8%
4.3
3%
4.2
7%
4.3
3%
3.7
1%
3.2
9%
3.4
2%
3.4
2%
3.1
7%
3.1
8%
2.9
6%
2.8
7%
3.0
7%
2.9
0%
2.6
6%
2.6
1%
2.6
0%
2.3
2%
2.6
4%
3.0
4%
2.9
8%
3.1
0%
3.8
3%
Tun
isia
16
.54
%1
6.2
9%
15
.50
%1
6.8
1%
17
.38
%1
8.0
8%
15
.65
%1
6.5
0%
13
.00
%1
4.1
9%
17
.75
%1
3.6
8%
15
.06
%1
4.4
9%
12
.63
%1
1.5
8%
11
.39
%1
3.5
4%
11
.92
%1
1.6
2%
12
.05
%1
2.1
6%
12
.17
%1
0.2
2%
10
.21
%1
1.0
1%
Turk
ey1
6.1
5%
14
.23
%1
4.5
7%
14
.06
%1
4.0
1%
13
.43
%1
2.7
2%
11
.97
%1
2.4
7%
11
.70
%1
1.8
9%
10
.49
%1
1.3
8%
11
.21
%1
1.2
7%
10
.71
%1
1.0
0%
10
.30
%9
.44
%8
.90
%8
.81
%8
.17
%8
.27
%8
.61
%8
.22
%7
.97
%
Turk
men
ista
n--
----
----
--4
3.8
9%
50
.08
%6
1.3
9%
65
.31
%4
8.3
9%
55
.17
%6
1.7
8%
64
.61
%6
6.7
5%
69
.92
%--
----
--7
3.9
7%
75
.18
%6
3.0
2%
63
.50
%5
4.1
9%
43
.86
%
Tuva
lu--
----
--7
.73
%1
0.4
2%
10
.03
%7
.96
%9
.42
%1
0.3
4%
11
.40
%1
0.4
1%
8.6
6%
8.2
0%
9.2
4%
8.3
7%
15
.98
%1
3.3
3%
18
.57
%2
2.6
9%
16
.56
%1
3.6
7%
14
.56
%1
6.2
9%
16
.35
%1
1.1
6%
Uga
nd
a1
3.7
9%
21
.49
%2
3.5
1%
25
.11
%3
0.0
0%
29
.95
%2
9.8
6%
28
.26
%2
4.7
6%
19
.65
%1
5.6
8%
18
.39
%1
9.7
2%
19
.54
%2
2.4
6%
23
.26
%2
2.2
3%
23
.58
%2
1.1
0%
19
.48
%1
7.3
2%
15
.86
%1
3.7
5%
13
.90
%1
3.1
4%
11
.86
%
Ukr
ain
e--
----
----
--1
8.4
7%
21
.52
%2
2.0
5%
23
.09
%2
4.3
1%
25
.68
%2
3.6
6%
21
.59
%2
3.9
8%
22
.05
%2
0.9
5%
19
.52
%1
8.3
8%
17
.53
%1
7.3
4%
15
.29
%1
6.4
2%
18
.23
%1
8.3
9%
19
.67
%
Un
ited
Ara
b E
mir
ates
2.0
1%
2.0
8%
2.0
4%
2.1
7%
1.6
5%
1.5
9%
1.7
6%
1.6
6%
2.0
3%
2.0
0%
1.9
8%
1.6
5%
1.7
6%
1.8
8%
1.7
2%
1.6
3%
1.9
1%
1.7
5%
1.9
1%
--2
.08
%2
.27
%2
.96
%3
.04
%3
.03
%3
.59
%
Un
ited
Kin
gdo
m2
.65
%2
.58
%2
.56
%2
.42
%2
.56
%2
.51
%2
.54
%2
.24
%2
.10
%2
.03
%2
.04
%1
.95
%1
.94
%1
.91
%1
.73
%1
.66
%1
.71
%1
.76
%1
.83
%1
.82
%1
.82
%1
.87
%1
.99
%1
.95
%1
.91
%1
.99
%
Un
ited
Sta
tes
of
Am
eric
a2
.24
%2
.12
%1
.78
%1
.82
%1
.90
%1
.88
%1
.91
%1
.74
%1
.92
%1
.70
%1
.70
%1
.76
%1
.73
%1
.73
%1
.69
%1
.63
%1
.61
%1
.61
%1
.64
%1
.57
%1
.54
%1
.50
%1
.44
%1
.58
%1
.52
%1
.40
%
Uru
guay
6.6
6%
7.1
0%
7.1
7%
6.2
9%
4.9
4%
5.8
7%
7.0
9%
6.2
6%
6.6
9%
6.0
9%
6.2
2%
5.4
0%
4.8
2%
6.9
9%
7.0
2%
6.5
5%
7.4
6%
6.7
6%
5.8
8%
5.5
5%
4.9
4%
4.2
3%
1.5
7%
2.6
1%
4.3
5%
4.2
2%
Uzb
ekis
tan
----
----
----
22
.71
%1
8.9
3%
20
.44
%2
0.2
3%
20
.63
%1
4.9
9%
15
.10
%1
3.0
9%
12
.21
%1
0.6
8%
11
.23
%1
0.6
5%
10
.14
%1
0.4
7%
9.9
6%
10
.67
%1
2.3
4%
10
.93
%1
0.3
0%
10
.58
%
Van
uat
u2
4.2
7%
24
.37
%2
3.4
1%
21
.69
%2
3.2
9%
20
.29
%2
0.6
4%
19
.94
%1
7.0
0%
18
.02
%1
9.8
4%
20
.28
%2
0.7
4%
17
.75
%1
5.7
3%
16
.77
%1
6.1
6%
15
.92
%1
6.2
8%
16
.11
%1
5.2
7%
16
.53
%1
6.9
3%
15
.49
%1
9.1
1%
18
.89
%
Ven
ezu
ela
6.9
5%
7.2
6%
7.8
7%
7.3
4%
6.8
8%
6.7
4%
6.7
0%
6.7
6%
6.6
4%
6.7
0%
6.9
7%
6.8
0%
7.4
0%
8.1
3%
8.3
3%
8.4
6%
8.8
1%
9.9
1%
8.4
7%
8.1
5%
8.1
6%
8.8
6%
9.9
9%
9.1
6%
8.5
7%
8.1
1%
Vie
t N
am2
7.9
3%
28
.24
%2
8.6
6%
26
.01
%2
4.9
7%
24
.92
%2
3.8
1%
23
.92
%2
2.0
9%
20
.54
%1
9.2
2%
17
.85
%1
7.4
3%
18
.40
%1
9.4
1%
19
.83
%2
0.9
7%
20
.80
%1
9.6
8%
18
.90
%1
8.3
0%
17
.79
%1
6.1
8%
16
.90
%1
6.5
2%
15
.29
%
Yem
en--
----
--2
4.8
3%
22
.54
%2
5.2
0%
25
.10
%2
1.1
9%
20
.09
%2
2.7
7%
17
.10
%1
8.2
9%
17
.07
%1
7.1
9%
17
.15
%1
7.3
6%
17
.51
%1
7.0
3%
17
.19
%1
8.2
6%
21
.88
%2
3.2
4%
22
.45
%2
2.3
4%
26
.11
%
Zam
bia
4.3
5%
4.3
8%
5.3
5%
5.2
3%
5.1
1%
4.6
5%
6.6
0%
5.7
3%
5.2
5%
5.3
7%
5.4
4%
5.0
3%
7.0
5%
4.7
4%
4.6
0%
4.4
4%
5.0
7%
5.7
1%
3.8
4%
3.7
3%
4.9
8%
2.7
0%
3.1
3%
3.6
5%
3.4
2%
2.4
3%
Zim
bab
we
2.5
1%
--2
.61
%3
.19
%2
.12
%2
.72
%8
.57
%6
.03
%--
--3
.17
%2
.26
%2
.32
%3
.46
%3
.66
%5
.07
%5
.77
%7
.38
%1
1.3
2%
6.7
8%
23
.10
%1
1.2
2%
15
.55
%2
0.0
8%
21
.56
%2
0.8
3%
Wo
rld
To
tal
5.0
5%
4.9
6%
4.7
7%
4.7
9%
4.8
3%
4.8
1%
5.1
1%
5.0
1%
5.0
0%
4.8
1%
4.9
5%
4.8
0%
4.5
8%
4.5
6%
4.4
0%
4.4
8%
4.4
4%
4.4
8%
4.5
2%
4.4
7%
4.3
9%
4.3
2%
4.4
4%
4.5
4%
4.4
1%
4.3
8%
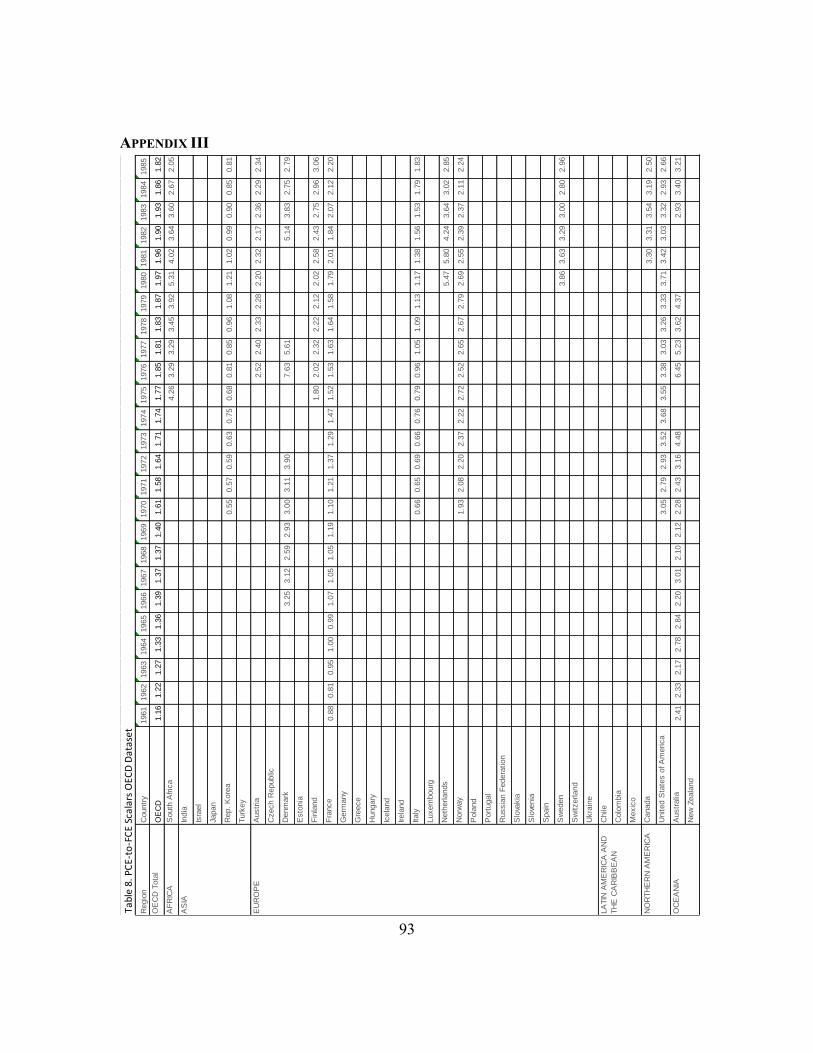
93
APPENDIX III
Tab
le 8
. PC
E-to
-FC
E Sc
alar
s O
ECD
Dat
aset
Regio
nC
ountr
y1961
1962
1963
1964
1965
1966
1967
1968
1969
1970
1971
1972
1973
1974
1975
1976
1977
1978
1979
1980
1981
1982
1983
1984
1985
OE
CD
Tota
lO
EC
D1.1
61.2
21.2
71.3
31.3
61.3
91.3
71.3
71.4
01.6
11.5
81.6
41.7
11.7
41.7
71.8
51.8
11.8
31.8
71.9
71.9
61.9
01.9
31.8
61.8
2
AF
RIC
AS
outh
Afric
a4.2
63.2
93.2
93.4
53.9
25.3
14.0
23.6
43.6
02.6
72.0
5
India
Isra
el
Japan
Rep.
Kore
a0.5
50.5
70.5
90.6
30.7
50.6
80.8
10.8
50.9
61.0
81.2
11.0
20.9
90.9
00.8
50.8
1
Turk
ey
Austr
ia2.5
22.4
02.3
32.2
82.2
02.3
22.1
72.3
62.2
92.3
4
Czech R
epublic
Denm
ark
3.2
53.1
22.5
92.9
33.0
03.1
13.9
07.6
35.6
15.1
43.8
32.7
52.7
9
Esto
nia
Fin
land
1.8
02.0
22.3
22.2
22.1
22.0
22.5
82.4
32.7
52.9
63.0
6
Fra
nce
0.8
80.8
10.9
51.0
00.9
91.0
71.0
51.0
51.1
91.1
01.2
11.3
71.2
91.4
71.5
21.5
31.6
31.6
41.5
81.7
92.0
11.8
42.0
72.1
22.2
0
Germ
any
Gre
ece
Hungary
Icela
nd
Irela
nd
Italy
0.6
60.6
50.6
90.6
60.7
60.7
90.9
61.0
51.0
91.1
31.1
71.3
81.5
61.5
31.7
91.8
3
Luxem
bourg
Neth
erlands
5.4
75.8
04.2
43.6
43.0
22.8
5
Norw
ay
1.9
32.0
82.2
02.3
72.2
22.7
22.5
22.6
52.6
72.7
92.6
92.5
52.3
92.3
72.1
12.2
4
Pola
nd
Port
ugal
Russia
n F
edera
tion
Slo
vakia
Slo
venia
Spain
Sw
eden
3.8
63.6
33.2
93.0
02.8
02.9
6
Sw
itzerland
Ukra
ine
Chile
Colo
mbia
Mexic
o
Canada
3.3
03.3
13.5
43.1
92.5
0
United S
tate
s o
f A
merica
3.0
52.7
92.9
33.5
23.6
83.5
53.3
83.0
33.2
63.3
33.7
13.4
23.0
33.3
22.9
32.6
6
Austr
alia
2.4
12.3
32.1
72.7
82.8
42.2
03.0
12.1
02.1
22.2
82.4
33.1
64.4
86.4
55.2
33.6
24.3
72.9
33.4
03.2
1
New
Zeala
nd
AS
IA
EU
RO
PE
LA
TIN
AM
ER
ICA
AN
D
TH
E C
AR
IBB
EA
N
NO
RTH
ER
N A
ME
RIC
A
OC
EA
NIA

94
Tab
le 8
. PC
E-to
-FC
E Sc
alar
s O
ECD
Dat
aset
Regio
nC
ountr
y1986
1987
1988
1989
1990
1991
1992
1993
1994
1995
1996
1997
1998
1999
2000
2001
2002
2003
2004
2005
2006
2007
2008
2009
2010
2011
OE
CD
Tota
lO
EC
D1.8
41.8
81.9
81.9
82.0
02.0
51.8
81.8
92.2
22.3
32.1
72.0
82.1
12.1
32.0
62.0
02.0
52.2
92.5
12.5
52.5
72.7
32.8
82.7
42.7
62.8
9
AF
RIC
AS
outh
Afric
a2.5
23.0
12.9
83.0
43.4
03.5
44.0
63.5
13.6
54.1
53.3
43.4
13.2
32.7
72.2
92.0
91.8
22.7
83.3
23.4
93.4
63.4
02.9
43.2
13.8
14.0
1
India
1.1
71.2
31.2
11.3
91.3
91.4
0
Isra
el
2.8
23.0
33.3
73.4
73.6
33.5
7
Japan
4.3
24.6
73.9
43.5
83.6
14.0
03.9
83.6
13.3
93.5
93.6
53.3
03.1
12.8
93.0
53.4
13.6
23.5
7
Rep.
Kore
a0.8
10.9
21.0
31.2
01.3
01.3
81.2
31.2
81.3
81.4
11.3
01.1
40.8
11.0
41.1
21.0
11.1
21.2
21.2
41.3
81.4
61.4
81.2
11.1
41.4
11.5
0
Turk
ey
1.5
81.4
61.3
71.1
31.2
31.6
51.9
62.2
62.1
72.6
32.8
32.4
82.8
62.7
5
Austr
ia2.2
02.1
52.1
32.2
52.1
82.2
22.2
72.3
02.1
82.0
42.1
32.0
92.1
22.0
41.9
31.8
82.0
72.4
22.5
92.6
22.7
22.8
23.1
62.9
22.8
62.7
7
Czech R
epublic
1.0
31.1
61.2
71.2
81.2
41.3
31.2
71.2
41.2
51.4
61.7
51.6
91.8
42.0
02.1
62.6
12.2
32.3
12.5
2
Denm
ark
4.2
94.5
13.6
63.9
03.7
74.7
75.5
76.0
1
Esto
nia
0.8
40.8
21.0
71.0
31.1
61.0
21.1
01.3
21.4
11.6
81.9
41.9
32.2
32.7
52.2
42.1
82.4
2
Fin
land
2.8
93.0
62.8
82.8
32.8
63.0
73.1
63.3
23.1
52.9
22.5
92.5
22.6
22.5
72.3
12.4
12.4
32.8
63.0
62.8
73.0
13.1
73.3
53.0
93.0
83.1
6
Fra
nce
2.2
12.2
22.4
42.5
42.6
12.6
52.4
82.6
72.6
32.6
92.5
52.5
32.5
22.4
42.1
42.1
92.2
93.0
73.0
73.1
53.2
63.6
64.0
13.4
93.5
33.8
2
Germ
any
2.6
72.7
93.0
92.9
72.8
72.7
92.8
72.8
82.8
82.6
02.6
12.7
43.2
43.3
43.4
03.5
03.7
84.1
73.9
43.9
74.1
0
Gre
ece
1.5
81.5
71.8
01.9
21.9
72.0
72.0
5
Hungary
2.0
91.6
81.6
21.5
71.4
01.3
51.3
41.7
02.3
71.9
32.2
02.2
14.0
43.5
73.0
34.1
44.6
0
Icela
nd
2.8
12.6
52.7
42.4
22.2
02.2
82.2
52.2
02.2
32.3
22.1
51.8
61.9
52.0
32.1
22.1
81.9
82.0
21.6
91.5
31.7
31.6
9
Irela
nd
5.0
92.3
82.1
22.0
72.5
41.6
31.9
02.5
54.4
74.3
02.8
92.7
53.5
4
Italy
1.8
81.8
11.9
41.9
32.1
51.9
92.1
12.2
62.3
12.3
92.4
22.4
62.5
22.4
12.2
12.2
42.4
42.9
32.8
72.9
63.1
23.4
03.5
93.3
43.3
03.3
1
Luxem
bourg
1.5
81.6
61.7
01.6
41.6
11.6
61.6
51.7
11.6
31.6
61.6
41.7
4
Neth
erlands
3.4
04.0
03.4
94.8
04.5
23.2
53.2
13.9
0
Norw
ay
2.6
02.9
33.0
02.8
13.0
93.3
33.6
13.0
73.0
23.3
93.2
83.1
73.1
13.0
83.0
32.9
33.1
53.4
43.3
53.4
73.3
83.3
73.2
73.4
23.4
53.5
0
Pola
nd
1.8
41.9
31.9
81.8
21.7
01.7
41.9
41.9
82.1
62.4
23.0
13.3
63.5
34.3
43.3
13.7
33.9
6
Port
ugal
1.5
51.5
01.6
81.8
21.7
01.6
11.6
91.7
82.1
52.1
02.1
82.2
12.3
42.4
82.4
02.1
92.3
0
Russia
n F
edera
tion
1.7
11.9
22.1
92.7
23.1
42.8
23.3
43.3
5
Slo
vakia
1.6
51.4
81.6
91.8
72.0
82.0
51.9
92.1
92.8
02.7
52.7
33.0
13.4
03.1
03.2
53.2
23.5
3
Slo
venia
1.1
61.2
31.4
21.5
81.6
41.5
91.7
11.7
92.2
02.1
82.1
32.1
92.3
22.4
72.4
42.5
12.4
3
Spain
2.4
02.0
31.9
61.9
61.9
51.6
81.7
41.8
92.2
62.5
92.8
52.7
93.0
13.4
33.1
43.1
33.1
9
Sw
eden
3.4
34.0
23.9
83.9
24.2
74.5
14.3
53.2
23.2
53.6
43.5
33.1
83.0
52.9
62.8
42.6
32.7
93.1
83.2
43.2
43.2
93.3
63.3
43.1
43.4
13.4
8
Sw
itzerland
2.2
62.2
62.2
42.1
92.3
92.7
22.4
92.2
72.1
82.2
72.0
02.1
22.2
12.5
42.6
32.6
62.6
12.6
22.8
52.9
63.0
93.3
4
Ukra
ine
0.2
40.2
30.2
20.2
40.2
50.2
10.2
10.2
30.2
60.3
00.3
00.3
00.3
70.3
30.2
70.2
70.2
6
Chile
4.6
05.7
36.0
66.5
0
Colo
mbia
2.0
01.7
71.7
21.5
01.6
92.1
32.0
42.3
62.6
32.6
53.0
03.2
0
Mexic
o3.2
73.3
53.6
63.6
03.6
73.7
63.5
73.9
54.3
2
Canada
2.2
62.5
43.2
02.7
52.7
62.8
72.8
22.3
42.1
52.2
32.3
62.2
71.9
71.8
82.0
52.2
52.1
72.2
72.4
72.5
12.7
43.0
43.2
32.8
53.1
63.4
0
United S
tate
s o
f A
merica
2.7
02.7
63.2
23.1
23.0
23.0
42.8
43.0
42.7
13.0
12.9
32.7
32.6
92.6
62.6
82.8
02.7
82.7
72.7
12.7
92.8
22.9
23.1
22.8
92.9
53.2
7
Austr
alia
2.8
22.7
83.1
23.7
33.8
63.6
32.8
32.6
63.8
42.9
83.8
23.6
82.3
62.2
12.1
81.8
62.6
42.3
14.0
13.1
94.8
43.9
74.4
73.7
95.5
36.2
1
New
Zeala
nd
2.5
73.3
25.5
94.7
64.2
14.5
53.4
13.3
04.3
75.3
55.8
92.4
52.3
82.2
02.4
52.5
94.4
1
OC
EA
NIA
AS
IA
EU
RO
PE
LA
TIN
AM
ER
ICA
AN
D
TH
E C
AR
IBB
EA
N
NO
RTH
ER
N A
ME
RIC
A

95
Table 9. PCE-to-FCE Scalars Non-OECD
Region Country 2000 2001 2002 2003 2004 2005 2006 2007 2008 2009 2010
Algeria 1.25 1.22 1.18 1.14 1.19 1.20 1.20 1.30 1.30 1.27 1.35
Cameroon 1.10 1.09 1.20 1.48 1.50 1.31 1.27 1.32 1.43 1.26 1.19
Egypt 2.22 2.12 1.78 1.45 1.52 1.60 1.63 1.81 2.03 2.59 2.75
Kenya 1.55 1.31 1.26 1.37 1.34 1.26 1.40 1.57 1.75 1.58 1.60
Morocco 1.50 1.32 1.29 1.44 1.47 1.65 1.49 1.80 1.86 1.74 1.77
Nigeria 0.26 0.35 0.38 0.41 0.48 0.46 0.52 0.55 0.52 0.53
Tunisia 1.49 1.56 1.65 1.54 1.81 1.77 1.68 1.72 1.84 2.06 2.01
Azerbaijan 1.80 1.58 1.56 1.57 1.61 1.72 2.12 2.63 3.30 3.61 3.64
Bahrain 2.27 1.81 1.71 1.89 1.92 1.73 2.46 2.19 1.86 1.98 1.53
China 0.51 0.51 0.50 0.51 0.52 0.52 0.54 0.62 0.73 0.76 0.80
Georgia 1.41 1.22 1.02 1.03 1.30 1.25 2.28 2.05 2.42 2.82 2.92
Indonesia 1.74 1.58 1.82 1.86 1.74 1.62 1.82 2.00 2.17 2.03 2.42
Iran 0.86 0.82 0.84 0.82 0.96 0.98 1.04 1.19 1.66 1.51 1.66
Jordan 2.48 2.71 2.50 2.52 2.38 2.92 3.03 2.84 2.62 3.06 3.25
Kazakhstan 1.64 1.36 1.31 1.60 1.85 1.89 2.15 2.66 3.93 2.55 3.14
Kuwait 1.65 1.69 2.77 2.67 2.42 2.35 2.24 2.29 2.37 2.74 2.91
Malaysia 0.90 0.83 0.84 0.80 0.75 0.74 0.74 0.82 0.85 0.80 0.88
Pakistan 1.31 1.24 1.28 1.31 1.38 1.41 1.49 1.54 1.53 1.66 1.93
Philippines 1.80 1.60 1.60 1.56 1.57 1.68 1.85 1.98 2.03 2.07 2.29
Qatar 0.91 0.87 0.95 1.00 1.93 1.64 1.71 1.79 1.53 1.78 1.57
Saudi Arabia 1.81 1.85 1.76 1.67 1.70 1.62 1.74 1.78 1.78 2.26 2.02
Singapore 2.35 2.08 2.45 2.52 2.74 2.83 2.98 2.64 2.61 2.94 2.74
Thailand 1.54 1.42 1.51 1.71 2.21 2.15 2.39 2.59 3.84 3.53 4.01
Turkmenistan 0.23 0.39 0.66 0.37 0.39 0.29 0.34
United Arab Emirates 2.17 2.23 2.15 2.29 2.41 2.83 2.55 2.00 2.31 2.55
Uzbekistan 3.20 2.76 1.96 1.79 1.78 1.67 2.06 2.04 1.75 2.28 2.46
Viet Nam 1.32 1.20 1.11 1.12 1.17 1.23 1.31 1.45 1.95 1.83 1.85
Belarus 0.94 1.06 1.17 1.21 1.25 1.58 1.71 1.99 2.32 2.10 2.39
Bosnia and Herzegovina 2.07 1.83 1.88 2.40 1.93 1.87 2.03 2.26 2.34 2.29 2.30
Bulgaria 0.98 1.05 1.25 1.74 1.64 2.06 1.98 2.68 2.45 2.46 2.53
Croatia 1.78 1.86 2.02 2.79 2.68 3.23 3.18 3.29 3.34 3.23 3.36
Latvia 1.32 1.35 1.33 1.34 1.80 1.90 2.12 2.32 2.53 2.37 1.97
Lithuania 1.65 2.03 1.89 2.35 2.93 3.19 4.08 4.58 5.11 3.88 4.38
Macedonia 1.09 1.15 1.33 1.65 1.59 1.83 1.84 1.66 2.31 2.19 2.21
Romania 0.87 0.82 0.93 1.01 1.12 1.44 1.61 2.24 2.21 1.83 1.96
Ukraine 0.65 0.79 0.84 0.92 1.02 1.42 1.63 2.22 2.60 1.87 1.92
Argentina 3.64 3.21 1.14 1.40 1.73 1.71 1.93 2.45 5.54 5.53 3.76
Bolivia 1.83 1.78 1.60 1.42 1.63 1.42 1.53 1.61 1.90 1.97 2.03
Brazil 2.27 1.90 1.65 1.78 2.11 2.89 3.46 4.10 4.70 4.68 6.24
Costa Rica 3.30 2.72 2.68 2.81 2.88 3.01 2.31 3.12 4.03 4.05 4.76
Dominican Republic 3.63 3.17 2.98 2.52 2.66 3.45 3.16 3.25 3.43 3.41 3.64
Ecuador 1.17 1.47 1.61 1.76 1.57 1.70 1.67 1.58 1.64 1.97 1.73
Peru 2.89 2.85 2.85 2.93 3.22 3.15 3.23 3.32 3.65 3.64 4.08
Uruguay 2.51 2.52 1.68 1.73 2.18 2.53 3.04 3.85 5.08 5.01 4.81
Venezuela 1.66 1.74 1.37 1.28 1.50 1.68 1.88 2.14 2.42 3.39 3.85
Date
AFRICA
ASIA
EUROPE
LATIN AMERICA AND THE CARIBBEAN
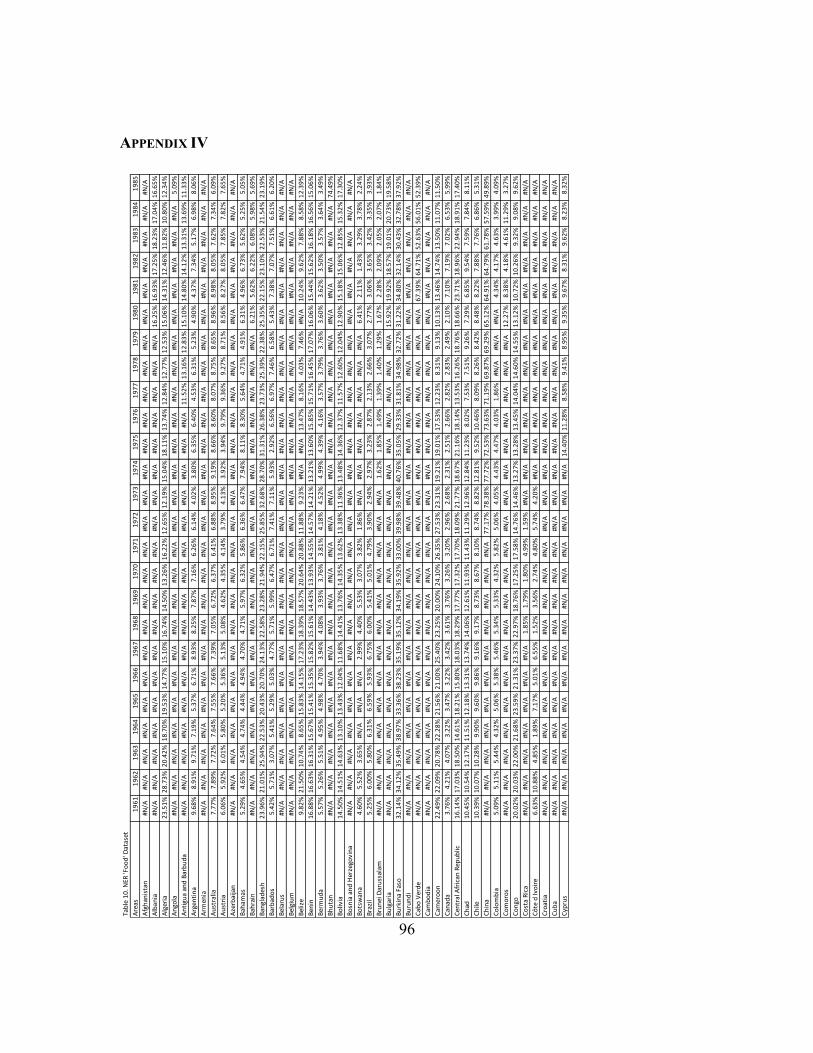
96
APPENDIX IV
Tab
le 1
0. N
ER 'F
oo
d' D
atas
et
Are
as
19
61
19
62
19
63
19
64
19
65
19
66
19
67
19
68
19
69
19
70
19
71
19
72
19
73
19
74
19
75
19
76
19
77
19
78
19
79
19
80
19
81
19
82
19
83
19
84
19
85
Afg
han
ista
n#N
/A#N
/A#N
/A#N
/A#N
/A#N
/A#N
/A#N
/A#N
/A#N
/A#N
/A#N
/A#N
/A#N
/A#N
/A#N
/A#N
/A#N
/A#N
/A#N
/A#N
/A#N
/A#N
/A#N
/A#N
/A
Alb
ania
#N/A
#N/A
#N/A
#N/A
#N/A
#N/A
#N/A
#N/A
#N/A
#N/A
#N/A
#N/A
#N/A
#N/A
#N/A
#N/A
#N/A
#N/A
#N/A
16
.25
%1
6.9
3%
17
.25
%1
8.2
3%
17
.04
%1
6.6
5%
Alg
eria
23
.51
%2
8.7
3%
20
.42
%1
8.7
0%
19
.53
%1
4.7
7%
15
.10
%1
6.7
4%
14
.50
%1
3.2
6%
16
.22
%1
2.6
5%
12
.19
%1
5.0
4%
18
.11
%1
3.7
4%
12
.84
%1
2.7
7%
12
.53
%1
5.0
6%
14
.31
%1
2.4
6%
11
.82
%1
0.8
0%
12
.34
%
An
gola
#N/A
#N/A
#N/A
#N/A
#N/A
#N/A
#N/A
#N/A
#N/A
#N/A
#N/A
#N/A
#N/A
#N/A
#N/A
#N/A
#N/A
#N/A
#N/A
#N/A
#N/A
#N/A
#N/A
#N/A
5.0
9%
An
tigu
a an
d B
arb
ud
a#N
/A#N
/A#N
/A#N
/A#N
/A#N
/A#N
/A#N
/A#N
/A#N
/A#N
/A#N
/A#N
/A#N
/A#N
/A#N
/A1
1.5
2%
13
.16
%1
2.8
3%
15
.10
%1
4.8
0%
14
.12
%1
3.3
1%
13
.69
%1
1.3
3%
Arg
enti
na
9.6
8%
8.9
1%
9.7
1%
7.1
9%
5.3
7%
6.7
1%
8.9
3%
8.2
5%
7.8
7%
7.1
6%
6.2
6%
6.1
4%
4.0
2%
3.8
0%
6.3
5%
6.4
0%
4.5
3%
6.3
1%
5.2
3%
4.9
0%
4.3
7%
7.3
4%
5.1
7%
6.9
8%
8.0
6%
Arm
enia
#N/A
#N/A
#N/A
#N/A
#N/A
#N/A
#N/A
#N/A
#N/A
#N/A
#N/A
#N/A
#N/A
#N/A
#N/A
#N/A
#N/A
#N/A
#N/A
#N/A
#N/A
#N/A
#N/A
#N/A
#N/A
Au
stra
lia7
.77
%7
.89
%7
.72
%7
.64
%7
.55
%7
.66
%7
.39
%7
.05
%6
.72
%6
.37
%6
.41
%6
.88
%8
.95
%9
.19
%8
.66
%8
.60
%8
.07
%8
.75
%8
.65
%8
.96
%8
.98
%8
.05
%7
.62
%7
.34
%6
.09
%
Au
stri
a6
.06
%5
.92
%6
.01
%5
.80
%5
.20
%5
.36
%5
.13
%5
.08
%4
.62
%4
.35
%4
.14
%3
.79
%4
.13
%3
.92
%3
.94
%9
.79
%9
.36
%9
.27
%8
.71
%8
.56
%8
.27
%8
.05
%7
.85
%7
.82
%7
.65
%
Aze
rbai
jan
#N/A
#N/A
#N/A
#N/A
#N/A
#N/A
#N/A
#N/A
#N/A
#N/A
#N/A
#N/A
#N/A
#N/A
#N/A
#N/A
#N/A
#N/A
#N/A
#N/A
#N/A
#N/A
#N/A
#N/A
#N/A
Bah
amas
5.2
9%
4.6
5%
4.5
4%
4.7
4%
4.4
4%
4.9
4%
4.7
0%
4.7
1%
5.9
7%
6.3
2%
5.8
6%
6.3
6%
6.4
7%
7.9
4%
8.1
1%
8.3
0%
5.6
4%
4.7
1%
4.9
1%
6.3
1%
4.9
6%
6.7
3%
5.6
2%
5.2
5%
5.0
5%
Bah
rain
#N/A
#N/A
#N/A
#N/A
#N/A
#N/A
#N/A
#N/A
#N/A
#N/A
#N/A
#N/A
#N/A
#N/A
#N/A
#N/A
#N/A
#N/A
#N/A
6.2
1%
5.6
2%
6.2
2%
6.0
8%
5.9
8%
5.6
9%
Ban
glad
esh
23
.96
%2
1.0
1%
25
.94
%2
2.5
3%
20
.43
%2
0.7
0%
24
.13
%2
2.5
8%
23
.28
%2
1.9
4%
22
.15
%2
5.8
5%
32
.68
%2
8.7
0%
31
.31
%2
6.3
8%
23
.73
%2
5.3
9%
22
.38
%2
5.3
5%
22
.15
%2
3.1
0%
22
.53
%2
1.5
4%
23
.19
%
Bar
bad
os
5.4
2%
5.7
1%
3.0
7%
5.4
1%
5.2
9%
5.0
3%
4.7
7%
5.7
1%
5.9
9%
6.4
7%
6.7
1%
7.4
1%
7.1
1%
5.9
3%
2.9
2%
6.5
6%
6.9
7%
7.4
6%
6.5
8%
5.4
3%
7.3
8%
7.0
7%
7.5
1%
6.6
1%
6.2
0%
Bel
aru
s#N
/A#N
/A#N
/A#N
/A#N
/A#N
/A#N
/A#N
/A#N
/A#N
/A#N
/A#N
/A#N
/A#N
/A#N
/A#N
/A#N
/A#N
/A#N
/A#N
/A#N
/A#N
/A#N
/A#N
/A#N
/A
Bel
giu
m#N
/A#N
/A#N
/A#N
/A#N
/A#N
/A#N
/A#N
/A#N
/A#N
/A#N
/A#N
/A#N
/A#N
/A#N
/A#N
/A#N
/A#N
/A#N
/A#N
/A#N
/A#N
/A#N
/A#N
/A#N
/A
Bel
ize
9.8
2%
21
.50
%1
0.7
4%
8.6
5%
15
.83
%1
4.1
5%
17
.23
%1
8.3
9%
18
.57
%2
0.6
4%
20
.88
%1
1.8
8%
9.2
3%
#N/A
#N/A
13
.47
%8
.16
%4
.03
%7
.46
%#N
/A1
0.2
4%
9.6
2%
7.8
8%
8.5
8%
12
.39
%
Ben
in1
6.8
8%
16
.63
%1
6.3
1%
15
.67
%1
5.4
1%
15
.35
%1
5.8
2%
15
.61
%1
4.4
3%
13
.93
%1
4.5
5%
14
.57
%1
4.2
1%
13
.21
%1
3.6
0%
15
.85
%1
5.7
1%
16
.45
%1
7.0
7%
16
.06
%1
5.4
4%
15
.62
%1
6.1
8%
16
.56
%1
5.0
6%
Ber
mu
da
5.5
7%
5.2
6%
5.5
1%
4.9
5%
4.9
8%
4.7
0%
3.9
4%
4.0
8%
3.9
3%
3.7
6%
3.8
1%
4.1
8%
4.5
2%
4.9
9%
4.3
9%
4.1
6%
3.5
7%
3.7
9%
3.7
6%
3.6
0%
3.6
2%
3.5
0%
3.5
7%
3.6
4%
3.4
9%
Bh
uta
n#N
/A#N
/A#N
/A#N
/A#N
/A#N
/A#N
/A#N
/A#N
/A#N
/A#N
/A#N
/A#N
/A#N
/A#N
/A#N
/A#N
/A#N
/A#N
/A#N
/A#N
/A#N
/A#N
/A#N
/A7
4.4
9%
Bo
livia
14
.50
%1
4.5
1%
14
.63
%1
3.1
0%
13
.43
%1
2.0
4%
11
.68
%1
4.4
1%
13
.76
%1
4.3
5%
13
.62
%1
3.3
8%
11
.96
%1
3.4
8%
14
.36
%1
2.3
7%
11
.57
%1
2.6
0%
12
.04
%1
2.9
0%
15
.18
%1
5.0
6%
12
.85
%1
5.3
2%
17
.30
%
Bo
snia
an
d H
erze
govi
na
#N/A
#N/A
#N/A
#N/A
#N/A
#N/A
#N/A
#N/A
#N/A
#N/A
#N/A
#N/A
#N/A
#N/A
#N/A
#N/A
#N/A
#N/A
#N/A
#N/A
#N/A
#N/A
#N/A
#N/A
#N/A
Bo
tsw
ana
4.6
0%
5.5
2%
3.6
5%
#N/A
#N/A
#N/A
2.9
9%
4.4
0%
5.5
3%
3.0
7%
3.8
2%
1.8
6%
#N/A
#N/A
#N/A
#N/A
#N/A
#N/A
#N/A
6.4
1%
2.1
1%
1.4
3%
3.2
9%
3.7
8%
2.2
4%
Bra
zil
5.2
5%
6.0
0%
5.8
0%
6.3
1%
6.5
9%
5.9
3%
6.7
5%
6.0
0%
5.4
1%
5.0
1%
4.7
9%
3.9
0%
2.9
4%
2.9
7%
3.2
3%
2.8
7%
2.1
3%
2.6
6%
3.0
7%
2.7
7%
3.0
6%
3.6
5%
3.4
2%
3.3
5%
3.9
3%
Bru
nei
Dar
uss
alam
#N/A
#N/A
#N/A
#N/A
#N/A
#N/A
#N/A
#N/A
#N/A
#N/A
#N/A
#N/A
#N/A
1.6
2%
1.8
5%
1.4
9%
1.3
9%
1.4
0%
1.2
9%
1.6
7%
2.2
8%
2.0
9%
2.0
5%
2.0
7%
1.8
4%
Bu
lgar
ia#N
/A#N
/A#N
/A#N
/A#N
/A#N
/A#N
/A#N
/A#N
/A#N
/A#N
/A#N
/A#N
/A#N
/A#N
/A#N
/A#N
/A#N
/A#N
/A1
5.9
2%
19
.92
%1
8.5
7%
19
.01
%2
0.7
3%
19
.58
%
Bu
rkin
a Fa
so3
2.1
4%
34
.12
%3
5.4
9%
38
.97
%3
3.3
6%
38
.23
%3
5.1
9%
35
.12
%3
4.1
9%
35
.92
%3
3.0
0%
39
.98
%3
9.4
8%
40
.76
%3
5.0
5%
29
.33
%3
1.8
1%
34
.98
%3
2.7
2%
31
.22
%3
4.8
0%
32
.14
%3
0.4
3%
32
.78
%3
7.9
2%
Bu
run
di
#N/A
#N/A
#N/A
#N/A
#N/A
#N/A
#N/A
#N/A
#N/A
#N/A
#N/A
#N/A
#N/A
#N/A
#N/A
#N/A
#N/A
#N/A
#N/A
#N/A
#N/A
#N/A
#N/A
#N/A
#N/A
Cab
o V
erd
e#N
/A#N
/A#N
/A#N
/A#N
/A#N
/A#N
/A#N
/A#N
/A#N
/A#N
/A#N
/A#N
/A#N
/A#N
/A#N
/A#N
/A#N
/A#N
/A#N
/A6
7.3
9%
64
.71
%5
2.6
3%
56
.01
%5
2.3
9%
Cam
bo
dia
#N/A
#N/A
#N/A
#N/A
#N/A
#N/A
#N/A
#N/A
#N/A
#N/A
#N/A
#N/A
#N/A
#N/A
#N/A
#N/A
#N/A
#N/A
#N/A
#N/A
#N/A
#N/A
#N/A
#N/A
#N/A
Cam
ero
on
22
.49
%2
2.0
9%
20
.78
%2
2.2
8%
21
.56
%2
1.0
0%
25
.40
%2
3.2
5%
20
.00
%2
4.1
0%
26
.35
%2
7.5
3%
23
.31
%1
9.2
1%
19
.01
%1
7.5
3%
12
.23
%8
.31
%9
.13
%1
0.1
3%
13
.46
%1
4.7
4%
13
.50
%1
1.0
7%
11
.50
%
Can
ada
3.7
6%
4.2
1%
4.0
7%
3.2
2%
3.4
7%
3.2
2%
3.4
2%
3.6
1%
3.7
6%
3.2
6%
3.2
0%
2.9
6%
2.6
8%
2.3
1%
2.5
1%
2.6
6%
2.8
2%
2.8
3%
2.4
9%
2.1
0%
7.1
0%
7.1
9%
7.0
2%
6.5
3%
5.9
9%
Cen
tral
Afr
ican
Rep
ub
lic1
6.1
4%
17
.03
%1
8.5
0%
14
.61
%1
8.2
1%
15
.80
%1
8.0
3%
18
.29
%1
7.7
7%
17
.32
%1
7.7
0%
18
.09
%2
1.7
7%
18
.67
%2
1.1
6%
18
.14
%1
3.5
3%
16
.26
%1
8.7
6%
18
.66
%2
3.7
1%
18
.96
%2
2.9
4%
18
.91
%1
7.4
0%
Ch
ad1
0.4
5%
10
.54
%1
2.1
7%
11
.51
%1
2.1
8%
13
.31
%1
3.7
4%
14
.06
%1
2.6
1%
11
.93
%1
1.4
3%
11
.29
%1
2.9
6%
12
.84
%1
1.2
3%
8.0
2%
7.5
3%
7.5
1%
9.2
6%
7.2
9%
6.8
5%
9.5
4%
7.5
9%
7.8
4%
8.1
1%
Ch
ile1
0.3
9%
10
.07
%1
0.2
8%
9.9
0%
9.6
0%
9.8
6%
9.1
6%
9.1
7%
8.7
3%
8.6
7%
8.1
0%
8.7
4%
8.8
2%
12
.81
%9
.52
%1
0.4
6%
8.0
9%
8.2
6%
8.4
2%
8.4
8%
8.2
2%
7.8
8%
7.7
6%
6.8
6%
5.3
1%
Ch
ina
#N/A
#N/A
#N/A
#N/A
#N/A
#N/A
#N/A
#N/A
#N/A
#N/A
#N/A
77
.17
%7
8.3
8%
77
.72
%7
2.5
3%
73
.63
%7
1.1
9%
69
.87
%6
9.2
9%
65
.12
%6
4.9
1%
64
.79
%6
1.7
8%
57
.59
%4
9.8
9%
Co
lom
bia
5.0
9%
5.1
1%
5.4
4%
4.3
2%
5.0
6%
5.3
8%
5.4
6%
5.3
4%
5.3
3%
4.3
2%
5.8
2%
5.0
6%
4.0
5%
4.4
3%
4.4
7%
4.0
3%
1.8
6%
#N/A
#N/A
#N/A
4.3
4%
4.1
7%
4.6
3%
3.9
9%
4.0
9%
Co
mo
ros
#N/A
#N/A
#N/A
#N/A
#N/A
#N/A
#N/A
#N/A
#N/A
#N/A
#N/A
#N/A
#N/A
#N/A
#N/A
#N/A
#N/A
#N/A
#N/A
12
.27
%8
.38
%4
.18
%4
.61
%1
1.2
9%
3.2
7%
Co
ngo
20
.02
%2
0.0
3%
22
.00
%2
1.6
8%
23
.59
%2
1.3
1%
23
.37
%2
2.9
7%
18
.76
%1
7.2
5%
17
.58
%1
4.7
6%
14
.46
%1
3.2
7%
13
.28
%1
3.4
5%
14
.04
%1
4.6
0%
14
.55
%1
3.1
2%
10
.72
%1
0.2
6%
9.3
2%
9.0
8%
9.6
2%
Co
sta
Ric
a#N
/A#N
/A#N
/A#N
/A#N
/A#N
/A#N
/A1
.85
%1
.79
%1
.80
%4
.99
%1
.59
%#N
/A#N
/A#N
/A#N
/A#N
/A#N
/A#N
/A#N
/A#N
/A#N
/A#N
/A#N
/A#N
/A
Cô
te d
Ivo
ire
6.6
3%
10
.88
%4
.85
%1
.89
%7
.17
%5
.01
%6
.55
%1
.52
%3
.56
%2
.74
%4
.80
%5
.74
%4
.20
%#N
/A#N
/A#N
/A#N
/A#N
/A#N
/A#N
/A#N
/A#N
/A#N
/A#N
/A#N
/A
Cro
atia
#N/A
#N/A
#N/A
#N/A
#N/A
#N/A
#N/A
#N/A
#N/A
#N/A
#N/A
#N/A
#N/A
#N/A
#N/A
#N/A
#N/A
#N/A
#N/A
#N/A
#N/A
#N/A
#N/A
#N/A
#N/A
Cu
ba
#N/A
#N/A
#N/A
#N/A
#N/A
#N/A
#N/A
#N/A
#N/A
#N/A
#N/A
#N/A
#N/A
#N/A
#N/A
#N/A
#N/A
#N/A
#N/A
#N/A
#N/A
#N/A
#N/A
#N/A
#N/A
Cyp
rus
#N/A
#N/A
#N/A
#N/A
#N/A
#N/A
#N/A
#N/A
#N/A
#N/A
#N/A
#N/A
#N/A
#N/A
14
.40
%1
1.2
8%
8.5
8%
9.4
1%
8.9
5%
9.3
5%
9.6
7%
8.3
1%
9.6
2%
8.2
3%
8.3
2%

97 Ta
ble
10
. NER
'Fo
od
' Dat
aset
(C
on
t.)
Are
as
19
86
19
87
19
88
19
89
19
90
19
91
19
92
19
93
19
94
19
95
19
96
19
97
19
98
19
99
20
00
20
01
20
02
20
03
20
04
20
05
20
06
20
07
20
08
20
09
20
10
20
11
Afg
han
ista
n#N
/A#N
/A#N
/A#N
/A#N
/A#N
/A#N
/A#N
/A#N
/A#N
/A#N
/A#N
/A#N
/A#N
/A#N
/A#N
/A1
7.1
5%
17
.82
%1
6.7
1%
18
.42
%1
7.3
3%
15
.87
%2
0.9
2%
14
.25
%1
3.0
1%
15
.47
%
Alb
ania
15
.95
%1
5.4
9%
16
.31
%1
6.4
6%
19
.09
%2
5.4
6%
33
.53
%3
4.6
4%
30
.70
%2
8.7
4%
28
.84
%2
7.8
5%
26
.35
%2
5.2
1%
22
.92
%2
1.9
3%
22
.12
%2
2.1
8%
22
.51
%2
0.9
6%
21
.09
%2
1.0
9%
20
.94
%2
0.0
7%
20
.50
%2
0.9
2%
Alg
eria
11
.48
%1
1.6
8%
11
.44
%1
4.1
1%
11
.94
%1
2.8
0%
13
.24
%1
3.1
5%
14
.49
%1
4.0
3%
14
.12
%1
2.4
7%
12
.87
%1
2.3
2%
14
.75
%1
4.3
7%
13
.84
%1
3.9
4%
15
.50
%1
4.9
2%
15
.08
%1
6.3
1%
18
.91
%1
8.3
9%
19
.29
%1
7.4
6%
An
gola
4.3
0%
4.8
6%
4.9
4%
5.3
9%
5.4
2%
5.1
1%
5.8
7%
6.7
3%
6.7
9%
6.4
3%
6.3
1%
5.9
5%
5.8
0%
4.9
3%
5.0
7%
5.4
0%
5.8
6%
6.2
0%
6.4
3%
6.1
5%
5.5
5%
5.0
9%
5.8
1%
5.5
5%
5.6
5%
6.7
7%
An
tigu
a an
d B
arb
ud
a9
.74
%9
.30
%9
.41
%8
.71
%8
.78
%7
.80
%8
.16
%7
.20
%6
.61
%6
.87
%6
.35
%6
.47
%5
.83
%5
.07
%4
.96
%4
.56
%4
.66
%4
.38
%4
.18
%8
.06
%5
.00
%5
.30
%5
.81
%6
.74
%7
.10
%9
.28
%
Arg
enti
na
8.8
1%
8.7
2%
8.2
2%
7.6
4%
8.5
7%
8.4
2%
7.4
7%
7.2
9%
7.8
2%
7.4
4%
7.0
7%
5.4
1%
6.4
6%
7.9
4%
27
.86
%2
6.8
8%
9.9
6%
11
.52
%1
1.9
4%
12
.20
%1
2.0
9%
13
.18
%1
4.9
0%
13
.82
%1
4.2
3%
1.3
0%
Arm
enia
#N/A
#N/A
#N/A
#N/A
#N/A
#N/A
40
.03
%3
6.0
1%
38
.53
%3
9.4
1%
41
.28
%3
4.2
7%
32
.91
%3
0.4
1%
27
.64
%2
6.7
4%
23
.12
%2
0.9
9%
22
.40
%2
1.5
3%
19
.13
%2
0.5
1%
20
.74
%2
2.7
6%
21
.07
%2
2.7
2%
Au
stra
lia5
.89
%6
.23
%6
.91
%7
.07
%6
.80
%6
.89
%6
.52
%5
.85
%6
.34
%6
.41
%6
.54
%6
.15
%5
.17
%5
.21
%4
.93
%4
.56
%4
.85
%5
.72
%6
.46
%6
.50
%6
.58
%7
.47
%7
.35
%7
.10
%8
.58
%8
.95
%
Au
stri
a7
.51
%7
.37
%7
.21
%7
.01
%6
.84
%6
.81
%6
.81
%6
.76
%6
.55
%6
.11
%5
.94
%5
.82
%5
.61
%5
.33
%4
.55
%4
.47
%4
.66
%5
.56
%6
.04
%5
.89
%5
.74
%6
.24
%6
.83
%6
.72
%6
.46
%6
.08
%
Aze
rbai
jan
#N/A
#N/A
#N/A
#N/A
#N/A
#N/A
15
.39
%1
6.2
3%
18
.20
%2
1.7
2%
24
.92
%2
0.2
2%
19
.54
%1
9.1
4%
34
.15
%2
9.9
7%
28
.15
%2
7.1
7%
26
.41
%2
2.5
0%
21
.98
%2
3.3
6%
29
.45
%2
9.3
3%
29
.75
%8
.49
%
Bah
amas
5.2
1%
5.3
6%
5.2
3%
4.8
4%
4.5
2%
5.0
2%
4.5
0%
4.1
6%
4.3
0%
4.5
9%
4.7
3%
4.4
0%
4.2
2%
4.1
5%
5.2
5%
4.4
6%
3.1
0%
2.5
8%
2.9
5%
4.3
3%
4.6
0%
4.7
4%
5.0
4%
5.2
4%
4.2
1%
4.1
2%
Bah
rain
5.1
4%
4.8
1%
4.4
9%
4.5
4%
4.4
0%
3.6
6%
3.9
2%
3.6
4%
3.5
3%
3.2
5%
2.8
2%
3.2
8%
1.8
9%
1.7
7%
6.7
6%
6.3
9%
5.8
9%
5.5
3%
5.2
3%
5.1
3%
5.2
2%
5.0
5%
5.0
1%
4.8
5%
4.8
2%
3.3
1%
Ban
glad
esh
20
.33
%2
0.1
3%
21
.03
%2
1.4
8%
20
.20
%1
9.5
6%
18
.87
%1
7.9
5%
16
.49
%1
7.4
4%
17
.34
%1
6.5
1%
16
.57
%1
9.3
7%
17
.70
%1
6.3
5%
16
.28
%1
6.4
8%
15
.57
%1
5.9
9%
15
.28
%1
5.8
0%
16
.16
%1
6.0
8%
16
.77
%1
6.8
1%
Bar
bad
os
5.8
4%
5.9
3%
5.7
3%
6.2
9%
5.9
3%
6.2
8%
5.5
0%
5.6
3%
5.5
7%
6.0
5%
5.1
5%
5.3
7%
3.7
8%
5.4
8%
4.5
8%
5.4
3%
5.3
7%
5.9
9%
5.1
0%
6.1
1%
5.7
4%
5.8
9%
6.3
2%
6.1
6%
6.6
8%
6.9
5%
Bel
aru
s#N
/A#N
/A#N
/A#N
/A#N
/A#N
/A2
5.2
8%
26
.59
%2
4.6
6%
27
.33
%2
7.8
5%
23
.63
%2
0.9
6%
19
.42
%1
8.6
4%
19
.00
%2
0.4
9%
20
.16
%2
1.0
1%
23
.56
%2
5.1
1%
27
.20
%3
2.0
8%
26
.93
%2
6.5
0%
9.6
3%
Bel
giu
m#N
/A#N
/A#N
/A#N
/A#N
/A#N
/A#N
/A#N
/A#N
/A7
.17
%6
.90
%6
.64
%6
.46
%6
.15
%5
.07
%5
.06
%5
.38
%6
.52
%6
.92
%6
.67
%6
.41
%6
.92
%7
.49
%7
.27
%6
.83
%7
.58
%
Bel
ize
8.1
4%
7.7
2%
6.7
9%
2.9
3%
2.4
7%
4.1
8%
7.0
1%
8.9
2%
6.1
6%
4.6
1%
5.4
4%
6.1
9%
6.5
8%
4.8
5%
6.5
9%
7.6
3%
9.2
2%
8.8
2%
8.3
7%
8.5
0%
7.3
2%
7.9
4%
8.3
4%
7.7
6%
9.3
9%
8.0
1%
Ben
in1
5.5
3%
14
.69
%1
7.1
4%
17
.61
%1
8.8
2%
19
.82
%2
2.3
5%
20
.47
%1
9.3
7%
19
.46
%1
8.8
5%
18
.63
%1
8.6
6%
18
.80
%1
7.4
8%
16
.85
%1
7.8
1%
18
.73
%1
9.0
9%
19
.02
%2
1.0
6%
19
.63
%2
2.4
1%
18
.41
%1
6.3
9%
21
.92
%
Ber
mu
da
3.2
3%
3.0
5%
2.8
1%
2.6
6%
2.5
1%
2.4
0%
2.9
9%
2.7
7%
4.1
9%
2.5
3%
2.3
7%
2.2
1%
2.0
6%
1.6
3%
1.4
8%
1.3
3%
1.3
5%
1.2
9%
1.2
6%
1.2
8%
1.6
5%
1.7
3%
2.0
1%
2.0
0%
1.8
5%
2.0
1%
Bh
uta
n6
8.2
2%
59
.28
%4
5.1
2%
43
.64
%4
5.7
3%
46
.25
%4
3.8
4%
45
.56
%4
4.6
6%
41
.83
%4
3.0
2%
42
.93
%3
9.4
5%
38
.57
%2
4.8
3%
23
.06
%2
0.0
5%
21
.26
%2
4.4
4%
27
.70
%2
5.8
4%
22
.13
%1
9.8
5%
18
.00
%1
8.9
5%
19
.08
%
Bo
livia
16
.31
%1
7.7
2%
16
.31
%1
5.5
2%
13
.43
%1
5.6
3%
15
.10
%1
5.3
8%
14
.65
%1
6.3
0%
14
.94
%1
3.9
2%
13
.86
%1
4.2
0%
27
.02
%2
5.2
6%
22
.78
%2
1.0
7%
20
.26
%1
9.7
6%
20
.56
%2
1.7
5%
24
.85
%2
5.8
1%
25
.38
%1
2.9
4%
Bo
snia
an
d H
erze
govi
na
#N/A
#N/A
#N/A
#N/A
#N/A
#N/A
#N/A
#N/A
48
.83
%4
0.3
1%
23
.97
%2
1.2
3%
17
.86
%1
4.8
4%
26
.25
%2
6.0
8%
27
.24
%3
1.4
8%
31
.92
%3
1.9
4%
32
.06
%3
5.0
5%
39
.87
%3
7.3
9%
35
.22
%1
6.3
7%
Bo
tsw
ana
1.4
2%
2.9
3%
3.4
6%
2.2
9%
3.4
9%
3.5
6%
4.2
9%
3.7
6%
3.4
8%
4.2
8%
4.2
3%
3.6
2%
3.3
3%
3.2
9%
3.3
5%
2.9
4%
2.7
5%
2.9
9%
2.1
0%
1.9
8%
2.1
8%
2.3
5%
2.8
0%
3.0
2%
2.7
2%
3.5
6%
Bra
zil
3.9
9%
4.0
4%
4.1
9%
4.5
6%
4.6
1%
4.9
8%
5.2
3%
5.1
1%
5.1
6%
5.4
3%
5.0
3%
5.1
4%
5.3
0%
5.5
9%
13
.10
%1
0.8
4%
9.8
2%
11
.22
%1
1.9
7%
15
.16
%1
7.5
5%
19
.99
%2
2.1
3%
22
.35
%2
6.3
2%
3.7
5%
Bru
nei
Dar
uss
alam
1.9
8%
2.3
0%
2.4
8%
2.2
8%
2.3
0%
2.2
6%
2.2
6%
2.2
8%
2.5
9%
2.4
3%
2.4
1%
2.8
2%
2.7
4%
2.0
6%
2.0
4%
2.0
2%
2.3
1%
2.4
3%
2.1
5%
2.1
8%
2.0
9%
1.8
8%
2.4
8%
2.4
8%
2.6
6%
2.8
4%
Bu
lgar
ia2
0.5
2%
18
.65
%1
7.1
7%
18
.99
%1
7.3
7%
19
.37
%1
7.6
2%
15
.76
%1
4.8
5%
15
.14
%1
4.3
8%
16
.34
%1
5.1
9%
15
.31
%1
3.5
3%
13
.72
%1
3.0
0%
14
.71
%1
6.1
8%
15
.72
%1
5.3
7%
17
.92
%1
8.7
1%
19
.14
%1
8.2
3%
7.2
0%
Bu
rkin
a Fa
so3
6.9
5%
34
.76
%3
8.8
7%
36
.67
%3
5.3
0%
41
.19
%4
1.2
3%
40
.83
%3
9.7
6%
38
.76
%3
9.7
3%
32
.98
%3
4.5
6%
34
.32
%2
8.7
8%
32
.76
%3
1.1
5%
32
.29
%2
7.4
5%
29
.84
%2
8.8
4%
24
.00
%2
9.2
5%
26
.26
%2
8.0
8%
23
.99
%
Bu
run
di
#N/A
#N/A
#N/A
#N/A
#N/A
#N/A
#N/A
#N/A
#N/A
#N/A
#N/A
#N/A
#N/A
#N/A
#N/A
#N/A
#N/A
#N/A
#N/A
#N/A
#N/A
#N/A
#N/A
#N/A
#N/A
#N/A
Cab
o V
erd
e6
6.2
7%
#N/A
79
.67
%7
7.8
2%
74
.21
%6
7.6
0%
74
.11
%6
3.7
9%
50
.73
%5
2.1
7%
43
.85
%4
1.4
2%
38
.40
%3
7.8
7%
30
.31
%3
2.0
6%
29
.28
%3
1.6
8%
30
.45
%2
9.7
6%
29
.51
%2
8.5
6%
29
.48
%2
8.7
7%
28
.08
%2
8.7
1%
Cam
bo
dia
#N/A
#N/A
#N/A
#N/A
#N/A
#N/A
#N/A
47
.92
%4
3.2
2%
47
.04
%4
5.7
7%
44
.37
%4
2.9
2%
42
.71
%3
9.5
5%
36
.97
%3
4.2
9%
35
.92
%3
3.1
0%
36
.82
%4
0.8
1%
37
.75
%4
1.2
2%
43
.11
%4
3.5
7%
49
.12
%
Cam
ero
on
11
.02
%1
1.0
9%
12
.69
%1
3.6
4%
16
.02
%1
7.8
5%
20
.03
%2
1.7
1%
21
.59
%2
0.9
3%
20
.49
%2
0.3
9%
21
.91
%2
1.6
6%
24
.38
%2
3.8
4%
25
.88
%3
1.2
6%
32
.58
%3
2.6
5%
34
.45
%3
8.1
5%
41
.98
%3
8.0
9%
35
.67
%3
1.7
4%
Can
ada
5.9
3%
6.1
4%
6.3
0%
6.4
5%
6.6
4%
6.9
0%
6.3
3%
5.8
8%
5.2
8%
5.1
8%
5.1
8%
4.9
6%
4.5
6%
4.4
0%
4.2
8%
4.1
9%
4.1
0%
4.6
0%
4.8
4%
5.0
6%
5.2
8%
5.5
5%
5.7
4%
5.7
7%
6.4
3%
6.4
4%
Cen
tral
Afr
ican
Rep
ub
lic2
0.2
3%
21
.03
%2
2.4
6%
20
.71
%2
5.1
7%
26
.47
%2
8.7
3%
29
.29
%2
8.7
5%
27
.15
%3
2.1
1%
29
.76
%3
1.1
6%
28
.23
%3
2.4
2%
32
.30
%3
1.3
1%
32
.96
%3
3.0
7%
33
.13
%3
1.6
0%
30
.80
%3
0.7
4%
29
.62
%2
7.5
4%
27
.71
%
Ch
ad1
1.1
3%
11
.29
%1
1.4
0%
10
.72
%1
1.9
9%
12
.30
%1
1.6
9%
12
.39
%1
1.1
9%
12
.62
%1
3.5
1%
12
.83
%1
4.7
4%
13
.47
%1
2.7
2%
13
.69
%1
2.6
0%
12
.18
%8
.70
%8
.42
%8
.26
%7
.75
%8
.36
%8
.35
%7
.77
%7
.34
%
Ch
ile4
.54
%4
.76
%4
.74
%4
.37
%4
.25
%4
.16
%3
.90
%4
.05
%4
.06
%3
.71
%3
.49
%3
.63
%3
.46
%3
.35
%1
2.9
6%
11
.05
%1
0.3
7%
10
.44
%1
1.6
6%
12
.82
%1
3.7
3%
14
.21
%1
5.1
5%
14
.63
%1
6.1
3%
14
.03
%
Ch
ina
47
.44
%4
4.8
8%
41
.28
%4
1.0
7%
42
.87
%4
0.1
6%
36
.81
%3
4.5
0%
32
.16
%3
1.8
0%
30
.89
%2
8.6
0%
28
.09
%2
6.9
4%
13
.10
%1
2.1
4%
11
.35
%1
0.7
0%
10
.74
%9
.89
%9
.25
%9
.74
%1
1.2
1%
10
.89
%1
0.8
0%
12
.71
%
Co
lom
bia
1.5
6%
4.3
7%
4.7
7%
5.2
2%
5.4
8%
5.3
3%
5.3
7%
5.8
3%
5.0
1%
5.5
0%
5.9
2%
5.0
7%
5.1
8%
6.1
2%
12
.47
%1
2.0
1%
11
.60
%1
0.1
7%
11
.07
%1
2.4
2%
12
.08
%1
3.9
3%
15
.98
%1
4.9
7%
17
.00
%1
7.2
0%
Co
mo
ros
3.9
9%
7.7
3%
6.2
3%
9.1
9%
10
.30
%7
.79
%9
.71
%7
.58
%1
2.9
9%
15
.63
%1
5.2
4%
14
.82
%1
4.6
0%
14
.63
%1
0.7
3%
10
.38
%1
2.1
4%
7.4
9%
8.7
4%
13
.61
%1
3.3
4%
16
.14
%1
7.6
7%
16
.74
%1
9.7
9%
15
.26
%
Co
ngo
10
.23
%9
.78
%1
0.7
2%
10
.17
%9
.84
%1
0.6
1%
11
.19
%1
1.2
5%
10
.82
%1
1.5
3%
11
.78
%1
1.0
7%
11
.43
%1
1.2
9%
11
.27
%1
0.7
1%
10
.95
%1
1.7
3%
12
.55
%1
0.7
4%
11
.18
%1
1.8
2%
11
.71
%1
2.4
3%
10
.83
%1
3.8
2%
Co
sta
Ric
a#N
/A#N
/A1
.93
%4
.71
%6
.18
%5
.29
%6
.03
%5
.67
%4
.36
%1
.47
%3
.04
%2
.81
%2
.55
%4
.45
%1
7.2
2%
17
.56
%1
7.0
7%
15
.93
%1
5.4
8%
15
.87
%1
5.1
5%
16
.40
%1
9.2
1%
19
.51
%2
2.6
8%
5.6
5%
Cô
te d
Ivo
ire
#N/A
1.0
8%
6.7
3%
6.1
2%
10
.53
%1
1.6
1%
13
.60
%1
2.8
4%
13
.13
%1
0.0
7%
7.9
2%
8.5
4%
7.7
7%
8.8
6%
13
.21
%1
1.8
2%
6.8
5%
7.0
3%
9.8
2%
11
.05
%1
2.6
4%
11
.14
%1
0.1
7%
4.7
2%
4.6
5%
5.5
0%
Cro
atia
#N/A
#N/A
#N/A
#N/A
#N/A
#N/A
#N/A
#N/A
#N/A
7.6
0%
7.2
2%
6.7
5%
6.2
7%
6.8
2%
10
.38
%1
1.8
2%
12
.93
%1
4.6
7%
15
.78
%1
5.8
8%
16
.09
%1
6.9
3%
19
.38
%1
8.6
8%
18
.11
%5
.82
%
Cu
ba
#N/A
#N/A
#N/A
#N/A
#N/A
#N/A
#N/A
1.9
5%
1.7
8%
2.1
4%
1.6
6%
1.9
9%
2.7
7%
3.6
4%
3.6
1%
3.1
0%
3.6
3%
4.1
9%
4.3
3%
4.6
4%
3.6
0%
4.1
7%
5.1
9%
4.0
2%
3.5
8%
3.9
6%
Cyp
rus
7.5
4%
7.1
6%
7.7
5%
7.5
9%
6.6
6%
6.4
4%
7.0
6%
7.2
2%
6.6
6%
6.8
3%
7.3
1%
6.9
3%
6.7
8%
6.7
3%
6.4
5%
6.2
2%
6.3
4%
6.1
3%
6.3
3%
6.1
1%
5.8
9%
6.2
1%
6.6
7%
6.0
4%
6.0
3%
6.1
8%

98 Ta
ble
10
. NER
'Fo
od
' Dat
aset
Are
as
19
61
19
62
19
63
19
64
19
65
19
66
19
67
19
68
19
69
19
70
19
71
19
72
19
73
19
74
19
75
19
76
19
77
19
78
19
79
19
80
19
81
19
82
19
83
19
84
19
85
Cze
ch R
epu
blic
#N/A
#N/A
#N/A
#N/A
#N/A
#N/A
#N/A
#N/A
#N/A
#N/A
#N/A
#N/A
#N/A
#N/A
#N/A
#N/A
#N/A
#N/A
#N/A
#N/A
#N/A
#N/A
#N/A
#N/A
#N/A
Dem
. Rep
. Co
ngo
15
.56
%1
3.2
9%
13
.24
%1
2.7
2%
14
.04
%1
3.3
0%
12
.58
%1
2.3
1%
12
.06
%1
2.4
9%
11
.72
%1
1.6
9%
11
.89
%1
2.8
2%
12
.59
%1
2.6
9%
10
.70
%1
1.6
9%
13
.50
%1
3.4
6%
16
.16
%1
5.1
3%
15
.32
%1
4.0
7%
15
.64
%
Den
mar
k2
.96
%2
.96
%2
.42
%2
.36
%2
.12
%6
.81
%6
.87
%6
.33
%6
.08
%6
.36
%6
.30
%6
.53
%8
.09
%8
.14
%8
.62
%8
.54
%8
.80
%9
.61
%9
.33
%8
.70
%7
.17
%6
.14
%5
.47
%4
.88
%4
.56
%
Do
min
ica
#N/A
#N/A
#N/A
#N/A
#N/A
#N/A
#N/A
#N/A
#N/A
#N/A
#N/A
#N/A
#N/A
#N/A
#N/A
#N/A
8.5
8%
8.2
8%
11
.34
%1
5.8
4%
10
.83
%9
.10
%7
.41
%8
.96
%6
.75
%
Do
min
ican
Rep
ub
lic7
.75
%4
.44
%4
.79
%6
.70
%1
1.7
9%
10
.92
%9
.14
%9
.70
%1
0.0
4%
8.2
4%
8.2
4%
5.8
3%
5.3
2%
2.2
6%
#N/A
4.2
2%
1.5
9%
5.4
1%
4.4
5%
5.7
7%
2.9
6%
6.1
6%
7.4
4%
6.8
5%
7.5
3%
Ecu
ado
r7
.57
%6
.56
%6
.71
%8
.12
%7
.28
%6
.72
%6
.28
%7
.13
%7
.65
%7
.54
%6
.86
%5
.83
%4
.95
%3
.80
%4
.68
%2
.89
%#N
/A#N
/A#N
/A2
.98
%4
.15
%6
.56
%6
.54
%6
.27
%5
.67
%
Egyp
t3
1.0
1%
35
.26
%3
3.8
5%
30
.78
%2
8.7
7%
30
.56
%2
9.2
2%
26
.90
%2
2.9
8%
22
.73
%2
5.1
8%
24
.79
%2
4.2
4%
37
.06
%3
6.3
5%
30
.47
%2
6.0
6%
28
.83
%2
5.1
6%
27
.18
%3
3.0
8%
28
.11
%2
6.4
1%
26
.49
%2
4.0
0%
El S
alva
do
r#N
/A#N
/A#N
/A#N
/A#N
/A#N
/A#N
/A#N
/A#N
/A#N
/A#N
/A#N
/A#N
/A#N
/A#N
/A#N
/A#N
/A#N
/A#N
/A#N
/A#N
/A#N
/A#N
/A3
.43
%1
.35
%
Equ
ato
rial
Gu
inea
#N/A
#N/A
#N/A
#N/A
#N/A
#N/A
#N/A
#N/A
#N/A
#N/A
#N/A
#N/A
#N/A
#N/A
#N/A
#N/A
#N/A
#N/A
#N/A
#N/A
#N/A
#N/A
#N/A
#N/A
4.0
2%
Erit
rea
#N/A
#N/A
#N/A
#N/A
#N/A
#N/A
#N/A
#N/A
#N/A
#N/A
#N/A
#N/A
#N/A
#N/A
#N/A
#N/A
#N/A
#N/A
#N/A
#N/A
#N/A
#N/A
#N/A
#N/A
#N/A
Esto
nia
#N/A
#N/A
#N/A
#N/A
#N/A
#N/A
#N/A
#N/A
#N/A
#N/A
#N/A
#N/A
#N/A
#N/A
#N/A
#N/A
#N/A
#N/A
#N/A
#N/A
#N/A
#N/A
#N/A
#N/A
#N/A
Eth
iop
ia#N
/A#N
/A#N
/A#N
/A#N
/A#N
/A#N
/A#N
/A#N
/A#N
/A#N
/A#N
/A#N
/A#N
/A#N
/A#N
/A#N
/A#N
/A#N
/A#N
/A#N
/A#N
/A#N
/A#N
/A#N
/A
Fiji
18
.47
%1
7.5
8%
10
.09
%9
.83
%1
9.3
1%
20
.76
%1
7.2
2%
17
.52
%1
6.0
1%
15
.74
%1
4.8
5%
12
.24
%1
4.7
1%
6.2
3%
1.1
8%
8.6
7%
6.9
0%
8.5
9%
5.7
8%
#N/A
6.4
4%
8.0
7%
8.6
6%
11
.44
%1
2.4
2%
Fin
lan
d6
.01
%5
.84
%6
.35
%5
.84
%5
.48
%5
.24
%5
.07
%4
.91
%4
.57
%4
.49
%3
.94
%3
.76
%3
.73
%3
.86
%7
.54
%8
.09
%8
.67
%8
.50
%8
.00
%7
.78
%7
.82
%8
.23
%8
.34
%8
.52
%8
.49
%
Fran
ce7
.48
%7
.64
%7
.94
%7
.81
%7
.71
%7
.60
%7
.41
%7
.22
%7
.09
%6
.83
%6
.68
%6
.77
%6
.66
%6
.73
%7
.02
%7
.13
%7
.35
%7
.35
%7
.26
%7
.29
%7
.59
%7
.98
%8
.37
%8
.76
%8
.91
%
Gab
on
4.4
5%
4.4
4%
4.3
6%
4.0
7%
4.0
0%
3.8
2%
3.7
0%
3.7
0%
3.3
9%
3.1
6%
2.8
9%
2.8
3%
2.6
5%
2.6
3%
2.6
4%
2.0
0%
2.5
6%
3.6
9%
3.4
8%
3.6
4%
3.7
0%
4.0
2%
3.5
3%
3.3
0%
3.5
3%
Gam
bia
#N/A
#N/A
#N/A
#N/A
#N/A
54
.49
%4
8.7
4%
51
.14
%4
9.7
2%
49
.94
%5
2.7
9%
48
.18
%4
8.4
9%
46
.12
%4
0.7
9%
45
.49
%3
3.3
9%
46
.47
%3
7.1
1%
42
.39
%4
8.8
0%
50
.28
%3
4.7
6%
37
.37
%3
6.2
3%
Geo
rgia
#N/A
#N/A
#N/A
#N/A
#N/A
#N/A
#N/A
#N/A
#N/A
#N/A
#N/A
#N/A
#N/A
#N/A
#N/A
#N/A
#N/A
#N/A
#N/A
#N/A
#N/A
#N/A
#N/A
#N/A
#N/A
Ger
man
y#N
/A#N
/A#N
/A#N
/A#N
/A#N
/A#N
/A#N
/A#N
/A4
.43
%4
.27
%4
.24
%4
.33
%4
.16
%4
.19
%4
.15
%4
.17
%4
.19
%4
.02
%3
.82
%3
.44
%3
.54
%3
.40
%3
.41
%3
.25
%
Gh
ana
30
.10
%3
1.5
7%
28
.38
%3
2.1
5%
27
.43
%4
1.0
2%
35
.85
%3
5.4
6%
33
.21
%2
8.2
8%
37
.75
%3
4.6
9%
31
.07
%2
9.8
9%
23
.84
%2
3.5
6%
7.9
9%
8.6
2%
12
.76
%1
7.2
3%
33
.07
%3
4.2
8%
43
.11
%4
9.7
0%
45
.36
%
Gre
ece
17
.61
%1
3.4
7%
15
.01
%1
3.0
2%
13
.14
%1
2.8
1%
12
.54
%1
1.5
8%
10
.69
%1
0.8
8%
10
.03
%9
.56
%9
.24
%1
0.7
4%
10
.38
%8
.96
%8
.72
%8
.72
%8
.29
%9
.22
%9
.59
%1
0.1
2%
9.7
2%
9.5
6%
10
.17
%
Gre
nad
a#N
/A#N
/A#N
/A#N
/A#N
/A#N
/A#N
/A#N
/A#N
/A#N
/A#N
/A#N
/A#N
/A#N
/A#N
/A#N
/A#N
/A#N
/A#N
/A3
.96
%5
.25
%6
.40
%4
.30
%6
.19
%5
.61
%
Gu
atem
ala
#N/A
#N/A
#N/A
#N/A
#N/A
#N/A
#N/A
#N/A
#N/A
#N/A
#N/A
#N/A
#N/A
#N/A
#N/A
#N/A
#N/A
#N/A
#N/A
#N/A
#N/A
#N/A
#N/A
#N/A
#N/A
Gu
inea
#N/A
#N/A
#N/A
#N/A
#N/A
#N/A
#N/A
#N/A
#N/A
#N/A
#N/A
#N/A
#N/A
#N/A
#N/A
#N/A
#N/A
#N/A
#N/A
#N/A
#N/A
#N/A
#N/A
#N/A
#N/A
Gu
inea
-Bis
sau
#N/A
#N/A
#N/A
#N/A
#N/A
#N/A
#N/A
#N/A
#N/A
18
.12
%2
0.9
0%
18
.47
%2
4.6
7%
25
.96
%1
9.9
9%
17
.74
%1
7.7
1%
24
.15
%1
7.8
5%
18
.18
%2
1.1
0%
15
.98
%1
5.6
7%
13
.87
%1
2.4
4%
Gu
yan
a#N
/A#N
/A#N
/A#N
/A#N
/A#N
/A#N
/A#N
/A#N
/A#N
/A#N
/A#N
/A#N
/A#N
/A#N
/A#N
/A#N
/A#N
/A#N
/A#N
/A#N
/A#N
/A#N
/A#N
/A#N
/A
Hai
ti#N
/A#N
/A#N
/A#N
/A#N
/A#N
/A#N
/A#N
/A#N
/A#N
/A#N
/A#N
/A#N
/A#N
/A#N
/A#N
/A#N
/A#N
/A#N
/A#N
/A#N
/A#N
/A#N
/A#N
/A#N
/A
Ho
nd
ura
s1
2.1
2%
10
.94
%1
1.3
3%
11
.01
%4
.07
%4
.45
%7
.08
%7
.23
%1
0.6
2%
10
.35
%9
.25
%1
1.4
3%
9.3
1%
12
.64
%1
0.0
1%
3.2
7%
#N/A
#N/A
#N/A
#N/A
2.7
3%
3.3
1%
3.9
7%
3.2
2%
2.0
3%
Hu
nga
ry1
8.4
1%
18
.28
%1
7.4
1%
16
.42
%1
1.2
4%
11
.08
%1
0.1
4%
10
.36
%9
.55
%8
.68
%9
.26
%8
.16
%6
.82
%7
.55
%7
.06
%6
.70
%7
.13
%7
.06
%6
.17
%6
.83
%6
.32
%6
.58
%6
.95
%7
.50
%7
.26
%
Icel
and
9.1
6%
8.9
7%
8.2
8%
7.9
4%
7.8
7%
6.8
4%
7.2
1%
7.2
4%
6.6
1%
6.5
8%
5.9
4%
5.8
8%
6.0
3%
6.4
3%
6.3
8%
5.8
6%
5.4
6%
5.3
1%
5.0
7%
4.8
2%
4.4
9%
4.2
5%
4.2
4%
4.0
2%
3.9
7%
Ind
ia4
3.0
2%
41
.31
%3
9.7
3%
38
.29
%3
8.1
8%
38
.60
%3
8.0
2%
38
.27
%3
6.5
5%
36
.08
%3
5.9
2%
34
.40
%3
5.9
7%
34
.61
%3
5.8
7%
34
.96
%3
2.8
7%
32
.49
%3
2.6
0%
31
.66
%3
2.3
3%
31
.30
%3
3.0
4%
32
.57
%3
1.4
2%
Ind
on
esia
29
.74
%3
1.8
2%
30
.13
%3
1.6
5%
28
.81
%2
9.0
8%
27
.96
%2
9.6
6%
27
.94
%2
8.3
1%
26
.44
%2
4.8
2%
26
.48
%2
4.7
4%
22
.99
%2
1.6
4%
19
.56
%1
9.6
6%
18
.42
%1
8.7
5%
19
.49
%1
8.4
6%
18
.22
%1
7.2
7%
16
.99
%
Iran
#N/A
#N/A
#N/A
#N/A
13
.17
%1
2.1
9%
10
.65
%1
0.5
2%
9.1
3%
8.6
8%
8.2
4%
7.7
5%
7.8
8%
9.8
2%
11
.37
%8
.81
%9
.30
%9
.40
%1
0.5
6%
12
.82
%1
5.7
6%
14
.30
%1
2.4
8%
12
.86
%1
2.2
8%
Iraq
#N/A
#N/A
#N/A
#N/A
#N/A
#N/A
#N/A
#N/A
#N/A
#N/A
#N/A
#N/A
#N/A
#N/A
#N/A
#N/A
#N/A
#N/A
#N/A
#N/A
#N/A
#N/A
#N/A
#N/A
#N/A
Irel
and
#N/A
#N/A
#N/A
#N/A
#N/A
#N/A
#N/A
#N/A
#N/A
6.9
0%
6.7
2%
5.3
7%
3.9
6%
4.9
1%
3.4
2%
3.7
7%
3.7
6%
2.3
5%
2.1
9%
2.4
4%
3.7
8%
4.6
3%
5.0
9%
5.2
4%
5.1
1%
Isra
el6
.83
%6
.45
%5
.78
%6
.94
%5
.80
%6
.50
%5
.89
%5
.74
%5
.03
%5
.37
%5
.10
%4
.84
%5
.61
%6
.38
%6
.01
%5
.27
%5
.16
%4
.70
%4
.92
%4
.55
%4
.39
%4
.53
%4
.56
%4
.52
%4
.00
%
Ital
y6
.98
%6
.49
%6
.75
%6
.67
%6
.76
%6
.67
%6
.59
%6
.02
%5
.97
%3
.80
%3
.78
%3
.78
%3
.94
%4
.19
%4
.51
%4
.87
%5
.36
%5
.62
%5
.75
%6
.06
%6
.41
%7
.09
%7
.54
%7
.75
%7
.96
%
Jap
an1
0.9
3%
10
.38
%9
.81
%9
.01
%8
.53
%7
.78
%7
.39
%6
.73
%5
.81
%5
.85
%5
.37
%5
.33
%5
.12
%5
.50
%5
.46
%4
.99
%5
.11
%4
.85
%4
.76
%4
.41
%4
.23
%4
.07
%3
.94
%3
.93
%3
.69
%
Jord
an#N
/A#N
/A#N
/A#N
/A#N
/A#N
/A#N
/A#N
/A#N
/A#N
/A#N
/A#N
/A#N
/A#N
/A2
6.5
6%
27
.60
%2
4.6
2%
24
.39
%2
1.1
7%
19
.05
%1
9.0
1%
19
.94
%1
9.5
4%
18
.25
%1
7.6
5%
Kaz
akh
stan
#N/A
#N/A
#N/A
#N/A
#N/A
#N/A
#N/A
#N/A
#N/A
#N/A
#N/A
#N/A
#N/A
#N/A
#N/A
#N/A
#N/A
#N/A
#N/A
#N/A
#N/A
#N/A
#N/A
#N/A
#N/A
Ken
ya4
7.3
2%
43
.37
%3
8.6
6%
37
.05
%3
9.6
5%
31
.62
%3
2.2
3%
32
.38
%2
9.3
9%
32
.00
%2
9.3
9%
24
.31
%2
1.8
8%
22
.49
%2
3.0
2%
18
.73
%5
.47
%1
3.4
0%
15
.47
%1
6.7
1%
17
.09
%2
1.8
3%
20
.28
%1
5.6
2%
20
.69
%
Kir
ibat
i#N
/A#N
/A#N
/A#N
/A#N
/A#N
/A#N
/A#N
/A#N
/A1
6.6
8%
18
.86
%1
6.1
8%
17
.24
%1
4.8
5%
10
.56
%1
5.1
5%
15
.39
%1
7.2
7%
19
.81
%3
6.1
7%
37
.35
%3
1.7
5%
24
.81
%3
0.7
6%
30
.26
%
Ku
wai
t#N
/A#N
/A#N
/A#N
/A#N
/A#N
/A#N
/A#N
/A#N
/A#N
/A#N
/A#N
/A#N
/A#N
/A#N
/A#N
/A#N
/A#N
/A#N
/A#N
/A#N
/A#N
/A#N
/A#N
/A#N
/A
Kyr
gyzs
tan
#N/A
#N/A
#N/A
#N/A
#N/A
#N/A
#N/A
#N/A
#N/A
#N/A
#N/A
#N/A
#N/A
#N/A
#N/A
#N/A
#N/A
#N/A
#N/A
#N/A
#N/A
#N/A
#N/A
#N/A
#N/A
Lao
#N/A
#N/A
#N/A
#N/A
#N/A
#N/A
#N/A
#N/A
#N/A
#N/A
#N/A
#N/A
#N/A
#N/A
#N/A
#N/A
#N/A
#N/A
#N/A
#N/A
#N/A
#N/A
#N/A
45
.00
%4
2.4
3%

99 Ta
ble
10
. NER
'Fo
od
' Dat
aset
(C
on
t.)
Are
as
19
86
19
87
19
88
19
89
19
90
19
91
19
92
19
93
19
94
19
95
19
96
19
97
19
98
19
99
20
00
20
01
20
02
20
03
20
04
20
05
20
06
20
07
20
08
20
09
20
10
20
11
Cze
ch R
epu
blic
#N/A
#N/A
#N/A
#N/A
#N/A
#N/A
#N/A
6.5
0%
6.6
2%
7.1
2%
7.4
5%
6.9
0%
7.3
1%
6.8
9%
6.1
0%
6.3
2%
6.9
4%
7.5
1%
7.9
9%
7.8
2%
7.7
8%
8.6
9%
10
.96
%1
0.0
1%
9.8
0%
9.7
0%
Dem
. Rep
. Co
ngo
12
.96
%1
5.2
3%
16
.10
%1
6.6
1%
19
.14
%2
1.5
1%
25
.00
%2
9.2
7%
30
.45
%2
6.1
2%
26
.30
%2
7.5
0%
27
.30
%2
8.1
5%
30
.36
%3
0.7
2%
30
.18
%2
9.4
3%
29
.04
%2
7.1
0%
27
.89
%2
5.5
9%
24
.91
%2
5.7
0%
23
.72
%2
3.8
2%
Den
mar
k5
.73
%6
.60
%6
.71
%6
.24
%7
.13
%6
.69
%7
.02
%6
.23
%6
.29
%7
.09
%6
.65
%5
.77
%5
.59
%5
.08
%4
.29
%4
.19
%4
.41
%5
.16
%5
.54
%5
.32
%5
.24
%5
.76
%6
.37
%6
.19
%5
.98
%6
.19
%
Do
min
ica
1.4
0%
#N/A
#N/A
5.0
3%
3.2
7%
2.4
4%
2.0
9%
3.1
4%
4.7
4%
6.7
0%
8.4
8%
7.4
6%
6.0
7%
5.3
5%
7.7
9%
7.7
1%
8.1
8%
8.5
3%
8.1
6%
8.4
8%
7.8
4%
9.6
6%
9.2
3%
9.3
2%
9.3
0%
8.8
3%
Do
min
ican
Rep
ub
lic7
.46
%8
.57
%8
.27
%8
.85
%8
.23
%8
.70
%8
.90
%8
.45
%7
.65
%8
.13
%7
.84
%7
.45
%6
.89
%7
.05
%2
4.8
5%
23
.54
%2
2.2
0%
17
.42
%1
8.2
3%
24
.00
%2
1.9
6%
22
.08
%2
3.1
2%
21
.81
%2
2.2
6%
6.2
8%
Ecu
ado
r4
.52
%5
.70
%6
.45
%6
.82
%6
.70
%5
.93
%7
.05
%7
.69
%6
.63
%6
.93
%7
.37
%7
.83
%7
.91
%8
.52
%1
1.6
2%
14
.26
%1
4.8
7%
15
.09
%1
4.2
1%
14
.17
%1
3.9
4%
13
.82
%1
3.9
7%
14
.54
%1
4.1
0%
7.4
4%
Egyp
t2
2.9
4%
20
.76
%2
1.5
4%
20
.66
%2
2.4
9%
21
.11
%2
0.9
4%
20
.39
%2
0.8
1%
21
.79
%2
2.6
0%
21
.92
%2
1.2
2%
21
.05
%4
5.0
4%
39
.88
%3
4.8
9%
27
.55
%2
7.6
5%
30
.22
%3
1.1
1%
35
.29
%3
9.8
2%
44
.80
%4
8.9
3%
18
.74
%
El S
alva
do
r#N
/A3
.28
%3
.60
%6
.60
%5
.80
%7
.41
%8
.17
%6
.61
%6
.06
%5
.22
%6
.36
%4
.93
%5
.93
%6
.50
%7
.08
%8
.01
%8
.37
%8
.44
%8
.86
%8
.48
%8
.82
%8
.86
%9
.69
%9
.37
%8
.67
%7
.90
%
Equ
ato
rial
Gu
inea
5.5
7%
6.7
7%
7.9
6%
8.6
3%
11
.13
%1
1.9
3%
10
.83
%1
0.9
1%
8.3
4%
8.3
6%
6.0
7%
4.0
1%
2.8
2%
2.3
5%
1.9
0%
1.2
8%
1.2
0%
1.1
5%
#N/A
#N/A
#N/A
#N/A
1.0
3%
1.0
8%
1.1
2%
1.3
7%
Erit
rea
#N/A
#N/A
#N/A
#N/A
#N/A
#N/A
#N/A
53
.64
%6
1.8
9%
51
.16
%4
9.4
2%
46
.48
%6
3.1
7%
51
.28
%4
8.2
0%
47
.44
%3
7.2
4%
48
.21
%5
0.8
2%
59
.04
%5
4.6
9%
62
.91
%5
0.7
5%
56
.64
%5
4.7
9%
55
.87
%
Esto
nia
#N/A
#N/A
#N/A
#N/A
#N/A
#N/A
#N/A
10
.27
%9
.94
%8
.66
%9
.83
%1
0.3
5%
9.6
9%
9.4
5%
7.8
7%
7.7
2%
8.2
4%
9.4
9%
10
.84
%1
0.7
2%
10
.46
%1
1.4
1%
14
.23
%1
4.0
3%
12
.25
%1
3.1
5%
Eth
iop
ia#N
/A#N
/A#N
/A#N
/A#N
/A#N
/A#N
/A3
4.7
7%
34
.30
%3
5.0
9%
37
.21
%3
4.0
9%
32
.02
%3
4.9
9%
35
.19
%3
7.8
3%
40
.15
%4
7.2
9%
40
.20
%3
9.3
6%
36
.27
%3
2.2
9%
34
.02
%3
3.8
3%
32
.37
%2
8.7
9%
Fiji
11
.18
%6
.84
%8
.64
%9
.72
%1
1.2
8%
8.5
3%
11
.07
%1
2.3
0%
11
.14
%1
0.2
3%
8.8
8%
12
.24
%1
2.2
6%
10
.84
%1
2.5
4%
11
.77
%1
2.3
1%
12
.17
%1
3.0
2%
13
.22
%1
3.6
4%
14
.62
%1
4.6
5%
14
.16
%1
5.9
6%
16
.66
%
Fin
lan
d8
.53
%8
.29
%7
.96
%7
.61
%7
.46
%7
.95
%8
.12
%8
.07
%7
.83
%7
.11
%6
.43
%6
.05
%5
.81
%5
.77
%4
.79
%4
.75
%4
.94
%5
.93
%6
.19
%5
.98
%5
.84
%6
.28
%7
.14
%7
.16
%6
.84
%7
.28
%
Fran
ce8
.92
%8
.81
%8
.45
%8
.26
%8
.12
%8
.05
%7
.78
%7
.71
%7
.52
%7
.40
%7
.25
%7
.15
%7
.03
%6
.83
%5
.97
%5
.89
%6
.28
%7
.58
%8
.06
%7
.81
%7
.63
%8
.15
%8
.93
%8
.70
%8
.09
%8
.22
%
Gab
on
3.3
2%
4.1
1%
3.7
1%
3.2
5%
2.9
7%
3.2
9%
3.6
4%
3.3
7%
2.7
5%
3.1
6%
3.0
8%
2.8
7%
3.0
1%
3.0
5%
3.1
7%
3.0
8%
2.7
7%
2.4
2%
3.3
2%
3.4
8%
3.5
1%
3.8
4%
4.4
4%
4.5
0%
4.4
6%
4.9
1%
Gam
bia
39
.36
%3
7.8
7%
38
.18
%4
0.1
6%
36
.63
%4
1.7
3%
36
.87
%3
5.8
0%
34
.65
%3
6.3
6%
30
.21
%3
3.3
2%
29
.50
%3
4.2
9%
32
.54
%2
8.6
8%
24
.70
%2
5.6
2%
37
.59
%3
7.6
4%
36
.99
%2
6.4
0%
26
.80
%2
7.0
5%
33
.57
%2
2.1
7%
Geo
rgia
#N/A
#N/A
#N/A
#N/A
#N/A
#N/A
24
.49
%3
2.5
6%
33
.87
%4
4.8
7%
43
.41
%3
9.0
7%
33
.00
%3
2.4
3%
38
.71
%3
3.7
5%
26
.87
%2
7.1
5%
32
.87
%3
0.9
4%
38
.59
%3
7.6
8%
43
.83
%4
1.3
1%
43
.52
%1
6.0
1%
Ger
man
y3
.38
%3
.27
%3
.14
%2
.92
%2
.86
%6
.97
%6
.99
%6
.92
%6
.72
%6
.65
%6
.50
%6
.27
%6
.16
%6
.02
%5
.20
%5
.07
%5
.26
%6
.16
%6
.55
%6
.32
%6
.11
%6
.49
%6
.95
%6
.76
%6
.14
%6
.55
%
Gh
ana
43
.59
%4
4.1
3%
45
.88
%5
0.6
1%
41
.01
%6
1.7
3%
60
.20
%6
2.3
5%
57
.61
%6
2.2
9%
57
.27
%5
8.2
7%
60
.96
%6
3.0
4%
60
.56
%6
1.7
8%
64
.95
%5
9.4
4%
58
.22
%5
9.5
7%
53
.82
%5
0.6
1%
54
.23
%5
5.7
8%
55
.40
%4
3.2
7%
Gre
ece
9.3
2%
9.9
1%
10
.06
%9
.87
%8
.68
%9
.65
%9
.52
%9
.47
%9
.87
%1
0.1
6%
9.7
9%
9.1
7%
8.7
3%
9.1
1%
8.4
0%
8.8
5%
10
.37
%1
2.5
0%
13
.29
%1
2.6
2%
12
.57
%1
3.6
8%
15
.15
%1
4.8
9%
15
.08
%1
4.2
5%
Gre
nad
a1
.85
%#N
/A1
.38
%4
.19
%5
.88
%6
.40
%6
.53
%8
.88
%8
.47
%8
.69
%1
0.3
3%
7.2
2%
6.7
4%
4.1
3%
3.8
3%
2.9
8%
4.9
4%
4.1
2%
7.1
9%
5.7
8%
6.7
6%
6.5
2%
6.9
0%
8.0
0%
7.7
9%
7.3
3%
Gu
atem
ala
#N/A
#N/A
#N/A
#N/A
#N/A
#N/A
#N/A
#N/A
#N/A
#N/A
#N/A
#N/A
#N/A
#N/A
28
.63
%2
6.3
2%
27
.53
%2
7.7
4%
28
.98
%3
1.9
7%
32
.10
%3
3.6
1%
39
.13
%3
6.6
6%
37
.86
%#N
/A
Gu
inea
52
.21
%5
1.7
1%
51
.34
%5
1.7
4%
51
.81
%5
2.8
0%
54
.90
%5
3.9
4%
55
.38
%5
4.8
9%
53
.39
%5
2.2
0%
49
.13
%4
8.9
2%
49
.32
%4
8.1
4%
48
.71
%5
1.5
5%
52
.15
%5
2.9
9%
53
.70
%5
6.3
7%
55
.30
%5
4.8
5%
57
.29
%5
5.9
8%
Gu
inea
-Bis
sau
13
.92
%1
5.8
9%
15
.33
%1
5.1
7%
12
.71
%1
2.3
0%
17
.04
%1
3.7
0%
9.5
1%
11
.60
%1
0.5
7%
7.2
3%
12
.28
%8
.98
%1
1.5
6%
10
.57
%1
2.1
3%
13
.41
%1
3.5
5%
8.0
6%
15
.54
%1
3.7
3%
8.1
0%
13
.03
%1
8.0
9%
#N/A
Gu
yan
a#N
/A#N
/A#N
/A#N
/A#N
/A#N
/A#N
/A#N
/A#N
/A#N
/A#N
/A#N
/A#N
/A#N
/A#N
/A#N
/A#N
/A#N
/A#N
/A#N
/A#N
/A#N
/A#N
/A#N
/A#N
/A#N
/A
Hai
ti#N
/A#N
/A#N
/A#N
/A#N
/A#N
/A#N
/A#N
/A#N
/A#N
/A#N
/A#N
/A1
4.7
4%
14
.01
%1
3.4
1%
13
.01
%1
4.2
5%
14
.35
%1
5.7
4%
15
.87
%1
7.8
1%
17
.44
%1
9.9
9%
18
.45
%2
3.9
8%
18
.54
%
Ho
nd
ura
s#N
/A2
.77
%3
.50
%4
.32
%5
.32
%8
.11
%9
.44
%1
0.8
8%
14
.71
%1
1.5
6%
15
.43
%1
4.9
0%
10
.30
%1
5.2
5%
11
.80
%1
3.7
0%
15
.46
%1
6.6
4%
15
.72
%1
6.1
2%
15
.68
%1
5.1
5%
15
.28
%1
5.0
9%
11
.70
%8
.86
%
Hu
nga
ry7
.10
%7
.08
%7
.06
%6
.86
%6
.46
%6
.69
%5
.14
%5
.72
%5
.66
%9
.65
%9
.00
%8
.39
%8
.02
%7
.33
%6
.31
%6
.69
%7
.51
%8
.80
%9
.40
%9
.22
%8
.74
%1
0.5
4%
11
.67
%1
0.1
9%
10
.31
%1
0.2
1%
Icel
and
4.0
6%
3.6
9%
3.5
4%
3.2
8%
9.2
4%
9.2
8%
10
.07
%8
.16
%7
.43
%7
.87
%7
.57
%7
.14
%7
.12
%6
.94
%6
.21
%5
.17
%5
.67
%6
.14
%6
.39
%6
.48
%5
.97
%6
.49
%5
.35
%4
.62
%4
.93
%5
.36
%
Ind
ia3
0.5
2%
28
.99
%2
9.0
5%
28
.98
%2
7.6
1%
27
.84
%2
7.3
0%
26
.96
%2
6.4
2%
24
.51
%2
3.7
3%
23
.36
%2
2.5
6%
21
.91
%2
3.9
6%
23
.20
%2
1.3
5%
21
.82
%2
0.2
2%
20
.40
%1
9.2
9%
21
.09
%2
0.4
3%
17
.95
%1
9.4
4%
12
.73
%
Ind
on
esia
16
.98
%1
6.6
3%
16
.47
%1
6.3
4%
15
.46
%1
4.6
4%
15
.08
%1
4.1
2%
13
.45
%1
4.8
0%
13
.93
%1
2.3
6%
13
.80
%1
4.3
5%
24
.08
%2
1.6
6%
25
.31
%2
6.7
2%
25
.23
%2
2.3
5%
25
.71
%2
8.0
5%
29
.27
%2
7.5
7%
32
.01
%1
3.6
1%
Iran
13
.35
%1
3.7
5%
14
.35
%1
5.8
0%
14
.92
%1
3.5
2%
13
.91
%1
4.4
3%
14
.01
%1
5.3
2%
14
.51
%1
4.6
6%
13
.84
%1
3.5
0%
10
.72
%1
0.4
7%
10
.55
%9
.87
%1
1.2
9%
11
.64
%1
1.8
2%
13
.09
%1
7.8
0%
17
.72
%1
7.4
3%
10
.38
%
Iraq
#N/A
#N/A
#N/A
#N/A
#N/A
#N/A
#N/A
#N/A
#N/A
#N/A
#N/A
#N/A
#N/A
#N/A
4.8
6%
4.4
6%
4.1
8%
5.4
5%
4.1
2%
5.4
6%
5.2
8%
4.8
7%
7.7
9%
6.6
8%
7.7
6%
7.4
5%
Irel
and
4.6
5%
2.3
7%
1.6
4%
1.3
2%
2.1
8%
2.4
2%
#N/A
#N/A
#N/A
5.6
7%
5.3
8%
4.7
8%
4.5
1%
4.1
2%
3.6
0%
3.5
0%
3.5
5%
4.0
4%
4.2
2%
4.0
3%
4.0
6%
4.3
8%
4.9
6%
4.8
7%
4.3
9%
4.4
7%
Isra
el3
.96
%3
.75
%3
.80
%4
.01
%3
.78
%3
.46
%3
.65
%3
.56
%3
.56
%3
.61
%3
.71
%3
.57
%3
.40
%3
.32
%1
0.0
6%
10
.01
%9
.10
%9
.55
%9
.25
%9
.03
%9
.34
%1
0.0
0%
11
.63
%1
0.8
1%
11
.35
%1
1.7
8%
Ital
y8
.07
%7
.97
%7
.74
%7
.73
%7
.77
%7
.89
%8
.14
%8
.10
%8
.08
%8
.08
%8
.16
%8
.06
%8
.06
%7
.93
%6
.70
%6
.42
%6
.86
%8
.38
%9
.01
%8
.81
%8
.73
%9
.31
%1
0.1
5%
10
.04
%9
.39
%9
.65
%
Jap
an3
.67
%3
.51
%3
.33
%3
.21
%2
.99
%2
.81
%2
.91
%2
.81
%1
3.0
0%
13
.69
%1
1.0
8%
9.5
6%
9.1
4%
10
.35
%1
0.4
6%
9.0
3%
8.5
1%
8.7
0%
8.8
8%
8.0
2%
7.3
1%
7.0
2%
7.8
5%
9.0
7%
8.9
6%
9.0
4%
Jord
an1
5.9
7%
16
.13
%1
6.8
2%
13
.71
%2
2.0
4%
19
.66
%1
8.5
8%
17
.82
%1
6.5
8%
15
.86
%1
5.4
7%
14
.97
%1
4.9
8%
13
.38
%3
4.6
4%
33
.43
%3
1.5
9%
31
.08
%3
3.0
7%
34
.83
%3
5.2
9%
37
.60
%3
8.9
1%
37
.23
%4
0.3
8%
13
.44
%
Kaz
akh
stan
#N/A
#N/A
#N/A
#N/A
#N/A
#N/A
17
.93
%1
6.2
0%
16
.84
%1
3.7
8%
11
.81
%1
1.1
7%
10
.11
%1
2.4
8%
17
.51
%1
5.9
3%
14
.35
%1
5.5
9%
17
.01
%1
8.3
3%
19
.65
%2
2.2
0%
27
.96
%2
3.9
2%
23
.37
%1
0.5
6%
Ken
ya1
9.1
8%
20
.31
%2
0.5
2%
22
.85
%2
1.6
5%
23
.00
%2
5.3
1%
21
.88
%2
4.2
4%
20
.97
%1
7.6
6%
21
.47
%2
0.0
1%
23
.09
%3
4.5
1%
32
.90
%3
0.8
4%
33
.16
%3
1.9
2%
34
.17
%3
6.8
9%
38
.86
%4
3.5
6%
43
.35
%4
1.1
9%
27
.08
%
Kir
ibat
i3
0.1
4%
35
.84
%3
2.9
0%
30
.31
%2
7.2
3%
32
.30
%3
1.2
0%
29
.66
%2
9.2
6%
38
.27
%3
6.1
5%
30
.35
%2
7.3
2%
28
.53
%2
3.8
2%
22
.10
%2
4.4
6%
23
.37
%2
7.0
7%
39
.76
%4
7.4
1%
62
.35
%5
2.1
4%
37
.34
%3
6.1
5%
43
.12
%
Ku
wai
t#N
/A#N
/A#N
/A#N
/A#N
/A#N
/A3
.36
%2
.70
%2
.60
%2
.59
%2
.72
%2
.58
%2
.57
%2
.47
%3
.85
%3
.77
%4
.21
%3
.82
%3
.67
%3
.81
%3
.88
%4
.25
%5
.00
%5
.43
%6
.04
%2
.36
%
Kyr
gyzs
tan
#N/A
#N/A
#N/A
#N/A
#N/A
#N/A
59
.08
%5
7.3
3%
58
.93
%5
8.4
9%
62
.53
%5
9.4
6%
62
.98
%6
4.4
0%
63
.37
%6
2.6
3%
60
.93
%5
8.4
1%
55
.38
%5
5.4
2%
55
.57
%5
3.7
6%
52
.98
%5
1.6
3%
52
.95
%5
2.6
1%
Lao
41
.71
%4
0.3
6%
36
.50
%3
7.2
1%
37
.54
%3
4.7
1%
37
.91
%3
4.7
2%
38
.65
%3
1.1
6%
33
.11
%3
4.2
6%
34
.47
%3
6.8
0%
46
.26
%4
5.2
1%
50
.70
%4
5.3
2%
44
.61
%4
5.5
1%
42
.43
%4
2.7
2%
39
.79
%4
1.5
8%
40
.11
%3
9.5
5%

100
Tab
le 1
0. N
ER 'F
oo
d' D
atas
et
Are
as
19
61
19
62
19
63
19
64
19
65
19
66
19
67
19
68
19
69
19
70
19
71
19
72
19
73
19
74
19
75
19
76
19
77
19
78
19
79
19
80
19
81
19
82
19
83
19
84
19
85
Latv
ia#N
/A#N
/A#N
/A#N
/A#N
/A#N
/A#N
/A#N
/A#N
/A#N
/A#N
/A#N
/A#N
/A#N
/A#N
/A#N
/A#N
/A#N
/A#N
/A#N
/A#N
/A#N
/A#N
/A#N
/A#N
/A
Leb
ano
n#N
/A#N
/A#N
/A#N
/A#N
/A#N
/A#N
/A#N
/A#N
/A#N
/A#N
/A#N
/A#N
/A#N
/A#N
/A#N
/A#N
/A#N
/A#N
/A#N
/A#N
/A#N
/A#N
/A#N
/A#N
/A
Leso
tho
36
.56
%3
3.0
7%
32
.10
%2
8.0
5%
31
.10
%2
7.6
6%
24
.14
%2
3.1
0%
21
.51
%2
5.1
2%
26
.62
%2
5.9
5%
23
.39
%2
4.7
1%
36
.25
%3
7.7
4%
33
.81
%3
2.7
2%
34
.09
%3
8.9
1%
35
.04
%3
5.9
7%
43
.64
%3
6.5
6%
25
.77
%
Lib
eria
15
.06
%1
6.0
2%
17
.63
%1
4.1
7%
16
.15
%1
4.1
1%
14
.58
%1
4.0
5%
11
.37
%1
3.5
9%
13
.82
%1
2.0
8%
14
.21
%1
5.2
2%
14
.91
%1
4.3
1%
8.4
2%
11
.55
%1
2.9
7%
13
.68
%1
6.8
6%
16
.06
%1
6.6
8%
17
.05
%1
3.3
7%
Lith
uan
ia#N
/A#N
/A#N
/A#N
/A#N
/A#N
/A#N
/A#N
/A#N
/A#N
/A#N
/A#N
/A#N
/A#N
/A#N
/A#N
/A#N
/A#N
/A#N
/A#N
/A#N
/A#N
/A#N
/A#N
/A#N
/A
Luxe
mb
ou
rg#N
/A#N
/A#N
/A#N
/A#N
/A#N
/A#N
/A#N
/A#N
/A#N
/A#N
/A#N
/A#N
/A#N
/A#N
/A#N
/A#N
/A#N
/A#N
/A#N
/A#N
/A#N
/A#N
/A#N
/A#N
/A
Mac
edo
nia
#N/A
#N/A
#N/A
#N/A
#N/A
#N/A
#N/A
#N/A
#N/A
#N/A
#N/A
#N/A
#N/A
#N/A
#N/A
#N/A
#N/A
#N/A
#N/A
#N/A
#N/A
#N/A
#N/A
#N/A
#N/A
Mad
agas
car
23
.15
%2
1.2
1%
25
.65
%2
5.2
8%
26
.12
%2
5.1
7%
24
.95
%2
2.7
9%
25
.74
%2
1.9
1%
22
.04
%2
1.6
6%
21
.78
%2
6.3
8%
19
.81
%2
2.6
8%
16
.63
%1
8.8
2%
19
.38
%1
9.1
7%
30
.74
%3
3.1
7%
33
.20
%3
0.5
6%
34
.10
%
Mal
awi
70
.91
%7
6.4
0%
75
.95
%7
9.7
6%
73
.80
%6
5.4
0%
71
.23
%7
0.2
2%
69
.73
%6
9.3
8%
69
.32
%6
9.5
0%
71
.35
%6
4.5
8%
60
.12
%5
9.1
6%
59
.06
%5
6.0
0%
50
.83
%4
8.2
0%
53
.79
%5
9.2
8%
48
.08
%4
4.4
4%
45
.07
%
Mal
aysi
a2
1.1
4%
19
.27
%2
0.3
2%
19
.82
%1
7.6
4%
16
.03
%1
5.7
2%
15
.43
%1
4.8
1%
14
.73
%1
3.8
4%
13
.88
%1
4.5
2%
16
.46
%1
5.3
2%
13
.37
%1
2.8
9%
13
.40
%1
3.1
8%
13
.57
%1
3.4
8%
13
.35
%1
1.9
1%
11
.58
%1
1.8
8%
Mal
div
es#N
/A#N
/A#N
/A#N
/A#N
/A#N
/A#N
/A#N
/A#N
/A#N
/A#N
/A#N
/A#N
/A#N
/A#N
/A#N
/A#N
/A#N
/A#N
/A#N
/A#N
/A#N
/A#N
/A#N
/A#N
/A
Mal
i#N
/A#N
/A#N
/A#N
/A#N
/A#N
/A6
3.5
2%
60
.51
%6
5.6
5%
62
.98
%6
0.8
1%
53
.24
%5
6.8
3%
69
.96
%6
0.0
6%
48
.91
%4
4.8
5%
49
.76
%4
3.5
5%
49
.37
%5
5.7
0%
63
.07
%5
8.4
9%
53
.72
%6
7.9
1%
Mal
ta#N
/A#N
/A#N
/A#N
/A#N
/A#N
/A#N
/A#N
/A#N
/A2
2.0
1%
23
.33
%2
2.4
9%
26
.54
%2
7.7
1%
22
.03
%1
7.7
0%
15
.01
%1
3.8
7%
13
.60
%1
5.5
2%
11
.93
%1
1.1
4%
9.6
2%
9.0
5%
8.9
7%
Mau
rita
nia
9.4
4%
10
.83
%1
0.1
8%
8.7
9%
8.1
9%
7.2
7%
8.1
3%
8.3
7%
7.8
3%
7.1
4%
7.7
4%
8.1
8%
14
.14
%1
6.1
6%
17
.72
%1
6.9
9%
18
.46
%1
7.4
0%
15
.42
%1
6.9
2%
16
.29
%2
0.9
5%
22
.62
%1
9.0
3%
18
.38
%
Mau
riti
us
#N/A
#N/A
#N/A
#N/A
#N/A
#N/A
#N/A
#N/A
#N/A
#N/A
#N/A
#N/A
#N/A
#N/A
#N/A
3.0
9%
1.4
9%
6.3
8%
3.5
7%
#N/A
12
.20
%1
1.0
0%
5.5
5%
7.9
1%
9.1
9%
Mex
ico
4.9
4%
5.1
0%
5.0
3%
4.4
8%
4.4
2%
4.5
8%
4.3
7%
4.1
4%
4.0
1%
4.1
7%
4.1
3%
4.1
0%
4.0
6%
4.3
4%
4.4
7%
3.7
4%
4.0
1%
4.0
8%
3.6
8%
4.4
9%
4.4
2%
3.9
3%
4.4
9%
4.1
6%
4.1
3%
Mo
ldo
va#N
/A#N
/A#N
/A#N
/A#N
/A#N
/A#N
/A#N
/A#N
/A#N
/A#N
/A#N
/A#N
/A#N
/A#N
/A#N
/A#N
/A#N
/A#N
/A#N
/A#N
/A#N
/A#N
/A#N
/A#N
/A
Mo
ngo
lia#N
/A#N
/A#N
/A#N
/A#N
/A#N
/A#N
/A#N
/A#N
/A#N
/A#N
/A#N
/A#N
/A#N
/A#N
/A#N
/A#N
/A#N
/A#N
/A#N
/A2
4.7
6%
25
.28
%2
3.2
4%
21
.20
%2
4.4
9%
Mo
nte
neg
ro#N
/A#N
/A#N
/A#N
/A#N
/A#N
/A#N
/A#N
/A#N
/A#N
/A#N
/A#N
/A#N
/A#N
/A#N
/A#N
/A#N
/A#N
/A#N
/A#N
/A#N
/A#N
/A#N
/A#N
/A#N
/A
Mo
rocc
o#N
/A#N
/A#N
/A#N
/A#N
/A2
4.0
7%
24
.04
%2
8.4
2%
20
.44
%2
1.1
8%
23
.24
%2
1.1
4%
19
.16
%2
4.7
1%
23
.79
%1
9.9
3%
16
.03
%1
8.1
6%
17
.56
%1
7.9
8%
19
.33
%1
9.0
0%
17
.11
%1
7.6
5%
16
.73
%
Mo
zam
biq
ue
#N/A
#N/A
#N/A
#N/A
#N/A
#N/A
#N/A
#N/A
#N/A
#N/A
#N/A
#N/A
#N/A
#N/A
#N/A
#N/A
#N/A
#N/A
#N/A
51
.08
%4
9.5
8%
53
.64
%6
8.7
0%
75
.81
%7
7.3
4%
Nam
ibia
#N/A
#N/A
#N/A
#N/A
#N/A
#N/A
#N/A
#N/A
#N/A
#N/A
#N/A
#N/A
#N/A
#N/A
#N/A
#N/A
#N/A
#N/A
#N/A
5.8
7%
4.1
6%
6.5
9%
7.2
6%
7.9
2%
8.3
0%
Nep
al3
6.6
7%
37
.51
%3
8.1
7%
28
.10
%3
3.2
7%
30
.91
%3
0.9
3%
32
.69
%3
8.0
3%
43
.24
%4
0.0
0%
40
.75
%4
1.4
3%
46
.10
%4
6.2
5%
44
.11
%4
5.1
0%
46
.69
%4
4.1
3%
50
.15
%4
7.6
5%
44
.28
%5
5.8
9%
50
.49
%4
7.3
3%
Net
her
lan
ds
3.2
8%
3.2
3%
3.1
8%
2.9
6%
2.3
5%
2.5
5%
2.7
8%
2.4
8%
2.3
6%
2.1
9%
2.0
1%
1.7
2%
1.3
4%
1.6
5%
1.1
8%
1.1
5%
1.5
2%
1.3
1%
1.4
1%
7.8
7%
7.5
8%
7.4
5%
7.2
5%
6.9
0%
6.8
2%
New
Zea
lan
d#N
/A#N
/A#N
/A#N
/A#N
/A#N
/A#N
/A#N
/A#N
/A3
.06
%3
.08
%1
.91
%#N
/A#N
/A2
.58
%3
.00
%2
.31
%2
.43
%#N
/A#N
/A#N
/A1
.40
%1
.44
%2
.32
%3
.53
%
Nic
arag
ua
6.9
6%
6.1
5%
5.2
1%
5.5
9%
5.1
6%
6.4
1%
6.1
6%
6.5
1%
5.8
0%
4.9
3%
5.1
2%
3.5
6%
4.1
1%
5.2
4%
4.4
9%
#N/A
#N/A
#N/A
#N/A
2.5
5%
6.0
7%
5.3
7%
5.8
7%
7.5
4%
7.6
9%
Nig
er3
4.0
8%
34
.18
%3
2.6
0%
32
.97
%2
9.8
1%
32
.75
%3
6.4
2%
32
.03
%3
7.8
3%
34
.25
%3
4.4
2%
36
.06
%3
4.6
6%
40
.41
%3
5.0
7%
41
.01
%4
2.5
4%
42
.38
%4
0.0
5%
43
.61
%4
6.1
8%
44
.28
%4
7.9
3%
41
.89
%4
9.2
1%
Nig
eria
58
.82
%5
8.2
9%
56
.90
%5
5.4
8%
55
.48
%5
7.2
4%
69
.50
%7
2.3
5%
64
.90
%5
6.8
4%
45
.85
%3
8.4
6%
38
.60
%3
7.4
9%
40
.64
%3
5.1
0%
33
.47
%3
5.6
3%
34
.93
%3
6.4
1%
42
.98
%4
2.8
6%
44
.07
%4
5.9
7%
45
.11
%
No
rway
4.3
7%
4.4
9%
4.7
1%
4.3
6%
4.0
2%
3.9
5%
3.7
3%
3.7
5%
3.3
5%
6.6
1%
6.6
0%
6.8
8%
7.7
8%
7.8
1%
8.4
2%
7.9
8%
8.2
8%
8.2
0%
8.0
2%
8.0
7%
6.9
0%
6.3
0%
5.5
3%
4.8
4%
4.7
5%
Om
an6
.13
%5
.32
%5
.34
%5
.57
%5
.79
%5
.56
%3
.54
%1
.96
%1
.66
%1
.59
%1
.89
%1
.73
%3
.41
%4
.07
%4
.13
%3
.82
%4
.40
%4
.68
%5
.30
%6
.36
%5
.77
%5
.88
%5
.14
%4
.67
%4
.07
%
Pak
ista
n4
9.8
9%
48
.14
%4
4.7
5%
44
.25
%4
4.3
4%
38
.16
%4
0.4
8%
42
.72
%3
8.2
2%
35
.65
%3
5.6
2%
36
.85
%3
6.1
1%
34
.90
%3
5.5
6%
34
.33
%3
3.0
7%
31
.82
%3
3.5
2%
28
.61
%2
7.3
2%
27
.51
%2
7.0
4%
25
.61
%2
6.0
5%
Pan
ama
11
.22
%1
2.3
4%
11
.59
%1
0.2
0%
8.5
7%
7.6
0%
6.4
7%
5.8
6%
5.3
5%
4.9
2%
6.0
1%
5.4
9%
6.0
0%
6.4
4%
4.3
5%
5.5
0%
5.8
9%
5.0
2%
5.4
9%
4.1
9%
4.3
5%
5.0
4%
4.7
8%
5.3
7%
5.7
5%
Pap
ua
New
Gu
inea
37
.84
%3
6.0
7%
34
.28
%3
2.4
2%
30
.15
%3
0.9
4%
28
.77
%2
7.8
5%
25
.33
%2
3.6
2%
23
.05
%2
4.1
1%
22
.47
%2
0.7
6%
20
.77
%2
2.7
1%
8.0
6%
10
.34
%1
1.1
3%
16
.83
%2
4.1
7%
25
.05
%2
2.0
0%
20
.89
%2
1.8
1%
Par
agu
ay2
9.8
9%
29
.44
%2
6.8
2%
27
.64
%2
5.8
8%
27
.33
%2
6.1
5%
25
.52
%2
5.4
2%
24
.86
%2
2.7
7%
18
.85
%1
5.3
1%
17
.42
%1
5.7
6%
19
.53
%1
9.8
7%
18
.84
%1
9.1
8%
17
.18
%1
7.9
6%
18
.59
%2
0.0
5%
20
.18
%2
1.3
6%
Per
u5
.73
%5
.80
%5
.43
%5
.73
%6
.50
%6
.22
%6
.19
%5
.48
%6
.17
%5
.51
%5
.64
%5
.16
%4
.40
%4
.59
%4
.42
%4
.85
%4
.14
%3
.92
%3
.72
%5
.22
%5
.95
%5
.44
%6
.08
%5
.25
%4
.81
%
Ph
ilip
pin
es1
6.9
6%
17
.09
%1
6.1
3%
16
.18
%1
7.4
2%
16
.61
%1
6.9
9%
15
.89
%1
6.3
9%
15
.13
%1
4.9
9%
14
.50
%1
3.4
8%
11
.03
%1
2.7
7%
13
.37
%1
2.1
2%
13
.66
%1
3.2
7%
11
.66
%1
2.4
9%
13
.43
%1
2.6
5%
13
.63
%1
5.0
3%
Po
lan
d#N
/A#N
/A#N
/A#N
/A#N
/A#N
/A#N
/A#N
/A#N
/A#N
/A#N
/A#N
/A#N
/A#N
/A#N
/A#N
/A#N
/A#N
/A#N
/A#N
/A#N
/A#N
/A#N
/A#N
/A#N
/A
Po
rtu
gal
14
.47
%1
6.0
4%
15
.35
%1
4.5
5%
14
.37
%1
1.3
2%
11
.48
%1
0.6
4%
9.9
6%
9.9
6%
8.5
6%
8.0
9%
7.9
7%
9.6
4%
9.2
5%
8.0
4%
7.0
0%
6.7
9%
7.8
8%
7.2
2%
7.0
5%
6.9
1%
5.9
2%
6.2
9%
6.1
6%
Qat
ar#N
/A#N
/A#N
/A#N
/A#N
/A#N
/A#N
/A#N
/A#N
/A#N
/A#N
/A#N
/A#N
/A#N
/A#N
/A#N
/A#N
/A#N
/A#N
/A#N
/A#N
/A#N
/A#N
/A#N
/A#N
/A
Rep
. Ko
rea
35
.18
%3
1.6
0%
33
.77
%3
5.7
6%
33
.38
%3
1.8
7%
28
.16
%2
5.5
2%
26
.37
%1
3.2
1%
12
.90
%1
2.7
1%
12
.75
%1
5.3
5%
14
.39
%1
6.1
9%
16
.38
%1
7.8
1%
19
.66
%1
8.0
0%
17
.40
%1
4.8
6%
12
.85
%1
1.5
6%
10
.45
%
Ro
man
ia#N
/A#N
/A#N
/A#N
/A#N
/A#N
/A#N
/A#N
/A#N
/A#N
/A#N
/A#N
/A#N
/A#N
/A#N
/A#N
/A#N
/A#N
/A#N
/A1
7.0
9%
18
.24
%1
8.9
2%
17
.43
%1
8.2
5%
17
.14
%
Ru
ssia
n F
eder
atio
n#N
/A#N
/A#N
/A#N
/A#N
/A#N
/A#N
/A#N
/A#N
/A#N
/A#N
/A#N
/A#N
/A#N
/A#N
/A#N
/A#N
/A#N
/A#N
/A#N
/A#N
/A#N
/A#N
/A#N
/A#N
/A
Rw
and
a5
3.3
6%
67
.33
%5
7.2
2%
58
.28
%6
0.4
8%
64
.79
%7
4.3
0%
66
.77
%6
6.0
6%
64
.75
%6
5.4
9%
64
.96
%6
3.5
5%
61
.02
%7
1.9
6%
57
.24
%5
2.7
4%
56
.03
%4
9.5
1%
54
.52
%5
5.0
1%
57
.87
%5
3.0
8%
51
.71
%5
9.2
2%
Sam
oa
#N/A
#N/A
#N/A
#N/A
#N/A
#N/A
#N/A
#N/A
#N/A
#N/A
#N/A
#N/A
#N/A
#N/A
#N/A
#N/A
#N/A
#N/A
#N/A
#N/A
#N/A
17
.22
%1
4.3
1%
14
.41
%1
5.2
9%
Sao
To
me
and
Pri
nci
pe
#N/A
#N/A
#N/A
#N/A
#N/A
#N/A
#N/A
#N/A
#N/A
#N/A
#N/A
#N/A
#N/A
#N/A
#N/A
#N/A
#N/A
#N/A
#N/A
#N/A
#N/A
#N/A
#N/A
#N/A
#N/A

101
Tab
le 1
0. N
ER 'F
oo
d' D
atas
et (
Co
nt.
)
Are
as
19
86
19
87
19
88
19
89
19
90
19
91
19
92
19
93
19
94
19
95
19
96
19
97
19
98
19
99
20
00
20
01
20
02
20
03
20
04
20
05
20
06
20
07
20
08
20
09
20
10
20
11
Latv
ia#N
/A#N
/A#N
/A#N
/A#N
/A#N
/A1
4.0
4%
12
.27
%1
0.3
2%
10
.00
%1
0.0
9%
9.3
1%
10
.08
%9
.65
%1
2.3
9%
11
.69
%1
2.2
5%
12
.58
%1
3.1
3%
12
.94
%1
2.7
8%
14
.21
%1
6.6
5%
16
.96
%1
3.1
6%
7.0
2%
Leb
ano
n#N
/A#N
/A1
1.7
7%
22
.56
%1
8.3
2%
14
.86
%1
5.2
3%
14
.30
%1
4.2
7%
14
.22
%1
3.0
1%
14
.47
%1
2.9
1%
12
.31
%1
1.9
7%
10
.90
%1
0.9
9%
10
.49
%1
0.6
9%
9.7
0%
9.6
2%
9.9
5%
9.9
8%
9.0
8%
9.0
4%
9.5
5%
Leso
tho
25
.82
%2
5.6
4%
28
.63
%2
5.4
3%
24
.40
%2
2.5
2%
21
.66
%2
0.7
9%
18
.17
%2
1.1
9%
20
.86
%1
8.5
7%
17
.98
%1
7.0
6%
14
.48
%1
4.1
3%
14
.49
%1
2.9
2%
11
.92
%1
0.5
2%
11
.47
%1
0.8
5%
13
.12
%1
2.7
7%
9.5
9%
9.3
0%
Lib
eria
15
.06
%1
5.9
3%
17
.59
%2
7.4
7%
37
.10
%5
6.3
7%
79
.90
%#N
/A#N
/A#N
/A#N
/A6
8.7
1%
54
.25
%4
3.1
1%
39
.12
%2
7.2
9%
21
.41
%3
3.3
1%
42
.69
%4
5.9
0%
39
.94
%3
4.0
7%
37
.04
%3
4.1
1%
33
.13
%2
6.7
6%
Lith
uan
ia#N
/A#N
/A#N
/A#N
/A#N
/A#N
/A9
.79
%1
1.6
0%
8.9
4%
8.4
1%
10
.60
%1
0.0
6%
9.5
9%
9.1
2%
14
.47
%1
3.4
9%
13
.67
%1
5.6
9%
17
.44
%1
6.6
1%
16
.70
%1
8.0
7%
19
.03
%1
7.0
0%
15
.17
%3
.58
%
Luxe
mb
ou
rg#N
/A#N
/A#N
/A#N
/A#N
/A#N
/A#N
/A#N
/A#N
/A4
.45
%4
.46
%4
.36
%4
.25
%3
.96
%3
.17
%3
.13
%3
.35
%3
.60
%3
.74
%3
.54
%3
.46
%3
.66
%4
.05
%4
.00
%3
.69
%3
.91
%
Mac
edo
nia
#N/A
#N/A
#N/A
#N/A
#N/A
#N/A
13
.45
%1
3.5
6%
17
.71
%1
7.7
7%
17
.27
%1
9.1
7%
19
.47
%1
6.1
9%
16
.94
%1
6.8
5%
20
.76
%2
5.5
3%
26
.33
%2
6.9
2%
26
.52
%2
9.6
4%
35
.87
%3
4.3
8%
32
.84
%1
4.9
4%
Mad
agas
car
33
.60
%3
1.8
3%
34
.56
%3
4.5
4%
35
.59
%3
8.2
9%
39
.19
%3
9.8
0%
36
.08
%3
8.3
8%
39
.85
%4
0.7
7%
38
.44
%3
7.3
7%
34
.55
%3
0.1
6%
33
.36
%3
3.2
3%
33
.26
%4
0.3
4%
38
.38
%3
6.9
1%
36
.79
%4
0.3
1%
42
.06
%4
0.4
5%
Mal
awi
49
.57
%4
9.4
0%
52
.16
%5
3.4
3%
47
.74
%5
0.0
4%
47
.23
%5
7.2
1%
53
.64
%5
0.4
4%
54
.17
%4
9.4
6%
59
.14
%6
6.1
4%
#N/A
#N/A
73
.18
%7
3.4
6%
74
.29
%6
3.2
7%
#N/A
#N/A
#N/A
#N/A
#N/A
#N/A
Mal
aysi
a1
1.7
2%
10
.92
%1
1.2
8%
12
.14
%1
1.3
7%
10
.90
%1
0.6
1%
10
.63
%9
.86
%9
.91
%9
.64
%9
.42
%8
.92
%9
.20
%7
.72
%7
.62
%7
.25
%6
.85
%6
.59
%6
.54
%6
.57
%7
.05
%7
.58
%7
.19
%7
.78
%9
.21
%
Mal
div
es#N
/A#N
/A#N
/A#N
/A#N
/A#N
/A#N
/A#N
/A#N
/A#N
/A#N
/A#N
/A#N
/A#N
/A#N
/A9
.72
%8
.90
%8
.54
%8
.82
%9
.49
%9
.76
%1
0.5
3%
11
.30
%9
.78
%1
1.9
2%
12
.67
%
Mal
i6
6.5
5%
63
.71
%7
1.0
8%
64
.50
%6
7.6
2%
73
.08
%6
0.1
6%
63
.07
%6
5.5
3%
63
.11
%6
5.3
6%
61
.56
%6
3.7
4%
61
.70
%5
5.7
3%
53
.59
%5
6.1
6%
59
.30
%5
3.9
2%
59
.71
%5
5.4
2%
60
.98
%6
1.5
7%
67
.76
%6
5.2
8%
64
.12
%
Mal
ta8
.49
%9
.07
%9
.14
%8
.75
%8
.52
%8
.39
%8
.28
%7
.28
%6
.73
%7
.88
%8
.44
%7
.58
%7
.40
%6
.72
%5
.93
%5
.84
%5
.70
%6
.26
%7
.11
%6
.69
%6
.69
%7
.48
%7
.76
%7
.34
%6
.48
%7
.46
%
Mau
rita
nia
14
.73
%1
5.9
3%
19
.24
%1
9.9
7%
17
.25
%1
7.5
0%
15
.85
%1
3.5
9%
11
.82
%1
1.6
6%
12
.82
%1
4.5
2%
21
.12
%1
3.8
8%
15
.21
%1
7.0
8%
16
.70
%1
7.2
3%
17
.69
%1
2.2
9%
14
.96
%1
5.4
4%
17
.24
%1
8.9
6%
13
.39
%1
3.2
5%
Mau
riti
us
4.6
6%
2.3
5%
2.3
6%
4.1
0%
3.9
0%
4.6
0%
4.4
2%
5.3
9%
5.3
3%
5.2
7%
4.3
9%
6.6
7%
5.1
1%
4.6
8%
7.9
2%
6.6
2%
6.3
0%
6.4
4%
6.3
7%
6.0
7%
5.8
4%
6.9
4%
8.2
9%
8.5
5%
7.8
1%
7.3
3%
Mex
ico
3.9
5%
4.0
0%
4.0
5%
4.0
1%
4.2
4%
3.9
4%
4.1
1%
3.9
4%
3.9
3%
3.8
2%
3.9
0%
3.6
2%
3.7
1%
3.8
6%
13
.20
%1
4.5
1%
14
.83
%1
5.0
8%
15
.42
%1
6.0
1%
15
.81
%1
6.5
5%
16
.80
%1
3.9
7%
15
.55
%1
5.9
5%
Mo
ldo
va#N
/A#N
/A#N
/A#N
/A#N
/A#N
/A3
5.0
2%
38
.18
%3
3.5
5%
35
.17
%3
4.6
1%
34
.43
%3
2.9
7%
33
.60
%3
5.9
1%
36
.38
%3
5.5
9%
33
.53
%3
4.9
2%
31
.31
%2
9.0
3%
22
.83
%3
0.7
9%
25
.48
%2
5.7
7%
26
.60
%
Mo
ngo
lia2
0.8
0%
21
.15
%2
0.8
2%
22
.57
%2
3.5
3%
27
.36
%2
7.5
4%
29
.06
%2
4.2
1%
23
.62
%2
5.9
0%
24
.37
%2
5.6
3%
25
.83
%2
6.3
7%
21
.97
%2
0.1
0%
17
.58
%1
9.5
2%
16
.97
%1
6.4
9%
17
.21
%2
0.9
1%
21
.19
%1
7.5
8%
18
.43
%
Mo
nte
neg
ro#N
/A#N
/A#N
/A#N
/A#N
/A#N
/A#N
/A#N
/A#N
/A#N
/A#N
/A#N
/A#N
/A#N
/A#N
/A#N
/A#N
/A#N
/A#N
/A#N
/A1
1.0
1%
12
.98
%1
6.6
9%
15
.92
%1
4.8
4%
16
.04
%
Mo
rocc
o1
7.9
0%
17
.04
%1
8.9
6%
20
.40
%1
8.1
2%
18
.80
%1
6.5
5%
17
.41
%1
8.7
9%
15
.45
%1
9.5
3%
17
.02
%1
7.5
0%
16
.23
%2
3.6
6%
21
.07
%2
1.3
3%
23
.79
%2
5.0
9%
24
.79
%2
4.5
1%
27
.00
%3
0.3
9%
29
.79
%2
9.3
2%
17
.43
%
Mo
zam
biq
ue
75
.19
%6
8.0
1%
64
.20
%6
0.8
9%
61
.90
%5
5.8
8%
56
.15
%5
4.7
3%
48
.33
%7
7.5
3%
75
.43
%7
0.7
8%
67
.90
%6
4.7
5%
61
.92
%5
7.1
3%
52
.55
%5
1.0
3%
50
.21
%4
3.4
1%
39
.72
%4
0.7
7%
40
.51
%4
1.0
9%
45
.64
%4
3.6
0%
Nam
ibia
7.5
0%
5.8
7%
6.0
4%
6.1
5%
7.2
0%
6.2
0%
5.2
2%
5.7
7%
5.0
4%
5.3
3%
5.5
4%
9.8
3%
5.8
9%
8.9
1%
8.7
2%
7.4
5%
6.6
6%
6.6
5%
6.2
9%
6.6
1%
6.1
5%
6.0
7%
5.5
9%
5.0
2%
4.7
0%
4.9
3%
Nep
al4
5.1
0%
49
.27
%5
0.1
8%
50
.80
%5
0.4
6%
49
.40
%4
6.8
5%
48
.70
%4
5.5
1%
46
.95
%4
4.3
5%
44
.29
%4
5.8
7%
43
.23
%4
3.1
2%
41
.96
%4
1.9
1%
43
.17
%4
3.4
7%
43
.21
%4
2.7
3%
42
.07
%4
1.7
6%
41
.18
%4
1.5
7%
44
.14
%
Net
her
lan
ds
6.5
9%
6.2
5%
5.9
8%
5.8
0%
5.5
4%
5.3
9%
5.3
8%
5.2
7%
5.2
3%
5.1
2%
5.0
1%
4.9
4%
4.9
1%
4.7
7%
3.9
9%
3.9
5%
4.2
6%
5.0
8%
5.3
6%
5.0
6%
5.0
2%
5.3
7%
5.8
9%
5.6
4%
5.4
0%
5.6
0%
New
Zea
lan
d3
.22
%6
.68
%7
.50
%7
.19
%7
.45
%7
.06
%6
.59
%6
.24
%6
.84
%7
.44
%7
.83
%7
.47
%6
.14
%5
.92
%5
.28
%4
.79
%5
.26
%6
.59
%7
.70
%8
.14
%7
.59
%8
.63
%8
.55
%7
.73
%9
.45
%1
0.2
3%
Nic
arag
ua
8.4
7%
7.8
9%
11
.48
%1
0.4
9%
9.6
4%
12
.42
%1
4.8
0%
14
.04
%1
1.6
4%
10
.79
%1
0.7
1%
9.6
8%
13
.17
%1
2.9
2%
12
.22
%1
3.4
0%
13
.64
%1
4.7
4%
12
.43
%1
2.7
3%
13
.19
%1
1.5
5%
11
.43
%1
1.3
1%
8.2
1%
8.7
8%
Nig
er4
4.1
1%
43
.34
%5
0.6
6%
46
.21
%5
1.8
4%
51
.79
%5
8.6
0%
55
.97
%5
7.3
7%
55
.19
%6
2.0
7%
56
.68
%6
5.6
6%
62
.16
%6
2.4
0%
68
.47
%7
0.6
7%
70
.75
%6
6.0
6%
73
.41
%7
3.2
7%
72
.57
%7
7.2
2%
63
.81
%7
1.1
3%
60
.02
%
Nig
eria
51
.10
%5
8.6
0%
61
.36
%6
2.8
3%
59
.76
%6
7.7
8%
72
.92
%7
6.5
6%
77
.93
%#N
/A7
9.0
1%
80
.00
%#N
/A#N
/A1
5.8
6%
20
.13
%2
7.0
9%
28
.60
%2
4.5
8%
29
.62
%2
7.5
8%
27
.41
%2
9.3
3%
22
.67
%2
3.6
8%
44
.01
%
No
rway
5.6
8%
6.4
1%
6.5
6%
6.0
9%
6.7
2%
6.4
9%
6.7
0%
5.7
0%
5.5
4%
6.0
5%
5.6
9%
5.0
7%
4.8
3%
4.7
4%
4.1
8%
4.0
0%
4.4
8%
5.1
2%
5.1
8%
5.3
2%
5.2
7%
5.7
9%
6.3
4%
6.0
0%
6.2
6%
6.7
7%
Om
an3
.78
%3
.75
%3
.74
%3
.29
%3
.53
%3
.35
%3
.18
%3
.04
%2
.87
%2
.94
%2
.89
%2
.50
%2
.47
%2
.49
%1
.97
%2
.29
%2
.08
%2
.23
%2
.69
%2
.31
%2
.49
%2
.96
%3
.71
%2
.89
%3
.35
%3
.13
%
Pak
ista
n2
6.9
7%
25
.52
%2
3.9
1%
25
.49
%2
5.2
9%
24
.19
%2
3.4
7%
25
.36
%2
4.5
3%
25
.01
%2
5.0
9%
25
.18
%2
5.1
8%
24
.56
%3
2.5
7%
28
.74
%2
8.9
0%
29
.28
%2
9.8
7%
30
.21
%3
1.1
6%
32
.02
%3
2.1
0%
35
.07
%3
8.5
0%
19
.93
%
Pan
ama
5.6
3%
5.7
0%
5.2
3%
6.4
0%
5.3
9%
6.2
1%
6.3
7%
6.2
8%
6.6
3%
7.3
0%
7.6
7%
7.4
7%
8.4
1%
7.6
6%
8.0
4%
8.7
2%
8.8
5%
8.7
7%
8.2
1%
7.7
7%
7.2
3%
7.6
3%
7.8
3%
7.6
7%
7.7
2%
7.6
7%
Pap
ua
New
Gu
inea
16
.68
%2
1.1
3%
22
.76
%2
2.8
0%
27
.03
%2
7.2
3%
24
.95
%2
1.2
1%
17
.53
%1
8.6
3%
19
.66
%1
7.4
2%
18
.77
%2
1.3
8%
23
.04
%2
4.8
6%
24
.23
%2
2.5
5%
22
.95
%2
2.5
0%
24
.53
%2
4.2
4%
24
.54
%2
3.3
8%
21
.03
%1
8.2
1%
Par
agu
ay1
7.4
1%
18
.97
%1
9.2
8%
17
.33
%1
6.7
1%
17
.71
%1
8.5
7%
18
.57
%1
8.6
1%
19
.87
%1
9.2
1%
19
.30
%2
0.0
4%
22
.10
%2
0.6
3%
23
.26
%2
5.0
4%
24
.51
%2
1.8
9%
21
.13
%2
0.2
5%
21
.45
%1
8.1
6%
13
.59
%2
1.2
6%
22
.25
%
Per
u4
.91
%5
.37
%6
.15
%6
.03
%6
.52
%6
.52
%6
.70
%6
.97
%6
.48
%6
.39
%6
.90
%6
.40
%6
.73
%6
.79
%1
9.8
7%
19
.61
%1
9.1
5%
19
.18
%1
9.5
7%
19
.35
%1
8.7
9%
19
.27
%2
1.0
3%
20
.96
%2
1.8
0%
4.7
5%
Ph
ilip
pin
es1
5.3
8%
14
.95
%1
4.9
3%
15
.37
%1
6.4
6%
16
.02
%1
6.7
6%
16
.95
%1
7.1
5%
17
.35
%1
7.9
5%
16
.77
%1
6.5
6%
16
.69
%2
9.4
8%
26
.09
%2
6.1
4%
25
.00
%2
4.5
2%
25
.54
%2
7.6
8%
30
.20
%3
3.4
0%
32
.20
%3
3.9
8%
14
.07
%
Po
lan
d#N
/A#N
/A#N
/A#N
/A1
0.3
0%
10
.42
%9
.16
%9
.92
%7
.98
%1
5.0
9%
15
.63
%1
3.5
4%
12
.91
%1
1.0
7%
10
.79
%1
1.7
6%
11
.58
%1
1.3
9%
12
.12
%1
3.2
3%
13
.29
%1
4.3
8%
16
.83
%1
3.1
7%
13
.59
%1
2.9
4%
Po
rtu
gal
6.0
6%
6.4
1%
5.2
0%
5.7
9%
6.2
9%
6.2
3%
5.9
2%
5.6
9%
5.9
4%
9.2
7%
9.1
8%
8.9
1%
9.1
8%
9.1
1%
7.7
8%
7.8
4%
8.3
2%
10
.22
%1
1.0
2%
10
.69
%1
0.7
9%
11
.67
%1
2.6
7%
11
.56
%1
0.8
6%
12
.22
%
Qat
ar#N
/A#N
/A#N
/A#N
/A#N
/A#N
/A#N
/A#N
/A#N
/A#N
/A#N
/A#N
/A#N
/A#N
/A1
.34
%1
.26
%1
.43
%1
.44
%1
.99
%2
.17
%2
.14
%2
.32
%2
.58
%2
.41
%2
.32
%#N
/A
Rep
. Ko
rea
9.6
6%
9.8
4%
10
.74
%1
1.9
1%
11
.50
%1
1.1
5%
10
.04
%9
.51
%9
.74
%9
.62
%8
.95
%7
.59
%5
.44
%6
.65
%7
.66
%6
.60
%6
.68
%6
.86
%7
.05
%7
.82
%8
.20
%8
.36
%7
.11
%6
.14
%6
.80
%6
.36
%
Ro
man
ia1
6.0
3%
13
.89
%1
4.5
3%
15
.05
%1
6.0
5%
17
.30
%1
7.7
7%
19
.85
%1
7.6
1%
17
.07
%1
5.7
7%
17
.41
%1
7.1
3%
18
.29
%1
3.5
4%
13
.99
%1
4.4
3%
17
.04
%1
9.1
5%
20
.80
%2
2.1
9%
26
.23
%2
7.6
6%
23
.29
%2
3.2
6%
12
.67
%
Ru
ssia
n F
eder
atio
n#N
/A#N
/A#N
/A#N
/A#N
/A#N
/A1
0.8
6%
10
.82
%1
0.8
5%
10
.98
%1
0.7
4%
10
.75
%9
.75
%8
.76
%1
0.4
5%
12
.13
%1
2.0
4%
12
.33
%1
4.6
4%
15
.91
%1
7.4
0%
18
.49
%2
2.7
5%
20
.63
%2
2.2
2%
25
.82
%
Rw
and
a4
1.8
3%
44
.55
%4
2.6
8%
47
.10
%4
8.2
2%
59
.07
%5
8.3
0%
50
.19
%#N
/A6
1.4
1%
61
.05
%5
4.4
0%
56
.21
%5
4.7
0%
61
.58
%5
7.8
0%
62
.01
%5
6.6
6%
52
.01
%5
0.9
1%
47
.46
%4
4.8
9%
40
.13
%5
4.0
0%
54
.85
%5
4.5
4%
Sam
oa
15
.14
%1
4.9
8%
16
.25
%1
4.9
9%
16
.13
%1
4.4
7%
14
.59
%1
5.5
1%
17
.61
%1
7.8
2%
17
.98
%1
5.1
5%
15
.46
%1
3.8
3%
13
.65
%1
2.9
2%
13
.36
%1
3.8
2%
15
.23
%1
4.6
4%
15
.45
%1
5.4
0%
16
.09
%2
0.4
2%
22
.36
%2
0.5
4%
Sao
To
me
and
Pri
nci
pe
#N/A
#N/A
#N/A
#N/A
#N/A
#N/A
#N/A
#N/A
#N/A
#N/A
#N/A
#N/A
#N/A
#N/A
#N/A
13
.71
%1
4.4
0%
13
.57
%1
6.4
3%
16
.83
%1
7.6
3%
20
.01
%1
7.9
2%
20
.45
%1
5.5
5%
18
.35
%

102
Tab
le 1
0. N
ER 'F
oo
d' D
atas
et
Are
as
19
61
19
62
19
63
19
64
19
65
19
66
19
67
19
68
19
69
19
70
19
71
19
72
19
73
19
74
19
75
19
76
19
77
19
78
19
79
19
80
19
81
19
82
19
83
19
84
19
85
Sau
di A
rab
ia#N
/A#N
/A#N
/A#N
/A#N
/A#N
/A#N
/A2
.81
%2
.83
%2
.66
%3
.02
%1
.94
%1
.94
%1
.95
%1
.92
%2
.14
%2
.57
%3
.33
%3
.66
%4
.20
%4
.41
%5
.10
%5
.10
%5
.83
%4
.63
%
Sen
egal
25
.46
%2
5.9
7%
27
.39
%2
7.4
6%
27
.86
%2
5.5
5%
27
.11
%2
1.7
8%
24
.75
%1
6.5
7%
23
.43
%1
4.8
4%
22
.55
%2
8.5
1%
24
.65
%2
2.0
0%
14
.70
%2
3.5
8%
17
.92
%1
9.5
8%
24
.33
%1
8.1
8%
15
.06
%1
6.0
8%
17
.66
%
Serb
ia#N
/A#N
/A#N
/A#N
/A#N
/A#N
/A#N
/A#N
/A#N
/A#N
/A#N
/A#N
/A#N
/A#N
/A#N
/A#N
/A#N
/A#N
/A#N
/A#N
/A#N
/A#N
/A#N
/A#N
/A#N
/A
Seyc
hel
les
6.0
7%
6.2
8%
5.7
9%
5.7
7%
5.6
0%
6.0
6%
7.0
6%
5.1
8%
3.1
7%
4.5
5%
5.4
8%
5.3
2%
7.4
3%
9.5
6%
9.1
4%
8.4
0%
7.3
2%
8.1
6%
7.7
4%
9.0
4%
8.4
5%
8.9
6%
6.9
8%
7.1
1%
5.9
4%
Sier
ra L
eon
e1
5.6
8%
16
.98
%1
8.2
5%
16
.16
%1
7.1
4%
16
.74
%1
8.6
0%
15
.30
%1
4.5
1%
15
.21
%1
3.6
7%
10
.83
%1
3.3
7%
18
.38
%1
1.5
5%
11
.21
%6
.24
%1
1.0
2%
10
.30
%1
0.6
8%
12
.43
%1
3.3
8%
10
.81
%8
.88
%8
.86
%
Sin
gap
ore
13
.74
%1
1.6
4%
11
.85
%1
2.3
8%
12
.00
%1
1.3
9%
9.3
3%
9.9
9%
9.2
1%
8.2
4%
7.8
6%
8.0
5%
9.1
0%
8.7
5%
8.0
9%
8.8
0%
7.4
3%
6.1
0%
6.6
0%
5.7
1%
5.4
6%
5.0
1%
5.2
1%
4.1
4%
4.1
5%
Slo
vaki
a#N
/A#N
/A#N
/A#N
/A#N
/A#N
/A#N
/A#N
/A#N
/A#N
/A#N
/A#N
/A#N
/A#N
/A#N
/A#N
/A#N
/A#N
/A#N
/A#N
/A#N
/A#N
/A#N
/A#N
/A#N
/A
Slo
ven
ia#N
/A#N
/A#N
/A#N
/A#N
/A#N
/A#N
/A#N
/A#N
/A#N
/A#N
/A#N
/A#N
/A#N
/A#N
/A#N
/A#N
/A#N
/A#N
/A#N
/A#N
/A#N
/A#N
/A#N
/A#N
/A
Solo
mo
n Is
lan
ds
#N/A
#N/A
#N/A
#N/A
#N/A
#N/A
#N/A
#N/A
#N/A
#N/A
#N/A
#N/A
#N/A
#N/A
#N/A
#N/A
#N/A
#N/A
#N/A
#N/A
#N/A
#N/A
#N/A
#N/A
#N/A
Sou
th A
fric
a6
.46
%5
.60
%5
.62
%5
.26
%5
.59
%5
.85
%5
.88
%4
.76
%5
.43
%4
.93
%5
.22
%4
.78
%4
.00
%3
.91
%1
5.6
4%
13
.84
%1
4.9
6%
15
.47
%1
6.7
3%
18
.58
%1
7.6
5%
15
.94
%1
7.2
2%
14
.17
%1
0.4
2%
Spai
n7
.46
%6
.70
%7
.41
%6
.44
%6
.26
%6
.40
%5
.66
%5
.65
%5
.24
%5
.21
%5
.18
%5
.06
%5
.25
%5
.33
%5
.33
%4
.86
%4
.67
%4
.99
%5
.06
%5
.17
%4
.60
%5
.16
%4
.81
%5
.18
%4
.98
%
Sri L
anka
3.3
6%
2.4
2%
3.5
0%
14
.98
%4
.34
%1
0.2
5%
11
.51
%1
2.4
5%
13
.38
%1
5.5
3%
13
.66
%1
3.9
9%
14
.89
%2
0.3
0%
21
.32
%1
3.9
9%
8.5
3%
9.4
0%
14
.34
%1
6.9
0%
14
.39
%1
1.9
5%
13
.58
%6
.36
%1
0.8
1%
St. K
itts
an
d N
evis
#N/A
#N/A
#N/A
#N/A
#N/A
#N/A
#N/A
#N/A
#N/A
#N/A
#N/A
#N/A
#N/A
#N/A
#N/A
#N/A
#N/A
#N/A
#N/A
#N/A
#N/A
1.5
0%
2.6
2%
1.2
3%
5.1
5%
St. L
uci
a#N
/A#N
/A#N
/A#N
/A#N
/A#N
/A#N
/A#N
/A#N
/A#N
/A#N
/A#N
/A#N
/A#N
/A#N
/A#N
/A#N
/A#N
/A#N
/A1
3.6
3%
12
.59
%1
3.3
9%
11
.45
%8
.18
%6
.55
%
St. V
ince
nt
and
th
e G
ren
adin
es5
.54
%5
.89
%7
.09
%7
.87
%7
.30
%7
.24
%8
.52
%7
.87
%8
.59
%1
0.1
0%
13
.33
%1
0.9
3%
10
.15
%7
.95
%1
2.5
1%
5.6
1%
6.5
0%
5.4
8%
8.9
7%
11
.01
%3
.98
%4
.34
%#N
/A#N
/A#N
/A
Sud
an5
2.2
7%
49
.05
%5
4.0
0%
54
.67
%4
9.4
0%
51
.37
%5
7.4
3%
51
.48
%5
3.8
7%
54
.42
%5
5.3
3%
58
.35
%6
1.3
7%
60
.52
%5
5.7
3%
47
.27
%4
5.1
6%
50
.75
%5
0.6
5%
56
.96
%5
6.6
2%
44
.92
%4
6.6
6%
43
.80
%6
0.7
5%
Suri
nam
e#N
/A#N
/A#N
/A#N
/A#N
/A#N
/A#N
/A#N
/A#N
/A#N
/A#N
/A#N
/A#N
/A#N
/A4
.64
%6
.52
%6
.91
%6
.18
%5
.04
%5
.61
%7
.75
%6
.97
%7
.19
%7
.94
%6
.03
%
Swaz
ilan
d#N
/A#N
/A#N
/A#N
/A#N
/A#N
/A#N
/A#N
/A#N
/A#N
/A#N
/A#N
/A#N
/A#N
/A#N
/A#N
/A#N
/A#N
/A#N
/A#N
/A#N
/A#N
/A#N
/A#N
/A#N
/A
Swed
en3
.86
%3
.78
%3
.69
%3
.62
%3
.43
%3
.31
%3
.24
%3
.19
%2
.77
%2
.90
%2
.71
%2
.63
%2
.75
%2
.83
%2
.71
%2
.96
%3
.16
%3
.11
%3
.04
%1
1.3
6%
9.6
9%
8.2
0%
6.9
9%
6.6
2%
6.4
7%
Swit
zerl
and
#N/A
#N/A
#N/A
#N/A
#N/A
#N/A
#N/A
#N/A
#N/A
3.2
5%
3.1
9%
3.1
0%
3.5
0%
3.4
7%
3.6
6%
3.6
8%
3.6
3%
3.7
6%
3.7
3%
3.5
6%
3.3
2%
3.5
2%
3.2
3%
3.2
1%
3.0
4%
Tajik
ista
n#N
/A#N
/A#N
/A#N
/A#N
/A#N
/A#N
/A#N
/A#N
/A#N
/A#N
/A#N
/A#N
/A#N
/A#N
/A#N
/A#N
/A#N
/A#N
/A#N
/A#N
/A#N
/A#N
/A#N
/A#N
/A
Tan
zan
ia#N
/A#N
/A#N
/A#N
/A#N
/A#N
/A#N
/A#N
/A#N
/A#N
/A#N
/A#N
/A#N
/A#N
/A#N
/A#N
/A#N
/A#N
/A#N
/A#N
/A#N
/A#N
/A#N
/A#N
/A#N
/A
Thai
lan
d#N
/A#N
/A#N
/A#N
/A3
5.5
8%
38
.94
%3
0.7
2%
31
.54
%3
2.3
4%
29
.69
%2
7.7
3%
24
.00
%2
5.0
5%
16
.00
%1
9.2
9%
16
.31
%1
4.2
9%
17
.08
%1
4.2
5%
14
.16
%1
2.0
4%
11
.66
%1
4.5
9%
13
.55
%1
5.7
7%
Tim
or-
Lest
e#N
/A#N
/A#N
/A#N
/A#N
/A#N
/A#N
/A#N
/A#N
/A#N
/A#N
/A#N
/A#N
/A#N
/A#N
/A#N
/A#N
/A#N
/A#N
/A#N
/A#N
/A#N
/A#N
/A#N
/A#N
/A
Togo
42
.42
%4
3.4
6%
45
.66
%3
5.0
4%
34
.19
%3
3.0
9%
31
.80
%2
9.4
4%
24
.49
%2
3.3
9%
26
.74
%2
5.0
6%
25
.68
%2
2.0
6%
23
.36
%2
2.8
7%
18
.46
%1
6.7
2%
24
.26
%2
3.0
2%
27
.08
%3
0.2
8%
30
.27
%2
9.5
0%
29
.05
%
Ton
ga#N
/A#N
/A#N
/A#N
/A#N
/A#N
/A#N
/A#N
/A#N
/A#N
/A#N
/A#N
/A#N
/A#N
/A#N
/A#N
/A#N
/A#N
/A#N
/A#N
/A2
2.1
4%
18
.20
%1
7.3
8%
15
.79
%1
6.1
5%
Trin
idad
an
d T
ob
ago
6.4
6%
6.6
6%
5.7
6%
5.6
2%
6.3
1%
6.4
8%
6.0
8%
5.3
8%
5.7
4%
5.3
8%
5.4
9%
5.5
3%
6.0
8%
5.6
6%
4.7
4%
5.6
8%
6.0
0%
6.1
2%
6.2
5%
6.6
1%
6.8
5%
7.1
5%
7.7
1%
7.6
9%
6.8
0%
Tun
isia
29
.35
%2
7.4
5%
26
.82
%2
5.5
9%
24
.26
%2
0.9
6%
24
.68
%2
0.8
0%
18
.39
%2
0.6
2%
23
.16
%1
9.1
7%
22
.02
%2
3.1
5%
24
.16
%2
0.6
7%
20
.97
%1
9.3
4%
18
.32
%2
0.7
3%
18
.73
%1
6.2
7%
18
.63
%1
6.6
7%
16
.99
%
Turk
ey2
7.5
2%
26
.44
%2
5.4
6%
23
.59
%2
2.7
1%
22
.27
%2
1.1
8%
20
.81
%1
9.8
4%
20
.61
%2
0.2
2%
18
.91
%1
6.5
8%
17
.95
%1
8.0
0%
16
.90
%1
5.9
9%
16
.26
%1
6.4
9%
17
.38
%1
6.4
8%
16
.84
%1
5.5
9%
16
.29
%1
5.8
9%
Turk
men
ista
n#N
/A#N
/A#N
/A#N
/A#N
/A#N
/A#N
/A#N
/A#N
/A#N
/A#N
/A#N
/A#N
/A#N
/A#N
/A#N
/A#N
/A#N
/A#N
/A#N
/A#N
/A#N
/A#N
/A#N
/A#N
/A
Tuva
lu#N
/A#N
/A#N
/A#N
/A#N
/A#N
/A#N
/A#N
/A#N
/A#N
/A#N
/A#N
/A#N
/A#N
/A#N
/A#N
/A#N
/A#N
/A#N
/A#N
/A#N
/A#N
/A#N
/A#N
/A#N
/A
Uga
nd
a#N
/A#N
/A#N
/A#N
/A#N
/A#N
/A#N
/A#N
/A#N
/A#N
/A#N
/A#N
/A#N
/A#N
/A#N
/A#N
/A#N
/A#N
/A#N
/A#N
/A#N
/A1
4.1
6%
15
.44
%1
2.8
6%
16
.17
%
Ukr
ain
e#N
/A#N
/A#N
/A#N
/A#N
/A#N
/A#N
/A#N
/A#N
/A#N
/A#N
/A#N
/A#N
/A#N
/A#N
/A#N
/A#N
/A#N
/A#N
/A#N
/A#N
/A#N
/A#N
/A#N
/A#N
/A
Un
ited
Ara
b E
mir
ates
#N/A
#N/A
#N/A
#N/A
#N/A
#N/A
#N/A
#N/A
#N/A
#N/A
#N/A
#N/A
#N/A
#N/A
1.8
8%
1.8
6%
1.6
8%
1.8
8%
1.7
8%
1.7
5%
1.6
8%
1.7
8%
1.6
2%
1.5
8%
1.6
1%
Un
ited
Kin
gdo
m4
.77
%4
.96
%4
.90
%4
.76
%4
.54
%4
.35
%4
.27
%3
.87
%3
.77
%3
.78
%3
.74
%3
.63
%3
.67
%4
.02
%3
.85
%3
.43
%3
.64
%3
.40
%3
.52
%3
.43
%3
.09
%3
.09
%2
.88
%2
.86
%2
.63
%
Un
ited
Sta
tes
of
Am
eric
a3
.56
%3
.36
%3
.29
%3
.13
%3
.02
%2
.87
%2
.99
%3
.00
%2
.93
%8
.63
%8
.14
%7
.92
%7
.89
%8
.24
%8
.26
%7
.92
%7
.65
%7
.40
%7
.36
%7
.39
%7
.01
%7
.03
%6
.68
%6
.34
%6
.12
%
Uru
guay
11
.83
%1
1.5
2%
11
.44
%1
1.8
8%
9.7
2%
9.6
3%
10
.02
%1
1.4
7%
10
.41
%1
1.1
1%
9.8
7%
8.7
3%
8.3
7%
10
.34
%8
.64
%7
.95
%6
.63
%6
.71
%6
.79
%5
.31
%4
.90
%6
.70
%6
.90
%7
.55
%8
.20
%
Uzb
ekis
tan
#N/A
#N/A
#N/A
#N/A
#N/A
#N/A
#N/A
#N/A
#N/A
#N/A
#N/A
#N/A
#N/A
#N/A
#N/A
#N/A
#N/A
#N/A
#N/A
#N/A
#N/A
#N/A
#N/A
#N/A
#N/A
Van
uat
u#N
/A#N
/A#N
/A#N
/A#N
/A#N
/A#N
/A#N
/A#N
/A#N
/A#N
/A#N
/A#N
/A#N
/A#N
/A#N
/A#N
/A#N
/A3
2.7
6%
34
.69
%3
4.0
1%
28
.25
%2
5.8
5%
27
.03
%2
4.6
9%
Ven
ezu
ela
5.9
7%
5.5
9%
5.3
5%
5.4
6%
5.5
5%
5.5
4%
5.7
9%
5.3
8%
5.7
6%
5.6
7%
5.7
2%
5.8
7%
5.9
0%
6.4
5%
6.5
4%
6.3
4%
7.1
0%
6.6
4%
6.5
7%
7.8
1%
8.1
2%
8.1
1%
7.4
8%
7.3
8%
7.4
3%
Vie
t N
am#N
/A#N
/A#N
/A#N
/A#N
/A#N
/A#N
/A#N
/A#N
/A#N
/A#N
/A#N
/A#N
/A#N
/A#N
/A#N
/A#N
/A#N
/A#N
/A#N
/A#N
/A#N
/A#N
/A3
0.4
9%
29
.51
%
Yem
en#N
/A#N
/A#N
/A#N
/A#N
/A#N
/A#N
/A#N
/A#N
/A#N
/A#N
/A#N
/A#N
/A#N
/A#N
/A#N
/A#N
/A#N
/A#N
/A#N
/A#N
/A#N
/A#N
/A#N
/A#N
/A
Zam
bia
6.4
7%
6.0
7%
5.8
3%
5.4
8%
4.6
7%
6.0
8%
4.5
5%
6.0
5%
6.9
9%
6.6
7%
9.2
4%
7.2
9%
5.5
0%
6.5
6%
7.0
0%
5.9
5%
5.6
8%
5.0
1%
6.5
4%
8.9
1%
5.4
4%
5.2
1%
5.0
9%
5.1
2%
5.0
0%
Zim
bab
we
6.7
7%
5.7
1%
7.2
0%
6.5
0%
2.6
9%
5.3
4%
3.7
3%
2.9
5%
3.6
4%
2.7
4%
3.7
2%
2.4
8%
#N/A
#N/A
#N/A
#N/A
#N/A
#N/A
#N/A
1.9
9%
1.6
9%
1.5
8%
1.5
6%
4.2
9%
4.3
6%
Wo
rld
To
tal
7.1
2%
6.8
9%
6.8
6%
6.5
5%
6.3
6%
6.2
2%
6.2
1%
5.9
8%
5.7
5%
7.1
4%
6.8
5%
7.2
2%
7.2
2%
7.4
6%
7.6
4%
7.3
7%
7.2
7%
7.3
2%
7.2
8%
7.5
2%
7.5
3%
7.5
9%
7.4
7%
7.3
6%
7.1
2%

103
Tab
le 1
0. N
ER 'F
oo
d' D
atas
et (
Co
nt.
)
Are
as
19
86
19
87
19
88
19
89
19
90
19
91
19
92
19
93
19
94
19
95
19
96
19
97
19
98
19
99
20
00
20
01
20
02
20
03
20
04
20
05
20
06
20
07
20
08
20
09
20
10
20
11
Sau
di A
rab
ia4
.18
%4
.59
%4
.30
%4
.15
%3
.96
%3
.79
%3
.64
%3
.39
%3
.36
%3
.80
%3
.81
%3
.81
%3
.63
%3
.63
%6
.70
%6
.57
%6
.54
%6
.20
%6
.03
%6
.10
%6
.34
%6
.88
%7
.19
%7
.57
%7
.81
%3
.87
%
Sen
egal
16
.98
%1
6.9
6%
15
.94
%1
8.5
5%
18
.95
%1
5.9
6%
15
.41
%1
5.9
0%
15
.37
%1
7.5
3%
16
.65
%1
3.8
9%
14
.23
%1
6.6
1%
14
.60
%1
4.7
1%
11
.25
%1
5.0
1%
15
.04
%1
6.2
2%
13
.53
%1
5.7
3%
24
.07
%1
7.5
4%
17
.37
%1
5.1
3%
Serb
ia#N
/A#N
/A#N
/A#N
/A#N
/A#N
/A#N
/A#N
/A#N
/A#N
/A#N
/A#N
/A#N
/A#N
/A#N
/A#N
/A#N
/A#N
/A#N
/A#N
/A1
2.7
6%
10
.61
%1
2.0
0%
11
.63
%1
0.6
1%
10
.18
%
Seyc
hel
les
6.4
1%
6.6
2%
6.8
6%
6.4
0%
6.3
2%
5.7
7%
6.6
2%
5.9
8%
5.8
8%
6.5
7%
6.9
7%
6.9
5%
5.4
5%
4.7
0%
5.0
6%
3.4
3%
4.2
2%
5.9
2%
4.3
4%
5.9
9%
6.9
6%
6.3
0%
5.5
1%
4.6
4%
4.5
0%
4.7
2%
Sier
ra L
eon
e1
2.3
5%
10
.97
%1
3.5
4%
15
.60
%1
5.7
6%
14
.51
%1
7.6
6%
17
.25
%2
1.5
5%
22
.48
%2
6.5
5%
24
.41
%2
3.2
7%
20
.96
%1
7.5
2%
22
.48
%2
2.1
2%
21
.66
%1
7.8
2%
16
.82
%1
9.6
3%
16
.75
%2
0.2
0%
19
.03
%1
9.9
6%
21
.85
%
Sin
gap
ore
3.6
4%
3.2
9%
3.0
9%
2.8
9%
3.0
9%
2.8
6%
2.8
1%
2.6
6%
1.9
8%
1.8
3%
2.0
1%
1.7
5%
1.3
1%
1.4
9%
3.1
3%
3.1
4%
3.1
6%
3.2
1%
3.1
3%
3.1
1%
3.0
4%
3.0
8%
3.4
1%
3.3
1%
3.2
4%
1.2
0%
Slo
vaki
a#N
/A#N
/A#N
/A#N
/A#N
/A#N
/A#N
/A6
.94
%6
.18
%9
.14
%8
.79
%9
.51
%9
.70
%1
0.0
0%
8.8
6%
8.7
6%
9.2
2%
10
.63
%1
1.0
9%
10
.29
%9
.87
%1
0.6
2%
11
.97
%1
1.8
4%
10
.74
%1
0.4
7%
Slo
ven
ia#N
/A#N
/A#N
/A#N
/A#N
/A#N
/A3
.77
%4
.82
%5
.09
%6
.12
%6
.50
%6
.87
%7
.20
%7
.28
%6
.43
%6
.55
%7
.03
%8
.61
%9
.04
%8
.52
%8
.14
%8
.91
%9
.89
%1
0.3
8%
9.8
0%
10
.21
%
Solo
mo
n Is
lan
ds
#N/A
#N/A
#N/A
#N/A
17
.29
%1
7.3
7%
16
.00
%1
4.9
0%
14
.65
%1
4.2
3%
14
.93
%1
5.5
6%
13
.81
%1
4.0
4%
16
.49
%1
9.1
3%
19
.43
%1
8.6
1%
21
.19
%2
4.5
2%
25
.08
%2
3.3
9%
25
.00
%2
2.7
7%
27
.67
%2
2.9
4%
Sou
th A
fric
a1
2.3
2%
15
.51
%1
5.4
7%
14
.85
%1
7.1
7%
18
.57
%2
0.8
9%
19
.13
%1
9.2
3%
20
.02
%1
7.3
4%
17
.31
%1
5.2
7%
13
.73
%9
.81
%8
.12
%7
.38
%1
0.8
7%
12
.99
%1
3.2
8%
12
.87
%1
2.6
0%
10
.99
%1
1.0
9%
12
.96
%1
8.3
0%
Spai
n4
.75
%4
.73
%4
.29
%4
.37
%4
.49
%4
.22
%4
.22
%4
.02
%3
.78
%8
.03
%7
.96
%7
.65
%7
.32
%7
.09
%6
.16
%6
.09
%6
.63
%7
.90
%8
.55
%8
.54
%8
.45
%9
.05
%9
.49
%8
.75
%8
.35
%9
.23
%
Sri L
anka
12
.36
%9
.21
%1
0.7
5%
11
.59
%9
.66
%9
.42
%1
0.3
4%
10
.40
%1
0.6
8%
10
.38
%8
.28
%6
.85
%6
.21
%6
.81
%6
.38
%6
.37
%6
.32
%6
.20
%5
.73
%5
.23
%7
.21
%7
.05
%5
.29
%4
.64
%4
.67
%4
.61
%
St. K
itts
an
d N
evis
2.4
7%
1.3
2%
3.1
6%
2.4
9%
4.2
5%
4.0
7%
2.4
0%
3.1
8%
2.6
7%
2.8
6%
4.6
1%
2.4
9%
3.6
3%
3.4
7%
6.6
8%
5.5
3%
4.8
5%
5.4
1%
4.7
5%
4.8
5%
6.1
6%
6.5
1%
6.1
1%
6.7
8%
6.3
0%
5.2
0%
St. L
uci
a#N
/A#N
/A#N
/A3
.74
%#N
/A4
.62
%3
.45
%6
.15
%7
.40
%7
.03
%6
.82
%9
.73
%8
.78
%7
.03
%8
.33
%8
.15
%7
.07
%8
.44
%8
.54
%8
.39
%8
.29
%8
.47
%8
.07
%3
.98
%7
.65
%7
.73
%
St. V
ince
nt
and
th
e G
ren
adin
es#N
/A#N
/A#N
/A#N
/A#N
/A#N
/A#N
/A#N
/A#N
/A#N
/A2
.60
%3
.82
%2
.26
%#N
/A#N
/A4
.05
%4
.54
%5
.08
%5
.37
%5
.65
%5
.62
%7
.27
%8
.95
%8
.09
%9
.53
%8
.70
%
Sud
an5
4.2
3%
42
.02
%5
1.9
6%
40
.67
%4
1.3
2%
49
.87
%5
0.1
3%
42
.93
%5
1.5
1%
47
.71
%5
0.1
7%
46
.47
%4
8.3
9%
47
.22
%4
7.9
4%
49
.84
%4
7.4
9%
49
.39
%4
8.0
0%
47
.65
%4
5.5
0%
40
.00
%3
9.7
3%
38
.70
%3
6.6
9%
4.3
7%
Suri
nam
e7
.39
%8
.15
%7
.88
%9
.41
%1
1.1
0%
12
.37
%1
2.0
5%
11
.94
%1
0.7
9%
11
.03
%1
0.8
2%
10
.73
%1
3.2
5%
10
.69
%9
.78
%1
0.3
5%
8.8
6%
8.5
2%
9.4
9%
9.2
7%
9.8
9%
10
.35
%9
.00
%9
.43
%9
.44
%1
0.5
5%
Swaz
ilan
d#N
/A#N
/A#N
/A#N
/A#N
/A#N
/A#N
/A#N
/A#N
/A#N
/A#N
/A#N
/A#N
/A1
.02
%#N
/A#N
/A2
.96
%3
.19
%3
.77
%5
.00
%#N
/A3
.81
%2
.67
%3
.81
%2
.99
%2
.10
%
Swed
en8
.08
%8
.94
%9
.22
%8
.76
%9
.79
%9
.80
%9
.63
%7
.47
%7
.44
%7
.74
%7
.59
%6
.50
%6
.04
%5
.61
%4
.88
%4
.43
%4
.80
%5
.68
%5
.92
%5
.58
%5
.53
%5
.98
%6
.40
%6
.00
%6
.24
%6
.47
%
Swit
zerl
and
3.1
1%
3.0
1%
3.0
4%
2.8
6%
6.2
6%
6.2
1%
6.2
8%
5.8
3%
6.2
0%
7.1
3%
6.6
4%
5.5
1%
5.3
9%
5.1
7%
4.8
5%
4.9
3%
5.2
8%
6.0
8%
6.2
6%
6.0
3%
5.7
5%
5.7
5%
6.2
5%
6.4
5%
6.5
0%
6.7
4%
Tajik
ista
n#N
/A#N
/A#N
/A#N
/A#N
/A#N
/A4
2.7
0%
43
.21
%4
6.4
8%
51
.34
%5
0.6
1%
51
.62
%4
5.0
3%
45
.90
%5
0.6
6%
44
.32
%4
6.5
8%
44
.78
%4
7.3
0%
50
.10
%5
0.9
8%
47
.40
%4
9.6
9%
56
.18
%5
5.3
0%
54
.62
%
Tan
zan
ia#N
/A#N
/A1
3.5
9%
13
.65
%1
3.6
5%
14
.43
%1
4.5
1%
13
.67
%1
2.7
9%
13
.12
%1
2.6
7%
12
.75
%1
5.0
9%
12
.74
%1
2.3
9%
13
.14
%1
5.6
0%
12
.72
%1
4.3
0%
12
.74
%1
3.9
2%
12
.86
%1
1.1
8%
11
.22
%1
2.0
4%
12
.64
%
Thai
lan
d1
3.1
8%
12
.13
%1
0.9
1%
8.7
6%
8.3
6%
8.6
5%
8.2
5%
8.5
6%
7.9
8%
6.7
7%
6.4
8%
7.0
4%
8.1
8%
8.2
8%
14
.53
%1
3.3
9%
13
.74
%1
4.5
1%
14
.64
%1
4.9
2%
15
.85
%1
6.6
9%
17
.95
%1
7.4
5%
18
.55
%3
.39
%
Tim
or-
Lest
e#N
/A#N
/A#N
/A#N
/A#N
/A#N
/A#N
/A#N
/A#N
/A#N
/A#N
/A#N
/A#N
/A1
6.4
1%
16
.25
%1
5.7
9%
16
.21
%1
6.7
2%
15
.12
%1
3.3
4%
14
.81
%1
4.8
1%
11
.91
%1
3.1
2%
10
.79
%1
1.6
6%
Togo
28
.67
%2
7.6
6%
32
.38
%3
3.7
7%
33
.77
%3
3.3
6%
35
.33
%4
8.2
3%
42
.14
%3
9.5
8%
37
.79
%3
2.6
5%
33
.21
%3
2.7
3%
32
.95
%3
6.4
8%
37
.42
%3
6.3
9%
36
.20
%3
7.2
5%
40
.61
%3
4.2
2%
41
.24
%3
4.4
4%
37
.44
%4
4.1
7%
Ton
ga1
5.4
6%
14
.96
%1
7.2
8%
14
.61
%1
3.5
0%
7.7
7%
10
.70
%1
1.7
5%
12
.15
%1
1.2
0%
13
.84
%1
3.9
9%
15
.08
%1
1.8
6%
13
.10
%1
3.2
6%
12
.09
%1
0.8
0%
13
.76
%1
4.7
9%
14
.54
%1
8.3
4%
16
.66
%1
6.3
0%
17
.65
%1
6.0
0%
Trin
idad
an
d T
ob
ago
6.1
7%
5.9
5%
4.6
5%
4.3
8%
4.3
3%
4.2
7%
4.3
3%
3.7
1%
3.2
9%
3.4
2%
3.4
2%
3.1
7%
3.1
8%
2.9
6%
2.8
7%
3.0
7%
2.9
0%
2.6
6%
2.6
1%
2.6
0%
2.3
2%
2.6
4%
3.0
4%
2.9
8%
3.1
0%
3.8
3%
Tun
isia
16
.54
%1
6.2
9%
15
.50
%1
6.8
1%
17
.38
%1
8.0
8%
15
.65
%1
6.5
0%
13
.00
%1
4.1
9%
17
.75
%1
3.6
8%
15
.06
%1
4.4
9%
18
.81
%1
8.0
8%
18
.81
%2
0.8
0%
21
.60
%2
0.5
4%
20
.24
%2
0.9
1%
22
.40
%2
1.0
4%
20
.57
%1
1.0
1%
Turk
ey1
6.1
5%
14
.23
%1
4.5
7%
14
.06
%1
4.0
1%
13
.43
%1
2.7
2%
11
.97
%1
2.4
7%
11
.70
%1
1.8
9%
10
.49
%1
7.9
8%
16
.40
%1
3.6
3%
10
.86
%1
1.6
8%
14
.72
%1
5.8
1%
17
.16
%1
6.2
8%
18
.04
%1
9.9
0%
17
.98
%1
8.7
1%
21
.90
%
Turk
men
ista
n#N
/A#N
/A#N
/A#N
/A#N
/A#N
/A4
3.8
9%
50
.08
%6
1.3
9%
65
.31
%4
8.3
9%
55
.17
%6
1.7
8%
64
.61
%1
5.4
5%
27
.58
%2
7.9
4%
39
.96
%6
0.2
2%
53
.13
%4
9.0
5%
27
.69
%2
4.7
4%
18
.40
%1
8.1
5%
43
.86
%
Tuva
lu#N
/A#N
/A#N
/A#N
/A7
.73
%1
0.4
2%
10
.03
%7
.96
%9
.42
%1
0.3
4%
11
.40
%1
0.4
1%
8.6
6%
8.2
0%
9.2
4%
8.3
7%
15
.98
%1
3.3
3%
18
.57
%2
2.6
9%
16
.56
%1
3.6
7%
14
.56
%1
6.2
9%
16
.35
%1
1.1
6%
Uga
nd
a1
3.7
9%
21
.49
%2
3.5
1%
25
.11
%3
0.0
0%
29
.95
%2
9.8
6%
28
.26
%2
4.7
6%
19
.65
%1
5.6
8%
18
.39
%1
9.7
2%
19
.54
%2
2.4
6%
23
.26
%2
2.2
3%
23
.58
%2
1.1
0%
19
.48
%1
7.3
2%
15
.86
%1
3.7
5%
13
.90
%1
3.1
4%
11
.86
%
Ukr
ain
e#N
/A#N
/A#N
/A#N
/A#N
/A#N
/A1
8.4
7%
21
.52
%2
2.0
5%
23
.09
%2
4.3
1%
25
.68
%2
3.6
6%
21
.59
%1
5.5
8%
17
.43
%1
7.5
7%
17
.88
%1
8.7
3%
24
.85
%2
8.3
5%
33
.90
%4
2.7
2%
34
.01
%3
5.2
8%
19
.67
%
Un
ited
Ara
b E
mir
ates
2.0
1%
2.0
8%
2.0
4%
2.1
7%
1.6
5%
1.5
9%
1.7
6%
1.6
6%
2.0
3%
2.0
0%
1.9
8%
1.6
5%
1.7
6%
1.8
8%
3.7
3%
3.6
4%
4.1
1%
4.0
0%
4.6
0%
5.7
2%
5.8
9%
5.7
8%
5.9
2%
7.0
2%
7.7
0%
3.5
9%
Un
ited
Kin
gdo
m2
.65
%2
.58
%2
.56
%2
.42
%2
.56
%2
.51
%2
.54
%2
.24
%2
.10
%5
.66
%5
.64
%5
.75
%5
.70
%5
.49
%5
.00
%4
.64
%4
.77
%5
.05
%5
.51
%5
.28
%5
.22
%5
.67
%5
.57
%5
.14
%5
.16
%5
.13
%
Un
ited
Sta
tes
of
Am
eric
a6
.04
%5
.83
%5
.74
%5
.70
%5
.75
%5
.72
%5
.45
%5
.30
%5
.21
%5
.09
%5
.00
%4
.82
%4
.66
%4
.62
%4
.35
%4
.42
%4
.47
%4
.40
%4
.29
%4
.22
%4
.11
%4
.13
%4
.26
%4
.32
%4
.32
%4
.56
%
Uru
guay
6.6
6%
7.1
0%
7.1
7%
6.2
9%
4.9
4%
5.8
7%
7.0
9%
6.2
6%
6.6
9%
6.0
9%
6.2
2%
5.4
0%
4.8
2%
6.9
9%
17
.62
%1
6.5
1%
12
.51
%1
1.6
7%
12
.81
%1
4.0
2%
14
.99
%1
6.2
7%
19
.00
%1
8.1
7%
20
.93
%4
.22
%
Uzb
ekis
tan
#N/A
#N/A
#N/A
#N/A
#N/A
#N/A
22
.71
%1
8.9
3%
20
.44
%2
0.2
3%
20
.63
%1
4.9
9%
15
.10
%1
3.0
9%
39
.09
%2
9.5
1%
21
.95
%1
9.1
1%
18
.01
%1
7.4
8%
20
.51
%2
1.7
1%
21
.65
%2
4.9
0%
25
.34
%1
0.5
8%
Van
uat
u2
4.2
7%
24
.37
%2
3.4
1%
21
.69
%2
3.2
9%
20
.29
%2
0.6
4%
19
.94
%1
7.0
0%
18
.02
%1
9.8
4%
20
.28
%2
0.7
4%
17
.75
%1
5.7
3%
16
.77
%1
6.1
6%
15
.92
%1
6.2
8%
16
.11
%1
5.2
7%
16
.53
%1
6.9
3%
15
.49
%1
9.1
1%
18
.89
%
Ven
ezu
ela
6.9
5%
7.2
6%
7.8
7%
7.3
4%
6.8
8%
6.7
4%
6.7
0%
6.7
6%
6.6
4%
6.7
0%
6.9
7%
6.8
0%
7.4
0%
8.1
3%
13
.86
%1
4.7
0%
12
.07
%1
2.7
1%
12
.68
%1
3.7
3%
15
.33
%1
9.0
0%
24
.13
%3
1.0
3%
33
.02
%8
.11
%
Vie
t N
am2
7.9
3%
28
.24
%2
8.6
6%
26
.01
%2
4.9
7%
24
.92
%2
3.8
1%
23
.92
%2
2.0
9%
20
.54
%1
9.2
2%
17
.85
%1
7.4
3%
18
.40
%2
5.5
9%
23
.77
%2
3.2
2%
23
.33
%2
2.9
7%
23
.17
%2
3.9
9%
25
.76
%3
1.5
7%
30
.88
%3
0.5
0%
15
.29
%
Yem
en#N
/A#N
/A#N
/A#N
/A2
4.8
3%
22
.54
%2
5.2
0%
25
.10
%2
1.1
9%
20
.09
%2
2.7
7%
17
.10
%1
8.2
9%
17
.07
%1
7.1
9%
17
.15
%1
7.3
6%
17
.51
%1
7.0
3%
17
.19
%1
8.2
6%
21
.88
%2
3.2
4%
22
.45
%2
2.3
4%
26
.11
%
Zam
bia
4.3
5%
4.3
8%
5.3
5%
5.2
3%
5.1
1%
4.6
5%
6.6
0%
5.7
3%
5.2
5%
5.3
7%
5.4
4%
5.0
3%
7.0
5%
4.7
4%
4.6
0%
4.4
4%
5.0
7%
5.7
1%
3.8
4%
3.7
3%
4.9
8%
2.7
0%
3.1
3%
3.6
5%
3.4
2%
2.4
3%
Zim
bab
we
2.5
1%
#N/A
2.6
1%
3.1
9%
2.1
2%
2.7
2%
8.5
7%
6.0
3%
#N/A
#N/A
3.1
7%
2.2
6%
2.3
2%
3.4
6%
3.6
6%
5.0
7%
5.7
7%
7.3
8%
11
.32
%6
.78
%2
3.1
0%
11
.22
%1
5.5
5%
20
.08
%2
1.5
6%
20
.83
%
Wo
rld
To
tal
7.1
0%
7.0
1%
6.9
4%
6.8
9%
6.9
9%
7.2
9%
7.4
1%
7.2
6%
8.4
4%
8.7
3%
8.4
4%
7.9
7%
7.6
9%
7.7
1%
7.7
0%
7.3
9%
7.3
6%
7.8
3%
8.1
1%
8.1
3%
8.1
2%
8.6
3%
9.4
0%
9.2
3%
9.5
2%
8.4
8%

104
Bibliography
Aghion, P., Howitt, P., Brant-Collett, M. & Garcia-Penalosa, C. (1998). Endogenous
Growth Theory. MIT Press.
Ajanovic, A. (2011). Biofuels versus Food Production: Does Biofuels Production
Increase Food Prices? Energy, 36(4): 2070-076.
Anderson, K. & Masters, W. A. (2009) Distortions to Agricultural Incentives in Africa.
The World Bank.
Anderson, K. & Swinnen, J. (2008) Distortions to Agricultural Incentives in Europe's
Transition Economies. The World Bank.
Bale, M. D. & Lutz, E. (1981). Price Distortions in Agriculture and Their Effects: An
International Comparison. American Journal of Agricultural Economics, 63(1).
Bongaarts, J. (2009). Human Population Growth and the Demographic Transition.
Philosophical Transactions of the Royal Society B: Biol. Sci. 364:2985–2990.
Boserup, E. (1981). Population and Technological Change. University of Chicago Press.
Brown, J. H., Burnside, W. R., Davidson, A. D., Delong, J. P., Dunn, W. C., Hamilton,
M. J., Mercado-Silva, N., Nekola, J. C., Okie, J. G., Woodruff, W. H. & Zuo. W.
(2011). Energetic Limits to Economic Growth. BioScience, 61(1): 19-26.
Brown, J. H., Burger, J. R., Burnside, W. R., Chang, M., Davidson, A. D., Fristoe, T. S.,
Hamilton, M. J., Hammond, S. T., Kodric-Brown, A., Mercado-Silva, N., Nekola,
J. C. & Okie, J. G. (2013). Macroecology Meets Macroeconomics: Resource
Scarcity and Global Sustainability. Ecological Engineering.
Burch, D. & Lawrence, G. (2005). Supermarket Own Brands, Supply Chains and the
Transformation of the Argi-food System. International Journal of Sociology of
Agriculture and Food. 13(1).
Cleveland, C. J. (1992). Energy Quality and Energy Surplus in the Extraction of Fossil
Fuels in the US. Ecological Economics, 6(2): 139-162.
Cleveland, C. J. (2013). Net energy analysis. Encyclopedia of Earth.
Evenson, R. E. (2003). Assessing the Impact of the Green Revolution, 1960 to 2000.
Science, 300(5620): 758-762.
105
FAO. (2011). The State of Food Insecurity in the World 2011. Food and Agriculture
Organization of the United Nations.
FAO (2012). Irrigation in Central Asia in Figures – AQUASTAT Survey – 2012. Food
and Agriculture Organization of the United Nations.
Heinberg, R. (2011). The End of Growth: Adapting to Our New Economic Reality. New
Society Publishers.
Hinrichs, C. C. (2000). Embeddedness and local food systems: notes on two types of
direct agricultural market. Journal of Rural Studies. 16(3): 295-303.
Howitt, P. (1999). Steady Endogenous Growth with Population and R & D Inputs
Growing. Journal of Political Economy, 107(4): 715-730.
Ingold, T., Riches, D. & Woodburn, J. (1988). Hunters and Gatherers. Berg Publishing.
Johnson, G. D. (1975). World Agriculture, Commodity Policy, and Price Variability.
American Journal of Agricultural Economics, 57(5).
Johnston, P. & Kilby, B. F. (1975). Agriculture and Structural Transformation:
Economic Strategies in Late-Developing Countries. Oxford University Press.
King, C. W. (2010). Energy Intensity Ratios As Net Energy Measures of United States
Energy Production and Expenditures. Environmental Research Letters, 5(4).
King, C. W. & Hall, C. A. S., (2011). Relating Financial and Energy Return on
Investment. Sustainability, 3: 1810-1832.
King, C. W. (2014). On Relating US and UK Energy Expenditures (Net Energy), Debt,
and Interest Rates. 37th Annual IAEE Conference, 2014.
Kummel, R. (2011). The Second Law of Economics. Springer.
Lee, R. B. & DeVore, I., (1968). Problems in the Study of Hunters and Gatherers. Man
the Hunter. Aldine Publishing.
Macours, K. & Swinnen, J. F. M. (2002). Patterns of Agrarian Transition. Economic
Development and Cultural Change. 50(2): 365-394.
Malthus, T. (1798). An Essay on the Principle of Population. 1st ed. Online at the Library
of Economics and Liberty, http://www.econlib.org/library/Malthus/malPop.html
Maxwell, J. P. (2013). Energy Intensity Ratios as Net Energy Measures for Selected
Countries 1978-2010. University of Texas at Austin.

106
Mitchell, D. (2008). A Note on Rising Food Prices. The World Bank.
Moses, M. E., & Brown, J. H. (2003). Allometry of Human Fertility and Energy Use.
Ecology Letters, 6(4): 295-300.
Mosher, A. T. (2008). The Development Problems of Subsistence Famers: A Preliminary
Review. Subsistence Agriculture & Economic Development. Transaction
Publishers.
Nekola, J. C., Allen, C. D., Brown J. H., Burger, J. R., Davidson, A. D., Fristoe, T. S.,
Hamilton, M. J., Hammond, S. T., Kodric-Brown, A., Mercado-Silva, N. & Okie,
J. G. (2013). The Malthusian–Darwinian Dynamic and the Trajectory of
Civilization. Trends in Ecology and Evolution, 28(3): 127-130.
Parfitt, J., Barthel, M. & Macnaughton, S. (2010). Food Waste within Food Supply
Chains: Quantification and Potential for Change to 2050. Philosophical
Transactions of the Royal Society B: Biological Sciences, 365(1554): 3065-3081.
Pedersen, B., Knudsen, K. E. B. & Eggum, B. 0. (1989). Nutritive Value of Cereal
Products with Emphasis on the Effect of Milling. World Review of Nutrition and
Dietetics, 60: 1-91.
Pfeiffer, J. E., (1977). The Emergence of Society: A Prehistory of the Establishment.
McGraw Hill.
Price, D. (1995). Energy and Human Evolution. Population and Environment, 16(4):
301-319.
Rosegrant, M. W. (2001). 2020 Global Food Outlook: Trends, Alternatives, and Choices.
International Food Policy Research Institute.
Rosegrant, M. W. (2008). Biofuels and Grain Prices: Impact and Policy Responses.
International Food Policy Research Institute.
Smil, V. (1994). Energy in World History. Westview Press.
Stark, B. L. (1986). Origins of Food Production in the New World. American
Archaeology Past and Future. Smithsonian Institute Press.
Stewart, F. (2006). War and Underdevelopment: Can Economic Analysis Help Reduce
the Costs?, 5(4): 357-380.
Tainter, J. (1988). The Collapse of Complex Societies. Cambridge University Press.
107
Tainter, J. A., Allen, T. F., Little, A. & Hoekstra, T. W. (2003). Resource Transitions and
Energy Gain: Contexts of Organizations. Conservation Ecology, 7.
Tainter, J. A. & Patzek, T. W. (2012). Drilling Down: The Gulf Oil Debacle and Our
Energy Dilemma, Springer.
Trostle, R. (2008). Global Agriculture Supply and Demand: Factors Contributing to the
Recent Increase in Food Commodity Prices. ERS USDA.
Tsao, J., Lewis, N. & Crabtree, G. (2006). Solar FAQs. Sandia National Laboratories.
Watts, D. C. H., Ilbery, B. & Maye, D. (2005). Making Reconnections in Agro-food
Geography: Alternative Systems of Food Provision. Progress in Human
Geography. 29(1): 22-40.
Weatherell, C., Tregear, A. & Allinson, J. (2003). In Search of the Concerned Consumer:
UK Public Perceptions of Food, Farming and Buying Local. Journal of Rural
Studies. 19(2): 233-244.
West, G. B., Brown, J. H. & Enquist, B. J. (1997). A General Model for the Origin of
Allometric Scaling Laws in Biology. Science, 4(276): 122-126.
Wharton, C. R. (2008). Subsistence Agriculture: Concepts and Scope. Subsistence
Agriculture & Economic Development. Transaction Publishers.
Wilkes, G. H. and Wilkes, S. (1972). The Green Revolution. Environment: Science and
Policy for Sustainable Development, 14(8): 32-39.
World Bank. (2008). Agriculture for Development. World Development Report 2008.
The World Bank.
Wrigley, T. (2011). Opening Pandora’s Box: A new look at the industrial revolution.
VOXEU.
Zohari, D. (1986). The Origin and Early Spread of Agriculture in the Old World. The
Origin and Domestication of Cultivated Plants. Elsevier.