copyright by mario carneiro faustini 2004 · mario carneiro faustini, bsme, msme dissertation...
TRANSCRIPT

Copyright
by
Mario Carneiro Faustini
2004

The Dissertation Committee for Mario Carneiro Faustini Certifies that this is the
approved version of the following dissertation :
MODELING AND FABRICATION OF PROSTHETIC SOCKETS
USING SELECTIVE LASER SINTERING
Committee:
Richard H. Crawford, Supervisor
Richard R. Neptune, Co-Supervisor
Kristin L. Wood
Nicolas E. Walsh
S. V. Sreenivasan

MODELING AND FABRICATION OF PROSTHETIC SOCKETS
USING SELECTIVE LASER SINTERING
by
Mario Carneiro Faustini, BSME, MSME
Dissertation
Presented to the Faculty of the Graduate School of
The University of Texas at Austin
in Partial Fulfillment
of the Requirements
for the Degree of
Doctor of Philosophy
The University of Texas at Austin
May, 2004

Dedication
To my parents.

v
Acknowledgements
The author would like to acknowledge the inestimable guidance from his
advisors, Dr. Richard H. Crawford and Dr. Richard R. Neptune, the support for this
research provided by the Department of Veterans Affairs and the personal support
provided by CNPq.
vi
Modeling and Fabrication of Prosthetic Sockets using Selective Laser
Sintering
Publication No._____________
Mario Carneiro Faustini, Ph.D.
The University of Texas at Austin, 2004
Supervisors: Richard H. Crawford and Richard R. Neptune
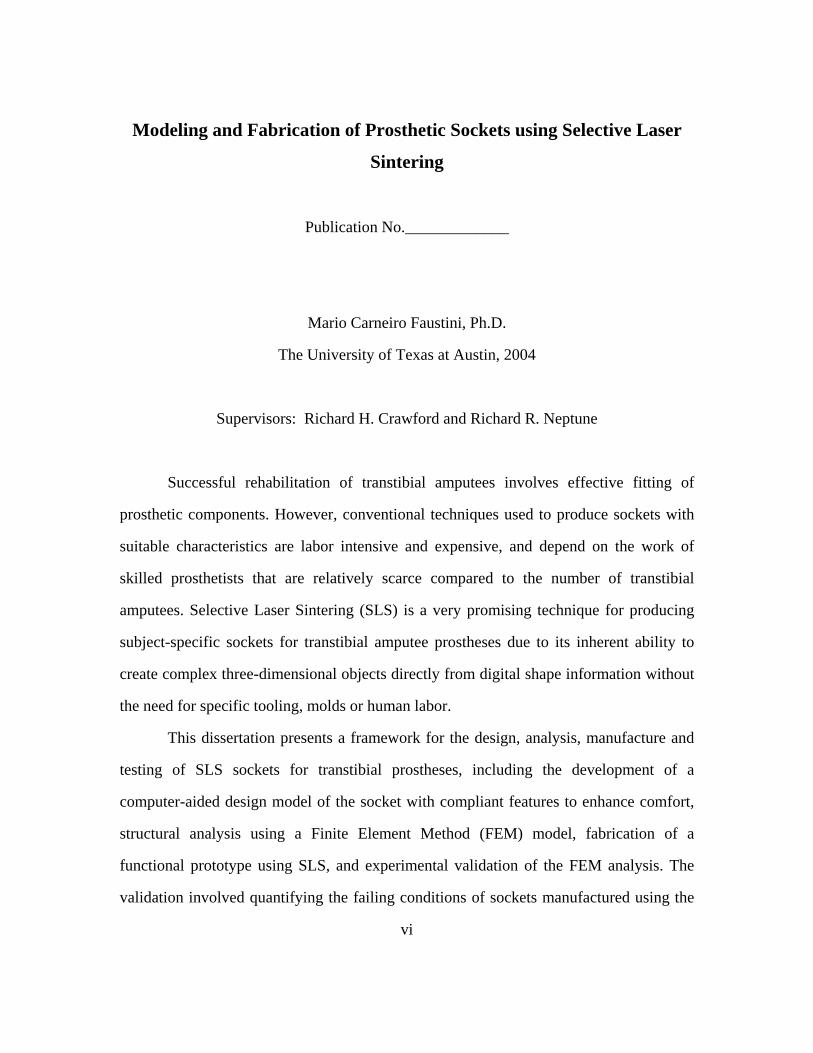
Successful rehabilitation of transtibial amputees involves effective fitting of
prosthetic components. However, conventional techniques used to produce sockets with
suitable characteristics are labor intensive and expensive, and depend on the work of
skilled prosthetists that are relatively scarce compared to the number of transtibial
amputees. Selective Laser Sintering (SLS) is a very promising technique for producing
subject-specific sockets for transtibial amputee prostheses due to its inherent ability to
create complex three-dimensional objects directly from digital shape information without
the need for specific tooling, molds or human labor.
This dissertation presents a framework for the design, analysis, manufacture and
testing of SLS sockets for transtibial prostheses, including the development of a
computer-aided design model of the socket with compliant features to enhance comfort,
structural analysis using a Finite Element Method (FEM) model, fabrication of a
functional prototype using SLS, and experimental validation of the FEM analysis. The
validation involved quantifying the failing conditions of sockets manufactured using the
vii
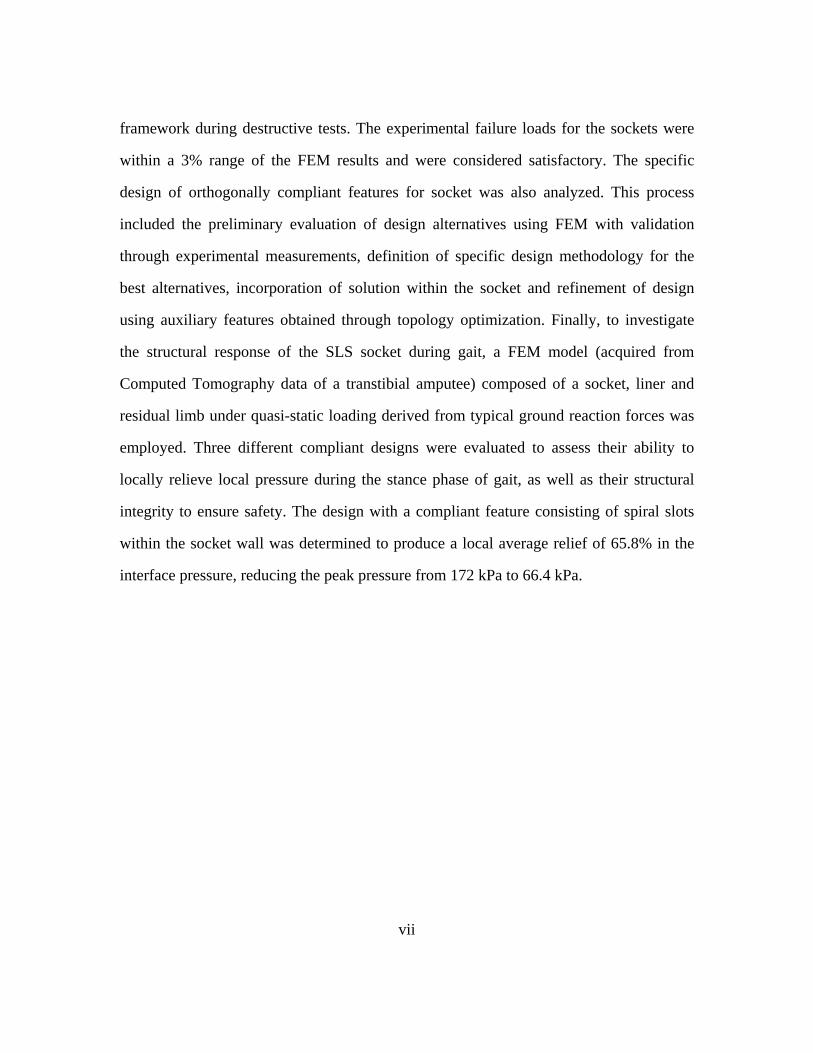
framework during destructive tests. The experimental failure loads for the sockets were
within a 3% range of the FEM results and were considered satisfactory. The specific
design of orthogonally compliant features for socket was also analyzed. This process
included the preliminary evaluation of design alternatives using FEM with validation
through experimental measurements, definition of specific design methodology for the
best alternatives, incorporation of solution within the socket and refinement of design
using auxiliary features obtained through topology optimization. Finally, to investigate
the structural response of the SLS socket during gait, a FEM model (acquired from
Computed Tomography data of a transtibial amputee) composed of a socket, liner and
residual limb under quasi-static loading derived from typical ground reaction forces was
employed. Three different compliant designs were evaluated to assess their ability to
locally relieve local pressure during the stance phase of gait, as well as their structural
integrity to ensure safety. The design with a compliant feature consisting of spiral slots
within the socket wall was determined to produce a local average relief of 65.8% in the
interface pressure, reducing the peak pressure from 172 kPa to 66.4 kPa.

viii
Table of Contents
List of Tables ......................................................................................................... xi
List of Figures ....................................................................................................... xii
List of Figures ....................................................................................................... xii
Chapter 1: INTRODUCTION..................................................................................1 1. State-of-Practice review.........................................................................2 2. Previous Work .......................................................................................4 3. Dissertation Structure.............................................................................5
Chapter 2: MEASUREMENT OF PATELLAR-TENDON BEARING SOCKET/RESIDUAL LIMB INTERFACE PRESSURE AT SENSITIVE SITES.........................................................................................................................7 Abstract ...........................................................................................................7 1. Introduction............................................................................................7 2. Material and methods.............................................................................9
2.1) The F-Socket transducers............................................................10 2.2) Subject data and socket instrumentation.....................................11 2.3) Walking test and step up/down test ............................................12 2.4) Post-processing of results ...........................................................12
3. Results..................................................................................................13 3.1) Contact pressures during the walking test ..................................13 3.2) Pressure differences during the walking test ..............................13 3.3) Contact pressures during step up/down test................................14
4. Discussion............................................................................................15
Chapter 3: AN EXPERIMENTAL AND THEORETICAL FRAMEWORK FOR MANUFACTURING PROSTHETIC SOCKETS FOR TRANSTIBIAL AMPUTEES ..................................................................................................17 Abstract .........................................................................................................17 1. Introduction..........................................................................................17 2. Material and methods...........................................................................19
ix
2.1) Overall Surface Model Development .........................................20 2.2) Design Constraints ......................................................................21 2.3) Socket Computer-Aided Design (CAD) Model Development ...22 2.4) FEM Analysis .............................................................................24 2.5) Load Conditions..........................................................................24 2.6) SLS Fabrication ..........................................................................26 2.7) Experimental Validation .............................................................28
3. Results..................................................................................................30 4. Discussion............................................................................................33
Chapter 4: DESIGN OF ORTHOGONALLY COMPLIANT FEATURES FOR LOCAL CONTACT PRESSURE RELIEF IN DURAFORMTM/SLS MANUFACTURED TRANSTIBIAL PROSTHESES ......................................................................36 Abstract .........................................................................................................36 1. Introduction..........................................................................................37 2. Design Constraints ...............................................................................40 3. Material and Methods ..........................................................................41
3.1) Material Properties......................................................................41 3.2) Evaluation of General Design Alternatives ................................42 3.3) Design of spiral slot compliant feature .......................................47 3.4) Refinement of designed discs: FEM and experimental validation49 3.5) Implementation of spiral-slot features on socket ........................54 3.6) Design of features with Topology Optimization for controlled
compliance ..................................................................................56 4. Conclusion ...........................................................................................64
Chapter 5: INVESTIGATION OF QUASI-STATIC RESPONSE OF COMPLIANT PROSTHETIC SOCKETS FOR TRANSTIBIAL AMPUTEES USING FINITE ELEMENT METHOD..................................................................................66 Abstract .........................................................................................................66 1. Introduction..........................................................................................66 2. Material and methods...........................................................................69
2.1) Generation of FEM from CT data...............................................69 2.2) Boundary Conditions ..................................................................72
x
3. Results..................................................................................................74 3.1) FEM results for vertical 800 N load ...........................................74 3.2) Socket stresses, pressure at fibula head and deformation of compliant
features using quasi-static loading conditions from stance phase75 4. Discussion............................................................................................78
Chapter 6: CONCLUSION ....................................................................................81 1. Summary ..............................................................................................81 2. Future Work .........................................................................................82
Appendices.............................................................................................................85 Appendix 1: Patellar-Tendon Bearing (PTB) Socket Rectifications ............85 Appendix 2: Typical gait cycle .....................................................................86 Appendix 3: Validation of socket wall thickness estimation using FEM.....87 Appendix 4: Considerations about the reuse of DuraformTM PA powder ....88 Appendix 5: Determination using FEM of the compliant wall thickness in the
socket with thinner walled sections .....................................................90 Appendix 6: Curved Beam Analysis.............................................................92 Appendix 7: Matlab code for Topology Optimization .................................96
References..............................................................................................................99
Vita 105

xi
List of Tables
Table A: Material properties achieved from tensile test of DuraformTM PA
specimens made from powder used more than 10 times. .................89

xii
List of Figures
Figure 1.1: Square film being lowered on the positive mold of the socket...........3
Figure 1.2: (a) Double-wall socket; (b) Detail of compliant feature composed of 3
intercepting slots. ................................................................................5
Figure 2.1: Calibration bench for transducers .....................................................10
Figure 2.2: (a) Runway with force plates to collect GRF data; (b) example of socket
instrumented with transducers. .........................................................11
Figure 2.3: Pressure map example from F-Scan software (with values in kPa)
displaying circular sampling region and central region for pressure
difference determination. ..................................................................12
Figure 2.4: (a) Pressure output from transducers for the walking test; (b) Profiles
measured over the stance phase. .......................................................13
Figure 2.5: Pressure at the fibula head and from points in a 25 mm dia circular line
around the fibula head.......................................................................14
Figure 2.6: (a) Pressure difference around fibula head and (b) Pressure difference
around the distal tibia: the black line is the average and the red lines
describe the standard deviation.........................................................14
Figure 2.7: Pressure results for the step up/down experiment. ..............................15
Figure 3.1: Framework for subject-specific socket design, analysis and
manufacturing. ..................................................................................20
Figure 3.2: (a) laser scanned surface with shape information about remaining limb;
(b) rectified and trimmed inner surface for socket with points marking
areas where more compliance is desired...........................................21
xiii
Figure 3.3: Initial estimation of wall thickness using a thin-walled cylinder
approximation for the socket shape. The wall thickness was evaluated
using contact pressure (q) and shear stress (p) taken from literature [8-
19]. ....................................................................................................22
Figure 3.4: (a) Anterior and (b) Posterior views of the inner socket profile
displaying the points used in the definition of the pressure distribution
boundary condition. ..........................................................................26
Figure 3.5: (a) Final CAD model of the socket; (b) Ready-to-wear prosthesis with
the SLS produced DuraformTM Socket. ............................................27
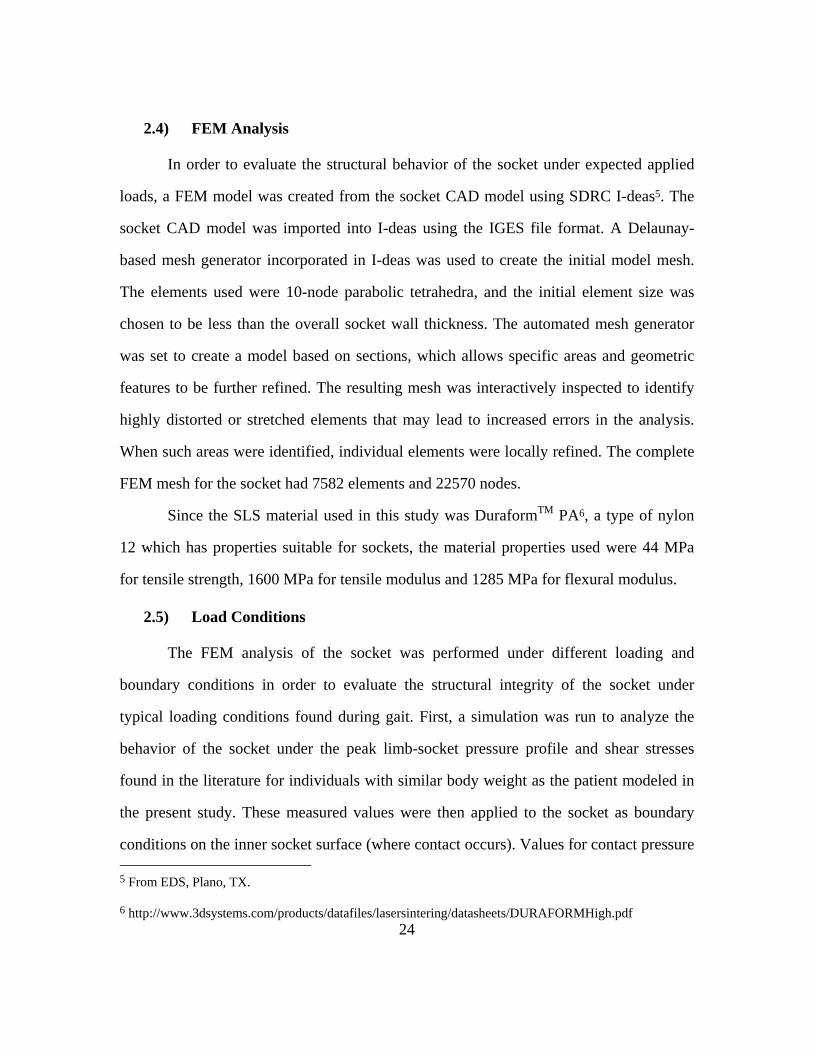
Figure 3.6: (a) Socket, pylon and attachment model; (b) Top view of the socket
filled with plaster and with a rod in the middle; (c) Experimental set-up
for the heel strike test........................................................................29
Figure 3.7: a) Set-up for compression test: socket attached to a hydraulic test
machine and filled with ZTA media to be compressed by piston; b)
travel indicator to measure deformation. ..........................................30
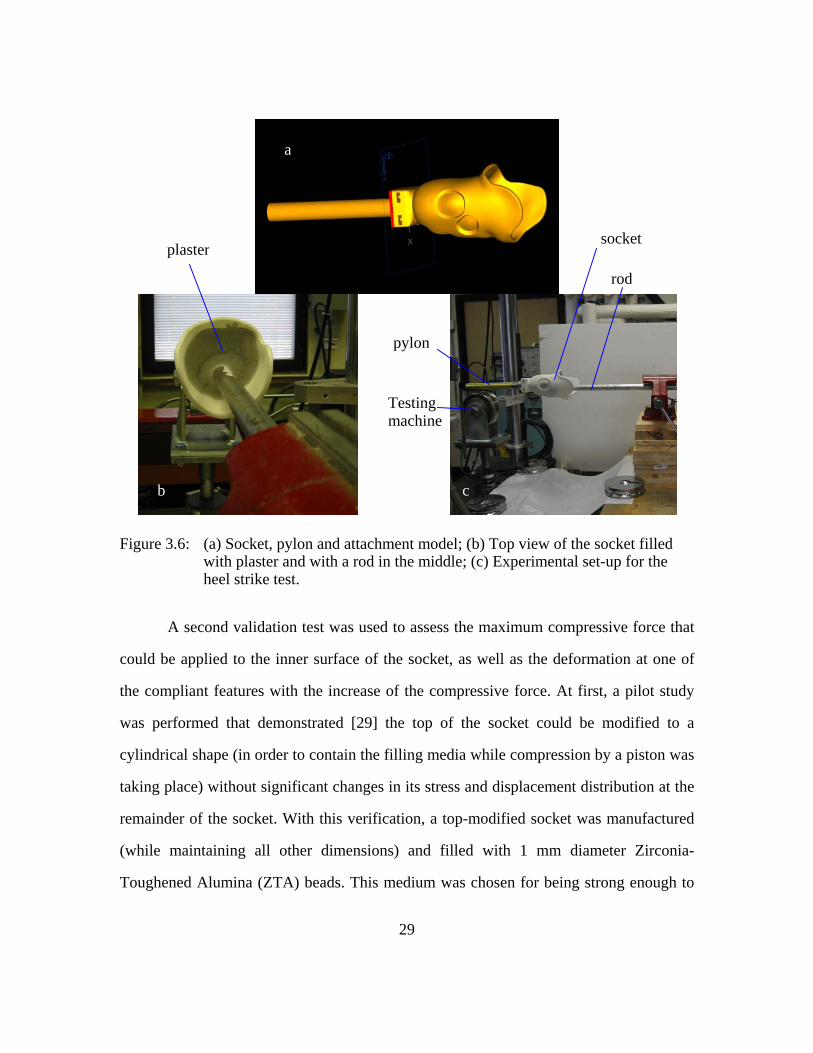
Figure 3.8: (a) FEM model of the socket; (b) FEM results for stresses under peak
loading conditions found during gait (in Pa). ...................................31
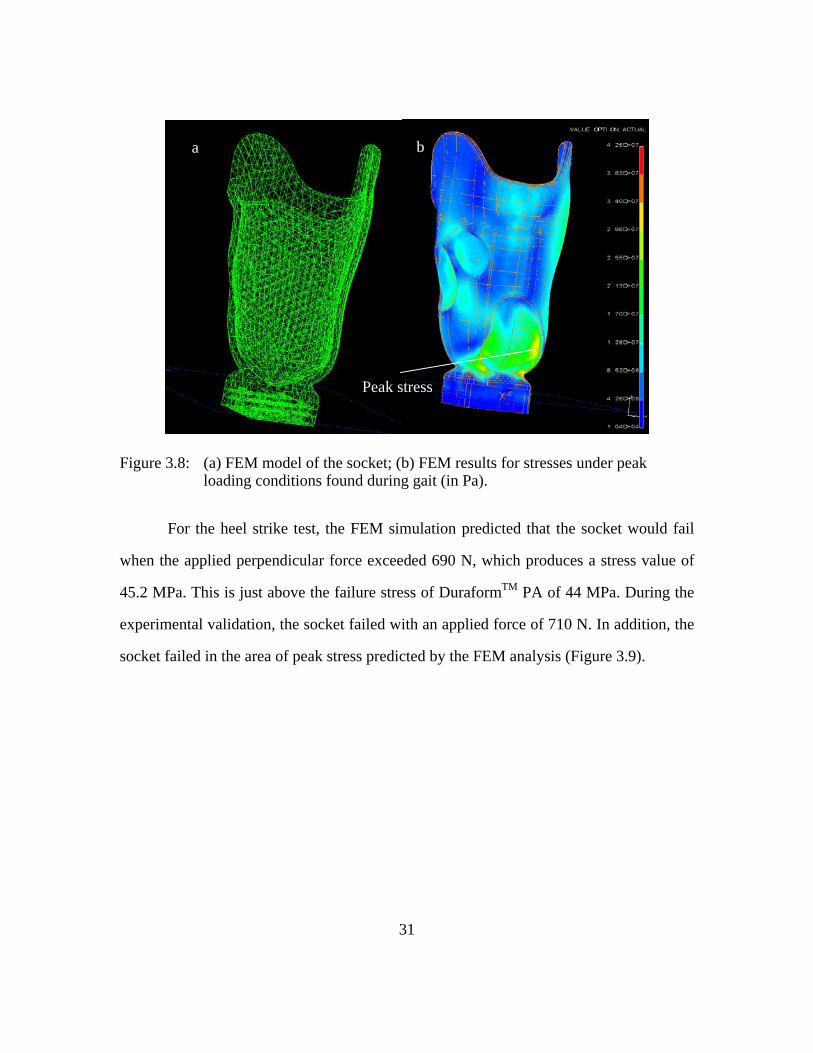
Figure 3.9: (a) FEM results for the stresses in the socket with bending moment
boundary conditions (in Pa); (b) a more detailed view of the failure area
(highlighted by a white square on the left); (c) output from the MTS
machine, showing the load applied at the pylon vs. its displacement
during the heel strike test; (d) and (e) broken socket after completion of
the test. ..............................................................................................32
xiv
Figure 3.10: (a) FEM results for the stresses in the socket with a compressive force
boundary condition (in Pa); (b) Comparison between measured
deformation at bottom of compliant socket with FEM results. ........33
Figure 4.1: (a) and (b) A patient testing an SLS fabricated socket; (c) the description
of the parts of a prosthesis for below-the-knee amputees: i – socket, ii –
attachment fitting, iii – pylon and iv – prosthetic foot......................38
Figure 4.2: Example of a current SLS fabricated socket with locally thinned walls in
areas where compliance is needed. ...................................................39
Figure 4.3: Test disc to evaluate compliance options (dimensions in meters)....42
Figure 4.4: FEM deformation results (in meters) for control disc with no special
compliant features.............................................................................43
Figure 4.5: FEM deformation results (in meters) for test disc with 4 void spaces.44
Figure 4.6: FEM deformation results (in meters) for test disc with 16 radial slots.
45
Figure 4.7: FEM deformation results (in meters) for test disc with two spiral slots.
46
Figure 4.8: FEM deformation results (in meters) for test disc with four spiral slots.
47
Figure 4.9: Diagram with the geometric representation of the half turn spiral beam
(under a load W)................................................................................48
Figure 4.10: Parts used in the experiment of test discs. ........................................50
Figure 4.11: Experimental set-up for the test of compliant discs..........................50
Figure 4.12: Comparison between experimental and FEM results for the central
displacement of test discs with two spiral slots. ...............................52

xv
Figure 4.13: FEM results for disc with two spiral slots and a normal load of 10 kPa:
displacement (in meters) on the left, stresses (in Pa) on the right. ...53
Figure 4.14: FEM results for disc with four spiral slots and a normal load of 10 kPa:
displacement (in meters) on the left, stresses (in Pa) on the right. ...53
Figure 4.15: Comparison between experimental and FEM results for the central
displacement of test discs with four spiral slots................................54
Figure 4.16: Example of orthogonally compliant features incorporated in a socket.55
Figure 4.17: On the left, a detailed view of spiral slot compliant feature and back wall
(unseen); on the right, section view showing void space between slotted
wall and back wall. ...........................................................................56
Figure 4.18: Design domain for the Homogenization Method..............................57
Figure 4.19: Schematic model of a cut view of a test disc: orthogonal deflection of
center portion is desired, while the border is fixed...........................59
Figure 4.20: Definition of design domain Γ for the topology optimization problem.
Material presence is mandatory in black areas, material is forbidden in
white areas, and grey areas indicate the sections to be optimized. ...59
Figure 4.21: Results for topology optimization of orthogonally compliant test disc for
different input volume fractions, and their theoretical compliances.61
Figure 4.22: FEM results for test disc with compliant structure: on the left,
displacement (in meters); on the right, stresses (in Pa). ...................62
Figure 4.23: On the left, implementation of compliant structure on top of test disc; on
the right, a section view of this model. .............................................62
Figure 4.24: Definition of design domain Γ for the topology optimization problem
with curved domain to be optimized.................................................63
xvi
Figure 4.25: Result for topology optimization of orthogonally compliant curved
domain...............................................................................................63
Figure 4.26: Implementation of compliant feature on socket................................64
Figure 5.1: FEM model of (a) bones, (b) soft tissues and (c) liner. ....................71
Figure 5.2: FEM models of the four different socket designs simulated: (a) plain
socket with no compliant feature; (b) socket with thin-walled compliant
feature; (c) socket with spiral slots for compliance; (d) socket with spiral
slots and compliant support. .............................................................71
Figure 5.3: Free-body diagram of a prosthetic leg, where the plane of the drawing
(x-y) is the sagittal plane...................................................................73
Figure 5.4: (a) Anterior and (b) Posterior view of pressures on the residual limb
using the plain socket under a downward vertical load of 800 N.....74
Figure 5.5: Structural FEM results displaying the stresses (in Pa) on each compliant
socket at 35% of stance, where the largest stresses were encountered.75
Figure 5.6: Comparison of resulting FEM values for (a) pressure at fibula head and
(b) local deformation at compliant features among the different socket
designs simulated. .............................................................................77
Figure A1: Areas of the lower limb where rectifications are needed for the PTB
socket: darker red areas are appropriate for weight bearing, while lighter
red areas must have pressure relieved [57]. ......................................85
Figure A2: Typical gait cycle illustrating the nomenclature of its phases and main
events [56].........................................................................................86
Figure A3: (a) FEM results (in meters) for displacement; (b) FEM results for
stresses (in Pa)...................................................................................87
xvii
Figure A4: Tensile specimens used to evaluate the material properties of older
Duraform powder..............................................................................88
Figure A5: (a) FEM stress results (in Pa) for the thinner walled section of the
socket; (b) Results for reaction forces (in N)....................................91
Figure A6: Diagram based on Figure 4.9, with the addition of distributed load w.92
1
Chapter 1: INTRODUCTION
Successful rehabilitation of transtibial amputees involves effective fitting of
several different type of prosthetic components and one of these components is the
prosthetic socket. However, conventional techniques used to produce these sockets with
suitable characteristics are labor intensive and expensive, and depend on the work of
skilled prosthetists that are relatively scarce compared to the number of transtibial
amputees. With more than 500,000 lower extremity amputees in the United States alone,
and at least 60,000 new ones every year [1], there is an urgent demand for improved
methods of prosthetic limb fabrication that would offer faster and more cost effective
rehabilitation and improved patient care. The inherent ability of SLS techniques to create
complex physical three-dimensional objects directly from subject-specific digital shape
information without the need for specific tooling, molds or human labor makes it
extremely suitable to fabricate prosthetic sockets. Previous research has established
Selective Laser Sintering (SLS) as a very promising technique for producing subject-
specific sockets for transtibial amputee prostheses [1].
With the intent of developing a framework for this application, collaboration
between the Department of Mechanical Engineering at The University of Texas at Austin
and the Department of Rehabilitation Medicine of the University of Texas Health Science
Center at San Antonio (UTHSCA) was established. A framework for the design, analysis,
manufacture and testing of SLS sockets for transtibial prostheses was created, and its
development forms the basis of this dissertation.

2
1. STATE-OF-PRACTICE REVIEW
Interviews with prosthetists at the UTHSCSA and visits to their socket fabrication
laboratory were conducted to gain insight into the current state-of-the-art in socket
fabrication. Several different methods are currently used in the production of
conventional sockets. However, the most common technique is also highly dependent on
the skill of experienced prosthetists and technicians. The procedure can be summarized as
follows. A negative mold of the residual limb is acquired. This portion is completed using
a moistened cast sock that is pulled over the residual limb. Using an indelible pencil, the
important sites of the residual limb are marked on the cast sock to help with their future
identification. The residual limb is then wrapped with a flexible plaster bandage that
becomes rigid with time. Once the cast is hard, it is then removed from the residual limb.
A positive mold is made by filling the negative mold with molding plaster mixed with
water and allowing it to harden. After it has hardened, the bandage is stripped off.
The positive mold is then modified by the prosthetist, using the pencil marked
sites as a reference, to relieve areas that are pressure sensitive by adding plaster, while
weight-bearing areas that are pressure tolerant are altered by removing plaster from the
positive mold – this procedure is commonly referred to as socket rectification. The end
result is a pattern for socket fabrication by either by vacuum forming or lamination. In the
case of lamination, the positive mold is then sealed using a poly-vinyl alcohol (PVA) bag
placed over the positive mold. Several pieces of stockinette (made of nylon, fiberglass,
carbon graphite, kevlar or a combination of these materials) are then pulled over the
positive mold and sealed by another PVA bag. This PVA bag has an opening at the top to
allow the bag to be filled with a liquid resin. In order to improve the flow of the resin,
maintain the shape of the positive mold and to help saturate the stockinette evenly, a
negative pressure is placed on the inside of the outer bag drawing the resin into the
stockinette. Once the resin has hardened the plaster pattern is broken out. After the plaster
has been removed, the socket is trimmed and the edges are smoothed. Alternatively, the
socket can be vacuum formed. A sheet of thermoplastic is heated in an oven to achieve a
softer consistency, and then lowered over the mold (with the mold positioned upside
down). Vacuum is applied in order to conform the heated plastic to the pattern’s outer
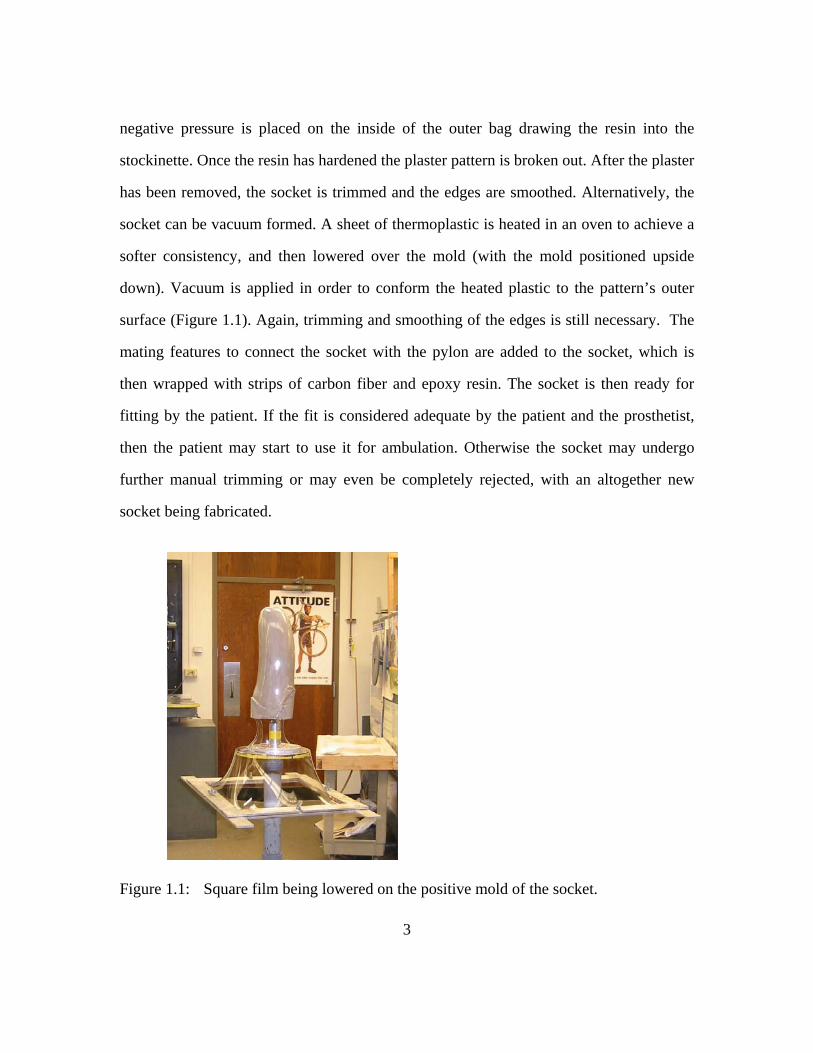
surface (Figure 1.1). Again, trimming and smoothing of the edges is still necessary. The
mating features to connect the socket with the pylon are added to the socket, which is
then wrapped with strips of carbon fiber and epoxy resin. The socket is then ready for
fitting by the patient. If the fit is considered adequate by the patient and the prosthetist,
then the patient may start to use it for ambulation. Otherwise the socket may undergo
further manual trimming or may even be completely rejected, with an altogether new
socket being fabricated.
Figure 1.1: Square film being lowered on the positive mold of the socket.
3
4
This method, as previously stated, is extremely time consuming, laborious and
ultimately depends on the skills of an experienced prosthetist and technician. If both the
prosthetist and technician dedicate exclusive attention to the production of one socket, the
work can be completed in about 8 hours. Moreover, the resulting socket must yet be
tested by the patient for long time comfort and fit to avoid the onset of pain and
circulatory problems. Thus, the socket fabrication may become an iterative process if the
socket is found to be unsatisfactory. As such, an alternative method capable of providing
solutions to these limitations is greatly needed.
2. PREVIOUS WORK
The first design approach for the fabrication of SLS sockets consisted of a double-
walled prosthetic socket [3]. The double-walled socket (Figure 1.2a) consisted of a
thicker outer wall and a thinner inner wall, which contacts the residual limb. The socket
incorporated design features to allow greater compliance at high-pressure spots. The
compliant features were intercepting slots (Figure 1.2b). The double-wall allowed
compliance and strength to be dealt with in separate mechanical structures. However, the
socket was heavier and bulkier than traditional sockets and lacked a natural look. In
addition, during clinical trials the sock worn on the patient’s limb interfered with
compliant features of the inner wall. Thus, additional work was needed to improve this
initial approach.

compliant feature
ba
Figure 1.2: (a) Double-wall socket; (b) Detail of compliant feature composed of 3 intercepting slots.
3. DISSERTATION STRUCTURE
This dissertation is focused on developing a framework for producing improved
subject-specific sockets. Chapter 2 analyzes the interface mechanics between the socket
and residual limb by measuring the contact pressure distribution between the socket and
residual limb, which is a prerequisite for integrating design features to improve patient
comfort. This analysis is presented, including a description of the instrumentation of a
socket to provide contact pressure measurements in two common interface locations
where pressure relief is needed.
Chapter 3 presents details of the framework for fabrication of prosthetic sockets
using SLS. There, the main tasks are described, including the acquisition of shape
information, surface model modifications to incorporate the rectifications of the patellar-
5
6
tendon bearing (PTB) method, socket computer-aided design (CAD) model development,
structural analysis using a Finite Element Method (FEM) model to assess structural
integrity, fabrication of a functional prototype using SLS, and experimental validation of
the FEM analysis.
Chapter 4 presents the methodology for the design and integration of orthogonally
compliant features in the socket structure to reduce contact pressure. The methodology
includes the preliminary evaluation of compliant design alternatives on test coupons
using FEM, validation of computed results through experimental measurements,
definition of design method for the most appropriate solution, incorporation of the
solution within the socket geometry and refinement of the design solution using auxiliary
features obtained through topology optimization.
Chapter 5 presents an alternative analysis of the structural response of the socket
to typical loading conditions that occur during gait. With the addition of the FEM model
of the residual limb derived from computed tomography (CT) data to the socket model,
the evaluation of different socket designs and the corresponding effects on interfacing
tissues using quasi-static loads is performed. The integration of the socket and residual
limb models was shown to eliminate much of the need for extensive prototyping and
socket instrumentation.
Finally, Chapter 6 presents a summary of the research performed and highlights
areas for future work.

7
Chapter 2: MEASUREMENT OF PATELLAR-TENDON BEARING SOCKET/RESIDUAL LIMB INTERFACE PRESSURE AT SENSITIVE
SITES
ABSTRACT
In a patellar-tendon bearing (PTB) prosthesis, the inner profile of the socket is
modified with respect to that of the residual limb so that the load is sustained in specific
pressure resistant tissues, while relieving this contact pressure in other sensitive sites.
Still, it is not uncommon for many patients to feel discomfort and pain in certain regions.
Further pressure relief can be achieved through the incorporation of compliant features
within the socket, which became possible with the development of rapid prototyping
techniques for the fabrication of prosthetic sockets. In order to adequately design such
features, an investigation of the magnitude of contact pressures at sites where relief is
needed must be performed. This paper describes the acquisition of interface pressure data
at the fibula head and the distal tibia during a walking test and during a step up/step down
test, using thin-film tactile pressure sensors. The average maximum pressures obtained at
the fibula head and distal tibia were 120 kPa and 75 kPa, respectively, for the walking
test. For the step up/down test, the values for the peak pressures at these sites were 125
kPa and 90 kPa, respectively. Both results were considered consistent throughout the
trials, with deviations of 2.3% for the walking test and 6% for the step up/down test.
1. INTRODUCTION
8
The socket of a patellar-tendon bearing (PTB) prosthesis is designed to reproduce
the overall shape of the patient’s stump, but undergoes typical local modifications
(rectifications) to cause most of the load distribution to occur in specific areas (e.g. the
patellar tendon and the gastrocnemius muscle belly) that have a greater tolerance for load
and pressure [4]. However, some sensitive areas may still be affected by enough contact
pressure to cause discomfort to the patient. In addition, integrating larger local
rectifications to relieve pressure may deteriorate residual limb/socket fit and compromise
structural integrity. The introduction of local compliant features may provide an
alternative solution to relieving concentrated high pressure areas. Although in
conventional hand cast sockets such features are hard to implement, the production of
sockets using freeform fabrication methods (to be discussed in Chapter 3) provides to the
prosthetist with a fabrication technique to easily incorporate complex compliant
topologies in the socket with no production cost penalty.
To properly design such features, it is necessary to quantify the magnitude of the
pressure in such sensitive areas during common workload conditions (to be addressed in
Chapters 3 and 4). Several methods have previously been used to measure such pressures
[7], including the use of fluid-filled sensors, pneumatic sensors and diaphragm strain
gauges. The greatest challenge with such transducers is their placement in the socket
without significantly modifying the interface conditions. Another issue is allowing
freedom of movements for the patient during testing while avoiding discomfort due to the
presence of such transducers within the instrumented sockets. Thus, a promising
alternative is the use of pressure transducers with arrays of pressure cells, which are thin
enough to have minimal impact in the interface conditions. This technique has been
previously reported [6] for the measurement of PTB socket/limb interface pressure
distributions during gait. There, four transducer arrays were used simultaneously in the

9
socket/limb interface, covering a considerable area of the socket. However, this might
lead to a change in the friction coefficient between the socket and the residual limb in all
such areas. A previous study reported that changes in the friction parameters of the
interface will cause ensuing changes in the shear stress distributions, thus significantly
affecting, as a consequence, the pressure distribution [11].
The focus of this paper is to use transducer arrays of pressure sensing resistors
and measure the contact pressure magnitudes in two specific sensitive sites of the residual
limb, the fibula head and the distal tibia at the anterodistal area. From a designer’s
viewpoint, it is necessary to obtain not only the value of the pressure at the center of the
site where compliance is needed, but also to predict the expected pressure gradient in
immediately surrounding areas. Furthermore, pressure values for workload situations
other than gait are also important considerations. Our goals were 1) obtain the peak
pressure at the specific sites during the stance phase of gait; 2) obtain the pressure
gradient during the stance phase of gait in the areas immediately surrounding the specific
sites; 3) obtain the peak pressure at the specific sites during a step up/step down test.
2. MATERIAL AND METHODS
The tests were performed by instrumenting the socket of a chosen patient with
two calibrated transducers. The patient was first asked to walk on a runway as pressure
data was collected for the walking test. Then he was asked to step up and down on a stool
for acquisition of the step up/down pressure data. The results were processed using the
software bundled with the transducers.

2.1) The F-Socket transducers
The two transducers used to measure the pressure were F-Socket 9811 sensors,
manufactured by Tekscan1. Each sensor was 76.2 mm x 203.2 mm, with a thickness of
0.28 mm, pressure range between 0 and 517 kPa, and had a total of 96 sensels (each with
161.3 mm2), arranged in 6 columns and 16 rows. They were connected to a computer by
an interface cable. F-Scan software was used to provide the interface between the sensors
and the data acquisition hardware. The software also provided the equilibration and
calibration capabilities as well as visualizing and recording pressure data taken during the
test.
The sensors were equilibrated and calibrated, using the equipment shown
schematically in Figure 2.1, prior to being placed in the socket for testing. The sensors
were each put into the pressure bladder, and a pressure of 200 kPa (raised from 0) was
used for calibration. To dissipate the effects of signal drifting, 120 seconds were allowed
to pass after application of pressure before calibration was performed [20].
Computer
Pressure Gauge
Needle ValveDigital Pressure Gauge
Pressure Bladder
Figure 2.1: Calibration bench for t
1 South Boston, MA.
Signal Generator
Pressure Regulator
Air Compressor
Solenoid Valve
ransducers
10
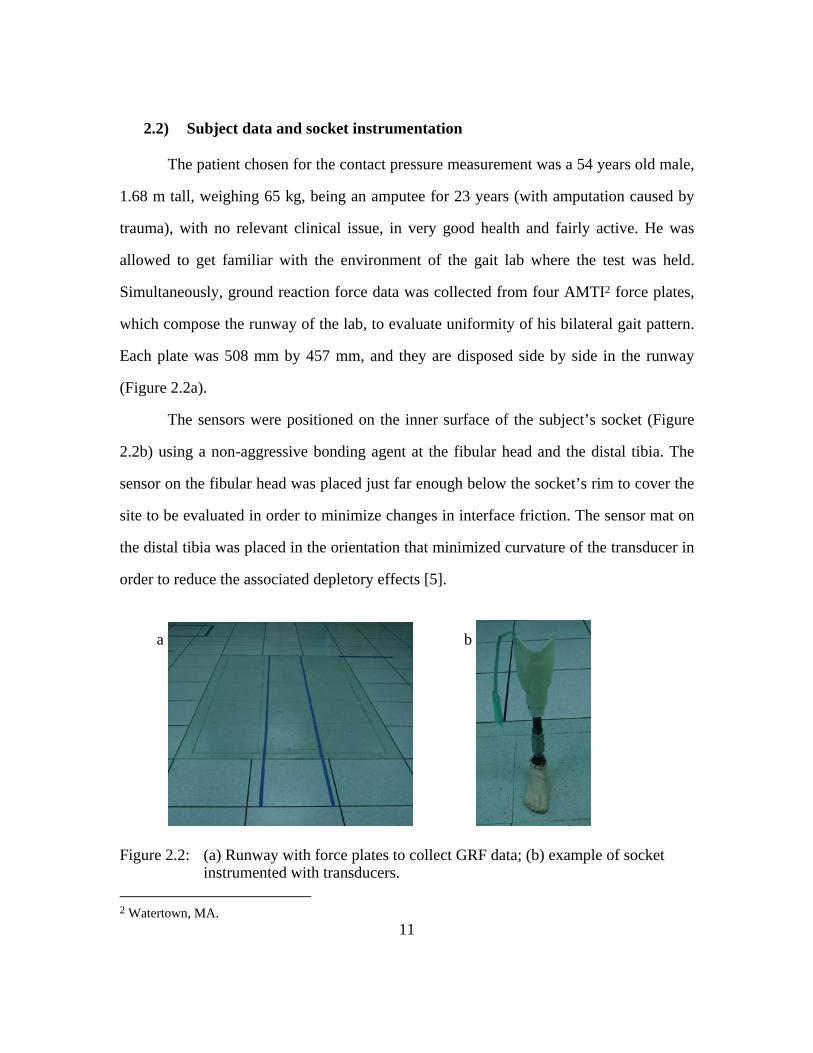
2.2) Subject data and socket instrumentation
The patient chosen for the contact pressure measurement was a 54 years old male,
1.68 m tall, weighing 65 kg, being an amputee for 23 years (with amputation caused by
trauma), with no relevant clinical issue, in very good health and fairly active. He was
allowed to get familiar with the environment of the gait lab where the test was held.
Simultaneously, ground reaction force data was collected from four AMTI2 force plates,
which compose the runway of the lab, to evaluate uniformity of his bilateral gait pattern.
Each plate was 508 mm by 457 mm, and they are disposed side by side in the runway
(Figure 2.2a).
The sensors were positioned on the inner surface of the subject’s socket (Figure
2.2b) using a non-aggressive bonding agent at the fibular head and the distal tibia. The
sensor on the fibular head was placed just far enough below the socket’s rim to cover the
site to be evaluated in order to minimize changes in interface friction. The sensor mat on
the distal tibia was placed in the orientation that minimized curvature of the transducer in
order to reduce the associated depletory effects [5].
a b
Figure 2.2: (a) Runway with force plates to collect GRF data; (b) example of socket instrumented with transducers.
112 Watertown, MA.

2.3) Walking test and step up/down test
The patient was then allowed to walk around and reported to feel no difference
from the presence of the sensors. Pressure data was collected at 60 Hz for 10 seconds as
the subject walked along a straight path at a self-selected pace. Six trials were recorded.
Finally, the subject was asked to step up on a bench that was 200 mm tall, and then step
down from it. The motion was repeated six times while pressure data was recorded at a
60 Hz rate.
2.4) Post-processing of results
The pressure data was processed using the F-Scan software. All pressures
measured were calibrated and the peak contact pressures at the fibula head and the distal
tibia were identified in the output data during the walking and step up/down trials.
Results for the local surrounding pressure difference to evaluate the gradients in the
surrounding area of the fibula head and the distal tibia were obtained in a similar way,
with the software interface being used to sample the pressure values along a 25 mm circle
around the center point of the site (Figure 2.3). The readings from these points were
averaged and the pressure difference between the mean surrounding values and the
central values was calculated.
Fibula head
Figure 2.3: Pressure map example from F-Scan software (with values in kPa) displaying circular sampling region and central region for pressure difference determination.
12
3. RESULTS
The transducers produced consistent profiles during both the walking and step
tasks. Representative profiles of each task will be presented and discussed below.
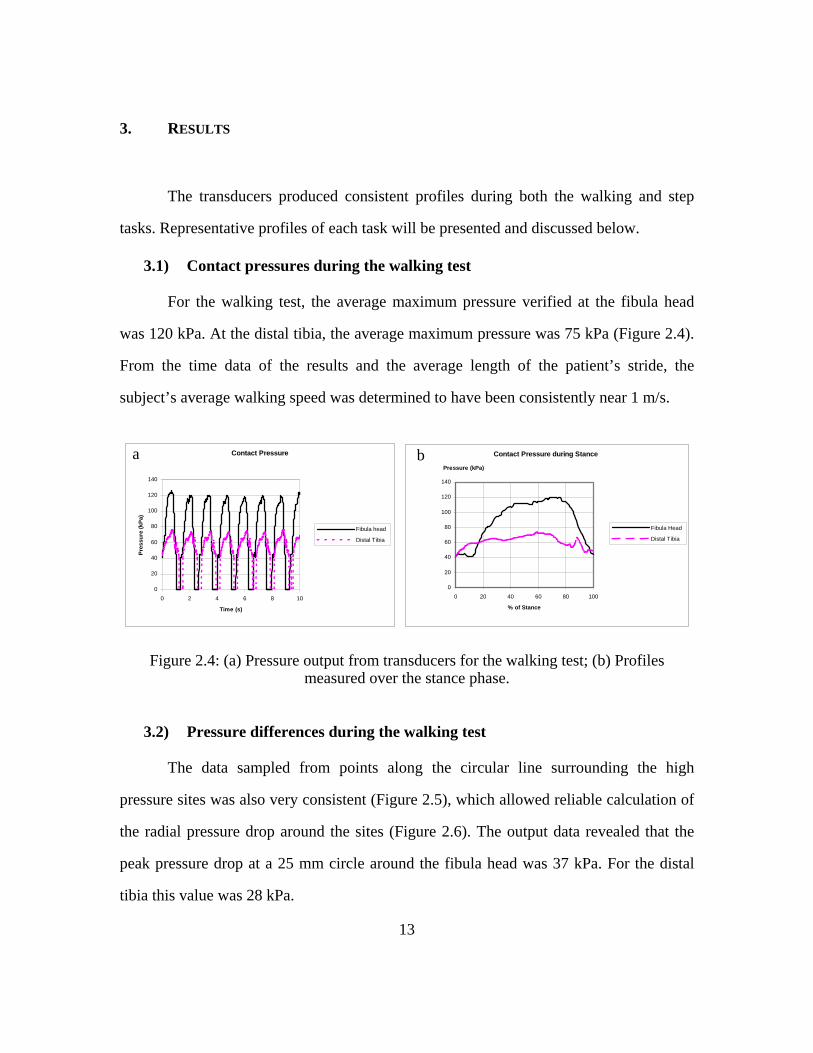
3.1) Contact pressures during the walking test
For the walking test, the average maximum pressure verified at the fibula head
was 120 kPa. At the distal tibia, the average maximum pressure was 75 kPa (Figure 2.4).
From the time data of the results and the average length of the patient’s stride, the
subject’s average walking speed was determined to have been consistently near 1 m/s.
Contact Pressure
0
20
40
60
80
100
120
140
0 2 4 6 8 10
Time (s)
Pres
sure
(kPa
)
Fibula head
Distal Tibia
Contact Pressure during Stance
0
20
40
60
80
100
120
140
0 20 40 60 80 100
% of Stance
Pressure (kPa)
Fibula Head
Distal Tibia
a b
Figure 2.4: (a) Pressure output from transducers for the walking test; (b) Profiles measured over the stance phase.
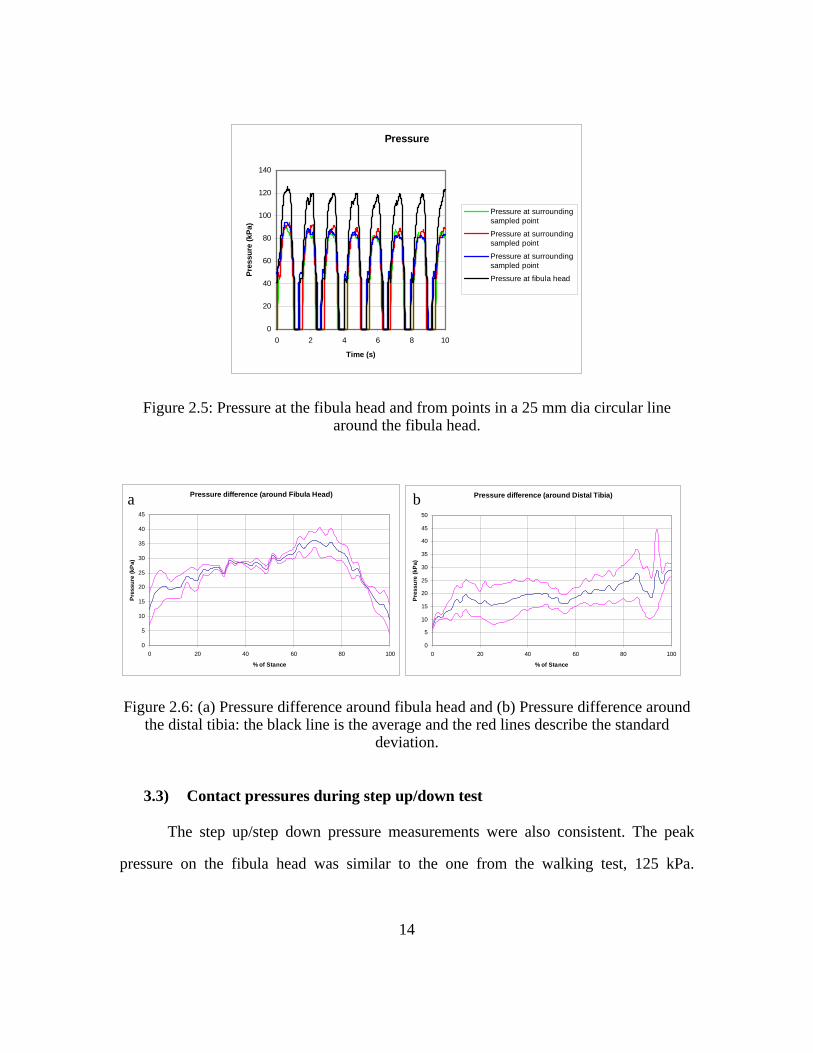
3.2) Pressure differences during the walking test
The data sampled from points along the circular line surrounding the high
pressure sites was also very consistent (Figure 2.5), which allowed reliable calculation of
the radial pressure drop around the sites (Figure 2.6). The output data revealed that the
peak pressure drop at a 25 mm circle around the fibula head was 37 kPa. For the distal
tibia this value was 28 kPa.
13
Pressure
0
20
40
60
80
100
120
140
0 2 4 6 8 10
Time (s)
Pres
sure
(kPa
)
Pressure at surroundingsampled point
Pressure at surroundingsampled point
Pressure at surroundingsampled point
Pressure at fibula head
Figure 2.5: Pressure at the fibula head and from points in a 25 mm dia circular line around the fibula head.
Pressure difference (around Fibula Head)
0
5
10
15
20
25
30
35
40
45
0 20 40 60 80 100
% of Stance
Pres
sure
(kPa
)
Pressure difference (around Distal Tibia)
0
5
10
15
20
25
30
35
40
45
50
0 20 40 60 80 100
% of Stance
Pre
ssur
e (k
Pa)
a b
Figure 2.6: (a) Pressure difference around fibula head and (b) Pressure difference around the distal tibia: the black line is the average and the red lines describe the standard
deviation.
3.3) Contact pressures during step up/down test
The step up/step down pressure measurements were also consistent. The peak
pressure on the fibula head was similar to the one from the walking test, 125 kPa.
14
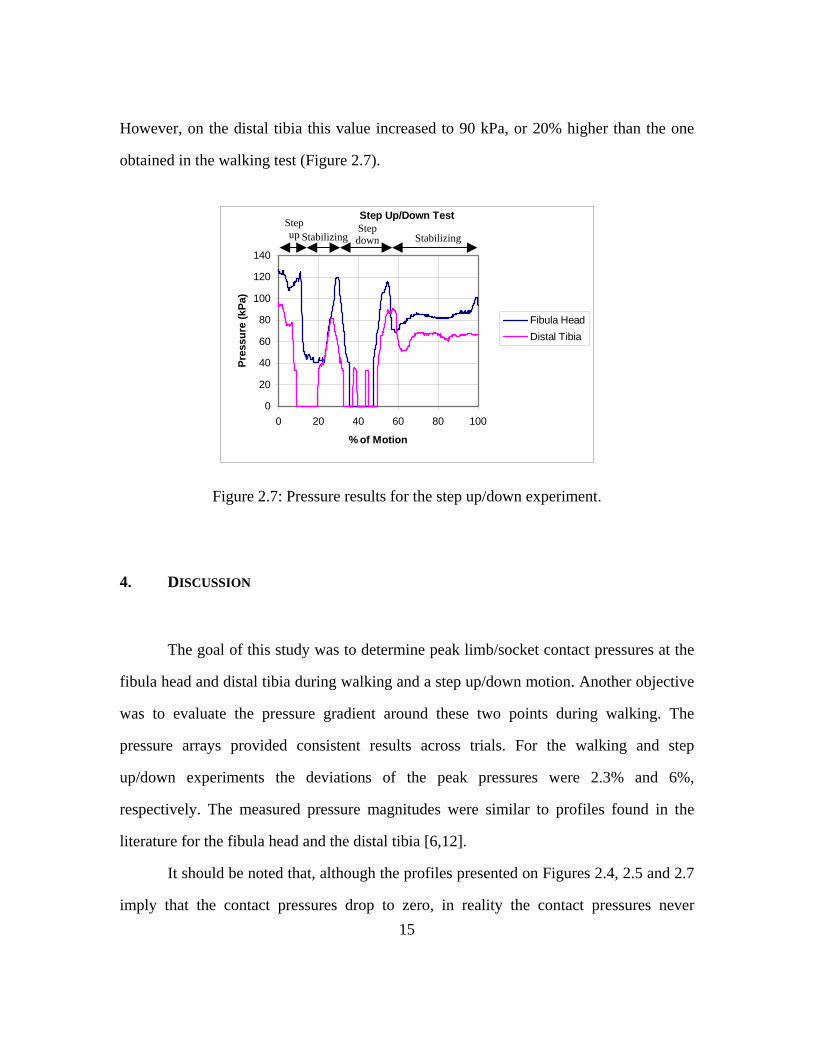
However, on the distal tibia this value increased to 90 kPa, or 20% higher than the one
obtained in the walking test (Figure 2.7).
Step Up/Down Test
0
20
40
60
80
100
120
140
0 20 40 60 80 100
% of Motion
Pres
sure
(kPa
)
Fibula HeadDistal Tibia
StabilizingStepdown
Step up Stabilizing
Figure 2.7: Pressure results for the step up/down experiment.
4. DISCUSSION
The goal of this study was to determine peak limb/socket contact pressures at the
fibula head and distal tibia during walking and a step up/down motion. Another objective
was to evaluate the pressure gradient around these two points during walking. The
pressure arrays provided consistent results across trials. For the walking and step
up/down experiments the deviations of the peak pressures were 2.3% and 6%,
respectively. The measured pressure magnitudes were similar to profiles found in the
literature for the fibula head and the distal tibia [6,12].
It should be noted that, although the profiles presented on Figures 2.4, 2.5 and 2.7
imply that the contact pressures drop to zero, in reality the contact pressures never 15

16
actually drop to zero since there is never any loss of contact between the socket and the
residual limb at the investigated sites. This effect in the results is due to the threshold
setting of the measuring equipment to filter out noise for low loads. This filtering causes
the plot to indicate zero contact pressure every time the measured pressure was below 20
kPa. It should also be noted that the values measured and presented are subject and socket
specific, and may vary even for the same subject depending on many factors, such as
time, socket/foot alignment [8-10].
The data presented in this article is important because, with the development of
new techniques for socket design involving rapid prototyping and freeform fabrication,
many different design solutions are possible to provide relief to the contact pressure at
sensitive areas (as will be addressed in Chapter 4). Thus, the measured values for the
pressure differences on areas surrounding the sensitive sites allow a better understanding
of the load conditions to be considered in the design pressure relieving features.
However, a challenging aspect of the socket design process is that such pressure
data needs to be predicted a priori, in order to serve as an input parameter for the design
itself, instead of being acquired a posteriori. Thus, using FEM as a tool to predict such
pressures is a promising alternative [12-14,17,18], allowing in situ pressure
measurements, such as described in this article, to be used for design validation (as will
be described in Chapter 5).
17
Chapter 3: AN EXPERIMENTAL AND THEORETICAL FRAMEWORK FOR MANUFACTURING PROSTHETIC SOCKETS
FOR TRANSTIBIAL AMPUTEES
ABSTRACT
An attractive application of Solid Freeform Fabrication, given its ability to easily
generate parts with customized complex geometric design, is to produce sockets for
transtibial amputee prostheses. The present work focuses on developing a manufacturing
framework to produce subject-specific sockets made of DuraformTM PA material using
Selective Laser Sintering. The framework includes establishing an overall socket design
(using the patellar-tendon bearing approach), performing a structural analysis using the
Finite Element Method (FEM) to ensure reliability during patient use, and validating the
results by comparing the model output with experimental data. The validation included
quantifying the failing conditions of sockets built using the framework through bending
moment and compression tests. The experimental failure loads for the socket were within
3% of the FEM results and were hence considered satisfactory.
1. INTRODUCTION
For lower extremity amputees, a well fitting socket is a prerequisite for successful
rehabilitation [1]. The socket provides the interface between the prosthesis and residual
limb, which is designed to allow appropriate load transmission, comfort and efficient
motion control. Attaining these objectives is extremely challenging, with up to 55% of
18
lower limb amputees reporting dissatisfaction with socket comfort, residual limb pain,
and/or skin breakdown. Moreover, current techniques used to produce sockets with
suitable characteristics are labor intensive and expensive, and depend on the work of
skilled prosthetists that are relatively scarce compared to the number of lower limb
amputees (more than 500,000 in the United States alone, with 60,000 new ones every
year [1]). Thus, an objective and systematic method of fabricating prosthetic sockets is
needed to improve efficiency in prosthetic care, enhance comfort and fit, and reduce time
and cost to ensure the optimal amputee rehabilitation. Previous systematic approaches
have not centered on the engineering design and structural analysis of the socket and
lacked experimental validation of the FEM analysis [17,21]. In addition, no study has
utilized Selective Laser Sintering (SLS) technology for the socket fabrication.
SLS technology has proven to be a very powerful manufacturing technique with
several advantages over traditional methods [22-25]. One advantage is that SLS can
directly create sockets from digital subject-specific shape information, which eliminates
the need for extensive molds, hand lamination and finishing procedures. Second, SLS has
the ability to create complex geometries with minimal cost penalty in manufacturing.
From a design perspective, this significantly expands the options for developing and
exploring alternate socket designs, including geometric variants of traditional socket
shapes, and for incorporating variable compliant elements in selected locations to relieve
contact pressure between the limb and socket. Third, the integration of additional
prosthetic components/features directly into the socket, such as an integrated pylon
mounting plate at the attachment site is straightforward.
The overall goal of this paper was to develop a manufacturing framework to
produce subject-specific sockets made of DuraformTM PA material using SLS. The
framework included defining the overall socket design using the patellar-tendon bearing

19
approach, performing a structural analysis using FEM to ensure reliability during patient
use, and validating the FEM results with experimental data.
2. MATERIAL AND METHODS
The framework for design and fabrication of prosthetic sockets is presented
below, and its principal steps are discussed in detail. Then, two tests for experimental
validation performed are presented. The chart shown in Figure 3.1 describes the overall
framework for the production of sockets using SLS. The main steps of the framework
are: 1) surface model development using the geometry of the residual limb acquired
through laser scanning, 2) CAD model development using appropriate design constraints,
3) FEM analysis of the socket using related boundary conditions and 4) SLS fabrication.

Figure 3.1: Framework for subject-specific socket design, analysis and manufacturing.
Pylon and foot mounting Prosthesis ready
to be used
Prototype Socket
Socket Fabrication with SLS
Mold cast directly from patient’s limb
Surface model from digital shape information
Laser scanning of mold
CAD Model Development
STL file
Mesh Generation
FEM analysis
Redesign if needed
Else proceed to fabrication
Boundary conditions:
e.g. patient’s weight,
interface pressure
2.1) Overall Surface Model Development
The first step of the framework is to acquire the patient’s residual limb shape
information through laser scanning of a positive mold cast directly from the patient’s
limb. For the socket designed and analyzed in this article, data was taken from a 54 year
old male, 1.68 m tall, weighing 65 kg, being a transtibial amputee for 23 years (with
amputation caused by trauma), with no relevant clinical issue, in very good health and
fairly active. A Seattle Limb Systems ShapeMaker 3000 laser scanner (built using
technology licensed from UTHSCSA) was used to provide a point cloud that described
the exact shape of the limb with an angular resolution of 3 degrees and a z-axis resolution
20
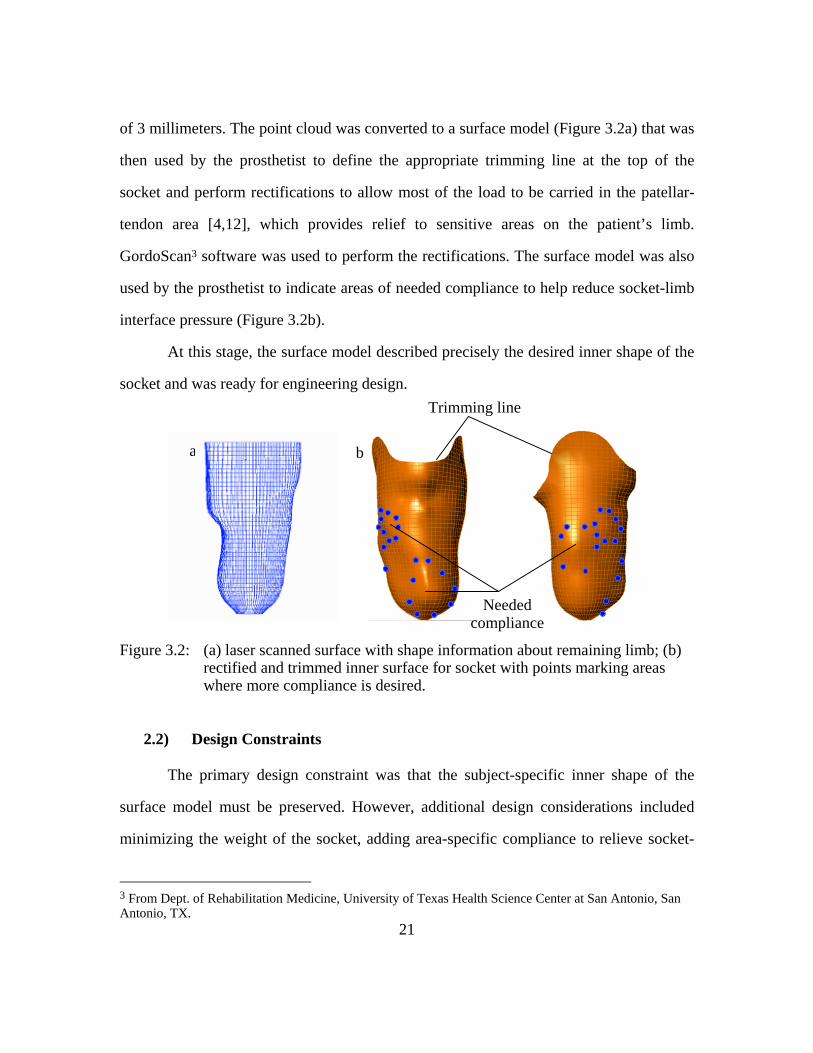
of 3 millimeters. The point cloud was converted to a surface model (Figure 3.2a) that was
then used by the prosthetist to define the appropriate trimming line at the top of the
socket and perform rectifications to allow most of the load to be carried in the patellar-
tendon area [4,12], which provides relief to sensitive areas on the patient’s limb.
GordoScan3 software was used to perform the rectifications. The surface model was also
used by the prosthetist to indicate areas of needed compliance to help reduce socket-limb
interface pressure (Figure 3.2b).
At this stage, the surface model described precisely the desired inner shape of the
socket and was ready for engineering design.
Trimming line
a b
Needed compliance
Figure 3.2: (a) laser scanned surface with shape information about remaining limb; (b) rectified and trimmed inner surface for socket with points marking areas where more compliance is desired.
2.2) Design Constraints
The primary design constraint was that the subject-specific inner shape of the
surface model must be preserved. However, additional design considerations included
minimizing the weight of the socket, adding area-specific compliance to relieve socket-
21
3 From Dept. of Rehabilitation Medicine, University of Texas Health Science Center at San Antonio, San Antonio, TX.

limb interface pressure and strength to withstand the normal loads applied during human
gait. In addition, aesthetic considerations that produce a socket shape that mimics the
profile of a leg anatomy were also important. From this set of design criteria, the overall
topology of a traditional thin-walled shell socket satisfied the considerations above.
2.3) Socket Computer-Aided Design (CAD) Model Development
The initial calculation for the wall thickness of the socket was estimated using a
thin-walled cylinder as an approximation (Figure 3.3). The radius of the cylinder was
estimated by the mean radius of the inner surface, and the contact pressure and shear
stress were estimated using the peak values found in the literature [8-19].
Figure 3.3: Initial estimation of wall thickness using a thin-walled cylinder approximation for the socket shape. The wall thickness was evaluated using contact pressure (q) and shear stress (p) taken from literature [8-19].
The equation used to define the overall thickness of the socket wall is given by
[31,32]:
max
2
2RE
LRpRqt
∆⋅
⋅⋅⋅+⋅=
ν ( 1 )
where q is the normal pressure load, p is the transferred shear stress, R is the
radius of the cylinder, L is its length, E is Young’s Modulus and ∆Rmax is the maximum
22

radial expansion desired. To ensure that the socket fit is preserved during applied
workload, a cylinder radius expansion of 1% or less was desired.
To preserve structural integrity, the resulting wall thickness should provide
stresses within boundaries of the strength of the material:
t
RqpSy⋅+
> ( 2 )
where Sy is the value for tensile strength of DuraformTM. Validation of this initial
value for thickness with FEM analysis can be found in Appendix 3. Once the appropriate
initial value for wall thickness was identified from ( 1 ), the inner surface profile was
modified in the CAD software (Rhinoceros 3D4) to produce the final socket shape. First,
an “outwards” offset operation was applied to the inner surface of the socket. Then, a
“blend” operation was performed at the top free edges of the inner surface and offset
surface to turn the model into a closed volume model. Features to facilitate the pylon
attachment were added to the bottom of the model [27].
The final design features to be incorporated were the compliant regions to relieve
contact pressure (Figure 3.2b), which were implemented using reduced wall thickness at
the compliance-needed sites. This was performed using “offset” operations on the outer
surface sections surrounding the identified sites. Once these sections were defined, they
were rejoined to the overall outer surface using “blend” operations, which preserved the
closed volume format of the model. The structural integrity of the wall thickness was
refined through FEM analysis of these compliant sections using the desired deformation
defined by the prosthetist as target and contact pressure data around these specific sites as
input (such as the pressure data measured in Chapter 2).
234 From Robert McNeel & Associates, Seattle, WA.
24
2.4) FEM Analysis
In order to evaluate the structural behavior of the socket under expected applied
loads, a FEM model was created from the socket CAD model using SDRC I-deas5. The
socket CAD model was imported into I-deas using the IGES file format. A Delaunay-
based mesh generator incorporated in I-deas was used to create the initial model mesh.
The elements used were 10-node parabolic tetrahedra, and the initial element size was
chosen to be less than the overall socket wall thickness. The automated mesh generator
was set to create a model based on sections, which allows specific areas and geometric
features to be further refined. The resulting mesh was interactively inspected to identify
highly distorted or stretched elements that may lead to increased errors in the analysis.
When such areas were identified, individual elements were locally refined. The complete
FEM mesh for the socket had 7582 elements and 22570 nodes.
Since the SLS material used in this study was DuraformTM PA6, a type of nylon
12 which has properties suitable for sockets, the material properties used were 44 MPa
for tensile strength, 1600 MPa for tensile modulus and 1285 MPa for flexural modulus.
2.5) Load Conditions
The FEM analysis of the socket was performed under different loading and
boundary conditions in order to evaluate the structural integrity of the socket under
typical loading conditions found during gait. First, a simulation was run to analyze the
behavior of the socket under the peak limb-socket pressure profile and shear stresses
found in the literature for individuals with similar body weight as the patient modeled in
the present study. These measured values were then applied to the socket as boundary
conditions on the inner socket surface (where contact occurs). Values for contact pressure
5 From EDS, Plano, TX. 6 http://www.3dsystems.com/products/datafiles/lasersintering/datasheets/DURAFORMHigh.pdf

and shear stress were defined at ten areas (Medial and Lateral Supracondyle, Medial and
Lateral Tibia, Medial and Lateral Gastrocnemius, Patellar Tendon, Popliteal Depression,
Distal Tibia and Fibula Head – Figure 3.4). Also, the top edge of the inner surface was
defined as having a zero load. The data surfaces were then created through refined
inverse distancing interpolation, leading to smooth and first order continuous pressure
distribution functions at contact surfaces. Such functions were mathematically defined as
follows:
- Given a set of pressure values p1...pn at n discreet points nPPr
Kr
1 of a
parametric surface of the socket model defined in terms of the parametric
space (u,v) as ( )v,uS ;
- Then for each discreet point iPr
, a local interpolation function was created: ( ) ( )( )
( ) ( ) ( )iii
iiiii
vvauuavva
vvuuauuapQ
−+−+−+
−−+−+=
542
3
22
1 ( 3 )
where ui and vi are the u and v components of iPr
and a1...a5 are the pressure
values at the five points of the set nPPr
Kr
1 that were closest to iPr
;
- Also for each discreet point iPr
, a weighing factor was calculated:
( )2ii
iii dr
drW⋅−
= ( 4 )
where ri is the radius of influence in the parametric space (u,v) around point
iPr
(defined to be equal to 0.05) and di is the parametric distance between
(u,v) and (ui,vi);
- Thus, the pressure distribution on the surface ( )v,uS was defined by:
( )∑
∑
=
=
⋅= n
ii
n
iii
W
QWv,up
1
1 ( 5 )
25

ba
Medial Gastrocnemius
Lateral Gastrocnemius
Popliteal Depression
Distal Tibia
Fibula Head
Lateral Tibia
Medial Tibia
Patellar Tendon
Lateral Supracondyle
Medial Supracondyle
Figure 3.4: (a) Anterior and (b) Posterior views of the inner socket profile displaying the points used in the definition of the pressure distribution boundary condition.
Once the load values were constructed and applied to the elements of the inner
surface of the socket, the pylon attachment fitting features at the bottom of the socket
were spatially restrained.
To investigate the structural response of the socket, the resulting stresses obtained
from the FEM analysis were used, assessing the integrity of the socket by comparing
these stresses with the range tolerated by the material.
2.6) SLS Fabrication
To experimentally validate the FEM analysis results, a prototype of the socket
was manufactured using SLS (Figure 3.5). The socket CAD model was exported using
the STL (or stereolithography) format, which is used as input into any SLS system. SLS
is a type of freeform fabrication technique where any computer solid model forming a
closed volume in space is manufactured in layers. Adjacent planar layers of a powdery
26

material are placed in a part bed, melted in the desired cross-section of the model by a
laser beam and solidified, thus adding one layer to the part itself. The bed is then lowered
by one layer thickness and covered again with another layer of the powdery material.
When all the cross-sections of the model are processed, the final part will possess the
same shape and dimensions as the computer model.
The socket in the present study was produced using a 3DSystems (Valencia, CA)
Sinterstation 3500. The model was fabricated in a vertical position for optimal sintering
and thermal conditions. The total fabrication time, including the warming up and cooling
down phases, was 15 hours, during which the machine operated completely unassisted.
Once the fabrication was finished, the socket was ready to be assembled into a prosthesis.
a b
Figure 3.5: (a) Final CAD model of the socket; (b) Ready-to-wear prosthesis with the SLS produced DuraformTM Socket.
27

28
2.7) Experimental Validation
The socket validation consisted of two experiments to assess the structural
responses of the socket and compare them with FEM predictions generated with
boundary conditions similar to the experimental conditions.
The first experiment was set to simulate the bending moment observed during a
heel strike (Figure 3.6) [28]. The socket was filled with sand and plaster and a steel rod
was placed in the center of the filling plaster. Once the plaster cured, the pylon and
attachment were mounted at the bottom of the socket. The entire assembly was placed in
a horizontal position, with the end of the rod firmly gripped by a vice attached to a fixed
table and the end of the pylon being positioned onto an MTS hydraulic testing machine.
The piston of the hydraulic machine applied a gradually increasing perpendicular force at
the end of the pylon while a load cell recorded the force magnitude and displacement that
was transferred to a data acquisition computer. The bending moment was increased until
the socket failed.
a
socket
29
Testing machine
pylon
rod
plaster
b c
Figure 3.6: (a) Socket, pylon and attachment model; (b) Top view of the socket filled with plaster and with a rod in the middle; (c) Experimental set-up for the heel strike test.
A second validation test was used to assess the maximum compressive force that
could be applied to the inner surface of the socket, as well as the deformation at one of
the compliant features with the increase of the compressive force. At first, a pilot study
was performed that demonstrated [29] the top of the socket could be modified to a
cylindrical shape (in order to contain the filling media while compression by a piston was
taking place) without significant changes in its stress and displacement distribution at the
remainder of the socket. With this verification, a top-modified socket was manufactured
(while maintaining all other dimensions) and filled with 1 mm diameter Zirconia-
Toughened Alumina (ZTA) beads. This medium was chosen for being strong enough to

withstand the compression load associated with the test while minimizing the effects of
friction. This created a pressure distribution profile over the inner surface of the socket
that could be replicated as a boundary condition for the FEM model. The MTS hydraulic
test machine was then used to gradually compress the medium through a piston until the
socket failed (Figure 3.7a). A travel indicator was used to measure the deformation of the
socket wall at the bottom compliant feature (Figure 3.7b) as the applied load increased.
travel indicatorsocket
piston
a b
Figure 3.7: a) Set-up for compression test: socket attached to a hydraulic test machine and filled with ZTA media to be compressed by piston; b) travel indicator to measure deformation.
3. RESULTS
The results for stresses within the socket under peak loading conditions during
gait (Figure 3.8) revealed that the maximum value (42.5 MPa), found at the bottom of the
socket, was within the range of the properties of commercially produced Duraform parts.
30
ba
Peak stress
Figure 3.8: (a) FEM model of the socket; (b) FEM results for stresses under peak loading conditions found during gait (in Pa).
For the heel strike test, the FEM simulation predicted that the socket would fail
when the applied perpendicular force exceeded 690 N, which produces a stress value of
45.2 MPa. This is just above the failure stress of DuraformTM PA of 44 MPa. During the
experimental validation, the socket failed with an applied force of 710 N. In addition, the
socket failed in the area of peak stress predicted by the FEM analysis (Figure 3.9).
31
ba
Peak stress
Socket test - Heel Strike
-200
-100
0
100
200
300
400
500
600
700
800
-20 0 20 40 60 80 100
Deformation (mm)
Load
(N)
c
d e
Figure 3.9: (a) FEM results for the stresses in the socket with bending moment boundary conditions (in Pa); (b) a more detailed view of the failure area (highlighted by a white square on the left); (c) output from the MTS machine, showing the load applied at the pylon vs. its displacement during the heel strike test; (d) and (e) broken socket after completion of the test.
32

The compression test found that the force at failure was 26.25 kN, which was
similar to the force (26.47 kN) predicted by the FEM analysis (Figure 3.10a). This peak
force produced a maximum stress of 45.3 MPa, which is just above the failure stress of
DuraformTM PA (44 MPa). The measured orthogonal deformation at the bottom
compliant feature was found to be within a 25% interval of the values predicted by the
FEM (Figure 3.10b) for loads under 78% of the failing force.
0
5
10
15
20
a
25
30
0 0.2 0.4 0.6 0.8 1
Orthogonal deformation at bottom compliant feature (mm)
Forc
e (k
N)
MeasuredFEM
b
Peak stress
Figure 3.10: (a) FEM results for the stresses in the socket with a compressive force boundary condition (in Pa); (b) Comparison between measured deformation at bottom of compliant socket with FEM results.
4. DISCUSSION
In this paper, a framework for the production of subject-specific prosthetic
sockets for transtibial amputees using SLS was described (Figure 3.1). The framework
included the acquisition of the residual limb shape through laser scanning, a methodology
for socket design, structural analysis using FEM to ensure reliability under normal
33
34
workload during gait, and socket fabrication using SLS. An experimental validation of
the FEM model was performed through tests of SLS built sockets. The validation results
achieved were considered quite satisfactory, with the FEM predictions for failure loads in
both tests being within 3% of the actual measured values. However, it should be noted
that the criterion to consider these results satisfactory was an outcome within 25% range
from the actual measured value. Such criterion was also used for the deformation data of
the compression test, and the results were valid for loads under 78% of the failing load.
For values above, the discrepancy between the predicted and measured results could be
explained by the transition of the FEM model into a large deformation regime, which
leads to higher errors in FEM results.
A limitation of the present FEM analysis procedure was the determination of the
pressure profile applied to the prosthesis, which can greatly vary among patients [8-16].
Ideally, the pressure profile should be measured in the actual socket being analyzed to
ensure the loading conditions are precise. However, obtaining actual pressure loads from
the socket being analyzed would require an iterative process that is not feasible.
Furthermore, previous analysis has shown that instrumenting a socket for contact
pressures measurement may considerably change the interface conditions from their
regular state [7]. However, another promising possibility [11-14,16-19] is to assess the
load transfer directly from an FEM model of the residual limb, including the bones, soft
tissues and liner, where the dimensional data to generate the corresponding meshes come
from a CT or MRI scan. Future work will be directed at integrating FEM models of the
residual limb and socket to obtain pressure data for design analysis (and will be addressed
in Chapter 5).
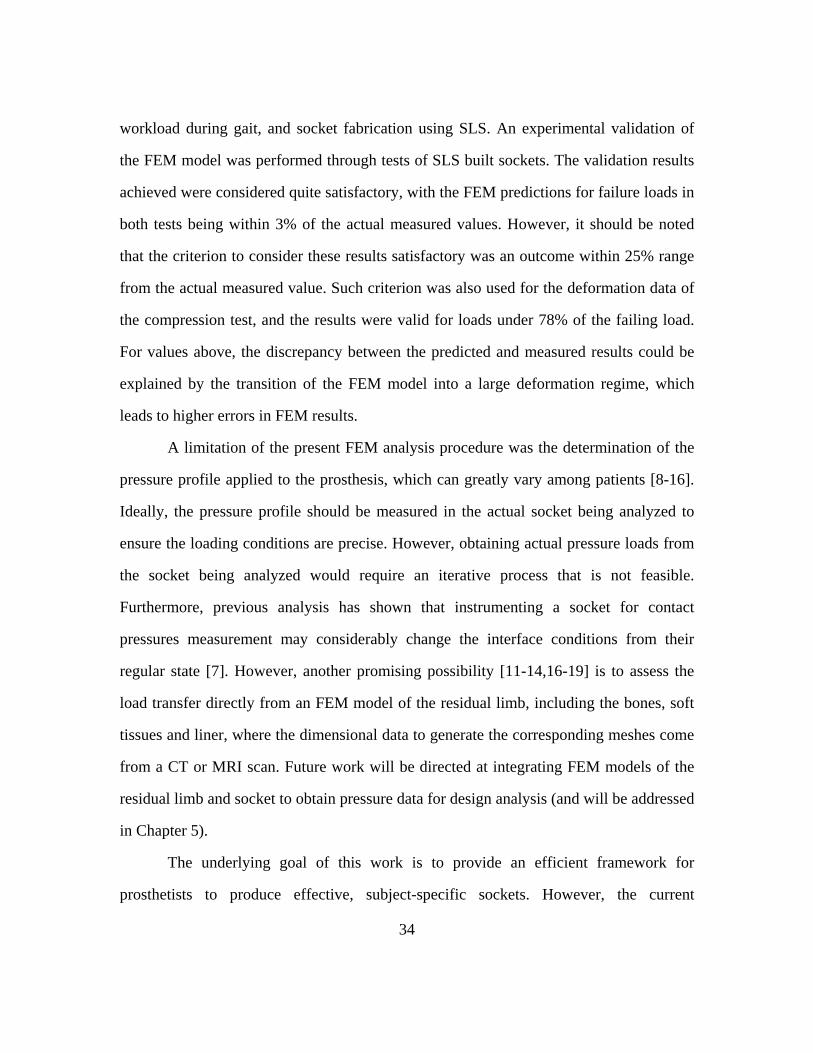
The underlying goal of this work is to provide an efficient framework for
prosthetists to produce effective, subject-specific sockets. However, the current
35
framework involves many steps and experience using CAD and FEM analysis software.
Future work will be directed at providing an integrated user-friendly system that
automatically performs all the CAD operations needed to produce the solid model of the
socket (including the thickening of the wall, incorporation of compliant features and
bottom pylon fitting attachment). This task is very feasible, since the involved parameters
can all be easily stored in a database within the program.
Nevertheless, one advantage of the presented framework is that it allows for
systematic and controlled design changes in socket shape or volume, which may permit
exploration of the relative advantages of various socket design philosophies [4,26] (e.g.
specific-area weight bearing/patellar-tendon bearing or PTB vs. total surface bearing;
smooth vs. abrupt contouring of socket features, etc). A second advantage is that
compliant features can be easily integrated into the socket design. Although the present
design integrated one form of compliance (i.e. thin-walled sections), future work will be
directed at examining other forms of compliant features (which will be addressed in
Chapter 4).

36
Chapter 4: DESIGN OF ORTHOGONALLY COMPLIANT FEATURES FOR LOCAL CONTACT PRESSURE RELIEF IN DURAFORMTM/SLS
MANUFACTURED TRANSTIBIAL PROSTHESES
ABSTRACT
A very attractive advantage of manufacturing prosthetic sockets through Solid
Freeform Fabrication is the freedom to introduce design solutions that would be
otherwise difficult to implement. Such is the case with compliant features embedded in
the structure of the prosthetic sockets for relief of contact pressure at specific sites. This
article discusses the design of orthogonally compliant elements within the context of
prosthetic sockets. In particular, we describe a process for designing compliant elements
to be incorporated into a model of transtibial sockets, which will be produced with
Selective Laser Sintering using DuraformTM, a material derived from nylon, and
exploring some different alternatives. This design process includes the preliminary
evaluation of design alternatives on test coupons using Finite Element Method, validation
of computed results through experimental measurements, definition of design
methodology for the most appropriate solution, incorporation of solution within the
socket geometry and refinement of design solution using auxiliary features obtained
through topology optimization. Using this methodology, a compliant feature consisting of
spiral beams and a supporting external structure was developed to provide pressure relief
to specific areas of the prosthetic socket.
37
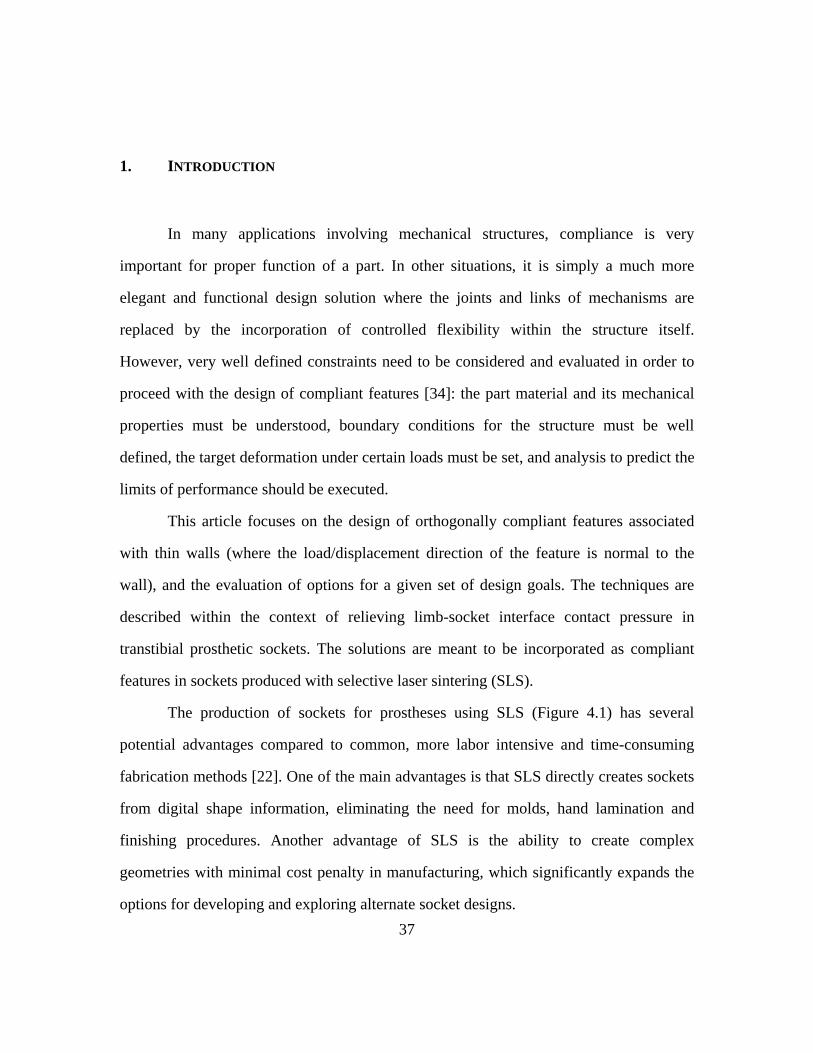
1. INTRODUCTION
In many applications involving mechanical structures, compliance is very
important for proper function of a part. In other situations, it is simply a much more
elegant and functional design solution where the joints and links of mechanisms are
replaced by the incorporation of controlled flexibility within the structure itself.
However, very well defined constraints need to be considered and evaluated in order to
proceed with the design of compliant features [34]: the part material and its mechanical
properties must be understood, boundary conditions for the structure must be well
defined, the target deformation under certain loads must be set, and analysis to predict the
limits of performance should be executed.
This article focuses on the design of orthogonally compliant features associated
with thin walls (where the load/displacement direction of the feature is normal to the
wall), and the evaluation of options for a given set of design goals. The techniques are
described within the context of relieving limb-socket interface contact pressure in
transtibial prosthetic sockets. The solutions are meant to be incorporated as compliant
features in sockets produced with selective laser sintering (SLS).
The production of sockets for prostheses using SLS (Figure 4.1) has several
potential advantages compared to common, more labor intensive and time-consuming
fabrication methods [22]. One of the main advantages is that SLS directly creates sockets
from digital shape information, eliminating the need for molds, hand lamination and
finishing procedures. Another advantage of SLS is the ability to create complex
geometries with minimal cost penalty in manufacturing, which significantly expands the
options for developing and exploring alternate socket designs.

i
ii
iii
ivca b
Figure 4.1: (a) and (b) A patient testing an SLS fabricated socket; (c) the description of the parts of a prosthesis for below-the-knee amputees: i – socket, ii – attachment fitting, iii – pylon and iv – prosthetic foot.
Our socket design/fabrication framework was developed through collaboration
between the Laboratory for Freeform Fabrication at The University of Texas at Austin
and the Rehabilitation Engineering Laboratory of The University of Texas Health
Science Center at San Antonio [1]. In our socket fabrication framework, we create a
computer model of the socket from laser digitization of the patient’s residual limb. The
shape of the socket is designed so that specific regions of the limb, which can safely
resist contact pressures generated when the patient walks, will support most of the load
that arises during gait. This design is called the Patellar Tendon Weight Bearing (PTB)
socket.
Other regions of the residual limb are not suitable for high contact pressures either
because they are too sensitive to pain, are susceptible to developing sores, or due to other
health issues. High pressures at these sites lead to discomfort for the patient during gait
(thus affecting rehabilitation) and, sometimes, pose a health risk for the patient. Thus, it is 38

necessary to incorporate means of relieving contact pressure in these regions. One
solution to this problem is to make the socket wall orthogonally compliant at these high
contact pressure sites.
Currently, local compliance is achieved by reducing the wall thickness of the
socket at pressure sensitive areas (Figure 4.2). However, this approach provides limited
compliance and pressure relief. A more effective design may be achieved by taking
advantage of the ability of SLS to easily create geometric variants of traditional socket
shapes to allow controlled expansion of the socket volume through deformation of the
wall at sites where pressure relief is needed, thus adapting to limb change during gait.
This chapter is structured as follows. First, the set of design constraints is defined
for the problem. Then, the methods used for design of the compliant features are
discussed as well as the material used for the fabrication of sockets. Results achieved
with the use of these methods are presented, as well as their incorporation in the socket
geometry. Finally, the achieved methodology is discussed.
39
Figure 4.2: Example of a current SLS fabricated socket with locally thinnedareas where compliance is needed.
compliantfeatures
walls in
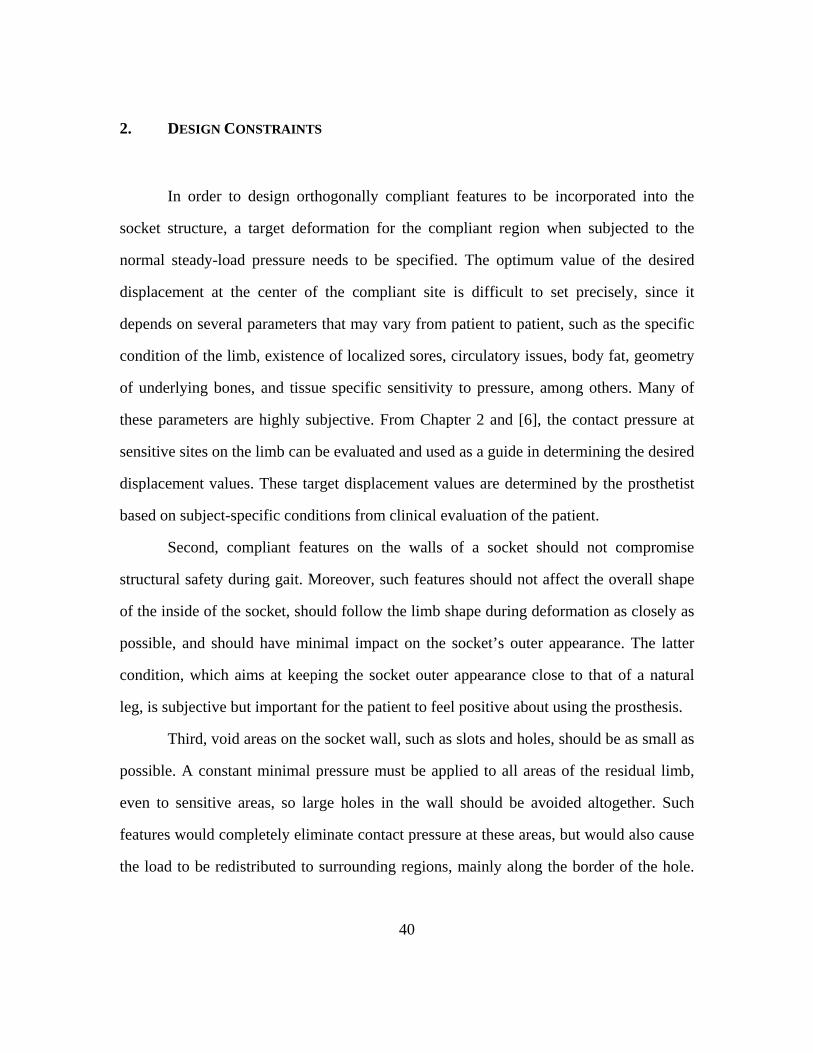
40
2. DESIGN CONSTRAINTS
In order to design orthogonally compliant features to be incorporated into the
socket structure, a target deformation for the compliant region when subjected to the
normal steady-load pressure needs to be specified. The optimum value of the desired
displacement at the center of the compliant site is difficult to set precisely, since it
depends on several parameters that may vary from patient to patient, such as the specific
condition of the limb, existence of localized sores, circulatory issues, body fat, geometry
of underlying bones, and tissue specific sensitivity to pressure, among others. Many of
these parameters are highly subjective. From Chapter 2 and [6], the contact pressure at
sensitive sites on the limb can be evaluated and used as a guide in determining the desired
displacement values. These target displacement values are determined by the prosthetist
based on subject-specific conditions from clinical evaluation of the patient.
Second, compliant features on the walls of a socket should not compromise
structural safety during gait. Moreover, such features should not affect the overall shape
of the inside of the socket, should follow the limb shape during deformation as closely as
possible, and should have minimal impact on the socket’s outer appearance. The latter
condition, which aims at keeping the socket outer appearance close to that of a natural
leg, is subjective but important for the patient to feel positive about using the prosthesis.
Third, void areas on the socket wall, such as slots and holes, should be as small as
possible. A constant minimal pressure must be applied to all areas of the residual limb,
even to sensitive areas, so large holes in the wall should be avoided altogether. Such
features would completely eliminate contact pressure at these areas, but would also cause
the load to be redistributed to surrounding regions, mainly along the border of the hole.

41
This would lead to high localized contact pressure gradients and concentrations that
should also be avoided, since they can create circulatory problems for the patient.
Finally, compliant features should not produce spikes or sharp corners when
deformed. Hence, slots on the socket wall should not self-intersect.
3. MATERIAL AND METHODS
This section discusses the material used for manufacture of the socket and
presents the design methodology used in the development of the desired compliant
features. Several commercial software tools were used to implement the methodology.
MatLab7 was used for design calculations and optimization. Solid models were generated
using Rhinoceros8. SDRC I-deas9 was used for Finite Element Method (FEM) analysis
and design refinement. All FEM models used 10-node parabolic tetrahedral elements.
3.1) Material Properties
The material utilized in fabrication of the sockets is DuraFormTM Polyamide
(PA). This material is a type of nylon 12 processed into a powder form by 3D Systems
(Valencia, CA) for utilization in SLS machines. Our experience shows that the material
properties of DuraFormTM PA parts vary based on a number of conditions. Alterations in
build parameters lead to parts with altered properties. Furthermore, the age of the
DuraFormTM PA powder, proportion between virgin and used powder in a blend, the
number of times it has been reused, and even machine dependent maintenance issues
7 MathWorks, Natick, MA. 8 Robert McNeel & Associates, Seattle, WA. 9 EDS, Plano, TX.
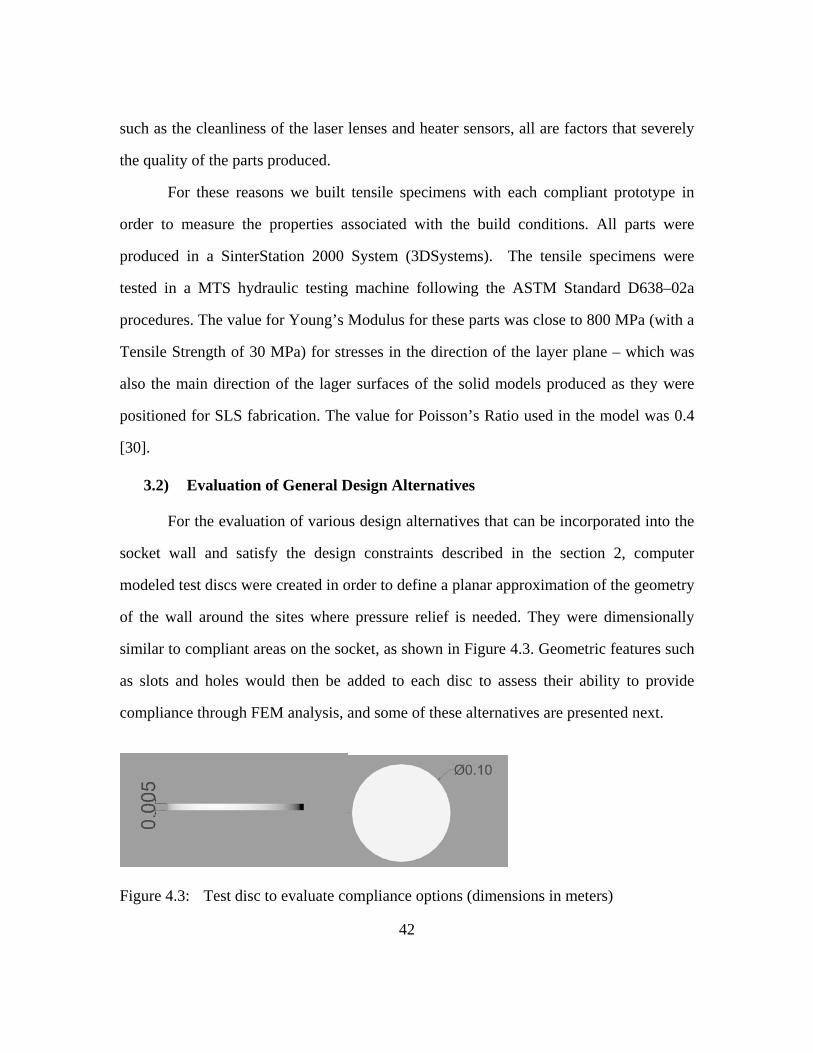
such as the cleanliness of the laser lenses and heater sensors, all are factors that severely
the quality of the parts produced.
For these reasons we built tensile specimens with each compliant prototype in
order to measure the properties associated with the build conditions. All parts were
produced in a SinterStation 2000 System (3DSystems). The tensile specimens were
tested in a MTS hydraulic testing machine following the ASTM Standard D638–02a
procedures. The value for Young’s Modulus for these parts was close to 800 MPa (with a
Tensile Strength of 30 MPa) for stresses in the direction of the layer plane – which was
also the main direction of the lager surfaces of the solid models produced as they were
positioned for SLS fabrication. The value for Poisson’s Ratio used in the model was 0.4
[30].
3.2) Evaluation of General Design Alternatives
For the evaluation of various design alternatives that can be incorporated into the
socket wall and satisfy the design constraints described in the section 2, computer
modeled test discs were created in order to define a planar approximation of the geometry
of the wall around the sites where pressure relief is needed. They were dimensionally
similar to compliant areas on the socket, as shown in Figure 4.3. Geometric features such
as slots and holes would then be added to each disc to assess their ability to provide
compliance through FEM analysis, and some of these alternatives are presented next.
Figure 4.3: Test disc to evaluate compliance options (dimensions in meters)
42

The boundary conditions for FEM analysis were defined as follows: the borders
of the discs were fully restrained and a dummy test force similar to the one expected at
the contact area of the socket in a sensitive site was applied to the center of the disc.
The first disc to be analyzed was a solid control disc with no compliant feature,
which could provide a reference value. The deformation results revealed that the
displacement at the center was 5.54 x 10⁻⁵ m (Figure 4.4).
Figure 4.4: FEM deformation results (in meters) for control disc with no special compliant features.
43
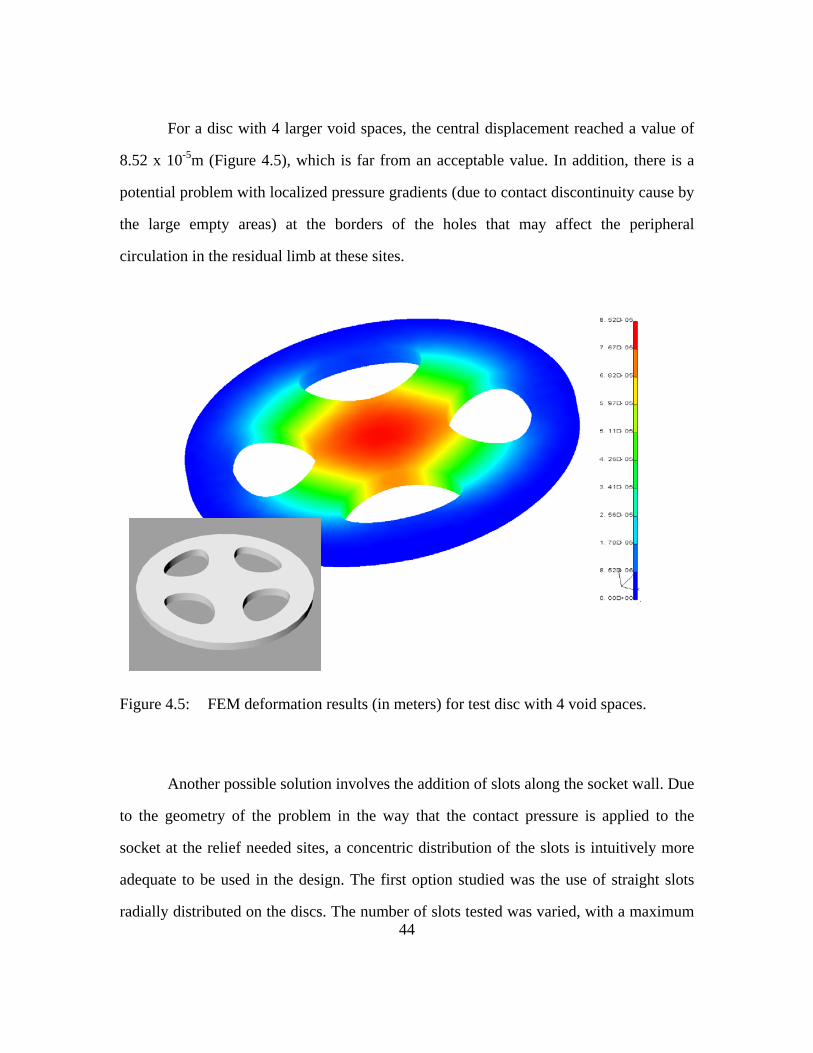
For a disc with 4 larger void spaces, the central displacement reached a value of
8.52 x 10⁻⁵m (Figure 4.5), which is far from an acceptable value. In addition, there is a
potential problem with localized pressure gradients (due to contact discontinuity cause by
the large empty areas) at the borders of the holes that may affect the peripheral
circulation in the residual limb at these sites.
Figure 4.5: FEM deformation results (in meters) for test disc with 4 void spaces.
44
Another possible solution involves the addition of slots along the socket wall. Due
to the geometry of the problem in the way that the contact pressure is applied to the
socket at the relief needed sites, a concentric distribution of the slots is intuitively more
adequate to be used in the design. The first option studied was the use of straight slots
radially distributed on the discs. The number of slots tested was varied, with a maximum

of 16 in order to preserve maximum stresses under a value that could start to compromise
structural integrity. The results for the case of 16 straight slots revealed that the central
displacement achieved was 7.20 x 10⁻⁵m (Figures 4.6), which was also still far from a
suitable deformation.
Figure 4.6: FEM deformation results (in meters) for test disc with 16 radial slots.
A different option for the slot approach is curved slots that spiral towards the
center of the disc. This shape increases the influence of the slots (by increasing their
length) while still keeping them bounded within the area of the disc. The resulting shape
actually creates a curved beam (also in a spiral shape) that acts like the coil of an
45

orthoplanar spring. More than one spiral slot is advisable to ensure symmetric
deformation.
The results for designs with spiral slots are displayed in Figures 4.7 and 4.8 (two
and four radially distributed spirals, respectively). For the case with two spirals, a central
displacement of 4.38 x 10⁻³ m was achieved, which is very satisfactory. The case with 4
spirals, on the other hand, results in a central displacement of 8.88 x 10⁻³ m, which was
considered to be too large – meaning that for a smaller input displacement, a low reaction
pressure will be applied by the feature on the contacting region, which could lead to
undesirable pressure concentration in surrounding areas.
Figure 4.7: FEM deformation results (in meters) for test disc with two spiral slots.
46

Figure 4.8: FEM deformation results (in meters) for test disc with four spiral slots.
3.3) Design of spiral slot compliant feature
The design of compliant features with spiral slots is parametrized by the number
of slots, the thickness of the wall at the feature and by the area of the feature. The area
needs to remain as small as possible around the compliant region defined by the
prosthetist (as discussed in Chapter 3), or the overall fit of the socket may suffer. This
area, together with the number of slots, will define the pitch of the spiral slot, which, in
turn, defines the width of the curved beam. For instance, in the example of Figure 4.7
where there are two full turn slots, the width of the beam is half the pitch of the spiral
slot. In the case of Figure 4.8, with four slots, it is one fourth of the pitch, and so on.
47

The thickness of the wall (and of the beam) should remain close to that of the
overall socket wall to avoid adding unnecessary mass (and bulkiness) to the socket and to
maintain the poor aesthetic effect. Thus, if more stiffness is needed to refine the
compliance, this should be done using supporting structures from topology optimization,
to be described in section 3.6 of this Chapter, rather than by increasing the wall thickness.
A diagram to model the beam width and thickness for the case with two full turn
spiral slots (Figure 4.7) is displayed in Figure 4.9.. These two slots lead to two half-turn
spiral beams.
Figure 4.9: Diagram with the geometric representation of the half turn spiral beam (under a load W).
Hence, deformation at the point of application of the load (end of beam) can be
approximated by [35]:
⎟⎟⎠
⎞⎜⎜⎝
⎛−⋅=
AGL
GKLRWf
562
( 1 )
where
48

tlA
lt
lttlK
⋅=
⎢⎣
⎡⎟⎟⎠
⎞⎜⎜⎝
⎛⋅
−−⎟⎠⎞
⎜⎝⎛⎟⎠⎞
⎜⎝⎛= 4
43
12136.3
316
22 ⎥⎦
⎤ and
R is the mean radius of curvature of beam, L is the developed arc length of the beam, G is
the torsional modulus of rigidity, l is the width of the beam, and t is the thickness of the
beam (height of cross section).
An estimation for shear stress can be calculated by [36]:
⎟⎠⎞
⎜⎝⎛ +++
⋅+⋅= 3222
5.056.02.11)2/()2/(8
)2/8.12/3(ccclt
tlTτ ( 2 )
where , and the twist moment T can be approximated by: lRc /2=
RWT 2⋅= ( 3 )
where W is the load. The results found for the parameters of the beam can be refined
analytically using formulas for computation of deformations and loads along curved
beams, as seen in Appendix 6, or by using FEM.
49
3.4) Refinement of designed discs: FEM and experimental validation
An experiment based on the one described in [30] was conducted to verify the
FEM model, which was iteratively used for the refinement of the design of the compliant
discs. The set-up is shown in Figure 4.10. The SLS test discs were tightly secured
between the flange and the main structure. An elastic rubber sheet was placed between
the disc and the main structure to prevent air leakage, both sideways and through the slots
of the discs. The whole set-up was fixed using clamps on a test table, then air pressure
was introduced into the main cylinder while the orthogonal displacement at the center of
the disc was measured using a dial indicator (Figure 4.11).
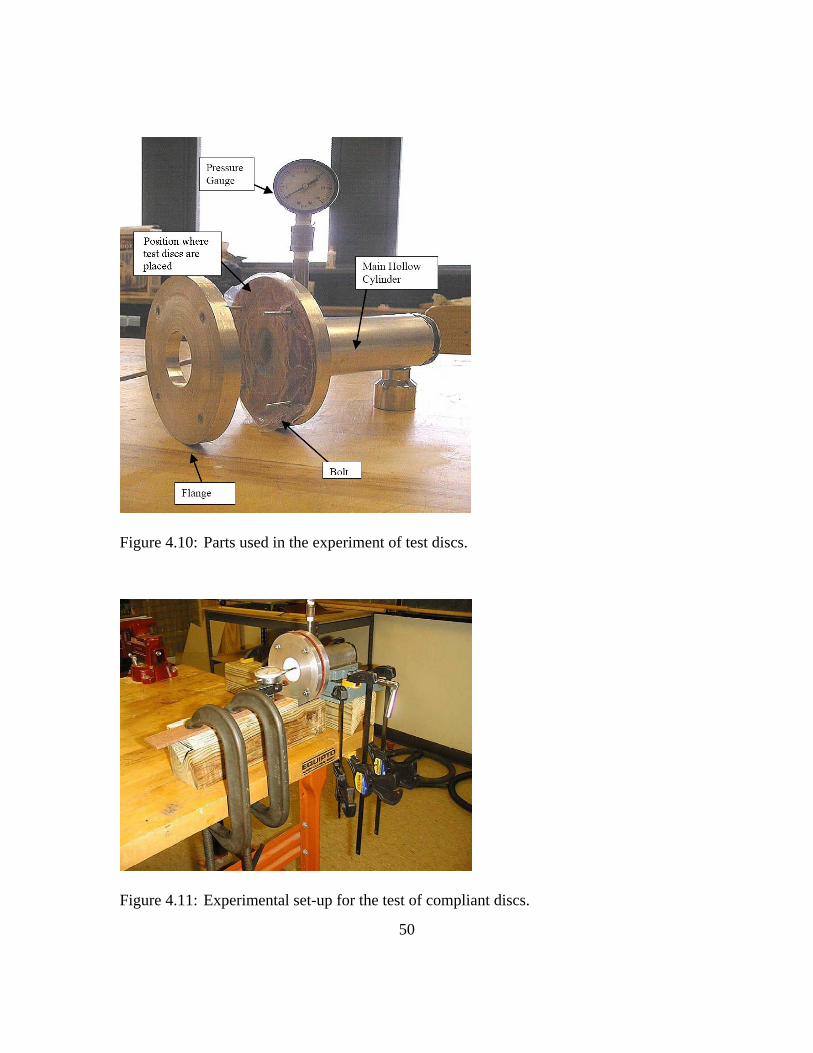
Figure 4.10: Parts used in the experiment of test discs.
Figure 4.11: Experimental set-up for the test of compliant discs.
50
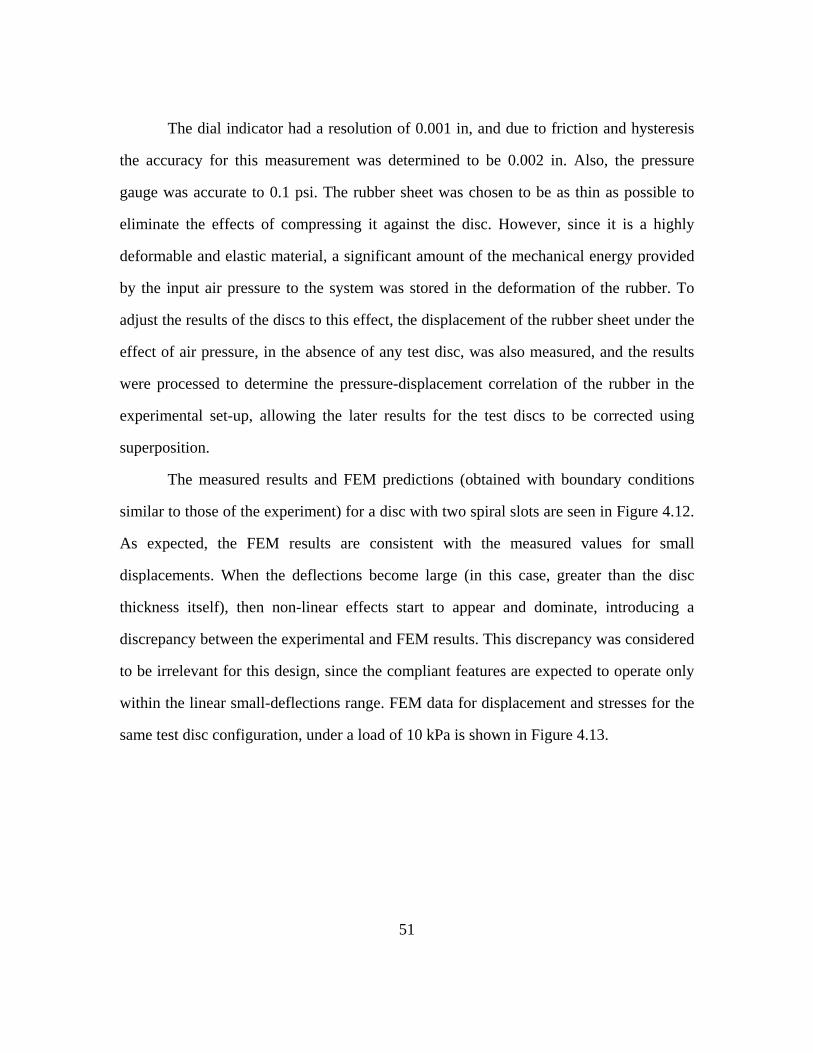
51
The dial indicator had a resolution of 0.001 in, and due to friction and hysteresis
the accuracy for this measurement was determined to be 0.002 in. Also, the pressure
gauge was accurate to 0.1 psi. The rubber sheet was chosen to be as thin as possible to
eliminate the effects of compressing it against the disc. However, since it is a highly
deformable and elastic material, a significant amount of the mechanical energy provided
by the input air pressure to the system was stored in the deformation of the rubber. To
adjust the results of the discs to this effect, the displacement of the rubber sheet under the
effect of air pressure, in the absence of any test disc, was also measured, and the results
were processed to determine the pressure-displacement correlation of the rubber in the
experimental set-up, allowing the later results for the test discs to be corrected using
superposition.
The measured results and FEM predictions (obtained with boundary conditions
similar to those of the experiment) for a disc with two spiral slots are seen in Figure 4.12.
As expected, the FEM results are consistent with the measured values for small
displacements. When the deflections become large (in this case, greater than the disc
thickness itself), then non-linear effects start to appear and dominate, introducing a
discrepancy between the experimental and FEM results. This discrepancy was considered
to be irrelevant for this design, since the compliant features are expected to operate only
within the linear small-deflections range. FEM data for displacement and stresses for the
same test disc configuration, under a load of 10 kPa is shown in Figure 4.13.

-2.5
0
2.5
5
7.5
10
12.5
15
17.5
20
22.5
25
27.5
30
32.5
35
37.5
40
-1 0 1 2 3 4 5 6 7 8 9 10
Displacement at center (mm)
Pres
sure
(kPa
)
Measurement set 1Measurement set 2Measurement set 3FEM
Figure 4.12: Comparison between experimental and FEM results for the central displacement of test discs with two spiral slots.
Similarly, the same procedure was used on SLS test discs with four spiral slots.
FEM data for displacement and stresses for the test disc configuration, under a load of 10
kPa, is seen in Figure 4.14. The graph with the results for the measurements and FEM
predictions is seen in Figure 4.15. Again, for deflections smaller than the thickness of the
disc, the FEM results can be considered very satisfactory when compared to the measured
values.
52
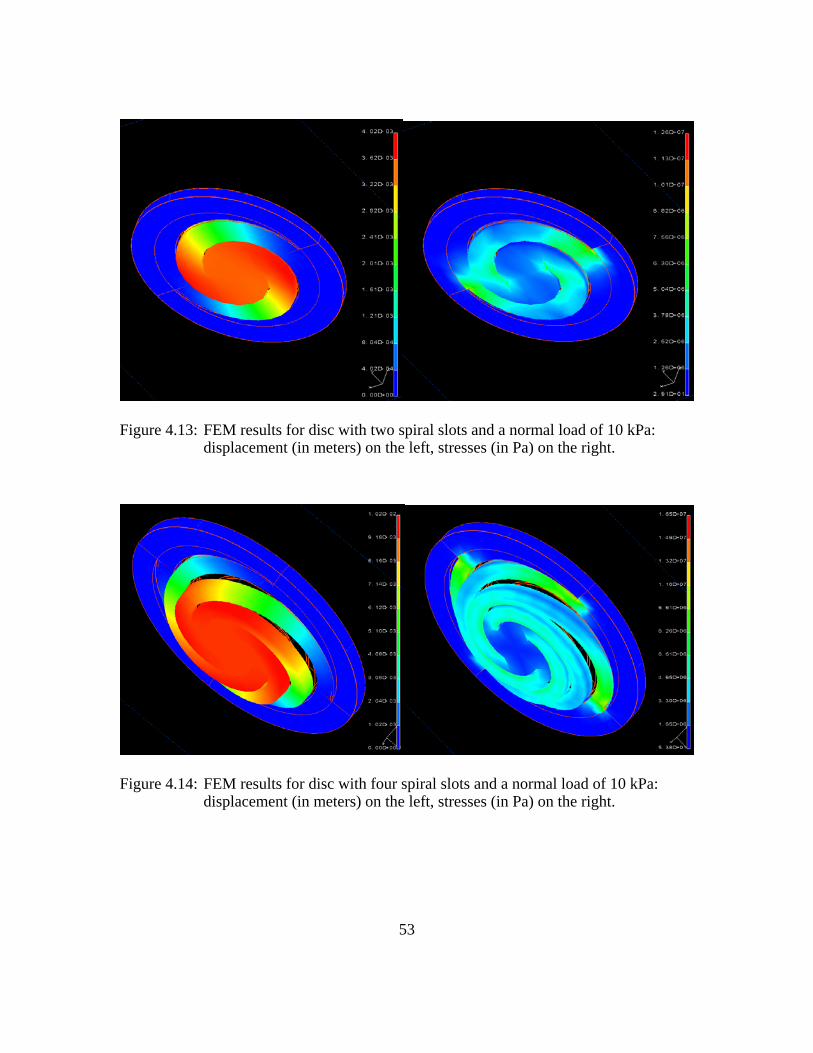
Figure 4.13: FEM results for disc with two spiral slots and a normal load of 10 kPa: displacement (in meters) on the left, stresses (in Pa) on the right.
Figure 4.14: FEM results for disc with four spiral slots and a normal load of 10 kPa: displacement (in meters) on the left, stresses (in Pa) on the right.
53

-2.5
0
2.5
5
7.5
10
12.5
15
17.5
20
22.5
25
27.5
30
32.5
35
-1 0 1 2 3 4 5 6 7 8 9 10 11 12 13 14 15 16 17
Displacement at center (mm)
Pres
sure
(kPa
)
Measurement set 1Measurement set 2Measurement set 3FEM
Figure 4.15: Comparison between experimental and FEM results for the central displacement of test discs with four spiral slots.
3.5) Implementation of spiral-slot features on socket
The incorporation of the compliant features using spiral slots can be performed in
a relatively straightforward fashion. The profile curves of the spiral slots can actually be
stored in a design library within the CAD environment. Once the feature is needed, it can
54
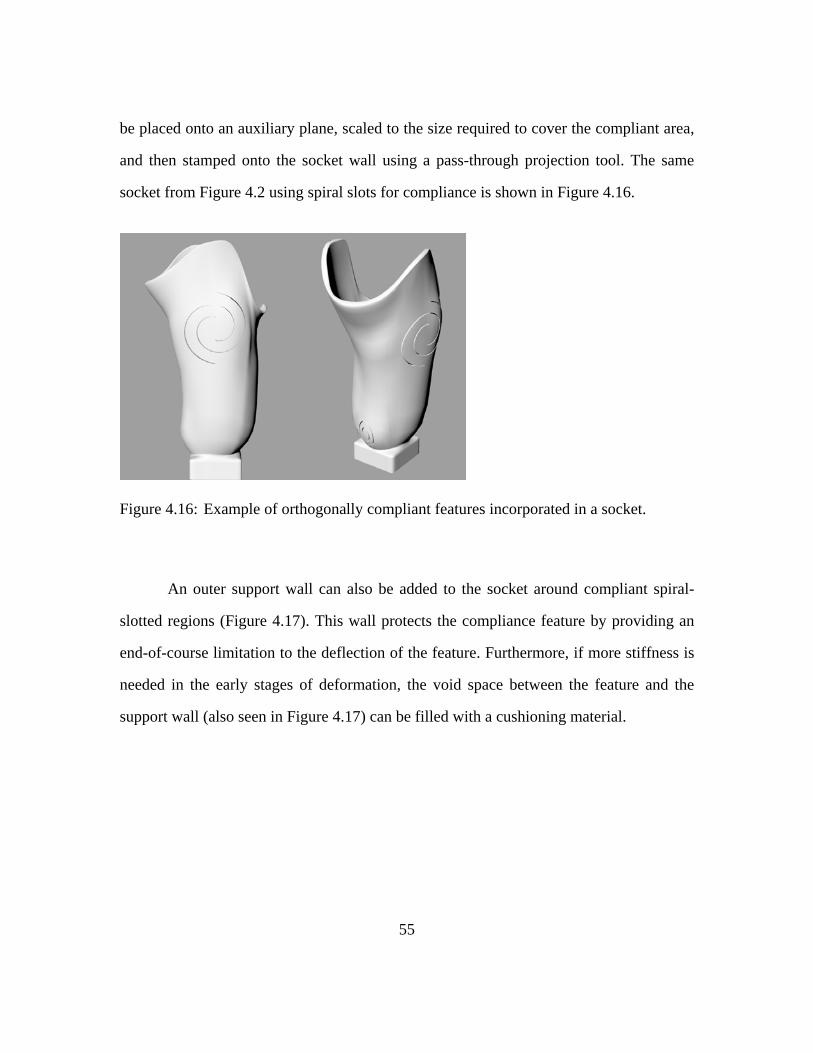
be placed onto an auxiliary plane, scaled to the size required to cover the compliant area,
and then stamped onto the socket wall using a pass-through projection tool. The same
socket from Figure 4.2 using spiral slots for compliance is shown in Figure 4.16.
Figure 4.16: Example of orthogonally compliant features incorporated in a socket.
An outer support wall can also be added to the socket around compliant spiral-
slotted regions (Figure 4.17). This wall protects the compliance feature by providing an
end-of-course limitation to the deflection of the feature. Furthermore, if more stiffness is
needed in the early stages of deformation, the void space between the feature and the
support wall (also seen in Figure 4.17) can be filled with a cushioning material.
55
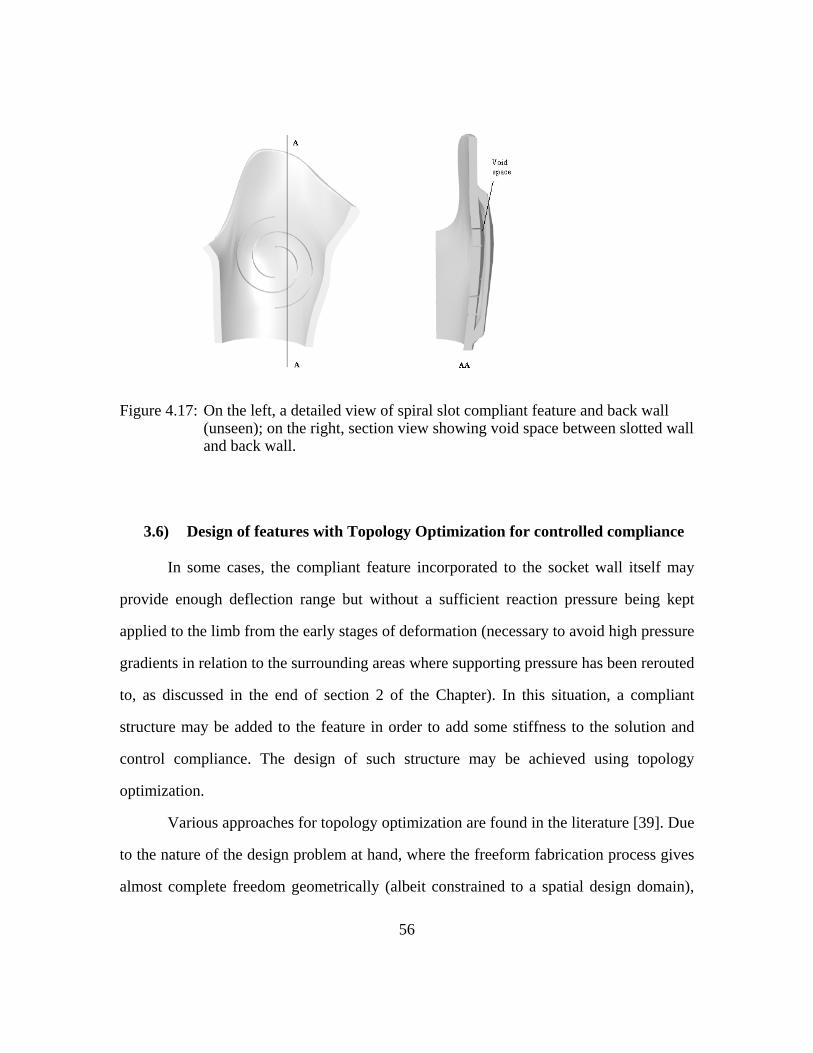
Figure 4.17: On the left, a detailed view of spiral slot compliant feature and back wall (unseen); on the right, section view showing void space between slotted wall and back wall.
3.6) Design of features with Topology Optimization for controlled compliance
In some cases, the compliant feature incorporated to the socket wall itself may
provide enough deflection range but without a sufficient reaction pressure being kept
applied to the limb from the early stages of deformation (necessary to avoid high pressure
gradients in relation to the surrounding areas where supporting pressure has been rerouted
to, as discussed in the end of section 2 of the Chapter). In this situation, a compliant
structure may be added to the feature in order to add some stiffness to the solution and
control compliance. The design of such structure may be achieved using topology
optimization.
Various approaches for topology optimization are found in the literature [39]. Due
to the nature of the design problem at hand, where the freeform fabrication process gives
almost complete freedom geometrically (albeit constrained to a spatial design domain),
56

optimization approaches tuned for discrete (finite element) domains are most appropriate.
In particular, we have applied the Homogenization Method [37,44,48], which considers a
design domain described by a 2D microstructure of unit cells, each one parametrized by
void space, with sides defined by values a and b, which vary from 0 – no material – to 1,
and orientation (defined by angle θ) (Figure 4.18). In general terms, the method
calculates homogenized elasticity coefficients for the design domain, calculates
sensitivities with FEM, optimizes for compliance with respect to a and b, filters the
results to eliminate “checkerboard” patterns, updates angle θ and repeats all steps until
convergence is achieved.
Unit cellDesign domain: microstructure
θb
a
Figure 4.18: Design domain for the Homogenization Method.
However, evaluation of optimal microstructures and their orientations is still
problematic. Because no dimensional scale is associated with the microstructures, often
the resulting structures simply cannot be built [47]. An alternative approach is the Solid
Isotropic Material with Penalization, or “power-law”, where material properties are
assumed to be constant within each element of the discretized design domain.
57

Furthermore, the variables are the relative densities of the elements, and their material
properties are estimated as: 0)( ijkl
pijkl CC ρρ = ( 4 )
where ρ is the density, p is the penalization power, and is the material tensor of the
solid. Such a material is physically feasible as long as the following condition is obeyed
for the power p in a 2D design domain [38]:
0ijklC
( )⎭⎬⎫
⎩⎨⎧
+−=≥
υυυ
14,
12max*pp ( 5 )
where υ is the value of Poisson’s ratio.
Given the design task of creating a structure that will provide extra stiffness to the
compliant feature achieved through incorporation of spiral slots into the socket wall, the
target is to minimize the compliance c of the structure. Hence, the objective function for
the problem can be formulated as follows:
[ ]( ) [ ] [ ] [ ]
[ ] [ ] [ ]
[ ] [ ] [ ] [ ]10
:subject to :min
min
*
≤≤<≤
=⋅
⋅=
xxVV
fdK
dKdxc T
( 6 )
where [d] is the displacement vector, [f] is the force vector, [K] is the stiffness matrix, V
is the volume of material in design domain Γ, V* is the total volume of design domain Γ,
and [x] is the design variable vector. In this case [x] stores the densities of the elements,
which are constrained to be between a positive minimum value (to avoid singularities)
and 1.
58

The definition of the design domain Γ can be simplified to a 2D domain due to the
approximate radial symmetry of the compliant feature. A radial section of a disc that
represents this approximation is displayed in Figure 4.19.
Figure 4.19: Schematic model of a cut view of a test disc: orthogonal deflection of center portion is desired, while the border is fixed.
Again, based on symmetry (through the central vertical plane), the problem can be
locally defined by the design domain Γ of Figure 4.20. The rounded corner of the grey
area is defined to ensure smoothness of the structure with respect to the fixed geometry.
Figure 4.20: Definition of design domain Γ for the topology optimization problem. Material presence is mandatory in black areas, material is forbidden in white areas, and grey areas indicate the sections to be optimized.
59

The objective function compliance can thus be rewritten in terms of a sum of the
individual compliances of each 4-noded finite element of the discretized design domain
(based on Figure 4.20) following the power-law approach:
[ ]( ) ( ) [ ] [ ]∑=
elementselementelement
Telement
pelement dKdxxc ][ ( 7 )
where p is the penalization power.
To ensure convergence the design domain must be restrained with appropriate
boundary conditions and filtering techniques must be applied. Such techniques are aimed
at resolving two numerical problems. First, the occurrence of checkerboard patterns in the
solution due to the artificially high stiffness of such checkerboard structures when
compared with ones with uniform material distribution. Second, the mesh-dependency of
the solution, which can be described by different topologies being achieved in the
solution from meshes with different degrees of discretization. These problems can be
solved with the application of an appropriate convolution operator to the element
sensitivities elementxc ∂∂ [49].
A previous work [47] presents a MatLab program to solve a problem with basic
boundary conditions (single constraint) using the Optimality Criteria. To allow for its use
with multiple constraints, the optimizer was modified to implement the Method of
Moving Asymptotes, discussed in [50]. Also, a geometric finite element mesh
representing the problem posed in Figure 4.20 was created, with modified elements to
ensure a fixed base structure and a desired degree of smoothness in the solution (so that it
can be applied directly to the socket following the design constraints established in
section 2 of the Chapter). An example of this modified code is found on Appendix 7.
60
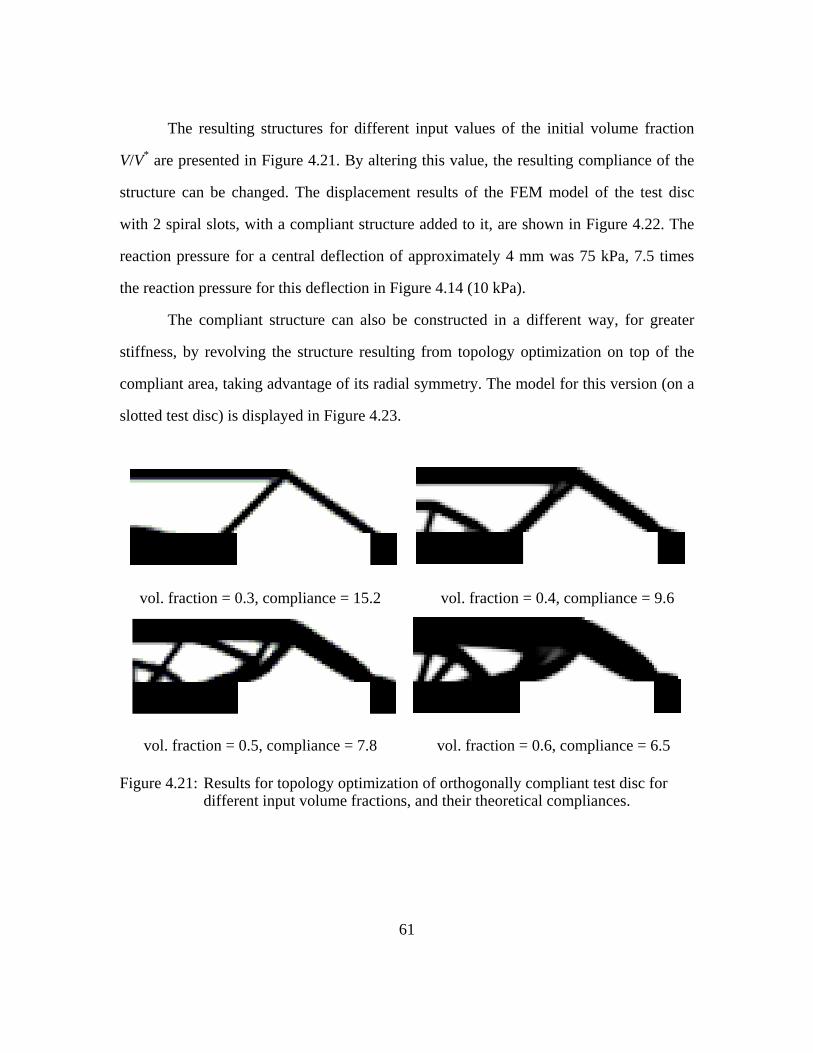
The resulting structures for different input values of the initial volume fraction
V/V* are presented in Figure 4.21. By altering this value, the resulting compliance of the
structure can be changed. The displacement results of the FEM model of the test disc
with 2 spiral slots, with a compliant structure added to it, are shown in Figure 4.22. The
reaction pressure for a central deflection of approximately 4 mm was 75 kPa, 7.5 times
the reaction pressure for this deflection in Figure 4.14 (10 kPa).
The compliant structure can also be constructed in a different way, for greater
stiffness, by revolving the structure resulting from topology optimization on top of the
compliant area, taking advantage of its radial symmetry. The model for this version (on a
slotted test disc) is displayed in Figure 4.23.
vol. fraction = 0.3, compliance = 15.2 vol. fraction = 0.4, compliance = 9.6
vol. fraction = 0.5, compliance = 7.8 vol. fraction = 0.6, compliance = 6.5
Figure 4.21: Results for topology optimization of orthogonally compliant test disc for different input volume fractions, and their theoretical compliances.
61

Figure 4.22: FEM results for test disc with compliant structure: on the left, displacement (in meters); on the right, stresses (in Pa).
Figure 4.23: On the left, implementation of compliant structure on top of test disc; on the right, a section view of this model.
The topology optimization code was also applied to a design domain with a
curved boundary (as seen in Figure 4.24) to evaluate the effect of curvature (which will
be present on the socket wall) on the final optimized topology. The resulting structures
did not present a significant topological difference (Figure 4.25).
62

Figure 4.24: Definition of design domain Γ for the topology optimization problem with curved domain to be optimized.
Figure 4.25: Result for topology optimization of orthogonally compliant curved domain.
The implementation of the compliant structure on the socket can be performed
with a sequence of well-defined CAD operations, adapting it to the outer surface of the
socket for a smooth transition. The complete compliant feature incorporated in the socket
geometry of Figure 4.16 is displayed in Figure 4.26.
63
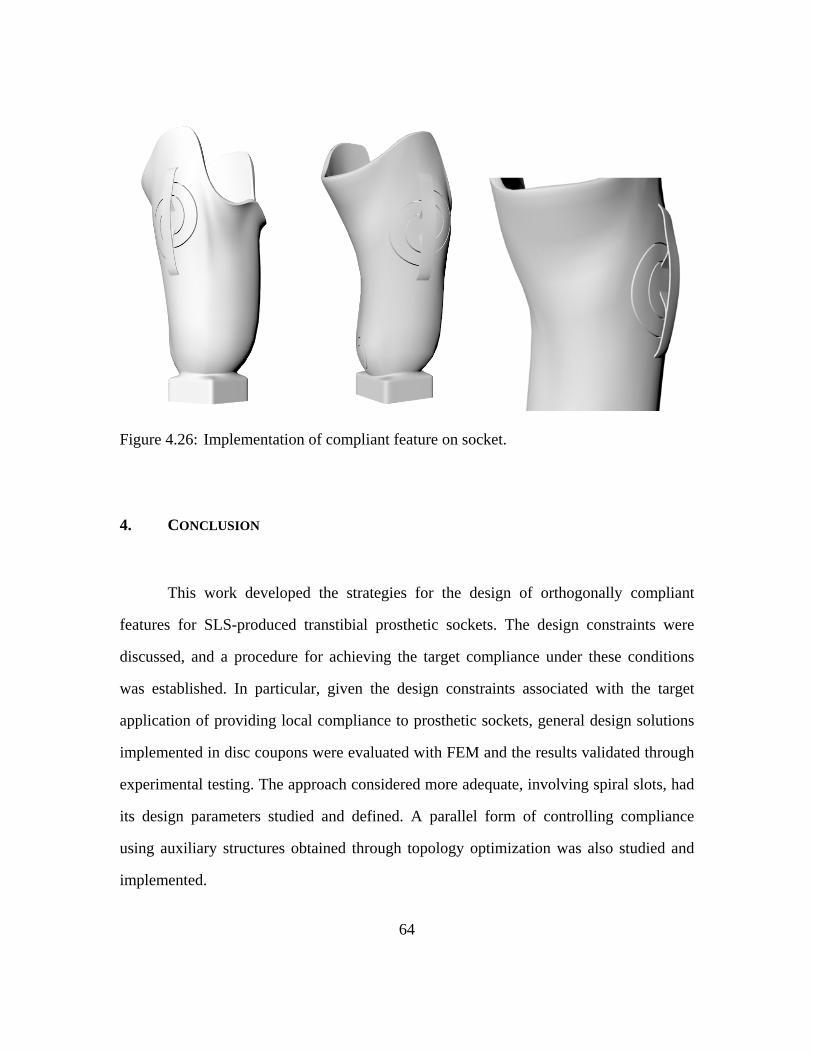
Figure 4.26: Implementation of compliant feature on socket.
4. CONCLUSION
This work developed the strategies for the design of orthogonally compliant
features for SLS-produced transtibial prosthetic sockets. The design constraints were
discussed, and a procedure for achieving the target compliance under these conditions
was established. In particular, given the design constraints associated with the target
application of providing local compliance to prosthetic sockets, general design solutions
implemented in disc coupons were evaluated with FEM and the results validated through
experimental testing. The approach considered more adequate, involving spiral slots, had
its design parameters studied and defined. A parallel form of controlling compliance
using auxiliary structures obtained through topology optimization was also studied and
implemented.
64
65
One limitation of this work is that the analysis methods assume a static load.
However, the loads in a real socket are cyclic in nature. Thus, our approach must be
modified in the future to consider fatigue of the socket. This will require experimental
determination of the fatigue strength of SLS parts produced with DuraformTM. The
durability of compliant features can then be included as a design parameter.
Another approach for providing compliance in sockets is varying the porosity
within the SLS build. As described in section 3.6 of this Chapter, the variables for
optimization of the objective function are the densities of the elements in the design
domain. In the current work, the final target value for each element density is either the
minimum value (for no material) or one (for the presence of material). However, since it
may be possible to change the density of the part (by introducing porosity) during the
SLS build through local variation of build parameters, other target values for element
density might be acceptable in the topology optimization, leading to more alternatives for
compliant structures.
Our goal in this research is to establish a rapid, customized fabrication process for
prosthetic sockets. In this vision, a practicing prosthetist would define a compliant socket
and transmit electronic data (STL files) to an SLS service bureau. The completed socket
would then be delivered to the prosthetist for patient fitting in a matter of days (instead of
weeks or months, as in current practice). This process will require a targeted CAD
environment that allows a prosthetist to incorporate compliant features, possibly from a
library of features, into the socket design without requiring intensive CAD training. The
prosthetist should be able to analyze the design and receive appropriate feedback on its
performance. Development of this environment is the subject of ongoing research.

66
Chapter 5: INVESTIGATION OF QUASI-STATIC RESPONSE OF COMPLIANT PROSTHETIC SOCKETS FOR TRANSTIBIAL
AMPUTEES USING FINITE ELEMENT METHOD
ABSTRACT
Finite element method (FEM) is a very powerful tool for studying the behavior of
structures, especially when their geometry and mechanics are too complex to be modeled
with analytical methods. This article focuses on the analysis of patellar-tendon bearing
prosthetic sockets with compliant features that were incorporated to relieve contact
pressure between the residual limb and socket. We employed a FEM model of the system
composed of a socket, liner and residual limb under quasi-static loading derived from
ground reaction forces. The geometry of the residual limb was acquired from CT data of
a transtibial amputee. Three different compliant designs were analyzed using finite
element analysis to assess their ability to relieve local pressure at the fibula head during
normal walking and the structural integrity of the socket to ensure safety. The compliant
features consisted of thinned walled sections and variations of spiral slots integrated
within the socket wall, which were found to produce an average reduction in the interface
pressure of 65.8% (peak pressure was reduced from 172 kPa to 66.4 kPa) compared to
the pressure within a socket with no compliant features.
1. INTRODUCTION

67
The design of patellar-tendon bearing (PTB) prosthetic sockets for transtibial
amputees has been improved with the integration of state-of-art freeform fabrication
techniques. These techniques allow the socket to be designed within a computer-aided
design (CAD) environment directly from digital shape information of the patient’s
residual limb, ensuring an effective design and swift fabrication of the sockets while
eliminating the need for extensive hand procedures involved in the production of
conventional sockets (as discussed in Chapter 3). Furthermore, this approach allows
flexibility for the designer to incorporate compliant features to enhance socket comfort by
relieving high pressures at specific sensitive sites of the residual limb. However, in order
to design efficient compliant features and evaluate their structural and dynamic behavior,
appropriate load transfer information between the socket and residual limb is necessary.
Estimating a priori the load transfer between the human body and the prosthetic
elements in terms of magnitude and distribution over time is a significant challenge in the
design of prosthetic devices. A common procedure for such analyses is to utilize load
transfer data measured during clinical trials using instrumented prostheses. However,
when one of the design objectives is to change, either locally or globally, the load transfer
itself, then a potentially costly and time consuming iterative design process is required: a
prototype needs to be manufactured and instrumented to measure the resulting load
transfer, which in turn is used as the new load case for redesign, and the process is
repeated until convergence is achieved.
A promising solution for estimating the load transferred to the socket is to use
finite element method (FEM) analysis to model the interaction. The FEM functions as a
bridge to combine data from ground reaction force measurements with complex geometry
and material data to determine the load distribution on the socket structure. Thus, FEM is
a very powerful approach for evaluating different socket designs.

68
The development of a FEM model of the lower extremity of a transtibial amputee
is, however, a challenging task that has been progressing for almost two decades.
Comprehensive surveys on early models and approaches can be found in [14] and [18].
Important criteria to be considered when using FEM in such applications include: 1)
defining the material properties of the soft tissues, which exhibit highly non-linear and
non-uniform behavior; 2) modeling the contact interface between the residual limb and
the socket liner and between the liner and the socket; 3) modeling the pre-stresses that
arise due to wearing the socket. Recent work by two different research groups ([12,13,16]
and [17,19]) addressed some of these questions. Both groups focused on the clinical
study of the interface pressure over the soft tissues by modeling the socket as either a
completely rigid and restrained structure, or as a uniform thickness shell with a constant
stiffness associated with it, instead of concentrating on the socket structure and its
topology.
The overall objective of this work was to focus on the analysis of the structural
response of four different socket designs using FEM. Three of these designs include
compliant features integrated within the socket wall to relieve pressure in the area of the
fibula head, which is an area where discomfort and pain due to usage of a PTB prosthesis
are commonly reported by patients. The sockets were designed to be fabricated using a
form of Solid Freeform Fabrication method called Selective Laser Sintering [51] with
DuraformTM PA. Thus, the specific objectives of this study were to use an FEM model of
the residual limb, liner and socket to evaluate: 1) the stresses within the socket wall, 2)
the resulting deformation of various concepts for integrating compliance within the
socket wall, and 3) the resulting pressure relief provided by these compliant features at
the fibula head.
69
2. MATERIAL AND METHODS
The approach used for the analysis involved the generation of finite element
models from computed tomography (CT) data acquired from the residual limb of a
transtibial amputee patient wearing the prosthesis and liner. Three geometrically similar
models of the prosthetic socket were also created, with different designs of compliant
features integrated within each socket. The original FEM model was first subjected to a
simple downward force of 800 N applied at the knee level for FEM model validation
against contact pressure values reported in the literature. In subsequent analyses, the
models were subjected to quasi-static loading boundary conditions obtained from ground
reaction force (GRF) data. From the FEM results, the structural stresses in the sockets
were computed, as well as the contact pressure at the fibula head and the displacement of
the compliant feature for the compliant sockets. The local deformations at the compliant
features were defined as the difference between the displacement at the center of the
compliant feature and the average displacement from the periphery of the feature.
2.1) Generation of FEM from CT data
The source for the shape information of the residual limb bones, tissues and inner
socket wall was taken from CT data of an amputee. The subject was a 70 years old male,
1.82 m tall and weighing 90 kg, diabetic and relatively active. The CT scan was adjusted
to produce one image every 2 millimeters. At the time of the scan, the patient was
wearing a Pelite liner around his residual limb and wearing a PTB socket at the time of
the CT scan. Thus, the shape of the limb was inherently altered to adjust to the local
modifications of the inner socket shape that defines the PTB method for socket design.
During the scan, the socket bottom was supported using a small force to assure the socket
remained fixed during the CT scan. The CT data was converted into separated point
70
clouds for each main surface area (bones, skin, outer liner/inner socket) using Mimics
(Materialise10). Each point cloud was then processed using Raindrop Geomagic11 in order
to construct a CAD surface model. This data processing resulted in a CAD model
composed of structured first-order continuous four-sided NURBS patches. These surfaces
were then organized into solids using Rhinoceros12, which were imported into I-deas13 for
meshing and FEM analysis. The boundary conditions between the different structure
volumes (i.e., bone, tissue, liner and socket) were defined as allowing zero displacement.
Hence, the contact interface was modeled with zero frictional slip or displacement
between structures. The volumes were meshed using the I-deas automated mesh
generator using 10-node parabolic tetrahedral and the Delaunay mesher option. The
resulting meshes were checked for distorted or stretched elements that may lead to
numerical errors in the FEM analysis. When such elements were identified, they were
locally modified to reduce their distortion.
The resulting models of the bones (distal femur, patella and remaining fibula and
tibia), soft tissues and liner had 8625 elements and 14680 nodes, 19888 elements and
32696 nodes, and 10342 elements and 19482 nodes, respectively (Figure 5.1).
Four socket models were designed from the inner PTB socket shape acquired
from the CT data: one with a constant 6 mm wall thickness, and three with integrated
compliant features. Three compliant feature were designed to relieve pressure at the
fibula head (as discussed in Chapters 3 and 4): 1) a locally thinner wall (1.5 mm), 2) plain
spiral slots and 3) spiral slots with a back compliant support to increase stiffness. The
FEM socket models had 6516 elements and 12657 nodes, 5364 elements and 10644
10 Leuven, Belgium. 11 Research Triangle Park, NC. 12 From Robert McNeel & Associates, Seattle, WA. 13 From EDS, Plano, TX.

nodes, 11100 elements and 21528 nodes, and 13909 elements and 26773 nodes,
respectively (Figure 5.2).
b ca
Figure 5.1: FEM model of (a) bones, (b) soft tissues and (c) liner.
71
cb a
d
Figure 5.2: FEM models of the four different socket designs simulated: (a) plain socket with no compliant feature; (b) socket with thin-walled compliant feature; (c) socket with spiral slots for compliance; (d) socket with spiral slots and compliant support.

72
All structural materials used in the analysis were assumed to be linearly elastic,
homogeneous and isotropic. For the bones and socket (fabricated with DuraformTM
PA14), the Young’s moduli were 10 GPa and 1.6 Gpa, and Poisson’s ratio were 0.3 and
0.39, respectively. For the Pelite liner, Young’s modulus was 380 kPa and Poisson’s ratio
was 0.39 [16]. The Young’s modulus for the soft tissues was assumed to be 200 kPa [13].
However, to account for the pre-stresses due to wearing the socket and the typical
characteristic of the soft tissues of stiffening when compressed [54,55], the Young’s
modulus value in areas where such pre-stresses are expected in the PTB socket were
slightly increased, to a maximum of 250 kPa on the patellar-tendon region. Poisson’s
ratio for the soft tissues was 0.49 [12].
2.2) Boundary Conditions
Initially, the load values used for the boundary conditions were modeled as a
simple downward vertical force of 800N (for the plain socket only) so that the FEM
analysis could be validated against results found in the literature. Afterward, for all
socket designs, the loading conditions were quasi-static approximations of the
experimental forces and moments measured using a force platform during clinical trials
over the stance phase. These forces and moments were then transferred from the
laboratory reference frame to the reference frame fixed at the top surface of the bones
(Figure 5.3). Six points from the stance phase of GRF data were used.
14 http://www.3dsystems.com/products/datafiles/lasersintering/datasheets/DURAFORMHigh.pdf
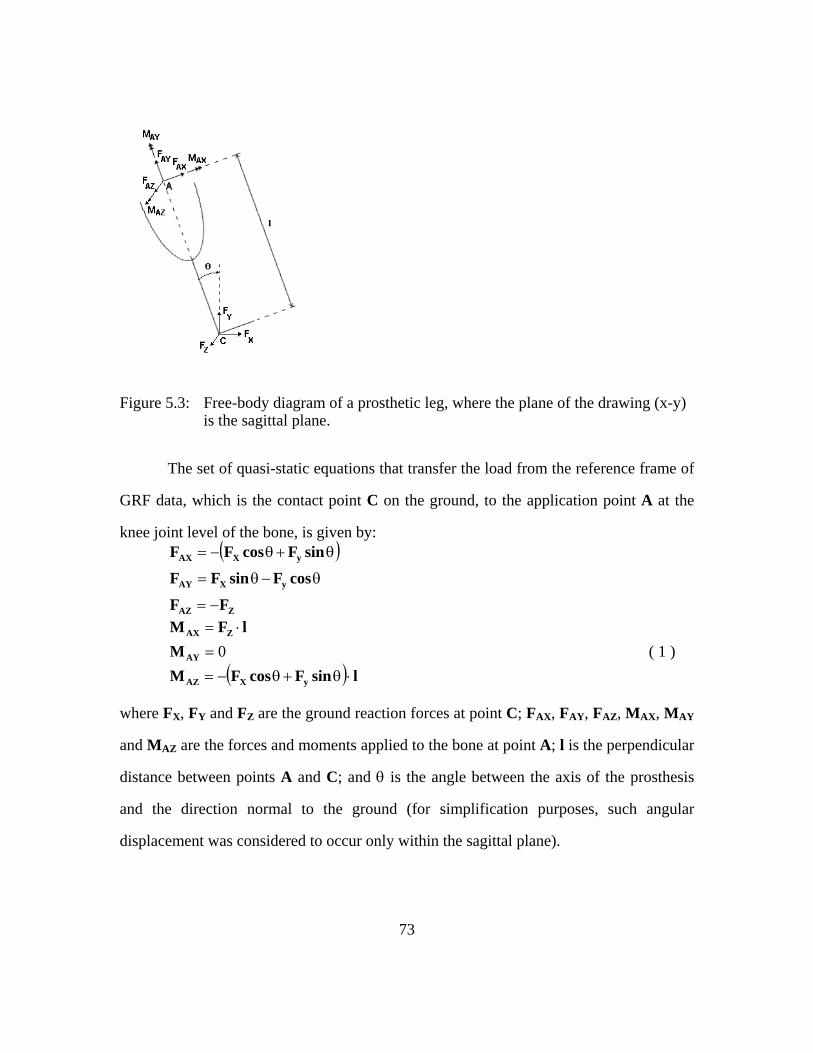
Figure 5.3: Free-body diagram of a prosthetic leg, where the plane of the drawing (x-y) is the sagittal plane.
The set of quasi-static equations that transfer the load from the reference frame of
GRF data, which is the contact point C on the ground, to the application point A at the
knee joint level of the bone, is given by: ( )
ZAZ
yXAY
yXAX
FF
cosFsinFF
sinFcosFF
−=
θ−θ=
θ+θ−=
( ) lsinFcosFMM
lFM
yXAZ
AY
ZAX
⋅θ+θ−=
=⋅=
0 ( 1 )
where FX, FY and FZ are the ground reaction forces at point C; FAX, FAY, FAZ, MAX, MAY
and MAZ are the forces and moments applied to the bone at point A; l is the perpendicular
distance between points A and C; and θ is the angle between the axis of the prosthesis
and the direction normal to the ground (for simplification purposes, such angular
displacement was considered to occur only within the sagittal plane).
73

The final boundary condition set for the FEM analysis was a complete
displacement restraint of the bottom of the socket, where the pylon of the prosthesis is
normally attached.
3. RESULTS
3.1) FEM results for vertical 800 N load
The first set of results (Figure 5.4), evaluated the pressure distribution on the soft
tissues, with the limb wearing the plain socket, under a simple downward vertical load of
800 N. The maximum pressure was computed at the patellar tendon (250 kPa). The value
found at the popliteal depression for this same the same loading conditions was 109 kPa.
a b
109 kPa
205 kPa 250 kPa
Figure 5.4: (a) Anterior and (b) Posterior view of pressures on the residual limb using the plain socket under a downward vertical load of 800 N.
74

3.2) Socket stresses, pressure at fibula head and deformation of compliant features using quasi-static loading conditions from stance phase
For the FEM simulations using the quasi-static loads during the stance phase,
three sets of results were obtained. First, the structural behavior of the three compliant
sockets was assessed with respect to the stresses produced within the models. The largest
stresses occurred at 35% of the stance phase. The largest stresses were, in all cases,
encountered within the compliant features (Figure 5.5). For the socket with a thinner
walled region, the largest stress was 16.9 MPa (at the anterior most portion of the thinner
region); for the design with spiral slots, 44 MPa (concentrated at the bottommost
beginning of the slots); for the design with supported spiral slots, 35 MPa (also at the
bottommost beginning of the slots).
Peak stresses
Figure 5.5: Structural FEM results displaying the stresses (in Pa) on each compliant socket at 35% of stance, where the largest stresses were encountered.
75
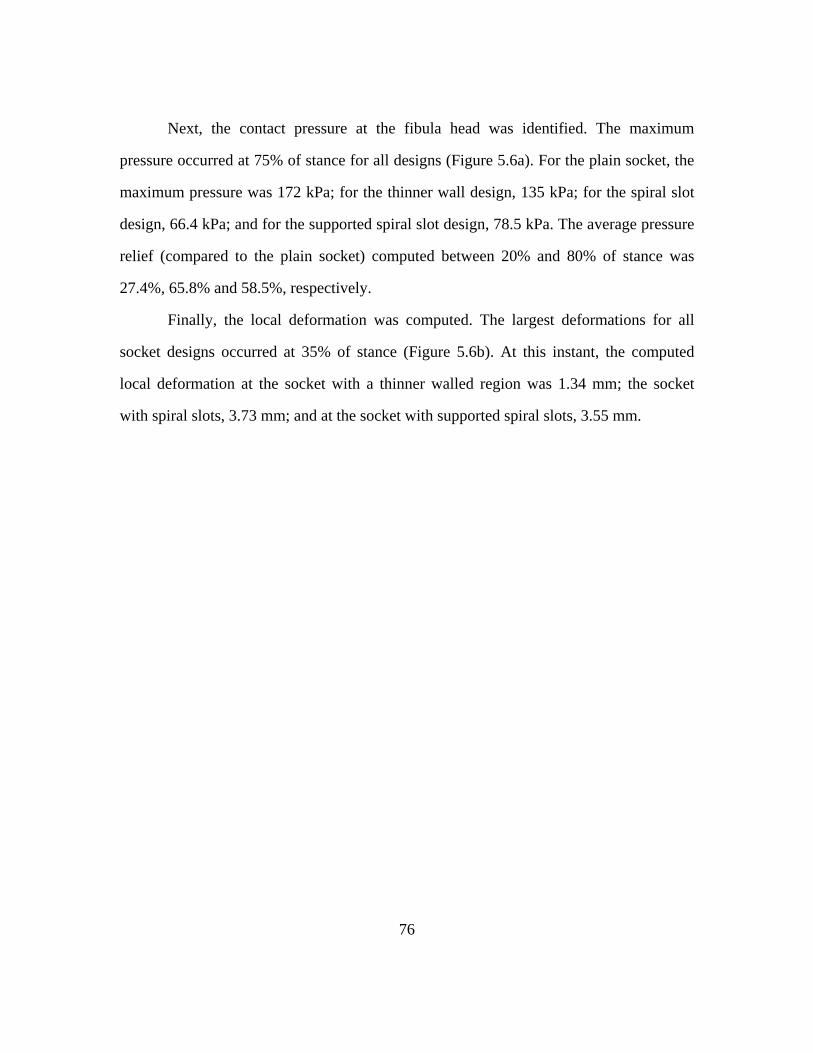
76
Next, the contact pressure at the fibula head was identified. The maximum
pressure occurred at 75% of stance for all designs (Figure 5.6a). For the plain socket, the
maximum pressure was 172 kPa; for the thinner wall design, 135 kPa; for the spiral slot
design, 66.4 kPa; and for the supported spiral slot design, 78.5 kPa. The average pressure
relief (compared to the plain socket) computed between 20% and 80% of stance was
27.4%, 65.8% and 58.5%, respectively.
Finally, the local deformation was computed. The largest deformations for all
socket designs occurred at 35% of stance (Figure 5.6b). At this instant, the computed
local deformation at the socket with a thinner walled region was 1.34 mm; the socket
with spiral slots, 3.73 mm; and at the socket with supported spiral slots, 3.55 mm.
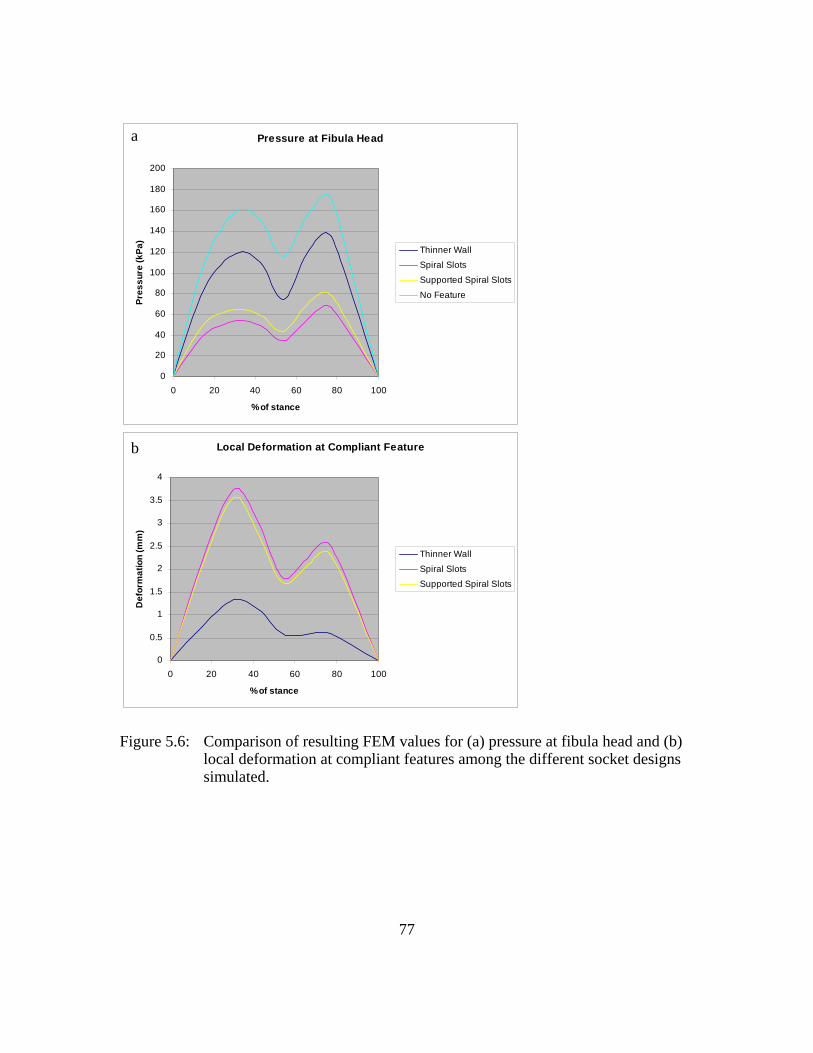
Pressure at Fibula Head
0
20
40
60
80
100
120
140
160
180
200
0 20 40 60 80 100
% of stance
Pres
sure
(kPa
)
Thinner Wall
Spiral Slots
Supported Spiral Slots
No Feature
a
Local Deformation at Compliant Feature
0
0.5
1
1.5
2
2.5
3
3.5
4
0 20 40 60 80 100
% of stance
Def
orm
atio
n (m
m)
Thinner Wall
Spiral Slots
Supported Spiral Slots
b
Figure 5.6: Comparison of resulting FEM values for (a) pressure at fibula head and (b) local deformation at compliant features among the different socket designs simulated.
77

78
4. DISCUSSION
The ability created by FEM to simulate a priori the structural response of
prototype socket designs gives the designer the ability to optimize the solution both
globally and locally within the CAD environment, without the need for time consuming
and costly intermediate prototypes and experimental measurements. However, providing
realistic boundary conditions is critical to the accuracy of FEM analyses. As such, a
model of the residual limb was incorporated into the analysis. This allowed an improved
representation of the load transfer between the residual limb and the socket through the
geometry of the mating structures. A few aspects of the results and the model of the
limb/liner set should be discussed.
The first set of results obtained with a downward vertical 800 N load (Figure 5.4)
was generated to permit an overview of the contact pressure distribution on the skin,
which was consistent with the theoretical distribution in a PTB socket [4]. Also, the
computed contact pressures at typical sites (such as the patellar tendon and the popliteal
depression) produced by the FEM model were within the commonly reported range
encountered in previously published works (both FEM based [12,13,16,17,19] and
experimental [6,15]).
Nevertheless, some approximations were judged necessary to create a
computationally efficient FEM model and require comment and justification. Primarily,
the soft tissues and the liner possess nonlinear, viscoelastic characteristics, rather than the
linear approximations used in this study. However, linear approximations were used
because non-linear material formulations increase exponentially the complexity of the
FEM model. In addition, it is difficult to identify a consistent formulation for the soft
tissues. Previous studies propose a Mooney-Rivlin formulation for these materials

79
[52,53]. The implementation of this approach and the assessment of the sensitivity of the
results with respect to this change remain as potential future work.
The contact between the soft tissues and the liner, and between the liner and the
socket were modeled with no sliding or gaps allowed. Since the present study focuses on
the stance phase of gait, the gapless assumption can be considered valid for most of the
high load portion of the stance phase (20% to 80% stance). As for the no sliding
assumption, previous work has shown that the use of automated contact elements in FEM
analysis of transtibial amputees with a “no frictional slip” model underestimates the mean
normal contact stress by 16% (and the peak normal stress by 2%) when compared to a
model with frictional slip (with the coefficient of friction equal to 0.675), while
overestimating the mean shear stress by a factor of two [19]. Although the shear stresses
are important in the clinical study of socket/limb interface mechanics, this is not the focus
of our work, which does concentrate on the structural behavior of the socket and the
effects of compliant features on normal contact stresses in specific areas of the soft tissue.
Thus, the present no slip model was considered adequate for this study.
The quasi-static approximation for the loading in the boundary conditions also
requires some discussion. An approximation model to account for dynamic effects in the
load formulation from GRF data was recently proposed [13], showing that the main
vertical load derived from FY would not be influenced at a significant level during the
stance phase. The horizontal force derived from FX would be increased by a maximum of
19% (at 35% of stance). Since this component of the force accounts only for a small
portion of the total force, it would have little effect on the normal contact stresses.
However, the moment MAZ would be increased by a maximum of 27% (at 75% of
stance), which would be enough, at that instant of stance, to decrease the normal stresses
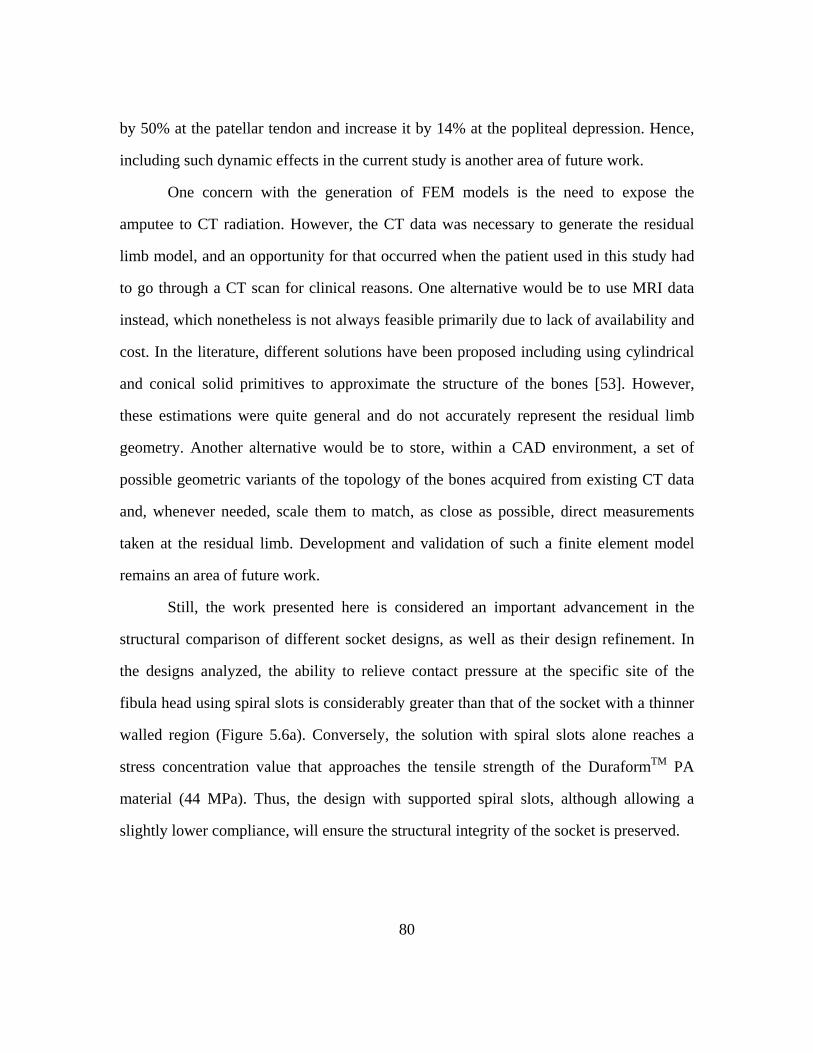
80
by 50% at the patellar tendon and increase it by 14% at the popliteal depression. Hence,
including such dynamic effects in the current study is another area of future work.
One concern with the generation of FEM models is the need to expose the
amputee to CT radiation. However, the CT data was necessary to generate the residual
limb model, and an opportunity for that occurred when the patient used in this study had
to go through a CT scan for clinical reasons. One alternative would be to use MRI data
instead, which nonetheless is not always feasible primarily due to lack of availability and
cost. In the literature, different solutions have been proposed including using cylindrical
and conical solid primitives to approximate the structure of the bones [53]. However,
these estimations were quite general and do not accurately represent the residual limb
geometry. Another alternative would be to store, within a CAD environment, a set of
possible geometric variants of the topology of the bones acquired from existing CT data
and, whenever needed, scale them to match, as close as possible, direct measurements
taken at the residual limb. Development and validation of such a finite element model
remains an area of future work.
Still, the work presented here is considered an important advancement in the
structural comparison of different socket designs, as well as their design refinement. In
the designs analyzed, the ability to relieve contact pressure at the specific site of the
fibula head using spiral slots is considerably greater than that of the socket with a thinner
walled region (Figure 5.6a). Conversely, the solution with spiral slots alone reaches a
stress concentration value that approaches the tensile strength of the DuraformTM PA
material (44 MPa). Thus, the design with supported spiral slots, although allowing a
slightly lower compliance, will ensure the structural integrity of the socket is preserved.

81
Chapter 6: CONCLUSION
1. SUMMARY
This dissertation presented the development of a framework for modeling and
fabricating prosthetic sockets using SLS technology. In order to define the loading
conditions needed for integrating compliant features into the socket, the interface
pressure at the fibula head and the distal tibia (two sites where compliance is commonly
needed) during a walking test and a step up/step down test using thin-film tactile pressure
sensors was measured. The average maximum pressures obtained at the fibula head and
distal tibia were 120 kPa and 75 kPa, respectively, for the walking test. For the step
up/down test, the values for the peak pressures at these sites were 125 kPa and 90 kPa,
respectively. Both results were considered consistent throughout the trials, with
deviations of 2.3% for the walking test and 6% for the step up/down test. Once the
loading conditions were established, a design and manufacturing framework to produce
subject-specific sockets made of DuraformTM PA material using SLS was presented. The
framework included establishing an overall socket design (using the patellar-tendon
bearing approach), performing structural analysis using the Finite Element Method
(FEM) to ensure reliability during patient use, and validating the results by comparing the
model output with experimental data. The validation included quantifying the failing
conditions of sockets manufactured using the framework during bending moment and
compression tests. The experimental failure loads for the socket were within 3% of the
FEM results and were hence considered satisfactory. Next, the design of orthogonally
compliant elements to be integrated into the socket designs was analyzed. The design

82
process included the preliminary evaluation of design alternatives using FEM, validation
of FEM results through experimental measurements, definition of a design methodology
for the alternative considered most appropriate, incorporation of the solution within the
socket geometry and refinement of the design solution using auxiliary features obtained
through topology optimization. The design alternative considered most appropriate to
provide compliance involved the incorporation of spiral slots in the socket wall. The
stiffness of this feature could be refined using compliant structures with optimized
topology. Finally, to investigate the structural response of the SLS socket during gait, a
FEM model of the system composed of a socket, liner and residual limb under quasi-
static loading derived from typical ground reaction forces was employed. The geometry
of the structures involved was acquired from CT data of a transtibial amputee. Three
different compliant designs were evaluated to assess their ability to relieve local pressure
at the fibula head during the stance phase of gait, as well as their structural integrity to
ensure safety. The design with a compliant feature consisting of spiral slots within the
socket wall was determined to produce an average relief of 65.8% in the interface
pressure at the fibula head, reducing the peak pressure from 172 kPa to 66.4 kPa, when
compared to the pressures taken from a socket with no compliant feature.
2. FUTURE WORK
The underlying goal of this work was to provide an efficient framework for
prosthetists to produce effective, subject-specific sockets. However, the current
framework involves many steps and experience using CAD and FEM analysis software.
Future work will be directed at providing an integrated user-friendly system that
automatically performs all the CAD operations needed to produce the solid model of the

83
socket, including thickening of the wall, incorporation of compliant features and bottom
pylon fitting attachments. Such a task is very feasible, since the involved parameters can
all be easily stored in a database within the program.
One limitation of this work was that the analysis methods assumed static loading
conditions. However, the loading conditions in vivo are dynamic and cyclic in nature.
Future work should be directed at investigating socket fatigue associated with such
cyclical loading. This will require experimental determination of the fatigue strength of
DuraformTM, which will allow the durability of compliant features to be included as a
design parameter.
To further improve the socket compliant features, a fruitful area of research may
be to vary the porosity within the SLS build. As described in Chapter 4, the density of the
resulting compliant feature was used as the objective function for the topology
optimization. In the present work, the final target value for local density was either the
minimum value (for no material) or one (for the presence of material). However, since it
may be possible to change the density of the part (by introducing porosity) during the
SLS build through local variation of build parameters, other target values for density may
be acceptable in the topology optimization. Different density values would lead to
additional alternatives for the compliant structures.
Further development of the residual limb, liner and socket interface
approximations presented in Chapter 5 is also needed. For instance, an implementation of
the Mooney-Rivlin formulation for the non-linear soft tissue material properties and liner
may be performed in order to assess the sensitivity of the results with respect to
alternative formulations. In addition, the inclusion of dynamic loading conditions for the
boundary conditions may be implemented.
84
Finally, the concern of patient exposure to CT radiation in order to generate the
residual limb FEM model should be addressed. One alternative would be the use of MRI
data instead. Another alternative, more cost efficient, would be to store, within a CAD
environment, a set of possible geometric variants of the topology of the bones acquired
from existing CT data. Then, the most similar bone set could be scaled to match direct
measurements taken from the residual limb. Development and validation of such a Finite
Element model remains as a potential future project.
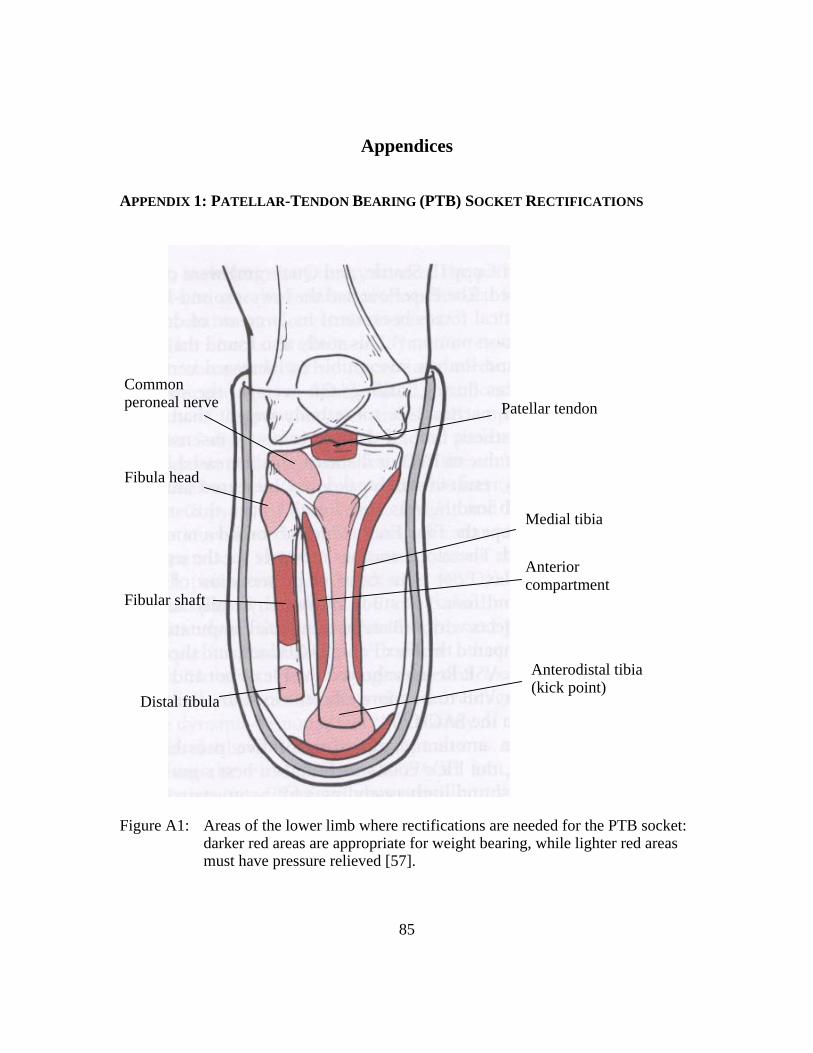
Appendices
APPENDIX 1: PATELLAR-TENDON BEARING (PTB) SOCKET RECTIFICATIONS
Patellar tendon
Anterior compartment
Distal fibula
Fibular shaft
Fibula head
Common peroneal nerve
Medial tibia
Anterodistal tibia (kick point)
Figure A1: Areas of the lower limb where rectifications are needed for the PTB socket: darker red areas are appropriate for weight bearing, while lighter red areas must have pressure relieved [57].
85

APPENDIX 2: TYPICAL GAIT CYCLE
Figure A2: Typical gait cycle illustrating the nomenclature of its phases and main events [56].
86
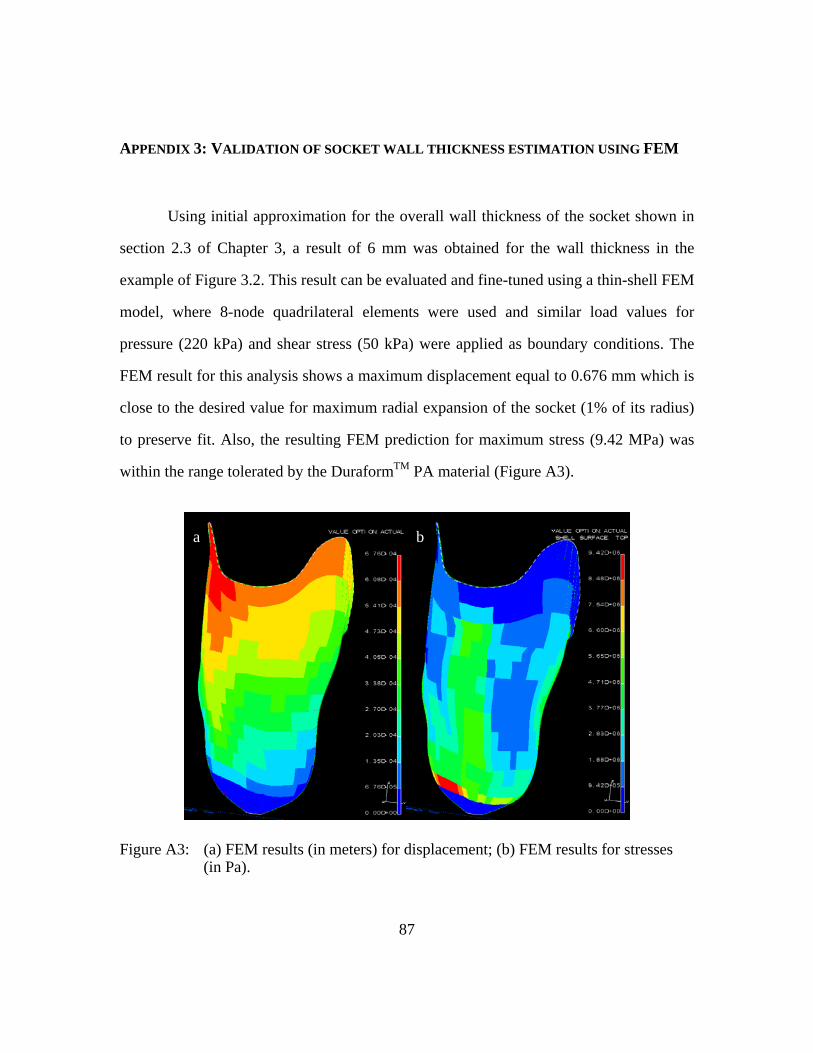
APPENDIX 3: VALIDATION OF SOCKET WALL THICKNESS ESTIMATION USING FEM
Using initial approximation for the overall wall thickness of the socket shown in
section 2.3 of Chapter 3, a result of 6 mm was obtained for the wall thickness in the
example of Figure 3.2. This result can be evaluated and fine-tuned using a thin-shell FEM
model, where 8-node quadrilateral elements were used and similar load values for
pressure (220 kPa) and shear stress (50 kPa) were applied as boundary conditions. The
FEM result for this analysis shows a maximum displacement equal to 0.676 mm which is
close to the desired value for maximum radial expansion of the socket (1% of its radius)
to preserve fit. Also, the resulting FEM prediction for maximum stress (9.42 MPa) was
within the range tolerated by the DuraformTM PA material (Figure A3).
a b
Figure A3: (a) FEM results (in meters) for displacement; (b) FEM results for stresses (in Pa).
87

APPENDIX 4: CONSIDERATIONS ABOUT THE REUSE OF DURAFORMTM PA POWDER
The material properties of DuraformTM PA may differ a lot from the published
values in different conditions. Variations in build parameters lead to parts with altered
properties. Furthermore, the age of the DuraformTM powder, the number of times it has
been reused, and even machine dependent maintenance issues such as the cleanliness of
the laser lenses and heater sensors are all factors that may dramatically influence in the
quality of the parts. To evaluate the impact such powder age in the mechanical properties,
some tensile specimens were in an MTS hydraulic testing machine. These specimens
(Figure A4) followed the ASTM Standard D638 – 02a – and so did the testing
procedures.
Figure A4: Tensile specimens used to evaluate the material properties of older DuraformTM powder.
The results varied dramatically, depending on the source of the part, with the ones
built with virgin powder being the closest to the published values. But for older, many
times reused DuraformTM powder, some properties were highly degraded, as low as
shown in Table 1. This is an important consideration to be made, since it is common
88

89
practice, due to the cost of the virgin DuraformTM, to reuse the powder several times.
Thus, caution must be exercised with such practice, aiming to at least abide to a blending
proportion of 1/3 virgin powder, 1/3 from part cake and 1/3 from overflow bins [33].
Experience shows that, if no blending is performed, the material properties of the parts
(not to mention other geometric issues such as variable shrinkage and surface
imperfections) will degrade significantly after 6-8 uses of the powder.
Result\Direction of Stress Any direction within
layer plane Normal to layer plane
Modulus of elasticity 255 MPa 160 MPa Tensile strength 27 MPa 8 MPa Elongation at break 15% 5%
Table A: Material properties achieved from tensile test of DuraformTM PA specimens made from powder used more than 10 times.
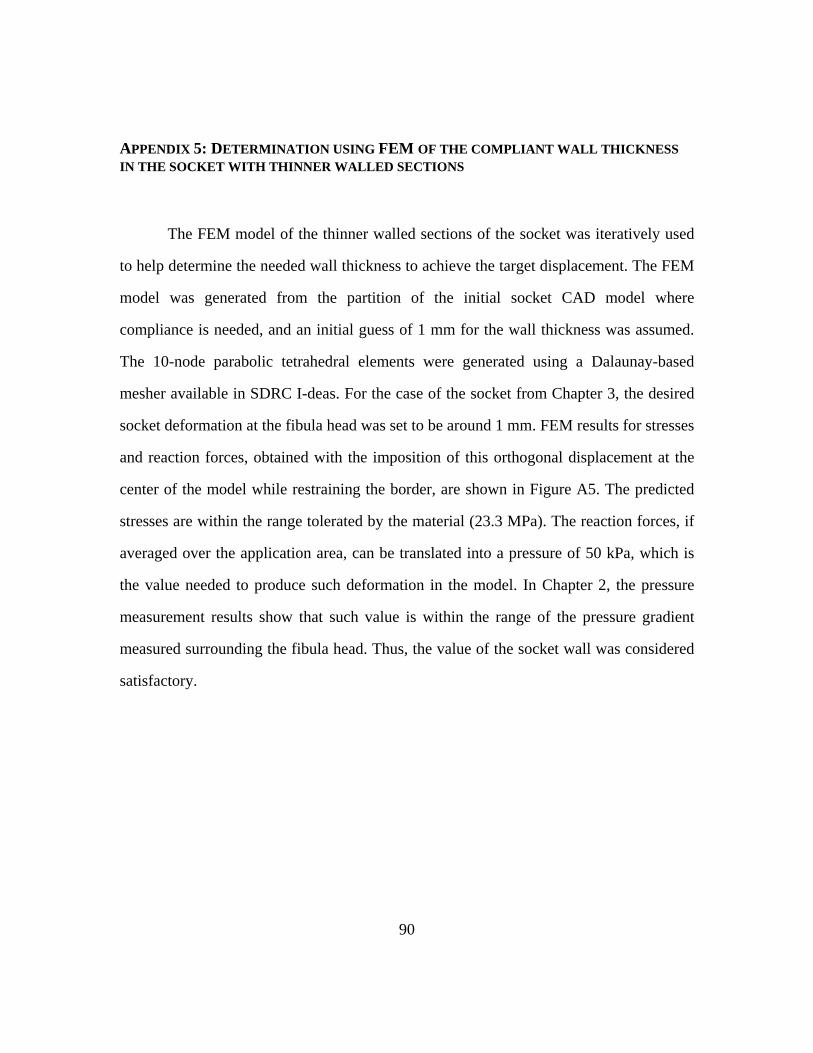
90
APPENDIX 5: DETERMINATION USING FEM OF THE COMPLIANT WALL THICKNESS IN THE SOCKET WITH THINNER WALLED SECTIONS
The FEM model of the thinner walled sections of the socket was iteratively used
to help determine the needed wall thickness to achieve the target displacement. The FEM
model was generated from the partition of the initial socket CAD model where
compliance is needed, and an initial guess of 1 mm for the wall thickness was assumed.
The 10-node parabolic tetrahedral elements were generated using a Dalaunay-based
mesher available in SDRC I-deas. For the case of the socket from Chapter 3, the desired
socket deformation at the fibula head was set to be around 1 mm. FEM results for stresses
and reaction forces, obtained with the imposition of this orthogonal displacement at the
center of the model while restraining the border, are shown in Figure A5. The predicted
stresses are within the range tolerated by the material (23.3 MPa). The reaction forces, if
averaged over the application area, can be translated into a pressure of 50 kPa, which is
the value needed to produce such deformation in the model. In Chapter 2, the pressure
measurement results show that such value is within the range of the pressure gradient
measured surrounding the fibula head. Thus, the value of the socket wall was considered
satisfactory.

a b
Figure A5: (a) FEM stress results (in Pa) for the thinner walled section of the socket; (b) Results for reaction forces (in N).
91
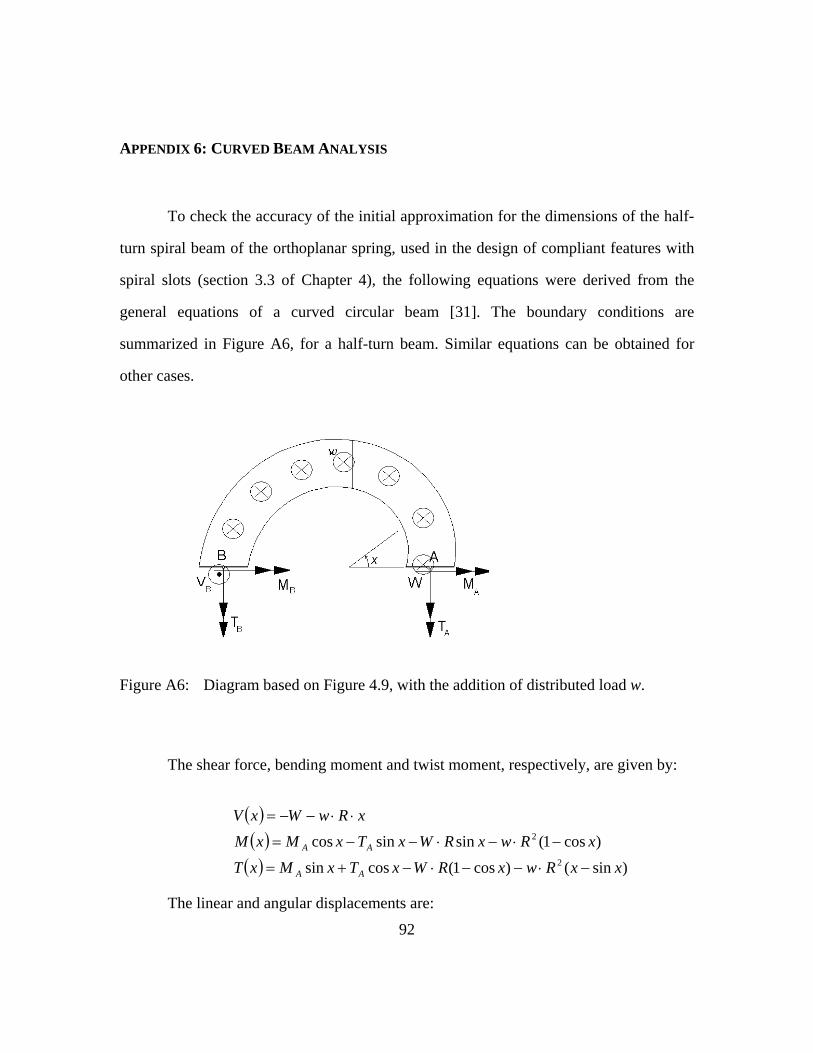
APPENDIX 6: CURVED BEAM ANALYSIS
To check the accuracy of the initial approximation for the dimensions of the half-
turn spiral beam of the orthoplanar spring, used in the design of compliant features with
spiral slots (section 3.3 of Chapter 4), the following equations were derived from the
general equations of a curved circular beam [31]. The boundary conditions are
summarized in Figure A6, for a half-turn beam. Similar equations can be obtained for
other cases.
Figure A6: Diagram based on Figure 4.9, with the addition of distributed load w.
The shear force, bending moment and twist moment, respectively, are given by:
( )( )( ) )sin()cos1(cossin
)cos1(sinsincos2
2
xxRwxRWxTxMxT
xRwxRWxTxMxMxRwWxV
AA
AA
−⋅−−⋅−+=
−⋅−⋅−−=
⋅⋅−−=
The linear and angular displacements are:
92
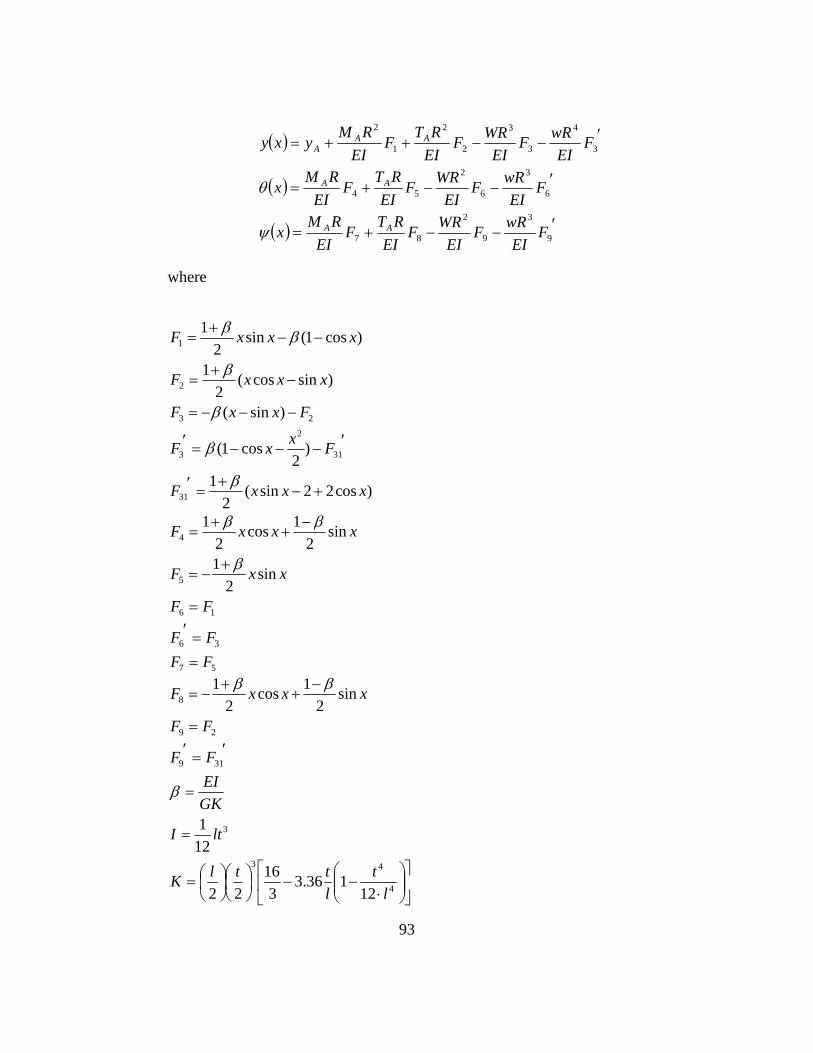
( )
( )
( ) ′−−+=
′−−+=
′−−++=
9
3
9
2
87
6
3
6
2
54
3
4
3
3
2
2
1
2
FEI
wRFEI
WRFEI
RTFEI
RMx
FEI
wRFEI
WRFEI
RTF
EIRM
x
FEI
wRFEI
WRFEIRT
FEI
RMyxy
AA
AA
AAA
ψ
θ
where
)cos22sin(2
1
)2
cos1(
)sin(
)sincos(2
1
)cos1(sin2
1
31
31
2
3
23
2
1
xxxF
FxxF
FxxF
xxxF
xxxF
+−+
=′
′−−−=′
−−−=
−+
=
−−+
=
β
β
β
β
ββ
57
36
16
5
4
sin2
1
sin2
1cos2
1
FFFF
FF
xxF
xxxF
==′=
+−=
−+
+=
β
ββ
⎥⎦
⎤⎢⎣
⎡⎟⎟⎠
⎞⎜⎜⎝
⎛⋅
−−⎟⎠⎞
⎜⎝⎛⎟⎠⎞
⎜⎝⎛=
=
=
′=′=
−+
+−=
4
43
3
319
29
8
12136.3
316
22
121
sin2
1cos2
1
lt
lttlK
ltI
GKEIFF
FF
xxxF
β
ββ
93

The following boundary conditions can be extracted from the supports:
( )( ) 00
00====
ψψθθ
A
A
( )( )( ) 0
00
======
πψψπθθπ
B
B
B yy
The description of the variables is as follows:
W: load at the beginning of the beam (point A);
w: distributed load;
x: angle from point A;
R: mean radius;
V: shear force;
M: bending moment in the plane tangent to the curved axis;
T: twist moment in the plane normal to the curved axis;
y: out-of-beam-plane displacement;
θ : slope of the beam axis in the plane of moment M;
ψ: roll of the beam cross section in the plane of twist moment T;
E: Young’s modulus;
G: Torsional modulus of rigidity;
l: width of the beam;
t: thickness of the beam (height of cross section).
94

95
The last three boundary conditions, applied to the equations of linear and angular
displacements, lead to a three by three system. This system, if resolved, defines the close
approximation of vertical displacement y at point A (which would be the deflection of the
center of the compliant feature) as well as the reaction moments needed to build the
bending moment and twist moment diagrams from their corresponding equations for
stress analysis.
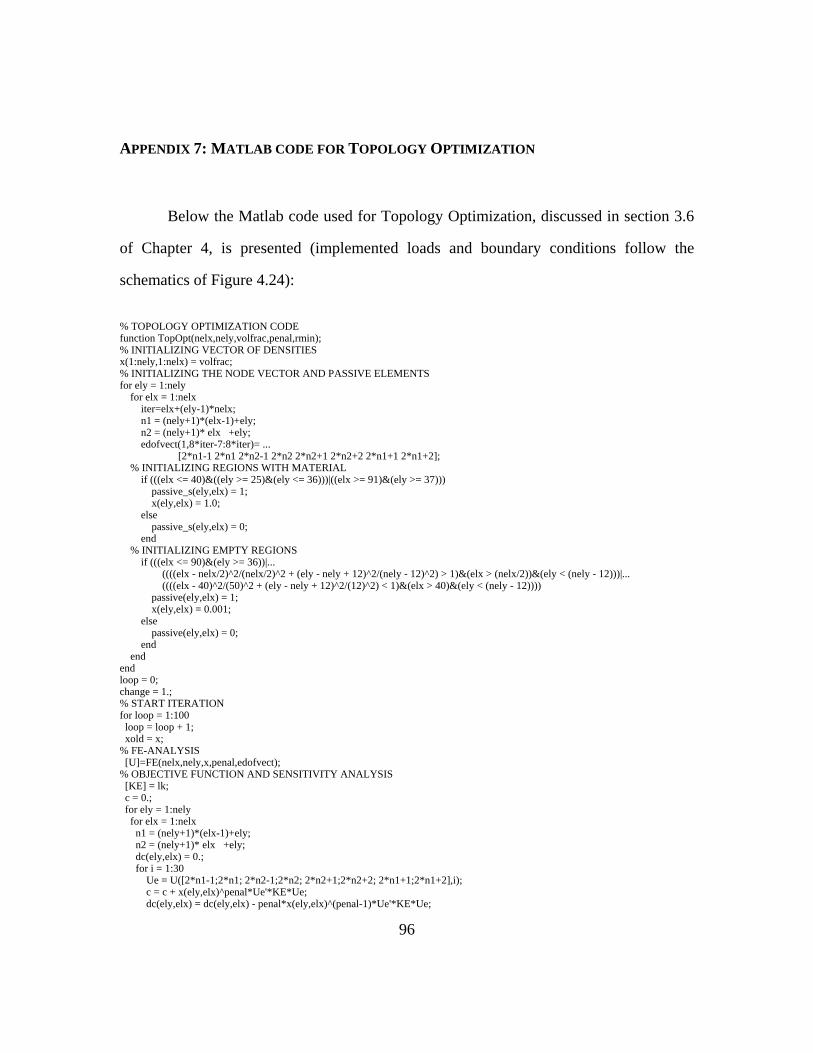
96
APPENDIX 7: MATLAB CODE FOR TOPOLOGY OPTIMIZATION
Below the Matlab code used for Topology Optimization, discussed in section 3.6
of Chapter 4, is presented (implemented loads and boundary conditions follow the
schematics of Figure 4.24):
% TOPOLOGY OPTIMIZATION CODE function TopOpt(nelx,nely,volfrac,penal,rmin); % INITIALIZING VECTOR OF DENSITIES x(1:nely,1:nelx) = volfrac; % INITIALIZING THE NODE VECTOR AND PASSIVE ELEMENTS for ely = 1:nely for elx = 1:nelx iter=elx+(ely-1)*nelx; n1 = (nely+1)*(elx-1)+ely; n2 = (nely+1)* elx +ely; edofvect(1,8*iter-7:8*iter)= ... [2*n1-1 2*n1 2*n2-1 2*n2 2*n2+1 2*n2+2 2*n1+1 2*n1+2]; % INITIALIZING REGIONS WITH MATERIAL if (((elx <= 40)&((ely >= 25)&(ely <= 36)))|((elx >= 91)&(ely >= 37))) passive_s(ely,elx) = 1; x(ely,elx) = 1.0; else passive_s(ely,elx) = 0; end % INITIALIZING EMPTY REGIONS if (((elx <= 90)&(ely >= 36))|... ((((elx - nelx/2)^2/(nelx/2)^2 + (ely - nely + 12)^2/(nely - 12)^2) > 1)&(elx > (nelx/2))&(ely < (nely - 12)))|... ((((elx - 40)^2/(50)^2 + (ely - nely + 12)^2/(12)^2) < 1)&(elx > 40)&(ely < (nely - 12)))) passive(ely,elx) = 1; x(ely,elx) = 0.001; else passive(ely,elx) = 0; end end end loop = 0; change = 1.; % START ITERATION for loop = 1:100 loop = loop + 1; xold = x; % FE-ANALYSIS [U]=FE(nelx,nely,x,penal,edofvect); % OBJECTIVE FUNCTION AND SENSITIVITY ANALYSIS [KE] = lk; c = 0.; for ely = 1:nely for elx = 1:nelx n1 = (nely+1)*(elx-1)+ely; n2 = (nely+1)* elx +ely; dc(ely,elx) = 0.; for i = 1:30 Ue = U([2*n1-1;2*n1; 2*n2-1;2*n2; 2*n2+1;2*n2+2; 2*n1+1;2*n1+2],i); c = c + x(ely,elx)^penal*Ue'*KE*Ue; dc(ely,elx) = dc(ely,elx) - penal*x(ely,elx)^(penal-1)*Ue'*KE*Ue;

97
end end end % FILTERING OF SENSITIVITIES [dc] = check(nelx,nely,rmin,x,dc); % DESIGN UPDATE BY THE MMA METHOD [x] = MMA(nelx,nely,x,volfrac,dc,passive,passive_s); % PRINT RESULTS change = max(max(abs(x-xold))); disp([' It.: ' sprintf('%4i',loop) ' Obj.: ' sprintf('%10.4f',c) ... ' Vol.: ' sprintf('%6.3f',sum(sum(x))/(nelx*nely)) ... ' ch.: ' sprintf('%6.3f',change )]) % PLOT DENSITIES colormap(gray); imagesc(-x); axis equal; axis tight; axis off;pause(1e-6); end %%%%%%%%%% MMA CRITERIA UPDATE %%%%%%%%%%%%%%%%%%%%%%%%%%%%%%%%%%%%%% function [xnew]=MMA(nelx,nely,x,volfrac,dc,passive,passive_s) xlow=0.001; xhigh=1; L=x-0.1*(xhigh-xlow)*ones(nely,nelx); high=(x-L).^2.*-dc./(xlow-L).^2; low=(x-L).^2.*-dc./(xhigh-L).^2; l2 = min(min(high)); l1 = max(max(low)); for i=1:50 lmid = 0.5*(l2+l1); xnew=max(xlow,min(xhigh,L+abs(x-L).*sqrt(-dc./lmid))); xnew(find(passive)) = 0.001; xnew(find(passive_s)) = 1.0; if sum(sum(xnew)) - volfrac*nelx*nely > 0; l2 = lmid; else l1 = lmid; end end %%%%%%%%%% MESH-INDEPENDENCY FILTER %%%%%%%%%%%%%%%%%%%%%%%%%%%%%%%%%%%%%%%% function [dcn]=check(nelx,nely,rmin,x,dc) dcn=zeros(nely,nelx); for i = 1:nelx for j = 1:nely sum=0.0; for k = max(i-floor(rmin),1):min(i+floor(rmin),nelx) for l = max(j-floor(rmin),1):min(j+floor(rmin),nely) fac = rmin-sqrt((i-k)^2+(j-l)^2); sum = sum+max(0,fac); dcn(j,i) = dcn(j,i) + max(0,fac)*x(l,k)*dc(l,k); end end dcn(j,i) = dcn(j,i)/(x(j,i)*sum); end end %%%%%%%%%% FE-ANALYSIS %%%%%%%%%%%%%%%%%%%%%%%%%%%%%%%%%%%%%%%%%%%%%%%%%%%%% function [U]=FE(nelx,nely,x,penal,edofvect) F = sparse(2*(nely+1)*(nelx+1),30); U = sparse(2*(nely+1)*(nelx+1),30); [KE]=reshape(lk,1,64); xrad=reshape(x',1,nelx*nely); columnindex= reshape(kron(reshape(edofvect,8,nelx*nely), ... ones(1,8)), 1,64*nelx*nely); rowindex=kron(edofvect,ones(1,8)); K=sparse(rowindex,columnindex,kron(xrad.^penal,KE)); % DEFINE LOADS AND SUPPORTS for i = 1:30 F(2*(36)*i,i) = 1./3; end fixeddofs = union([1:2:2*(nely+1)],[2*(nelx)*(nely+1)+2*(nely - 12):2*(nelx+1)*(nely+1)]); alldofs = [1:2*(nely+1)*(nelx+1)]; freedofs = setdiff(alldofs,fixeddofs);

98
% SOLVING U(freedofs,:) = K(freedofs,freedofs) \ F(freedofs,:); U(fixeddofs,:)= 0; %%%%%%%%%% ELEMENT STIFFNESS MATRIX FOR DURAFORM %%%%%%%%%%%%%%%%%%%%%%%%%%%% function [KE]=lk E = 1600.; nu = 0.4; k=[ 1/2-nu/6 1/8+nu/8 -1/4-nu/12 -1/8+3*nu/8 ... -1/4+nu/12 -1/8-nu/8 nu/6 1/8-3*nu/8]; KE = E/(1-nu^2)*[ k(1) k(2) k(3) k(4) k(5) k(6) k(7) k(8) k(2) k(1) k(8) k(7) k(6) k(5) k(4) k(3) k(3) k(8) k(1) k(6) k(7) k(4) k(5) k(2) k(4) k(7) k(6) k(1) k(8) k(3) k(2) k(5) k(5) k(6) k(7) k(8) k(1) k(2) k(3) k(4) k(6) k(5) k(4) k(3) k(2) k(1) k(8) k(7) k(7) k(4) k(5) k(2) k(3) k(8) k(1) k(6) k(8) k(3) k(2) k(5) k(4) k(7) k(6) k(1)];

99
References
1 Rogers, W. E., Crawford, R. H., Beaman, J. J., and Walsh, N. E., 1991, “Fabrication of Prosthetic Sockets by Selective Laser Sintering”, 1991 Solid Freeform Fabrication Symposium Proceedings, Marcus, H. L., Beaman, J. J., Barlow, J. W., Bourell, D. L., and Crawford, R. H., eds., Austin, TX, August 12-14, 1991, pp. 158-163.
2 Hoagland, F. T., Jergesen, H. E., Wilson, C. P., Lamoreux, L. W., et al., 1983, “Evaluation of problems and needs of veteran lower-limb amputees in the San Francisco Bay Area”, Journal of Rehabilitation Research and Development, Num. 20, pp. 57-71, 1983.
3 Stephens, S. D., 1999, Design of a Compliant Socket Fabricated Using Selective Laser Sintering, MS thesis, The University of Texas at Austin.
4 Fergunson, J., Smith, D. G., 1999, “Socket Considerations for the Patient With a Transtibial Amputation”, Clinical Orthopaedics and Related Research, Num. 361, pp. 77-86.
5 Buis, A. W. P., Convery, P., 1997, “Calibration problems encountered while monitoring stump/socket interface pressures with force sensing resistors: techniques adopted to minimise inaccuracies”, Prosthetics and Orthotics International, Vol. 21, pp. 179-182.
6 Buis, A. W. P., Convery, P., 1998, “Conventional patellar-tendon-bearing (PTB) socket/stump interface dynamic pressure distributions recorded during the prosthetic stance phase of gait of a trans-tibial amputee”, Prosthetics and Orthotics International, Vol. 22, pp. 193-198.
7 Mak, A. F. T., Zhang, M., Boone, D. A., 2001, “State-of-the-art research in lower-limb prosthetic biomechanics-socket interface”, Journal of Rehabilitation Research and Development, Vol. 38, No. 2, March/April 2001.
8 Sanders, J. E., Zachariah, S. G., Baker, A. B., Greve, J. M., Clinton, C., 2000, “Effects of changes in cadence, prosthetic componentry, and time on interface pressures and shear stresses of three trans-tibial amputees”, Clinical Biomechanics, Num. 15, pp. 684-694.

100
9 Sanders, J. E., Daly, C. H., 1999, “Interface pressures and shear stresses: sagittal plane angular alignment effects in three trans-tibial amputee case studies”, Prosthetics and Orthotics International, Num. 23, pp. 21-29.
10 Sanders, J. E., Greve, J. M., Clinton, C., Hafner, B. J., 2000, “Changes in interface pressure and stump shape over time: preliminary results from a trans-tibial amputee subject”, Prosthetics and Orthotics International, Num. 24, pp. 163-168.
11 Zhang, M., Turner-Smith, A. R., Roberts, V. C., Tanner, A., 1996, “Frictional action at lower limb/prosthetic socket interface”, Medical Engineering & Physics, Vol. 18, Num. 3, pp. 207-214.
12 Zhang, M., Roberts, C., 2000, “Comparison of computational analysis with clinical measurement of stresses on below-knee residual limb in a prosthetic socket”, Medical Engineering & Physics, Num. 22, pp. 607-612.
13 Jia, X., Zhang, M., Lee, W. C. C., 2004, “Load transfer mechanics between trans-tibial prosthetic socket and residual limb-dynamic effects”, Journal of Biomechanics (in press)..
14 Zhang, M., Mak, A., Roberts, V. C., 1998, “Finite element modeling of residual lower-limb in a prosthetic socket: a survey of the development in the first decade”, Medical Engineering & Physics, Num. 20, pp. 360-373.
15 Zhang, M., Turner-Smith, A. R., Tanner, A., Roberts, V. C., 1998, “Clinical investigation of the pressure and shear stress on the trans-tibial stump with a prosthesis”, Medical Engineering & Physics, Num. 20, pp. 188-198.
16 Zhang, M., Lord, M., Turner-Smith, A. R., Roberts, V. C., 1995 “Development of a non-linear finite element modeling of the below-knee prosthetic socket interface”, Medical Engineering & Physics, Vol. 17, Num. 8, pp. 559-566.
17 Zachariah, S. G., Sanders, J. E., Turkiyyah, G. M., 1996, “Automated Hexahedral Mesh Generation, from Biomedical Image Data: Applications in Limb Prosthetics”, IEEE Transactions on Rehabilitation Engineering, Vol. 4, Num. 2, pp. 91-102.
18 Zachariah, S., Sanders, J. E., 1996, “Interface Mechanics in Lower-Limb External Prosthetics: A Review of Finite Element Models”, IEEE Transactions on Rehabilitation Engineering, Vol. 4, Num. 4, pp. 288-302.
19 Zachariah, S. G., Sanders, J. E., 2000, “Finite element estimates of interface stress in the trans-tibial prosthesis using gap elements are different from those using automated contact”, Journal of Biomechanics, Num. 33, pp. 895-899.
101
20 Luo, J., 2002, “Calibration of Tekscan F-Socket 9811 sensors”, Internal Report, Dept. of Rehabilitation Medicine, University of Texas Health Science Center at San Antonio.
21 Silver-Thorn, M. B., 1991, “Prediction and experimental verification of residual limb-prosthetic socket interface pressures for below-knee amputees”, Ph. D. Thesis, Northwestern University.
22 Walsh, N. E., Lancaster, J. L., Faulkner V. W., Rogers, W. E., 1989, “A Computerized System to Manufacture Prostheses for Amputees in Developing Countries”, Journal of Prosthetics and Orthotics, Vol. 1, Num. 3, pp. 165-181.
23 Freeman, D., Wontorcik, L., 1998, “Stereolithography and Prosthetic Test Socket Manufacture: A Cost/Benefit Analysis”, Journal of Prosthetics and Orthotics, Vol. 10, Num. 1.
24 Rogers, W., Gitter, A., Bosker, G., Faustini, M., Lockhande, M., Crawford, R., 2001, “Clinical Evaluation of Prosthetic Sockets Manufactured by Selective Laser Sintering”, 2001 Solid Freeform Fabrication Symposium Proceedings, Austin, TX.
25 Faustini, M., Crawford, R., Rogers, W., Gitter, A., Bosker, G., 2001, “Finite Element Structural Analysis of Prosthesis Sockets for Below-the-Knee Amputees Manufactured by SLS”, 2001 Solid Freeform Fabrication Symposium Proceedings, Austin, TX.
26 Kahle, J., 1999, “Conventional and Hydrostatic Transtibial Interface Comparison”, Journal of Prosthetics and Orthotics, Vol. 11, Num. 4, pp. 85-91, 1999.
27 Burhan, D., 2004, Redesign Attachment Fitting of Transtibial Prosthetic Socket using Selective Laser Sintering, MS Thesis, The University of Texas at Austin.
28 Brooks, A., 2004, Bending Strength Test and Evaluation of a Transtibial Prosthetic Socket Fabricated by Selective Laser Sintering, MS Thesis, The University of Texas at Austin.
29 Dixit, V. S., 2004, Compression Test of Trans-Tibial Prosthesis Sockets Using Granular Media Boundary Condition, MS Report, The University of Texas at Austin.
30 Lockhande, M., Crawford, R., 2001, “Testing of Compliance in a Prosthetic Socket Fabricated using Selective Laser Sintering”, 2001 Solid Freeform Fabrication Symposium Proceedings, Austin, TX.

102
31 Roark, R. J. and Young, W. C., 1975, Formulas for Stress and Strain, McGraw-Hill Book Co., New York.
32 Pilkey, W. D., 1994, Formulas for Stress, Strain, and Structural Matrices, John Wiley & Sons, New York.
33 2002, Guide to Duraform Materials, 3DSystems, DCN 8002-10004-001, pp. 61-62.
34 Howell, L. L., 2001, Compliant Mechanisms, John Wiley & Sons, New York.
35 Sayre, M. F., 1936, “New Spring Formulas and New Materials for Precision Spring Scales”, Trans. ASME, Vol. 58.
36 Wahl, A. M., 1963, Mechanical Springs, 2d. ed., McGraw-Hill Book Co., New York.
37 Bendsoe, M. P., Diaz, A., and Kikuchi, N., 1993, “Generating Optimal Topologies in Structural Design Using a Homogenization Method,” Computer Methods in Applied Mechanics and Engineering, 71 (1988), pp. 197-224.
38 Bendsoe, M. P., Sigmund, O., 1999, “Material interpolation schemes in topology optimization”, Archive of Applied Mechanics, Vol. 69, pp. 635-657.
39 Frecker, M. I., Kikuchi, N., Kota, S., 1996, “Optimal Synthesis of Compliant Mechanisms to Satisfy Kinematic and Structural Requirements – Preliminary Results”, Proceedings of the 1996 ASME Design Engineering Techincal Conferences, 96-DETC/DAC-1497.
40 Hetrick, J. A., Kota, S., 1998, “Size and Shape Optimization of Compliant Mechanisms: an Efficiency Formulation”, Proceedings of the 2000 ASME Design Engineering Techincal Conferences, DETC98/MECH-5943.
41 Hetrick, J. A., Kota, S., 1999, “An Energy Formulation for Parametric Size and Shape Optimization of Compliant Mechanisms”, Journal of Mechanical Design, Vol. 121, pp. 229-234.
42 Hetrick, J. A., Kota, S., 2000, “Topological and Geometric Synthesis of Compliant Mechanisms”, Proceedings of the 2000 ASME Design Engineering Techincal Conferences, DETC-2000/MECH-14140.
43 Joo, J., Kota, S., Kikuchi, N., 2000, “Nonlinear Synthesis of Compliant Mechanisms: Topology Design”, Proceedings of the 2000 ASME Design Engineering Techincal Conferences, DETC-2000/MECH-14141.
103
44 Nishiwaki, S., Frecker, M., Min, S. and Kikuchi, N., 1998, “Topology Optimization of Compliant Mechanisms Using the Homogenization Method,” International Journal for Numerical Methods in Engineering, 42 (1998), pp. 535-559.
45 Roark, R. J. and Young, W. C., 1975, Formulas for Stress and Strain, McGraw-Hill Book Co., New York.
46 Rozvany, G. I. N., 2001, “Stress ratio and compliance based methods in topology optimization – a critical review”, Structural and Multidisciplinary Optimization, Vol. 21, pp. 109-119.
47 Sigmund, O., 2001, “A 99 line topology optimization code written in Matlab”, Structural and Multidisciplinary Optimization, Vol. 21, Num 2, pp. 120-127.
48 Suzuki, K. and Kikuchi, N., 1991, “A Homogenization Method for Shape and Topology Optimization,” Computer Methods in Applied Mechanics and Engineering, 93 (1991), pp. 291-318.
49 Sigmund, O., Peterson, J., 1998, “Numerical instabilities in topology optimization: a survey on procedures dealing with checkerboards, mesh-dependencies and a local minima”, Structural and Multidisciplinary Optimization, Vol. 16, pp. 68-75.
50 Svanberg, K., 1987, “The method of moving asymptotes – a new method for structural optimization”, Int. J. Numer. Meth. Engr., Vol. 24, pp 359-373.
51 Bourell, D.L., Marcus, H. L., Barlow, J. W., Beaman, J. J., 1992, “Selective laser sintering of metals and ceramics”, International Journal of Powder Metallurgy, Vol. 28, Num. 4, pp. 369-381.
52 Fisher, C., Simpson, G., Reynolds, D., 1999, “Development of a three-dimensional, non-linear finite element model of a transtibial socket liner”, Proceedings of the 4th International Symposium of Computer Methods In Biomechanics & Biomedical Engineering, Lisbon, Portugal.
53 Simpson, G., Fisher, C., Wright, D. K., 1999, “Modeling the Interactions Between a Prosthetic Socket, Polyurethane Liners and the Residual Limb in Transtibial Amputees using Non-Linear Finite Element Analysis”, Dept. of Design, Brunel University.
54 Silver-Thorn, M. B., 1999, “In Vivo Indentation of Lower Extremity Limb Soft Tissues”, IEEE Transactions on Rehabilitation Engineering, Vol. 7, Num. 3, pp. 268-277.

104
55 Silver-Thorn, M. B., 2002, “Investigation of lower-limb tissue perfusion during loading”, Journal of Rehabilitation Research and Development, Vol. 39, Num. 5, pp. 597-608.
56 Rose, J., Gamble, J. G., 1996, Human Walking, Williams and Wilkins, Baltimore.
57 Seymour, R., 2002, Prosthetics and Orthotics: Lower Limb and Spine, Williams and Wilkins, Baltimore.

105
Vita
Mário Carneiro Faustini was born in Rio de Janeiro, Brazil, on February 14, 1974,
the son of Mário Francisco Antônio Faustini and Angélica Carneiro Faustini. After
completing his work at the Colégio de São Bento, Rio de Janeiro, Brazil, in 1992, he
entered the Escola Politécnica of the Universidade de São Paulo, Brazil, where he
received the degree of Bachelor of Science in Mechatronics Engineering in January 1997.
The following semester he entered the Graduate School of the University of São Paulo,
where he received the degree of Master of Science in Mechanical Engineering in May
1999. In August 1999 he entered the Graduate School of The University of Texas at
Austin.
Permanent address: Rua General Barbosa Lima, 99 Apt 401, Copacabana, Rio de
Janeiro, RJ, CEP 22011-060, Brazil
This dissertation was typed by Mario Carneiro Faustini.