copyright2002: nomura research institute , ltd all rights reserved 0 tokyo club for global studies...
Post on 19-Dec-2015
213 views
TRANSCRIPT

1Copyright2002: Nomura Research Institute , LTD All Rights Reserved
Tokyo Club for Global Studies
Innovation and Promotion Policies for the Service Sector in Asia20-21 February 2003

2Copyright2002: Nomura Research Institute , LTD All Rights Reserved
Service Sector Innovation and Policy Issues in Japan
February 21, 2003
Nobuaki TakadaNomura Research Institute, Ltd.

3Copyright2002: Nomura Research Institute , LTD All Rights Reserved
Introduction
• The weight of service industries has been increasing. • Hopes are being pinned on the service industries to become
a key player in the rehabilitation of the Japanese economy.• The service industries have failed to achieve demonstrative
increases in productivity through innovation.
“Service innovation” based on the development and adoption of technology and know-how

4Copyright2002: Nomura Research Institute , LTD All Rights Reserved
Growing Importance of Service Industries
1978 1988 1998Agriculture, forestry and fisheries 3.7 2.6 1.8Mining 0.5 0.2 0.2Manufacturing 24.9 26.2 25.9Construction 11.1 9.3 7.8Total for secondary industries 36.5 35.8 33.9Electric power, city gas and water supply 2.4 2.5 2.9Wholesale and retail 11.2 12.6 12.2Finance and insurance 4.1 5.6 5.0Real estate 10.8 10.8 11.9Transportation and communications 6.4 6.2 6.3Services 13.2 13.9 16.4Government service providers 9.7 8.0 7.2Private non-profit service providers to the household sector2.0 2.0 2.3Total for tertiary industries 59.8 61.6 64.3
Change in Japan’s Industrial Structure (% of GDP)

5Copyright2002: Nomura Research Institute , LTD All Rights Reserved
80.0
100.0
120.0
140.0
160.0
180.0
1981 1983 1985 1987 1989 1991 1993 1995 1997 1999 2001
Service Tertiary Manufacturing
Sectoral Trends in Employment 1981-2001
(1981 = 100)

6Copyright2002: Nomura Research Institute , LTD All Rights Reserved
2.8%
4.7%
1.9%
4.2%
0%
1%
2%
3%
4%
5%
6%
1990 2000
Manufacturing Service
4.0%
2.9%
5.3%4.8%
0%
1%
2%
3%
4%
5%
6%
1990 2000
Manufacturing Service
Business-Opening Ratio Business-Closing Ratio
Business-opening and Business-closing Ratiosin the Manufacturing and Service Industries

7Copyright2002: Nomura Research Institute , LTD All Rights Reserved
20.622.3 22.9
17.6
30.9
0
5
10
15
20
25
30
35
U.S. U.K. France South Korea Singapore
Ratio of Business Services to the Total Economy in Selected Countries
Percent of GDP

8Copyright2002: Nomura Research Institute , LTD All Rights Reserved
BusinessAmount of
outputNumber ofemployees
Number ofestablishment
Laundry, barbers and public bath 82.5% 18.7% 2.8%Parking 96.0% 26.3% 3.1%Other services related to daily living (Note 1) 62.9% 35.5% 19.1%Inns and other accommodations 56.5% 18.2% -13.6%Entertainment (excluding movie and video production) 80.6% 49.4% 17.3%Automobile maintenance 45.5% 21.2% 11.3%Machinery and furniture repairs 150.7% 52.6% 11.9%Rental of goods 81.6% 33.6% 12.6%Movie and video production 81.2% 44.0% 51.3%Broadcasting 63.6% 19.6% 0.7%Information services and investigation 164.6% 42.3% 44.6%Advertising 42.0% 7.2% -3.5%Professional services 121.1% 44.3% 23.9%Other services for businesses (Note 2) 133.2% 64.3% 42.2%Waste disposal 162.3% 60.7% 45.3%Health care 207.3% 125.2% 29.1%Public health and hygiene 244.3% 162.9% 88.1%Social insurance and welfare 135.8% 103.7% 49.2%Education 44.1% 24.9% 36.6%Academic research institutions -5.6% 33.3% 45.0%Religion 66.0% 8.7% 2.3%Political, economic or cultural groups 57.0% 21.7% 11.6%Other services (Note 3 138.1% 95.0% 56.1%
Growth Sectors of the Service Industry (1989-99)

9Copyright2002: Nomura Research Institute , LTD All Rights Reserved
Growth Potential of Service Industries
Rate of return
Chart. Smile Curve
R&D 生産 販売 R&D Production
Value chain
SalesAfter-sale services
Rate of return
Chart. Smile Curve
R&D 生産 販売 R&D Production
Value chain
SalesAfter-sale services

10Copyright2002: Nomura Research Institute , LTD All Rights Reserved
Smile Curves for the Computer Industry Structure of the Value Added in the PC IndustryValue added ratio
Other electronic parts
Semiconductor elements
and integrated
circuits
Data processing and supply
services
0%
5%
10%
Computers Computer auxiliary equipment
Family communications
equipment wholesale
Family communications
equipment retailing
Software Computer leasing
1998
Liquid crystal elements
Structure of the Value Added in the PC IndustryValue added ratio
Other electronic parts
Semiconductor elements
and integrated
circuits
Data processing and supply
services
0%
5%
10%
Computers Computer auxiliary equipment
Family communications
equipment wholesale
Family communications
equipment retailing
Software Computer leasing
1998
Liquid crystal elements
Production valueOther
electronic parts
Semiconductor elements and ICs
Information services
0%
5%
10%
Computers
Computer auxiliary equipment
Family Communications
equipment wholesale
Family communications
Equipmentretailing
Computer leasing
1988
Production valueOther
electronic parts
Semiconductor elements and ICs
Information services
0%
5%
10%
Computers
Computer auxiliary equipment
Family Communications
equipment wholesale
Family communications
Equipmentretailing
Computer leasing
1988

11Copyright2002: Nomura Research Institute , LTD All Rights Reserved
Smile Curve of the Automobile Industry Chart. Smile Curve of the Automobile Industry
0%
5%
10%
Auto parts Enginesand
their parts
Chassis
Auto assembly Automobile wholesale
Automobile retailing
Autorepairs
Autos for hire and taxis
Value added ratio
Production value
0%
5%
10%
Auto parts Engines and
their parts
Auto assembly
Automobilewholesale
Automobile retailing
Auto repairs
Production value
1998
1988
Leasing and rental
Chassis Leasing and rental
Autos forhire and taxis
Chart. Smile Curve of the Automobile Industry
0%
5%
10%
Auto parts Enginesand
their parts
Chassis
Auto assembly Automobile wholesale
Automobile retailing
Autorepairs
Autos for hire and taxis
Value added ratio
Production value
0%
5%
10%
Auto parts Engines and
their parts
Auto assembly
Automobilewholesale
Automobile retailing
Auto repairs
Production value
1998
1988
Leasing and rental
Chassis Leasing and rental
Autos forhire and taxis

12Copyright2002: Nomura Research Institute , LTD All Rights Reserved
Implications from the Smile Curve
•The smile curve varies from industry to industry.
•Power relations among sectors make up the value chains of industries.
•Value added as a whole fell between 1988 and 1998.
• It is possible to change the value chain through innovation.

13Copyright2002: Nomura Research Institute , LTD All Rights Reserved
Evolution toward a Service Economy
Factors on the users’ side:
Individuals:
•Graying of the population.
•Participation of housewives in the labor force.
•Increasing need for continuing education.
Businesses:
• Core competency and outsourcing.
Government:
•Fiscal rehabilitation

14Copyright2002: Nomura Research Institute , LTD All Rights Reserved
Evolution toward a Service Economy
Factors on the suppliers’ side:
• Manufacturers focusing on after-sale services, such as maintenance and leasing
• Companies spinning off head office administration departments to create shared-service companies

15Copyright2002: Nomura Research Institute , LTD All Rights Reserved
Rising hopes pinned on the service industries
To create employment opportunities
To realize a desirable international production network with other Asian countries.
To contribute to strengthening the competitiveness of industries
To realize a rich and worry-free life
16Copyright2002: Nomura Research Institute , LTD All Rights Reserved
Policy measures by the Japanese government
The Cabinet Office:
•Council on Economic and Fiscal Policy
•Industrial Structure Council
Ministry of Economy, Trade and Industry:
•Service Forum
Japan Tourism Advisory Council

17Copyright2002: Nomura Research Institute , LTD All Rights Reserved
•(Workers, %)
•Manufacturing
•Mining•Finance and insurance
•Electricity, city gas, water supply
•Construction
•Real estate
•Transportation, communications
•Services
•Wholesale, retailing
Employment, %
•Manufacturing
•Mining•Finance and insurance
•Electricity, city gas, water supply
•Construction
•Real estate
•Transportation, communications
•Services
•Wholesale, retailing
TFP and the Rate of Increase in Employment Average annual growth rate in employment 1997-2000

18Copyright2002: Nomura Research Institute , LTD All Rights Reserved

19Copyright2002: Nomura Research Institute , LTD All Rights Reserved
• Combining crime-prevention sensors and telecommunications technology.
• Based on the information and communications infrastructure.
• Developed technologies in such areas as:
remote sensing,
image processing,
geographical information system (GIS),
and the application of information technology to finance

20Copyright2002: Nomura Research Institute , LTD All Rights Reserved
• Based on the combination of a physical distribution and delivery system and an information system.
“cool home delivery”
“time designation delivery”
“cash-on-delivery”
• Challenging the government-run postal business
21Copyright2002: Nomura Research Institute , LTD All Rights Reserved
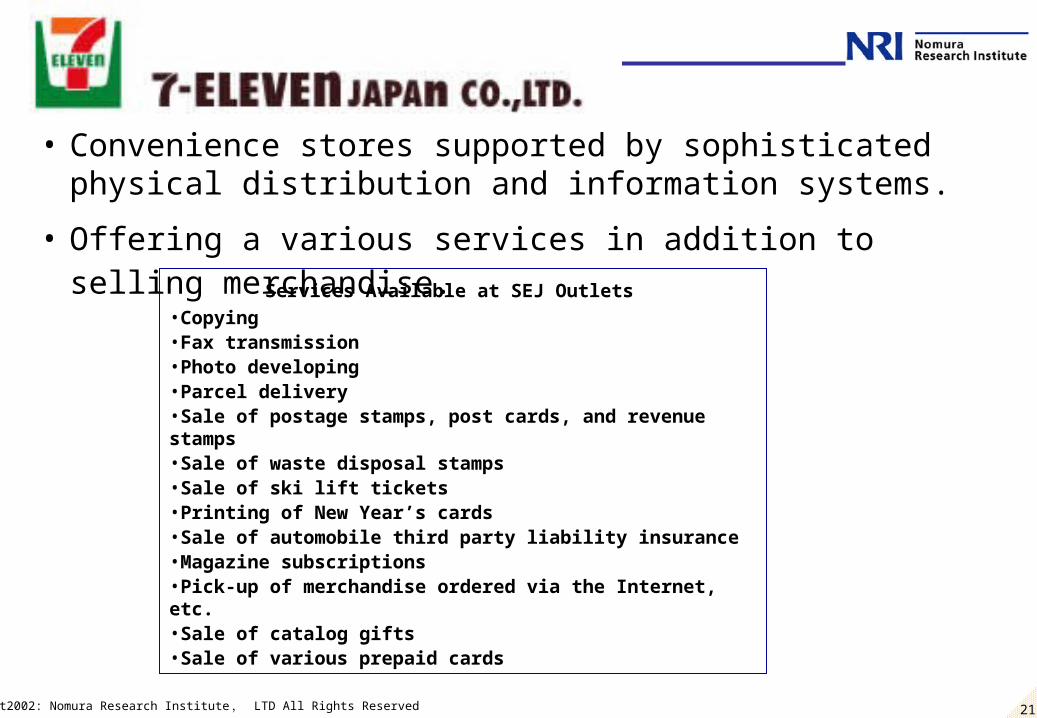
• Convenience stores supported by sophisticated physical distribution and information systems.
• Offering a various services in addition to selling merchandise. Services Available at SEJ Outlets
•Copying •Fax transmission•Photo developing•Parcel delivery•Sale of postage stamps, post cards, and revenue stamps•Sale of waste disposal stamps•Sale of ski lift tickets•Printing of New Year’s cards•Sale of automobile third party liability insurance•Magazine subscriptions•Pick-up of merchandise ordered via the Internet, etc.•Sale of catalog gifts•Sale of various prepaid cards

22Copyright2002: Nomura Research Institute , LTD All Rights Reserved
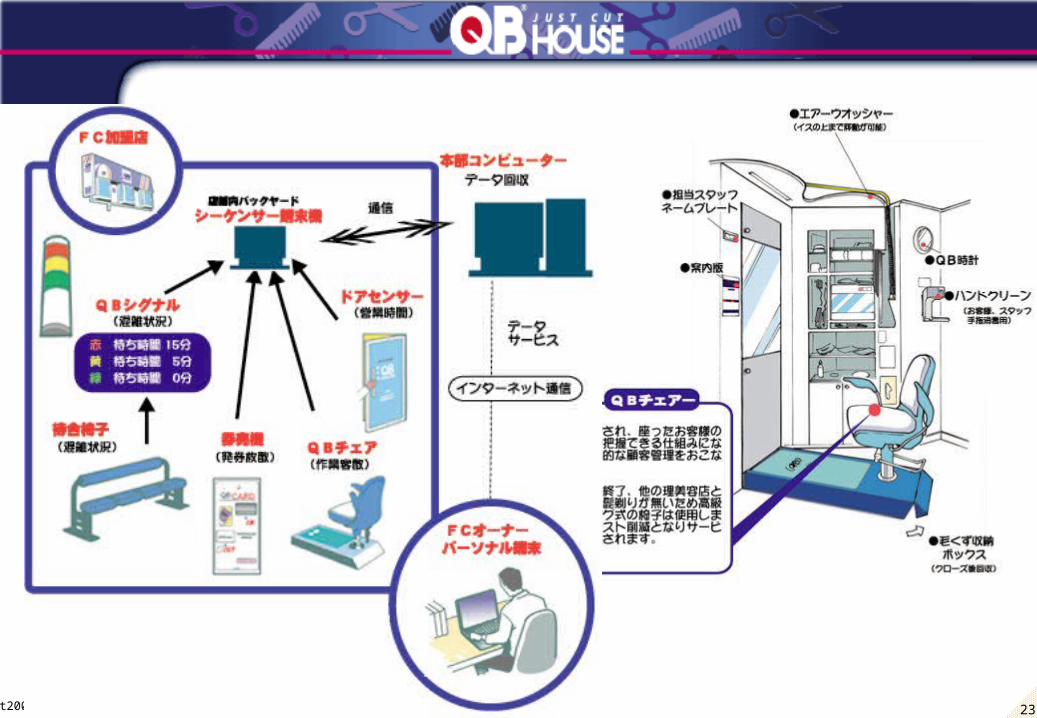
• Barbershop chain operator.
• Based on the concept of \1,000 and 10 minutes.
• Eliminate shampoos, face shaves, and massages.
• Designed a shop system, including utensils and barber’s chairs, that allows efficient and inexpensive service.
• Opened shops in Singapore.
23Copyright2002: Nomura Research Institute , LTD All Rights Reserved
24Copyright2002: Nomura Research Institute , LTD All Rights Reserved
Application of Toyota-model production system
• Dry cleaning and laundry industry: Adopting the “kanban” method to process small lots of various types of clothing resulted in improved finishing, fewer delivery errors, and less damage to clothing.
• Hospitals:Reforming operations based on the concept of eliminating waste, which is the core of the Toyota model, sharply reduced waiting time for patients.

25Copyright2002: Nomura Research Institute , LTD All Rights Reserved
Need for Japanese-model service innovation
• It is essential for service industries to raise labor productivity.
• The development of markets and the creation of demand through innovation should expand the markets for services.
• Service industries need to do business abroad.

26Copyright2002: Nomura Research Institute , LTD All Rights Reserved
The direction of service innovation
Product innovation• Creating new service content.• Requires developing technology to create new services
or developing technologies and know-how to offer services more efficiently.
Process innovation• Building systems that can meet diverse needs and be
efficient. • Chain Operation is such a system.
27Copyright2002: Nomura Research Institute , LTD All Rights Reserved
Future policies for the development of service industries
(1) Develop service technologies
(2) Improve the market environment for service industries
(3) Develop service industry professionals
(4) Promote the internationalization of the service industries

28Copyright2002: Nomura Research Institute , LTD All Rights Reserved
Develop service technologies
Adapt technologies and know-how used in the manufacturing industries.
Develop original technologies for the service industries.
• Ubiquitous network technologies -- IC cards, RFID, etc.
• Data mining • Other information processing
technology • Sensor technology
29Copyright2002: Nomura Research Institute , LTD All Rights Reserved
Improve the market environment for the service industries
Increase competition by eliminating monopoly and removing entry barriers.
Open markets that have been monopolized or heavily regulated by the public sector

30Copyright2002: Nomura Research Institute , LTD All Rights Reserved
Develop service industry professionals
Securing and nurturing manpower with professional capabilities are essential for the development of these industries.
Enhance higher education in the field of services
Develop vocational schools for re-training and re-education of workers.

31Copyright2002: Nomura Research Institute , LTD All Rights Reserved
Promote the internationalization of the service industries
Provide information to help businesses go abroad.
Harmonize systems that affect the business environment in various countries.
Actively promote foreign direct investment in Japan.

32Copyright2002: Nomura Research Institute , LTD All Rights Reserved
Country ( Regional) DifferencesSectoral Share of GDP at Current Market Prices, 1980, 1990, 2000
(Percent)
IndustryAgriculture All Industry Manufacturing only Services
1980 1990 2000 1980 1990 2000 1980 1990 2000 1980 1990 2000
China 30.1 27.0 15.9 48.5 41.6 50.9 44.2 37.0 44.3 21.4 31.3 33.2Hong Kong 0.8 0.3 0.1 31.7 25.3 14.6 23.7 17.6 5.8 67.5 74.5 85.3Indonesia 24.8 19.4 16.9 43.4 39.1 47.3 11.6 20.7 26.0 31.8 41.5 35.8Korea 14.9 8.5 4.6 41.3 43.1 42.7 29.7 28.8 31.5 43.7 48.4 52.7Malaysia … 15.2 8.6 … 42.2 51.7 … 24.2 34.3 … 42.6 39.7Philippines 25.1 21.9 15.9 38.8 34.5 31.1 25.7 24.8 22.6 36.1 43.6 52.9Singapore 1.3 0.4 0.1 38.1 34.4 34.3 29.1 27.1 26.5 60.6 65.3 65.6Taiwan 7.7 4.2 2.1 45.7 41.2 32.4 36.0 33.3 26.3 46.6 54.6 65.6Thailand 23.2 12.5 9.1 28.7 37.2 41.7 21.5 27.2 33.4 48.1 50.3 49.2
Japan 3.0 2.0 41.0 36.0 28.0 24.0 56.0 62.0
Source: ADB, Asian Development Outlook 2001. World Bank, World Development Indicators 2001.