coral cay conservation proposed marine protected …proposed... · were entirely absent from the...
TRANSCRIPT

1 | P a g e © Coral Cay Conservation
2013
Coral Cay Conservation
Proposed Marine Protected Area Report
Cagbungalon
Cagbungalon Liloan, Southern Leyte, The Philippines
June 2014
Head of Science: Alex Ferguson, head of [email protected]
Project Scientist: Laura Foley, [email protected]

2 | P a g e © Coral Cay Conservation
2013

1 | Page © Coral Cay Conservation 2013
TABLE OF CONTENTS
EXECUTIVE SUMMARY .......................................................................................................................... 2
ACKNOWLEDGEMENTS ......................................................................................................................... 3
LIST OF ACRONYMS AND ABBREVIATIONS ............................................................................................... 3
CORAL CAY CONSERVATION .................................................................................................................. 4
1. INTRODUCTION ............................................................................................................................... 5
1.1. Marine Protected Areas ..................................................................................................... 5
1.2. Coral Reefs & Marine Conservation in the Philippines ..................................................... 6
1.3. Characterization of Study Region ....................................................................................... 7
1.3.1. Sogod Bay ..................................................................................................................... 7
1.3.2. Cagbungalon, Proposed MPA Site ................................................................................ 8
2. METHODS..................................................................................................................................... 10
2.1. Biophysical Survey ............................................................................................................ 10
2.1.1. Fish ............................................................................................................................... 11
2.1.2. Invertebrates .............................................................................................................. 12
2.1.3. Substrate ..................................................................................................................... 12
2.1.4. Impacts ....................................................................................................................... 12
2.2. Data Analysis ..................................................................................................................... 13
3. RESULTS ....................................................................................................................................... 14
3.1 Fish.................................................................................................................................. 14
3.2 Invertebrates ................................................................................................................... 17
3.3 Substrate ......................................................................................................................... 19
3.4 Impacts ............................................................................................................................ 21
4. VISUAL ASSESSMENT ...................................................................................................................... 22
5. DISCUSSION .................................................................................................................................. 26
6. RECOMMENDATIONS ..................................................................................................................... 28
APPENDIX A: TARGET SPECIES LISTS ..................................................................................................... 32
APPENDIX B - SPECIES ABUNDANCE GRAPHS .......................................................................................... 35

2 | P a g e © Coral Cay Conservation 2013
EXECUTIVE SUMMARY Coral Cay Conservation conducted an assessment of the reef fish, invertebrates,
substrates and anthropogenic impacts at Barangay Cagbungalon in the Municipality of Liloan. The site is proposed as a potential MPA.
An enhanced Reef Check methodology was used to survey six 100m transects, each containing four 20m replicates. The transects were equally divided between 6m and 12m depths.
Abundance and diversity of fish families and species varied significantly between
survey sites. Overall fish abundance was significantly higher at sites 2 and 5.
Abundance and diversity of invertebrate species varied significantly between sites. The diversity of invertebrates was significantly greater at site 4.
Sand was the most commonly recorded substrate across the survey area followed by rock and hard coral. Generally hard coral cover was higher on sites towards the northern end of the surveys area.
Commercially important fish families including Barracuda, Emperors and Sweetlips were entirely absent from the surveys. Others including Grouper and Snapper were only recorded in low numbers and individuals were generally small in size.
Instances of damaging impacts such as trash, discarded fishing gear and boat damage were generally recorded in low abundance.
The reef appears in good health although lack of commercially important fish and invertebrate species indicates that overfishing may be a threat to the area.
It is recommended that consultation be started between the local community,
municipal and provincial government and CCC on the creation of an MPA at the northern end of the surveyed area to incorporate the areas of highest diversity, abundance and coral cover.
The reef at Cagbungalon is home to a wide array of marine life that is attractive to
divers and has great potential as a dive site. Not only will the establishment of an MPA improve local fish stocks, it will also bring the potential for increased income through dive tourism.

3 | P a g e © Coral Cay Conservation 2013
ACKNOWLEDGEMENTS Coral Cay Conservation would like to express our gratitude to the Provincial Government of Southern Leyte (PGSL). Our work would not be possible without the support of the Provincial Environmental and Natural Resource Management Office (PENRMO) and other members of the PGSL. We would also like to thank the Barangay Council of Cagbungalon and the Municipality of Liloan for facilitating the MPA assessment. In particular we would like to acknowledge the cooperation of Sir Terance Dipay, Liloan Municipal Agriculturalist and Ma’am Beney Dipay, Liloan Municipal Agricultural Technician. We would also like to thank our trained volunteers and staff who collected the data during this proposed MPA assessment.
LIST OF ACRONYMS AND ABBREVIATIONS CCC : Coral Cay Conservation
CoTs : Crown of Thorns Seastars (Ancanthaster planci)
GPS : Global Positioning System
IEC : Information, Education, Communication
LGU : Local Government Unit
MPA : Marine Protected Area
MPA MEAT : MPA Management Effectiveness Assessment Tool
MWU : Mann-Whitney U test
NIA : Nutrient Indicator Algae
NIPAS : National Integrated Protected Area System
PGSL : Provincial Government of Southern Leyte
PRRCFI : Philippines Reef and Rainforest Conservation Foundation Inc.
RKC : Recently Killed Coral
SE : Standard Error

4 | P a g e © Coral Cay Conservation 2013
CORAL CAY CONSERVATION Coral Cay Conservation (CCC) is a not for profit organisation, founded in 1986 by a British scientist. CCC’s mission is:
“Providing resources to help sustain livelihoods and alleviate poverty through the protection, restoration and management of coral reefs and tropical forests.”
In order to achieve this mission, CCC has carried out conservation projects all over the world, including in the Philippines, Belize, Honduras, Malaysia, Cambodia and Fiji. CCC successfully set up Marine Protected Areas and provided scientific data that has been used to manage local marine resources. Since 1995, CCC has worked with the Philippine Reef and Rainforest Conservation Foundation Inc. (PRRCFI) and local communities to survey and safeguard reef and rainforest areas in the Philippines. To date these have included coastal regions of the Southern Negros Occidental, Anilao, Palawan, Danjugan Island and the forests of North Negros. The project in Danjugan Island in the Philippines between the years 1996-1999 was particularly successful and the reefs around the island received the accolade of Best Managed Reef in the Philippines in 2002.
At the invitation of the Provincial Government of Southern Leyte, CCC began its survey work in Sogod Bay in September 2002. CCC is conducting a collaborative program to survey the region's coral reefs and provide training and conservation education opportunities for project counterparts. The aim is to develop local capacity and ensure the long-term protection and sustainable use of marine resources throughout Southern Leyte.

5 | P a g e © Coral Cay Conservation 2013
1. INTRODUCTION 1.1. Marine Protected Areas Marine resources have come under increasing pressure from an ever growing world population (Jackson et al. 2001). Strong declines in catch from fisheries worldwide, such as the North Atlantic Cod (Myers et al 1997) and reef fisheries in the Caribbean (Hardt 2009), have illustrated that biological marine resources are limited (Jackson et al. 2001; Pauly et al. 2002). Additional pressures such as pollution, coastal development and the effects of climate change contribute to the stress the marine environment is under. This has given rise to the increased drive for conservation efforts and resource management in the marine environment (Wood et al. 2008; CBD 2010). Marine protected areas (MPAs) can achieve conservation and resource management targets simultaneously and are therefore considered instrumental to sustainable ocean utilization (Pauly et al. 2002). The International Union for the Conservation of Nature (IUCN) defines a MPA as:
“A clearly defined geographical space, dedicated and managed, through legal or other effective means, to achieve the long-term conservation of nature with the
associated ecosystem services and cultural values.”
Figure 1 - Schematic diagram of MPA functioning. Protected inside the MPA fish grow larger and produce more offspring, this leads to ‘overspill’, increasing fish numbers outside the MPA. In addition, the corals inside the MPA are not disturbed by direct human impacts.
MPAs have become vital tools in conserving marine resources, not only for their own intrinsic value but also for the services they can provide humanity. The ecosystem within the MPA, if left undisturbed for an extended amount of time, has the potential to provide a
Fish Sanctuary Reserve area with limited fishing allowed
Larval and fish dispersal

6 | P a g e © Coral Cay Conservation 2013
sustainable supply of goods - such as fish, algae and salt - and services - such as shoreline protection, maintaining water quality and recreation (World Bank 2005). Increased fish catch is perhaps the most sought after potential benefit of MPAs. There are two ways that this can happen, through overspill and larval export (Figure 1). In areas where there is the potential for increasing tourism and therefore increased anthropogenic pressure on the marine environment for food, recreation and other resources, the benefits and necessities of having a network of functioning MPAs are increased. However, the success of MPAs is for a large part dependent on the willingness of local people to adhere to the rules. Experience from around the world has shown that closely involving the community in the planning, implementation and management of their own MPA can increase their sense of ownership and pride. Only when the local stakeholders feel their concerns are taken seriously and they are consulted on management of the MPA regularly, will it be possible for the full beneficial potential of the MPA to be attained (Green et al. 2009, Human and Davies 2010). 1.2. Coral Reefs & Marine Conservation in the Philippines The Philippines lies within a region known as the Coral Triangle. The Coral Triangle, which includes Indonesia, Malaysia, Papua New Guinea, Timor-Leste and the Solomon Islands, is recognized as the global centre of marine biodiversity (Roberts et al. 2002). It is home to the oldest coral reefs in the world and the largest expanses of mangrove forest. More than 75% of the known coral species and over 30% of all the coral reefs in the world are found in the Coral Triangle (Veron et al. 2009). The same extraordinary diversity is found in the other types of marine creatures; with over 3,000 species of fish recorded, even higher figures for molluscs and new species still being discovered regularly (Allen 2008). The waters of the Philippines contain roughly 25,000 km2 of coral reefs. An estimated 60% of the country’s 95 million citizens live in coastal regions, i.e. in close proximity to coral reefs, and over half of the consumed animal protein comes from marine sources (CTI 2012). This heavy reliance on marine resources has caused large areas of coral reef ecosystems to become threatened. In 1980 33% of coral reefs were characterized as being in poor condition, in 2008 this figure had increased to 40% (Wilkinson 2008). These figures make a strong case for increased marine conservation efforts. Legislation concerning marine conservation in the Philippines is one of the more advanced within the Coral Triangle (Jacinto et al. 2000). Some important laws include:
1998 Fisheries Code (Republic Act 8550): 15% of municipal water should be within a MPA
Marine and Coastal Resource Protection Act: Each municipality should have at least one MPA that is bigger than 10 hectares (if the total municipal waters are larger than 15 hectares)
The Philippine Marine Sanctuary Strategy (2002): By 2020, 10% of all the Philippine marine waters will be fully protected

7 | P a g e © Coral Cay Conservation 2013
Currently there are about 1,640 MPAs in the Philippines. Of these MPAs, 33 have been declared at national level as NIPAS sites and the remainder is managed by Local Government Units. Box 1 highlights a case study of successful MPAs in the Philippines.
1.3. Characterization of Study Region 1.3.1. Sogod Bay The coral reefs of Southern Leyte remain some of the least disturbed habitats in the Philippines. Sogod Bay is an important fishing ground and the area is rich in tuna, flying fish, herrings, anchovies, shell-fish and Spanish mackerel. The bay has been targeted by the Fisheries Sector Program of the Department of Agriculture as one of the country’s ten largest bays in need of assessment and management (Calumpong et al. 1994). Sogod Bay is also a feeding ground for attractive mega-fauna such as pilot whales, melon-headed whales,
The MPAs at Apo Island and Sumilon Island are some of the best-known examples of successful tropical marine conservation efforts in the world. Years of monitoring provided accurate data that shows what can be achieved if the coral reef inside a MPA is given the chance to recover (Figure 2). These figures also show that although an increase of biomass was observed in the first years of reserve protection, the biggest increase in biomass took several years to become evident (5-10 years). Unequivocal evidence of overspill from these MPAs remains elusive but the
increased number and size of fish within the reserves make it likely that the MPAs were a source for net larval export, which aided recovery of fish stocks in the area. Indirect positive effects of the effective management of these MPAs include increased tourism income and elimination of unsustainable fishing practices such as dynamite fishing (Russ and Alcala 2004).
Figure 2 - Observed and projected increase in mean biomass of commercially important species of fish inside the MPAs at
Apo Island and Sumilon Island. Figure from: Russ and Alcala (2004).
Box 1 - Case study of successful MPAs in the Philippines: Apo Island & Sumilon Island

8 | P a g e © Coral Cay Conservation 2013
dolphins, manta rays and whale sharks. The bay is characterised by naturally limited mangrove areas, narrow fringing coral reefs, limited seagrass beds and narrow intertidal areas and beaches (Calumpong et al. 1994). Depths in the bay reach a maximum of approximately 1,400 metres in the central channel. Currently there are 23 established MPAs within Sogod Bay covering an estimated 170 hectares. These figures will increase in the coming years as more MPAs are currently being set up. The size of the MPAs ranges from 2 hectares (Maujon/Juangon Fish Sanctuary) to 45 hectares (Limasawa Fish Sanctuary), with a mean average size of 8.7 hectares (±2.1 SE) and a median average of 5 hectares. The sizes for several MPAs are not known, as accurate GPS coordinates are not available. In 2013 under the new Governor, the Honourable Roger G. Mercado, a drive for increased tourism within Southern Leyte is high on the agenda. Currently dive tourism is located predominantly in the Municipalities of Padre Burgos, Malitbog and Macrohon with only one dive centre on the eastern side of Sogod Bay, in Pintuyan Municipality. Divers worldwide are very appreciative of marine conservation efforts and will willingly pay to dive in protected areas if they are well managed (Peters and Hawkins, 2009). In Bonaire, part of the Netherland Antilles, users of the National Marine Park pay an annual fee of US $25 (based on figures from 2014) to dive inside the reserve. A study by Thur (2010) suggested that divers would actually be willing to pay a greater annual fee up to US $134 under the condition that the money is used to enhance conservation management. The dive industry in Sogod Bay is mostly seasonal and the South-West monsoon followed by the North-East monsoon can make for unpredictable conditions at sea. In comparison to its neighbouring islands to the west, Bohol and Cebu, the diving in Southern Leyte is still relatively unknown to tourists despite its beautiful dive sites and incredible marine creatures. Other tourism attractions in the area are relatively few, though another key event is the seasonal visits of majestic Whale Sharks (Rincodon typus) at the mouth of the bay. At this time, many aspects of tourism are being expanded in conjunction with improved infrastructure. 1.3.2. Cagbungalon, Proposed MPA Site Surveys of the Cagbungalon Proposed MPA, were requested by Municipal Agricultural Office of Liloan and the Barangay Council of Cagbungalon with an interest in designating the reef in part, or wholly, as an MPA. The site is located in the Municipality of Liloan, in the waters of the barangay Cagbungalon. Currently, few divers visit the area and the site is not popular or known to local dive operators. The area surveyed was to the northern end of the barangay’s waters, transects were between 60 and 700 metres from a river mouth and between 60 and 90 metres from shore (Figure 3).

9 | P a g e © Coral Cay Conservation 2013
Figure 3 - Map showing the location of Cagbungalon survey sites

10 | P a g e © Coral Cay Conservation 2013
2. METHODS
2.1. Biophysical Survey The assessment of the proposed MPA was conducted using an enhanced Reef Check method. The Reef Check methodology is widely recognised and is used to survey coral reefs around the world. It was developed in the 1990s with the aim of gathering as much data as possible about the global status of coral reefs (Hodgson 1999). The data from around the world is analysed on a yearly basis and updates about the status of coral reefs are published. Reef Check provides a general picture of the ecological status of a reef and the human impacts affecting it. CCC has augmented the methodology by adding additional target species of fish, coral and other invertebrates to better reflect the high biodiversity of the area (see Appendix A for target species). Survey transects were conducted at depths of 6 metres and 12 metres (Table 1), along the outer reef on a North-South bearing and also adjacent to the reef wall. To provide a full overview of the area three transects were completed at 6 metres and three at 12 metres. Each transect was 100 metres long and divided into 4 replicates of 20 metres each. Between each replicate there was a 5 metre gap where no data was recorded. This survey set up allows for robust statistical analysis of the collected data. Table 1 - GPS coordinates and depths for the ten survey sites
Site Number Depth (m) Easting (UTM) Northing (UTM)
1 12 731862 1118586 2 12 731856 1118943 3 12 731891 1119233 4 6 731884 1118578 5 6 731869 1118918 6 6 731902 1119246
11 | P a g e © Coral Cay Conservation 2013
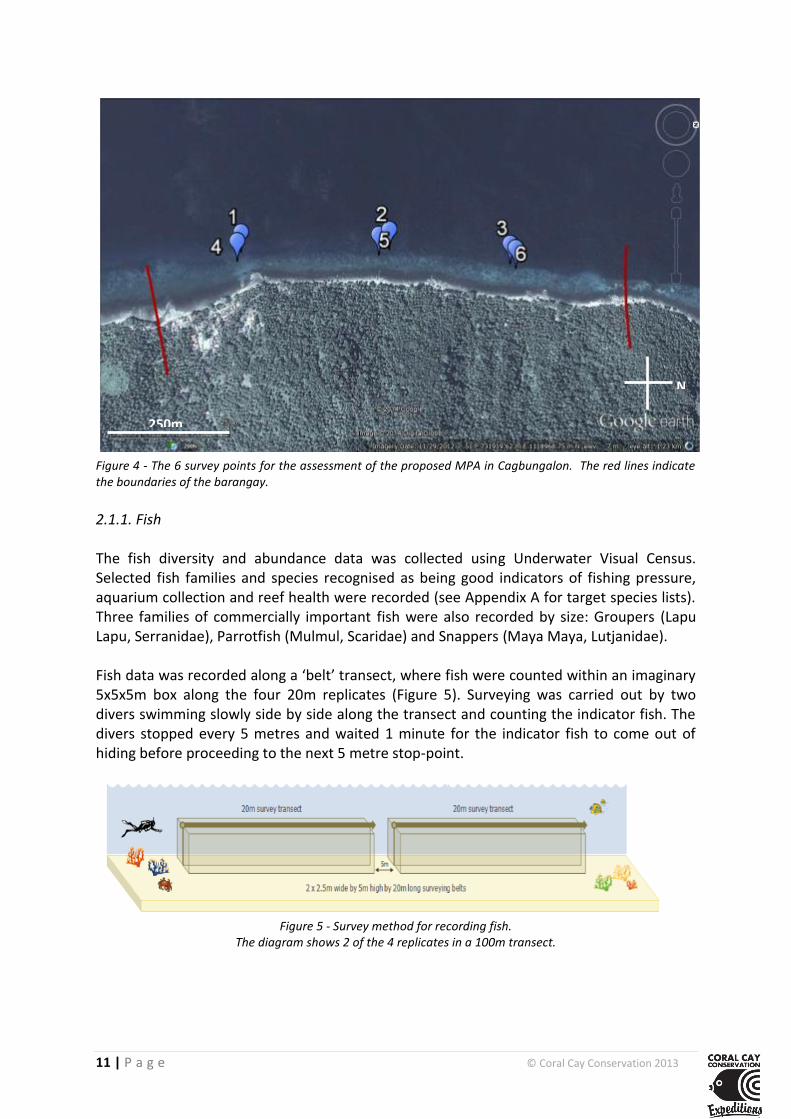
Figure 4 - The 6 survey points for the assessment of the proposed MPA in Cagbungalon. The red lines indicate the boundaries of the barangay.
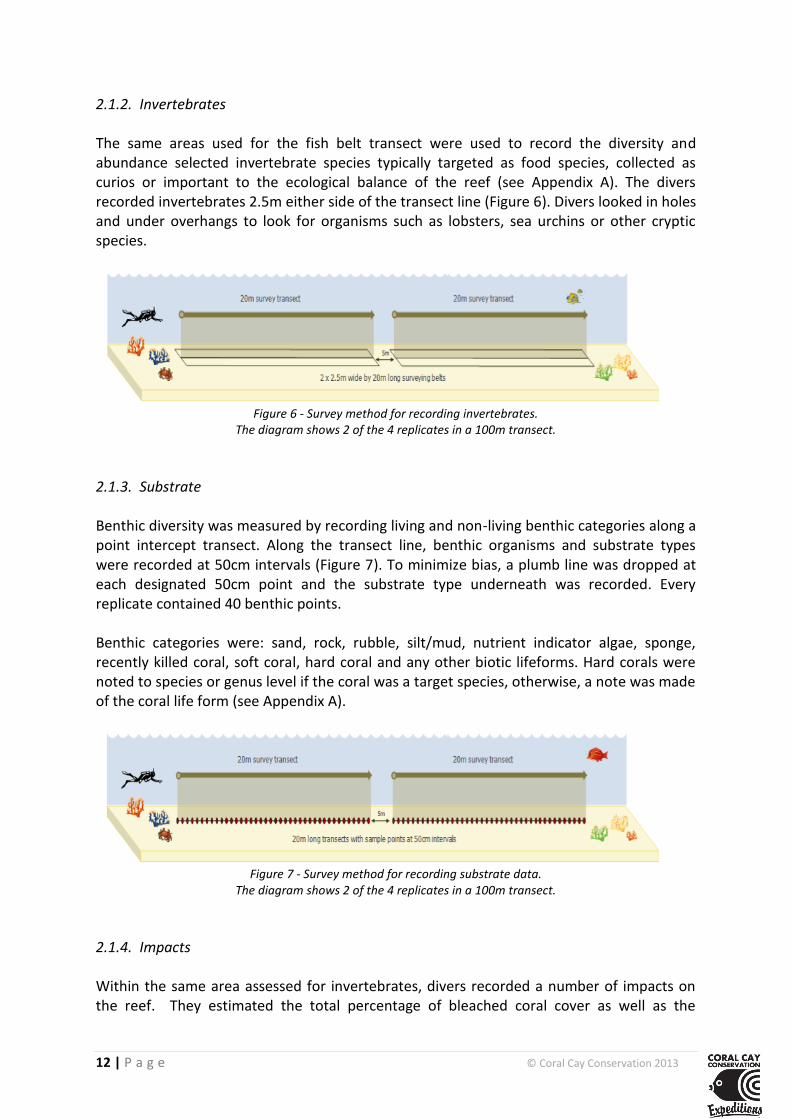
2.1.1. Fish The fish diversity and abundance data was collected using Underwater Visual Census. Selected fish families and species recognised as being good indicators of fishing pressure, aquarium collection and reef health were recorded (see Appendix A for target species lists). Three families of commercially important fish were also recorded by size: Groupers (Lapu Lapu, Serranidae), Parrotfish (Mulmul, Scaridae) and Snappers (Maya Maya, Lutjanidae). Fish data was recorded along a ‘belt’ transect, where fish were counted within an imaginary 5x5x5m box along the four 20m replicates (Figure 5). Surveying was carried out by two divers swimming slowly side by side along the transect and counting the indicator fish. The divers stopped every 5 metres and waited 1 minute for the indicator fish to come out of hiding before proceeding to the next 5 metre stop-point.
Figure 5 - Survey method for recording fish.
The diagram shows 2 of the 4 replicates in a 100m transect.
250m
N
12 | P a g e © Coral Cay Conservation 2013
2.1.2. Invertebrates The same areas used for the fish belt transect were used to record the diversity and abundance selected invertebrate species typically targeted as food species, collected as curios or important to the ecological balance of the reef (see Appendix A). The divers recorded invertebrates 2.5m either side of the transect line (Figure 6). Divers looked in holes and under overhangs to look for organisms such as lobsters, sea urchins or other cryptic species.
Figure 6 - Survey method for recording invertebrates.
The diagram shows 2 of the 4 replicates in a 100m transect.
2.1.3. Substrate Benthic diversity was measured by recording living and non-living benthic categories along a point intercept transect. Along the transect line, benthic organisms and substrate types were recorded at 50cm intervals (Figure 7). To minimize bias, a plumb line was dropped at each designated 50cm point and the substrate type underneath was recorded. Every replicate contained 40 benthic points. Benthic categories were: sand, rock, rubble, silt/mud, nutrient indicator algae, sponge, recently killed coral, soft coral, hard coral and any other biotic lifeforms. Hard corals were noted to species or genus level if the coral was a target species, otherwise, a note was made of the coral life form (see Appendix A).
Figure 7 - Survey method for recording substrate data.
The diagram shows 2 of the 4 replicates in a 100m transect.
2.1.4. Impacts Within the same area assessed for invertebrates, divers recorded a number of impacts on the reef. They estimated the total percentage of bleached coral cover as well as the

13 | P a g e © Coral Cay Conservation 2013
estimated percentage of each individual coral colony that was bleached. Coral diseases were recorded as a percentage of the colony infected and where possible, the disease was identified. Coral damage was recorded in three categories: boat/anchor, dynamite and other, on a categorical scale from 0 to 3 (0 = none, 1=low, 2= medium, 3 = high). Impact on the site from trash was recorded on the same scale and separated into general and fishing nets/traps. 2.2. Data Analysis Each 20m replicate was treated as an independent sample. This produced n=12 at 6 metres and n=12 at 12 metres. Each of the 6 sites surveyed was analysed independently and compared to the other sites in order to establish which areas of the reef are particularly healthy and which are not, with the view of being able to recommend suitable areas to be protected. To test for statistically significant differences between sites and depths, Mann-Whitney U (MWU) tests were used. Preliminary inspection of the data revealed that the variances were not homogeneous and the data had a non-normal distribution. Transformations of the data did not sufficiently alter this to warrant using a parametric test. Species diversity of fish and invertebrates was calculated using the Fishers α index. These index values too were then submitted to the Mann-Whitney U test to check for significant differences

14 | P a g e © Coral Cay Conservation 2013
3. RESULTS The assessment of the Cagbungalon proposed MPA was conducted between the 22nd of April and the 2nd of May 2014. It was conducted over 16 dives by trained volunteer survey teams from Coral Cay Conservation. In general, the weather throughout the survey period was sunny, with no major weather systems moving through the region. On average the air temperature was 30.3°C, the water temperature was 27.9°C at the surface and 27.5°C at 3m and 27.3°C at 10m. Estimated horizontal visibility was 17.3m on average. 3.1 Fish Fish abundance at Cagbungalon (Figure 8) was highest at sites 2 and 5 with 66.0 ± 29.4 fish per 500m3 and 73.8 ± 32.8 fish per 500m3 respectively. Sites 1 and 4 had the lowest abundance with 24.5 ± 20.4 fish per 500m3 at site 1 and 23.3 ± 9.9 fish per 500m3 at site 4. Sites 1 and 4 are located to the south and close to the mouth of the small river found at Cagbungalon. It is likely that natural distributions in bottom cover explain the observed differences in fish abundances and variations in substrate cover will be discussed in further detail in section 3.1.3. Sites 2 and 5 were found to have significantly higher fish abundance than other areas of the reef (Figure 9). When running statistical analysis on fish abundance, the number of gobies and fusiliers were removed from the data set. Neither of these species are indicator species and both of these fish are often found in large groups which can skew the overall abundance values. High abundances of cardinalfish and angelfish found at site 5 contribute to the high fish abundance observed there. Site 5 had significantly more cardinal fish than all sites (p <=0.03) and was also found to have significantly higher levels of angelfish than sites 2, 3, 4, and 6 (p<=0.04).

15 | P a g e © Coral Cay Conservation 2013
Figure 8 – Average fish abundance at each site. Data are mean number of individuals per replicate, error bars are standard error of the mean.
1 2 3 4 5 6
1 -
2 + + +
3
4 - -
5 + +
6 - -
Figure 9 - Matrix showing significant differences in fish abundance between sites. ‘+’ significantly higher at site on the left compared to site at the top (p<0.05). ‘-‘ significantly lower at site on the left compared to site at the top (p<0.05). Blank cells indicate no significant difference.
To determine fish diversity, the Fisher’s alpha value was calculated (goby and fusilier counts were included in the analysis) (Figure 10). Site 6 had the highest fish diversity with a Fisher’s α value of 5.6 ± 1.3 and was found to be significantly higher than site 1 (p=0.2; Figure 11). Site 6 was the only site where stonefish were observed, and one of the few where pipefish, pufferfish, triggerfish, and porcupine fish were seen. Site 1 was found to have significantly lower diversity than all sites other than site 3 with a Fisher’s α value of 1.7 ± 0.4. In the same manner as fish abundance, the low diversity at site 1 is likely due to the limited about of reef structure and fish habitat.
0
20
40
60
80
100
120
1 2 3 4 5 6
Tota
l Fis
h A
bu
nd
ance
pe
r 5
00
m2
Site

16 | P a g e © Coral Cay Conservation 2013
Figure 10 – Average fish diversity (Fisher’s α) at each site. Data are mean number of individuals per replicate, error bars are standard error of the mean.
Figure 11 - Matrix showing significant differences in fish diversity between sites. ‘+’ significantly higher at site on the left compared to site at the top (p<0.05). ‘-‘ significantly lower at site on the left compared to site at the top (p<0.05). Blank cells indicate no significant difference.
0
1
2
3
4
5
6
7
8
1 2 3 4 5 6
Fish
Div
ers
ity
(Fis
he
r's
α)
Site
1 2 3 4 5 6
1 - - - -
2 +
3
4 +
5 +
6 +

17 | P a g e © Coral Cay Conservation 2013
Large commercially important fish species, including Snapper, Grouper and Parrotfish were small in size and were in low numbers and in regards to biomass (Figure 12). Snapper, Grouper, and Parrotfish were observed with abundances of 1.67 ± 0.42; 0.42 ± 0.13, and 5.04 ± 1.46 respectively per 500m3 inside the survey area. All observed individuals were less than 40 cm. Parrotfish were the most abundant, although 18% of individuals observed during this study were below 10cm and 82% of all observed Parrotfish were between 11-20cm. Only four Parrotfish greater than 31cm were observed. Similar trends were seen in Groupers and Snappers. The mean average biomass of these species inside the MPA was low at 0.014 ± 0.013 kg/500m3, 0.106 ± 0.050 kg/500m3, and 0.759 ± 0.750 kg/500m3 respectively for Grouper, Snapper, and Parrotfish species (Figure 12). Biomass of Snapper and Parrotfish were highest at site 2 at 0.284 ± 0.161 kg/500m3 and 3.029 ± 2.028 kg/500m3
respectively. Biomass of Grouper species was highest at site 5 at 0.022 ± 0.016 kg/500m3. The low biomass described and the absence of large, commercially important individuals and species indicate that overfishing may be occurring in the area. Overfishing is further discussed in section 5.4.
Figure 12 - Biomass of Grouper, Snapper, and Parrotfish observed at each site.
3.2 Invertebrates
Invertebrate abundance was highest at sites 2 and 5, with 152.0 ± 21.4 invertebrates per 100m2 at site 2 and 125 ± 20.7 invertebrates per 100m2 found at site 5 (Figure 13). Site 2 was found to have a significantly higher amount of invertebrates than sites 4 and 6 (p=0.02). Increased amounts of feather stars and Linkia laevigata account for the higher number of inverts at site 2 while brittle stars and other gastropods account for the high invertebrate abundance at site 5. Site 4 was found to have the lowest number of invertebrates with 73.0 ± 2.9 invertebrates per 100m2. Although site 4 was low in overall invertebrate abundance, there were more nudibranchs, topshells, and Crown-of-Thorn seastars observed here than at other sites.
0
1
2
3
4
5
6
1 2 3 4 5 6
Bio
mas
s (k
g/5
00
m3 )
Site
Grouper
Snapper
Parrotfish

18 | P a g e © Coral Cay Conservation 2013
Figure 13– Average invertebrate abundance at each site. Data are mean number of individuals per replicate, error bars are standard error of the mean.
Figure 14 - Matrix showing significant differences in invertebrate abundance between sites. ‘+’ significantly higher at site on the left compared to site at the top (p<0.05). ‘-‘ significantly lower at site on the left compared to site at the top (p<0.05). Blank cells indicate no significant difference.
Although site 4 had the fewest number of invertebrates it was found to have the highest diversity at a Fisher’s alpha value of 4.7 ± 0.5 and is significantly higher than all sites (Figure 15 & 16). A few of the rarer invertebrates, including Banded Coral Shrimp, Cowrie, Pencil Urchins, and Giant Clams were spotted during the survey on site 4 and account for the increased diversity at this site. Invertebrate diversity at site 1 was the lowest with a Fisher’s α value of 2.1 ± 0.6. Diversity at site 1 is significantly lower than sites 4, 5, and 6 (p-value <0.05).
1 2 3 4 5 6
1
2 + +
3
4 -
5
6 -
0
20
40
60
80
100
120
140
160
180
200
1 2 3 4 5 6
Nu
mb
er
of
Inve
rte
bra
tes
pe
r 1
00
m2
Site

19 | P a g e © Coral Cay Conservation 2013
Figure 15 – Average fish diversity (Fisher’s α) at each site. Data are mean number of individuals per replicate, error bars are standard error of the mean.
Figure 16 - Matrix showing significant differences in invertebrate diversity between sites. ‘+’ significantly higher at site on the left compared to site at the top (p<0.05). ‘-‘ significantly lower at site on the left compared to site at the top (p<0.05). Blank cells indicate no significant difference.
3.3 Substrate Sand was the most abundant substrate in the area followed by rock and hard coral (Figure 17). Site 5 had the highest amount of coral cover (40.0%) and was significantly higher in hard coral cover than all sites accept 6 (p < 0.05; Figure 18). At 72.5% sand, site 1 had significantly higher amounts of sand than sites 2, 5, and 6. Likewise, site 1 had the least amount of hard coral cover at 8.1%.
0
1
2
3
4
5
6
1 2 3 4 5 6
Inve
rte
bra
te d
ive
rsit
y (F
ish
er'
s α
)
Site
1 2 3 4 5 6
1 - - -
2 -
3 - -
4 + + + + +
5 + -
6 + + -

20 | P a g e © Coral Cay Conservation 2013
Figure 17 - Mean substrate percentage cover at each survey site. Data are mean average per replicate. HC – Hard coral; SC – Soft coral; SP – Sponge; RKC – Recently killed coral; RC – Rock; RB – Rubble; SD – Sand; SI – Silt/mud; NIA – Nutrient indicator algae; OT – Other living organisms.
A B
Figure 18 - Matrix showing significant differences in percentage of sand (A) and hard coral cover (B) between sites. ‘+’ significantly higher at site on the left compared to site at the top (p<0.05). ‘-‘ significantly lower at site on the left compared to site at the top (p<0.05). Blank cells indicate no significant difference.
Non target massive corals and non-target branching corals contributed to the majority of the hard coral cover at Cagbungalon, with 17.9% and 14.0% respectively. 21 hard coral target species were observed in Cagbungalon with Massive porites accounting for 11.8% of hard coral observed and Porites cylindrica accounting for 9.7%. Favia sp and Diploastria heliopora were also abundant countributing to 3.2% and 2.9% of total hard coral cover. 13 target species were found at site 5, the site with the highest hard coral diversity. Site 1 had the lowest coral diversity and only 4 hard coral target species were observed there. Acropora was only found as the branching lifeform and only contribute to 2.2% of the hard corals observed in in the survey area.
0%
10%
20%
30%
40%
50%
60%
70%
80%
90%
100%
1 2 3 4 5 6
% S
ub
stra
te C
ove
rage
Site
OT
NIA
SD
RB
SI
RC
RKC
SP
SC
HC
1 2 3 4 5 6
1 -
2 -
3 - -
4 -
5 + + + +
6 +
1 2 3 4 5 6
1 + + +
2 - -
3 + + + +
4 -
5 - -
6 - -

21 | P a g e © Coral Cay Conservation 2013
3.4 Impacts The reefs at Cagbungalon were healthy and showed few signed of anthropogenic impacts. No damage from anchors or dynamite fishing was observed on any of the survey sites, and coral damage through other causes was minimal and only observed on sites 1, 2, and 3 at an average less than 1 instance per 100m2. Discarded fishing gear and other fishing related trash was also minimal and observed at less than 1 instance per 100m2 for sites 1-4 and was not observed at all on sites 5 and 6. All sites had minimal amounts of general trash present. Site 4 had the highest level of trash with an average of 3 pieces found per 100m2. An average of 1.75 pieces of trash per 100m2 was found on sites 2 and 5 and sites 1 and 3 had an average of 1 piece of trash per 100m2. Site 6 had the least amount of trash with an average of 0.25 pieces per 100m2. The minimal anthropogenic impacts observed at Cagbungalon further support the findings that the health of the reefs here are in overall good health.

22 | P a g e © Coral Cay Conservation 2013
4. VISUAL ASSESSMENT Underwater photographs were taken to provide the reader and the community with an idea of the beauty observed on the reefs at Cagbungalon.
Figure 19 – Healthy coral heads at Cagbungalon
Figure 20 – Branching coral and anemones provide homes for many reef fish.

23 | P a g e © Coral Cay Conservation 2013

24 | P a g e © Coral Cay Conservation 2013
Figure 21 – Many species of nudibranchs were observed during the survey in Cagbungalon
Figure 22 – A frog fish hides in branching Acropora species.

25 | P a g e © Coral Cay Conservation 2013
Figure 23 – A well camouflaged scorpionfish is a joy for divers to discover!
Figure 24 – Featherstars were abundant throughout the reefs at Cagbungalon

26 | P a g e © Coral Cay Conservation 2013
5. DISCUSSION The reefs at Cagbungalon appear to be in good health and suitable for the creation of a Marine Protected Area. Fish and invertebrate abundance and diversity varied between sites but were generally high. The southern survey sites had generally lower fish and invertebrate abundance and diversity which is likely due to the increased level of sand in the area. Little evidence of detrimental anthropogenic activity was seen during the survey. General household trash was the largest threat to the reef, although the amount of trash observed was minimal. While the reefs here appear healthy, the absence of commercially important invertebrate and fish species and the lack of larger fish indicate fishing pressures in the area. The creation on an MPA in Cagbungalon will help to replenish the fish populations both inside and outside of the proposed MPA and will secure food sources for generations to come.
As mentioned in previous sections, several species of fish and invertebrates that are known to be popular for consumption were only observed in low numbers or were completely absent from the surveyed area. The most concerning aspect of these findings is that several of these species are known keystone species. This means that these organisms play a vital role in the ecosystem and if removed can seriously affect the stability of the entire ecosystem. This can happen in two ways: (1) direct effects or (2) indirect effects. Direct effects occur when predators are removed from an ecosystem and facilitate the ecological release of prey species. For example the removal of predators such as Titan Triggerfish (Balistoides viridescens) which are known to feed on CoTs can result in an expansion in CoTs numbers through a lack of predation pressure. Indirect effects are more complex as they often involve many species of families and cascade down through trophic levels. In severe cases this can lead to phase shifts and alter ecosystem dynamics. The removal of top predators can lead to trophic cascades which can affect the whole ecosystem (Figure 25). With the removal of apex predators such as Groupers, prey species including Wrasse
suffer less predation pressure and populations increase. Many Wrasse species feed on benthic invertebrates that in turn predate juvenile settlement stage CoTs. With an increase in Wrasse numbers there is a corresponding decline in these invertebrates and thus an increase in juvenile CoT survivorship. This cascade effect through the trophic levels leads to
Groupers
Wrasse
Small Invertebrates
Juvenile CoTs
Coral
Natural State
Overfished State
Figure 25 – Representation of the indirect effects that overfishing of predatory fish, in this example Groupers can have on the entire coral ecosystem. The size of the circle represents the relative abundance of that organism or trophic level.

27 | P a g e © Coral Cay Conservation 2013
problems such as CoTs outbreaks because fewer predators are around to keep the CoTS population in check. Indirect top-down effects from depletion of apex predators have been shown to have wide spread impacts on ecosystems around the world (Myers et al. 2007). The observed size and biomass of commercially important species such as Parrotfish, Snapper, and Grouper, further support the concern that the area is overfished. For instance, 18% of recorded Parrotfish were below 11cm and 82% of all Parrotfish were below 21cm; however, common parrotfish reach sexual maturity around 15.5 cm and their fecundity, or ability to reproduce, continues to increase as they grow (Froese and Pauly, 2001). It is vital to have larger fish in the population to support reproduction in the area and produce parrotfish for future generations. A similar example is seen in the snapper population. All snapper (Maya Maya) recoded during this study were smaller than 40cm yet snappers do not reach sexual maturity until they are approximately 54.6 cm in length (Froese and Pauly, 2001). Again, as snappers grow in size they become more beneficial at replenishing the population. For example, one 12.5 kg female snapper produces as many eggs as 212 1.1kg snappers (Bohnsack, 1990). The biomass and size of snappers at Cagbungalon suggest that if removal of snappers continues in the area, there will be no snappers left to re-populate and snappers will become completely absent here. Signs of unsustainable fishing pressure observed in Cagbungalon can be remedied through the creation of a no-take Marine Protected Area. As shown in the case studies of Apo Island and Sumilon Island (Box 1), full recovery of certain species will take a substantial amount of time. Recovery can only begin when a no-take zone is established and overfishing is no longer occurring in the area. Once abundances of fish and invertebrates begin to increase, it is vital that proper enforcement continues as poaching inside an MPA can destroy years of recovery.

28 | P a g e © Coral Cay Conservation 2013
6. RECOMMENDATIONS
The reefs at Cagbungalon appear to be in good health and suitable for the creation of a Marine Protected Area. The proposed MPA boundaries should encompass the sites found to have the highest abundance, diversity, and coral cover so that the MPA can be as productive as possible. Of the 6 sites that were surveyed, the 4 sites to the north appear to be the healthiest. The four transect sites to the north of the survey area generally had higher fish and invertebrate abundance and diversity compared to the two southern sites. The southern boundary of Cagbungalon is marked by a small river which likely lead to the higher amount of sand and sedimentation found at sites 1 and 4. Rivers naturally bring sediment, as well as pollution and trash, from inland communities out into the sea. Due to riverine input, the southern sites had more sand and tended to have fewer fish and invertebrates. Coral cover was higher to the north (specifically at sites 5 & 6) and provides homes to many invertebrates and fish. Due to the more complex habitat here, fish and invertebrate abundances were higher at sites 2 and 5, while fish diversity was highest at site 6 and biomass of commercially important species (grouper, snapper, and parrotfish) was highest at site 2. Sites 2, 5, and 6 were also found to have more rock than the other sites, which is important as rock provides a stable space for new coral to grow. The suggested area for the proposed MPA in Cagbungalon incorporates the 4 healthiest and biodiverse sites surveyed during the assessment (Figure 26). Our suggested area is approximately 5 hectares, but is flexible and open to the suggestions of the community and the fisherfolk who use the area the most. This recommendation should be used as the first step in opening dialogue between all relevant members of the local community, Municipal and Provincial Governments, and CCC. Consultation will be essential within the local community, particularly with the fishers whose livelihoods may be affected by the designation of an MPA. Many studies from existing MPAs have shown that without the involvement of the local community the effectiveness of a MPA is greatly reduced. If individuals from the community are involved in the planning processes they will have a vested interest in the effective running and management of the MPA. If an MPA is declared, an awareness campaign is essential to ensure that everyone is aware of the new MPA, its extent and the rules that they will be expected to follow. CCC can help at all levels of this process by providing educational support to the community with information on how and why MPA can be successful.

29 | P a g e © Coral Cay Conservation 2013
Figure 26 – Recommended area for the Cagbungalon MPA. The outlined area is ~500m by 100m. Easting Northing
Northern Boundary 731877 1119324 Southern Boundary 731814 1118822
It is further advised that a management committee be created to oversee the effective running of the MPA once established. The purpose of this committee would be to coordinate the collection of MPA fees for possible dive sites, provide training and support to Bantay Dagat, oversee the enforcement of the MPA and be a link to the Municipal Government for matters concerning the MPA. It will be important for the management committee to establish goals and objectives for the MPA based on the criteria of species protection, fisheries and tourism. Reviewing these objectives will help inform management decisions. Support for the establishment of an MPA is available from both Municipal and Provincial government levels. It will be important to secure funding from the outset to aid in the establishment of the MPA. Demarcation buoys, and signage are essential tools for raising awareness and promoting enforcement. Securing sustainable financing will help to secure the long term future and success of an MPA. If, after detailed consultation and evaluation, an MPA is designated in Cagbungalon it will be important to ensure that monitoring of the MPA is conducted on a regular basis. Assessing temporal trends in abundance and diversity is crucial in determining how successfully the MPA is achieving its goals. The MPA Management Effectiveness Assessment Tool (MPA MEAT) is a national government programme designed to enable MPA manager to assess the effectiveness of their MPA. It uses detailed questionnaires and documentation to highlight limitations of MPA management and also suggests ways to improve it. CCC can provide further support by conducting MPA assessments to provide the biophysical data required by the MPA MEAT. CCC can also provide training to allow the barangay to develop their own MPA monitoring team. Overall the future of the Cagbungalon MPA should be reviewed with consultation between all stakeholders involved. The site is highly suitable for an MPA but it should only be established with the support of the local community and with management and monitoring coming from both Barangay and Municipal levels.

30 | P a g e © Coral Cay Conservation 2013
REFERENCES Allen, G.R. (2008) Conservation hotspots of biodiversity and endemism for Indo-Pacific coral reef fishes.
Aquatic Conservation: Marine and Freshwater Ecosystems 18: 541–556. Bohnsack, J.A. (1990). The potential of marine fishery reserves for reef fish management in the U.S. Southern
Atlantic. NOAA Technical Memorandum NMFS-SEFC-261, Miami, USA. 40p. Calumpong, H.P., Raymundo, L. J., Solis-Duran, E. P., Alava M. N. R. and de Leon, R. O. (Eds.). (1994). Resource
and Ecological Assessment of Sogod Bay, Leyte, Philippines - Final Report. CBD. 2010. Convention on Biological Diverstiy - Aichi Biodiversity Targets. http://www.cbd.int/sp/targets/. CTI (2012). Coral Triange Initiative – State of the Coral Triangle Highlights – Philippines. 4p. GCRMN Edited by Wilkinson, C. 2004. Status of Coral Reefs of the World:2004. Australian Institute of Marine
Science. Froese, R. and Pauly, D. (2001) Fishbase. World Wide Web electronic publication. http://www.fishbase.org Green, A., Smith, S. E., Lipsett-Moore, G., Groves, C., Peterson, N., Sheppard, S., Lokani, P., Hamilton, R.,
Almany, J., Aitsi, J. and Bualia, L. (2009). Designing a resilient network of marine protected areas for Kimbe Bay, Papua New Guinea. Oryx 43: 488-498.
Hardt, M. J. 2009. Lessons from the past: the collapse of Jamaican coral reefs. Fish and Fisheries 10:143-158. Hodgson G. (1999). A global assessment of human effects on coral reefs. Marine Pollution Bulletin 38: 345-355 Human, B. A. and Davies, A. (2010). Stakeholder consultation during the planning phase of scientific programs.
Marine Policy 34: 645-654. IUCN World Commission on Protected Areas (IUCN-WCPA) (2008). Establishing Marine Protected Area
Networks – Making it Happen. Washington DC: IUCN-WCPA, National Oceanic and Atmospheric Administration and The Nature Conservancy. 118p.
Jacinto G.L., Alino P.M., Villanoy C.L., Talaue‐McManus L. and E.D. Gomez (2000). The Philippines. In Seas of the
Millennium: An environmental evaluation. C. Sheppard (Ed.), Elsevier Science, chapter 79, 405‐423. Jackson, J.B.C., Kirby, M.X., Berger, W.H., Bjorndal, K.A., Botsford, L.W., Bourque, B.J., Bradbury, R.H., Cooke,
R., Erlandson, J., Estes, J.A., Hughes, T.P., Kidwell, S., Lange, C.B., Lenihan, H.S., Pandolfi, J.M., Peterson, C.H., Steneck, R.S., Tegner, M.J., Warner, R.R. (2001). Historical overfishing and the recent collapse of coastal ecosystems. Science 293:629–38.
Myers, R. A., Hutchings, J. A. & Barrowman, N. J., (1997) Why do fish stocks collapse? The example of cod in
Atlantic Canada. Ecological Application 7, 91–106. Myers, R. A., Baum, J. K., Shepherd, T. D., Powers, S. P. and Peterson, C. H. (2007) Cascading effects of the loss of apex predatory sharks from a coastal ocean. Science, 315, 1846–1850 Pauly, D., V. Christensen, Guenette, S., Pitcher, T. J., Sumaila, U. R., Walters, C. J., Watson, R. and Zeller, D.
(2002). Towards sustainability in world fisheries. Nature 418: 687-689. Peters, H. and Hawkins, J.P. (2009) Access to marine parks: A comparative study in willingness to pay. Ocean
and Coastal Management 52: 219-228.

31 | P a g e © Coral Cay Conservation 2013
Roberts, C.M., McClean, C.J., Veron, J.E.N., Hawkins, J.P., Allen, G.R., McAllister, D.E. et al., (2002). Marine biodiversity hotspots and conservation priorities for tropical reefs. Science 295: 1280–1284.
Russ, G. R., and Alcala, A. C. (2004). Marine reserves: long-term protection is required for full recovery of
predatory fish populations. Oecologia 138: 622-627. Thur, S.M. (2010) User fees as sustainable financing mechanisms for marine protected areas: An application to
the Bonaire National Marine Park. Marine Policy 34: 63-69. Veron, J.E.N. , Devantier, L. M., Turak, E., Green, A. L., Kininmonth, S., Stafford-Smith, M. and Peterson, N.
(2009). Delineating the Coral Triangle. Galaxea, Journal of Coral Reef Studies 11: 91-100 Wilkinson, C. (2008). Status of Coral Reefs of the World: 2008. Global Coral Reef Monitoring Network and Reef
and Rainforest Research Centre, Townsville, Australia, 296p. Wood, L. J., Fish, L., Laughren, J. and Pauly, D. (2008). Assessing progress towards global marine protection
targets: shortfalls in information and action. Oryx 42: 340-351. World Bank (2005). Philippines Environment Monitor on Coastal and Marine Resource Management. World
Bank, Washington DC, USA.

32 | P a g e © Coral Cay Conservation 2013
APPENDIX A: TARGET SPECIES LISTS
SUBSTRATES
Soft Coral Sponge Recently killed coral
Rock Silt/mud Rubble
Sand Nutrient indicator algae Other*
Hard Coral Lifeforms**:
Acropora branching Acropora encrusting Acropora submassive
Acropora digitate Acropora tabulate Non-Acropora branching
Non-Acropora encrusting Non-Acropora foliose Non-Acropora submassive
Non-Acropora mushroom Heliopora (blue coral) Millepora (fire coral)
Tubipora (organ-pipe coral)
*Other:
Anemone Corallimorph Halimeda
Tunicate Zoanthid Gorgonian
Hydroids
** If hard coral, also record target species
TARGET HARD CORALS
Brain small Brain medium Brain large
Ctenactis echinata Diploastrea heliopora Echinopora
Euphyllia Favia Favites
Foliose Montipora Galaxea Goniopora/Alveopora
Herpolitha limax Hydnophora Lobophyllia
Massive Porites Montipora digitata Mycedium elephantotus
Pachyseris rugosa Pachyseris speciosa Pavona clavus
Pectinia lactuca Plerogyra Pocillopora small
Pocillopora medium Pocillopora large Polyphyllia talpina
Porites cylindrica Porites nigrescens Porites rus
Seriatopora hystrix Tubastrea micrantha Turbinaria
Upside-down Bowl
Target Invertebrates
Feather duster worms Christmas tree worms Flatworms
Crabs Shrimps Banded coral shrimp
Lobsters Nudibranch Abalone
Conch Cowrie Triton’s trumpet
Cone shell Drupella Top shell
Other gastropod Giant clam Octopus
Cuttlefish Squid Acanthaster planci
Linkia laevigata Culcita novaeguineae Protoreaster nodosus
Choriaster granulatus Feather star Brittle star
Long spine sea urchin Pencil urchin Collector urchin
33 | P a g e © Coral Cay Conservation 2013
Prickly redfish Pinkfish Greenfish
Other sea cucumber Giant Clam
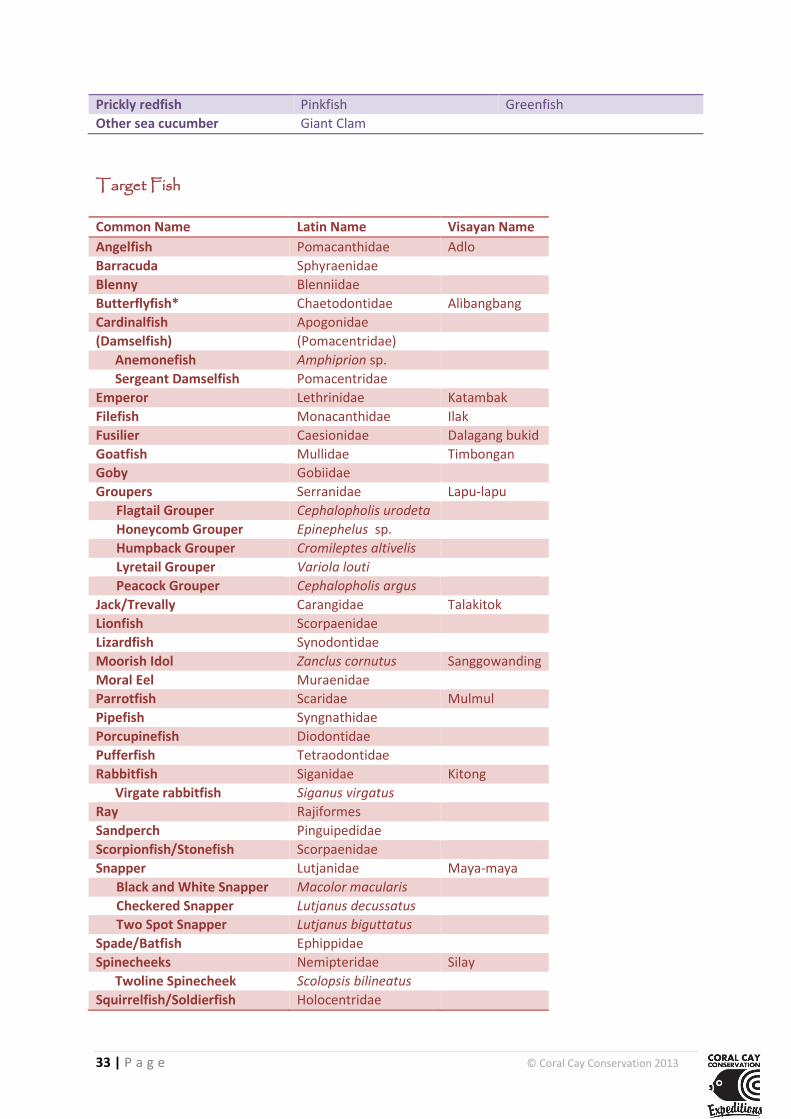
Target Fish
Common Name Latin Name Visayan Name
Angelfish Pomacanthidae Adlo
Barracuda Sphyraenidae
Blenny Blenniidae
Butterflyfish* Chaetodontidae Alibangbang
Cardinalfish Apogonidae
(Damselfish) (Pomacentridae)
Anemonefish Amphiprion sp.
Sergeant Damselfish Pomacentridae
Emperor Lethrinidae Katambak
Filefish Monacanthidae Ilak
Fusilier Caesionidae Dalagang bukid
Goatfish Mullidae Timbongan
Goby Gobiidae
Groupers Serranidae Lapu-lapu
Flagtail Grouper Cephalopholis urodeta
Honeycomb Grouper Epinephelus sp.
Humpback Grouper Cromileptes altivelis
Lyretail Grouper Variola louti
Peacock Grouper Cephalopholis argus
Jack/Trevally Carangidae Talakitok
Lionfish Scorpaenidae
Lizardfish Synodontidae
Moorish Idol Zanclus cornutus Sanggowanding
Moral Eel Muraenidae
Parrotfish Scaridae Mulmul
Pipefish Syngnathidae
Porcupinefish Diodontidae
Pufferfish Tetraodontidae
Rabbitfish Siganidae Kitong
Virgate rabbitfish Siganus virgatus
Ray Rajiformes
Sandperch Pinguipedidae
Scorpionfish/Stonefish Scorpaenidae
Snapper Lutjanidae Maya-maya
Black and White Snapper Macolor macularis
Checkered Snapper Lutjanus decussatus
Two Spot Snapper Lutjanus biguttatus
Spade/Batfish Ephippidae
Spinecheeks Nemipteridae Silay
Twoline Spinecheek Scolopsis bilineatus
Squirrelfish/Soldierfish Holocentridae

34 | P a g e © Coral Cay Conservation 2013
Surgeonfish Acanthuridae Indangan
Unicornfish Naso sp.
Sweeper Pempheridae
Sweetlips Haemulidae Lipti
Toby Tetraodontidae
Triggerfish Balistidae Pakol
Trunk/Box/Cowfish Ostraciidae
(Wrasse) (Labridae)
Crescent Wrasse Thalassoma lunare
Humphead Wrasse Cheilinus undulatus
Red Breasted Wrasse Cheilinus fasciatus
*Target Butterflyfish
Vagabond Butterflyfish Spot-Banded Butterflyfish Merten’s Butterflyfish
Klein’s Butterflyfish Dot and Dash Butterflyfish Chevroned Butterflyfish
Latticed butterflyfish Singular Bannerfish Threadfin Butterflyfish
Eastern Triangle Butterflyfish Longfin Bannerfish Teardrop Butterflyfish
Redfin Butterflyfish Masked Bannerfish Spot-Nape Butterflyfish
Pyramid Butterflyfish Pennant Bannerfish Lined Butterflyfish
(Big) Long-Nosed Butterflyfish
Racoon Butterflyfish Yellow-Dotted Butterflyfish
Copper-Banded Butterflyfish Dotted Butterflyfish Black-Backed Butterflyfish
Orange-Banded Butterflyfish Ovalspot/Mirror Butterflyfish Spot-Tail Butterflyfish
Humphead Bannerfish Bennett’s/Eclipse Butterflyfish Panda Butterflyfish
Asian Butterflyfish Bluespot Butterflyfish Eight-Banded Butterflyfish
Burgess’ Butterflyfish Highfin Coralfish Reticulated Butterflyfish
Ornate Butterflyfish Two-Eyed Coralfish Saddled Butterflyfish
Meyer’s Butterflyfish Brown Banded Butterflyfish Spotted Butterflyfish
Speckled Butterflyfish Ocellate Coralfish Yellowtail Butterflyfish
Pacific Double-Saddle Butterflyfish

35 | P a g e © Coral Cay Conservation 2013
APPENDIX B - SPECIES ABUNDANCE GRAPHS
Figure 27 – Average abundance of target fish families. Data are mean average per replicate, error
bars indicate Standard Error of the Mean.
0 10 20 30 40 50 60
Angelfish
Total Surgeonfish
Moorish Idol
Total Rabbitfish
Anemonefish
Sergeant Damselfish
Total Spinecheeks
Humphead Wrasse
Crescent Wrasse
Red Breasted Wrasse
Emperor
Sweetlips
Triggerfish
Filefish
Goatfish
Fusilier
Cardinalfish
Jack/Trevally
Pufferfish
Toby
Porcupinefish
Trunk/Box/Cowfish
Goby
Blenny
Sandperch
Lizardfish
Scorpionfish/Stonefish
Lionfish
Barracuda
Pipefish
Squirrelfish/Soldierfish
Sweeper
Spade/Batfish
Moral Eel
Ray
Total Parrotfish
Total Groupers
Total Snappers
Total Butterflyfish
Mean Fish Abundance per 100m2

36 | P a g e © Coral Cay Conservation 2013
Figure 28 – Average abundance of target invertebrate species and families. Data are mean averages per
replicate, error bars indicate standard error of the mean.
0 10 20 30 40 50 60
Feather Duster Worms
Christmas Tree Worms
Flatworms
Shrimp
Banded Coral Shrimp
Lobster
Crab
Abalone
Conch
Cowrie
Triton
Cone Shell
Drupella
Topshell
Nudibranch
Other Gastropod
Octopus
Cuttlefish
Squid
Acanthaster plancii (COTS)
Linkia laevigata
Choriaster granulatus
Protoreaster nodosus
Culcita novaeguineae
Feather Star
Brittle Star
Long Spin Sea Urchin
Pencil Urchin
Collector Urchin
Prickly Redfish
Greenfish
Pinkfish
Other Sea Cucumber
Total Giant Clams
Mean Invertebrate Abundance per 100m2

37 | P a g e © Coral Cay Conservation 2013
Figure 29– Average abundance of hard coral lifeform, target coral species and benthic organisms classed under ‘other’. Data are mean average per replicate, error bars indicate Standard Error of the Mean.
0 1 2 3 4 5
Acropora branchingAcropora encrusting
Acropora submassiveAcropora digitate
Acropora tabulatenon-Acropora
Non-Acropora encrustingNon-Acropora foliose
Non-Acropora massiveNon-Acropora submassiveNon-Acropora mushroom
HelioporaMilleporaTubipora
Brain smallBrain medium
Brain largeCtenactis echinata
Diploastrea helioporaEchinopora
EuphylliaFavia
Foliose MontiporaGalaxea
Goniopora/AlveoporaHerpolitha limax
HydnophoraLobophyllia
Massive PoritesMontipora digitata
M. elephantotusPachiseris rugosa
Pachiseries speciosaPavona clavus
Pectina lactucaPlerogyra
Pocillopora smallPocillopora medium
Pocillopora largePolyphyllia talpina
Porites cylindricaPorites nigrescens
Porites rusSeriatopora hystrix
Tubastrea micranthaTurbinaria
Upsidedown Bowl
Mean abundance per 20m Transect