core tip amendment appendix f - thempc.org · f‐4 introduction . the transportation improvement...
TRANSCRIPT

CORE MPO is the Metropolitan Planning Organization (MPO) responsible for transportation planningfor the Savannah region. The CORE MPO is comprised of the representatives of local, stateand federal government and transportation authorities and ensures federal spending ontransportation for urbanized areas of over 50,000 people occurs through a comprehensive,cooperative and continuing process involving both the public and policy-makers. The MPCprovides staff services to the CORE MPO Board, which is chaired by the chairman of theChChatham County Board of County Commissioners.
Fiscal Year 2018 -2021
PREPARED BY THE CHATHAM COUNTY - SAVANNAH METROPOLITAN PLANNING COMMISSION in cooperation withthe Federal Highway Administration, the Federal Transit Administration and the Georgia Department of Transportation
Adopted June 28, 2017Amended June 27, 2018
METROPOLITAN PLANNING ORGANIZATION
Transportation Improvement Program

F‐2
Table of Contents Introduction ............................................................................................................................................................ 1Transportation Performance Management ............................................................................................................ 1Performance Based Planning and Programming .................................................................................................... 2National Goal Areas ................................................................................................................................................ 3Highway Performance Goals ............................................................................................................................... 3Transit Performance Goals .................................................................................................................................. 4
Federal Requirements ............................................................................................................................................. 5Targets ................................................................................................................................................................. 5Reporting ............................................................................................................................................................. 5Assessments ........................................................................................................................................................ 6
Safety Programming ............................................................................................................................................... 6CORE MPO FY 2018‐2021 TIP Safety Projects ..................................................................................................... 7
Transportation Asset Management: Bridge and Pavement Conditions .............................................................. 12System Performance: Reliability, Freight and Air Quality ................................................................................... 14Transit Asset Management ................................................................................................................................... 15Next Steps ............................................................................................................................................................. 18Appendix A: Related Performance Based Planning and Programming Resolutions ........................................... 20Appendix B: Public Participation Materials ......................................................................................................... 21Appendix C: System Performance Report............................................................................................................ 22
Tables Table 1: Federal Highway Program Performance Goals ........................................................................................ 4Table 2: Federal Transit Program Performance Goals ........................................................................................... 5Table 3: Georgia Department of Transportation Safety Performance Targets 2018 ............................................ 7Table 4: TIP Projects and Federal Performance Measures .................................................................................... 8Table 5: Project Descriptions ................................................................................................................................. 9Table 6: GDOT Bridge and Pavement Condition Targets ..................................................................................... 14Table 7: GDOT Adopted System Performance Targets ........................................................................................ 16Table 8: Regional Transit Asset Management Targets ........................................................................................ 18Table 9: Programmed Transit Asset Management Projects ................................................................................ 18
Figures Figure 1: Transportation Performance Management ............................................................................................ 2Figure 2: Performance Based Planning and Program Process ............................................................................... 3Figure 3: CORE MPO FY 2018‐2021 TIP Projects Related to Safety ..................................................................... 12Figure 4: 2040 Total Mobility Goals and State of Good Repair ........................................................................... 13Figure 5: 2040 Total Mobility Goals and System Performance ........................................................................... 15Figure 6: 2040 Total Mobility Goals and Transit Asset Management ................................................................. 17

Appendices Appendix A: Perfromance Based Planning and Programming Resolutions and Agreements ..... 20 Appendix B: Public Participation Materials ................................................................................. 38 Appendix C: System Performance Reports .................................................................................. 40
F‐2
Table of Contents Introduction ............................................................................................................................................................ 1Transportation Performance Management ............................................................................................................ 1Performance Based Planning and Programming .................................................................................................... 2National Goal Areas ................................................................................................................................................ 3Highway Performance Goals ............................................................................................................................... 3Transit Performance Goals .................................................................................................................................. 4
Federal Requirements ............................................................................................................................................. 5Targets ................................................................................................................................................................. 5Reporting ............................................................................................................................................................. 5Assessments ........................................................................................................................................................ 6
Safety Programming ............................................................................................................................................... 6CORE MPO FY 2018‐2021 TIP Safety Projects ..................................................................................................... 7
Transportation Asset Management: Bridge and Pavement Conditions .............................................................. 12System Performance: Reliability, Freight and Air Quality ................................................................................... 14Transit Asset Management ................................................................................................................................... 15Next Steps ............................................................................................................................................................. 18Appendix A: Related Performance Based Planning and Programming Resolutions ........................................... 20Appendix B: Public Participation Materials ......................................................................................................... 21Appendix C: System Performance Report............................................................................................................ 22
Tables Table 1: Federal Highway Program Performance Goals ........................................................................................ 4Table 2: Federal Transit Program Performance Goals ........................................................................................... 5Table 3: Georgia Department of Transportation Safety Performance Targets 2018 ............................................ 7Table 4: TIP Projects and Federal Performance Measures .................................................................................... 8Table 5: Project Descriptions ................................................................................................................................. 9Table 6: GDOT Bridge and Pavement Condition Targets ..................................................................................... 14Table 7: GDOT Adopted System Performance Targets ........................................................................................ 16Table 8: Regional Transit Asset Management Targets ........................................................................................ 18Table 9: Programmed Transit Asset Management Projects ................................................................................ 18
Figures Figure 1: Transportation Performance Management ............................................................................................ 2Figure 2: Performance Based Planning and Program Process ............................................................................... 3Figure 3: CORE MPO FY 2018‐2021 TIP Projects Related to Safety ..................................................................... 12Figure 4: 2040 Total Mobility Goals and State of Good Repair ........................................................................... 13Figure 5: 2040 Total Mobility Goals and System Performance ........................................................................... 15Figure 6: 2040 Total Mobility Goals and Transit Asset Management ................................................................. 17

B‐2
Appendices Appendix A: Perfromance Based Planning and Programming Resolutions and Agreements ............................. 20 Appendix B: Public Participation Materials ......................................................................................................... 37 Appendix C: System Performance Reports .......................................................................................................... 39

F‐4
Introduction The Transportation Improvement Program (TIP) is the MPO’s short‐range programming document and is a staged, multi‐year listing of surface transportation projects proposed for federal, state and local funding within the metropolitan area. The TIP may be modified in accordance with the procedures outlined in the adopted Participation Plan by resolution of the CORE MPO Board if priorities, area goals, project schedules or funding levels change. The CORE MPO’s FY 2018 ‐ 2021 TIP was adopted by the MPO Board in June 2017. Since then a series of TIP amendments have been processed regarding various projects. The original adopted TIP document and the amendment reports are all available for review on the CORE MPO website at http://www.thempc.org/Dept/Tip. This TIP amendment document is meant to serve as a bridge as CORE MPO incorporates newly established safety targets as part of a Performance Based Planning and Programming process. This document contains details on:
Federal Requirements
National Goal Areas and Measures
Safety Goals and Targets
Next steps for CORE MPO to build its PBPP practices, process, and policies.
Transportation Performance Management The Moving Ahead for Progress in the 21st Century Act (MAP‐21) signed into law in 2012 and the Fixing America’s Surface Transportation Act (FAST ACT) signed into law in 2015 require that all state departments of transportation and metropolitan planning organizations use a performance based planning and programming approach as part of a Transportation Performance Management (TPM) program, transforming transportation decision making into a performance‐driven and outcome based process. The Federal Highway Administration (FHWA) defines TPM (see Figure 1) as a strategic approach that uses system information to make investment and policy decisions to achieve national performance goals. Performance management has been increasingly utilized over the past two decades. This process provides key information to decision makers, allowing them to understand the consequences of investment decisions across transportation assets and modes. It is also credited with improving project and program delivery and providing greater transparency and accountability to the public. Transportation Performance Management:
Is systematically applied on a regular ongoing basis; Provides key information to help decision makers, allowing them to understand the consequences of
investment decisions across transportation assets or modes; Improves communications between decision makers, stakeholders and the traveling public; and Ensures targets and measures are developed in cooperative partnerships and based on data and
objective information.

F‐2
Figure 1: Transportation Performance Management
Source: FHWA
Performance Based Planning and Programming Performance‐based planning and programming (PBPP) refers to transportation agencies’ application of TPM as a standard state of the practice in the planning and programming processes. The goal of PBPP is to ensure that transportation investment decisions, both long‐term planning and short‐term programming, are based on performance and the ability to meet established goals. The process for MPOs includes incorporating PBPP into the Metropolitan Transportation Plan (MTP) which evaluates transportation system performance and is the MPO’s long‐range investment document, as well as the Transportation Improvement Program (TIP) which is the subset of the MTP and the MPO’s short‐term programming document outlining the anticipated projects the MPO intends to implement with federal funding in the next four fiscal years. PBPP requires the following elements (see Figure 2) be incorporated into the metropolitan planning process:
measurable goals and objectives for the transportation system;
performance measures and targets for desired performance outcomes;
data collection to monitor and analyze trends;
performance measures and data collection to inform investment decisions; and
monitoring, analyzing, and reporting decision outputs and performance outcomes.

F‐3
Figure 2: Performance Based Planning and Program Process
Source: FHWA
PBPP will assist the CORE MPO’s decision‐makers to make both policy and project decisions. Transportation needs continue to outweigh resources available for transportation improvements. Implementing PBPP assists decision makers with these difficult decisions by utilizing tradeoff analysis and focusing on data specific performance outcomes. The results will be the enhanced accountability and transparency of the MPO planning process.
National Goal Areas A key feature of MAP‐21 and the FAST ACT is the establishment of a performance‐ and outcome‐based program. The objective of this performance‐ and outcome‐based program is for States to invest resources in projects that collectively will make progress toward the achievement of the national goals (see Table 1) established by Congress1.
Highway Performance Goals Through the federal rulemaking process, FHWA is requiring state DOTs and MPOs to monitor the transportation system using specific performance measures. These measures are associated with the national goal areas prescribed in MAP‐21 and the FAST Act. The goals address three areas of concern which include safety, state of good repair and system efficiently. The following table describes these national goal areas, rulemakings, performance areas, and prescribed measures.
1 [§1203; 23 USC 150(b)]

F‐4
Table 1: Federal Highway Program Performance Goals
Transit Performance Goals Recipients of public transit funds, which can include states, local authorities, and public transportation operators are also required to establish performance targets based on the national goals (see Table 2) for safety and state of good repair; to develop transit asset management and transit safety plans; and to report on their progress toward achieving targets. Public transportation operators are directed to share information with the CORE MPO and states so that all plans and performance reports are coordinated. The table below identifies performance measures outlined in the National Public Safety Transportation Plan2 released by the Federal Transit Administration (FTA), and in the final rule for transit asset management3. The CORE MPO is required to coordinate with public transit providers to set targets for these measures.
2 https://www.transit.dot.gov/sites/fta.dot.gov/files/docs/National%20Public%20Transportation%20Safety%20Plan_1.pdf 3 https://www.gpo.gov/fdsys/pkg/FR‐2016‐07‐26/pdf/2016‐16883.pdf
National Goal Performance Area Performance Measure
PM1
Safety ‐ To achieve a significant reduction in
traffic fatalities and serious injuries on all
public roads.
Injuries & Fatalities
1. Number of Fatalities
2. Rate of Fatalities per 100 million Vehicle Miles Traveled (VMT)
3. Number of Serious Injuries
4. Rate of Serious Injuries per 100 million VMT
5. Number of Non‐motorized Fatalities and Non‐motorized
Serious Injuries
Pavement
1. Percentage of pavement on the Interstate System in Good
condition
2. Percentage of pavements on the Interstate System in Poor
condition
3. Percentage of pavements on the non‐interstate national
Highway System (NHS) in Good condition
4. Percentage of pavements on the non‐Interstate NHS in Poor
Condition
Bridge Condition1. Percentage of NHS bridged classifieds as in Good condition
2. Percentage of NHS bridges classified as in Poor condition
Congestion Reduction ‐ To achieve a
significant reduction in congestion on the
National Highway System
Performance of the National
Highway System
1. Percent of person miles traveled on the Interstate System that
are reliable
2. Percent of the person miles traveled on the non‐Interstate NHS
that are reliable
System Reliability ‐ To improve the efficiency
of the surface transportation system
Freight Movement of the
Interstate System1. Truck Travel Time Reliability
Freight Movement and Economic Vitality ‐
To improve the national freight network,
strengthen the ability of rural communities
to access national and international trade
markets, and support regional economic
development.
Traffic Congestion1. Annual hours of peak‐hour excessive delay per capita
2. Percent of non‐single occupant vehicle travel
Environmental Sustainability ‐ To enhance
the performance of the transportation
system while protecting and enhancing the
natural environment.
On‐Road Mobile Source
Emissions* 1. Total emissions reduction*
*Only applies in non‐attainment or maintenance area and does not apply to the CORE MPO at this time.
PM2
PM3
Infrastructure Condition ‐ To maintain the
highway infrastructure asset system in a
state of good repair
Source: 23USC §150(b)

F‐5
Table 2: Federal Transit Program Performance Goals
Federal Requirements The PBPP process requires states and MPOs to set targets related to the national goals and to report on progress toward meeting those targets. The following section describes these requirements for MPOs.
Targets As part of the TPM, each state DOT and MPO must adopt targets to strive for within the planning and programming process. State DOTs and MPOs are required to set targets for a variety of performance measures related to safety, state of good repair and system performance. The process for setting targets will be taking place through 2019. The state DOT will set their targets first and the MPO has 180 days from that time to adopt their own targets. The MPO has two options in terms of setting targets. The MPO can state that it supports the state DOT targets, or it can create its own unique targets. By supporting the state’s targets, GDOT will do the quantitative work and the CORE MPO will reflect the support of the target through its planning and programming activities. GDOT, CORE MPO, and the Chatham Area Transit Authority (CAT) must coordinate throughout the target setting process to ensure consistency to the maximum extent practicable. For each performance measure, the CORE MPO Board will decide to either support statewide target(s), or to establish a quantifiable target(s) specific to the CORE MPO’s planning area.
Reporting The CORE MPO’s MTP must describe the performance measures and targets, evaluate the performance of the transportation system and report on progress made towards achieving the targets. The TIP must link investment priorities to the targets in the MTP and describe the anticipated effect of the program toward
National Goal Transit Performance Area Performance Measure
Safety ‐ To achieve a significant reduction in traffic
fatalities and serious injuries on all public roads.Fatalities, Injuries and Safety Events
1. Total number of fatalities and rate per total vehicle revenue
miles by mode
2. Total number of injuries and rate per total vehicle revenue
miles by mode
3. Total number of events and rate per total vehicle revenue
miles by mode
4. Mean distance between major mechanical failures by mode
EquipmentPercentage of vehicles that have met or exceeded their Useful
Life Benchmark (ULB)
Rolling StockPercentage of revenue vehicles within a particular asset class
that have met or exceeded their ULB
FacilitiesPercentage of facilities within an asset class rated below 3.0 on
the FTA Transit Economic Requirements Model scale
Infrastructure Condition
(State of Good Repair: Transit Asset Management)

F‐6
achieving established targets. CORE MPO must also produce a system performance report showing progress toward the achievement of targets to GDOT.
Assessments FHWA and FTA will not directly evaluate the CORE MPO progress towards meeting targets for required performance measures but rather the performance will be assessed as part of regular cyclical certification review. FHWA will determine if GDOT has met or made significant progress towards attaining the selected targets for the highway system on an annual basis.
Safety Programming The first set of performance measures and targets to be addressed is for safety. The Safety Performance Management (PM) Final Rule supports the state’s Highway Safety Improvement Program (HSIP) by establishing safety performance measures to assess fatalities and serious injuries on all public roads. The Safety Performance Management (PM) Final Rule establishes the following five performance measures:
1. Number of Fatalities4: The total number of persons suffering fatal injuries in a motor vehicle crash during a calendar year.
2. Rate of Fatalities5: The ratio of total number of fatalities to the number of vehicle miles travelled (VMT, in 100 million VMT) in a calendar year.
3. Number of Serious Injuries6: The total number of persons suffering at least one serious injury in a motor vehicle crash during a calendar year.
4. Rate of Serious Injuries: The ratio of total number of serious injuries to the number of VMT (in 100 million VMT) in a calendar year.
5. Number of Non‐motorized Fatalities and Non‐motorized Serious Injuries7: The combined total number of non‐motorized fatalities and non‐motorized serious injuries involving a motor vehicle during a calendar year.
Using the methods provided in the federal final rule, GDOT determined the appropriate statewide safety targets as seen in Table 3. Staff from GDOT presented their findings to all state MPOs and presented to the CORE MPO in October of 2017. After careful consideration the CORE MPO Policy Board elected to support GDOTs targets in December of 2017. Although the CORE MPO has opted to support the state’s targets initially, the MPO does have the option in the future to establish regional numeric targets for the safety performance measures. The CORE targets were reported to GDOT, which must be able to provide them to FHWA, upon request. MPO targets are not included in the assessment of whether a State met or made significant progress toward meetings its targets.
4 Final FARS data is to be used if it is available, otherwise FARS Annual Report File (ARF) data may be used, which is generally available one year before Final FARS data. 5 Volume Data: State VMT data is derived from the Highway Performance Monitoring System (HPMS). Metropolitan Planning Organization (MPO) VMT, if applicable, is estimated by the MPO. 6 Serious Injury Data: State motor vehicle crash database. Agencies must use the definition for “Suspected Serious Injury (A)” from the MMUCC, 4th edition by April 14, 2019. Prior to April 14, 2019 agencies may use injuries classified as “A” on the KABCO scale through use of NHTSA conversion tables. However, agencies are encouraged to begin using the MMUCC, 4th edition definition and attributes at the beginning of 2019 for a complete and consistent data file for the calendar year. 7 The number of non‐motorized fatalities is the total number of fatalities with the FARS person attribute codes: (5) Pedestrian, (6) Bicyclist, (7) Other Cyclist, and (8) Person on Personal Conveyance. The number of nonmotorized serious injuries is the total number of serious injuries where the injured person is, or is equivalent to, a pedestrian (2.2.36) or a pedalcyclist (2.2.39) as defined in ANSI D16.1‐2007.

F‐7
For the 2018 performance period, CORE MPO has elected to accept and support the State of Georgia’s safety targets detailed in Table 3 for all five safety performance measures. CORE MPO will:
Address areas of concern for fatalities or serious injuries within the CORE MPO’s metropolitan planning area through coordination with GDOT and incorporation of safety considerations on all projects;
Integrate safety goals, objectives, performance measures, and targets into the planning process; and
Include the anticipated effect toward achieving the targets noted above within the TIP, effectively linking investment priorities to safety target achievement.
Table 3: Georgia Department of Transportation Safety Performance Targets 2018*
*Safety Targets are updated annually. The most current Safety Targets can be found in Appendix A
CORE MPO FY 2018-2021 TIP Safety Projects To support progress towards approved highway safety targets, the FY 2018‐2021 TIP includes a number of key safety investments. A total of $443 million has been programmed in the FY 2018‐2021 TIP to improve highway safety; averaging approximately $148 million per year.
The following table serves as a visualization tool to show how the projects programmed in the CORE MPO FY 2018 – 2021 TIP relate to federal performance measures, underscoring the strong alignment between CORE MPO’s planning and TIP programming process and federal transportation planning priorities (see Table 4). The majority of the projects in the current TIP have elements that support the state’s safety targets. As projects are completed and future crash data is collected we will be able to make further correlations between reductions in fatalities and serious injuries based on the transportation investments made within the region.
Target
Number of Fatalities To maintain the 5‐year rolling average for traffic fatalities under the projected
1,593.3 (2014 – 2018) 5‐year average by December 2018
Rate of Fatalities per 100 million
vehicle miles traveled (VMT)
To maintain the 5‐year rolling average for the rate of traffic fatalities per 100 million
VMT under the projected 1.32 (2014 – 2018) 5‐year average by December 2018
Number of Serious Injuries To maintain the 5‐year rolling average for serious injuries under the projected
19,642.8 (2014 – 2018) 5‐year average by December 2018
Rate of Serious Injuries per 100
million VMT
To maintain the 5‐year rolling average for the rate of serious injuries per 100 million
VMT under the projected 16.318 (2014 – 2018) 5‐year average by December 2018
Non
Motorized
Number of Non‐motorized Fatalities
and Serious Injuries
To maintain the 5‐year rolling average for non‐motorized fatalities and serious
injuries under the projected 1,027.2 (2014 – 2018) 5‐year average by December 2018
Fatalities
Serious
Injuries
Performance Measure

F‐8
Table 4: TIP Projects and Federal Performance Measures
Safety
Pavem
ent & Bridge
Conge
stion
Freight
Air Quality
Tran
sit Safety
Tran
sit Asset
manage
men
t
0012757 I‐16 From I‐95 to I‐516 X X X X
0012758 I‐16 @ I‐95 Interchange Reconstruction X X X X
0013741 SR 25/US 17 @ Savannah River in Port Wentworth X X X
0013742 SR 25/US 17 @ Middle River in Port Wentworth X X X
0007128 CR 787/Island Expressway @ Wilmington River/Bascule Bridge X X X
0007631 Truman Linear Park Trail ‐ Phase II‐A X X
0015306 Truman Linear park Trail ‐ Phase II‐B X X
0008358 I‐516 @ CS 1503/DeRenne Ave X X X
0010028 CS 1097/Delesseps/La Rouche Ave from Waters Ave to Skidaway Road X X X
0013727 I‐16 @ SR 307 X X X X
0013280 CAT Vehicle Purchase for 2018 X X
0015977 CAT‐ Bus Reliability Initiative X X
0015978 CAT ‐ Maintenance Equipment Upgrades X X
0015979 CAT ‐ Electric Bus Conversion Initiative X X X
532370 SR 144 EB from S OF CR 100 to S of CR 154 X X X
TBA CAT Bikeshare System Expansion Phase 2 X
0015980 McQueens Island Trail Restoration and Mitigation X X
0006328 Brampton Road Conn from SR 21/SR 25 to SR 21 SPUR X X
PI # DESCRIPTION
Federal Performance Measures

F‐9
Table 4: TIP Projects and Federal Performance Measures (Continued)
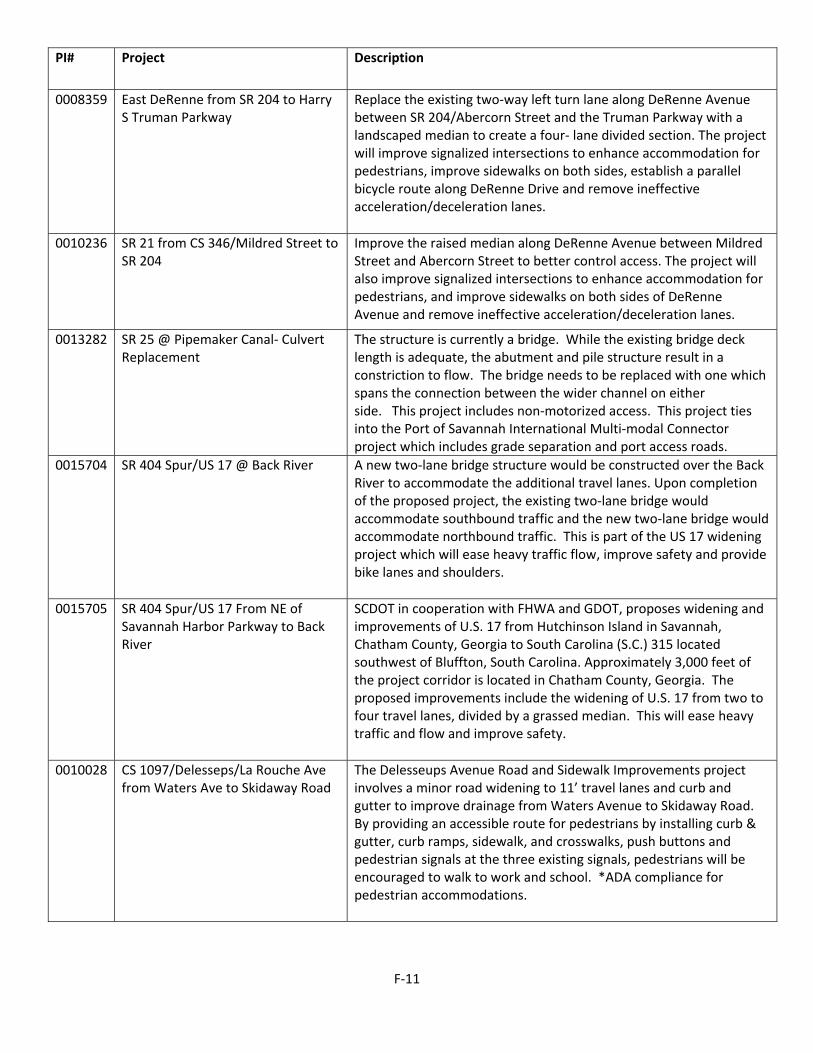
The following Table includes a brief description of how each project programmed in the FY 2018‐2021 TIP supports the GDOT’s targets on reducing fatalities and serious injuries. For detailed information please visit the CORE MPO interactive TIP at http://core.dtstiptool.com/ or visit http://www.thempc.org/Dept/Tip. Figure 3 maps each of the projects that support the safety targets. Table 5: Project Descriptions PI# Project Description
0012757 I‐16 From I‐95 to I‐516 Widening project which will support safety targets by easing congestion and heavy traffic flow, providing an emergency use ramp across the median for hurricane evacuations and linkage to the Georgia NaviGAtor system.
0012758 I‐16 @ I‐95 Interchange Reconstruction
The project will ease heavy traffic flow and enhance safety at the interchange by proving more efficient exit and entrance ramp operations with fewer conflicts. Collector‐distributor* (CD) lanes will run parallel to the interstate and help improve traffic flow, speed, and safety. Lighting will be added to the interchange. A linkage to the Georgia NaviGAtor system will be included.
0013741 SR 25/US 17 @ Savannah River in Port Wentworth
Bridge replacement of an aged structure. Bridge is often closed for emergency repairs and a cause of safety concerns. The bridge improvement will minimize or eliminate the safety concerns.
Safety
Pavem
ent & Bridge
Conge
stion
Freigh
t
Air Quality
Tran
sit Safety
Tran
sit Asset
man
agem
ent
0006700 Effingham Parkway from CR156/Blue Jay/Effingham to SR 30/Chatham X
521855 SR 26 from I‐516 to CS 188/Victory Drive X X X X
0008359 East DeRenne from SR 204 to Harry S Truman Parkway X X X X
0010236 SR 21 from CS 346/Mildred Street to SR 204 X X X X
0015704SR 404 Spur/US 17 @ Back River
X X X X
0015705SR 404 Spur/US 17 From NE of Savannah Harbor Parkway to Back River
X X X X
Transit Section 5307, Section 5337, Section 5339, Ferry boat program X X
PI # DESCRIPTION
Federal Performance Measures
Lump Sum Lump Sum Projects X X X X X

F‐10
PI# Project Description
0013742 SR 25/US 17 @ Middle River in Port Wentworth
Bridge replacement of an aged structure. Bridge is often closed for emergency repairs and a cause of safety concerns. The bridge improvement will minimize or eliminate the safety concerns.
0007128 CR 787/Island Expressway @ Wilmington River/Bascule Bridge
Replace the existing deteriorated bascule bridges on Island's Expressway over Wilmington River with two fixed span structures. This will help reduce traffic delays in addition to providing a safe and efficient evacuation from the islands without the worry of the bascule bridges malfunctioning.
0007631 Truman Linear Park Trail ‐ Phase II‐A Supports non‐ motorized safety by creating dedicated non‐ motorized facilities
0015306 Truman Linear park Trail ‐ Phase II‐B Supports non‐ motorized safety by creating dedicated non‐ motorized facilities
0008358 I‐516 @ CS 1503/DeRenne Ave Reduce traffic congestion and improve safety on DeRenne Avenue by providing a new four‐lane divided connector from I‐516 to a realigned White Bluff Road with a new direct connection to Hunter Army Airfield and a multi‐use path. This project will eliminate the need for traffic bound to or from the Southside to turn at a signalized intersection, thus freeing up more green time for through movements on DeRenne
0013727 I‐16 @ SR 307 Operational improvements including widening and relocation of the existing ramps and reconstruction into a diverging diamond interchange for more efficient traffic flow.
532370 SR 144 EB from S OF CR 100 to S of CR 154
This project consists of widening 144 to ease heavy vehicular traffic while supporting non‐motorized travel with the addition of including sidewalks and bike lanes.
0015980 McQueens Island Trail Restoration and Mitigation
Supports non‐ motorized safety by enhancing dedicated non‐ motorized facilities
521855 SR 26 from I‐516 to CS 188/Victory Drive
This project consists of the proposed widening of SR 26/US 80/Ogeechee Road from just east of Lynes Parkway to just east of the Springfield Canal and the SR 26/US 80/Ogeechee Road Intersection with Victory Drive. Approximately 1400 feet of Victory Drive would also be reconstructed to tie the proposed widening of SR 26/US 80/Ogeechee Road into the existing Victory Drive roadway. The existing two‐lane roadway would be widened to provide four twelve‐foot wide travel lanes, with two four‐foot wide bicycle lanes, one in each direction, and a twenty‐foot wide raised median. Realignment of the Victory Drive/Ogeechee Road intersection will improve traffic flow and reduce conflicts at the intersection.
F‐11
PI# Project Description
0008359 East DeRenne from SR 204 to Harry S Truman Parkway
Replace the existing two‐way left turn lane along DeRenne Avenue between SR 204/Abercorn Street and the Truman Parkway with a landscaped median to create a four‐ lane divided section. The project will improve signalized intersections to enhance accommodation for pedestrians, improve sidewalks on both sides, establish a parallel bicycle route along DeRenne Drive and remove ineffective acceleration/deceleration lanes.
0010236 SR 21 from CS 346/Mildred Street to SR 204
Improve the raised median along DeRenne Avenue between Mildred Street and Abercorn Street to better control access. The project will also improve signalized intersections to enhance accommodation for pedestrians, and improve sidewalks on both sides of DeRenne Avenue and remove ineffective acceleration/deceleration lanes.
0013282 SR 25 @ Pipemaker Canal‐ Culvert Replacement
The structure is currently a bridge. While the existing bridge deck length is adequate, the abutment and pile structure result in a constriction to flow. The bridge needs to be replaced with one which spans the connection between the wider channel on either side. This project includes non‐motorized access. This project ties into the Port of Savannah International Multi‐modal Connector project which includes grade separation and port access roads.
0015704 SR 404 Spur/US 17 @ Back River A new two‐lane bridge structure would be constructed over the Back River to accommodate the additional travel lanes. Upon completion of the proposed project, the existing two‐lane bridge would accommodate southbound traffic and the new two‐lane bridge would accommodate northbound traffic. This is part of the US 17 widening project which will ease heavy traffic flow, improve safety and provide bike lanes and shoulders.
0015705 SR 404 Spur/US 17 From NE of Savannah Harbor Parkway to Back River
SCDOT in cooperation with FHWA and GDOT, proposes widening and improvements of U.S. 17 from Hutchinson Island in Savannah, Chatham County, Georgia to South Carolina (S.C.) 315 located southwest of Bluffton, South Carolina. Approximately 3,000 feet of the project corridor is located in Chatham County, Georgia. The proposed improvements include the widening of U.S. 17 from two to four travel lanes, divided by a grassed median. This will ease heavy traffic and flow and improve safety.
0010028 CS 1097/Delesseps/La Rouche Ave from Waters Ave to Skidaway Road
The Delesseups Avenue Road and Sidewalk Improvements project involves a minor road widening to 11’ travel lanes and curb and gutter to improve drainage from Waters Avenue to Skidaway Road. By providing an accessible route for pedestrians by installing curb & gutter, curb ramps, sidewalk, and crosswalks, push buttons and pedestrian signals at the three existing signals, pedestrians will be encouraged to walk to work and school. *ADA compliance for pedestrian accommodations.

F‐12
PI# Project Description
Lump Sum
Lump Sum Projects GDOT manages various groups of projects that do not affect the capacity of the roadway, including maintenance, safety, roadway and interchange lighting, safe routes to school, transportation enhancements, highway risk rural roads, regional traffic signal optimization, etc.
Figure 3: CORE MPO FY 2018‐2021 TIP Projects Related to Safety
Transportation Asset Management: Bridge and Pavement Conditions Transportation Asset Management is a strategic approach to cost‐effectively and efficiently manage the physical assets of the transportation system. Preserving assets before they deteriorate extends their useful lives and saves money in the long run. This reduces the financial burden on taxpayers, as well as inconveniences to the traveling public that result from unanticipated asset failure and replacement. The 2040 Total Mobility Plan shows the importance of a system in a state of good repair by having an adopted goal for system maintenance as shown in Figure 4.

F‐13
The Moving Ahead for Progress in the 21st Century Act (MAP‐21) and Fixing America’s Surface Transportation
Act (FAST ACT) requires states to develop an asset management plan and both states and MPOs are required
to adopt targets related to Bridge and Pavement Conditions to better maintain and preserve our
infrastructure.
The federal legislation focuses on the National Highway System (NHS). The National Highway System (NHS) is a network of strategic highways within the United States, including the Interstate Highway System and other roads serving major airports, ports, rail or truck terminals, railway stations, pipeline terminals and other strategic transport facilities. As part of the federal legislation the Bridge and Pavement Targets are based on the following performance measures. Bridge Condition Measures
Percent of NHS Bridges in Poor condition ‐ Bridges rated poor are safe to drive on; however, they are nearing a point where it is necessary to either replace the bridge or extend its service life through substantial rehabilitation investments
Percent of NHS Bridges in Good condition ‐ Bridges rated as good will be evaluated by cost to maintain good condition. Bridges rated as FAIR will be evaluated by the cost of replacement vs. rehabilitation to bring the structure back to a condition rating of good.
Pavement Condition Measures
Percent of interstate pavement in Poor condition ‐ Interstate pavements in poor condition need work due to either the ride quality or due to a structural deficiency.
Percent of interstate pavement in Good condition: Interstate pavements rated as good will be considered for potential pavement preservation treatments to maintain the good rating
Percent of pavements in Poor condition ‐ Non‐interstate NHS pavements in poor condition need major maintenance. These will be evaluated for potential projects
Percent of pavements in Good condition ‐ Non‐interstate NHS pavements in good condition will be evaluated for potential preservation treatments.
GDOT adopted Bridge and Pavement Condition targets on May 16th, 2018 (see Table 6). The MPO’s are required to either support the state’s targets through planning and programming activities or establish their own quantifiable targets within 180 days of the State target establishment. The CORE MPO adopted to support the state’s targets through planning and programming projects on August 24, 2018.
Figure 4: 2040 Total Mobility Goals and State of Good Repair

F‐14
Table 6: GDOT Bridge and Pavement Condition Targets
GDOT will be collecting and analyzing the data statewide. The MPOs will be reporting on efforts to make progress towards the state’s targets through planning and programming projects. A current list of projects in the plan that support making progress towards the state’s targets can be found in table 10. Bridge and Pavement Condition Targets are required to be adopted every 4 years thereafter, with a revision possible at the 2‐year mark. Information GDOTs Transportation Asset Management Plan can be found on their website at www.dot.ga.gov/IS/TAM
System Performance: Reliability, Freight and Air Quality The Moving Ahead for Progress in the 21st Century Act (MAP‐21) and Fixing America’s Surface Transportation Act (FAST ACT) requires states and MPOs to adopt System Performance Targets focused on reducing traffic congestion, improving efficiency of the system and freight movement and protecting the environment. The 2040 Total Mobility Plan shows the importance of a system performance by having adopted several goals which support these targets such as protecting the environment, supporting economic vitality, mobility and system management as highlighted in Figure 7.
Asset Performance Measure Target
Percent of NHS Bridges in Good
condition as a percentage of total
NHS bridge deck area
> 60% (NHS) in Good Condition
Percent of interstate NHS pavement
in POOR condition< 5% in Poor Condition
Percent of interstate NHS pavement
in GOOD condition> 50% in Good Condition
Percent of NHS pavements in POOR
condition< 12% in Poor Condition
Percent of NHS pavements in GOOD
condition> 40% in Good Condition
Georgia Targets for Bridge and Pavement Conditons (PM2)
Adopted May 2018
*Bridge conditions are based on the results of inspections on all bridges structures
*Pavement conditions are measured through field inspections
Non‐Interstate NHS
Interstate NHS
Percent of NHS Bridges in Poor
condition as a percentage of total
NHS bridge deck area.
Bridge Structures*
< 10% (NHS) in Poor Condition

F‐15
GDOT adopted System Performance Targets on May 16th, 2018 (see Table 5). The MPOs are required to either support the state’s targets through planning and programming activities or establish their own quantifiable targets within 180 days of the State target establishment. The CORE MPO adopted to support the state’s targets on August 24, 2018. GDOT will be collecting and analyzing the data at a statewide level and the CORE MPO will be reporting on our efforts to make progress towards the state’s targets through planning and programming projects. System Performance Targets are required to be adopted every 4 years thereafter, with a revision possible at the 2‐year mark. The System Performance Targets will be measured by the following three performance measures:
Level of Travel Time Reliability (LOTTR) – The LOTTR is the ratio of the longer travel times (80th percentile) to a “normal” travel time (50th percentile). The measure is intended to capture person‐miles traveled that are reliable. Person‐miles take into account the users of the roadway including bus, auto, and truck occupancy levels.
Freight movement will be assessed by the Truck Travel Time Reliability (TTTR) Index ‐ The TTTR ratio will be generated by dividing the 95th percentile time by the normal time (50th percentile) for each segment. The TTTR Index will be generated by multiplying each segment’s largest ratio of the five periods by its length, then dividing the sum of all length‐weighted segments by the total length of Interstate.
Total emissions reduction ‐ The summation of 2 year and 4 year totals of emissions reductions of applicable criteria pollutant and precursor, in kilograms per day, for all projects funded with Congestion Mitigation and Air Quality (CMAQ) funds. There currently no CMAQ funded projects in the Savannah area but this information will be collected by GDOT on a statewide level where applicable.
Figure 5: 2040 Total Mobility Goals and System Performance

F‐16
Table 7: GDOT Adopted System Performance Targets
Implementation differs for the Interstate and non‐Interstate National Highway System (NHS) measures for the first performance period. State DOTs must establish 2‐ and 4‐ year targets for the Interstate, but only a 4‐year target for the non‐Interstate NHS, by May 20, 2018. Those targets will be reported in the State’s baseline performance period report. The State DOTs have the option to adjust 4‐year targets in their mid performance period progress report, due October 1, 2020. For the first performance period only, there is no requirement for States to report baseline condition performance or 2‐year targets for the non‐Interstate NHS before the mid performance period progress report. This will allow State DOTs to consider more complete data. The process will align for both Interstate and non‐Interstate measures with the beginning of the second performance period on January 1, 2022. A current list of projects in the plan that support making progress towards the state’s targets can be found in table 10.
Transit Asset Management The 2016 Transit Asset Management (TAM) Final Rule as part of the Moving Ahead for Progress in the 21st Century Act (MAP‐21) and Fixing America’s Surface Transportation Act (FAST ACT) develops a framework for transit agencies to monitor and manage public transportation assets, improve safety, increase reliability and performance, and establish performance measures in order to help keep their systems operating smoothly and efficiently. The 2040 Total Mobility Plan shows the importance of a system in a state of good repair by having an adopted goal for system maintenance as shown in Figure 6. TAM helps to prioritize projects and optimize funding allocations based on the condition of transit assets to achieve and maintain a State of Good Repair (SGR) for the nation’s public transportation assets. Transit agencies are required to develop TAM plans and submit their targets to the Federal Transit Administration’s (FTA’s) National Transit Database (NTD). Currently, there is an estimated $85.9 billion transit SGR backlog. The regulations apply to all transit providers that are recipients or subrecipients of federal financial assistance under 49 U.S.C. Chapter 53 and own, operate, or manage transit capital assets used in the provision of public transportation.
Geographic
Extent Applicable Roadways 2 Year Target 4 Year Target
Percent of person‐miles traveled
on the non‐interstate NHS that are
reliable
Statewide Non‐Interstate N/A 81%
Truck travel Time Reliability (TTTR)
IndexStatewide Interstate 1.66 1.78
Emissions Total Emissions Statewide All RoadsVOC: 764.309 kg/day
NOx: 1,429.118 kg/day
VOC: 748.185 kg/day
NOx: 1,347.270 kg/day
Georgia Targets for System Performance (PM3)
Adopted May 2018
73% 67%
System Efficiency
Percent of person‐miles traveled
on the interstate that are reliableStatewide Interstate
Performance Measure

F‐17
There are two transit agencies operating within the CORE MPO’s metropolitan planning boundary ‐ the Chatham Area Transit Authority (CAT) and the Coastal Regional Commission (CRC). CAT is a direct recipient of FTA funds and developed its own TAM Plan. CRC is a participant in the GDOT group TAM plan. In addition to TAM performance targets the plans are required to include an inventory of capital assets, conditions assessment, decision support tools and investment prioritization. The TAM plans must be updated every four years while the targets are to be updated annually. The transit agencies are responsible for collecting data and reporting their progress towards meeting their targets to the NTD annually. The transit agency submission to the NTD should include: projected targets for the next fiscal year, condition assessments and performance results, and a narrative report on changes in transit system conditions and the progress toward achieving previous performance targets. Asset performance is measured by asset class. There are three categories of assets being measured: rolling stock, equipment and facilities. The targets are set within these categories by asset class such as buses, vans, ferryboat etc. As a part of the TAM framework the CORE MPO is required to also set a TAM target. The MPO has adopted Regional TAM Targets which encompass both CAT and CRC needs (see Table 8). The MPO will reflect the support of the targets through its planning and programming activities. The MPO is not required to report to the NTD.
Figure 6: 2040 Total Mobility Goals and Transit Asset Management

F‐18
Table 8: Regional Transit Asset Management Targets
To support the regional transit agency targets for asset management several projects are identified in the finically constrained portion of the 2040 Total Mobility Plan as well as programmed it the FY 2018‐2021 TIP. Table 9 lists the transit asset management supportive projects in our current planning documents. For more detail on CAT’s and CRC’s other initiatives please visit CAT’s web page at www.catchacat.org and CRCs web page at www.crc.ga.gov. Table 9: Programmed Transit Asset Management Projects
0013280 CAT Vehicle Purchase CAT ADA compliant Vehicle Purchase for 2018
0015977 CAT‐ Bus Reliability Initiative
Chatham Area Transit Authority (CAT) is seeking funding to replace three heavy‐duty diesel
transit vehicles in its aging fleet. CAT proposes to use the funding to replace the oldest and least
reliable buses in its fleet, which were delivered in 2003. With an updated fleet of vehicles and a
more consistent replacement schedule, CAT will be able to provide a more reliable and higher
quality transit service to the community.
0015978 CAT ‐ Maintenance Equipment Upgrades
Chatham Area Transit Authority (CAT) is requesting funds to procure essential maintenance
equipment: a tire alignment rack, vehicle lift systems, diagnostic technology, software upgrade,
radio systems, facility upgrades, and various tools.
0015979 CAT ‐ Electric Bus Conversion Initiative
Chatham Area Transit Authority (CAT) is requesting funds to retire and replace two heavy‐duty
diesel transit vehicles with two zero emission, battery‐powered electric transit vehicles and a
fast‐charger. Converting CAT’s fleet to battery‐powered electric vehicles will not only reduce the
community’s carbon footprint, but it will also reduce maintenance costs over the lifespan of the
vehicles. CAT proposes to use the funding to replace the oldest and least reliable buses in its
fleet, which were delivered in 2003. The EV fast‐charger will be installed at one of CAT’s primary
transfer locations for maximum deployment flexibility.
TransitSection 5307, Section 5337, Section 5339, Ferry boat
program
Projects include operating assistance, safety and security, passenger amentias, transit planning,
facility enhancements, vehicle purchases in addition to a new ferry maintenance facility on
Hutchinson Island and new West River Street ferry dock near the Kessler development.
Transit Coastal Region Rural Planning Funds Section 5304 and 5311Planning, Capitola and Operations
*This list contains only projects programmed the regional TIP.
For more information on CAT visit http://www.catchacat.org/about‐cat/transparency/ and for CRC visit http://www.crc.ga.gov/departments/trans/trans.html
PI # DESCRIPTION DESCRIPTION

F‐19
Next Steps The CORE MPO will continue to support the state’s targets through planning and programming activities and document system performance towards meeting the state’s targets. MTP update due in late August 2019 will fully integrate all the adopted targets.

Appendix A: Related Performance Based Planning and Programming Resolutions and Agreements


Appendix B: Public Participation Materials

June 2018
PUBLIC NOTICE for MTP and TIP AMENDMENTS
The Coastal Region Metropolitan Planning Organization (CORE MPO), the transportation planning agency for the Savannah urbanized area, is requesting the public to review and provide comments on proposed amendments to the 2040 Metropolitan Transportation Plan (MTP) and FY 2018 – 2021 Transportation Improvement Program (TIP). The MTP evaluates transportation system performance and is a source of policies, projects and actions that implement community vision of transportation improvements needed to reach the community goals. The TIP is the short-term programming document that lists transportation improvement projects to receive funding in the next four years. Reports providing details of the proposed MTP and TIP amendments are available for review at the Live Oak public libraries, the Chatham County-Savannah Metropolitan Planning Commission (MPC) office, the MPC website at http://www.thempc.org/Dept/Tran, and other public review agencies. Any changes to the reports will be posted on the website. The comment period starts on June 1, 2018 and written comments on the proposed MTP and TIP amendments will be accepted until close of business on June 15, 2018. Please send your comments to Stephanie Rossi, Metropolitan Planning Commission, 110 E. State Street, Savannah, GA 31401, or via email at [email protected]. CORE MPO will host two separate public hearings at the June 2018 CORE MPO Board meeting – one for the proposed 2040 MTP amendments, and the other for the proposed FY 2018 – 2021 TIP amendments. Meeting time and location are listed below: CORE MPO Board Meeting June 27, 2018 10:00 a.m. MPC Arthur A. Mendonsa Hearing Room 112 East State Street, Savannah, GA 31401
For a complete list of public review agencies or additional information regarding the proposed MTP and TIP amendments, please call (912) 651-1476. Disclaimer: The Chatham County-Savannah Metropolitan Planning Commission (MPC) and Coastal Region Metropolitan Planning Organization (CORE MPO) are committed to the principle of affirmative action and prohibit discrimination against otherwise qualified persons on the basis of race, color, religion, national origin, age, physical or mental disability, and where applicable, sex (including gender identity and expression), marital status, familial status, parental status, religion, sexual orientation, political beliefs, genetic information, reprisal, or because all or part of an individual's income is derived from any public assistance program in its recruitment, employment, facility and program accessibility or services. MPC and CORE MPO are committed to complying with and enforcing the provisions of the Title VI of the Civil Rights Act and other federal and state non-discrimination authorities. CORE MPO is also committed to taking positive and realistic affirmative steps to ensure the protection of rights and opportunities for all persons affected by its plans and programs.

Appendix C: System Performance Report

1
Coastal Region Metropolitan Planning Organization System Performance Report 2018
Background
Pursuant to the Moving Ahead for Progress in the 21st Century Act (MAP-21) Act enacted in 2012 and the Fixing America's Surface Transportation Act (FAST Act) enacted in 2015, state Departments of Transportation (DOT) and Metropolitan Planning Organizations (MPO) must apply a transportation performance management approach in carrying out their federally-required transportation planning and programming activities. The process requires the establishment and use of a coordinated performance-based approach to transportation decision-making to support national goals for the federal-aid highway and public transportation programs.
On May 27, 2016, the Federal Highway Administration (FHWA) and the Federal Transit Administration (FTA) issued the Statewide and Nonmetropolitan Transportation Planning; Metropolitan Transportation Planning Final Rule (The Planning Rule).1 This regulation implements the transportation planning and transportation performance management provisions of MAP-21 and the FAST Act.
In accordance with The Planning Rule and the Georgia Performance Management Agreement between the Georgia DOT (GDOT) and the Georgia Association of Metropolitan Planning Organizations (GAMPO), GDOT and each Georgia MPO must publish a System Performance Report for applicable performance measures in their respective statewide and metropolitan transportation plans and programs. The System Performance Report presents the condition and performance of the transportation system with respect to required performance measures, documents performance targets and progress achieved in meeting the targets in comparison with previous reports. This is required for the following:
In any statewide or metropolitan transportation plan or program amended or adopted after May 27, 2018, for Highway Safety/PM1 measures;
In any statewide or metropolitan transportation plan or program amended or adopted after October 1, 2018, for transit asset and safety measures; and
in any statewide or metropolitan transportation plan or program amended or adopted after May 20, 2019, for Pavement and Bridge Condition/PM2 and System Performance/PM3 measures.
The Coastal Region MPO (CORE MPO) Fiscal Year (FY) 2018-2021 Transportation Improvement Program (TIP)_ was amended on June 2018. Per the Planning Rule and the Georgia Performance Management Agreement, the System Performance Report for the CORE MPO FY 2018-2021 TIP is included, herein, for the required Highway Safety/PM1 performance measures.
1 23 CFR 450.314

2
Highway Safety/PM1
Effective April 14, 2016, the FHWA established the highway safety performance measures2 to carry out the Highway Safety Improvement Program (HSIP). These performance measures are:
1. Number of fatalities;
2. Rate of fatalities per 100 million vehicle miles traveled;
3. Number of serious injuries;
4. Rate of serious injuries per 100 million vehicle miles traveled; and
5. Number of combined non-motorized fatalities and non-motorized serious injuries.
Safety performance targets are provided by the States to FHWA for each safety performance measure. Current safety targets address calendar year 2018 and are based on a five-year rolling average (2014-2018). Georgia statewide safety performance targets for 2018 are included in Table 13. The Coastal Region MPO adopted the Georgia statewide safety performance targets on December 13, 2017. Statewide system conditions for each performance measure are also included in Table 1. System conditions reflect baseline performance, which for this first system performance report is the same as the current reporting period (2012-2016).
The latest safety conditions will be updated on a rolling 5-year window and reflected within each subsequent System Performance Report, to track performance over time in relation to baseline conditions and established targets.
Table 1. Highway Safety/PM1, System Conditions and Performance
Performance Measures
Georgia Statewide Baseline Performance
(Five-Year Rolling Average 2012-2016)
2018 Georgia Statewide Performance Target
(Five-Year Rolling Average 2014-2018)
Number of Fatalities 1,305.2 1,593.0
Rate of Fatalities per 100 Million Vehicle Miles Traveled
1.148 1.320
Number of Serious Injuries 17,404.6 19,643.0
Rate of Serious Injuries per 100 Million Vehicle Miles Traveled
15.348 16.318
Number of Combined Non-Motorized Fatalities and Non-Motorized Serious Injuries
1,138.0 1,027.2
The CORE MPO recognizes the importance of linking goals, objectives, and investment priorities to stated performance objectives, and that establishing this link is critical to the achievement of national transportation goals and statewide and regional performance targets. As such, the FY 2018-20YY TIP planning process directly reflects the goals, objectives, performance measures, and targets as they are available and described in other State and public transportation plans and
2 23 CFR Part 490, Subpart B 3 https://safety.fhwa.dot.gov/hsip/spm/state_safety_targets/

3
processes; specifically, the Georgia Strategic Highway Safety Plan (SHSP), the Georgia Highway Safety Improvement Program (HSIP), the current Georgia Statewide Transportation Plan (SWTP), and the current CORE MPO 2040 Total Mobility Plan the region’s Metropolitan Transportation Plan (MTP).
The Georgia SHSP is intended to reduce the number of fatalities and serious injuries resulting from motor vehicle crashes on public roads in Georgia. Existing highway safety plans are aligned and coordinated with the SHSP, including (but not limited to) the Georgia HSIP, MPO and local agencies’ safety plans. The SHSP guides GDOT, the Georgia MPOs, and other safety partners in addressing safety and defines a framework for implementation activities to be carried out across Georgia.
The GDOT HSIP annual report provides for a continuous and systematic process that identifies and reviews traffic safety issues around the state to identify locations with potential for improvement. The ultimate goal of the HSIP process is to reduce the number of crashes, injuries and fatalities by eliminating certain predominant types of crashes through the implementation of engineering solutions.
The GDOT SWTP summarizes transportation deficiencies across the state and defines an investment portfolio across highway and transit capacity, highway preservation, highway safety, and highway operations over the 25-year plan horizon. Investment priorities reflect optimal performance impacts across each investment program given anticipated transportation revenues.
The CORE MPO 2040 Total Mobility Plan the region’s MTP increases the safety of the transportation system for motorized and non-motorized users as required by The Planning Rule. The RTP identifies safety needs within the metropolitan planning area and provides funding for targeted safety improvements.
To support progress towards approved highway safety targets, the FY 2018-2021 TIP includes a number of key safety investments. A total of $443 million has been programmed in the FY 2018-2021 TIP to improve highway safety; averaging approximately $148 million per year.