core.ac.uk stock market integration: globalization, valuation and convergence pui sun tamy...
TRANSCRIPT
econstor www.econstor.eu
Der Open-Access-Publikationsserver der ZBW – Leibniz-Informationszentrum WirtschaftThe Open Access Publication Server of the ZBW – Leibniz Information Centre for Economics
Standard-Nutzungsbedingungen:
Die Dokumente auf EconStor dürfen zu eigenen wissenschaftlichenZwecken und zum Privatgebrauch gespeichert und kopiert werden.
Sie dürfen die Dokumente nicht für öffentliche oder kommerzielleZwecke vervielfältigen, öffentlich ausstellen, öffentlich zugänglichmachen, vertreiben oder anderweitig nutzen.
Sofern die Verfasser die Dokumente unter Open-Content-Lizenzen(insbesondere CC-Lizenzen) zur Verfügung gestellt haben sollten,gelten abweichend von diesen Nutzungsbedingungen die in der dortgenannten Lizenz gewährten Nutzungsrechte.
Terms of use:
Documents in EconStor may be saved and copied for yourpersonal and scholarly purposes.
You are not to copy documents for public or commercialpurposes, to exhibit the documents publicly, to make thempublicly available on the internet, or to distribute or otherwiseuse the documents in public.
If the documents have been made available under an OpenContent Licence (especially Creative Commons Licences), youmay exercise further usage rights as specified in the indicatedlicence.
zbw Leibniz-Informationszentrum WirtschaftLeibniz Information Centre for Economics
Tam, Pui Sun; Tam, Pui I.
Working Paper
Rethinking stock market integration: Globalization,valuation and convergence
SFB 649 Discussion Paper, No. 2012-052
Provided in Cooperation with:Collaborative Research Center 649: Economic Risk, Humboldt UniversityBerlin
Suggested Citation: Tam, Pui Sun; Tam, Pui I. (2012) : Rethinking stock market integration:Globalization, valuation and convergence, SFB 649 Discussion Paper, No. 2012-052
This Version is available at:http://hdl.handle.net/10419/79570
SFB 649 Discussion Paper 2012-052
Rethinking stock market integration:
Globalization, valuation and convergence
Pui Sun Tam * Pui I Tam **
* University of Macau, China ** Macao Polytechnic Institute, China
This research was supported by the Deutsche Forschungsgemeinschaft through the SFB 649 "Economic Risk".
http://sfb649.wiwi.hu-berlin.de
ISSN 1860-5664
SFB 649, Humboldt-Universität zu Berlin Spandauer Straße 1, D-10178 Berlin
SFB
6
4 9
E
C O
N O
M I
C
R
I S
K
B
E R
L I
N
Rethinking stock market integration:
Globalization, valuation and convergence∗
Pui Sun Tam†
University of Macau
Pui I Tam‡
Macao Polytechnic Institute
July 5, 2012
Abstract
This paper aims to study the extent of integration among developed and emerg-
ing stock markets in the onset of globalization through the formulation of a unified
conceptual framework that synthesizes the stock valuation model and the convergence
hypothesis. Market integration manifests in the convergence of stock valuation ratios
of markets in the long run, where valuation ratios are reflective of stock fundamentals
driven by common global factors across markets. The spectrum of transition dynamics
of markets towards integration is explored with variants of valuation ratios and differ-
ent notions of convergence. Results reveal the time-varying nature of the global stock
market integration process that is characterized by heterogeneous transition experience
of markets at both the total market and disaggregated industrial sector levels.
JEL classification: F36, G12, G15
Keywords: Convergence, Stock market integration, Valuation ratio
∗Financial support from the Deutsche Forschungsgemeinschaft via CRC 649 "Economic Risk", Humboldt-Universität zu Berlin, is gratefully acknowledged.†Corresponding author. Faculty of Business Administration, University of Macau, Av. Padre Tomás
Periera, Taipa, Macau. Phone: +853-8397-4756. Fax: +853-2883-8320. Email: [email protected].‡School of Business, Macao Polytechnic Institute, Rua de Luís Gonzaga Gomes, Macao. Phone: +853-
8599-3325. Fax: +853-2872-7653. Email: [email protected].
1
1. Introduction
As the world is undergoing the rapid process of globalization, international trade in
both goods and financial assets have expanded tremendously. Fast development in infor-
mation technology and means of communications have greatly facilitated the international
transmission of information, dissemination of knowledge and diffusion of technology. The
financial markets are characterized by dramatic evolutions, with liberalization of financial
transactions, removal of restrictions on cross-border capital flows, development of new fi-
nancial products, as well as harmonization of practices, policies, regulations and corporate
governance rules. A key question then arises is whether global stock markets have become
more integrated (Beine et al., 2010; Masih and Masih, 1999), which has been referred to
as the globalization of stock markets (Davis and Marquis, 2005; Masih and Masih, 2002).
This issue has become a core subject of econometric concern due to some significant im-
plications. Market integration promotes international risk diversification, enhances effi cient
allocation of capital, lowers the cost of capital, stimulates investment flows, and thus spurs
real economic growth (Arouri et al., 2010; Baele et al., 2004; Bekaert et al., 2005). More
integrated markets, by virtue of broadening the investor base, also improves the accuracy of
public information and reduces volatility (Umutlu et al., 2010). However, a greater extent of
market integration leads to more similar risk-return characteristics across markets (Eun and
Lee, 2010a), and erodes gains from international portfolio diversification for financial risk
reduction. Moreover, intensified linkages in extreme market realizations harbor cross-border
contagion and threaten global financial stability (Morana and Beltratti, 2008). International
propagation of shocks via stock markets also has a bearing on the design of monetary policy
by policy makers (Berben and Jansen, 2005).
There is a vast literature on the study of stock market integration, but the majority of
them falls short of addressing the globalization of stock markets per se by confining their
analyses solely on panels of markets with similar characteristics. While some studies focus
2
on markets in accordance with their maturity levels (for example, Berben and Jansen, 2005;
De Jong and De Roon, 2005; Rua and Nunes, 2009; Umutlu et al., 2010), some others
address integration on a regional basis (refer to Aggarwala and Kyaw, 2005; Apergis, et al.
2011; Click and Plummer, 2005; Hunter, 2006; Marashdeh and Shrestha, 2010; Moerman,
2008; Mylonidis and Kollias, 2010; Yu et al., 2010, for instance). An extensive coverage of
these homogeneous market panels is found in Narayan et al. (2011). Although there are
also works on investigating integration across these types of panels (for example, Caporale
and Spagnolo, 2011; Mallik, 2006; Syllignakis and Kouretas, 2010; Yu and Hassan, 2008), to
the best of our knowledge, only a few exceptions, including Bekaert et al. (2007, 2011) and
Pukthuanthong and Roll (2009), are devoted to the study of market integration across the
fuller board of global developed and emerging markets. With the onset of globalization,
emerging markets have been actively engaging in liberalization activities and attracting
considerable capital inflows due to high expected returns and opportunities for investment
diversification (Arouri et al., 2010). This has, however, also contributed to a substantial
increase in their financial vulnerability due to external shocks, as in the recent global financial
crisis. Thus, empirical interest on global stock market integration has its practical grounding
and financial significance, but has received limited attention on the contrary.
In this paper, we rethink stock market integration in the globalized context, and con-
tribute to the meager literature on the issue by the systematic build-up of a unified concep-
tual framework for its analysis. The framework essentially comprises a working definition
of market integration, an operational measure of it, and an appropriate methodology for its
assessment. First and foremost, although there is no formal definition, it is commonly held
that markets are integrated when the law of one price and the no arbitrage condition hold
(Baele et al., 2004; Chen and Knez, 1995). Accordingly, assets with the same return and risk
characteristics should be priced identically across markets. The relationship between asset
characteristics and the pricing of an asset can be formulated in a standard stock valuation
model.
3
Under the valuation model, our measure of market integration is based on the normalized
valuations of stocks, including the earnings-price (EP), dividend-price (DP) and book-price
(BP) ratios, along the lines of Bekaert et al. (2007). In so doing, we deviate from the common
use of price and return measures in the literature, as in Pukthuanthong and Roll (2009), to
test for market integration. Realized returns, according to Bekaert and Harvey (2000) and
Fama and French (2002), are susceptible to high volatility and thus may bias the analytic
results. By contrast, valuation ratios, which contain information on fundamentals such as
expected return and growth opportunities of stocks, are less volatile and tend to give more
precise estimates. Besides, the use of valuation ratios in analysis provides the convenience
of comparison over time for the same stock and across stocks that may be denominated in
different currencies (Bakshi and Chen, 2005; King and Segal, 2008).
It is not until recently that valuation ratios have gained favor as measures in studying
stock market integration. EP is employed by Bekaert et al. (2007, 2011) and Eun and
Lee (2010b), DP is used in De Jong and De Roon (2005), EP and DY are considered in
Carrieri et al. (2004), whereas EP and BP are adopted by Land and Lang (2002) and King
and Segal (2008). We take one step further and consider all three ratios in our analysis for
at least three reasons. First, due to market-specific characteristics, one ratio may excel the
other as the valuation apparatus. For example, while EP is important for valuation in the US
market, book value appears to be a better measure for Japan (Bildersee et al., 1990). Second,
empirical works suggest that a better indicator of fundamentals of stocks is a combination
of these ratios. While Cheng and McNamara (2000) propose the combined EP-BP valuation
method, Jiang and Lee (2007) develop the DP-BP model. Third, it is well-known that
valuation ratios tend to differ across industrial sectors. The use of valuation ratios therefore
facilitate our analysis of market integration at the industry level as to be discussed later on in
this section. Under our valuation model with full market integration, fundamentals of stocks
that are reflective in valuation ratios are driven by common global factors across markets.
In other words, fully integrated markets are characterized by the same steady state balanced
4
growth path of stock valuation in the long run. Thus, as markets become more integrated,
valuation ratios across markets become more equalized, or converge to one another.
The above measurement approach for market integration suggests the convergence hy-
pothesis that is commonly employed by macroeconomists to study cross-economy growth
patterns as a suitable analytic methodology. As pointed out by Bruno et al. (2012), there is
a lack of a theory of financial system convergence in the literature, so that existing empirical
studies of Apergis, et al. (2011), Baele et al. (2004) and Narayan et al. (2011), which
have employed different notions of the convergence methodology to study stock market in-
tegration, are susceptible to the risk of doing measurement without theory. The unified
conceptual framework for stock market integration that we advance in this paper embeds
globalized common factors across markets in a synthesis of the stock valuation model in
finance and the convergence hypothesis in macroeconomics.
We shed light on global stock market integration at both the total market and the individ-
ual industrial sector levels. This is because integration (segmentation) at the total market
level may come with different degrees of segmentation (integration) at the industry level,
and knowledge of such is central for a comprehensive analysis of global market integration
(Carrieri et al., 2004). However, market integration at the disaggregated level has largely
been neglected in the literature, aside from the works of Bekaert et al. (2011), Berben and
Janson (2005), Carrieri et al. (2004) and Rua and Nunes (2009), for instance. We therefore
seek to provide empirical evidence not only on the extent of stock market integration in the
ongoing globalization process, but also the extent to which aggregate market integration is
driven by integration at the industry level.
The remainder of the paper is organized as follows. Section 2 constructs the stock valua-
tion model, in three variants based on the ratios of EP, DP and BP, that lays the foundation
for the investigation of global stock market integration. Section 3 establishes the technical
link between stock valuation in market integration and the convergence hypothesis in growth
empirics. Section 4 describes the large panel data set used in the empirical analysis, while
5

Section 5 details and discusses the empirical results. Section 6 summarizes and concludes.
2. Stock market integration
The definition of stock market integration employed in this paper is based on two well-
established theorems, the law of one price and the absence of arbitrage (Rubinstein, 1976;
Ross, 1978; Harrison and Kreps, 1979). The law of one price states that two assets with
identical payoffs (in every state of nature) should not be priced differently. If the law fails to
hold, then there arises profit opportunity from buying the cheaper asset and selling the more
expensive one. In other words, a stochastic discount factor exists that prices all payoffs. But
profit opportunity is still possible in the presence of zero or negatively priced assets which
always yield nonnegative payoffs and positive payoffs with positive probability. Thus, the
absence of arbitrage requires that the discount factor be strictly positive to rule out non-
positive prices in practice. In the general international context, integrated stock markets
should assign the same positive price to assets in different markets which yield the same
payoffs by the law of one price and in the absence of arbitrage opportunities (Chen and
Knez, 1995). Consequently, markets are integrated if there exists a strictly positive discount
factor, which summarizes the pricing structure of a market, that is common across markets.
To formalize stock market integration in the above sense, consider a stock which belongs
to a certain industry of market i. The stochastic discount factor, πi,t+1, relates the stock’s
current price, Pi,t, to its price and dividend payoffs in the next period, Pi,t+1 and DVi,t+1
respectively, as follows:
Pi,t = Et [πi,t+1(Pi,t+1 +DVi,t+1)] , (1)
where Et is the expectation given information at time t. Iterating this forward to infinity
and assuming that the transversality condition, Et (πi,τDVi,τ ) → 0 as τ → ∞, holds, the
6

current price of the stock equals the present value of all future dividends, that is:
Pi,t = Et
( ∞∑s=1
πi,t+sDVi,t+s
). (2)
Eq. (2) is the most fundamental stock valuation model, the dividend discount model, which
gives the intrinsic value of the stock in level form. Allowing for time-varying log expected
return and assuming continuous compounding, Eq. (2) becomes:
Pi,t = Et
[ ∞∑s=1
(s−1∏k=0
exp(−ρi,t+k))DVi,t+s
], (3)
where ρi,t is the expected return from time t to time t + 1. This can be normalized by
dividend to obtain the price-dividend ratio, popularized by Campbell and Shiller (1989):
PDi,t =Pi,tDVi,t
= Et
[ ∞∑s=1
exp
(s−1∑k=0
−ρi,t+k +4dvi,t+1+k)]
, (4)
where dvi,t denotes log(DVi,t). The price-dividend ratio evolves according to the state vari-
ables of expected return and dividend growth rate. Eq. (4) represents a measure of the
normalized intrinsic value of the stock along the lines of Ang and Liu (1998), Lee et al.
(1999) and Bakshi and Chen (2005).
Alternatively, Eq. (3) in level form of the intrinsic value can be normalized by earnings.
For each time period, denote earnings by EAi,t, the dividend payout ratio by POi,t (=
DVi,t/EAi,t), and their respective log forms by eai,t and poi,t. The following gives the widely
used intrinsic valuation ratio, the price-earnings ratio, which depends on the expected return,
payout ratio and earnings growth rate:
PEi,t =Pi,tEAi,t
=Et
[ ∞∑s=1
exp
(s−1∑k=0
−ρi,t+k +4poi,t+1+k +4eai,t+1+k)POi,t
]. (5)
Define the return on equity as Ri,t = EAi,t/BVi,t−1, where BVt is the book value of the
stock. The intrinsic value of the stock can be related to its book value by re-writing Eq. (4)
7
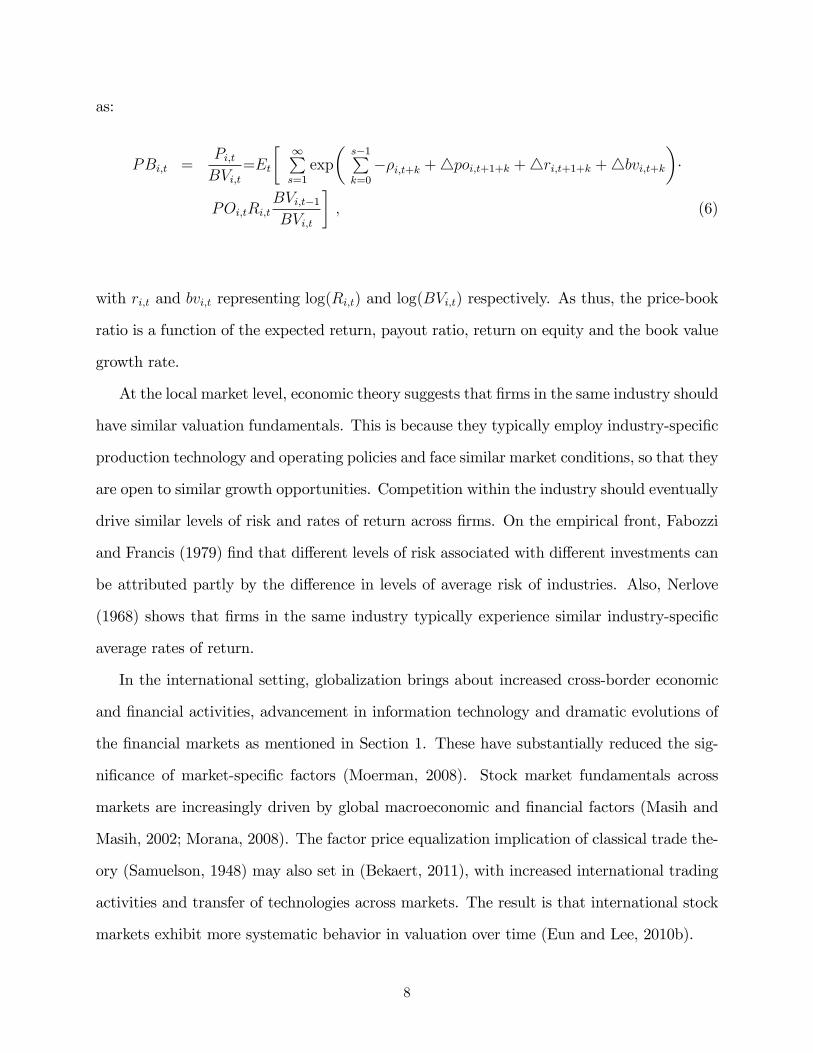
as:
PBi,t =Pi,tBVi,t
=Et
[ ∞∑s=1
exp
(s−1∑k=0
−ρi,t+k +4poi,t+1+k +4ri,t+1+k +4bvi,t+k)·
POi,tRi,tBVi,t−1BVi,t
], (6)
with ri,t and bvi,t representing log(Ri,t) and log(BVi,t) respectively. As thus, the price-book
ratio is a function of the expected return, payout ratio, return on equity and the book value
growth rate.
At the local market level, economic theory suggests that firms in the same industry should
have similar valuation fundamentals. This is because they typically employ industry-specific
production technology and operating policies and face similar market conditions, so that they
are open to similar growth opportunities. Competition within the industry should eventually
drive similar levels of risk and rates of return across firms. On the empirical front, Fabozzi
and Francis (1979) find that different levels of risk associated with different investments can
be attributed partly by the difference in levels of average risk of industries. Also, Nerlove
(1968) shows that firms in the same industry typically experience similar industry-specific
average rates of return.
In the international setting, globalization brings about increased cross-border economic
and financial activities, advancement in information technology and dramatic evolutions of
the financial markets as mentioned in Section 1. These have substantially reduced the sig-
nificance of market-specific factors (Moerman, 2008). Stock market fundamentals across
markets are increasingly driven by global macroeconomic and financial factors (Masih and
Masih, 2002; Morana, 2008). The factor price equalization implication of classical trade the-
ory (Samuelson, 1948) may also set in (Bekaert, 2011), with increased international trading
activities and transfer of technologies across markets. The result is that international stock
markets exhibit more systematic behavior in valuation over time (Eun and Lee, 2010b).
8
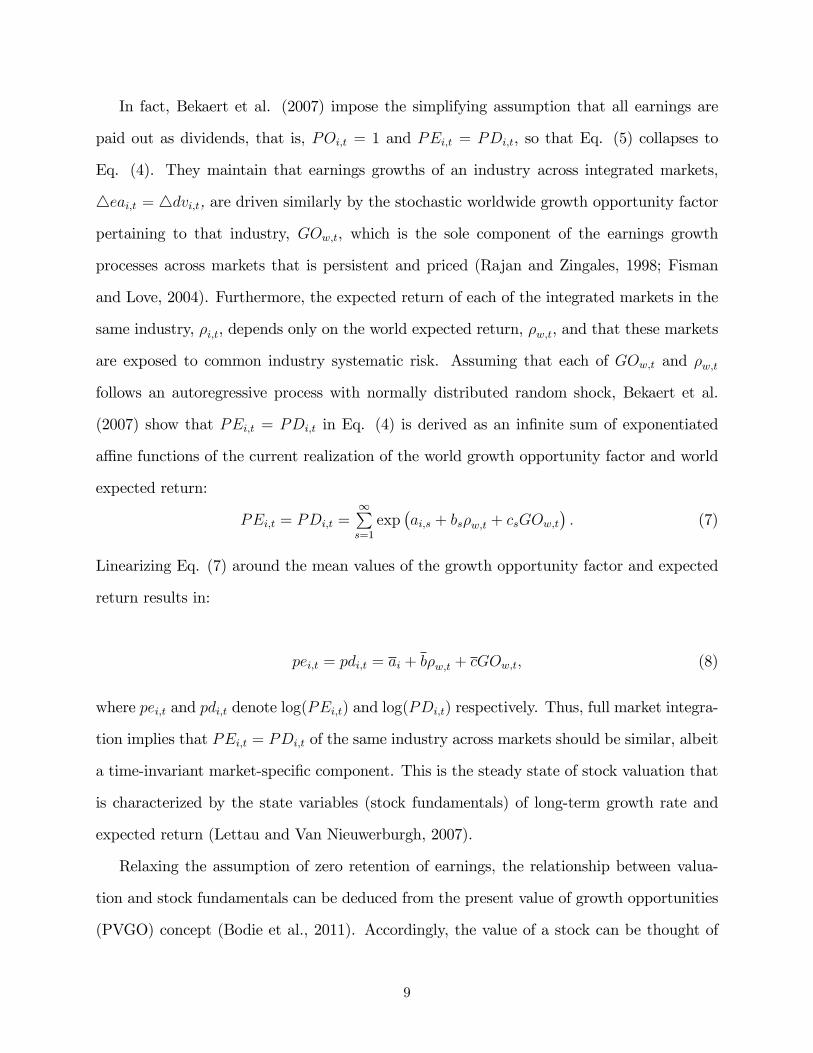
In fact, Bekaert et al. (2007) impose the simplifying assumption that all earnings are
paid out as dividends, that is, POi,t = 1 and PEi,t = PDi,t, so that Eq. (5) collapses to
Eq. (4). They maintain that earnings growths of an industry across integrated markets,
4eai,t = 4dvi,t, are driven similarly by the stochastic worldwide growth opportunity factor
pertaining to that industry, GOw,t, which is the sole component of the earnings growth
processes across markets that is persistent and priced (Rajan and Zingales, 1998; Fisman
and Love, 2004). Furthermore, the expected return of each of the integrated markets in the
same industry, ρi,t, depends only on the world expected return, ρw,t, and that these markets
are exposed to common industry systematic risk. Assuming that each of GOw,t and ρw,t
follows an autoregressive process with normally distributed random shock, Bekaert et al.
(2007) show that PEi,t = PDi,t in Eq. (4) is derived as an infinite sum of exponentiated
affi ne functions of the current realization of the world growth opportunity factor and world
expected return:
PEi,t = PDi,t =∞∑s=1
exp(ai,s + bsρw,t + csGOw,t
). (7)
Linearizing Eq. (7) around the mean values of the growth opportunity factor and expected
return results in:
pei,t = pdi,t = ai + bρw,t + cGOw,t, (8)
where pei,t and pdi,t denote log(PEi,t) and log(PDi,t) respectively. Thus, full market integra-
tion implies that PEi,t = PDi,t of the same industry across markets should be similar, albeit
a time-invariant market-specific component. This is the steady state of stock valuation that
is characterized by the state variables (stock fundamentals) of long-term growth rate and
expected return (Lettau and Van Nieuwerburgh, 2007).
Relaxing the assumption of zero retention of earnings, the relationship between valua-
tion and stock fundamentals can be deduced from the present value of growth opportunities
(PVGO) concept (Bodie et al., 2011). Accordingly, the value of a stock can be thought of
9
as the sum of the no-growth value of the firm and the present value of the firm’s future
investment opportunities, PVGO, made possible through earnings plowback. PVGO is pos-
itive and therefore value enhancing only when planned investments yield a return on equity
greater than the expected rate of return, the discount rate. Thus, the valuation of a stock is
closely tied to the payout ratio and return on equity in practice, which are not accounted for
in the simplified model of Bekaert et al. (2007). Besides, it is also argued that it is price-book
ratio, not price-earnings ratio, that is an appropriate indicator of earnings growth oppor-
tunities of a stock since the former reflects future profitability and is unaffected by current
profitability (Penman, 1996). These considerations motivate our investigation of global stock
market integration based on the trio of price-dividend, price-earnings and price-book ratios,
which are popular valuation ratios for equity investment evaluation.
Our definition of stock market integration in the globalized context thus manifests in
similar levels of stock valuation in accordance to Eqs. (4) to (6) across markets for the same
industry. It can be noted that industrial sectors may not be integrated to the same degree,
due to industry-specific characteristics. For instance, some industries, such as health care and
utilities, may be highly regulated and nontradable in nature (Bekaert et al., 2007). Others,
like the oil and gas sector, may be subject to the strong influence of local business cycle,
or as in the case of the utilities sector, have limited presence of firms on foreign exchanges
traditionally (Carrieri et al., 2004). For these industries, convergence of valuation ratios and
therefore integration across markets are relatively more diffi cult to be realized than those
industries that are less dependent on industry-specific factors. Market integration at the
industry level for some dominating sectors or the majority of sectors then drives market
integration at the aggregate level, as posited by Berben and Janson (2005), Carrieri et al.
(2004) and Rua and Nunes (2009). Thus, as markets become more integrated, valuation
ratios of stocks across markets, both at the total market and industry level, tend to converge
to similar levels.
10
3. Convergence methodology
Since the existence of convergence of stock valuation ratios across markets is taken as
supportive evidence for market integration, the convergence hypothesis established in eco-
nomic growth empirics by macroeconomists is useful for the assessment of global stock market
integration. Three notions of convergence, namely beta, log t and sigma, are particularly
relevant to our present study.
The concept of beta convergence is a basic notion of convergence. Under the paradigm of
the neoclassical growth theory (Solow, 1956), physical capital stock is subject to diminishing
marginal returns. Accordingly, developing economies with lower levels of capital stock than
developed economies commandeer higher rates of return on their physical capital, ceteris
paribus. Capital is then expected to flow to the developing economies. Moreover, developing
economies learn with the diffusion of knowledge and technology from the developed ones.
Consequently, developing economies tend to grow faster than their developed counterparts
initially, with catching up and thereby convergence in income level. The growth rates of
developing economies then slow down, and the growth process eventually leads all economies
to converge to a unique steady state balanced growth path characterized by the rate of growth
of the technological progress in the long run (Islam, 1995). In the case of stock markets,
the expected rates of return on investments tend to differ across markets, especially between
developed and emerging markets. With the onset of the globalization process, the elimination
of cross-border barriers to capital flows and the introduction of new financial products enable
investment funds to be channeled internationally to places where the best risk-adjusted
return can be reaped. At the same time, rapid transfer of technology, deregulation and
harmonization of regulations and practices across markets reduce cross-market differences in
risk-return characteristics and promote more similar growth opportunities across markets.
Taken together, these forces drive stock valuation fundamentals across markets to become
more equalized and tend to converge to the steady state of stock valuation under full market
11
integration.
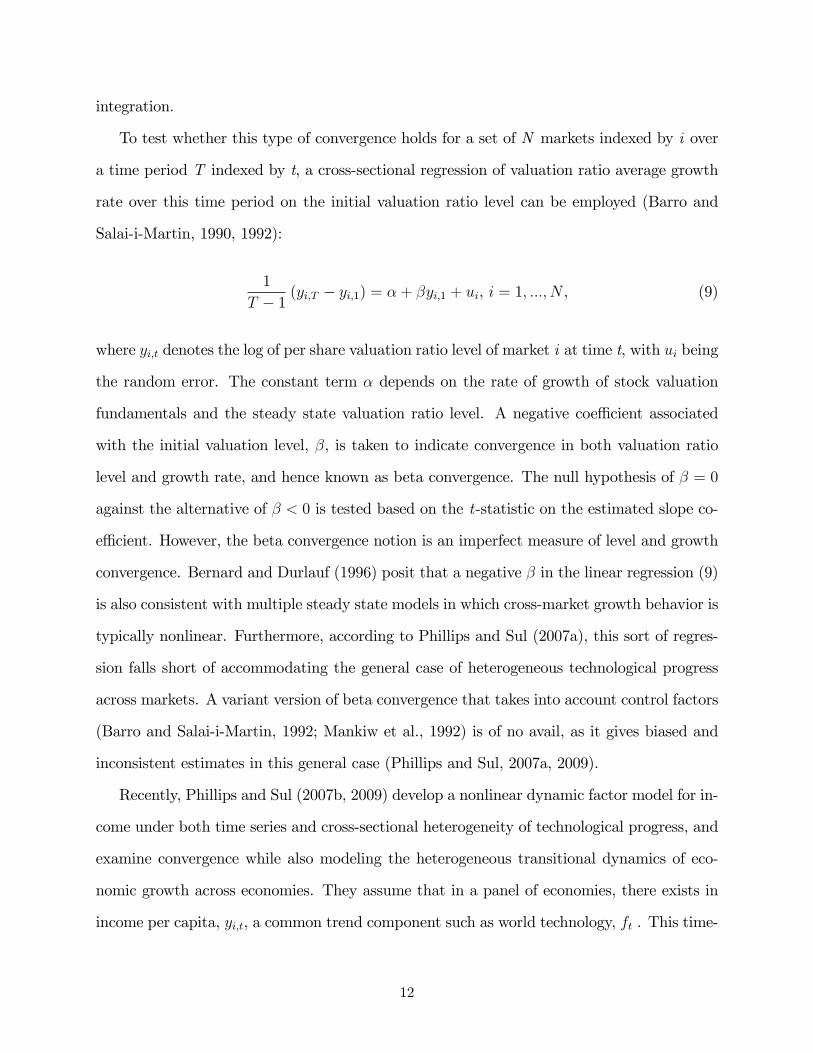
To test whether this type of convergence holds for a set of N markets indexed by i over
a time period T indexed by t, a cross-sectional regression of valuation ratio average growth
rate over this time period on the initial valuation ratio level can be employed (Barro and
Salai-i-Martin, 1990, 1992):
1
T − 1 (yi,T − yi,1) = α + βyi,1 + ui, i = 1, ..., N , (9)
where yi,t denotes the log of per share valuation ratio level of market i at time t, with ui being
the random error. The constant term α depends on the rate of growth of stock valuation
fundamentals and the steady state valuation ratio level. A negative coeffi cient associated
with the initial valuation level, β, is taken to indicate convergence in both valuation ratio
level and growth rate, and hence known as beta convergence. The null hypothesis of β = 0
against the alternative of β < 0 is tested based on the t-statistic on the estimated slope co-
effi cient. However, the beta convergence notion is an imperfect measure of level and growth
convergence. Bernard and Durlauf (1996) posit that a negative β in the linear regression (9)
is also consistent with multiple steady state models in which cross-market growth behavior is
typically nonlinear. Furthermore, according to Phillips and Sul (2007a), this sort of regres-
sion falls short of accommodating the general case of heterogeneous technological progress
across markets. A variant version of beta convergence that takes into account control factors
(Barro and Salai-i-Martin, 1992; Mankiw et al., 1992) is of no avail, as it gives biased and
inconsistent estimates in this general case (Phillips and Sul, 2007a, 2009).
Recently, Phillips and Sul (2007b, 2009) develop a nonlinear dynamic factor model for in-
come under both time series and cross-sectional heterogeneity of technological progress, and
examine convergence while also modeling the heterogeneous transitional dynamics of eco-
nomic growth across economies. They assume that in a panel of economies, there exists in
income per capita, yi,t, a common trend component such as world technology, ft . This time-
12

varying common factor can be shared by individual economies to different extents in accor-
dance with their individual characteristics, bi,t, such that yi,t = bi,tft. The single common fac-
tor structure can be generalized in the stock valuation model where valuation ratio processes
are driven by multiple common trend factors such as long-term growth and expected return
under full market integration in that yi,t =∑M
m=1 bm,i,tfm,t =(∑M
m=1 bm,i,tfm,tf1,t
)f1,t = bi,tft.
As such, bi,t measures the relative deviation of individual market from ft, with ft determining
the common steady state growth path. The growth dynamics experience is heterogeneous
among markets, and can be described by the relative transition parameter, hi,t, constructed
as:
hi,t =yi,t
1N
N∑i=1
yi,t
=bi,t
1N
N∑i=1
bi,t
. (10)
This measures the transition element bi,t for market i relative to the panel average at time
t. The evolution of the relative transition parameter hi,t over time traces out the trajectory
of each market relative to the average, which also measures the relative divergence of the
market from the common steady state growth path. Despite possible transient diverging
relative patterns, long run growth convergence among markets is possible if limt→∞yi,tyj,t= 1
for all i 6= j, or equivalently limt→∞ bi,t = b for all i. In other words, growth convergence
occurs when limt→∞ hi,t = 1 for all i. If bi,t converges faster than the divergence rate of ft,
level convergence is further implied.
To test for the null hypothesis of convergence for all i against the alternative of non-
convergence for some i, the following time series regression is estimated:
log
(H1
Ht
)− 2 log (log t) = a+ γ log t+ εt, t = T0, ..., T , (11)
where Ht = (1/N)∑N
i=1 (hi,t − 1)2 and T0 = [κT ] for some κ > 0, so that the first κ% of
the time series data is discarded before carrying out regression. Under the null of growth
convergence, γ > 0, whereas γ < 0 under the alternative. In the case of level convergence,
13
the null and alternative hypotheses are changed to γ > 2 and γ < 2 respectively. The null
hypothesis, whether growth or level convergence, is based on the t-statistic on the slope
coeffi cient γ in Eq. (11). This is called the log t test due to the log t regressor, and we refer
to this as the log t notion of convergence. Thus, growth convergence does not necessarily
imply level convergence with the log t test. This corroborates the modeling under Eq. (8)
that intrinsic valuation ratios across markets are driven by similar global factors but may
still differ from one another by a time-invariant market-specific component.
Under the log t convergence framework, the transition and convergence experience can
vary substantially from stock market to stock market. This is especially the case when many
shocks, such as wars, major political and economic events and financial crises, affect markets
differentially. These shocks tend to raise the cross-sectional variances of stock valuation
ratios above their steady state levels. If the long run distributions of valuation ratios are
unchanged, the rise in variances is temporary, and cross-sectional dispersions tend to fall
gradually back to the steady state levels over time. This is what is termed the notion of sigma
convergence (Baumol, 1986; Dowrick and Nguyen, 1989; Lichtenberg, 1994). To complement
log t convergence, we are therefore also interested in the behavior of the distribution of
valuation ratios across markets over time. This can be tested based on the likelihood ratio
test of Carree and Klomp (1997), which is constructed according to:
χ = (N − 2.5) log[1 +
1
4
(σ̂21 − σ̂2T
)σ̂21σ̂
2T − σ̂21T
], (12)
where σ̂2t = (1/N)∑N
i=1 (yi,t − yt)2. σ̂2t is the estimated cross-sectional variance, with yt =
(1/N)∑N
i=1 yi,t being the sample mean, and σ̂21T = (1/N)
∑Ni=1 (yi,1 − y1) (yi,T − yT ) being
the covariance of stock valuation between the first and last period. This test statistic has a
chi-square distribution with 1 degree of freedom under the null hypothesis of no convergence.
14
4. Data description
To evaluate global stock market integration based on the stock valuation approach with
the use of the convergence methodology, we collect EP, DP and BP ratios from DataStream’s
Global Equity Indices, which best serve our purpose in comparison with several other data
sources. We consider EP, DP and BP in empirical study for the convenience that they are
expressed in percentage terms. Since our analysis is based on their log transformation, results
remain intact regardless of whether P is in the numerator or denominator of valuation ratios
(Musumeci and Peterson, 2011).
The data base covers data for more than 50 markets. Data on certain markets are dropped
in analysis for reasons of missing observations, short time span and/or non-positive values.
Only time series with data available from 2000 or before are included in our data set as we
are concerned with cross-market phenomena from a long-term perspective. In addition, time
series with non-positive values are dropped, which follows from the notion of stock market
integration that we define in Section 2. The resulting sample consists of 51 markets that
spans the period January 1973 through July 2011. Monthly observations are being used
which minimizes the influence of daily or weekly price fluctuations when compared with
book values in terms of ratios. The monthly data are end-of-month figures.
For each market, DataStream covers a representative sample of stocks making up a
minimum of 75 to 80% of total market capitalization. We refer to four leading market
indices, namely Dow Jones Total Stock Market Index, FTSE Global Equity Index, MSCI
and S&P Global Broad Market Index, to classify markets as either developed or emerging in
our sample. Within each market, stocks are allocated to ten industrial sectors, which include
basic materials, consumer goods, consumer services, financials, health care, industrials, oil
and gas, technology, telecommunications and utilities, based on the Industry Classification
Benchmark jointly created by Dow Jones and FTSE. This level of disaggregation shows the
major differences among industries and avoids excessive details obscuring the overall picture
15
of our analysis, especially when finer industrial breakdown reduces the number of stocks for
many emerging markets substantially. Such broad industrial classification is also adopted in
the literature to investigate the industry factor (Berben and Jansen, 2005; Moerman, 2008;
Rua and Nunes, 2009).
With respect to EP and DP, data for the entire sample period are available for certain
developed markets and the South African emerging market. As for the BP data, the earliest
availability can be dated back to 1980 for similar markets. For all three ratios, it is not
until the late 1980s that data for other developed markets and a few more emerging markets
become available. Starting from the late 1990s, data began to appear for a large number
of emerging markets. Subject to such data limitation, we consider three time periods with
different starting dates but the same ending date of July 2011 in analysis. The first time
period, named Period I, begins from January 1973 for EP and DP, and January 1980 for BP.
The second and third time periods, named Periods II and III, commence from January 1990
and January 2000 respectively. As such, stock market integration can be studied among the
same set of markets over time, instead of among a changing set of markets as data become
available for them, which may bias the results. This is similar in essence to Pukthuanthong
and Roll (2009), who categorize markets into cohorts according to the starting date of data
availability. This time distinction is also consistent with the fact that the process of capital
market liberalization can be traced back to the mid-1970s for the developed markets following
the collapse of the Bretton Woods system (Eun and Lee 2010a), whereas the removal of
capital controls for emerging markets mostly took place in the late 1980s and early 1990s
(Bekaert and Harvey, 2000).
Abstracting from the voluminous description, we provide in Table 1 a snapshot of the
data by presenting the averages of the means and standard deviations of the valuation ratios
for the total market and the ten industrial sectors. Averages are calculated across the three
market groups of all markets, and the subgroups of developed and emerging markets, over
the three time periods under consideration. Notice that only groups with data available for
16
at least three markets are included in testing for the different notions of convergence among
stock markets. A listing of markets in our data set for EP, DP and BP can be found in
Tables A.1, A.2 and A.3 respectively in the Appendix. The tables also include information
on market classification and data availability in each time period.
Several patterns can be deduced from Table 1. First, the means of valuation ratios for
certain industrial sectors are persistently higher than those of the total market for most or
all market groups over time. These sectors include basic materials, consumer goods, and
financials with respect to all three ratios, oil and gas regarding EP and DP, and utilities for
DP and BP. Second, the sectoral volatilities of ratios measured in terms of standard deviation
are often higher than the market volatility. Third, there is a tendency for the means and
volatilities of valuation ratios to be higher for emerging markets than for developed markets.
This trend is exhibited in both Periods II and III with regards to EP and DP, and Period III
as regards BP. Fourth, for the all-market group with respect to EP and DP, the lowest means
and volatilities generally appear in Period II, contributed by the low levels during 1990-2000.
These observations provide support for our stock market integration investigation from the
dimensions of total market, industrial sector, market group and time period.
5. Test results
In this section, we present and discuss the empirical results based on the three valuation
ratios introduced in Section 2 to gauge the extent of global stock market integration through
the use of the three notions of convergence discussed in Section 3.
5.1. Beta convergence
Fig. 1 provides scatter plots and fitted regression lines of the average growth rates
and the log of the initial level of EP for different market groups in different time periods.
Similarly, Figs. 2 and 3 are for DP and BP respectively. To conserve space, diagrams for
17

different industrial sectors are not included here, but are available upon request. As shown
in these figures, a clear negative relationship between the average growth rate of a ratio and
its initial value is found. In other words, markets which start off to have high valuation ratios
grow slower in their valuation ratios over time than markets with low initial valuation ratios.
The estimated slope coeffi cients in Eq. (9) and their corresponding p-values of the t-statistics
for testing the null of no beta convergence are displayed in Table 2. The t-statistics used
in hypothesis testing are computed from heteroscedasticity-consistent standard errors. The
test results provide overwhelming support for the notion of beta convergence with regards
to the three valuation ratios for the total market across any market group over any time
period.
Table 2 also contains the estimation and test results by industrial sector. Similar to the
total market scenario, there is strong evidence in support of beta convergence for four indus-
tries, namely basic materials, consumer goods, financials and industrials. There are one or
two instances of non-convergence for the industrial sectors of consumer services, technology,
telecommunications and utilities. For consumer services and utilities, non-rejection of the
no beta convergence occurs with respect to BP, in Period II among emerging markets for
the former sector, and in Period I among developed markets for the latter. For technology,
non-rejection occurs in Period I with developed markets based on EP. There is no evidence
against the null of no beta convergence for telecommunications with regards to DP in Period
I among developed markets, and in Period III among emerging markets. More non-rejections
of the null are found for the health care and oil and gas sectors. For health care, there is
evidence for divergence among emerging markets, using EP and DP in Period II, and EP
in Period III. Turning to oil and gas, divergence is associated with BP among developed
markets in Period I, and with both EP and DP across emerging markets in Period II.
In summary, according to the notion of beta convergence, stock market integration is
found for the total market, which is largely driven by the industrial sectors of basic mate-
rials, consumer goods, financials and industrials. Health care and oil and gas are the least
18

integrated industrial sectors, in Periods II and III for the former, and Periods I and II for the
latter. In Periods II and III, the phenomenon of market segmentation, if any, occurs only
among the emerging markets. Besides, conclusion for varying degrees of market segregation
across industries is drawn from the use of different ratios, viz., all ratios for oil and gas, EP
and DP for health care, EP for technology, DP for telecommunications, and BP for consumer
services and utilities.
5.2. Log t convergence
Graphical illustrations of the relative transition paths of the total market with respect
to EP, DP and BP are contained in Figs. 4, 5 and 6 respectively. Consider first Fig. 4 for
EP. In Period I, the relative transition paths of some markets appear to diverge from the
rest in the 1970s and the early 1980s, especially for Japan. Thereafter, a narrowing in the
distances of the transition paths from one another is generally observed, especially towards
the end of the period. Such patterns are observed regardless of the inclusion or exclusion
of the South African emerging market. In Period II for the all-market group, the transition
curves close in on each other over the entire period towards unity in general, except for Sri
Lanka in 2000 and 2001, and Portugal towards the end of the period. Similar converging
pattern can also be observed for the developed-market group. Emerging markets show more
varied patterns over time. Their transition paths are seen to first converge until the mid-
1990s, then diverge and eventually begin to converge again in the 2000s. In Period III, the
transition parameters behave in a completely different manner. For all market groups, the
curves first move towards unity in the first half of the period and then turn around to diverge
from one another in the second half of the period.
We next turn to Fig. 5 for DP. In Period I, there is a clear tendency of divergence for the
transition curves during the late 1980s and throughout the 1990s. The curves converge to
more similar levels in the 2000s. For the all-market and developed-market groups in Period
II, the transition curves remain persistently dispersed before 2000. A reduction in dispersion
19

occurs thereafter, which is more evident for the latter market group with the removal of
South Africa. As for the emerging-market group, there is a turnaround from the initial
divergence of transition paths in around 1998. However, starting from the mid-2000s, the
transition paths begin to move away from one another again. In Period III for all market
groups, some large gaps exist among the transition paths in the early part of the period.
These gaps appear to narrow down so that the transition parameters across markets come
to more similar levels later on in the period.
From Fig. 6 for BP, it is observed that markets in Period I exhibit sharp divergence in
values of the transition parameters in the early few years. The beginning of Period II for all
market groups is also characterized by similar, though less pronounced, pattern. In addition,
towards the end of the period, Ireland, which suffers from chronic financial and debt crisis,
shows prominent divergence of its transition path from the rest. Considering the all-market
group in Period III, large gaps exist among the transition curves both in the beginning and
at the end of the period. The sizeable gaps can be attributed to those among the emerging
markets in the beginning of the period, and those among the developed markets at the end
of the period.
Overall, graphical observation suggests that for the total market in Period III, the transi-
tion parameters of markets are mostly dispersed in values away from unity towards the end
of the period. This observation is consistent with the formal statistical test results for growth
and level convergence shown in Table 3, which also displays the estimated coeffi cients for
the log t variable in Eq. (11). Clearly, the null hypotheses of growth and level convergence
are rejected at conventional significance levels based on EP for all market groups, and BP
for the all-market and developed-market groups. In the rest of the scenarios for all periods,
growth convergence is always supported, although level convergence is supported only for the
all-market and developed-market groups in Period I using BP, and for the emerging-market
group in Period II based on DP and BP.
Turning to the sectoral analysis, the industrial sector of consumer goods is the most sup-
20

portive of the null of growth convergence, which is rejected only for the developed markets in
Period I using BP. For the consumer services and technology industrial sectors, the growth
convergence null is rejected only in Period III for all market groups, with EP and BP respec-
tively. Regarding industrials, growth convergence is not supported only by BP in Periods I
and III for the all-market and developed-market groups. With respect to the three industrial
sectors of financials, oil and gas and telecommunications, null rejections are found in Periods
II and III only. For financials, BP lends no support for growth convergence in both periods
for the all-market and developed-market groups, while EP provides evidence against it for all
market groups in Period III. As for oil and gas, growth convergence is rejected based on DP
for all market groups in Period II. In Period III, both EP and BP give unfavorable evidence
against the null for the all-market group, but mixed evidence for the other market groups.
As regards telecommunications, rejections are found in Period II with BP only. In Period
III, both EP and BP are against growth convergence for the all-market group, while mixed
results are found for the other market groups based on all ratios. For the remaining sectors,
there is evidence against growth convergence in all periods for different market groups based
on different ratios.
Some interesting patterns derived from the sectoral test results for level convergence are
as follows. This type of convergence is consistently supported by all ratios for the emerging-
market group in Period II regarding the sectors of consumer goods and financials. In the
same period, it is also supported for consumer services and industrials with the use of DP
and BP. With respect to basic materials, BP is supportive of level convergence in all but one
scenario in Periods II and III. As regards technology and telecommunications, non-rejection
of the level convergence null is found using DP in Periods I and III in all scenarios considered,
and for the developed-market group in all periods for the latter. Utilities, oil and gas and
health care are the sectors that are least supportive of level convergence. The null of level
convergence is not rejected only in one occasion for utilities, and two occasions for the other
two sectors.
21
On the whole, based on the notion of log t convergence, stock market integration for the
total market is largely supported for all market groups in Periods I and II. At the sectoral
level, consumer goods is found to be the most integrated sector, especially beginning from
the 1990s. The sectors of industrials, financials and technology are also highly integrated in
the case of DP, where the growth convergence conclusion can be drawn for all market groups
in all periods, and level convergence is further supported in some occasions. In contrast,
market integration is mainly found for consumer services in Periods I and II, and for oil
and gas in Period I only. The remaining sectors generally exhibit varying degrees of market
integration in different time periods based on one or more valuation ratios. Overall, there
is slightly more evidence for market segmentation in Period III than in the other periods.
In this short Period III, developed markets are found to be slightly more segregated from
one another than emerging markets. Besides, DP provides the most favorable evidence for
market integration amongst all the ratios.
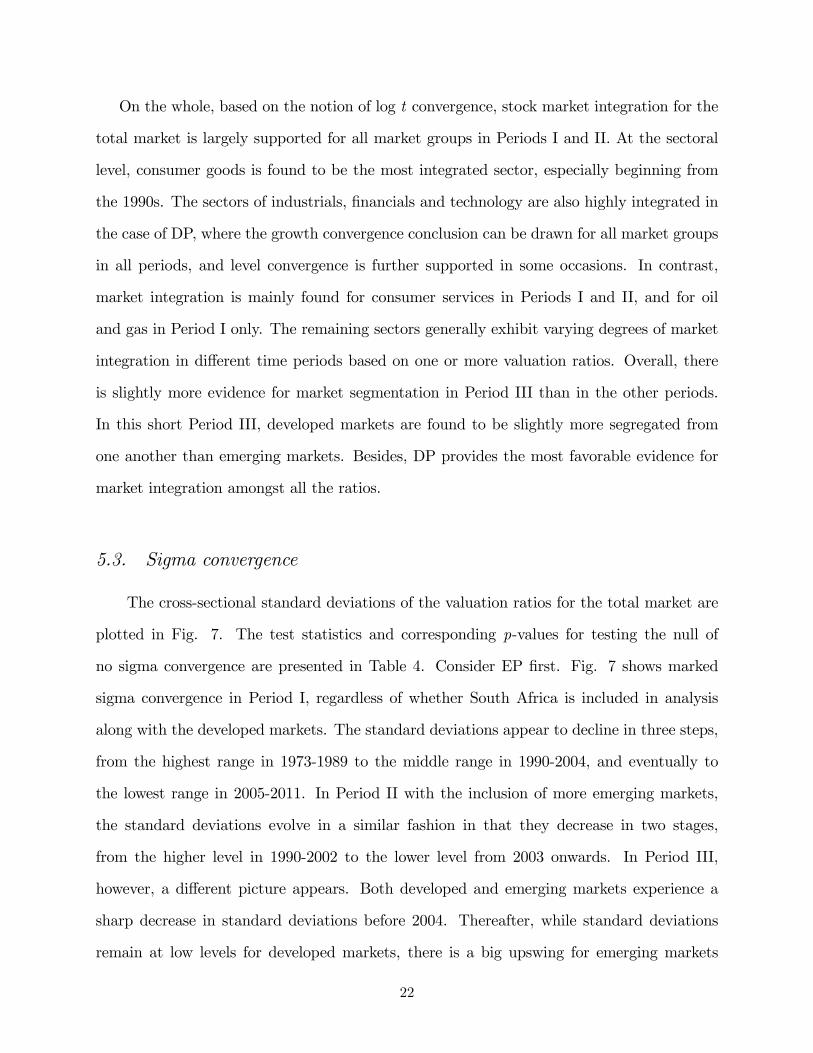
5.3. Sigma convergence
The cross-sectional standard deviations of the valuation ratios for the total market are
plotted in Fig. 7. The test statistics and corresponding p-values for testing the null of
no sigma convergence are presented in Table 4. Consider EP first. Fig. 7 shows marked
sigma convergence in Period I, regardless of whether South Africa is included in analysis
along with the developed markets. The standard deviations appear to decline in three steps,
from the highest range in 1973-1989 to the middle range in 1990-2004, and eventually to
the lowest range in 2005-2011. In Period II with the inclusion of more emerging markets,
the standard deviations evolve in a similar fashion in that they decrease in two stages,
from the higher level in 1990-2002 to the lower level from 2003 onwards. In Period III,
however, a different picture appears. Both developed and emerging markets experience a
sharp decrease in standard deviations before 2004. Thereafter, while standard deviations
remain at low levels for developed markets, there is a big upswing for emerging markets
22

until 2010, which completely nullifies the initial fall. The test results in Table 4 corroborate
the graphical observations. The null of no sigma convergence is rejected in all scenarios
except for emerging markets in Period III.
We next consider DP. In Period I, the standard deviations first increase and then decrease,
with the final levels in 2011 still higher than the initial levels in 1973. In Period II, developed
markets exhibit convergence until 2008 and slight divergence thereafter. As for emerging
markets, the initial convergence is completely offset by the later divergence starting from
2004. There is a clear picture of a decrease in standard deviations for emerging markets
in Period III, from the higher level in 2000-2003 to the lower level thereafter. However,
developed markets first experience divergence, then convergence and divergence again, with
the terminal standard deviations in 2011 not much lower than the starting values in 2000.
The test results are also supportive of sigma convergence for developed markets in Period
II, and emerging markets in Period III.
Turning to BP, after lingering at a high level for the first half of Period I, the standard
deviations begin to decrease in the second half of the period. However, this decrease is
not statistically significant enough to provide evidence for sigma convergence in this period.
Throughout Period II, there is an evident downward trend for the standard deviations across
emerging markets, but not across developed markets. Thus, the null of no sigma convergence
is not rejected for the latter. In Period III, developed markets exhibit a U-turn in their
standard deviations, which is consistent with the non-rejection conclusion from the test
results.
From the test results for different industrial sectors, we find that the consumer goods
sector is the most integrated, with the null of no sigma convergence not being rejected only
for developed markets by BP in all periods, and in Period II with DP. Industrials and basic
materials also exhibit relatively high degree of market integration in all periods for different
market groups, especially with EP and DP for the former sector, and with EP for the
latter. Health care is the most segregated industrial sector. Sigma convergence is supported
23

only for emerging markets in Period III with BP. Results also indicate that the sectors
of technology, oil and gas, telecommunications and utilities are rather segmented. Null
rejections are found only in Periods II and III for these sectors. In the case of technology,
rejection occurs only in two scenarios for the all-market group. Sigma convergence is more
supported in Period III with DP and BP for all market groups with respect to utilities.
Of the remaining two sectors, while there is evidence in support of sigma convergence in all
periods regarding consumer services, evidence for sigma convergence is only found in Periods
II and III concerning financials. Emerging markets are always found to be integrated using
all ratios in Period III for the former, and in Periods II and III for the latter.
Overall, market segmentation prevails in all time periods to some degree. Whether de-
veloped or emerging markets are more segregated depends on the specific sector under in-
vestigation. Also, market segmentation is generally more supportive when using BP than
with the other ratios.
6. Summary and conclusion
This paper rethinks stock market integration and adds to the meager literature by in-
vestigating the crucial issue of stock market integration across the board of global developed
and emerging markets amidst the ongoing globalization process. We formulate a unified con-
ceptual framework that embeds globalized common factors across markets by synthesizing
the stock valuation model in finance and the convergence hypothesis in macroeconomics,
and examine market integration that manifests in the convergence of the valuation ratios of
different markets to a steady state balanced growth path in the long run. The spectrum of
transition dynamics of markets towards integration is explored through examining the con-
vergence processes of earnings-price, dividend-price and book-price ratios among markets
in light of the notions of beta, log t and sigma convergence. We not only study integra-
tion at the total market level, but also attend to the often neglected industry integration
24

by disaggregating the total market into the ten industrial sectors of basic materials, con-
sumer goods, consumer services, financials, health care, industrials, oil and gas, technology,
telecommunications and utilities. Our panel data spans the period January 1973 through
July 2011. Market integration at both the aggregate and disaggregated levels for the global
set of 51 developed and emerging markets is analyzed within the three overlapping time pe-
riods of Period I for 1973/1980-2011, Period II for 1990-2011, and Period III for 2000-2011,
in accordance with the commencement date of data availability for different markets.
Our convergence test results from Tables 2, 3 and 4 are summarized in Table 5. As a
whole, there is strong evidence for beta convergence, while results for log t convergence and
sigma convergence are more mixed. Some interesting patterns can be deduced based on the
several dimensions considered in our analysis. At the aggregate level, market integration for
all markets is the least supported in Period III, which is reasonable given that this is the
shortest time span with the largest market pool. In Periods II and III, emerging markets
are slightly more integrated among themselves than are developed markets. The asymmetric
extent of integration between the two groups of markets may be attributed to the recent
financial and debt problems originating from developed markets.
At the industrial level for all markets, the extent of market integration also varies in
different time periods. In Period I, the consumer services sector is the most integrated.
In Period II, four industrial sectors, namely basic materials, consumer goods, consumer
services and industrials, are found to be more integrated than the others. The consumer
goods and industrials sectors remain relatively highly integrated in Period III. In contrast,
the health care and utilities sectors are found to be the most segregated in Periods I and
II. In Period III, the health care sector persists to be the most segmented, followed by the
financials sector. It is interesting to find that in Period II for emerging markets, all notions
of convergence suggest unanimously the very high degree of integration within the consumer
goods and financials sectors irrespective of valuation ratio. However, results are less favorable
for integration regarding the financials sector among developed markets. These observations
25

may be explained by the various industry-specific factors at work. For instance, the financial
sector may be distressed by local financial turmoil, whereas the oil and gas industry may be
strongly influenced by local business cycle. The consumer goods sector is largely unregulated
and tradable in nature relative to other sectors, which is not the case for the health care and
utilities sectors. The utilities sector is further characterized by the limited presence of firms
on foreign exchanges traditionally.
There are only a few occasions in which different valuation ratios give unanimous evidence
for market integration regardless of the notion of convergence employed. Conclusion on
integration with regards to the consumer goods sector is the most consistent across all
valuation ratios regardless of market group, especially in Period III. Valuation ratios also
give qualitatively similar integration inference in Period II at the total market level among
all markets, for the technology sector among developed markets, and for the financials sector
among emerging markets, as well as in Period III regarding the industrials sector among
emerging markets. These observations may be due to the fact that different valuation ratios
are reflective of similar but not exactly the same set of valuation fundamentals. With more
intensified market integration, each of the valuation fundamentals across markets becomes
increasingly driven by global common factors, and there is a tendency for the convergence
of the same valuation fundamental across markets. However, the different fundamentals
converge at varying speeds due to the heterogeneous transition dynamics of different markets,
giving rise to conflicting evidence for market integration across the different valuation ratios.
In conclusion, the global stock market integration process is found to be time-varying
in nature, as many emerging markets are still undergoing substantial development in their
stock markets, and the transition paths of both developed and emerging markets towards
ultimate convergence are constantly perturbed by shocks arising from major global political,
economic and financial events. Besides, integration at the total market level comes with
different degrees of integration at the industry level, due to the interplay of various industry-
specific factors. On the whole, with the onset of the globalization process, we provide
26
evidence that global stock markets are becoming more integrated under our unified valuation
and convergence conceptual framework. However, markets are still far from ultimate full
integration, as the global integration process is characterized by heterogeneous transition
dynamics across markets and industries. Our results indicate that scrutinization of the
determinants and the underlying mechanism for global stock market integration, especially at
the industry level, would be useful for the design of appropriate international diversification
strategies and coordinated inter-market monetary policies, which is left for future research.
References
Ang, A., Liu, J., 1998. A generalized earnings model of stock valuation. Research Paper No. 1491,
Stanford University.
Apergis, N., Christou, C., Payne, J., 2011. Political and institutional factors in the convergence
of international equity markets: Evidence from the club convergence and clustering procedure.
Atlantic Economic Journal 39, 7-18.
Aggarwal, R., Kyaw, N.A., 2005. Equity market integration in the NAFTA region: evidence from
unit root and cointegration tests. International Review of Financial Analysis 14, 393-406.
Arouri, M.E.H., Jawadi, F., Nguyen, D.K., 2010. The Dynamics of Emerging Stock Markets: Em-
pirical Assessments and Implications. Physica-Verlag, Heidelberg.
Baele, L., Ferrando, A., Hordahl, P., Krylova, E., Monnet, C., 2004. Measuring financial integration
in the Euro Area. Occasional Paper 14, European Central Bank.
Bakshi, G., Chen, Z., 2005. Stock valuation in dynamic economies. Journal of Financial Markets
8, 111-151.
Barro, R.J., Sala-i-Martin, X., 1990. Economic growth and convergence across the United States.
NBER Working Paper No. 3419, National Bureau of Economic Research.
Barro, R.J., Sala-i-Martin, X., 1992. Convergence. Journal of Political Economy 100, 223-251.
27
Baumol, W., 1986. Productivity growth, convergence, and welfare: What the long-run data show.
American Economic Review 76, 1072-1085.
Bekaert, G., Harvey, C.R., 2000. Foreign speculators and emerging equity markets. Journal of
Finance 55, 565-613.
Bekaert, G., Harvey, C.R., Lundblad, C., 2005. Does financial liberalization spur growth? Journal
of Financial Economics 77, 3-55.
Bekaert, G., Harvey, C.R., Lundblad, C., Siegel, S., 2007. Global growth opportunities and market
integration. Journal of Finance 62, 1081-1137.
Bekaert, G., Harvey, C.R., Lundblad, C., Siegel, S., 2011. What segments equity markets. Netspar
Discussion Paper 02/2011-031, Network for Studies on Pensions, Aging and Retirement.
Beine, M., Cosma, A.Vermeulen, R., 2010. The dark side of global integration: Increasing tail
dependence. Journal of Banking and Finance 34, 184-192.
Berben, R.-P., Jansen, W.J., 2005. Comovement in international equity markets: A sectoral view.
Journal of International Money and Finance, 24, 832-857.
Bernard, A.B., Durlauf, S.N., 1996. Interpreting tests of the convergence hypothesis. Journal of
Econometrics 71, 161-173.
Bildersee, J.S., Cheh, J.J., Lee, C., 1990. The international price-earnings ratio phenomenon. Japan
and the World Economy 2, 263-282.
Bodie, Z., Kane, A., Marcus, A.J., 2011. Investments, 9th ed. McGraw-Hill/Irwin: New York.
Bruno, G., Bonis, R., Silvestrini, A., 2012. Do financial systems converge? New evidence from
financial assets in OECD countries. Journal of Comparative Economics 40, 141-155.
Campbell, J.Y., Shiller, R.J., 1989. The dividend-price ratio and expectations of future dividends
and discount factors, Review of Financial Studies 1, 195-228.
Caporale, G.M., Spagnolo, N., 2011. Stock market integration between three CEECs, Russia, and
the UK. Review of International Economics 19, 158-69.
28
Carree, M., Klomp, L., 1997. Testing the convergence hypothesis: A comment. Review of Economics
and Statistics 79, 683-686.
Carrieri, F., Errunza, V., Sarkissian, S., 2004. Industry risk and market integration. Management
Science 50, 207-221.
Chen, Z., Knez, P.J., 1995. Measurement of market integration and arbitrage. The Review of
Financial Studies 8, 287-325.
Cheng, C.S.A., McNamara, R., 2000. The valuation accuracy of the price-earnings and price-book
benchmark valuation methods. Review of Quantitative Finance and Accounting 15, 349-370.
Click, R.W., Plummer, M.G., 2005. Stock market integration in ASEAN after the Asian financial
crisis. Journal of Asian Economics 16, 5-28.
Davis, G.F., Marquis, C., 2005. The globalization of stock markets and convergence in corporate
governance. In: Nee, V., Swedberg, R. (Eds.), The Economic Sociology of Capitalism, Princeton
University Press: Princeton and Oxford.
De Jong, F., De Roon, F. A., 2005. Time-varying market integration and expected returns in
emerging markets. Journal of Financial Economics 78, 583-613.
Dowrick, S., Nguyen, D.-T., 1989. OECD comparative economic growth 1950-85: Catch-up and
convergence. American Economic Review 79, 1010-1030.
Eun, C.S., Lee, J., 2010a. Mean-variance convergence around the world. Journal of Banking and
Finance 34, 856-870.
Eun, C.S, Lee, J., 2010b. Evolution of earnings-to-price ratios: International evidence. Global
Finance Journal 21, 125-137.
Fabozzi, F.J., Francis, J.C., 1979. Industry effects and the determinants of risk. Quarterly Review
of Economics and Business 19, 61-74.
Fama, E.F., French, K.R., 1995. Size and book-to-market factors in earnings and returns. Journal
of Finance 50, 131-155.
29
Fisman, R., Love, I., 2004. Financial development and intersector allocation: A new approach,
Journal of Finance 59, 2785-2807.
Harrison, J.M., Kreps, D.M., 1979. Martingales and arbitrage in multiperiod securities markets.
Journal of Economic Theory 20, 381-408.
Hunter, D.M., 2006. The evolution of stock market integration in the post-liberalization period -
A look at Latin America. Journal of International Money and Finance 25, 795-826.
Islam, N., 1995. Growth empirics: A panel data approach. Quarterly Journal of Economics 110,
1127-1170.
Jiang, X., Lee, B.S., 2007. Stock returns, dividend yield, and book-to-market ratio. Journal of
Banking and Finance 31, 455-475.
King, M.R., Segal, D., 2008. Market segmentation and equity valuation: Comparing Canada and
the United States. Journal of International Financial Markets, Institutions and Money 18, 245-
258.
Land, J., Lang, M.H., 2002. Empirical evidence on the evolution of international earnings. The
Accounting Review 77, 115-133.
Lee, C.M.C., Myers, J., Swaminathan, B., 1999. What is the intrinsic value of the Dow? Journal
of Finance 54, 1693-1741.
Lettau, M., Nieuwerburgh, S.V., 2007. Reconciling the return predictability evidence. Review of
Financial Studies 21. 1607-1652.
Lichtenberg, F.R., 1994. Testing the convergence hypothesis. Review of Economics and Statistics
76, 576—579.
Mallik, G., 2006. Has the stock market integration between the Asian and OECD countries improved
after the Asian crisis? Frontiers in Finance and Economics 3, 55-69.
Mankiw, N.G., Romer, D., Weil D.N., 1992. A contribution to the empirics of economic growth.
The Quarterly Journal of Economics 107, 407-437.
30
Marashdeh, H.A., Shrestha, M.B., 2010. Stock market integration in the GCC countries. Interna-
tional Research Journal of Finance and Economics 37, 102-114.
Masih, A.M.M., Masih, R., 1999. Are Asian stock market fluctuations due mainly to intra-regional
contagion effects? Evidence based on Asian emerging stock markets. Pacific-Basin Finance
Journal 7, 251-282.
Masih, A.M.M., Masih, R., 2002. Propagative causal price transmission among international stock
markets: evidence from the pre- and post globalization period. Global Finance Journal 13,
63-91.
Morana, C., Beltratti, A., 2008. Comovements in international stock markets. Journal of Interna-
tional Financial Markets, Institutions and Money 18, 31-45.
Morana, C., 2008. International stock markets comovements: the role of economic and financial
integration. Empirical Economics 35, 333-359.
Moerman, G.A., 2008. Diversification in euro area stock markets: country versus industry. Journal
of International Money and Finance 27, 1122-1134.
Musumeci, J., Peterson, M., 2011. BE/ME and E/P work better than ME/BE or P/E in regressions.
Journal of Corporate Finance 17, 1272-1288.
Mylonidis, N., Kollias, C., 2010. Dynamic European stock market convergence: Evidence from
rolling cointegration analysis in the first euro-decade. Journal of Banking and Finance 34,
2056-2064.
Narayan, P.K., Mishra, S., Narayan, S., 2011. Do market capitalization and stocks traded converge?
New global evidence. Journal of Banking and Finance 35, 2771-2781.
Nerlove, M., 1968. Factors affecting differences among rates of return on investments in individual
common stocks. Review of Economics and Statistics 50, 312-331.
Penman, S.H., 1996. The articulation of price-earnings ratios and market-to-book ratios and the
evaluation of growth. Journal of Accounting Research 34, 235-259.
31
Phillips, P.C.B., Sul, D., 2007a. Some empirics on economic growth under heterogeneous technology.
Journal of Macroeconomics 29, 455-469.
Phillips, P.C.B., Sul, D., 2007b. Transition modeling and econometric convergence tests. Econo-
metrica 75, 1771-1855.
Phillips, P.C.B., Sul, D., 2009. Economic transition and growth. Journal of Applied Econometrics
24, 1153-1185.
Pukthuanthong, K., Roll, R., 2009. Global market integration: an alternative measure and its
application. Journal of Financial Economics 94, 214-232.
Rajan, R., Zingales, L., 1998. Financial dependencies and growth. American Economic Review 88,
559-586.
Ross, S.A., 1978. A simple approach to the valuation of risky streams. Journal of Business 51,
453-475.
Rua, A., Nunes, L.C., 2009. International comovement of stock market returns: a wavelet analysis.
Journal of Empirical Finance 16, 632-639.
Rubinstein, M., 1976. The valuation of uncertain income streams and the price of options. Bell
Journal of Economics 7, 407-425.
Samuelson, P.A., 1948. International trade and the equalization of factor prices. Economic Journal
58, 163-184.
Solow, R.M., 1956. A contribution to the theory of economic growth. Quarterly Journal of Eco-
nomics 70, 65-94.
Syllignakis, M.N., Kouretas, G.P., 2010. German, US and Central and Eastern European stock
market integration. Open Economies Review 21, 607-628.
Umutlu, M., Akdeniz, L.,Altag-Salih, A., 2010. The degree of financial liberalization and aggregated
stock-return volatility in emerging markets. Journal of Banking and Finance 34, 485-696.
32

Yu, I.W., Fung, K.P., Tam, C.S., 2010. Assessing financial market integration in Asia —Equity
markets. Journal of Banking and Finance 34, 2874-2885.
Yu, J.-S., Hassan, M.K., 2008. Global and regional integration of the Middle East and North African
(MENA) stock markets. The Quarterly Review of Economics and Finance 48, 482-504.
33
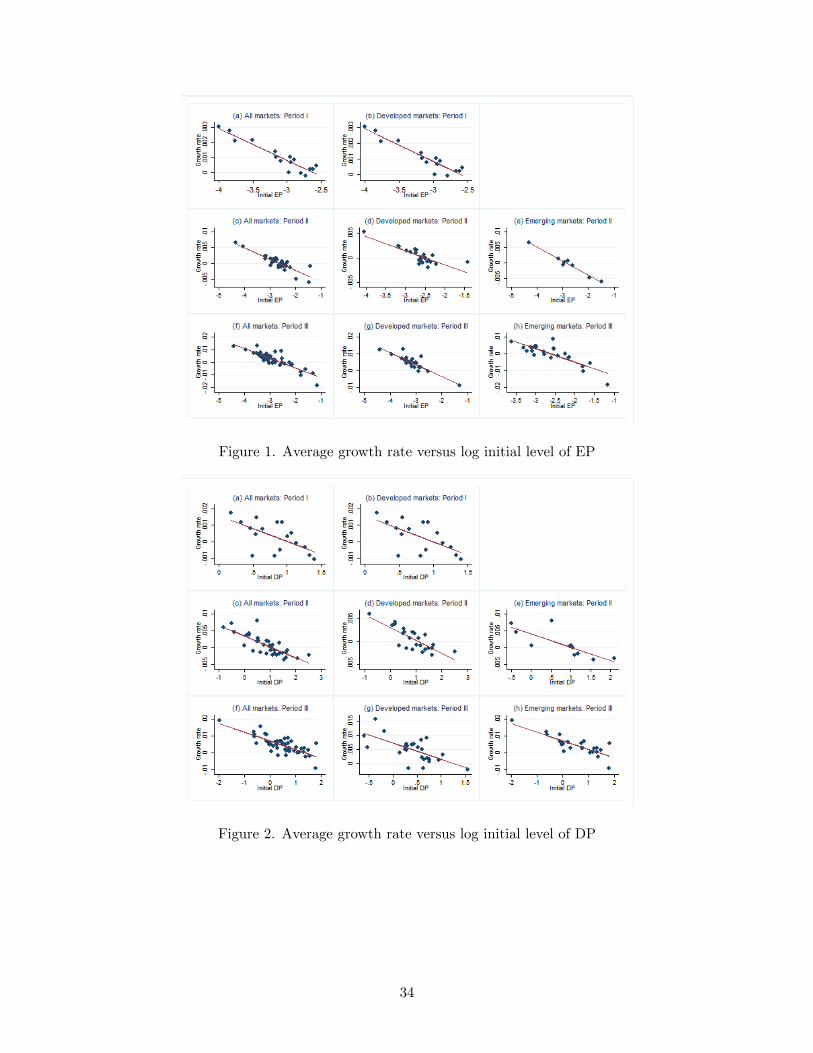
Figure 1. Average growth rate versus log initial level of EP
Figure 2. Average growth rate versus log initial level of DP
34
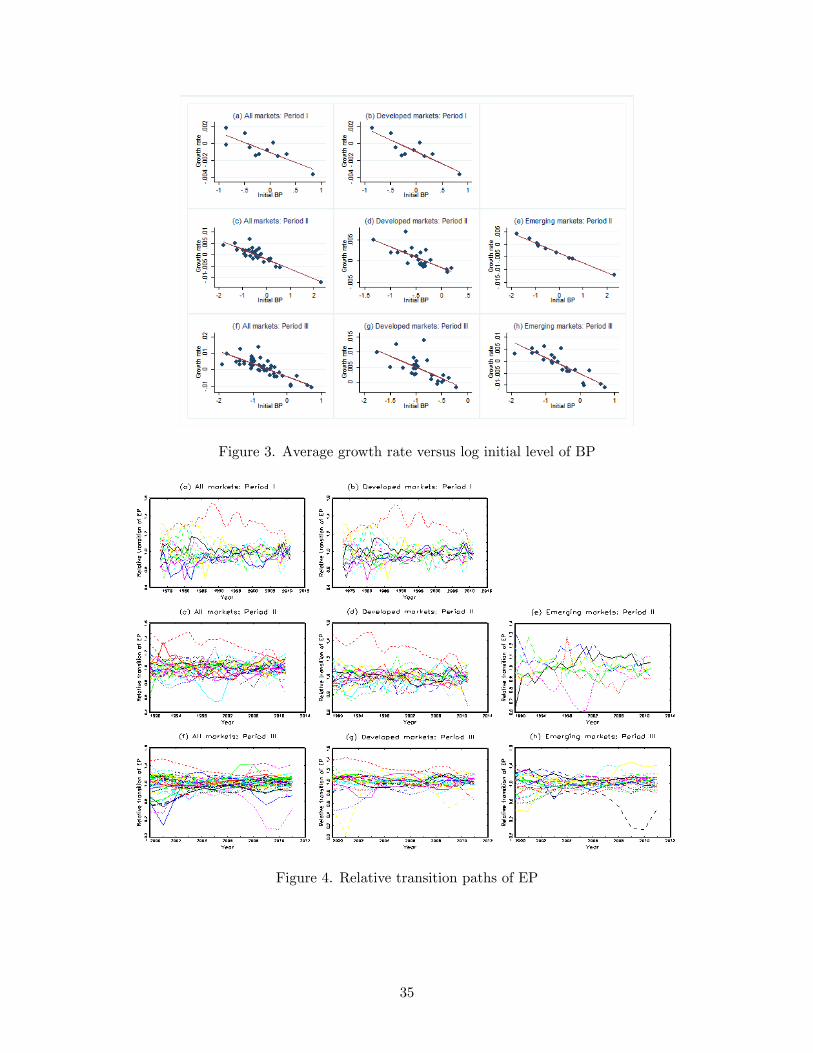
Figure 3. Average growth rate versus log initial level of BP
Figure 4. Relative transition paths of EP
35
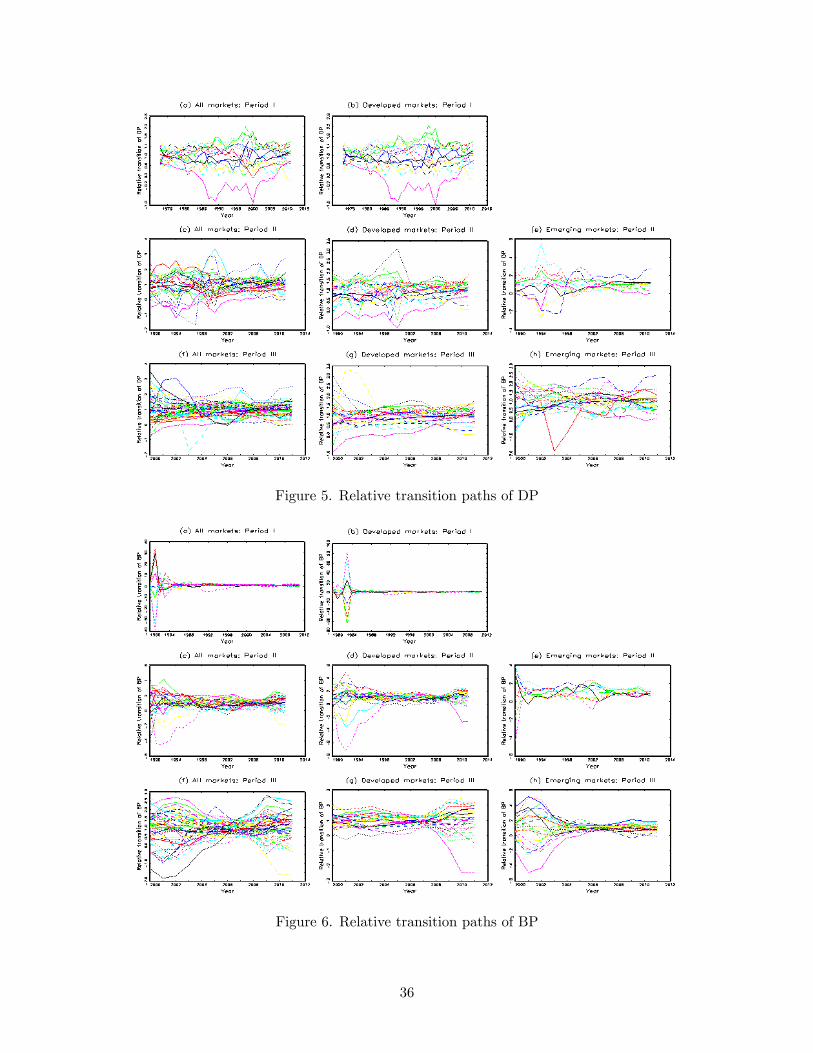
Figure 5. Relative transition paths of DP
Figure 6. Relative transition paths of BP
36
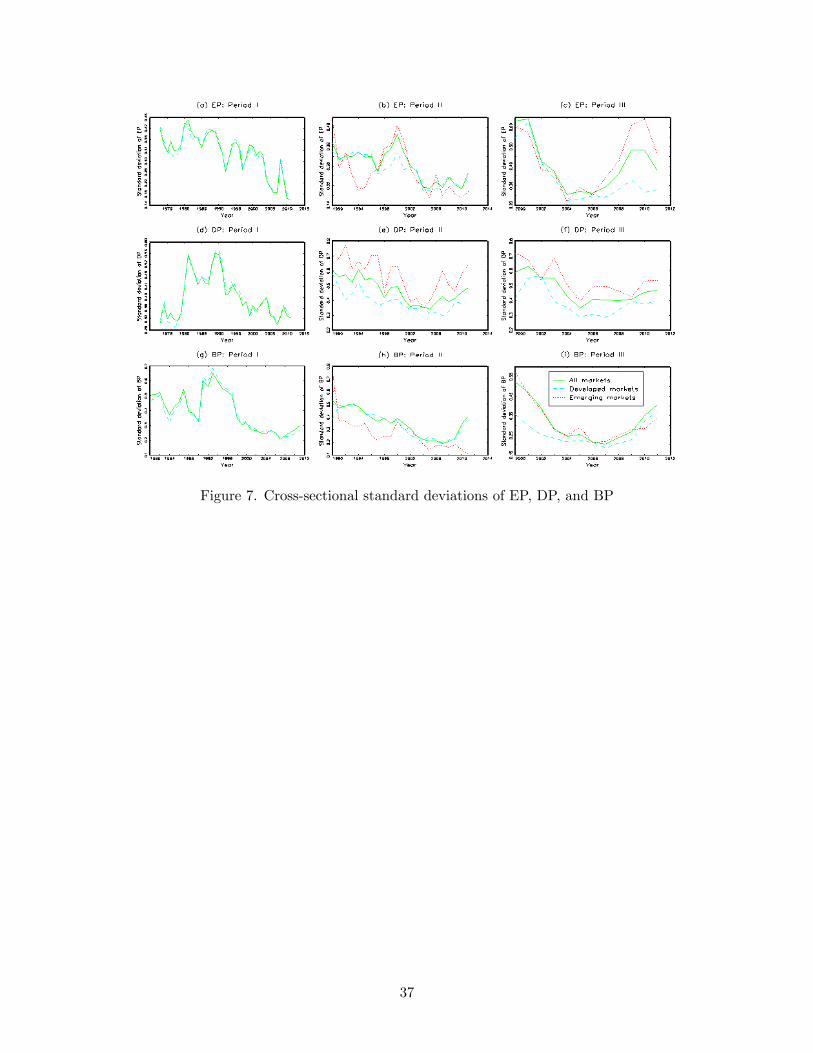
Figure 7. Cross-sectional standard deviations of EP, DP, and BP
37
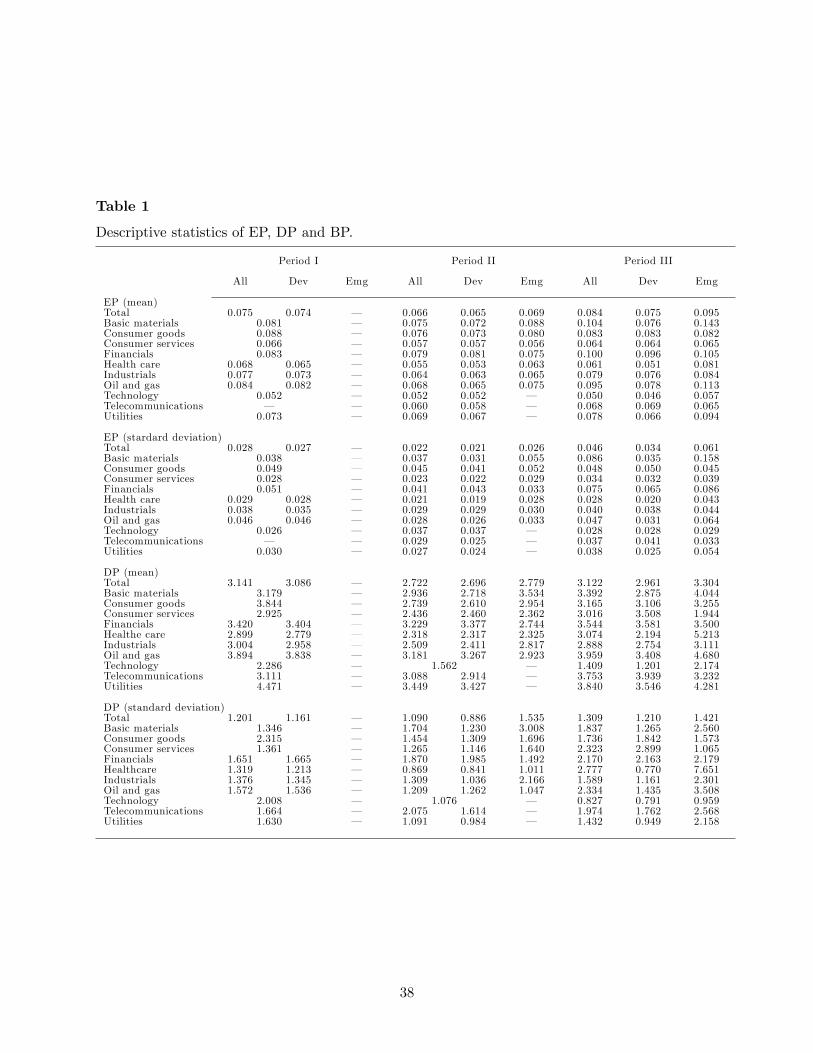
Table 1
Descriptive statistics of EP, DP and BP.
Period I Period II Period III
All Dev Emg All Dev Emg All Dev Emg
EP (mean)Total 0.075 0.074 – 0.066 0.065 0.069 0.084 0.075 0.095Basic materials 0.081 – 0.075 0.072 0.088 0.104 0.076 0.143Consumer goods 0.088 – 0.076 0.073 0.080 0.083 0.083 0.082Consumer services 0.066 – 0.057 0.057 0.056 0.064 0.064 0.065Financials 0.083 – 0.079 0.081 0.075 0.100 0.096 0.105Health care 0.068 0.065 – 0.055 0.053 0.063 0.061 0.051 0.081Industrials 0.077 0.073 – 0.064 0.063 0.065 0.079 0.076 0.084Oil and gas 0.084 0.082 – 0.068 0.065 0.075 0.095 0.078 0.113Technology 0.052 – 0.052 0.052 – 0.050 0.046 0.057Telecommunications – – 0.060 0.058 – 0.068 0.069 0.065Utilities 0.073 – 0.069 0.067 – 0.078 0.066 0.094
EP (stardard deviation)Total 0.028 0.027 – 0.022 0.021 0.026 0.046 0.034 0.061Basic materials 0.038 – 0.037 0.031 0.055 0.086 0.035 0.158Consumer goods 0.049 – 0.045 0.041 0.052 0.048 0.050 0.045Consumer services 0.028 – 0.023 0.022 0.029 0.034 0.032 0.039Financials 0.051 – 0.041 0.043 0.033 0.075 0.065 0.086Health care 0.029 0.028 – 0.021 0.019 0.028 0.028 0.020 0.043Industrials 0.038 0.035 – 0.029 0.029 0.030 0.040 0.038 0.044Oil and gas 0.046 0.046 – 0.028 0.026 0.033 0.047 0.031 0.064Technology 0.026 – 0.037 0.037 – 0.028 0.028 0.029Telecommunications – – 0.029 0.025 – 0.037 0.041 0.033Utilities 0.030 – 0.027 0.024 – 0.038 0.025 0.054
DP (mean)Total 3.141 3.086 – 2.722 2.696 2.779 3.122 2.961 3.304Basic materials 3.179 – 2.936 2.718 3.534 3.392 2.875 4.044Consumer goods 3.844 – 2.739 2.610 2.954 3.165 3.106 3.255Consumer services 2.925 – 2.436 2.460 2.362 3.016 3.508 1.944Financials 3.420 3.404 – 3.229 3.377 2.744 3.544 3.581 3.500Healthe care 2.899 2.779 – 2.318 2.317 2.325 3.074 2.194 5.213Industrials 3.004 2.958 – 2.509 2.411 2.817 2.888 2.754 3.111Oil and gas 3.894 3.838 – 3.181 3.267 2.923 3.959 3.408 4.680Technology 2.286 – 1.562 – 1.409 1.201 2.174Telecommunications 3.111 – 3.088 2.914 – 3.753 3.939 3.232Utilities 4.471 – 3.449 3.427 – 3.840 3.546 4.281
DP (standard deviation)Total 1.201 1.161 – 1.090 0.886 1.535 1.309 1.210 1.421Basic materials 1.346 – 1.704 1.230 3.008 1.837 1.265 2.560Consumer goods 2.315 – 1.454 1.309 1.696 1.736 1.842 1.573Consumer services 1.361 – 1.265 1.146 1.640 2.323 2.899 1.065Financials 1.651 1.665 – 1.870 1.985 1.492 2.170 2.163 2.179Healthcare 1.319 1.213 – 0.869 0.841 1.011 2.777 0.770 7.651Industrials 1.376 1.345 – 1.309 1.036 2.166 1.589 1.161 2.301Oil and gas 1.572 1.536 – 1.209 1.262 1.047 2.334 1.435 3.508Technology 2.008 – 1.076 – 0.827 0.791 0.959Telecommunications 1.664 – 2.075 1.614 – 1.974 1.762 2.568Utilities 1.630 – 1.091 0.984 – 1.432 0.949 2.158
38
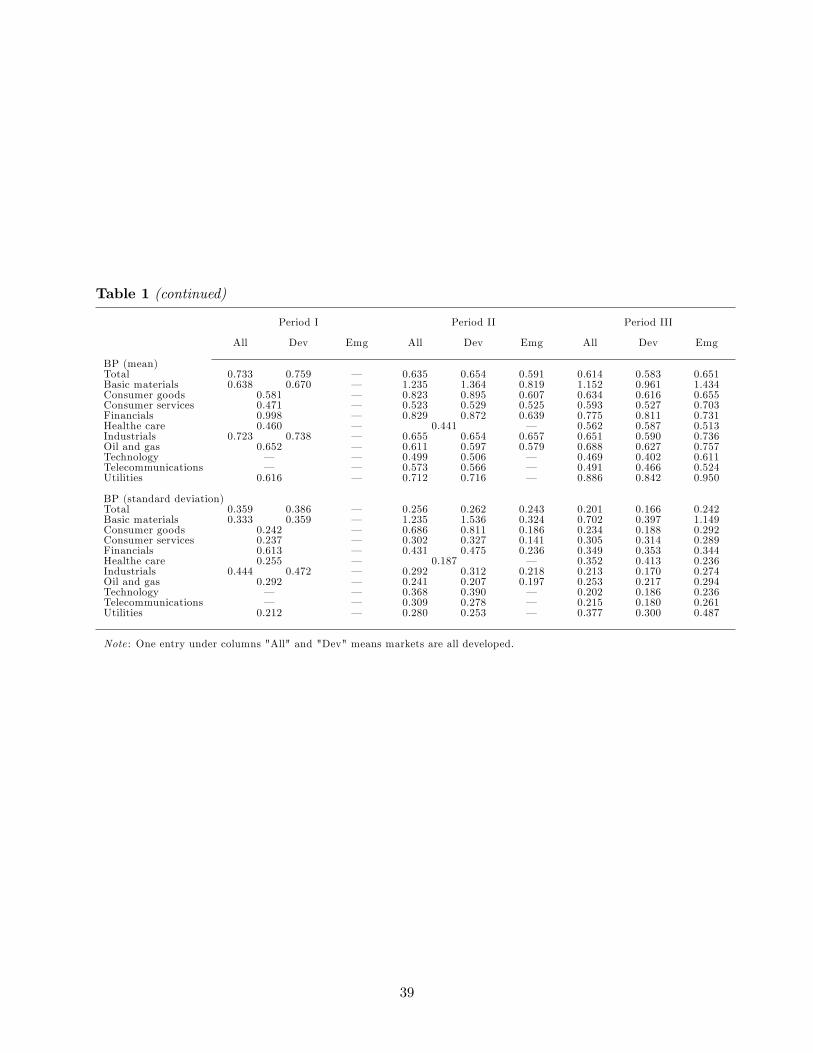
Table 1 (continued)
Period I Period II Period III
All Dev Emg All Dev Emg All Dev Emg
BP (mean)Total 0.733 0.759 – 0.635 0.654 0.591 0.614 0.583 0.651Basic materials 0.638 0.670 – 1.235 1.364 0.819 1.152 0.961 1.434Consumer goods 0.581 – 0.823 0.895 0.607 0.634 0.616 0.655Consumer services 0.471 – 0.523 0.529 0.525 0.593 0.527 0.703Financials 0.998 – 0.829 0.872 0.639 0.775 0.811 0.731Healthe care 0.460 – 0.441 – 0.562 0.587 0.513Industrials 0.723 0.738 – 0.655 0.654 0.657 0.651 0.590 0.736Oil and gas 0.652 – 0.611 0.597 0.579 0.688 0.627 0.757Technology – – 0.499 0.506 – 0.469 0.402 0.611Telecommunications – – 0.573 0.566 – 0.491 0.466 0.524Utilities 0.616 – 0.712 0.716 – 0.886 0.842 0.950
BP (standard deviation)Total 0.359 0.386 – 0.256 0.262 0.243 0.201 0.166 0.242Basic materials 0.333 0.359 – 1.235 1.536 0.324 0.702 0.397 1.149Consumer goods 0.242 – 0.686 0.811 0.186 0.234 0.188 0.292Consumer services 0.237 – 0.302 0.327 0.141 0.305 0.314 0.289Financials 0.613 – 0.431 0.475 0.236 0.349 0.353 0.344Healthe care 0.255 – 0.187 – 0.352 0.413 0.236Industrials 0.444 0.472 – 0.292 0.312 0.218 0.213 0.170 0.274Oil and gas 0.292 – 0.241 0.207 0.197 0.253 0.217 0.294Technology – – 0.368 0.390 – 0.202 0.186 0.236Telecommunications – – 0.309 0.278 – 0.215 0.180 0.261Utilities 0.212 – 0.280 0.253 – 0.377 0.300 0.487
Note : One entry under columns "All" and "Dev" means markets are all developed.
39
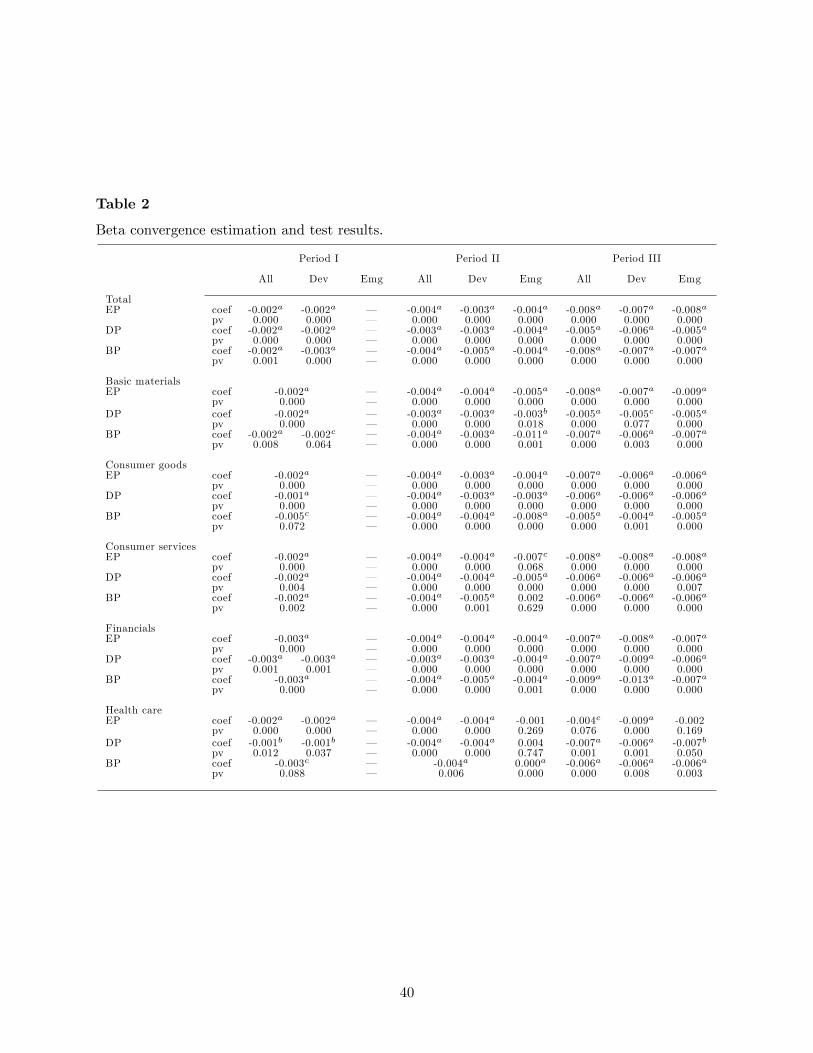
Table 2
Beta convergence estimation and test results.
Period I Period II Period III
All Dev Emg All Dev Emg All Dev Emg
TotalEP coef -0.002a -0.002a – -0.004a -0.003a -0.004a -0.008a -0.007a -0.008a
pv 0.000 0.000 – 0.000 0.000 0.000 0.000 0.000 0.000DP coef -0.002a -0.002a – -0.003a -0.003a -0.004a -0.005a -0.006a -0.005a
pv 0.000 0.000 – 0.000 0.000 0.000 0.000 0.000 0.000BP coef -0.002a -0.003a – -0.004a -0.005a -0.004a -0.008a -0.007a -0.007a
pv 0.001 0.000 – 0.000 0.000 0.000 0.000 0.000 0.000
Basic materialsEP coef -0.002a – -0.004a -0.004a -0.005a -0.008a -0.007a -0.009a
pv 0.000 – 0.000 0.000 0.000 0.000 0.000 0.000DP coef -0.002a – -0.003a -0.003a -0.003b -0.005a -0.005c -0.005a
pv 0.000 – 0.000 0.000 0.018 0.000 0.077 0.000BP coef -0.002a -0.002c – -0.004a -0.003a -0.011a -0.007a -0.006a -0.007a
pv 0.008 0.064 – 0.000 0.000 0.001 0.000 0.003 0.000
Consumer goodsEP coef -0.002a – -0.004a -0.003a -0.004a -0.007a -0.006a -0.006a
pv 0.000 – 0.000 0.000 0.000 0.000 0.000 0.000DP coef -0.001a – -0.004a -0.003a -0.003a -0.006a -0.006a -0.006a
pv 0.000 – 0.000 0.000 0.000 0.000 0.000 0.000BP coef -0.005c – -0.004a -0.004a -0.008a -0.005a -0.004a -0.005a
pv 0.072 – 0.000 0.000 0.000 0.000 0.001 0.000
Consumer servicesEP coef -0.002a – -0.004a -0.004a -0.007c -0.008a -0.008a -0.008a
pv 0.000 – 0.000 0.000 0.068 0.000 0.000 0.000DP coef -0.002a – -0.004a -0.004a -0.005a -0.006a -0.006a -0.006a
pv 0.004 – 0.000 0.000 0.000 0.000 0.000 0.007BP coef -0.002a – -0.004a -0.005a 0.002 -0.006a -0.006a -0.006a
pv 0.002 – 0.000 0.001 0.629 0.000 0.000 0.000
FinancialsEP coef -0.003a – -0.004a -0.004a -0.004a -0.007a -0.008a -0.007a
pv 0.000 – 0.000 0.000 0.000 0.000 0.000 0.000DP coef -0.003a -0.003a – -0.003a -0.003a -0.004a -0.007a -0.009a -0.006a
pv 0.001 0.001 – 0.000 0.000 0.000 0.000 0.000 0.000BP coef -0.003a – -0.004a -0.005a -0.004a -0.009a -0.013a -0.007a
pv 0.000 – 0.000 0.000 0.001 0.000 0.000 0.000
Health careEP coef -0.002a -0.002a – -0.004a -0.004a -0.001 -0.004c -0.009a -0.002
pv 0.000 0.000 – 0.000 0.000 0.269 0.076 0.000 0.169DP coef -0.001b -0.001b – -0.004a -0.004a 0.004 -0.007a -0.006a -0.007b
pv 0.012 0.037 – 0.000 0.000 0.747 0.001 0.001 0.050BP coef -0.003c – -0.004a 0.000a -0.006a -0.006a -0.006a
pv 0.088 – 0.006 0.000 0.000 0.008 0.003
40
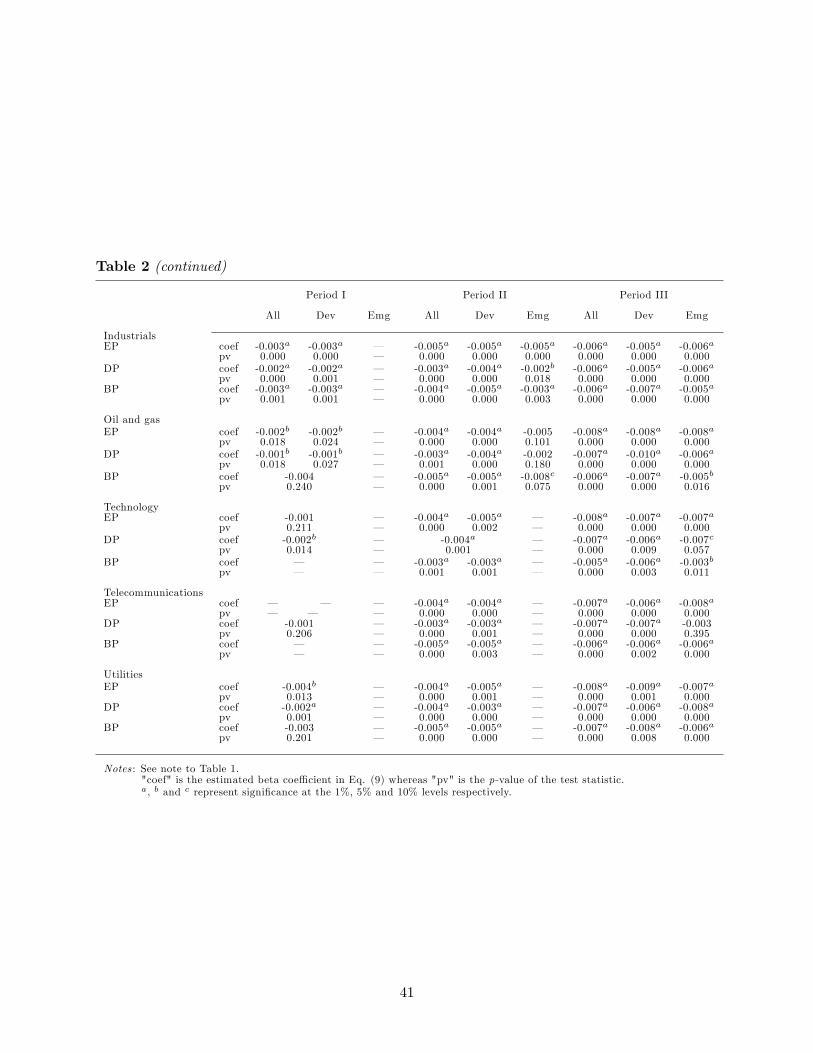
Table 2 (continued)
Period I Period II Period III
All Dev Emg All Dev Emg All Dev Emg
IndustrialsEP coef -0.003a -0.003a – -0.005a -0.005a -0.005a -0.006a -0.005a -0.006a
pv 0.000 0.000 – 0.000 0.000 0.000 0.000 0.000 0.000DP coef -0.002a -0.002a – -0.003a -0.004a -0.002b -0.006a -0.005a -0.006a
pv 0.000 0.001 – 0.000 0.000 0.018 0.000 0.000 0.000BP coef -0.003a -0.003a – -0.004a -0.005a -0.003a -0.006a -0.007a -0.005a
pv 0.001 0.001 – 0.000 0.000 0.003 0.000 0.000 0.000
Oil and gasEP coef -0.002b -0.002b – -0.004a -0.004a -0.005 -0.008a -0.008a -0.008a
pv 0.018 0.024 – 0.000 0.000 0.101 0.000 0.000 0.000DP coef -0.001b -0.001b – -0.003a -0.004a -0.002 -0.007a -0.010a -0.006a
pv 0.018 0.027 – 0.001 0.000 0.180 0.000 0.000 0.000BP coef -0.004 – -0.005a -0.005a -0.008c -0.006a -0.007a -0.005b
pv 0.240 – 0.000 0.001 0.075 0.000 0.000 0.016
TechnologyEP coef -0.001 – -0.004a -0.005a – -0.008a -0.007a -0.007a
pv 0.211 – 0.000 0.002 – 0.000 0.000 0.000DP coef -0.002b – -0.004a – -0.007a -0.006a -0.007c
pv 0.014 – 0.001 – 0.000 0.009 0.057BP coef – – -0.003a -0.003a – -0.005a -0.006a -0.003b
pv – – 0.001 0.001 – 0.000 0.003 0.011
TelecommunicationsEP coef – – – -0.004a -0.004a – -0.007a -0.006a -0.008a
pv – – – 0.000 0.000 – 0.000 0.000 0.000DP coef -0.001 – -0.003a -0.003a – -0.007a -0.007a -0.003
pv 0.206 – 0.000 0.001 – 0.000 0.000 0.395BP coef – – -0.005a -0.005a – -0.006a -0.006a -0.006a
pv – – 0.000 0.003 – 0.000 0.002 0.000
UtilitiesEP coef -0.004b – -0.004a -0.005a – -0.008a -0.009a -0.007a
pv 0.013 – 0.000 0.001 – 0.000 0.001 0.000DP coef -0.002a – -0.004a -0.003a – -0.007a -0.006a -0.008a
pv 0.001 – 0.000 0.000 – 0.000 0.000 0.000BP coef -0.003 – -0.005a -0.005a – -0.007a -0.008a -0.006a
pv 0.201 – 0.000 0.000 – 0.000 0.008 0.000
Notes : See note to Table 1."coef" is the estimated beta coeffi cient in Eq. (9) whereas "pv" is the p-value of the test statistic.a, b and c represent significance at the 1%, 5% and 10% levels respectively.
41
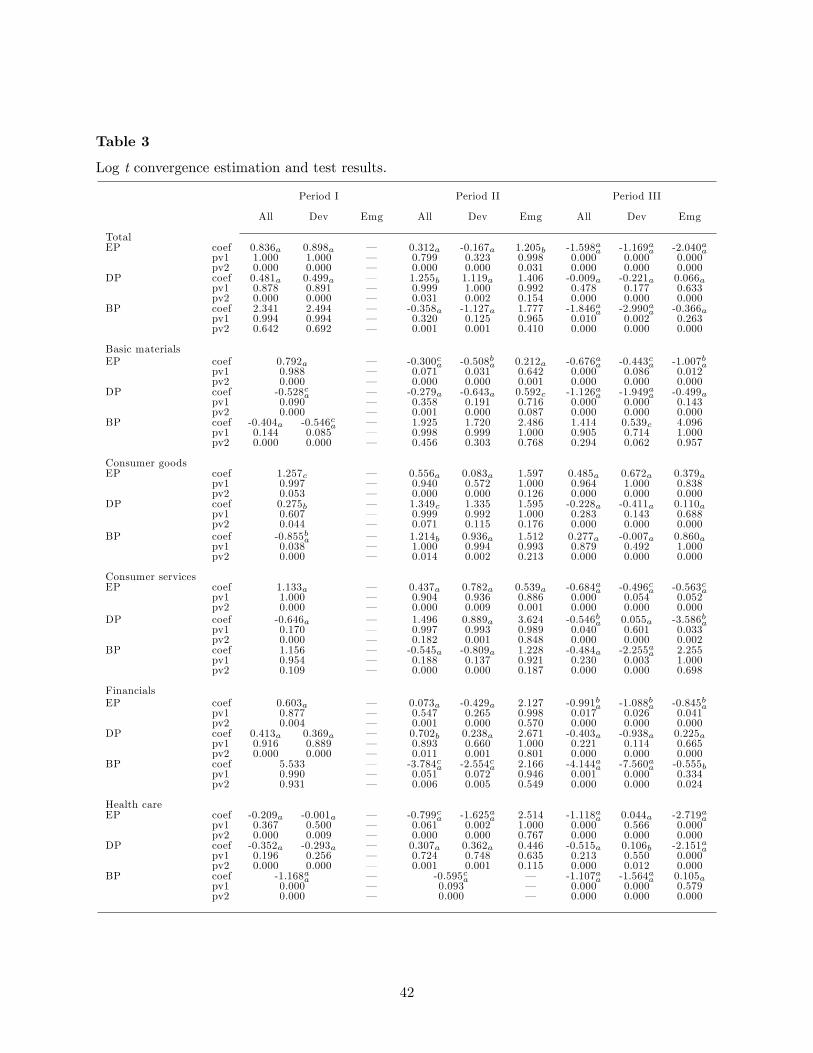
Table 3
Log t convergence estimation and test results.
Period I Period II Period III
All Dev Emg All Dev Emg All Dev Emg
TotalEP coef 0.836a 0.898a – 0.312a -0.167a 1.205b -1.598aa -1.169aa -2.040aa
pv1 1.000 1.000 – 0.799 0.323 0.998 0.000 0.000 0.000pv2 0.000 0.000 – 0.000 0.000 0.031 0.000 0.000 0.000
DP coef 0.481a 0.499a – 1.255b 1.119a 1.406 -0.009a -0.221a 0.066apv1 0.878 0.891 – 0.999 1.000 0.992 0.478 0.177 0.633pv2 0.000 0.000 – 0.031 0.002 0.154 0.000 0.000 0.000
BP coef 2.341 2.494 – -0.358a -1.127a 1.777 -1.846aa -2.990aa -0.366apv1 0.994 0.994 – 0.320 0.125 0.965 0.010 0.002 0.263pv2 0.642 0.692 – 0.001 0.001 0.410 0.000 0.000 0.000
Basic materialsEP coef 0.792a – -0.300ca -0.508ba 0.212a -0.676aa -0.443ca -1.007ba
pv1 0.988 – 0.071 0.031 0.642 0.000 0.086 0.012pv2 0.000 – 0.000 0.000 0.001 0.000 0.000 0.000
DP coef -0.528ca – -0.279a -0.643a 0.592c -1.126aa -1.949aa -0.499apv1 0.090 – 0.358 0.191 0.716 0.000 0.000 0.143pv2 0.000 – 0.001 0.000 0.087 0.000 0.000 0.000
BP coef -0.404a -0.546ca – 1.925 1.720 2.486 1.414 0.539c 4.096pv1 0.144 0.085 – 0.998 0.999 1.000 0.905 0.714 1.000pv2 0.000 0.000 – 0.456 0.303 0.768 0.294 0.062 0.957
Consumer goodsEP coef 1.257c – 0.556a 0.083a 1.597 0.485a 0.672a 0.379a
pv1 0.997 – 0.940 0.572 1.000 0.964 1.000 0.838pv2 0.053 – 0.000 0.000 0.126 0.000 0.000 0.000
DP coef 0.275b – 1.349c 1.335 1.595 -0.228a -0.411a 0.110apv1 0.607 – 0.999 0.992 1.000 0.283 0.143 0.688pv2 0.044 – 0.071 0.115 0.176 0.000 0.000 0.000
BP coef -0.855ba – 1.214b 0.936a 1.512 0.277a -0.007a 0.860apv1 0.038 – 1.000 0.994 0.993 0.879 0.492 1.000pv2 0.000 – 0.014 0.002 0.213 0.000 0.000 0.000
Consumer servicesEP coef 1.133a – 0.437a 0.782a 0.539a -0.684aa -0.496ca -0.563ca
pv1 1.000 – 0.904 0.936 0.886 0.000 0.054 0.052pv2 0.000 – 0.000 0.009 0.001 0.000 0.000 0.000
DP coef -0.646a – 1.496 0.889a 3.624 -0.546ba 0.055a -3.586bapv1 0.170 – 0.997 0.993 0.989 0.040 0.601 0.033pv2 0.000 – 0.182 0.001 0.848 0.000 0.000 0.002
BP coef 1.156 – -0.545a -0.809a 1.228 -0.484a -2.255aa 2.255pv1 0.954 – 0.188 0.137 0.921 0.230 0.003 1.000pv2 0.109 – 0.000 0.000 0.187 0.000 0.000 0.698
FinancialsEP coef 0.603a – 0.073a -0.429a 2.127 -0.991ba -1.088ba -0.845ba
pv1 0.877 – 0.547 0.265 0.998 0.017 0.026 0.041pv2 0.004 – 0.001 0.000 0.570 0.000 0.000 0.000
DP coef 0.413a 0.369a – 0.702b 0.238a 2.671 -0.403a -0.938a 0.225apv1 0.916 0.889 – 0.893 0.660 1.000 0.221 0.114 0.665pv2 0.000 0.000 – 0.011 0.001 0.801 0.000 0.000 0.000
BP coef 5.533 – -3.784ca -2.554ca 2.166 -4.144aa -7.560aa -0.555bpv1 0.990 – 0.051 0.072 0.946 0.001 0.000 0.334pv2 0.931 – 0.006 0.005 0.549 0.000 0.000 0.024
Health careEP coef -0.209a -0.001a – -0.799ca -1.625aa 2.514 -1.118aa 0.044a -2.719aa
pv1 0.367 0.500 – 0.061 0.002 1.000 0.000 0.566 0.000pv2 0.000 0.009 – 0.000 0.000 0.767 0.000 0.000 0.000
DP coef -0.352a -0.293a – 0.307a 0.362a 0.446 -0.515a 0.106b -2.151aapv1 0.196 0.256 – 0.724 0.748 0.635 0.213 0.550 0.000pv2 0.000 0.000 – 0.001 0.001 0.115 0.000 0.012 0.000
BP coef -1.168aa – -0.595ca – -1.107aa -1.564aa 0.105apv1 0.000 – 0.093 – 0.000 0.000 0.579pv2 0.000 – 0.000 – 0.000 0.000 0.000
42
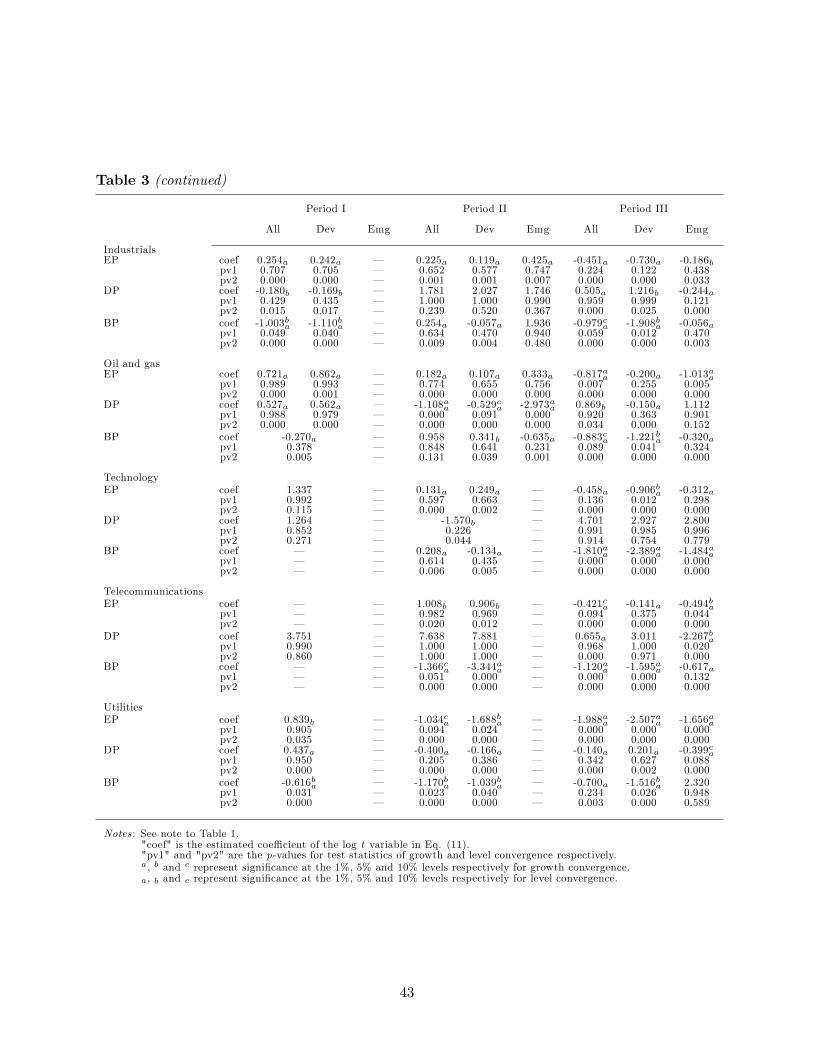
Table 3 (continued)
Period I Period II Period III
All Dev Emg All Dev Emg All Dev Emg
IndustrialsEP coef 0.254a 0.242a – 0.225a 0.119a 0.425a -0.451a -0.730a -0.186b
pv1 0.707 0.705 – 0.652 0.577 0.747 0.224 0.122 0.438pv2 0.000 0.000 – 0.001 0.001 0.007 0.000 0.000 0.033
DP coef -0.180b -0.169b – 1.781 2.027 1.746 0.505a 1.216b -0.244apv1 0.429 0.435 – 1.000 1.000 0.990 0.959 0.999 0.121pv2 0.015 0.017 – 0.239 0.520 0.367 0.000 0.025 0.000
BP coef -1.003ba -1.110ba – 0.254a -0.057a 1.936 -0.979ca -1.908ba -0.056apv1 0.049 0.040 – 0.634 0.470 0.940 0.059 0.012 0.470pv2 0.000 0.000 – 0.009 0.004 0.480 0.000 0.000 0.003
Oil and gasEP coef 0.721a 0.862a – 0.182a 0.107a 0.333a -0.817aa -0.200a -1.013aa
pv1 0.989 0.993 – 0.774 0.655 0.756 0.007 0.255 0.005pv2 0.000 0.001 – 0.000 0.000 0.000 0.000 0.000 0.000
DP coef 0.527a 0.562a – -1.108aa -0.529ca -2.973aa 0.869b -0.150a 1.112pv1 0.988 0.979 – 0.000 0.091 0.000 0.920 0.363 0.901pv2 0.000 0.000 – 0.000 0.000 0.000 0.034 0.000 0.152
BP coef -0.270a – 0.958 0.341b -0.635a -0.883ca -1.221ba -0.320apv1 0.378 – 0.848 0.641 0.231 0.089 0.041 0.324pv2 0.005 – 0.131 0.039 0.001 0.000 0.000 0.000
TechnologyEP coef 1.337 – 0.131a 0.249a – -0.458a -0.906ba -0.312a
pv1 0.992 – 0.597 0.663 – 0.136 0.012 0.298pv2 0.115 – 0.000 0.002 – 0.000 0.000 0.000
DP coef 1.264 – -1.570b – 4.701 2.927 2.800pv1 0.852 – 0.226 – 0.991 0.985 0.996pv2 0.271 – 0.044 – 0.914 0.754 0.779
BP coef – – 0.208a -0.134a – -1.810aa -2.389aa -1.484aapv1 – – 0.614 0.435 – 0.000 0.000 0.000pv2 – – 0.006 0.005 – 0.000 0.000 0.000
TelecommunicationsEP coef – – 1.008b 0.906b – -0.421ca -0.141a -0.494ba
pv1 – – 0.982 0.969 – 0.094 0.375 0.044pv2 – – 0.020 0.012 – 0.000 0.000 0.000
DP coef 3.751 – 7.638 7.881 – 0.655a 3.011 -2.267bapv1 0.990 – 1.000 1.000 – 0.968 1.000 0.020pv2 0.860 – 1.000 1.000 – 0.000 0.971 0.000
BP coef – – -1.366ca -3.344aa – -1.120aa -1.595aa -0.617apv1 – – 0.051 0.000 – 0.000 0.000 0.132pv2 – – 0.000 0.000 – 0.000 0.000 0.000
UtilitiesEP coef 0.839b – -1.034ca -1.688ba – -1.988aa -2.507aa -1.656aa
pv1 0.905 – 0.094 0.024 – 0.000 0.000 0.000pv2 0.035 – 0.000 0.000 – 0.000 0.000 0.000
DP coef 0.437a – -0.400a -0.166a – -0.140a 0.201a -0.399capv1 0.950 – 0.205 0.386 – 0.342 0.627 0.088pv2 0.000 – 0.000 0.000 – 0.000 0.002 0.000
BP coef -0.616ba – -1.170ba -1.039ba – -0.700a -1.516ba 2.320pv1 0.031 – 0.023 0.040 – 0.234 0.026 0.948pv2 0.000 – 0.000 0.000 – 0.003 0.000 0.589
Notes : See note to Table 1."coef" is the estimated coeffi cient of the log t variable in Eq. (11)."pv1" and "pv2" are the p-values for test statistics of growth and level convergence respectively.a, b and c represent significance at the 1%, 5% and 10% levels respectively for growth convergence.a, b and c represent significance at the 1%, 5% and 10% levels respectively for level convergence.
43
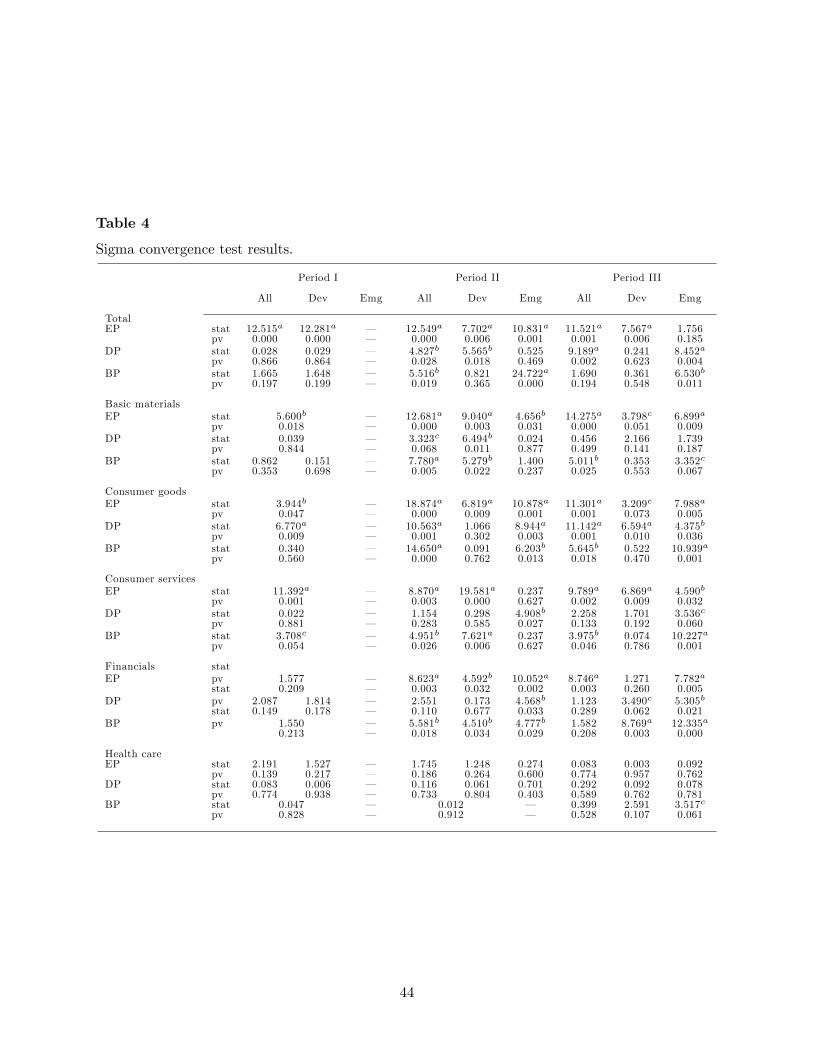
Table 4
Sigma convergence test results.
Period I Period II Period III
All Dev Emg All Dev Emg All Dev Emg
TotalEP stat 12.515a 12.281a – 12.549a 7.702a 10.831a 11.521a 7.567a 1.756
pv 0.000 0.000 – 0.000 0.006 0.001 0.001 0.006 0.185DP stat 0.028 0.029 – 4.827b 5.565b 0.525 9.189a 0.241 8.452a
pv 0.866 0.864 – 0.028 0.018 0.469 0.002 0.623 0.004BP stat 1.665 1.648 – 5.516b 0.821 24.722a 1.690 0.361 6.530b
pv 0.197 0.199 – 0.019 0.365 0.000 0.194 0.548 0.011
Basic materialsEP stat 5.600b – 12.681a 9.040a 4.656b 14.275a 3.798c 6.899a
pv 0.018 – 0.000 0.003 0.031 0.000 0.051 0.009DP stat 0.039 – 3.323c 6.494b 0.024 0.456 2.166 1.739
pv 0.844 – 0.068 0.011 0.877 0.499 0.141 0.187BP stat 0.862 0.151 – 7.780a 5.279b 1.400 5.011b 0.353 3.352c
pv 0.353 0.698 – 0.005 0.022 0.237 0.025 0.553 0.067
Consumer goodsEP stat 3.944b – 18.874a 6.819a 10.878a 11.301a 3.209c 7.988a
pv 0.047 – 0.000 0.009 0.001 0.001 0.073 0.005DP stat 6.770a – 10.563a 1.066 8.944a 11.142a 6.594a 4.375b
pv 0.009 – 0.001 0.302 0.003 0.001 0.010 0.036BP stat 0.340 – 14.650a 0.091 6.203b 5.645b 0.522 10.939a
pv 0.560 – 0.000 0.762 0.013 0.018 0.470 0.001
Consumer servicesEP stat 11.392a – 8.870a 19.581a 0.237 9.789a 6.869a 4.590b
pv 0.001 – 0.003 0.000 0.627 0.002 0.009 0.032DP stat 0.022 – 1.154 0.298 4.908b 2.258 1.701 3.536c
pv 0.881 – 0.283 0.585 0.027 0.133 0.192 0.060BP stat 3.708c – 4.951b 7.621a 0.237 3.975b 0.074 10.227a
pv 0.054 – 0.026 0.006 0.627 0.046 0.786 0.001
Financials statEP pv 1.577 – 8.623a 4.592b 10.052a 8.746a 1.271 7.782a
stat 0.209 – 0.003 0.032 0.002 0.003 0.260 0.005DP pv 2.087 1.814 – 2.551 0.173 4.568b 1.123 3.490c 5.305b
stat 0.149 0.178 – 0.110 0.677 0.033 0.289 0.062 0.021BP pv 1.550 – 5.581b 4.510b 4.777b 1.582 8.769a 12.335a
0.213 – 0.018 0.034 0.029 0.208 0.003 0.000
Health careEP stat 2.191 1.527 – 1.745 1.248 0.274 0.083 0.003 0.092
pv 0.139 0.217 – 0.186 0.264 0.600 0.774 0.957 0.762DP stat 0.083 0.006 – 0.116 0.061 0.701 0.292 0.092 0.078
pv 0.774 0.938 – 0.733 0.804 0.403 0.589 0.762 0.781BP stat 0.047 – 0.012 – 0.399 2.591 3.517c
pv 0.828 – 0.912 – 0.528 0.107 0.061
44
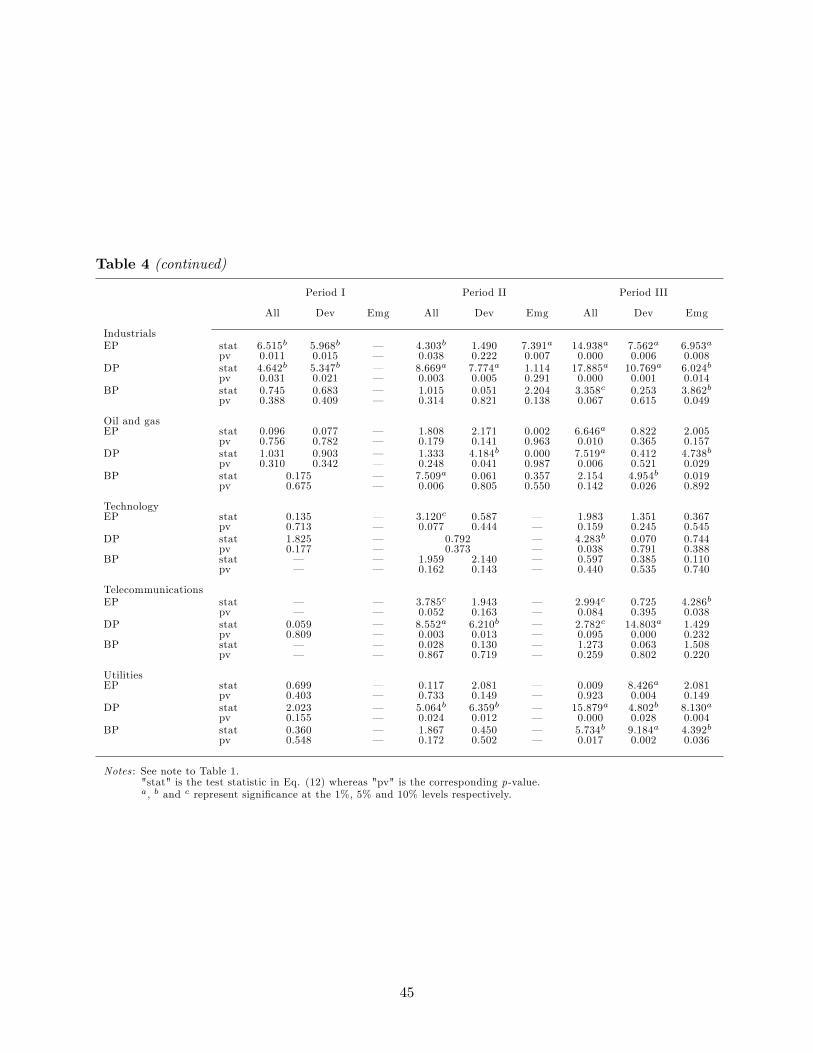
Table 4 (continued)
Period I Period II Period III
All Dev Emg All Dev Emg All Dev Emg
IndustrialsEP stat 6.515b 5.968b – 4.303b 1.490 7.391a 14.938a 7.562a 6.953a
pv 0.011 0.015 – 0.038 0.222 0.007 0.000 0.006 0.008DP stat 4.642b 5.347b – 8.669a 7.774a 1.114 17.885a 10.769a 6.024b
pv 0.031 0.021 – 0.003 0.005 0.291 0.000 0.001 0.014BP stat 0.745 0.683 – 1.015 0.051 2.204 3.358c 0.253 3.862b
pv 0.388 0.409 – 0.314 0.821 0.138 0.067 0.615 0.049
Oil and gasEP stat 0.096 0.077 – 1.808 2.171 0.002 6.646a 0.822 2.005
pv 0.756 0.782 – 0.179 0.141 0.963 0.010 0.365 0.157DP stat 1.031 0.903 – 1.333 4.184b 0.000 7.519a 0.412 4.738b
pv 0.310 0.342 – 0.248 0.041 0.987 0.006 0.521 0.029BP stat 0.175 – 7.509a 0.061 0.357 2.154 4.954b 0.019
pv 0.675 – 0.006 0.805 0.550 0.142 0.026 0.892
TechnologyEP stat 0.135 – 3.120c 0.587 – 1.983 1.351 0.367
pv 0.713 – 0.077 0.444 – 0.159 0.245 0.545DP stat 1.825 – 0.792 – 4.283b 0.070 0.744
pv 0.177 – 0.373 – 0.038 0.791 0.388BP stat – – 1.959 2.140 – 0.597 0.385 0.110
pv – – 0.162 0.143 – 0.440 0.535 0.740
TelecommunicationsEP stat – – 3.785c 1.943 – 2.994c 0.725 4.286b
pv – – 0.052 0.163 – 0.084 0.395 0.038DP stat 0.059 – 8.552a 6.210b – 2.782c 14.803a 1.429
pv 0.809 – 0.003 0.013 – 0.095 0.000 0.232BP stat – – 0.028 0.130 – 1.273 0.063 1.508
pv – – 0.867 0.719 – 0.259 0.802 0.220
UtilitiesEP stat 0.699 – 0.117 2.081 – 0.009 8.426a 2.081
pv 0.403 – 0.733 0.149 – 0.923 0.004 0.149DP stat 2.023 – 5.064b 6.359b – 15.879a 4.802b 8.130a
pv 0.155 – 0.024 0.012 – 0.000 0.028 0.004BP stat 0.360 – 1.867 0.450 – 5.734b 9.184a 4.392b
pv 0.548 – 0.172 0.502 – 0.017 0.002 0.036
Notes : See note to Table 1."stat" is the test statistic in Eq. (12) whereas "pv" is the corresponding p-value.a, b and c represent significance at the 1%, 5% and 10% levels respectively.
45
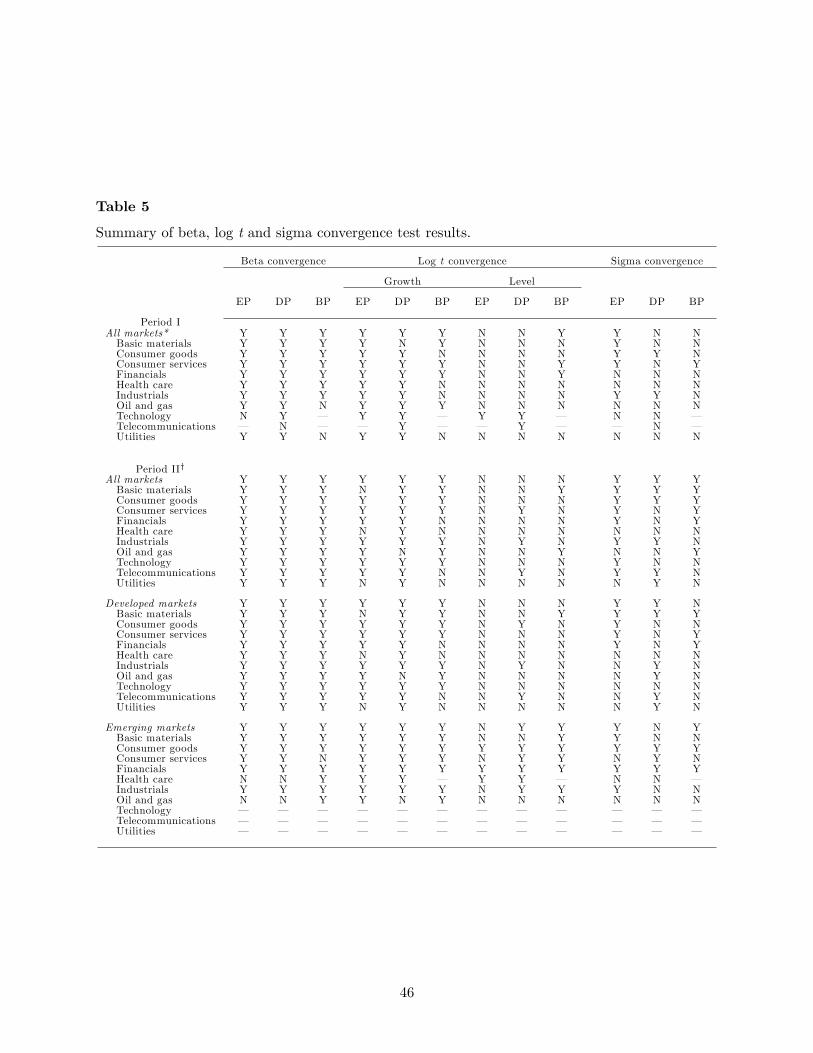
Table 5
Summary of beta, log t and sigma convergence test results.
Beta convergence Log t convergence Sigma convergence
Growth Level
EP DP BP EP DP BP EP DP BP EP DP BP
Period IAll markets* Y Y Y Y Y Y N N Y Y N NBasic materials Y Y Y Y N Y N N N Y N NConsumer goods Y Y Y Y Y N N N N Y Y NConsumer services Y Y Y Y Y Y N N Y Y N YFinancials Y Y Y Y Y Y N N Y N N NHealth care Y Y Y Y Y N N N N N N NIndustrials Y Y Y Y Y N N N N Y Y NOil and gas Y Y N Y Y Y N N N N N NTechnology N Y – Y Y – Y Y – N N –Telecommunications – N – – Y – – Y – – N –Utilities Y Y N Y Y N N N N N N N
Period II†All markets Y Y Y Y Y Y N N N Y Y YBasic materials Y Y Y N Y Y N N Y Y Y YConsumer goods Y Y Y Y Y Y N N N Y Y YConsumer services Y Y Y Y Y Y N Y N Y N YFinancials Y Y Y Y Y N N N N Y N YHealth care Y Y Y N Y N N N N N N NIndustrials Y Y Y Y Y Y N Y N Y Y NOil and gas Y Y Y Y N Y N N Y N N YTechnology Y Y Y Y Y Y N N N Y N NTelecommunications Y Y Y Y Y N N Y N Y Y NUtilities Y Y Y N Y N N N N N Y N
Developed markets Y Y Y Y Y Y N N N Y Y NBasic materials Y Y Y N Y Y N N Y Y Y YConsumer goods Y Y Y Y Y Y N Y N Y N NConsumer services Y Y Y Y Y Y N N N Y N YFinancials Y Y Y Y Y N N N N Y N YHealth care Y Y Y N Y N N N N N N NIndustrials Y Y Y Y Y Y N Y N N Y NOil and gas Y Y Y Y N Y N N N N Y NTechnology Y Y Y Y Y Y N N N N N NTelecommunications Y Y Y Y Y N N Y N N Y NUtilities Y Y Y N Y N N N N N Y N
Emerging markets Y Y Y Y Y Y N Y Y Y N YBasic materials Y Y Y Y Y Y N N Y Y N NConsumer goods Y Y Y Y Y Y Y Y Y Y Y YConsumer services Y Y N Y Y Y N Y Y N Y NFinancials Y Y Y Y Y Y Y Y Y Y Y YHealth care N N Y Y Y – Y Y – N N –Industrials Y Y Y Y Y Y N Y Y Y N NOil and gas N N Y Y N Y N N N N N NTechnology – – – – – – – – – – – –Telecommunications – – – – – – – – – – – –Utilities – – – – – – – – – – – –
46

Table 5 (continued)
Beta convergence Log t convergence Sigma convergence
Growth Level
EP DP BP EP DP BP EP DP BP EP DP BP
Period IIIAll markets Y Y Y N Y N N N N Y Y NBasic materials Y Y Y N N Y N N Y Y N YConsumer goods Y Y Y Y Y Y N N N Y Y YConsumer services Y Y Y N N Y N N N Y N YFinancials Y Y Y N Y N N N N Y N NHealth care Y Y Y N Y N N N N N N NIndustrials Y Y Y Y Y N N N N Y Y YOil and gas Y Y Y N Y N N N N Y Y NTechnology Y Y Y Y Y N N Y N N Y NTelecommunications Y Y Y N Y N N N N Y Y NUtilities Y Y Y N Y Y N N N N Y Y
Developed markets Y Y Y N Y N N N N Y N NBasic materials Y Y Y N N Y N N N Y N NConsumer goods Y Y Y Y Y Y N N N Y Y YConsumer services Y Y Y N Y N N N N Y N NFinancials Y Y Y N Y N N N N N Y YHealth care Y Y Y Y Y N N N N N N NIndustrials Y Y Y Y Y N N N N Y Y NOil and gas Y Y Y Y Y N N N N N N YTechnology Y Y Y N Y N N Y N N N NTelecommunications Y Y Y Y Y N N Y N N Y NUtilities Y Y Y N Y N N N N Y Y Y
Emerging markets Y Y Y N Y Y N N N N Y YBasic materials Y Y Y N Y Y N N Y Y N YConsumer goods Y Y Y Y Y Y N N N Y Y YConsumer services Y Y Y N N Y N N Y Y Y YFinancials Y Y Y N Y Y N N N Y Y YHealth care N Y Y N N Y N N N N N YIndustrials Y Y Y Y Y Y N N N Y Y YOil and gas Y Y Y N Y Y N Y N N Y NTechnology Y Y Y Y Y N N Y N N N NTelecommunications Y N Y N N Y N N N Y N NUtilities Y Y Y N N Y N N Y N Y Y
Notes: "Y" indicates evidence for convergence whereas "N" signifies evidence against convergence.* Results for all markets are qualitatively applicable to developed markets except with BP for basic materials.† In Period II, markets are all developed with BP in the health care sector, and with DP in the technology sector.
47
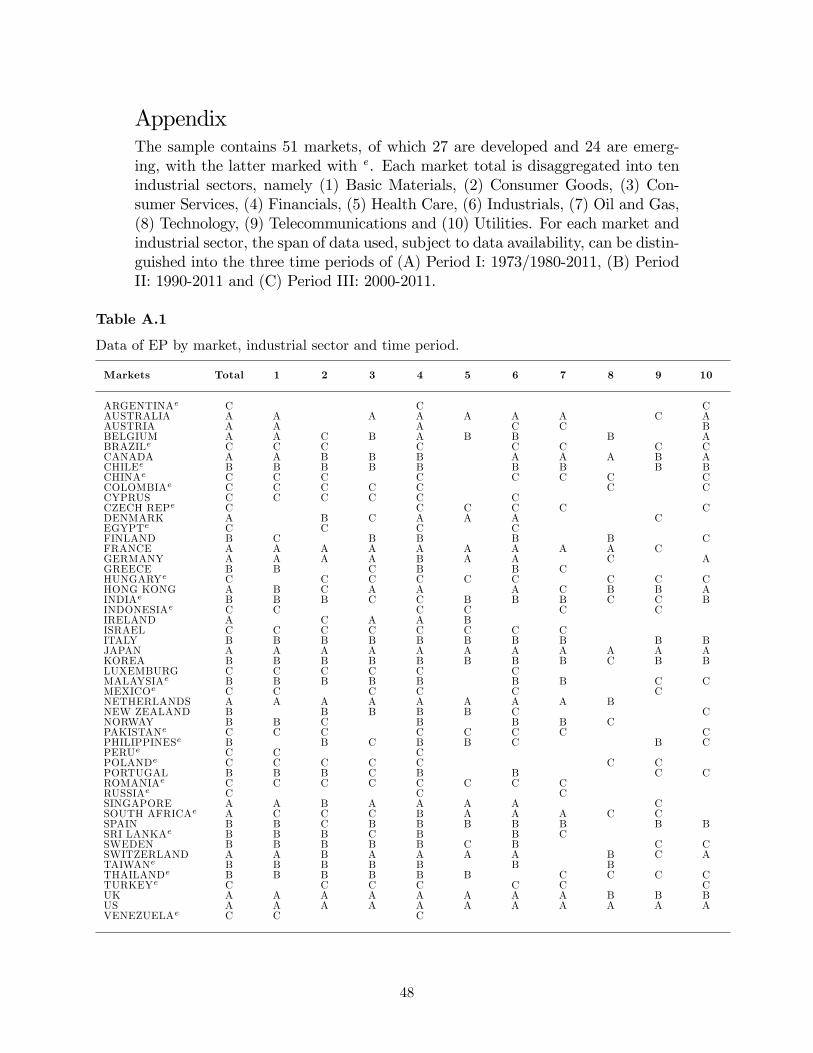
AppendixThe sample contains 51 markets, of which 27 are developed and 24 are emerg-ing, with the latter marked with e . Each market total is disaggregated into tenindustrial sectors, namely (1) Basic Materials, (2) Consumer Goods, (3) Con-sumer Services, (4) Financials, (5) Health Care, (6) Industrials, (7) Oil and Gas,(8) Technology, (9) Telecommunications and (10) Utilities. For each market andindustrial sector, the span of data used, subject to data availability, can be distin-guished into the three time periods of (A) Period I: 1973/1980-2011, (B) PeriodII: 1990-2011 and (C) Period III: 2000-2011.
Table A.1
Data of EP by market, industrial sector and time period.
Markets Total 1 2 3 4 5 6 7 8 9 10
ARGENTINAe C C CAUSTRALIA A A A A A A A C AAUSTRIA A A A C C BBELGIUM A A C B A B B B ABRAZILe C C C C C C C CCANADA A A B B B A A A B ACHILEe B B B B B B B B BCHINAe C C C C C C C CCOLOMBIAe C C C C C C CCYPRUS C C C C C CCZECH REPe C C C C C CDENMARK A B C A A A CEGYPTe C C C CFINLAND B C B B B B CFRANCE A A A A A A A A A CGERMANY A A A A B A A C AGREECE B B C B B CHUNGARYe C C C C C C C C CHONG KONG A B C A A A C B B AINDIAe B B B C C B B B C C BINDONESIAe C C C C C CIRELAND A C A A BISRAEL C C C C C C C CITALY B B B B B B B B B BJAPAN A A A A A A A A A A AKOREA B B B B B B B B C B BLUXEMBURG C C C C C CMALAYSIAe B B B B B B B C CMEXICOe C C C C C CNETHERLANDS A A A A A A A A BNEW ZEALAND B B B B B C CNORWAY B B C B B B CPAKISTANe C C C C C C C CPHILIPPINESe B B C B B C B CPERUe C C CPOLANDe C C C C C C CPORTUGAL B B B C B B C CROMANIAe C C C C C C C CRUSSIAe C C CSINGAPORE A A B A A A A CSOUTH AFRICAe A C C C B A A A C CSPAIN B B C B B B B B B BSRI LANKAe B B B C B B CSWEDEN B B B B B C B C CSWITZERLAND A A B A A A A B C ATAIWANe B B B B B B BTHAILANDe B B B B B B C C C CTURKEYe C C C C C C CUK A A A A A A A A B B BUS A A A A A A A A A A AVENEZUELAe C C C
48
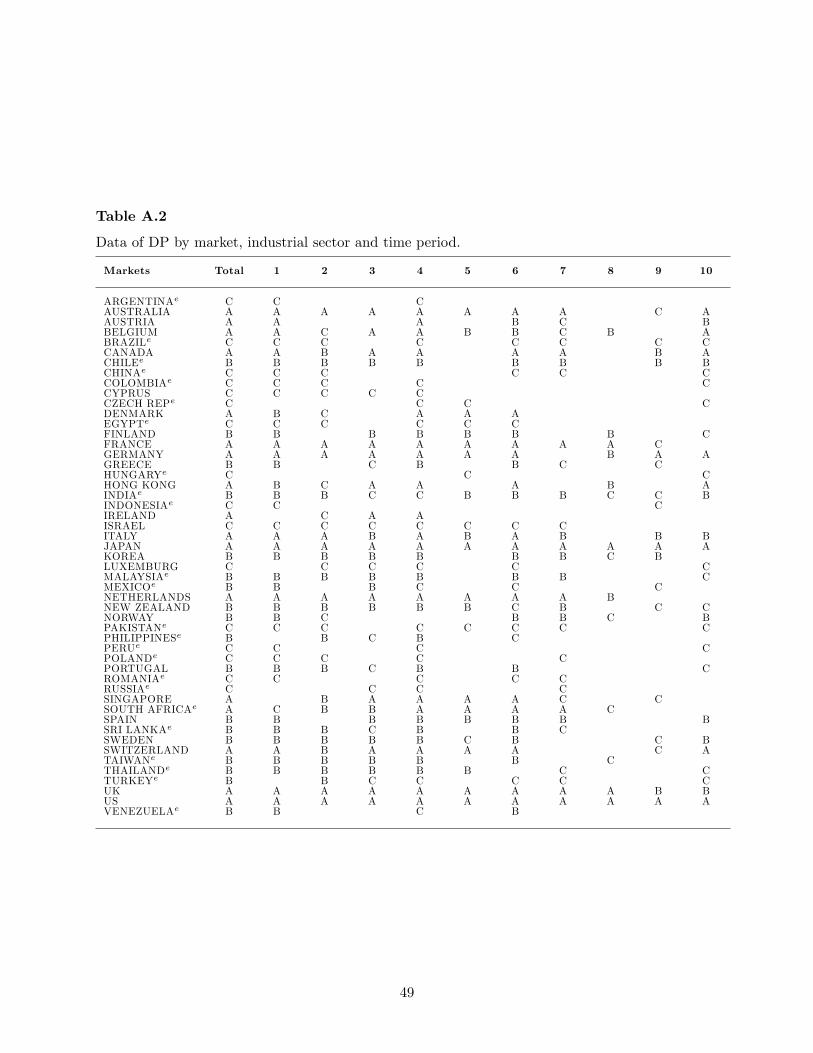
Table A.2
Data of DP by market, industrial sector and time period.
Markets Total 1 2 3 4 5 6 7 8 9 10
ARGENTINAe C C CAUSTRALIA A A A A A A A A C AAUSTRIA A A A B C BBELGIUM A A C A A B B C B ABRAZILe C C C C C C C CCANADA A A B A A A A B ACHILEe B B B B B B B B BCHINAe C C C C C CCOLOMBIAe C C C C CCYPRUS C C C C CCZECH REPe C C C CDENMARK A B C A A AEGYPTe C C C C C CFINLAND B B B B B B B CFRANCE A A A A A A A A A CGERMANY A A A A A A A B A AGREECE B B C B B C CHUNGARYe C C CHONG KONG A B C A A A B AINDIAe B B B C C B B B C C BINDONESIAe C C CIRELAND A C A AISRAEL C C C C C C C CITALY A A A B A B A B B BJAPAN A A A A A A A A A A AKOREA B B B B B B B C BLUXEMBURG C C C C C CMALAYSIAe B B B B B B B CMEXICOe B B B C C CNETHERLANDS A A A A A A A A BNEW ZEALAND B B B B B B C B C CNORWAY B B C B B C BPAKISTANe C C C C C C C CPHILIPPINESe B B C B CPERUe C C C CPOLANDe C C C C CPORTUGAL B B B C B B CROMANIAe C C C C CRUSSIAe C C C CSINGAPORE A B A A A A C CSOUTH AFRICAe A C B B A A A A CSPAIN B B B B B B B BSRI LANKAe B B B C B B CSWEDEN B B B B B C B C BSWITZERLAND A A B A A A A C ATAIWANe B B B B B B CTHAILANDe B B B B B B C CTURKEYe B B C C C C CUK A A A A A A A A A B BUS A A A A A A A A A A AVENEZUELAe B B C B
49
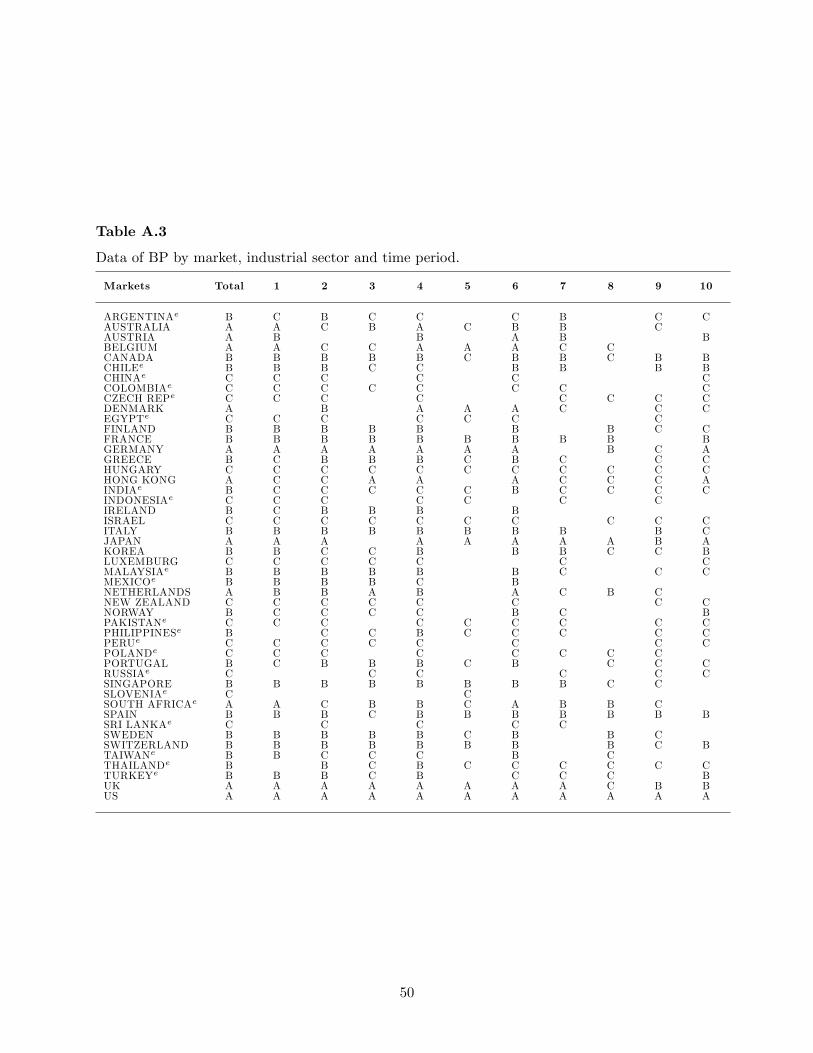
Table A.3
Data of BP by market, industrial sector and time period.
Markets Total 1 2 3 4 5 6 7 8 9 10
ARGENTINAe B C B C C C B C CAUSTRALIA A A C B A C B B CAUSTRIA A B B A B BBELGIUM A A C C A A A C CCANADA B B B B B C B B C B BCHILEe B B B C C B B B BCHINAe C C C C C CCOLOMBIAe C C C C C C C CCZECH REPe C C C C C C C CDENMARK A B A A A C C CEGYPTe C C C C C C CFINLAND B B B B B B B C CFRANCE B B B B B B B B B BGERMANY A A A A A A A B C AGREECE B C B B B C B C C CHUNGARY C C C C C C C C C C CHONG KONG A C C A A A C C C AINDIAe B C C C C C B C C C CINDONESIAe C C C C C C CIRELAND B C B B B BISRAEL C C C C C C C C C CITALY B B B B B B B B B CJAPAN A A A A A A A A B AKOREA B B C C B B B C C BLUXEMBURG C C C C C C CMALAYSIAe B B B B B B C C CMEXICOe B B B B C BNETHERLANDS A B B A B A C B CNEW ZEALAND C C C C C C C CNORWAY B C C C C B C BPAKISTANe C C C C C C C C CPHILIPPINESe B C C B C C C C CPERUe C C C C C C C CPOLANDe C C C C C C C CPORTUGAL B C B B B C B C C CRUSSIAe C C C C C CSINGAPORE B B B B B B B B C CSLOVENIAe C CSOUTH AFRICAe A A C B B C A B B CSPAIN B B B C B B B B B B BSRI LANKAe C C C C CSWEDEN B B B B B C B B CSWITZERLAND B B B B B B B B C BTAIWANe B B C C C B CTHAILANDe B B C B C C C C C CTURKEYe B B B C B C C C BUK A A A A A A A A C B BUS A A A A A A A A A A A
50
SFB 649 Discussion Paper Series 2012
For a complete list of Discussion Papers published by the SFB 649, please visit http://sfb649.wiwi.hu-berlin.de.
SFB 649, Spandauer Straße 1, D-10178 Berlin http://sfb649.wiwi.hu-berlin.de
This research was supported by the Deutsche
Forschungsgemeinschaft through the SFB 649 "Economic Risk".
001 "HMM in dynamic HAC models" by Wolfgang Karl Härdle, Ostap Okhrin and Weining Wang, January 2012.
002 "Dynamic Activity Analysis Model Based Win-Win Development Forecasting Under the Environmental Regulation in China" by Shiyi Chen and Wolfgang Karl Härdle, January 2012.
003 "A Donsker Theorem for Lévy Measures" by Richard Nickl and Markus Reiß, January 2012.
004 "Computational Statistics (Journal)" by Wolfgang Karl Härdle, Yuichi Mori and Jürgen Symanzik, January 2012.
005 "Implementing quotas in university admissions: An experimental analysis" by Sebastian Braun, Nadja Dwenger, Dorothea Kübler and Alexander Westkamp, January 2012.
006 "Quantile Regression in Risk Calibration" by Shih-Kang Chao, Wolfgang Karl Härdle and Weining Wang, January 2012.
007 "Total Work and Gender: Facts and Possible Explanations" by Michael Burda, Daniel S. Hamermesh and Philippe Weil, February 2012.
008 "Does Basel II Pillar 3 Risk Exposure Data help to Identify Risky Banks?" by Ralf Sabiwalsky, February 2012.
009 "Comparability Effects of Mandatory IFRS Adoption" by Stefano Cascino and Joachim Gassen, February 2012.
010 "Fair Value Reclassifications of Financial Assets during the Financial Crisis" by Jannis Bischof, Ulf Brüggemann and Holger Daske, February 2012.
011 "Intended and unintended consequences of mandatory IFRS adoption: A review of extant evidence and suggestions for future research" by Ulf Brüggemann, Jörg-Markus Hitz and Thorsten Sellhorn, February 2012.
012 "Confidence sets in nonparametric calibration of exponential Lévy models" by Jakob Söhl, February 2012.
013 "The Polarization of Employment in German Local Labor Markets" by Charlotte Senftleben and Hanna Wielandt, February 2012.
014 "On the Dark Side of the Market: Identifying and Analyzing Hidden Order Placements" by Nikolaus Hautsch and Ruihong Huang, February 2012.
015 "Existence and Uniqueness of Perturbation Solutions to DSGE Models" by Hong Lan and Alexander Meyer-Gohde, February 2012.
016 "Nonparametric adaptive estimation of linear functionals for low frequency observed Lévy processes" by Johanna Kappus, February 2012.
017 "Option calibration of exponential Lévy models: Implementation and empirical results" by Jakob Söhl und Mathias Trabs, February 2012.
018 "Managerial Overconfidence and Corporate Risk Management" by Tim R. Adam, Chitru S. Fernando and Evgenia Golubeva, February 2012.
019 "Why Do Firms Engage in Selective Hedging?" by Tim R. Adam, Chitru S. Fernando and Jesus M. Salas, February 2012.
020 "A Slab in the Face: Building Quality and Neighborhood Effects" by Rainer Schulz and Martin Wersing, February 2012.
021 "A Strategy Perspective on the Performance Relevance of the CFO" by Andreas Venus and Andreas Engelen, February 2012.
022 "Assessing the Anchoring of Inflation Expectations" by Till Strohsal and Lars Winkelmann, February 2012.
SFB 649 Discussion Paper Series 2012
For a complete list of Discussion Papers published by the SFB 649, please visit http://sfb649.wiwi.hu-berlin.de.
023 "Hidden Liquidity: Determinants and Impact" by Gökhan Cebiroglu and Ulrich Horst, March 2012.
024 "Bye Bye, G.I. - The Impact of the U.S. Military Drawdown on Local German Labor Markets" by Jan Peter aus dem Moore and Alexandra Spitz-Oener, March 2012.
025 "Is socially responsible investing just screening? Evidence from mutual funds" by Markus Hirschberger, Ralph E. Steuer, Sebastian Utz and Maximilian Wimmer, March 2012.
026 "Explaining regional unemployment differences in Germany: a spatial panel data analysis" by Franziska Lottmann, March 2012.
027 "Forecast based Pricing of Weather Derivatives" by Wolfgang Karl Härdle, Brenda López-Cabrera and Matthias Ritter, March 2012.
028 “Does umbrella branding really work? Investigating cross-category brand loyalty” by Nadja Silberhorn and Lutz Hildebrandt, April 2012.
029 “Statistical Modelling of Temperature Risk” by Zografia Anastasiadou, and Brenda López-Cabrera, April 2012.
030 “Support Vector Machines with Evolutionary Feature Selection for Default Prediction” by Wolfgang Karl Härdle, Dedy Dwi Prastyo and Christian Hafner, April 2012.
031 “Local Adaptive Multiplicative Error Models for High-Frequency Forecasts” by Wolfgang Karl Härdle, Nikolaus Hautsch and Andrija Mihoci, April 2012.
032 “Copula Dynamics in CDOs.” by Barbara Choroś-Tomczyk, Wolfgang Karl Härdle and Ludger Overbeck, May 2012.
033 “Simultaneous Statistical Inference in Dynamic Factor Models” by Thorsten Dickhaus, May 2012.
034 “Realized Copula” by Matthias R. Fengler and Ostap Okhrin, Mai 2012. 035 “Correlated Trades and Herd Behavior in the Stock Market” by Simon
Jurkatis, Stephanie Kremer and Dieter Nautz, May 2012 036 “Hierarchical Archimedean Copulae: The HAC Package” by Ostap Okhrin
and Alexander Ristig, May 2012. 037 “Do Japanese Stock Prices Reflect Macro Fundamentals?” by Wenjuan
Chen and Anton Velinov, May 2012. 038 “The Aging Investor: Insights from Neuroeconomics” by Peter N. C. Mohr
and Hauke R. Heekeren, May 2012. 039 “Volatility of price indices for heterogeneous goods” by Fabian Y.R.P.
Bocart and Christian M. Hafner, May 2012. 040 “Location, location, location: Extracting location value from house
prices” by Jens Kolbe, Rainer Schulz, Martin Wersing and Axel Werwatz, May 2012.
041 “Multiple point hypothesis test problems and effective numbers of tests” by Thorsten Dickhaus and Jens Stange, June 2012
042 “Generated Covariates in Nonparametric Estimation: A Short Review.” by Enno Mammen, Christoph Rothe, and Melanie Schienle, June 2012.
043 “The Signal of Volatility” by Till Strohsal and Enzo Weber, June 2012. 044 “Copula-Based Dynamic Conditional Correlation Multiplicative Error
Processes” by Taras Bodnar and Nikolaus Hautsch, July 2012
SFB 649, Spandauer Straße 1, D-10178 Berlin http://sfb649.wiwi.hu-berlin.de
This research was supported by the Deutsche
Forschungsgemeinschaft through the SFB 649 "Economic Risk".
SFB 649, Spandauer Straße 1, D-10178 Berlin http://sfb649.wiwi.hu-berlin.de
This research was supported by the Deutsche
Forschungsgemeinschaft through the SFB 649 "Economic Risk".
SFB 649 Discussion Paper Series 2012
For a complete list of Discussion Papers published by the SFB 649, please visit http://sfb649.wiwi.hu-berlin.de.
045 "Additive Models: Extensions and Related Models." by Enno Mammen, Byeong U. Park and Melanie Schienle, July 2012.
046 "A uniform central limit theorem and efficiency for deconvolution estimators" by Jakob Söhl and Mathias Trabs, July 2012
047 "Nonparametric Kernel Density Estimation Near the Boundary" by Peter Malec and Melanie Schienle, August 2012
048 "Yield Curve Modeling and Forecasting using Semiparametric Factor Dynamics" by Wolfgang Karl Härdle and Piotr Majer, August 2012
049 "Simultaneous test procedures in terms of p-value copulae" by Thorsten Dickhaus and Jakob Gierl, August 2012
050 "Do Natural Resource Sectors Rely Less on External Finance than Manufacturing Sectors? " by Christian Hattendorff, August 2012
051 "Using transfer entropy to measure information flows between financial markets" by Thomas Dimpfl and Franziska J. Peter, August 2012
052 "Rethinking stock market integration: Globalization, valuation and convergence" by Pui Sun Tam and Pui I Tam, August 2012