corelogic home price index report march...
TRANSCRIPT
CoreLogic ®
Home Price Index Report
MARCH 2014
CORELOGIC HOME PRICE INDEX REPORTMARCH 2014
© 2014 CoreLogic — Proprietary and confidential. This material may not be reproduced in any form without express written permission. 22
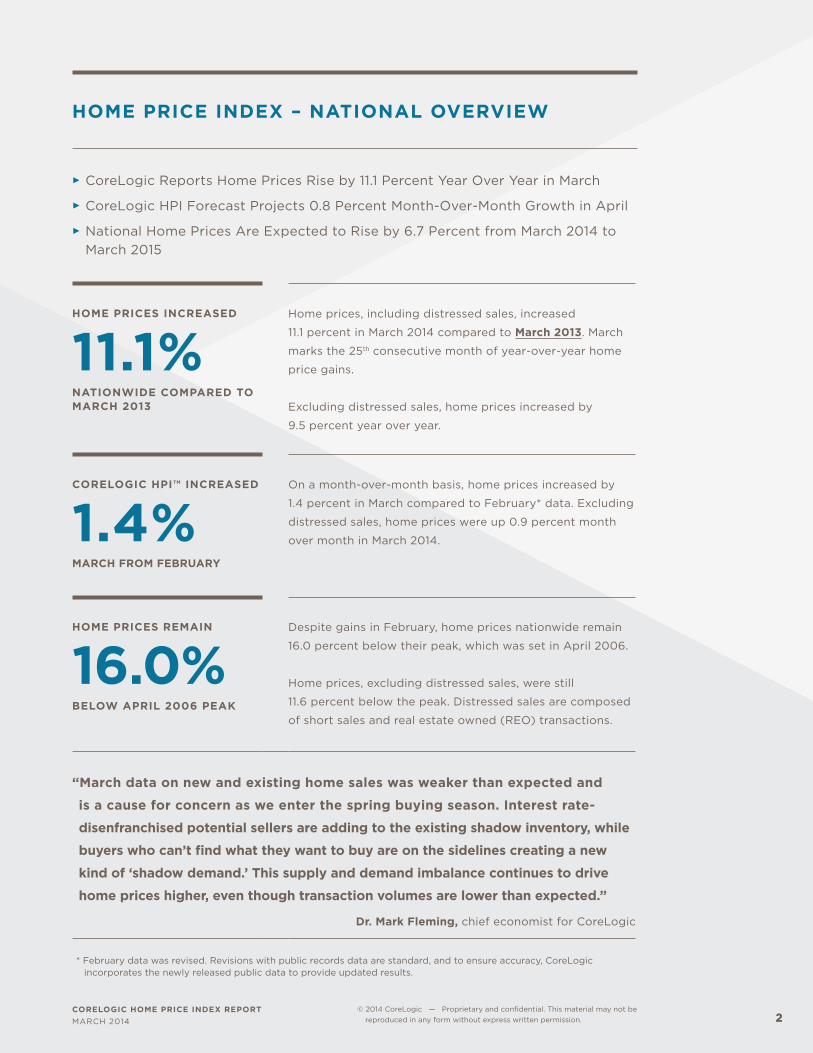
HOME PRICE INDEX – NATIONAL OVERVIEW
► CoreLogic Reports Home Prices Rise by 11.1 Percent Year Over Year in March
► CoreLogic HPI Forecast Projects 0.8 Percent Month-Over-Month Growth in April
► National Home Prices Are Expected to Rise by 6.7 Percent from March 2014 to March 2015
HOME PRICES INCREASED
11.1%NATIONWIDE COMPARED TO MARCH 2013
Home prices, including distressed sales, increased
11.1 percent in March 2014 compared to March 2013. March
marks the 25th consecutive month of year-over-year home
price gains.
Excluding distressed sales, home prices increased by
9.5 percent year over year.
CORELOGIC HPI™ INCREASED
1.4%MARCH FROM FEBRUARY
On a month-over-month basis, home prices increased by
1.4 percent in March compared to February* data. Excluding
distressed sales, home prices were up 0.9 percent month
over month in March 2014.
HOME PRICES REMAIN
16.0%BELOW APRIL 2006 PEAK
Despite gains in February, home prices nationwide remain
16.0 percent below their peak, which was set in April 2006.
Home prices, excluding distressed sales, were still
11.6 percent below the peak. Distressed sales are composed
of short sales and real estate owned (REO) transactions.
“March data on new and existing home sales was weaker than expected and
is a cause for concern as we enter the spring buying season. Interest rate-
disenfranchised potential sellers are adding to the existing shadow inventory, while
buyers who can’t find what they want to buy are on the sidelines creating a new
kind of ‘shadow demand.’ This supply and demand imbalance continues to drive
home prices higher, even though transaction volumes are lower than expected.”
Dr. Mark Fleming, chief economist for CoreLogic
* February data was revised. Revisions with public records data are standard, and to ensure accuracy, CoreLogic incorporates the newly released public data to provide updated results.
CORELOGIC HOME PRICE INDEX REPORTMARCH 2014
© 2014 CoreLogic — Proprietary and confidential. This material may not be reproduced in any form without express written permission. 3
SHORT-TERM PROJECTIONS
THE CORELOGIC HPI FORECASTS™ INDICATE THAT HOME PRICES, INCLUDING DISTRESSED SALES, ARE PROJECTED TO INCREASE
0.8%month over month from March 2014 to April 2014.
The forecast indicates that home prices, including distressed
sales, are projected to increase 0.8 percent month over
month from March 2014 to April 2014 and by 6.7 percent
(+/− 1.5 percent) from March 2014 to March 2015.
EXCLUDING DISTRESSED SALES, HOME PRICES ARE EXPECTED TO RISE
0.6%month over month from March 2014 to April 2014 and by 5.7 percent
(+/− 1.5 percent) year over year from March 2014 to March 2015.
“Home prices continue to rise across the nation, but
affordability, tight credit and supply concerns are
becoming an increasing drag on purchase market
activity. In many markets—especially major metro areas
like Los Angeles, Atlanta and New York—home prices
are being driven up at double-digit rates fueled by a
lack of inventory and record levels of cash purchases.”
Anand Nallathambi, president and CEO of CoreLogic
The CoreLogic HPI Forecasts are a monthly forecast built on
the CoreLogic HPI and other economic variables.
CORELOGIC HOME PRICE INDEX REPORTMARCH 2014
© 2014 CoreLogic — Proprietary and confidential. This material may not be reproduced in any form without express written permission. 4
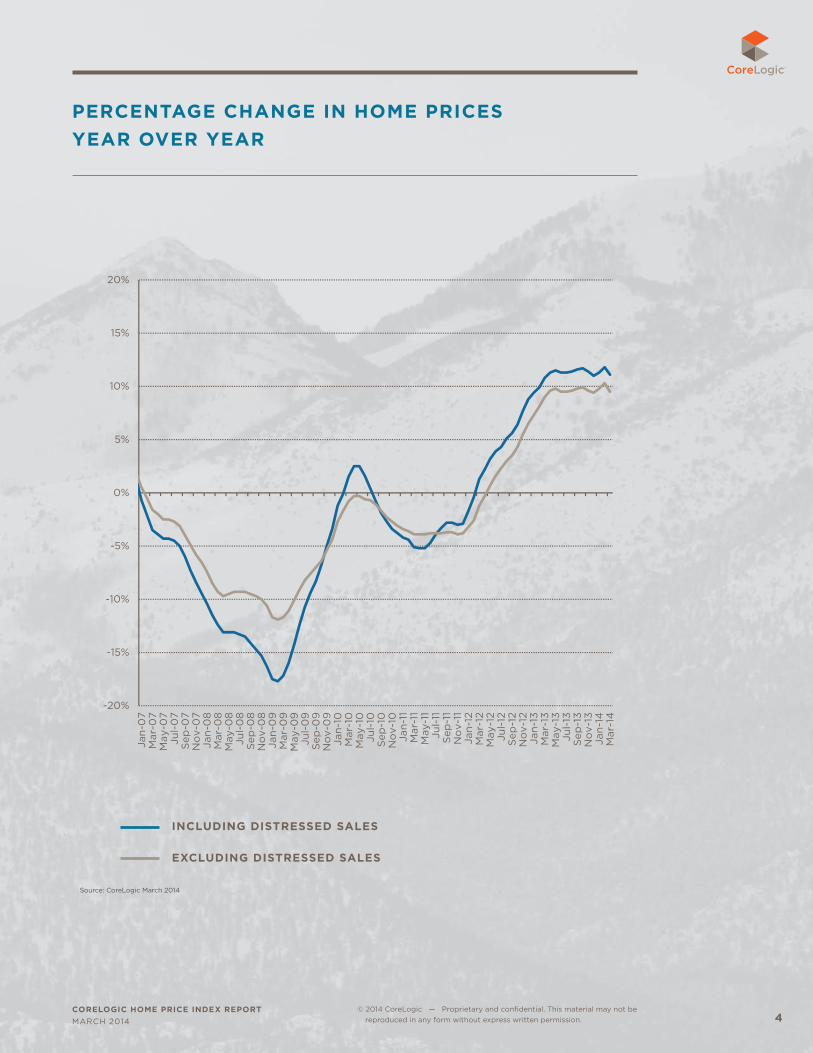
PERCENTAGE CHANGE IN HOME PRICES YEAR OVER YEAR
-20%
-15%
-10%
-5%
0%
5%
10%
15%
20%
Jan-
07
Mar
-07
May
-07
Jul-
07
Sep
-07
No
v-0
7Ja
n-0
8M
ar-0
8M
ay-0
8Ju
l-0
8S
ep-0
8N
ov-
08
Jan-
09
Mar
-09
May
-09
Jul-
09
Sep
-09
No
v-0
9Ja
n-10
Mar
-10
May
-10
Jul-
10S
ep-1
0N
ov-
10Ja
n-11
Mar
-11
May
-11
Jul-
11S
ep-1
1N
ov-
11Ja
n-12
Mar
-12
May
-12
Jul-
12S
ep-1
2N
ov-
12Ja
n-13
Mar
-13
May
-13
Jul-
13S
ep-1
3N
ov-
13Ja
n-14
Mar
-14
Including Distressed Excluding DistressedINCLUDING DISTRESSED SALES
EXCLUDING DISTRESSED SALES
Source: CoreLogic March 2014
CORELOGIC HOME PRICE INDEX REPORTMARCH 2014
© 2014 CoreLogic — Proprietary and confidential. This material may not be reproduced in any form without express written permission. 55
No Decline
0% - 8%
8% - 15%
15% - 20%
>20%
No Decline
0% - 8%
8% - 15%
15% - 20%
>20%
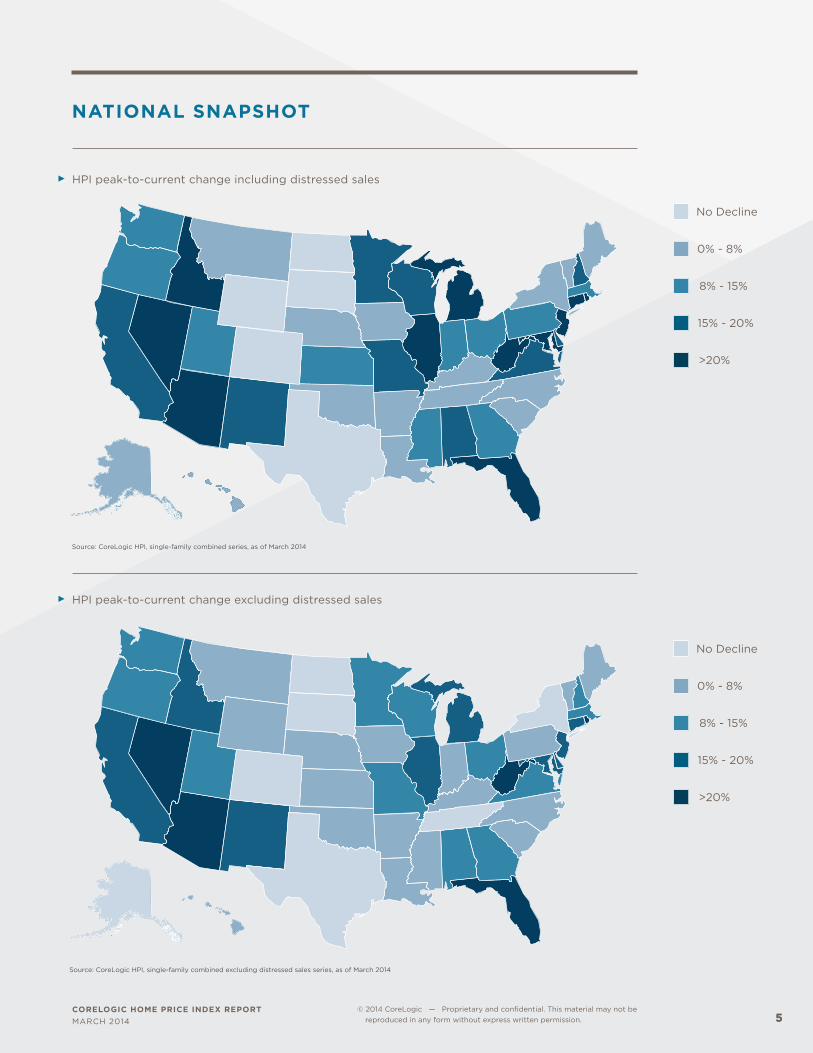
NATIONAL SNAPSHOT
► HPI peak-to-current change including distressed sales
Source: CoreLogic HPI, single-family combined series, as of March 2014
► HPI peak-to-current change excluding distressed sales
Source: CoreLogic HPI, single-family combined excluding distressed sales series, as of March 2014
CORELOGIC HOME PRICE INDEX REPORTMARCH 2014
© 2014 CoreLogic — Proprietary and confidential. This material may not be reproduced in any form without express written permission. 66
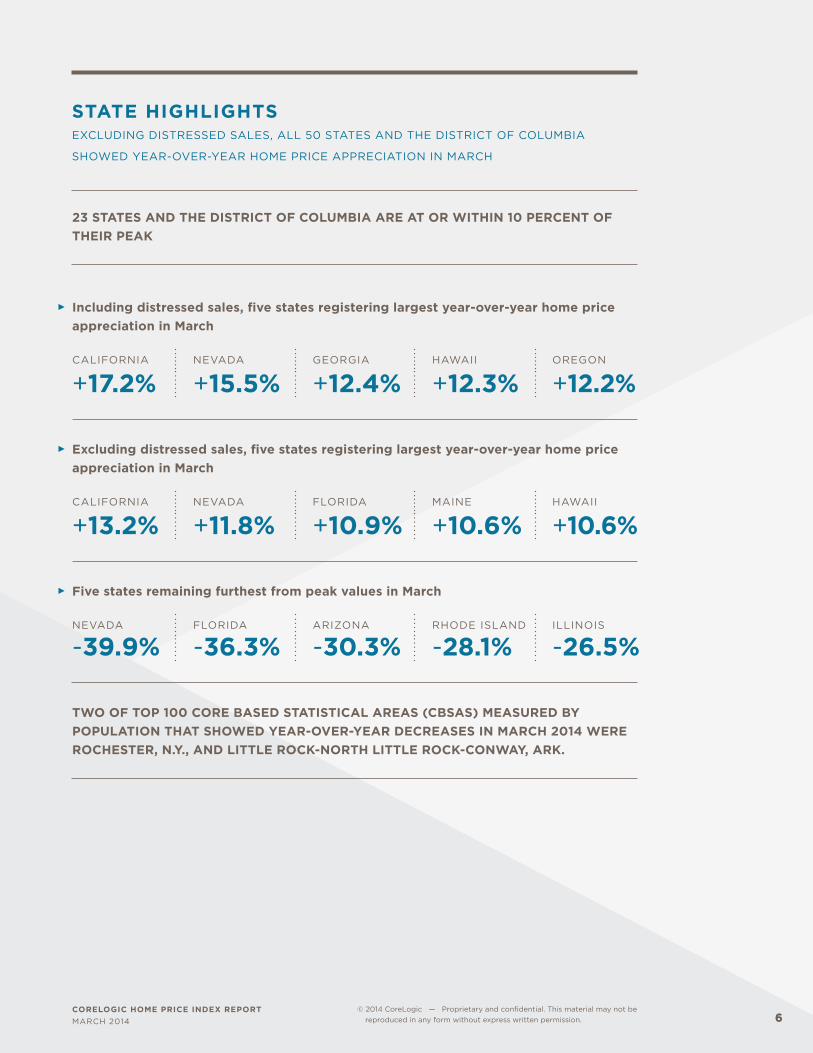
STATE HIGHLIGHTSEXCLUDING DISTRESSED SALES, ALL 50 STATES AND THE DISTRICT OF COLUMBIA
SHOWED YEAR-OVER-YEAR HOME PRICE APPRECIATION IN MARCH
23 STATES AND THE DISTRICT OF COLUMBIA ARE AT OR WITHIN 10 PERCENT OF THEIR PEAK
► Including distressed sales, five states registering largest year-over-year home price appreciation in March
CALIFORNIA NEVADA GEORGIA HAWAII OREGON
+17.2% +15.5% +12.4% +12.3% +12.2%
► Excluding distressed sales, five states registering largest year-over-year home price appreciation in March
CALIFORNIA NEVADA FLORIDA MAINE HAWAII
+13.2% +11.8% +10.9% +10.6% +10.6%
► Five states remaining furthest from peak values in March
NEVADA FLORIDA ARIZONA RHODE ISLAND ILLINOIS
-39.9% -36.3% -30.3% -28.1% -26.5%
TWO OF TOP 100 CORE BASED STATISTICAL AREAS (CBSAS) MEASURED BY POPULATION THAT SHOWED YEAR-OVER-YEAR DECREASES IN MARCH 2014 WERE ROCHESTER, N.Y., AND LITTLE ROCK-NORTH LITTLE ROCK-CONWAY, ARK.
CORELOGIC HOME PRICE INDEX REPORTMARCH 2014
© 2014 CoreLogic — Proprietary and confidential. This material may not be reproduced in any form without express written permission. 77
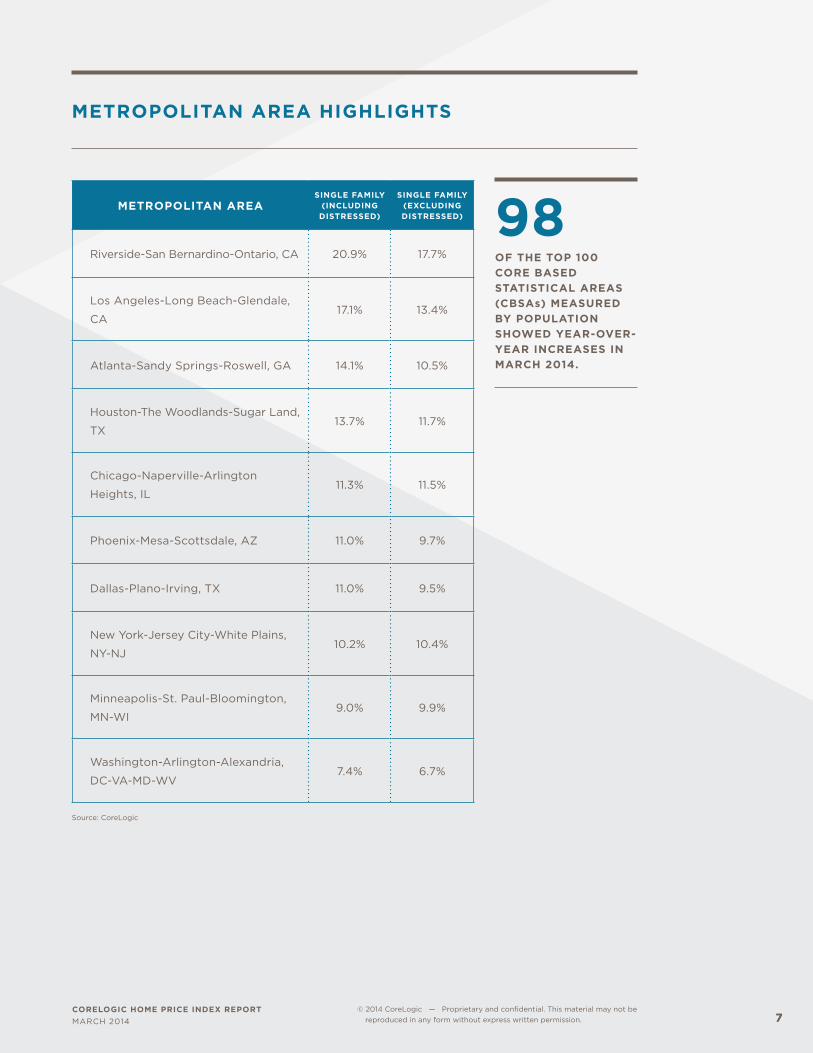
METROPOLITAN AREA HIGHLIGHTS
METROPOLITAN AREASINGLE FAMILY
(INCLUDING DISTRESSED)
SINGLE FAMILY (EXCLUDING DISTRESSED)
Riverside-San Bernardino-Ontario, CA 20.9% 17.7%
Los Angeles-Long Beach-Glendale,
CA17.1% 13.4%
Atlanta-Sandy Springs-Roswell, GA 14.1% 10.5%
Houston-The Woodlands-Sugar Land,
TX13.7% 11.7%
Chicago-Naperville-Arlington
Heights, IL11.3% 11.5%
Phoenix-Mesa-Scottsdale, AZ 11.0% 9.7%
Dallas-Plano-Irving, TX 11.0% 9.5%
New York-Jersey City-White Plains,
NY-NJ10.2% 10.4%
Minneapolis-St. Paul-Bloomington,
MN-WI9.0% 9.9%
Washington-Arlington-Alexandria,
DC-VA-MD-WV7.4% 6.7%
Source: CoreLogic
98OF THE TOP 100 CORE BASED STATISTICAL AREAS (CBSAs) MEASURED BY POPULATION SHOWED YEAR-OVER-YEAR INCREASES IN MARCH 2014.
CORELOGIC HOME PRICE INDEX REPORTMARCH 2014
© 2014 CoreLogic — Proprietary and confidential. This material may not be reproduced in any form without express written permission. 88
CONTINUED ON PAGE 9
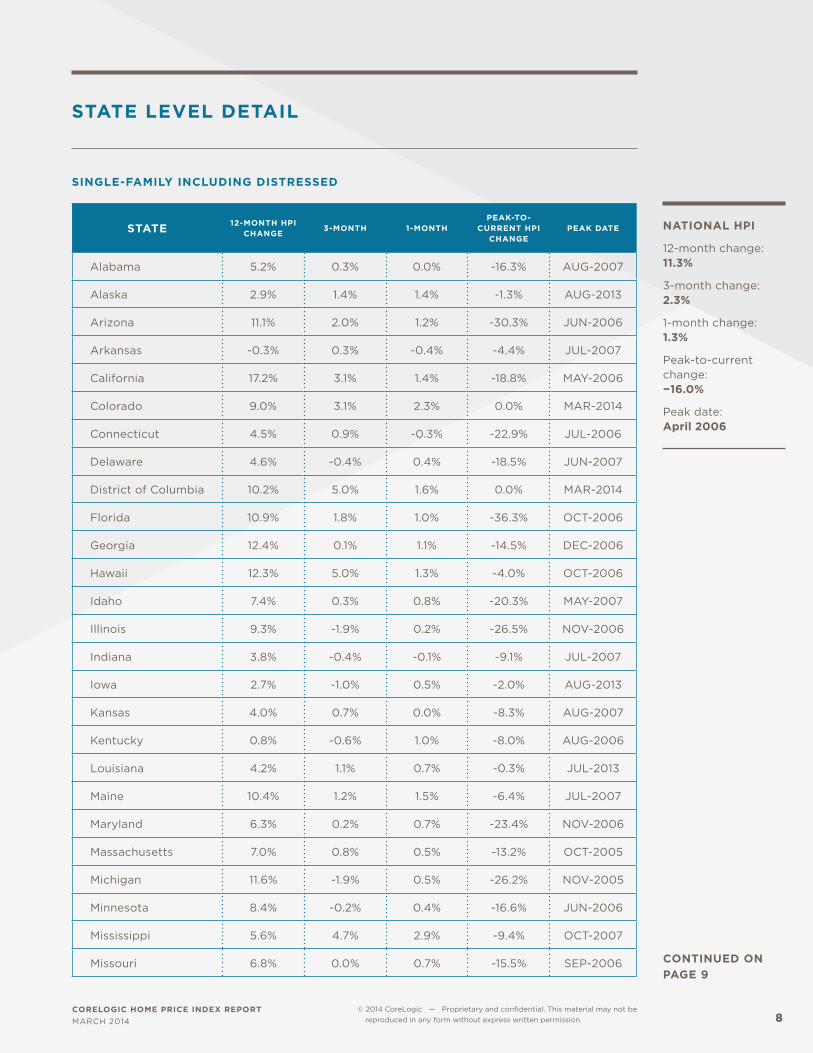
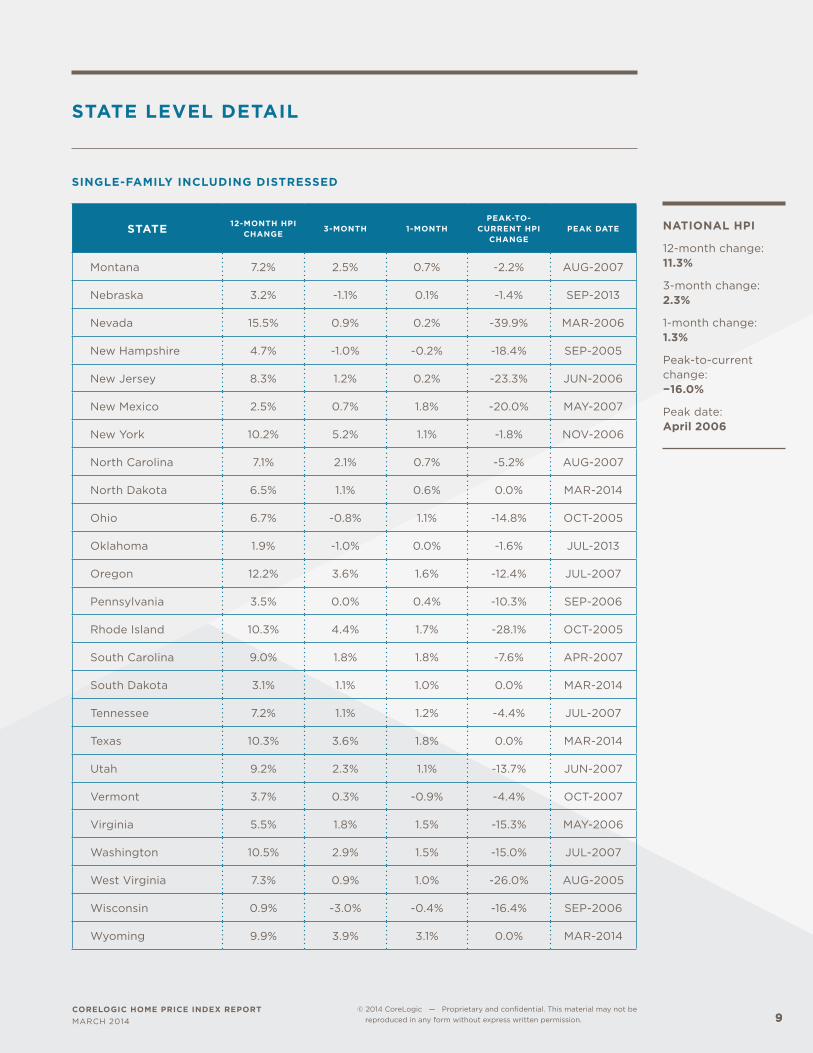
STATE LEVEL DETAIL
SINGLE-FAMILY INCLUDING DISTRESSED
STATE 12-MONTH HPI CHANGE
3-MONTH 1-MONTH PEAK-TO-
CURRENT HPI CHANGE
PEAK DATE
Alabama 5.2% 0.3% 0.0% -16.3% AUG-2007
Alaska 2.9% 1.4% 1.4% -1.3% AUG-2013
Arizona 11.1% 2.0% 1.2% -30.3% JUN-2006
Arkansas -0.3% 0.3% -0.4% -4.4% JUL-2007
California 17.2% 3.1% 1.4% -18.8% MAY-2006
Colorado 9.0% 3.1% 2.3% 0.0% MAR-2014
Connecticut 4.5% 0.9% -0.3% -22.9% JUL-2006
Delaware 4.6% -0.4% 0.4% -18.5% JUN-2007
District of Columbia 10.2% 5.0% 1.6% 0.0% MAR-2014
Florida 10.9% 1.8% 1.0% -36.3% OCT-2006
Georgia 12.4% 0.1% 1.1% -14.5% DEC-2006
Hawaii 12.3% 5.0% 1.3% -4.0% OCT-2006
Idaho 7.4% 0.3% 0.8% -20.3% MAY-2007
Illinois 9.3% -1.9% 0.2% -26.5% NOV-2006
Indiana 3.8% -0.4% -0.1% -9.1% JUL-2007
Iowa 2.7% -1.0% 0.5% -2.0% AUG-2013
Kansas 4.0% 0.7% 0.0% -8.3% AUG-2007
Kentucky 0.8% -0.6% 1.0% -8.0% AUG-2006
Louisiana 4.2% 1.1% 0.7% -0.3% JUL-2013
Maine 10.4% 1.2% 1.5% -6.4% JUL-2007
Maryland 6.3% 0.2% 0.7% -23.4% NOV-2006
Massachusetts 7.0% 0.8% 0.5% -13.2% OCT-2005
Michigan 11.6% -1.9% 0.5% -26.2% NOV-2005
Minnesota 8.4% -0.2% 0.4% -16.6% JUN-2006
Mississippi 5.6% 4.7% 2.9% -9.4% OCT-2007
Missouri 6.8% 0.0% 0.7% -15.5% SEP-2006
NATIONAL HPI
12-month change: 11.3%
3-month change: 2.3%
1-month change: 1.3%
Peak-to-current change: −16.0%
Peak date: April 2006
CORELOGIC HOME PRICE INDEX REPORTMARCH 2014
© 2014 CoreLogic — Proprietary and confidential. This material may not be reproduced in any form without express written permission. 99
STATE 12-MONTH HPI CHANGE
3-MONTH 1-MONTH PEAK-TO-
CURRENT HPI CHANGE
PEAK DATE
Montana 7.2% 2.5% 0.7% -2.2% AUG-2007
Nebraska 3.2% -1.1% 0.1% -1.4% SEP-2013
Nevada 15.5% 0.9% 0.2% -39.9% MAR-2006
New Hampshire 4.7% -1.0% -0.2% -18.4% SEP-2005
New Jersey 8.3% 1.2% 0.2% -23.3% JUN-2006
New Mexico 2.5% 0.7% 1.8% -20.0% MAY-2007
New York 10.2% 5.2% 1.1% -1.8% NOV-2006
North Carolina 7.1% 2.1% 0.7% -5.2% AUG-2007
North Dakota 6.5% 1.1% 0.6% 0.0% MAR-2014
Ohio 6.7% -0.8% 1.1% -14.8% OCT-2005
Oklahoma 1.9% -1.0% 0.0% -1.6% JUL-2013
Oregon 12.2% 3.6% 1.6% -12.4% JUL-2007
Pennsylvania 3.5% 0.0% 0.4% -10.3% SEP-2006
Rhode Island 10.3% 4.4% 1.7% -28.1% OCT-2005
South Carolina 9.0% 1.8% 1.8% -7.6% APR-2007
South Dakota 3.1% 1.1% 1.0% 0.0% MAR-2014
Tennessee 7.2% 1.1% 1.2% -4.4% JUL-2007
Texas 10.3% 3.6% 1.8% 0.0% MAR-2014
Utah 9.2% 2.3% 1.1% -13.7% JUN-2007
Vermont 3.7% 0.3% -0.9% -4.4% OCT-2007
Virginia 5.5% 1.8% 1.5% -15.3% MAY-2006
Washington 10.5% 2.9% 1.5% -15.0% JUL-2007
West Virginia 7.3% 0.9% 1.0% -26.0% AUG-2005
Wisconsin 0.9% -3.0% -0.4% -16.4% SEP-2006
Wyoming 9.9% 3.9% 3.1% 0.0% MAR-2014
STATE LEVEL DETAIL
SINGLE-FAMILY INCLUDING DISTRESSED
NATIONAL HPI
12-month change: 11.3%
3-month change: 2.3%
1-month change: 1.3%
Peak-to-current change: −16.0%
Peak date: April 2006
CORELOGIC HOME PRICE INDEX REPORTMARCH 2014
© 2014 CoreLogic — Proprietary and confidential. This material may not be reproduced in any form without express written permission. 1010
CONTINUED ON PAGE 11
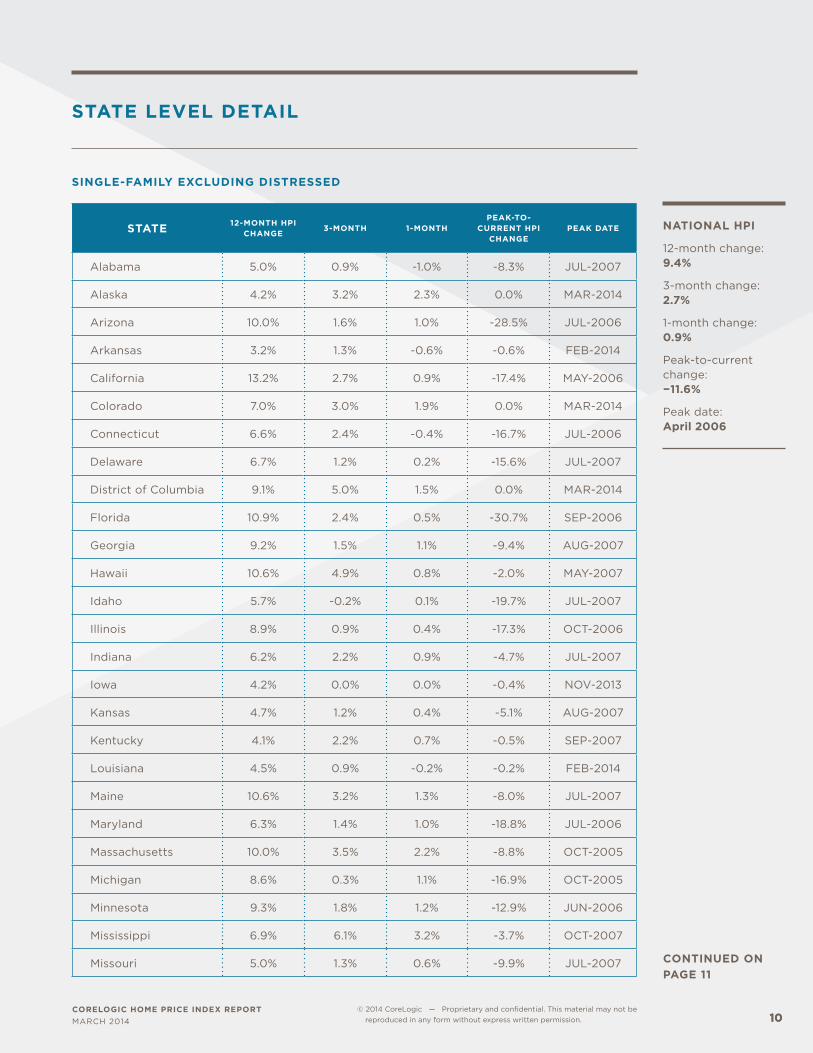
STATE LEVEL DETAIL
SINGLE-FAMILY EXCLUDING DISTRESSED
STATE 12-MONTH HPI CHANGE
3-MONTH 1-MONTH PEAK-TO-
CURRENT HPI CHANGE
PEAK DATE
Alabama 5.0% 0.9% -1.0% -8.3% JUL-2007
Alaska 4.2% 3.2% 2.3% 0.0% MAR-2014
Arizona 10.0% 1.6% 1.0% -28.5% JUL-2006
Arkansas 3.2% 1.3% -0.6% -0.6% FEB-2014
California 13.2% 2.7% 0.9% -17.4% MAY-2006
Colorado 7.0% 3.0% 1.9% 0.0% MAR-2014
Connecticut 6.6% 2.4% -0.4% -16.7% JUL-2006
Delaware 6.7% 1.2% 0.2% -15.6% JUL-2007
District of Columbia 9.1% 5.0% 1.5% 0.0% MAR-2014
Florida 10.9% 2.4% 0.5% -30.7% SEP-2006
Georgia 9.2% 1.5% 1.1% -9.4% AUG-2007
Hawaii 10.6% 4.9% 0.8% -2.0% MAY-2007
Idaho 5.7% -0.2% 0.1% -19.7% JUL-2007
Illinois 8.9% 0.9% 0.4% -17.3% OCT-2006
Indiana 6.2% 2.2% 0.9% -4.7% JUL-2007
Iowa 4.2% 0.0% 0.0% -0.4% NOV-2013
Kansas 4.7% 1.2% 0.4% -5.1% AUG-2007
Kentucky 4.1% 2.2% 0.7% -0.5% SEP-2007
Louisiana 4.5% 0.9% -0.2% -0.2% FEB-2014
Maine 10.6% 3.2% 1.3% -8.0% JUL-2007
Maryland 6.3% 1.4% 1.0% -18.8% JUL-2006
Massachusetts 10.0% 3.5% 2.2% -8.8% OCT-2005
Michigan 8.6% 0.3% 1.1% -16.9% OCT-2005
Minnesota 9.3% 1.8% 1.2% -12.9% JUN-2006
Mississippi 6.9% 6.1% 3.2% -3.7% OCT-2007
Missouri 5.0% 1.3% 0.6% -9.9% JUL-2007
NATIONAL HPI
12-month change: 9.4%
3-month change: 2.7%
1-month change: 0.9%
Peak-to-current change: −11.6%
Peak date: April 2006
CORELOGIC HOME PRICE INDEX REPORTMARCH 2014
© 2014 CoreLogic — Proprietary and confidential. This material may not be reproduced in any form without express written permission. 1111
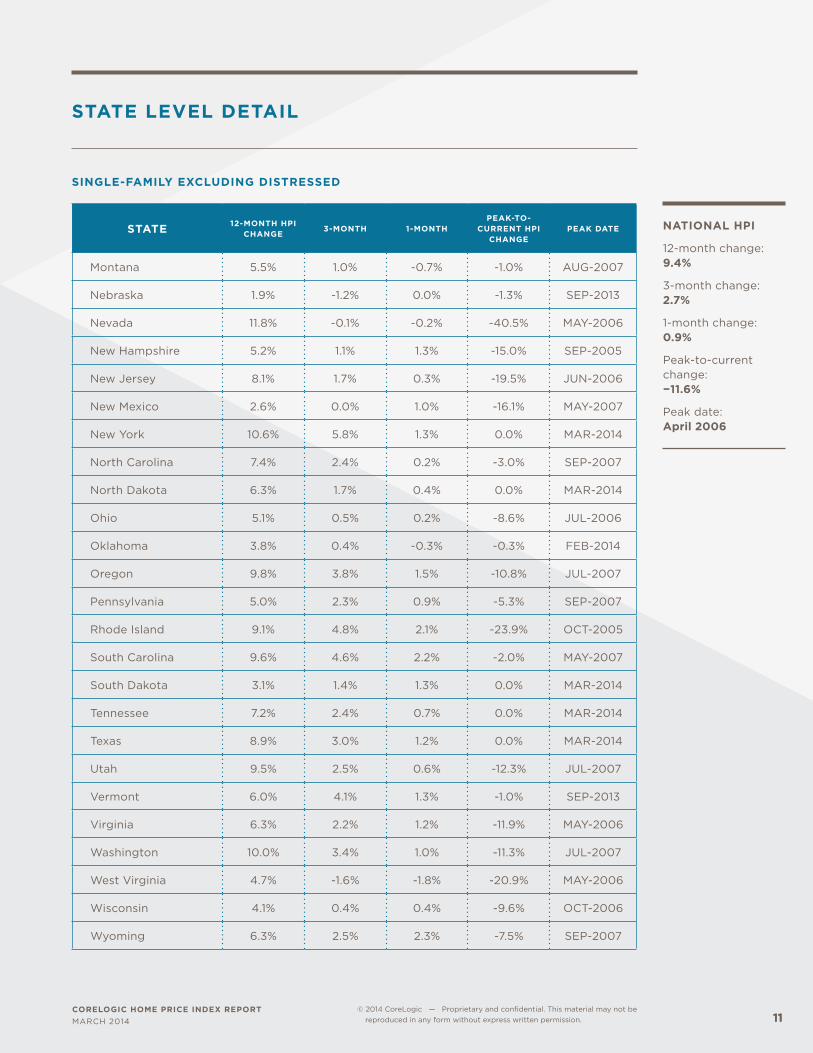
STATE LEVEL DETAIL
SINGLE-FAMILY EXCLUDING DISTRESSED
STATE 12-MONTH HPI CHANGE
3-MONTH 1-MONTH PEAK-TO-
CURRENT HPI CHANGE
PEAK DATE
Montana 5.5% 1.0% -0.7% -1.0% AUG-2007
Nebraska 1.9% -1.2% 0.0% -1.3% SEP-2013
Nevada 11.8% -0.1% -0.2% -40.5% MAY-2006
New Hampshire 5.2% 1.1% 1.3% -15.0% SEP-2005
New Jersey 8.1% 1.7% 0.3% -19.5% JUN-2006
New Mexico 2.6% 0.0% 1.0% -16.1% MAY-2007
New York 10.6% 5.8% 1.3% 0.0% MAR-2014
North Carolina 7.4% 2.4% 0.2% -3.0% SEP-2007
North Dakota 6.3% 1.7% 0.4% 0.0% MAR-2014
Ohio 5.1% 0.5% 0.2% -8.6% JUL-2006
Oklahoma 3.8% 0.4% -0.3% -0.3% FEB-2014
Oregon 9.8% 3.8% 1.5% -10.8% JUL-2007
Pennsylvania 5.0% 2.3% 0.9% -5.3% SEP-2007
Rhode Island 9.1% 4.8% 2.1% -23.9% OCT-2005
South Carolina 9.6% 4.6% 2.2% -2.0% MAY-2007
South Dakota 3.1% 1.4% 1.3% 0.0% MAR-2014
Tennessee 7.2% 2.4% 0.7% 0.0% MAR-2014
Texas 8.9% 3.0% 1.2% 0.0% MAR-2014
Utah 9.5% 2.5% 0.6% -12.3% JUL-2007
Vermont 6.0% 4.1% 1.3% -1.0% SEP-2013
Virginia 6.3% 2.2% 1.2% -11.9% MAY-2006
Washington 10.0% 3.4% 1.0% -11.3% JUL-2007
West Virginia 4.7% -1.6% -1.8% -20.9% MAY-2006
Wisconsin 4.1% 0.4% 0.4% -9.6% OCT-2006
Wyoming 6.3% 2.5% 2.3% -7.5% SEP-2007
NATIONAL HPI
12-month change: 9.4%
3-month change: 2.7%
1-month change: 0.9%
Peak-to-current change: −11.6%
Peak date: April 2006
CORELOGIC HOME PRICE INDEX REPORTMARCH 2014
© 2014 CoreLogic — Proprietary and confidential. This material may not be reproduced in any form without express written permission. 1212
CORELOGIC HPI METHODOLOGY
The CoreLogic HPI incorporates more than 30 years’ worth of repeat sales transactions, representing
more than 65 million observations sourced from CoreLogic industry-leading property information
and its securities and servicing databases. The CoreLogic HPI provides a multi-tier market evaluation
based on price, time between sales, property type, loan type (conforming vs. nonconforming) and
distressed sales. The CoreLogic HPI is a repeat-sales index that tracks increases and decreases
in sales prices for the same homes over time, including single-family attached and single-family
detached homes, which provides a more accurate “constant-quality” view of pricing trends than
basing analysis on all home sales.
6,993 ZIP codes (58 percent of total U.S. population), 641 Core Based Statistical Areas (86 percent of
total U.S. population) and 1,239 counties (84 percent of total U.S. population) located in all 50 states
and the District of Columbia.
ABOUT CORELOGIC
CoreLogic (NYSE: CLGX) is a leading global property information, analytics and data-enabled
services provider. The company’s combined data from public, contributory and proprietary sources
includes over 3.3 billion records spanning more than 40 years, providing detailed coverage of
property, mortgages and other encumbrances, consumer credit, tenancy, location, hazard risk and
related performance information. The markets CoreLogic serves include real estate and mortgage
finance, insurance, capital markets, and the public sector. CoreLogic delivers value to clients
through unique data, analytics, workflow technology, advisory and managed services. Clients
rely on CoreLogic to help identify and manage growth opportunities, improve performance and
mitigate risk. Headquartered in Irvine, Calif., CoreLogic operates in North America, Western Europe
and Asia Pacific. For more information, please visit www.corelogic.com.
CORELOGIC, the CoreLogic logo, CORELOGIC HPI and CORELOGIC HPI FORECASTS are trademarks of CoreLogic, Inc.
and/or its subsidiaries.
CONTACT
For more information, please call 415-536-3500 or email [email protected].
17-HPI-MAR14-0514-00
MORE INSIGHTS
The CoreLogic Insights Blog (corelogic.com/blog) provides an expanded perspective on housing economies and property markets, including policy, trends, regulation and compliance. Please visit the blog for timely analysis, thought-provoking data visualizations and unique commentary from our team in the Office of the Chief Economist.
CoreLogic CoreLogic Econ