cornell university financial report 2006-2007
TRANSCRIPT

25
Financial Review 26
Management Responsibility for Financial Statements 31
Independent Auditors’ Report 32
Notes to the Financial Statements 37
University Administration 52
Board of Trustees and Trustees At Large 53
Cornell University 2006-2007 Financial Report

26
FINANCIAL REVIEW BY THE EXECUTIVE VICE PRESIDENT FOR ADMINISTRATION AND FINANCE AND THE VICE PRESIDENT FOR FINANCIAL AFFAIRS AND UNIVERSITY CONTROLLER
We are pleased to report a very strong fi nancial year in 2007, which continues to support the University’s ambitious strategic goals. The recently ended fi scal year saw an in-crease in the University’s net assets in excess of one billion dollars. Investment returns of 25.9 percent contributed signifi cantly to this year’s performance by boosting total assets to a level in excess of $10 billion for the fi rst time. Revenues from gifts and pledges continue to support capital campaign goals, and the University maintains its strategic management of debt through the use of commercial paper and tax-exempt bonds while sustaining a strong credit rating. As we look ahead, we expect the continued support of our faculty, staff, students, trustees, alumni, and others, allowing us to continue to build on our fi scal successes and provide for the future generations of Cornellians.
FINANCIAL STATEMENT FORMAT, NEW STANDARDS AND CURRENT INITIATIVES: ANOTHER BUSY YEAR
Financial Statement FormatThe University’s consolidated fi nancial statements are used by many constituents: sponsors, donors, parents, students, employees, government agencies, rating agencies, and others. These users benefi t from a format that is easy to understand. Toward that end, the University changed its fi nancial state-ment format for fi scal year ended June 30, 2007 to facilitate comparisons over time and across organizations. In addi-tion, the fi nancial information for the prior fi scal year has been reclassifi ed to conform to the current year presentation. In implementing the new format, which is detailed below, the University followed guidelines from the National Associa-tion of College and University Business Offi cers (NACUBO) and similar organizations. The University no longer presents its consolidated fi nancial statements using the disaggregation categories of general operations, physical capital, and fi nancial capital. In ad-dition to this change, which affects both the statement of fi nancial position and the statement of activities, accounts receivable have been aggregated on the statement of fi nancial position, and other minor changes have been made to this statement to better refl ect liquidity and the nature of the underlying activities. The working capital line of credit is reclassifi ed from bonds and notes payable to deferred revenue and other liabilities. Derivative instruments for managing interest rate risk are reclassifi ed from accounts payable to prepaid expense if the fair market value adjust-ment at June 30 serves to decrease interest costs, or deferred revenue and other liabilities if the fair market value adjust-ment serves to increase interest costs.
The most signifi cant change in presentation affects the consolidated statement of activities. This statement now presents operating activities separately from nonoperat-ing activities. Broadly defi ned, operating activities include income and expenses that are (a) related to the missions of education, research, and public service, and (b) associated with activity substantially within the control of manage-ment. Operating income also includes investment return for support of current operations based on the University’s pay-out policy established by the Board of Trustees’ endowment spending rules. And, while there is no uniform defi nition of what constitutes “operations” for higher education, many colleges and universities report an “operating measure” as permitted by the Statement of Financial Accounting Stan-dards 117 (SFAS 117), which is designed to refl ect fi nancial performance that is predictive of future results. Additionally, the university has, in its consolidated statement of activities, combined certain categories in both the operat-ing and nonoperating sections: government appropriations (whether federal or state) are reported as appropriations; interest, dividends, payout, gains, and losses (whether real-ized or unrealized) are reported as investment return. The investment return distributed as payout is reported in the operating section of the statement of activities; the invest-ment return undistributed is reported in the nonoperating section. The components of income previously reported as other sources were analyzed and classifi ed as either operating income (educational activities and other sales and services) or nonoperating income (other). Addition-ally, the University now reports payments from New York Presbyterian Hospital as revenues, not as a reduction of expenses. Compensation and benefi ts were combined into one line item, to refl ect the overall costs associated with employment. Also combined were the three separate line items for federal, state, and private grants into grants, contracts and similar agreements. Both direct and indirect cost recoveries for sponsored projects are now reported to provide additional information important for readers.
Nonoperating activities include investment return net of amounts distributed to fund current operations; new gifts for endowments and/or physical plant (primarily buildings); and present-value adjustments to split-interest agreements.
The University has revised certain footnotes and tables to enhance clarity for the readers, consistent with the new fi nancial statement format. In particular, the “Investments at Fair Value” table (see note 3-A) has been revised to disclose information in categories consistent with those often used in the investment community: domestic equity, foreign equity, absolute return, hedged equity, fi xed income, private equity, and real estate.

27
Cornell continues to work closely with its peer institu-tions and professional organizations on issues that affect universities. The Internal Revenue Service (IRS), in response
to these efforts, issued a favorable ruling, Rev. Proc 2007-47, addressing federally sponsored research and its impact on private use of facilities fi nanced with tax-exempt bonds. The issue of private use is extremely important, because it can affect the tax exemption of the bonds. The 2007 ruling provides important and favorable clarifi cation: the rights that inure to the federal government under the Bayh-Dole Act for federally sponsored research will generally not create private use.
Cornell is working closely with its peers and professional organizations to identify and submit to the IRS their shared concerns about the proposed changes to the annual information return for exempt organizations (i.e., 990). Many of the proposed changes create signifi cant additional administrative burden. Therefore, the goal of this collaboration is to create changes that are acceptable to the IRS and practicable for tax-exempt organizations.
CURRENT INITIATIVES
Ten-Year Financial PlanOperating measures, refl ected in Cornell’s new presenta-tion, are important not merely for a particular fi scal year, but are useful in developing projections of future fi nancial results and their impact on cash fl ows and fi nancial ratios, essential for sound strategic planning.
In fi scal year 2007, Cornell began a comprehensive project to envision and engineer the University’s economic profi le for the next ten years in an effort to ensure that the University maintains its fi nancial strength while meeting its strategic goals. The preparation of detailed capital and operating budgets, as well as pro forma fi nancial statements for a future ten-year period, should help management make the wisest fi nancial and economic decisions. The ten-year projection, now reported in a format based on an operating measure similar to the consolidated statement of activities, will be reevaluated each year based on actual results and changes in the University’s strategic plan.
NEW STANDARDS
Financial Standards Accounting BoardThe Financial Standards Accounting Board (FASB) has undertaken a comprehensive project on accounting for postretirement benefi ts. In September 2006, as part of this project, FASB issued Statement of Financial Accounting Standards 158, Employers’ Accounting for Defi ned Ben-efi t Pension and Other Postretirement Plans (SFAS 158). The statement is effective for fi scal year 2007, and refl ects FASB’s concern that footnote disclosure does not provide suffi cient information for employees and others about the over-funded or under-funded status of employee benefi ts. The statement requires recording the “funding status” in the fi nancial statements. For fi scal year 2007, Cornell recorded a decrease in net assets for the under-funded liability of $77 million in the consolidated statement of activities. The amount represents the recognition of the liability in compliance with SFAS 158; the increase to the liability for SFAS 158 is recorded in deferred benefi ts on the statement of fi nancial position. (See notes to consolidated fi nancial statements 1-O and 5-C.)
Auditing Standards BoardThe American Institute of Certifi ed Public Accountants (AICPA), through its Auditing Standards Board (ASB), has continued to focus on internal controls and issued State-ment of Auditing Standard 112, Communicating Internal Control Related Matters Identifi ed in an Audit (SAS 112), effective for fi scal year 2007. SAS 112 introduces and defi nes critical terms related to the internal control environment the auditors must evaluate for fi nancial reporting: “control defi ciency,” “signifi cant defi ciency,” and “material weakness.” In addition, the statement identifi es which defi ciencies must, by regulation, be communicated, and to whom.
To ensure consistency with the Statement of Auditing Standards, the Offi ce of Management and Budget (OMB) announced a revision to Circular A-133 (Audits of States, Local Governments and Non-Profi t Organizations). OMB updated internal control terminology in A-133 to ensure that OMB’s terminology is consistent with SAS 112.
Government Regulations and Emerging Issues Congress continues to focus on exempt organizations, particularly in the committee work of Senators Grassley and Baucus. There is an ongoing concern that the activities of exempt organizations are not suffi ciently transparent to the public and regulatory authorities. In response to these concerns, both federal and state agencies are focusing atten-tion on the activities of exempt organizations and vendors who serve them (such as fi nancial institutions serving the student loan market).
“Investment returns of 25.9 percent contributed signifi cantly to this years’s performance, by boosting total assets to a level in excess of
$10 billion for the fi rst time.”

28
Although overall contribution income increased by 32 percent for fi scal year ended June 30, 2007, the increase is exclusively in nonoperating income. Contributions for operations, in fact, decreased by $52 million from $271.1 million for fi scal year ended June 30, 2006, to $219.1 million for fi scal year ended June 30, 2007. A primary reason is this: in response to Cornell’s strategic initiatives for the capital campaign, Cornell’s donors have often restricted their gifts to buildings and/or permanent endowment. Gifts with these restrictions are now reported in the nonoperating section of the consolidated statement of activities.
Investment returns that are distributed for operations increased by 17 percent, from $248.3 million for fi scal year ended June 30, 2006, to $290.6 million for fi scal year ended June 30, 2007. The Board of Trustees authorized an increase in payout from the long-term investment pool (LTIP) from $2.30 per unit in fi scal year ended June, 30 2006, to $2.42 per unit for fi scal year ended June 30, 2007. The payout from the pooled balances income fund (PBIF) also increased in 2007. Although some members of Congress have suggested that not-for-profi t institutions are spending too little of their investment assets for mission-related activities, this is not true for Cornell or many other research universities.
The revenues from Medical Physicians’ Organization increased by $49.5 million, or 12.7 percent. This increase was created by many factors; most signifi cantly an increase in patient visits resulting from both strategic recruitment of faculty and the opening of the Weill Greenberg Center for ambulatory care, a state-of-the-art facility, as well as enhanced operating practices.
Financial SystemsThe PeopleSoft/Oracle Student Services System began its rolling implementation in fi scal year 2007, and all modules for student services are expected to be implemented by fall 2008. The application, when fully implemented, will
provide the structure to manage student services as a whole, including prospect, applicant, admissions, fi nancial aid, and student fi nancials. In addition, the system will provide data delivery through a student data warehouse.
Cornell continues to be a key partner in the Kuali Financial System (KFS) Open Source Project. KFS will replace Cornell’s legacy mainframe fi nancial system with an up-to-date application. Cornell’s Ithaca and Medical College campuses became partners in a parallel effort, the Kuali Research Administration (KRA) Project, to begin planning for the implementation of a research administration system to support the ever-increasing interdisciplinary research between campuses.
FINANCIAL YEAR IN REVIEW
2007 was an extraordinary year; the balance sheet refl ects a healthy net asset growth, enhancing the University’s strong fi nancial position. The University’s net assets increased by $1.3 billion or approximately 19 percent, to over $7.8 billion, with an increase in every net asset restriction classifi cation: unrestricted-22 percent; temporarily re-stricted-20 percent and permanently restricted-11 percent. These overall results derive from operating and nonoper-ating activities, with the most signifi cant growth in non-operating income.
Operating Income:The University earned $31.4 million from its net operating activities for fi scal year ended June 30, 2007, demonstrating continued fi nancial strength from mission-related activities. However, the 2007 income from operations is 56 percent lower than last year’s operating income of $72 million. This decrease in net operating income from prior year is easily identifi ed: operating expenses increased by 4.5 percent and operating income increased by only 2.7 percent. A full understanding of this decrease requires review of specifi c components of both operating income and expense.
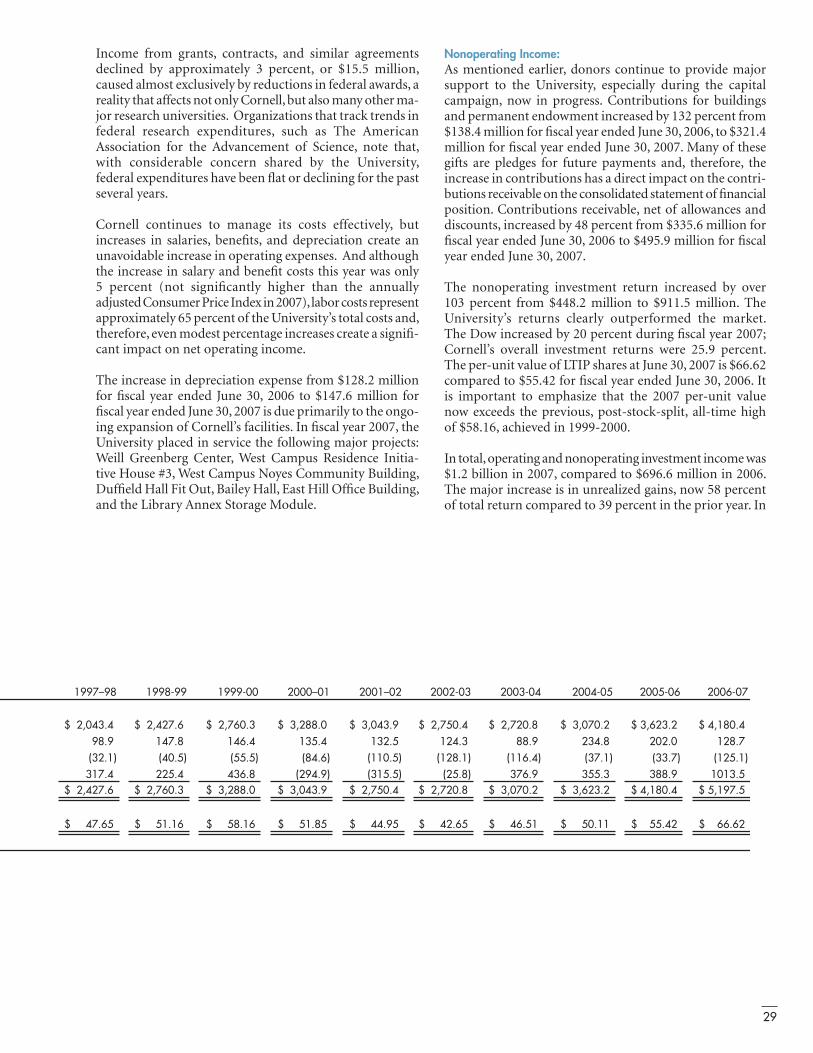
LONG-TERM INVESTMENT POOL
Source and applications (in millions)Beginning market value Gifts and other additions
WithdrawalsRealized and unrealized gains (losses)Ending market value
Unit value at year end (in dollars) *
* Unit values adjusted for 2 for 1 unit split on July 1, 1998
“In fiscal year 2007, Cornell began a comprehensive fi nancial project to envision and plan the University’s economic profi le for the next
ten years.”
29
Income from grants, contracts, and similar agreements declined by approximately 3 percent, or $15.5 million, caused almost exclusively by reductions in federal awards, a reality that affects not only Cornell, but also many other ma-jor research universities. Organizations that track trends in federal research expenditures, such as The American Association for the Advancement of Science, note that, with considerable concern shared by the University, federal expenditures have been fl at or declining for the past several years.
Cornell continues to manage its costs effectively, but increases in salaries, benefi ts, and depreciation create an unavoidable increase in operating expenses. And although the increase in salary and benefi t costs this year was only 5 percent (not signifi cantly higher than the annually adjusted Consumer Price Index in 2007), labor costs represent approximately 65 percent of the University’s total costs and, therefore, even modest percentage increases create a signifi -cant impact on net operating income.
The increase in depreciation expense from $128.2 million for fi scal year ended June 30, 2006 to $147.6 million for fi scal year ended June 30, 2007 is due primarily to the ongo-ing expansion of Cornell’s facilities. In fi scal year 2007, the University placed in service the following major projects: Weill Greenberg Center, West Campus Residence Initia-tive House #3, West Campus Noyes Community Building, Duffi eld Hall Fit Out, Bailey Hall, East Hill Offi ce Building, and the Library Annex Storage Module.
Nonoperating Income:As mentioned earlier, donors continue to provide major support to the University, especially during the capital campaign, now in progress. Contributions for buildings and permanent endowment increased by 132 percent from $138.4 million for fi scal year ended June 30, 2006, to $321.4 million for fi scal year ended June 30, 2007. Many of these gifts are pledges for future payments and, therefore, the increase in contributions has a direct impact on the contri-butions receivable on the consolidated statement of fi nancial position. Contributions receivable, net of allowances and discounts, increased by 48 percent from $335.6 million for fi scal year ended June 30, 2006 to $495.9 million for fi scal year ended June 30, 2007. The nonoperating investment return increased by over 103 percent from $448.2 million to $911.5 million. The University’s returns clearly outperformed the market. The Dow increased by 20 percent during fi scal year 2007; Cornell’s overall investment returns were 25.9 percent. The per-unit value of LTIP shares at June 30, 2007 is $66.62 compared to $55.42 for fi scal year ended June 30, 2006. It is important to emphasize that the 2007 per-unit value now exceeds the previous, post-stock-split, all-time high of $58.16, achieved in 1999-2000.
In total, operating and nonoperating investment income was $1.2 billion in 2007, compared to $696.6 million in 2006. The major increase is in unrealized gains, now 58 percent of total return compared to 39 percent in the prior year. In
1997–98 1998-99 1999-00 2000–01 2001–02 2002-03 2003-04 2004-05 2005-06 2006-07
$ 4.340,2 $ 6.724,2 $ 3.067,2 $ 0.882,3 $ 9.340,3 $ 4.057,2 $ 8.027,2 $ 2.070,3 3,623.2$ $ 4.081,498.9 147.8 146.4 135.4 132.5 124.3 88.9 234.8 202.0 128.7
(32.1) (40.5) (55.5) (84.6) (110.5) (128.1) (116.4) (37.1) (33.7) (125.1)317.4 225.4 436.8 (294.9) (315.5) (25.8) 376.9 355.3 388.9 1013.5
$ 6.724,2 $ 3.067,2 $ 0.882,3 $ 9.340,3 $ 4.057,2 $ 8.027,2 $ 2.070,3 $ 2.326,3 4,180.4$ $ 5.791,5
$ 56.74 $ 61.15 $ 61.85 $ 58.15 $ 59.44 $ 56.24 $ 15.64 $ 11.05 $ 24.55 $ 26.66

30
fact, unrealized gains alone of $702.3 million, at fi scal year ended June 30, 2007, exceed the total investment income for fi scal year ended June 30, 2006, which was $696.6 million.
Nonoperating contributions and investment returns are the primary reasons for the extraordinary performance in 2007. The markets often remind us, as they did shortly after fi scal year-end, that they can be volatile. As our Subsequent Event note 12 discloses, Cornell incurred a loss of approximately $20 million on a fund that liquidated in July due to sudden changes in market conditions.
Financial Position:Many of the signifi cant changes in the University’s consoli-dated statement of fi nancial position are directly related to operating and non operating income. Specifi cally, for fi scal year ended June 30, 2007, there is a 48 percent in-crease in contributions receivable, a 21 percent increase in investments, and a 13 percent increase in land, buildings, and equipment.
The decrease in deferred revenues and other liabilities of 22 percent, however, is not related to operating or nonop-erating income, but primarily to a $23.9 million reduction in the line of credit. This reduction does not signify a shift in strategy about borrowing. The University, because of favorable interest rates, used commercial paper to meet cash fl ow needs as well as short-term funding for projects. The
Revenues
0%
10%
20%
30%
40%
Net
Tui
tion
Gra
nts
and
Con
tract
s
Gift
s
Inve
stm
ent
Ret
urns
Phy
icia
ns'
Org
aniz
atio
n
Oth
er
20072006
14 percent increase in bonds and notes payable refl ects the planned, increased use of commercial paper.
Deferred benefi ts increased 44 percent, based primarily on the SFAS 158 requirement to record an additional liability of $77.1 million for the unfunded, postretirement benefi ts. There were also increases in the annual costs for postretire-ment benefi ts, vacation accruals, and other benefi ts that had an impact on the increase in deferred benefi ts ($260.8 mil-lion at fi scal year ended June 30, 2006 compared to $374.6 million at fi scal year ended June 30, 2007).
Summary: To support the University’s key strategic priorities for aca-demic excellence, access to and quality of undergraduate education, global outreach, etc., Cornell continues to align resources with priorities.
Cornell’s fi nancial performance in fi scal year ended June 30, 2007 has enhanced the resource base to support strategic initiatives. Net assets increased by 19 percent from $6.6 billion to $7.8 billion during this period, with the greatest percentage increase in unrestricted net assets of approxi-mately 22 percent, from $4.4 billion to $5.3 billion.
To properly align resources and priorities, it is useful to identify resources likely to be under the control of management – generally defi ned as operating income and expenses. Nonoperating income is affected by external factors less likely to be in management’s control. The new fi nancial statement format, by reporting an operating measure, seeks, among other things, to provide better information useful in planning for an effective alignment of resources to priorities.
Stephen T. GoldingExecutive Vice President forFinance and Administration
Joanne M. DeStefanoVice President for Financial Affairs and University Controller
Source of Investment Return
0%
20%
40%
60%
Inte
rest
and
Div
iden
ds
Rea
lized
Gai
n
Unr
ealiz
edG
ain
20072006
31
MANAGEMENT RESPONSIBILITY FOR CONSOLIDATED FINANCIAL STATEMENTS
The management of Cornell University is responsible for the preparation, integrity and fair presentation of the consolidated fi nancial statements that have been prepared in conformity with generally accepted accounting principles and, as such, include amounts based on judgments and estimates by management. The University also prepared the other information in this annual report and is responsible for its accuracy and consistency with these consolidated fi nancial statements.
The consolidated fi nancial statements have been audited by the independent accounting fi rm KPMG LLP, which was given unrestricted access to all fi nancial records and related data, including minutes of all meetings of trustees. The University believes that all representations made to KPMG LLP during its audit were valid and appropri-ate. The independent auditors’ report expresses an independent opinion on the fairness of presentation of these consolidated fi nancial statements.
The University maintains a system of internal controls over fi nancial reporting that is designed to provide reasonable assurance to the University’s management and Board of Trustees regarding the preparation of reliable published fi nancial statements. Such controls are maintained by the establishment and communication of accounting and fi nancial policies and procedures, by the selection and training of qualifi ed personnel, and by an internal audit program designed to identify internal control weaknesses in order to permit management to take appropriate, corrective action on a timely basis.
There are inherent limitations in the effectiveness of any system of internal control, including the possibility of human error and the circumvention of controls. Accordingly, even an effective internal control system can provide only reasonable assurance with respect to fi nancial statement preparation. Furthermore, the effectiveness of the internal control system can change with circumstances.
The Trustees of Cornell University through its Audit Committee, comprised of trustees not employed by the University, are responsible for engaging independent accountants and meeting with management, internal auditors, and the independent accountants to ensure that all are carrying out their responsibilities. Both internal auditors and the independent accountants have full and free access to the Audit Committee.
David J. Skorton Stephen T. Golding Joanne M. DeStefanoPresident Executive Vice President for Vice President for FinancialCornell University Finance and Administration Affairs and University Controller
32
The Board of Trusteesof Cornell University:
We have audited the accompanying consolidated statement of fi nancial position of Cornell University as of June 30, 2007, and the related consolidated statements of activities and cash fl ows for the year then ended. These consolidated fi nancial statements are the responsibility of the University’s manage-ment. Our responsibility is to express an opinion on these consolidated fi nancial statements based on our audit. The prior year summarized comparative information has been derived from the University’s 2006 consolidated fi nancial statements and, in our report dated September 28, 2006, we expressed an unqualifi ed opinion on those consolidated fi nancial statements.
We conducted our audit in accordance with auditing standards generally accepted in the United States of America. Those standards require that we plan and perform the audit to obtain reasonable assurance about whether the consolidated fi nancial statements are free of material misstatement. An audit includes consideration of internal control over fi nancial reporting as a basis for designing audit procedures that are appropriate in the circumstances, but not for the purpose of expressing an opinion on the effectiveness of the University’s internal control over fi nancial reporting. Accordingly, we express no such opinion. An audit also includes examining, on a test basis, evidence supporting the amounts and disclosures in the consolidated fi nancial statements, assessing the accounting prin-ciples used and signifi cant estimates made by management, as well as evaluating the overall fi nancial statement presentation. We believe that our audit provides a reasonable basis for our opinion.
In our opinion, the consolidated fi nancial statements referred to above present fairly, in all material respects, the fi nancial position of Cornell University as of June 30, 2007, and the changes in its net assets and its cash fl ows for the year then ended, in conformity with U.S. generally accepted accounting principles.
As discussed in notes 1(O) and 5(C) to the consolidated fi nancial statements, in 2007 the University adopted the provisions of Financial Accounting Standards Board Statement No. 158, Employers’ Accounting for Defi ned Benefi t Pension and Other Postretirement Benefi t Plans.
Albany, New YorkSeptember 20, 2007
FINANCIAL
STATEMENTS
Independent Auditors’ Report
CONSOLIDATED

33
CONSOLIDATED STATEMENT OF FINANCIAL POSITION AS OF JUNE 30, 2007 (in thousands)(WITH COMPARATIVE INFORMATION AS OF JUNE 30, 2006)
2007 2006Assets
1 Cash and cash equivalents 27,569$ 23,089$ 2 Collateral for securities loaned 346,804 232,4553 Accounts receivable, net (note 2-A) 247,965 209,1254 Contributions receivable, net (note 2-B) 495,910 335,6255 Inventories and prepaid expenses 75,176 62,7276 Student loans receivable, net (note 2-C) 64,931 63,7077 Investments (note 3) 6,369,225 5,260,4498 Land, buildings, and equipment, net (note 4) 2,348,223 2,085,0769 Funds held in trust by others 103,550 111,752
10 Total assets 10,079,353$ 8,384,005$
Liabilities11 Accounts payable and accrued expenses 245,374$ 208,066$ 12 Payable under securities loan agreements 346,804 232,45513 Deferred revenue and other liabilities 120,210 154,41714 Obligations under split interest agreements 125,131 103,58515 Deferred benefits (note 5) 374,557 260,80216 Funds held in trust for others (note 6) 184,830 93,40417 Bonds and notes payable (note 7) 800,107 702,06418 Government advances for student loans 43,875 43,85719 Total liabilities 2,240,888 1,798,650
Net assets (note 10)20 Unrestricted 5,303,889 4,351,56121 Temporarily restricted 777,922 646,19022 Permanently restricted 1,756,654 1,587,60423 Total net assets 7,838,465 6,585,35524 Total liabilities and net assets 10,079,353$ 8,384,005$
The accompanying notes are an integral part of the consolidated financial statements.

34
CONSOLIDATED STATEMENT OF ACTIVITIES FOR THE YEAR ENDED JUNE 30, 2007 (in thousands) (WITH SUMMARIZED INFORMATION FOR THE YEAR ENDED JUNE 30, 2006)
TemporarilyUnrestricted Restricted
Operating revenues1 Tuition and fees 633,387$ -$2 Scholarship allowance (189,225) -3 Net tuition and fees 444,162 -4 State and federal appropriations 173,360 -5 Grants, contracts and similar agreements6 Direct 381,003 -7 Indirect cost recoveries 119,837 -8 Contributions 91,188 127,9489 Investment return, distributed 216,355 74,300
10 Medical Physicians' Organization 438,355 -11 Auxiliary enterprises 134,377 -12 Educational activities and other sales and services 304,861 -13 Net assets released from restrictions 130,116 (130,116)14 Total operating revenues 2,433,614 72,132
Operating expenses (note 9)15 Compensation and benefits 1,620,037 -16 Purchased services 114,785 -17 Supplies and general 440,481 -18 Utilities, rents and taxes 120,853 -19 Interest expense 30,509 -20 Depreciation 147,639 -21 Total operating expenses 2,474,304 -
22 Change in net assets from operating activities (40,690) 72,132
Nonoperating revenues and (expenses)23 State and federal appropriations for capital acquisitions 25,220 -24 Grants, contracts and similar agreements for capital acquisitions 6,805 -25 Contributions for capital acquisitions, trusts and endowments 19,137 149,03326 Investment return, net of amount distributed 911,254 3,16227 Change in value of split interest agreements 2,959 3,52828 Other 21,754 -29 Net asset released for capital acquisitions and reclassifications 83,022 (96,123)
30 Change in net assets from nonoperating activities 1,070,151 59,600
31 Change in net assets before cumulative effect and effect of adoption of FASB 1,029,461 131,732Statement No.158
32 Cumulative effect of change in accounting principle - -33 Effect of adoption of FASB Statement No.158 (notes 1-O, 5-C) (77,133) -34 Change in net assets 952,328 131,73235 Net assets, beginning of the year 4,351,561 646,19036 Net assets, end of the year 5,303,889$ 777,922$
The accompanying notes are an integral part of the consolidated financial statements.

35
Permanently 2007 2006Restricted Total Total
-$ 633,387$ 593,194$ 1
- (189,225) (177,999) 2
- 444,162 415,195 3
- 173,360 162,839 4
5
- 381,003 394,082 6
- 119,837 122,273 7
- 219,136 271,170 8
- 290,655 248,388 9
- 438,355 388,871 10
- 134,377 125,975 11
- 304,861 310,999 12
- - - 13
- 2,505,746 2,439,792 14
- 1,620,037 1,541,207 15
- 114,785 116,210 16
- 440,481 431,979 17
- 120,853 121,544 18
- 30,509 28,584 19
- 147,639 128,246 20
- 2,474,304 2,367,770 21
- 31,442 72,022 22
- 25,220 25,547 23
- 6,805 15,744 24
153,244 321,414 138,392 25
(2,955) 911,461 448,164 26
5,660 12,147 16,639 27
- 21,754 15,573 28
13,101 - - 29
169,050 1,298,801 660,059 30
169,050 1,330,243 732,081 31
- - (17,192) 32
- (77,133) - 33
169,050 1,253,110 714,889 34
1,587,604 6,585,355 5,870,466 35
1,756,654$ 7,838,465$ 6,585,355$ 36
36
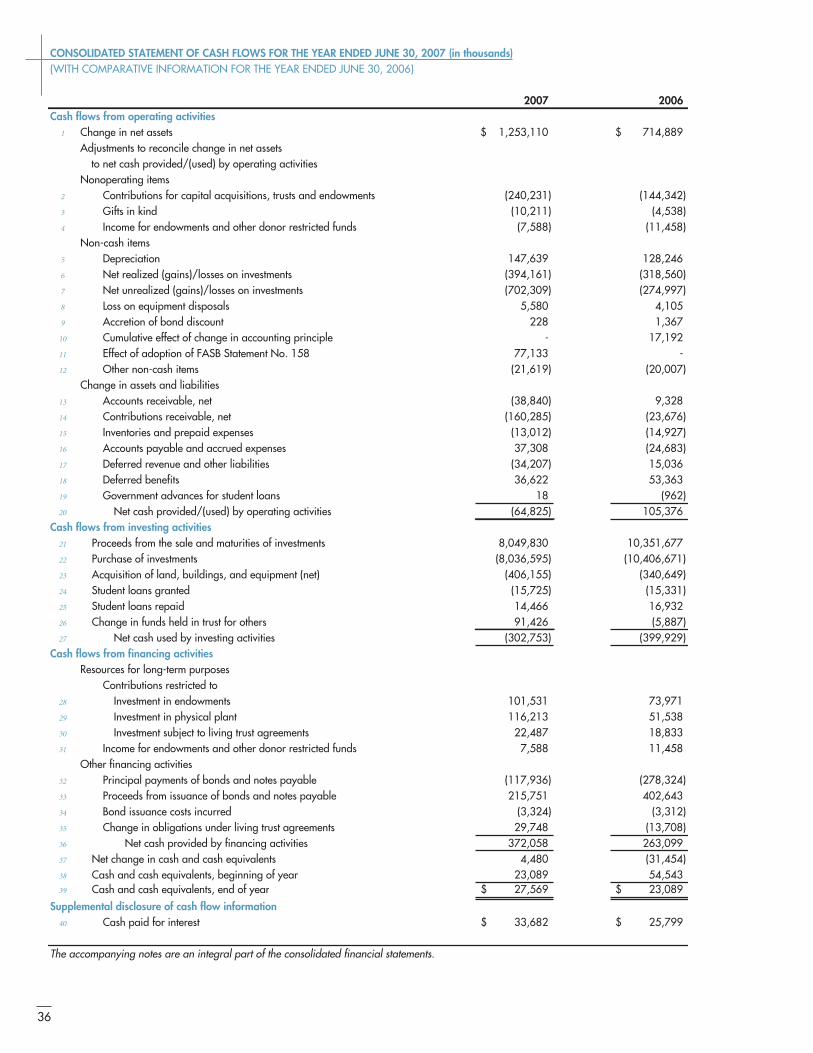
CONSOLIDATED STATEMENT OF CASH FLOWS FOR THE YEAR ENDED JUNE 30, 2007 (in thousands)(WITH COMPARATIVE INFORMATION FOR THE YEAR ENDED JUNE 30, 2006)
2007 2006Cash flows from operating activities
1 Change in net assets 1,253,110$ 714,889$ Adjustments to reconcile change in net assets
to net cash provided/(used) by operating activitiesNonoperating items
2 Contributions for capital acquisitions, trusts and endowments (240,231) (144,342) 3 Gifts in kind (10,211) (4,538) 4 Income for endowments and other donor restricted funds (7,588) (11,458)
Non-cash items5 Depreciation 147,639 128,2466 Net realized (gains)/losses on investments (394,161) (318,560) 7 Net unrealized (gains)/losses on investments (702,309) (274,997)8 Loss on equipment disposals 5,580 4,1059 Accretion of bond discount 228 1,367
10 Cumulative effect of change in accounting principle - 17,19211 Effect of adoption of FASB Statement No. 158 77,133 -12 Other non-cash items (21,619) (20,007)
Change in assets and liabilities13 Accounts receivable, net (38,840) 9,32814 Contributions receivable, net (160,285) (23,676)15 Inventories and prepaid expenses (13,012) (14,927)16 Accounts payable and accrued expenses 37,308 (24,683)17 Deferred revenue and other liabilities (34,207) 15,03618 Deferred benefits 36,622 53,36319 Government advances for student loans 18 (962)20 Net cash provided/(used) by operating activities (64,825) 105,376
Cash flows from investing activities21 Proceeds from the sale and maturities of investments 8,049,830 10,351,67722 Purchase of investments (8,036,595) (10,406,671)23 Acquisition of land, buildings, and equipment (net) (406,155) (340,649)24 Student loans granted (15,725) (15,331)25 Student loans repaid 14,466 16,93226 Change in funds held in trust for others 91,426 (5,887)27 Net cash used by investing activities (302,753) (399,929)
Cash flows from financing activities Resources for long-term purposes
Contributions restricted to28 Investment in endowments 101,531 73,97129 Investment in physical plant 116,213 51,53830 Investment subject to living trust agreements 22,487 18,83331 Income for endowments and other donor restricted funds 7,588 11,458
Other financing activities32 Principal payments of bonds and notes payable (117,936) (278,324)33 Proceeds from issuance of bonds and notes payable 215,751 402,64334 Bond issuance costs incurred (3,324) (3,312)35 Change in obligations under living trust agreements 29,748 (13,708)36 Net cash provided by financing activities 372,058 263,09937 Net change in cash and cash equivalents 4,480 (31,454)38 Cash and cash equivalents, beginning of year 23,089 54,54339 Cash and cash equivalents, end of year 27,569$ 23,089$
Supplemental disclosure of cash flow information40 Cash paid for interest 33,682$ 25,799$
The accompanying notes are an integral part of the consolidated financial statements.

37
NOTES TO THE
CONSOLIDATED
FINANCIAL
STATEMENTS
1. SIGNIFICANT ACCOUNTING POLICIES
A. Description of the OrganizationCornell University (the University) consists of three major organizational units: Endowed Ithaca, which includes the endowed colleges, the central university administration, and the enterprise and service operations for the Ithaca campus; Contract Colleges at Ithaca (colleges operated by the University on behalf of New York State); and the Joan and Sanford I. Weill Medical College and Graduate School of Medical Sciences (Medical College) in New York City. These three units are subject to the com-mon administrative authority and control of the Cornell University Board of Trustees, but generally operate as fi nancially discrete entities. The laws establishing the Contract Colleges at Ithaca prohibit other units of the University from using funds attributable to those colleges. Except as specifi cally required by law, the contract and endowed colleges at Ithaca are, to the extent practicable, governed by common management principles and policies determined at the private discretion of the University. In addition to the three major organizational units, the University’s subsidiaries and certain affi liated organizations are included in the consolidated fi nancial statements. All signifi cant intercompany transactions and balances are eliminated in the accompanying consolidated fi nancial statements.
B. Basis of PresentationThe accompanying consolidated fi nancial statements have been prepared on an accrual basis in accordance with U.S. generally accepted accounting principles and presented in accordance with the AICPA Audit and Accounting Guide for Not-for-Profi t Organizations (the Guide). The standards for general purpose fi nancial statements of not-for-profi t organizations require a statement of fi nancial position, a statement of activities, and a statement of cash fl ows, and that they be displayed based on the concept of net assets. The Guide requires presentation of revenues, expenses, gains, losses, and net assets in three categories based on the presence or absence of donor-imposed restrictions: permanently restricted, temporarily restricted, and unrestricted.
Permanently restricted net assets include the historical dollar amount of gifts, pledges, trusts, and gains explicitly required by donors to be permanently retained. Pledges and trusts are reported at their estimated fair value on the date of donation.
Temporarily restricted net assets include gifts, pledges, trusts, income, and gains that can be expended, but for which the donor restrictions have not yet been met. Such restrictions include purpose restrictions where donors have specifi ed the purpose for which the net assets are to be spent, or time restrictions imposed by donors or implied by the nature of the gift (e.g., future capital projects, pledges to be paid in the future, life income funds).
Unrestricted net assets are the remaining net assets of the University, including appreciation on true endowments where the donor restrictions are deemed to have been met.
Expiration of donor restrictions is reported in the consolidated statement of activities as net assets released from restrictions. The expiration is recorded as a reclassifi cation from temporarily restricted net assets to unrestricted net assets.

38
NOTES TO CONSOLIDATED FINANCIAL STATEMENTS
(dollars in thousands)
The consolidated statement of activities presents the changes in net assets of the University from both operating and nonoperating activities. Operating activities are primarily revenues and expenses that relate to carrying out the University’s educational, research, and public service missions. Operating revenues include investment income and appreciation utilized to fund current operations, the largest portion of which is the distribution of investment payout as determined by the University’s spending policy. Nonoperating activities primarily consist of the excess of investment earnings over amounts utilized in operating activities, contributions and net assets released from restrictions for endowment and facilities, and other activities not in direct support of the University’s annual operations.
All numbers in the consolidated fi nancial statements and accompanying notes are presented, unless otherwise indicated, in thousands.
C. Cash and Cash EquivalentsThe University considers all instruments that bear original maturity dates of ninety days or less to be cash equivalents. The carrying amount of cash equivalents approximates fair value because of the short maturity.
D. Collateral for Securities LoanedThe University has an agreement with its investment custodian to lend university securities to approved brokers in exchange for a fee. The agreement specifi es that, to limit the University’s risk, the securities on loan must be collateralized by cash deposits. Cash collateral is reported as both an asset and liability of the University. The collateral is invested in short-term securities, and the earnings are recorded as additional income to the investment pools.
E. ContributionsContributions, including unconditional promises to give (pledges), are recognized as revenues in the appropriate category of net assets in the period received. Pledges are recorded at the present value of estimated future cash fl ows, based on an appropriate discount rate at the time of the gift. Amortization of the discount in subsequent years is included in contribution revenue. Contributions of assets other than cash are recorded at their estimated fair value at the date of the gift. Contributions for capital projects, endowments, and similar funds are reported as nonoperating revenues. Conditional promises to donate to the University are not recognized until the conditions are substantially met.
F. InvestmentsThe University’s investments are recorded in the consolidated fi nancial statements at fair value. The value of publicly traded securities is based upon quoted market prices and exchange rates, if applicable. Nonmarketable securities are recorded at the estimated fair value provided by external investment managers. These investments are generally less liquid than other investments and the values reported by the general partner or investment manager may differ from the values that would have been reported had a ready market for these securities existed. The University believes the carrying amount of these fi nancial instruments is a reasonable estimate of fair value.
Investment income is recorded on an accrual basis, and purchases and sales of investment securities are refl ected on a trade-date basis. Realized gains and losses are calculated using average cost for securities sold.
G. Derivative Instruments and Hedging ActivitiesThe University holds derivative instruments for investment, and records the fair value within the applicable portfolio. The change in the fair value of a derivative instrument held for investment is included in nonoperating investment return in the consolidated statement of activities.
In addition, the University holds derivatives to manage its current and/or future long-term debt. These instruments are recorded at fair value as either prepaid expenses or other liabilities on the consolidated statement of fi nancial position, and the change in fair value is recorded in other nonoperating revenues and expenses on the consolidated statement of activities.
H. Land, Buildings, and EquipmentPhysical plant and equipment are stated at cost on the date of acquisition or at fair value on the date of donation, net of accumulated depreciation. Depreciation is computed using the straight-line method over the estimated useful lives of the assets and is refl ected as an operating expense. Expenditures associated with the construction of new facilities are recorded as construction in progress until the projects are completed.
39
NOTES TO CONSOLIDATED FINANCIAL STATEMENTS
(dollars in thousands)
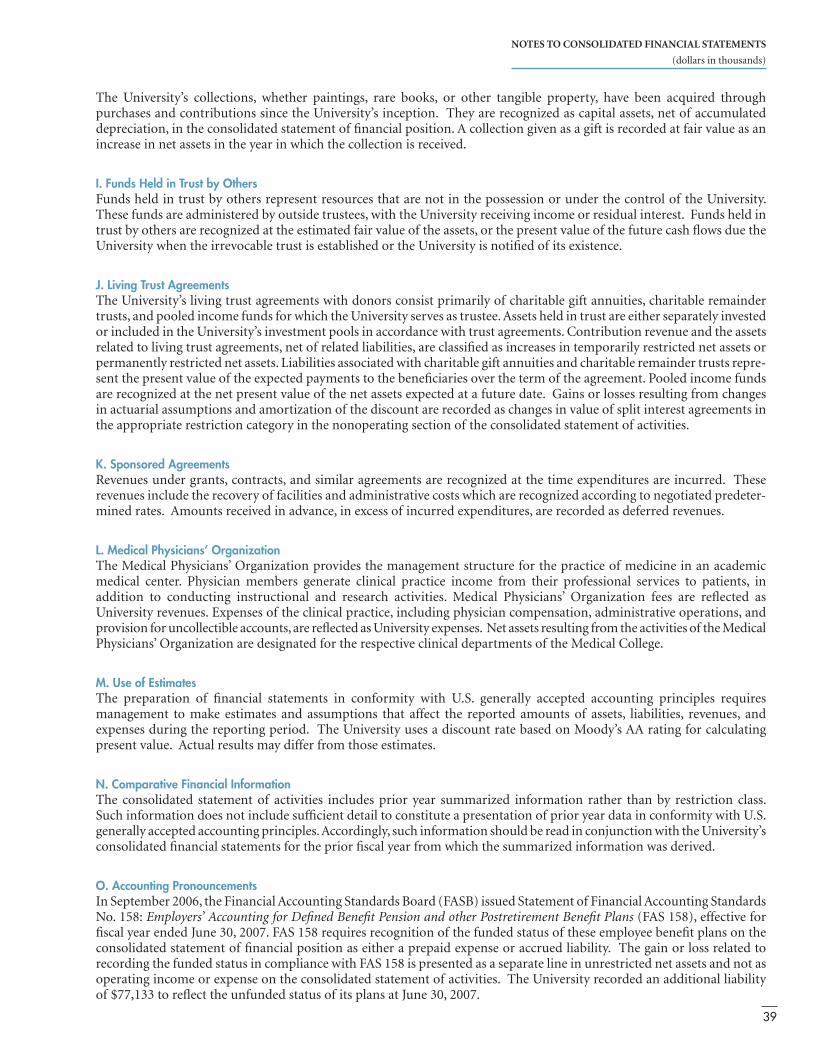
The University’s collections, whether paintings, rare books, or other tangible property, have been acquired through purchases and contributions since the University’s inception. They are recognized as capital assets, net of accumulated depreciation, in the consolidated statement of fi nancial position. A collection given as a gift is recorded at fair value as an increase in net assets in the year in which the collection is received.
I. Funds Held in Trust by OthersFunds held in trust by others represent resources that are not in the possession or under the control of the University. These funds are administered by outside trustees, with the University receiving income or residual interest. Funds held in trust by others are recognized at the estimated fair value of the assets, or the present value of the future cash fl ows due the University when the irrevocable trust is established or the University is notifi ed of its existence.
J. Living Trust AgreementsThe University’s living trust agreements with donors consist primarily of charitable gift annuities, charitable remainder trusts, and pooled income funds for which the University serves as trustee. Assets held in trust are either separately invested or included in the University’s investment pools in accordance with trust agreements. Contribution revenue and the assets related to living trust agreements, net of related liabilities, are classifi ed as increases in temporarily restricted net assets or permanently restricted net assets. Liabilities associated with charitable gift annuities and charitable remainder trusts repre-sent the present value of the expected payments to the benefi ciaries over the term of the agreement. Pooled income funds are recognized at the net present value of the net assets expected at a future date. Gains or losses resulting from changes in actuarial assumptions and amortization of the discount are recorded as changes in value of split interest agreements in the appropriate restriction category in the nonoperating section of the consolidated statement of activities.
K. Sponsored AgreementsRevenues under grants, contracts, and similar agreements are recognized at the time expenditures are incurred. These revenues include the recovery of facilities and administrative costs which are recognized according to negotiated predeter-mined rates. Amounts received in advance, in excess of incurred expenditures, are recorded as deferred revenues.
L. Medical Physicians’ OrganizationThe Medical Physicians’ Organization provides the management structure for the practice of medicine in an academic medical center. Physician members generate clinical practice income from their professional services to patients, in addition to conducting instructional and research activities. Medical Physicians’ Organization fees are refl ected as University revenues. Expenses of the clinical practice, including physician compensation, administrative operations, and provision for uncollectible accounts, are refl ected as University expenses. Net assets resulting from the activities of the Medical Physicians’ Organization are designated for the respective clinical departments of the Medical College.
M. Use of EstimatesThe preparation of fi nancial statements in conformity with U.S. generally accepted accounting principles requires management to make estimates and assumptions that affect the reported amounts of assets, liabilities, revenues, and expenses during the reporting period. The University uses a discount rate based on Moody’s AA rating for calculating present value. Actual results may differ from those estimates.
N. Comparative Financial Information The consolidated statement of activities includes prior year summarized information rather than by restriction class. Such information does not include suffi cient detail to constitute a presentation of prior year data in conformity with U.S. generally accepted accounting principles. Accordingly, such information should be read in conjunction with the University’s consolidated fi nancial statements for the prior fi scal year from which the summarized information was derived.
O. Accounting PronouncementsIn September 2006, the Financial Accounting Standards Board (FASB) issued Statement of Financial Accounting Standards No. 158: Employers’ Accounting for Defi ned Benefi t Pension and other Postretirement Benefi t Plans (FAS 158), effective for fi scal year ended June 30, 2007. FAS 158 requires recognition of the funded status of these employee benefi t plans on the consolidated statement of fi nancial position as either a prepaid expense or accrued liability. The gain or loss related to recording the funded status in compliance with FAS 158 is presented as a separate line in unrestricted net assets and not as operating income or expense on the consolidated statement of activities. The University recorded an additional liability of $77,133 to refl ect the unfunded status of its plans at June 30, 2007.

40
NOTES TO CONSOLIDATED FINANCIAL STATEMENTS
(dollars in thousands)
In the year ended June 30, 2006, the University, following guidelines issued in FASB Interpretation No. 47: Accounting for Conditional Asset Retirement Obligations (FIN 47), recorded a reduction of unrestricted net assets of $17,192, primarily for the estimated costs of future asbestos removal. This adjustment is refl ected as a cumulative effect of change in accounting principle in the summarized statement of activities for the year ended June 30, 2006.
P. Reclassifi cations Certain prior year amounts have been reclassifi ed to conform to the current year presentation.
Q. Income TaxesThe University is a not-for-profi t organization as described in Section 501(c)(3) of the Internal Revenue Code and is exempt from income taxes on related income pursuant to the appropriate sections of the Internal Revenue Code.
2. RECEIVABLES
A. Accounts ReceivableAccounts receivable from the following sources were outstanding as of June 30:
The patient accounts receivable for medical services were comprised of the following at June 30, 2007 and 2006, respectively: commercial third parties 54 percent and 59 percent; federal/state government 14 percent and 12 percent; and patients 32 percent and 29 percent. The other accounts receivable include payments expected from the Dormitory Authority of the State of New York (DASNY) for reimbursement of construction, the New York-Presbyterian Hospital for services provided by the Medical College, sponsoring agencies for grants and contracts, and matured bequests.
B. Contributions ReceivableUnconditional promises to give, or pledges, are recorded in the consolidated fi nancial statements at present value using discount rates ranging from 5 percent to 7 percent. Contributions are expected to be realized as follows:
2007 2006356,741raey eno naht sseL 166,161 $ $
282,722948,342sraey evif dna eno neewteB 271,06967,844sraey evif naht eroM
Gross contributions receivable 840,271 511,944 $ $ )628,59()062,813(tnuocsid dezitromanu :sseL
Less: allowance for uncollectible amounts (26,101) (17,664)Net contributions receivable 495,910 526,533 $ $
SUMMARY OF CONTRIBUTIONS RECEIVABLE
2007 2006699,94stcartnoc dna stnarG 907,34 $ $
Patients (net of contractual allowances) 75,512 66,278 174,4667,5stnuocca tnedutS 868,901641,331rehtO
024,462latotbuS 623,422 $ $ Less: allowance for doubtful accounts (16,455) (15,201)
569,742elbaviecer stnuocca teN 521,902 $ $
SUMMARY OF ACCOUNTS RECEIVABLE

41
NOTES TO CONSOLIDATED FINANCIAL STATEMENTS
(dollars in thousands)
Contributions receivable as of June 30 are intended for the following purposes:
At June 30, 2007 and 2006, conditional promises not refl ected in the consolidated fi nancial statements, which consist primarily of bequest intentions, were approximately $160,273 and $128,502, respectively.
C. Student Loans ReceivableThe University participates in various federal revolving loan programs, in addition to administering institutional loan programs. Loans receivable from students as of June 30 are as follows:
The allowance for doubtful accounts is for loans in both repayment status and those not yet in repayment status because the borrowers are still in school or in the grace period following graduation.
Due to the nature and terms of student loans, which are subject to signifi cant restrictions, it is not feasible to determine the fair value of such loans.
3. INVESTMENTS
A. General InformationThe University’s investment holdings as of June 30 are summarized in the following table:
The University’s investments are overseen by the Investment Committee of the Board of Trustees. The University’s investment strategy incorporates a diversifi ed asset allocation approach and maintains, within defi ned limits, exposure to the movements of the world equity, fi xed income, commodities, real estate, and private equity markets. Based on guidelines established by the Investment Committee, the University’s Investment Offi ce directs the investment of endowment and trust assets, certain working capital, and temporarily invested expendable funds.
2007 2006522,84snaol gnivlover laredeF 264,84 $ $
260,52894,62snaol lanoitutitsnI Gross student loans receivable 74,723 425,37 $ $
Less: allowance for doubtful accounts (9,792) (9,817)139,46elbaviecer snaol tneduts teN 707,36 $ $
SUMMARY OF STUDENT LOANS RECEIVABLE
EXPECTED PURPOSE OF CONTRIBUTIONS RECEIVABLE2007 2006
Support of University operations 239,604$ 231,067$ Capital purposes 117,383 40,596 Endowments and similar funds 138,923 63,962
Net contributions receivable 495,910$ 335,625$
INVESTMENTS AT FAIR VALUE2007 2006
Cash and cash equivalents 137,757$ 181,968$ Domestic equities 923,789 929,441Foreign equities 1,097,843 896,782Absolute return 519,094 463,693Hedged equities 1,299,482 980,944Fixed income 728,462 679,207Private equities 738,445 545,693Real assets 892,774 551,556Other 31,579 31,165
Total 6,369,225$ 5,260,449$

42
NOTES TO CONSOLIDATED FINANCIAL STATEMENTS
(dollars in thousands)
Under the terms of certain limited partnership agreements, the University is obligated to make additional capital contributions up to contractual levels. At June 30, 2007 and 2006, the University had commitments of $1,066,802 and $1,083,357, respectively, for which capital calls had not been exercised. Such commitments generally have fi xed expiration dates or other termination clauses. The University maintains suffi cient liquidity in its investment portfolio to cover such calls.
The University maintains a number of investment pools or categories for specifi ed purposes, the most signifi cant of which are the Long-Term Investment Pool (LTIP), described below, and the Pooled Balances Investment Fund (PBIF), established to maximize total return derived from the investment of intermediate-term cash balances. The fair values as of June 30 were as follows:
Additional information about the University’s investment return for the years ended June 30 is presented in the following table:
B. Long-Term Investment Pool The LTIP is a mutual fund-like vehicle used for investing the University’s true endowment funds, funds functioning as endowment, and other funds that are not expected to be expended for at least three years. The objective is to achieve a total return, net of expenses, of at least 5 percent in excess of infl ation, as measured by a rolling 5-year average of the Consumer Price Index.
The University employs a unit method of accounting for the LTIP. Each participating fund enters into and withdraws from the pooled investment account based on monthly unit market values. At June 30, 2007 and 2006, the fair values per unit were $66.62 and $55.42, respectively. The total return on the University’s long-term investments, of which the LTIP is the major component, was 25.9 percent for the year ended June 30, 2007. The changes in the fair value and cost of the LTIP and information about its participating units as of June 30, 2007 and 2006 are as follows:
INVESTMENTS POOLS/CATEGORIES AT FAIR VALUE2007 2006
Working capital 3,807$ 22,735$ Intermediate-term (PBIF) 609,353 540,290Long-term investment pool (LTIP) 5,197,503 4,180,389Separately invested portfolio 478,902 360,682Pooled life income funds 16,935 17,712Other 62,725 138,641
Total 6,369,225$ 5,260,449$
SUMMARY INFORMATION - LONG-TERM INVESTMENT POOLFair value Cost Appreciation Fair value Number
(in thousands) (in thousands) (in thousands) per unit of unitsEnd of year 5,197,503$ 3,800,321$ 1,397,182$ 66.62$ 78,016,232Beginning of year 4,180,389$ 3,426,160$ 754,229$ 55.42$ 75,425,544Unrealized net gain for year 642,953$ Realized net gain for year 370,533$
Net gain for year 1,013,486$
SUMMARY OF INVESTMENT RETURN2007 2006
Interest and dividends, net of investment fees 105,646$ 102,995$ Net realized gains 394,161 318,560Net unrealized gains 702,309 274,997
Total investment return 1,202,116$ 696,552$
Investment return, distributed 290,655$ 248,388$ Investment return, undistributed 911,461 448,164
Total investment return 1,202,116$ 696,552$
43
NOTES TO CONSOLIDATED FINANCIAL STATEMENTS
(dollars in thousands)
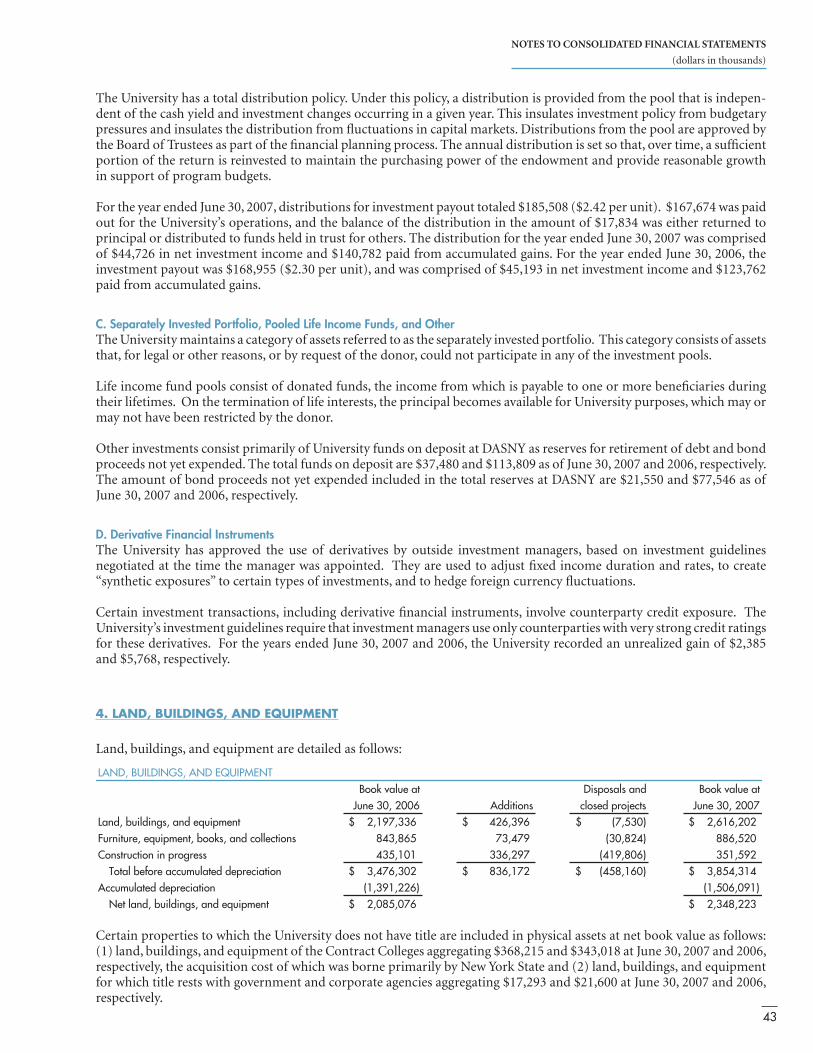
The University has a total distribution policy. Under this policy, a distribution is provided from the pool that is indepen-dent of the cash yield and investment changes occurring in a given year. This insulates investment policy from budgetary pressures and insulates the distribution from fl uctuations in capital markets. Distributions from the pool are approved by the Board of Trustees as part of the fi nancial planning process. The annual distribution is set so that, over time, a suffi cient portion of the return is reinvested to maintain the purchasing power of the endowment and provide reasonable growth in support of program budgets.
For the year ended June 30, 2007, distributions for investment payout totaled $185,508 ($2.42 per unit). $167,674 was paid out for the University’s operations, and the balance of the distribution in the amount of $17,834 was either returned to principal or distributed to funds held in trust for others. The distribution for the year ended June 30, 2007 was comprised of $44,726 in net investment income and $140,782 paid from accumulated gains. For the year ended June 30, 2006, the investment payout was $168,955 ($2.30 per unit), and was comprised of $45,193 in net investment income and $123,762 paid from accumulated gains.
C. Separately Invested Portfolio, Pooled Life Income Funds, and OtherThe University maintains a category of assets referred to as the separately invested portfolio. This category consists of assets that, for legal or other reasons, or by request of the donor, could not participate in any of the investment pools.
Life income fund pools consist of donated funds, the income from which is payable to one or more benefi ciaries during their lifetimes. On the termination of life interests, the principal becomes available for University purposes, which may or may not have been restricted by the donor.
Other investments consist primarily of University funds on deposit at DASNY as reserves for retirement of debt and bond proceeds not yet expended. The total funds on deposit are $37,480 and $113,809 as of June 30, 2007 and 2006, respectively. The amount of bond proceeds not yet expended included in the total reserves at DASNY are $21,550 and $77,546 as of June 30, 2007 and 2006, respectively.
D. Derivative Financial InstrumentsThe University has approved the use of derivatives by outside investment managers, based on investment guidelines negotiated at the time the manager was appointed. They are used to adjust fi xed income duration and rates, to create “synthetic exposures” to certain types of investments, and to hedge foreign currency fl uctuations.
Certain investment transactions, including derivative fi nancial instruments, involve counterparty credit exposure. The University’s investment guidelines require that investment managers use only counterparties with very strong credit ratings for these derivatives. For the years ended June 30, 2007 and 2006, the University recorded an unrealized gain of $2,385 and $5,768, respectively.
4. LAND, BUILDINGS, AND EQUIPMENT
Land, buildings, and equipment are detailed as follows:
Certain properties to which the University does not have title are included in physical assets at net book value as follows: (1) land, buildings, and equipment of the Contract Colleges aggregating $368,215 and $343,018 at June 30, 2007 and 2006, respectively, the acquisition cost of which was borne primarily by New York State and (2) land, buildings, and equipment for which title rests with government and corporate agencies aggregating $17,293 and $21,600 at June 30, 2007 and 2006, respectively.
LAND, BUILDINGS, AND EQUIPMENTta eulav kooBdna slasopsiDta eulav kooB
June 30, 2006 Additions closed projects June 30, 2007633,791,2tnempiuqe dna ,sgnidliub ,dnaL 693,624 $ )035,7( $ $ 2,616,202$
Furniture, equipment, books, and collections 843,865 974,37 )428,03( 025,688 101,534ssergorp ni noitcurtsnoC 792,633 )608,914( 295,153
Total before accumulated depreciation 3,476,302 271,638 $ )061,854( $ $ 3,854,314$ )622,193,1(noitaicerped detalumuccA )190,605,1(
Net land, buildings, and equipment 2,085,076 322,843,2 $ $

44
NOTES TO CONSOLIDATED FINANCIAL STATEMENTS
(dollars in thousands)
5. DEFERRED BENEFITS
A. General InformationAccrued employee benefi t obligations as of June 30 include:
Accrued postemployment benefi ts include workers’ compensation and medical continuation benefi ts for those on long-term disability. The University also provides various benefi ts to former or inactive employees after employment, but before retirement, that are recognized when they are earned.
B. Pension and Postretirement PlansThe University’s employee pension plan coverage is provided by two basic types of plan: one based on a predetermined level of funding (defi ned contribution), and the other based on a level of benefi t to be provided (defi ned benefi t).
The primary defi ned contribution plans for Endowed Ithaca and for exempt employees (those not subject to the overtime provisions of the Fair Labor Standards Act) at the Medical College are carried by the Teachers Insurance and Annuity Association, the College Retirement Equities Fund, the Vanguard Group (Medical College only), and Fidelity Investments (Endowed Ithaca only), all of which permit employee contributions. Total pension costs of the Endowed Ithaca and Medical College plans for the years ended June 30, 2007 and 2006 amounted to $72,771 and $68,812, respectively.
The Medical College maintains a defi ned benefi t plan for non-exempt employees. The defi ned benefi t plan for exempt em-ployees was frozen in 1976, and the accrued benefi ts were merged with the active non-exempt retirement plan in 1989.
In addition, certain non-exempt employees of Endowed Ithaca are covered by the Cornell University Retirement Plan for Non-Exempt Employees of the Endowed Colleges at Ithaca (NERP), a defi ned benefi t plan. In June 2006, the Board of Trustees voted to terminate this frozen plan effective December 31, 2006, with all surplus assets inuring to the plan participants. During the year ended June 30, 2007, lump sum payments were made to, or annuity contracts were purchased for, retirees and former employees with a vested benefi t in NERP. The settlements totaled $19,281. The University has re-ceived authorization from the Internal Revenue Service to proceed with settlements for all remaining plan participants. In accordance with Employee Retirement Income Security Act (ERISA) requirements for the defi ned benefi t plans, the University must fund annually with an independent trustee an actuarially determined amount that represents normal costs plus amortization of prior service costs over a forty-year period that began on July 1, 1976.
The University also provides health and life insurance benefi ts for eligible retired employees and their dependents. Although there is no legal obligation for future benefi ts, the cost of postretirement benefi ts must be accrued during the service lives of employees. The University elected the prospective transition approach and is amortizing the transition obligation over 20 years, through fi scal year 2012-13.
C. Obligations and Funded StatusFAS 158 requires employers to recognize the over-funded or under-funded status of defi ned benefi t pension and postretirement plans as assets or liabilities in its statement of fi nancial position. The incremental effect of adopting FAS 158 was an increase in deferred benefi ts liability of $77,133.
SUMMARY OF DEFERRED BENEFITS2007 2006
Postemployment benefits 21,765$ 23,481$ Pension and other postretirement benefits 212,066 119,451 Other deferred benefits 140,726 117,870
Total deferred benefits 374,557$ 260,802$
45
NOTES TO CONSOLIDATED FINANCIAL STATEMENTS
(dollars in thousands)
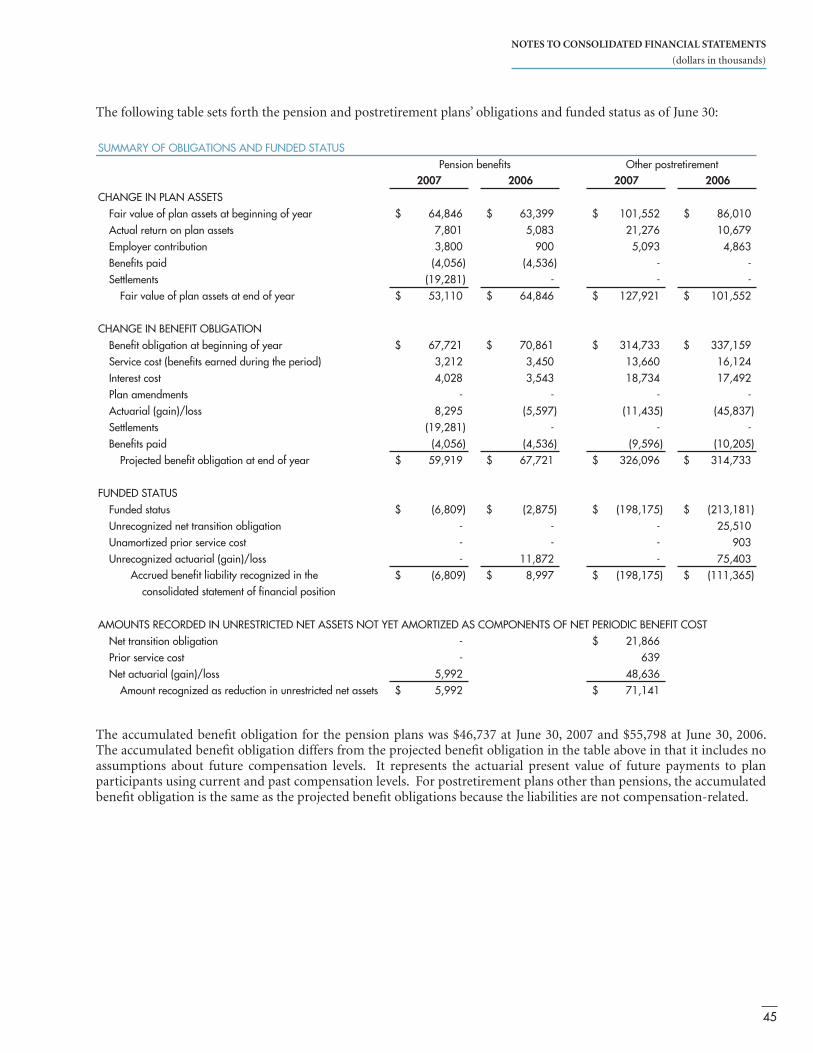
The following table sets forth the pension and postretirement plans’ obligations and funded status as of June 30:
The accumulated benefi t obligation for the pension plans was $46,737 at June 30, 2007 and $55,798 at June 30, 2006. The accumulated benefi t obligation differs from the projected benefi t obligation in the table above in that it includes no assumptions about future compensation levels. It represents the actuarial present value of future payments to plan participants using current and past compensation levels. For postretirement plans other than pensions, the accumulated benefi t obligation is the same as the projected benefi t obligations because the liabilities are not compensation-related.
SUMMARY OF OBLIGATIONS AND FUNDED STATUSPension benefits Other postretirement
2007 2006 2007 2006CHANGE IN PLAN ASSETS
Fair value of plan assets at beginning of year 64,846$ 63,399$ 101,552$ 86,010$ Actual return on plan assets 7,801 5,083 21,276 10,679Employer contribution 3,800 900 5,093 4,863Benefits paid (4,056) (4,536) - -Settlements (19,281) - - -
Fair value of plan assets at end of year 53,110$ 64,846$ 127,921$ 101,552$
CHANGE IN BENEFIT OBLIGATIONBenefit obligation at beginning of year 67,721$ 70,861$ 314,733$ 337,159$ Service cost (benefits earned during the period) 3,212 3,450 13,660 16,124Interest cost 4,028 3,543 18,734 17,492Plan amendments - - - -Actuarial (gain)/loss 8,295 (5,597) (11,435) (45,837)Settlements (19,281) - - -Benefits paid (4,056) (4,536) (9,596) (10,205)
Projected benefit obligation at end of year 59,919$ 67,721$ 326,096$ 314,733$
FUNDED STATUSFunded status (6,809)$ (2,875)$ (198,175)$ (213,181)$ Unrecognized net transition obligation - - - 25,510Unamortized prior service cost - - - 903Unrecognized actuarial (gain)/loss - 11,872 - 75,403 Accrued benefit liability recognized in the (6,809)$ 8,997$ (198,175)$ (111,365)$
consolidated statement of financial position
AMOUNTS RECORDED IN UNRESTRICTED NET ASSETS NOT YET AMORTIZED AS COMPONENTS OF NET PERIODIC BENEFIT COSTNet transition obligation - 21,866$ Prior service cost - 639Net actuarial (gain)/loss 5,992 48,636
Amount recognized as reduction in unrestricted net assets 5,992$ 71,141$

46
NOTES TO CONSOLIDATED FINANCIAL STATEMENTS
(dollars in thousands)
D. Net Periodic Benefi t CostNet benefi t expense related to the pension and postretirement plans for the years ended June 30 includes the following components:
The amounts of transition obligation, prior service costs, and actuarial gains/losses that will be amortized into net periodic benefi t cost for the year ending June 30, 2008 are estimated as follows:
E. Actuarial AssumptionsAssumptions used in determining the pension and postretirement plans benefi t obligations and net periodic costs are:
The healthcare cost trend rate assumption has a signifi cant effect on the amounts reported for other postretirement (health-care) plans. Increasing the healthcare cost trend rate by 1 percent in each future year would increase the benefi t obligation by $56,988 and the annual service and interest cost by $6,754. Decreasing the healthcare cost trend rate by 1 percent in each future year would decrease the benefi t obligation by $45,820 and the annual service and interest cost by $5,297.
Pension benefits Other postretirement446,3 -noitagilbo noitisnarT $ 462 -tsoc ecivres roirP
903ssol/)niag( lairautca teN 283,1
$
903latoT 092,5 $ $
ESTIMATED COMPONENTS OF NET PERIODIC BENEFIT COST
SUMMARY OF ACTUARIAL ASSUMPTIONSPension benefits Other postretirement
2007 2006 2007 2006USED TO CALCULATE BENEFIT OBLIGATIONS AT JUNE 30
Discount rate 6.00% 6.00% 6.00% 6.00%Rate of compensation increase 6.10% 6.10%
USED TO CALCULATE NET PERIODIC COST AT JULY 1Discount rate 6.00% 5.00% 6.00% 5.00%Expected return on plan assets 8.00% 8.00% 8.00% 8.00%Rate of compensation increase 6.10% 6.10%
ASSUMED HEALTHCARE COST TREND RATESHealthcare cost trend rate assumed for next year 8.00% 9.00%Ultimate trend rate 5.00% 5.00%Years to reach ultimate trend rate 3 4
2007 2006 2007 2006Service cost (benefits earned during the period) 3,212$ 3,450 066,31 $ $ 16,124$
294,71437,81345,3820,4tsoc tseretnI)520,7()903,8()147,4()329,4(stessa nalp no nruter detcepxE
446,3446,3 - -noitagilbo noitisnart laitini fo noitazitromA313462 - -tsoc ecivres roirp fo noitazitromA331,7563,2082,1216ssol/)niag( ten fo noitazitromA
- - -586,01ssol/)niag( tnemeltteS416,31 tsoc tifeneb cidoirep teN $ 3,532 853,03 $ $ 37,681$
NET PERIODIC BENEFIT COSTtnemeritertsop rehtOstifeneb noisneP

47
NOTES TO CONSOLIDATED FINANCIAL STATEMENTS
(dollars in thousands)
F. Plan AssetsThe plan assets for Endowed Ithaca and the Medical College are invested with an outside trustee for the sole benefi t of the plan participants. Consistent with that objective, investments are managed to maximize total return while maintaining a prudent limitation on risk.
Risk mitigation is achieved by diversifying investments across multiple asset classes, by investing in high quality securities, and by permitting fl exibility in the balance of investments in the permitted asset classes. The expected return on assets was derived based on long-term assumptions of infl ation, real returns (primarily historically based), anticipated value added by the investment managers, and expected average asset class allocations. The expected returns on plan assets by category are 9.25 percent on equity securities, 6.00 percent on debt securities, and 7.50 percent on real estate.
Plan asset allocations by category at June 30 are as follows:
G. Expected Contributions and Benefi t PaymentsThe expected annual contributions and benefi t payments that refl ect anticipated service are as follows:
The Medicare Prescription Drug, Improvement and Modernization Act of 2003 established a prescription drug benefi t known as “Medicare Part D” that also established a federal subsidy to sponsors of retiree healthcare benefi t plans. The estimated future government subsidy amounts are refl ected in the table above.
H. Contract College EmployeesEmployees of the Contract Colleges are covered under the New York State pension plans. Contributions to the state retirement system and other employee benefi t costs are paid directly by the state. The amounts of the direct payments applicable to the University as revenue and expenditures are not currently determinable and are not included in the consolidated fi nancial statements. The University reimburses the state for employee benefi t costs on certain salaries, principally those associated with externally sponsored programs. The amount reimbursed to the state during the years ended June 30, 2007 and 2006, was $17,488 and $17,889, respectively, and are included in operating expenses.
Targetallocation 2007 2006 2007 2006
PERCENTAGE OF PLAN ASSETS%0.57%1.07%0.16%0.25%58-93seitiruces ytiuqE%0.52%9.92%0.33%6.44%55-51seitiruces tbeD%0.0%0.0%0.6%4.3%5-0etatse laeR%0.001%0.001%0.001%0.001latoT
SUMMARY OF PLAN ASSETStnemeritertsop rehtOstifeneb noisneP
Pension benefits Employer paid Government subsidyUNIVERSITY CONTRIBUTIONS
000,38002 633,5 $ $
FUTURE BENEFIT PAYMENTS091,98002 759,01 $ 445,1 $ $ 877,29002 449,11 537,1 148,20102 101,31 819,1 874,31102 433,41 690,2 727,32102 224,51 582,2 903,227102-3102 764,79 389,41
EXPECTED CONTRIBUTIONS AND BENEFIT PAYMENTSOther postretirement

48
NOTES TO CONSOLIDATED FINANCIAL STATEMENTS
(dollars in thousands)
6. FUNDS HELD IN TRUST FOR OTHERS
The University, in limited instances, invests funds as a custodian for other closely related parties. Independent trustees are responsible for the funds and for the designation of income distribution. The New York Hospital-Cornell Medical Center Fund, Inc., which benefi ts the New York Weill Cornell Medical Center of the New York-Presbyterian Hospital, is the major external organization invested in the University’s long-term investment pool with assets having a market value of $186,461 and $96,824 at June 30, 2007 and 2006, respectively. Of these investments, a portion of the future income stream has been directed in perpetuity to benefi t the Medical College. The present value of this income stream, calculated to be $74,141 and $57,241 at June 30, 2007 and 2006, respectively, has been recorded as a reduction of the funds held in trust for others liability.
7. BONDS AND NOTES PAYABLE
Bonds and notes payable as of June 30 are summarized as follows:
The University’s bonds and notes payable had a carrying amount of $800,107 and $702,064 at June 30, 2007 and 2006, respectively, compared to an estimated fair value of approximately $808,513 and $710,655 at June 30, 2007 and 2006, respectively. The estimated fair value of bonds is based on quoted market prices for the same or similar issues. The market prices utilized refl ect the amount a third party would pay to purchase the bonds and not an additional liability to the University. Interest expense during the years ended June 30, 2007 and 2006 was approximately $30,280 and $27,217, respectively. Effective for the year ended June 30, 2007, the University capitalized interest on self-constructed assets, such as buildings, in the amount of $4,218.
2007 2006 Interest rates Maturity date )YNSAD( kroY weN fo etatS eht fo ytirohtuA yrotimroD seireS dnoB euneveR
003,75B0991 $ 57,800$ 3.04 to 4.05* 2025023,85A0002 59,960 2.99 2029567,67B0002 78,615 4.63 2030051,094002 92,100 3.51 2033057,9326002 248,570 4.00 to 5.00 2035
7002a/n551,1 - noitaicerppa latipac dnob naol tnedutS 39911995 Student loan bond capital appreciation 6,339 8,150 5.80 to 6.15 2008
500,98repap laicremmoc tpmexe-xaT 19,205 2.99 to 3.72* 2037073,01B7891 seireS dnoB 11,760 11.11 2012979,68repap laicremmoc elbaxaT 37,791 5.08 to 5.40* -
Industrial Development Agency533,40002 5,290 5.00 to 5.25 2011017,24A2002 42,780 4.52 2030093,51B2002 15,390 4.33 2015043,5noitaicossA gnitekraM naoL tnedutS 5,635 5.75 to 6.50 2019057,2noitaroproC tnempoleveD nabrU 2,875 - 2029
Capitalized leases692,11evA egelloC 213 11,836 various 2020803,3rehtO 3,152 various 2009-2029701,008elbayap seton dna sdnob latoT $ 702,064$
* Rates presented are the actual rates paid during the year ended June 30, 2007. These rates are variable based on market conditions.
SUMMARY OF BONDS AND NOTES PAYABLE

49
NOTES TO CONSOLIDATED FINANCIAL STATEMENTS
(dollars in thousands)
Debt and debt service related to borrowings by New York State for the construction and renovation of facilities of the Con-tract Colleges are not included in the consolidated fi nancial statements because they are not liabilities of the University.
Under agreement with DASNY, certain revenues, principally rental income from facilities fi nanced by bond proceeds plus a portion of tuition, are pledged by the University to meet debt service requirements. Also, certain revenue bonds require compliance with an asset-to-liability ratio and an unencumbered securities-to-operating-expense ratio.
The University has eight interest rate swap agreements to exchange variable rate debt for a fi xed rate obligation without the exchange of the underlying principal amount. Net payments or receipts under the swap agreements are recorded as adjustments to interest expense. Three of the eight interest rate swap agreements are forward-starting swaps negotiated in the year ended June 30, 2007. Under four agreements in effect at June 30, 2007, the counterparty pays the University a variable interest rate equal to the Securities Industry and Financial Markets Association (SIFMA) index (formerly the Bond Market Association index), and under four other agreements, the counterparty pays a variable interest rate equal to a percentage of the one month London Interbank Offered Rates (LIBOR) rate. Detailed information about the interest rate swaps is shown in the following table:
The University continues to issue tax-exempt commercial paper under an agreement entered into in the year ended June 30, 1999. The University amended the agreement in the year ended June 30, 2007, increasing the maximum amount outstanding at any one time from $100,000 to $200,000. In addition, there is no longer a cap on the maximum amount of commercial paper to be issued for the program. The funds may be used for capital projects and equipment purchases for the Ithaca and Medical College campuses.
The University also has a taxable commercial paper program to fi nance working capital, capital projects, and equipment purchases for the Ithaca and Medical College campuses. The University amended the program in the year ended June 30, 2007, increasing the maximum amount outstanding at any one time from $100,000 to $200,000.
Scheduled principal and interest payments on notes and bonds for the next fi ve fi scal years and thereafter are shown below:
The University increased the working capital line of credit from $75,000 to $100,000 for short-term cash fl ow needs in the year ended June 30, 2007. As of June 30, 2007 and 2006, the $30,500 and $54,400, respectively, borrowed against the line of credit is recorded as other liabilities in the consolidated statement of fi nancial position.
SUMMARY OF INTEREST RATE SWAPSsisaBetad noitaripxEtnemecnemmoCetar tseretnItnuoma lanoitoN
78,320 AMFIS7002 ,1 rebotcO %99.2 $15,390 AMFIS0102 ,1 yluJ %33.4 42,710 AMFIS0302 ,1 yluJ %25.4 76,100 ROBIL0302 ,1 yluJ %36.4 90,150 ROBIL3302 ,1 yluJ %15.3
200,000 AMFIS7302 ,1 yluJ8002 ,1 yluJ%48.3 200,000 ROBIL9302 ,1 yluJ0102 ,1 yluJ%54.3 200,000 ROBIL1402 ,1 yluJ2102 ,1 yluJ%84.3
ANNUAL DEBT SERVICE REQUIREMENTSlatoTtseretnIlapicnirPraeY
130,528002 307,63 $ 437,16 $ $ 276,229002 623,53 899,75 842,320102 462,43 215,75 358,321102 770,33 039,65 815,422102 257,13 072,65
Thereafter 680,785 021,934 1,119,905 701,008latoT 242,016 $ $ 1,410,349$

50
NOTES TO CONSOLIDATED FINANCIAL STATEMENTS
(dollars in thousands)
8. OPERATING LEASES
Although the University generally purchases, rather than leases, machinery and equipment, the University does enter operating lease agreements for the use of real property. Total lease expense was $18,011 and $15,444 for the years ended June 30, 2007 and 2006, respectively. The future annual minimum lease payments in the following table are payments under operating leases expiring at various dates through November 1, 2054.
9. FUNCTIONAL EXPENSES AND STUDENT AID
Total expenses by functional categories for the years ended June 30 are as follows:
The expenses for operations and maintenance of facilities, depreciation, and interest are allocated to functional categories based on square footage. The amount allocated for operations and maintenance was approximately $143,344 and $138,221 for the years ended June 30, 2007 and 2006, respectively.
Student fi nancial assistance, other than assistance in exchange for services, is shown as a component of instruction expense unless the assistance is for tuition and mandatory fees. If the assistance is for tuition and mandatory fees, the amounts are recorded as a discount from tuition revenue, not an expense. Total fi nancial assistance classifi ed as instruction expense was $23,401 and $21,463 for the years ended June 30, 2007 and 2006, respectively.
ANNUAL MINIMUM OPERATING LEASE PAYMENTSYear Payments2008 16,755$ 2009 15,6522010 15,2592011 13,8912012 11,437Thereafter 69,897
Total minimum operating lease payments 142,891$
FUNCTIONAL EXPENSES2007 2006
Instruction 555,434$ 534,837$ Research 505,452 497,933 Public service 108,847 105,893 Academic support 236,784 220,012 Student services 111,279 106,667 Medical services 412,270 392,079 Institutional support 360,426 330,948 Enterprises and subsidiaries 183,812 179,401
Total expenses 2,474,304$ 2,367,770$

51
NOTES TO CONSOLIDATED FINANCIAL STATEMENTS
(dollars in thousands)
10. NET ASSETS
The University’s net assets as of June 30 are as follows:
11. CONTINGENT LIABILITIES
The University is a defendant in various legal actions, some of which are for substantial monetary amounts, that arise out of the normal course of its operations. Although the fi nal outcome of the actions cannot be determined currently, the University’s administration is of the opinion that eventual liability, if any, will not have a material effect on the University’s fi nancial position.
The University retains self insurance for property, general liability, and certain health benefi ts, and has an equity interest in a multi-provider captive insurance company.
12. SUBSEQUENT EVENT
In July 2007, a hedge fund in which the University was invested was unexpectedly liquidated. The University estimates its loss at approximately $20,000.
SUMMARY OF NET ASSETS
UnrestrictedTemporarily
restricted Permanently
restricted2007Total
2006Total
Operations 17,979$ 391,996$ -$ 409,975$ 444,818$ Student loans 7,064 - 30,711 37,775 41,458Facilities and equipment 1,702,323 154,497 - 1,856,820 1,621,301Endowment and similar funds 3,576,523 163,741 1,684,469 5,424,733 4,385,161Living trust funds - 67,688 41,474 109,162 92,617
Total net assets 5,303,889$ 777,922$ 1,756,654$ 7,838,465$ 6,585,355$

52
ADMINISTRATION
JULY 1, 2007UNIVERSITY ADMINISTRATION
David J. Skorton, President C. Biddy Martin, Provost Antonio M. Gotto, Jr., Provost for
Medical Affairs and Stephen and Suzanne Weiss Dean of the Joan and Sanford I. Weill Medical College
Carolyn N. Ainslie, Vice President for Planning and Budget
Thomas W. Bruce, Vice President for University Communications
Joseph A. Burns, Vice Provost for PhysicalSciences and Engineering
Doris Davis, Associate Provost for Admissions and Enrollment
Joanne M. DeStefano, Vice President for Financial Affairs and University Controller
Helene R. Dillard, Director of Cornell Cooperative Extension
Charles R. Fay, Vice Provost for Research Administration
Stephen T. Golding, Samuel W. Bodman Executive Vice President for Finance and Administration
Stephen F. Hamilton, Associate Provost for Outreach
David R. Harris, Vice Provost for Social SciencesRobert L. Harris, Jr., Vice Provost for
Diversity and Faculty DevelopmentKent L. Hubbell, Robert W. and Elizabeth C.
Staley Dean of Students Stephen Philip Johnson, Vice President for
Government and Community RelationsStephen Kresovich, Vice Provost for
Life Sciences Polley Ann McClure, Vice President for
Information Technologies Richard W. McDaniel, Vice President for Safety,
Health and Environmental RiskJames J. Mingle, University Counsel and
Secretary of the Corporation Michele M. Moody-Adams, Vice Provost for
Undergraduate EducationSusan H. Murphy, Vice President for Student
and Academic Services Mary G. Opperman, Vice President for
Human Resources Alan S. Paau, Vice Provost for Technology
Transfer and Economic DevelopmentCharles D. Phlegar, Vice President for
Alumni Affairs and DevelopmentRobert C. Richardson, Vice Provost for ResearchSteven P. Rosalie, Associate Provost for
International Initiatives and Executive Vice Dean
ACADEMIC UNITS
College of Agriculture and Life SciencesSusan A. Henry, Ronald P. Lynch Dean
College of Architecture, Art, and PlanningMohsen Mostafavi, Dean
College of Arts and SciencesG. Peter Lepage, Harold Tanner Dean
College of EngineeringW. Kent Fuchs, Joseph Silbert Dean
College of Human EcologyAlan Mathios, Rebecca Q. and James Morgan Dean, Interim
College of Veterinary MedicineMichael I. Kotlikoff, Austin O. Hooey Dean of Veterinary Medicine
Graduate SchoolAlison G. Power, Dean
Law SchoolStewart J. Schwab, Dean
School of Continuing Educationand Summer SessionsGlenn C. Altschuler, Dean
School of Hotel AdministrationMichael D. Johnson, Dean
School of Industrial and Labor RelationsHarry C. Katz, Dean
S. C. Johnson Graduate School of Management, L. Joseph Thomas, Anne and Elmer Lindseth Dean, Interim
Weill Graduate School of Medical SciencesDavid P. Hajjar, Dean
Weill Medical CollegeAntonio M. Gotto, Jr., Stephen and Suzanne Weiss Dean and Provost for Medical Affairs
Weill Medical College in QatarDaniel R. Alonso, Dean
Computing and Information ScienceRobert L. Constable, Dean
Africana Studies and Research CenterSalah Hassan, Director
Division of Nutritional SciencesPatrick Stover, Director
Cornell University LibraryAnne R. Kenney, Carl A. KrochUniversity Librarian, Interim
Ronald Seeber, Vice Provost for Land Grant Affairs
John A. Siliciano, Vice ProvostCharles Walcott, Dean of the University
Faculty James H. Walsh, Chief Investment Offi cerKyu-Jung Whang,Vice President
for Facilities ServicesDavid Wippman, Vice Provost for
International Relations

53
BOARD OF
TRUSTEES AND
TRUSTEES AT LARGE
JULY 1, 2007
LEADERSHIP
Peter C. Meinig, ChairmanSamuel C. Fleming, Vice ChairmanRobert S. Harrison, Vice ChairmanEdwin H. Morgens, Vice ChairmanDavid W. Zalaznick, Vice ChairmanJan Rock Zubrow, Vice Chairman
Ex Offi cio MembersDavid J. Skorton, President of Cornell UniversityEliot Spitzer, Governor of New York StateJoseph L. Bruno, Temporary President of the New York State SenateSheldon Silver, Speaker of the New York State Assembly
Other MembersJohn E. AlexanderStephen B. AshleyJeffrey F. BergC. Morton Bishop IIIFranci J. BlassbergKelly J. BrownDwight L. Bush Sr.Jennie K.Y. ChuaEzra CornellDavid D. CrollEdward vK. Cunningham Jr.Diana M. DanielsIra DrukierKatherine H. DuchWilliam V. EatonRonald G. EhrenbergMichael V. EspositoStephen J. EttingerMiguel A. FerrerCheryl A. FrancisBlanche S. GoldenbergKenneth A. GoldmanPaul A. GouldDenis M. HughesRobert A. HuretRobert J. KatzKaren Rupert KeatingJill N. LernerMarcus H. Loo
Kevin M. McGovernN.R. Narayana MurthyCarolyn Chauncey NeumanJohn A. NoblePeter J. NolanLubna Suliman OlayanDonald C. OpatrnyAndrew M. PaulKathleen M. RamussenBruce S. RaynorPhilip R. ReillyIrene B. RosenfeldJerold R. RudermanRobert L. RyanWilliam D. SandersRichard J. SchwartzSherri K. StuewerMartin Y. TangRatan N. TataLisa Skeete TatumAndrew H. TischSheryl WuDunnMao YePhilip M. YoungCraig YunkerMichael J. Zak
COMMITTEES
Executive CommitteeDiana M. Daniels, ChairmanRobert J. Katz, Vice Chairman
Investment CommitteePaul A. Gould, ChairmanDonald C. Opatrny, Vice ChairmanAndrew M. Paul, Vice Chairman
Audit CommitteeDwight L. Bush, Chairman Cheryl A. Francis, Vice Chairman
Finance CommitteeDavid W. Zalaznick, ChairmanFranci J. Blassberg, Vice Chairman
Buildings and Properties CommitteeBlanche S. Goldenberg, ChairmanSherri K. Stuewer, Vice Chairman
Committee on Governmental RelationsAndrew H. Tisch, ChairmanBruce S. Raynor, Vice ChairmanRichard J. Schwartz, Vice Chairman
Committee on Board MembershipEdwin H. Morgens, Chairman
Board of Overseers - Weill Medical College and Graduate School of Medical SciencesSanford I. Weill, Chairman
Committee on Academic Affairs Marcus H. Loo, CoChairmanRobert J. Katz, CoChairmanSheryl WuDunn, Vice ChairmanCraig Yunker, Vice Chairman
Committee on Student LifeRobert S. Harrison, ChairmanC. Morton Bishop, Vice ChairmanPeter J. Nolan, Vice Chairman
Committee on Alumni Affairs and DevelopmentStephen B. Ashley, CoChairmanJan Rock Zubrow, CoChairmanKaren R. Keating, Vice Chairman
Trustee-Community Communications CommitteeCarolyn C. Newman, Chairman

54
Emeritus Chairmen of the BoardAustin H. KiplingerHarold TannerStephen H. Weiss
Other Emeritus TrusteesRobert H. AbramsEllen Gussman AdelsonLilyan H. Affi nitoRobert J. AppelRichard A. AubrechtRobert W. BitzRobert T. Blakely IIIKenneth H. BlanchardAnn Schmeltz BowersJames L. BroadheadRichard C. CallMichael W.N. ChiuJames M. ClarkJ. Thomas ClarkLaura J. ClarkAbby Joseph CohenPaul F. ColeRobert A. CowieKenneth T. DerrJohn S. DysonRobert R. DysonAnne Evans EstabrookFred J. EydtMary C. FalveyJoan H. FerreiraStephen W. FilloEarl R. FlansburghBarbara B. FriedmanH. Laurance FullerJames Lowell Gibbs Jr.Myra Maloney HartJoseph H. HollandH. Fisk Johnson
Thomas W. JonesAlbert J. KanebRobert D. KennedyHarvey KinzelbergBenson P. LeeCharles R. LeeJon A. LindsethCarol Britton MacCorkleEli Manchester Jr.Thomas A. MannDale Rogers MarshallRonay A. MenschelRobert W. MillerHoward P. MilsteinRebecca Q. MorganJohn P. NeafseyMargaret Osmer-McQuadeRoy H. Park, Jr.Jeffrey P. ParkerRobert A. PaulGeorge PeterWilliam E. PhillipsBernard W. PotterCurtis S. ReisWilliam R. RobertsonWilliam D. SandersNelson Schaenen Jr.Daniel G. SislerRobert W. StaleyCharles T. StewartPatricia Carry StewartPeter G. Ten Eyck IIAllan R. TesslerSamuel O. ThierPaul R. TregurthaRichard F. TuckerSanford I. WeillRoger J. WeissBruce Widger
BOARD OF
TRUSTEES AND
TRUSTEES AT LARGE
JULY 1, 2007

55
WEILL CORNELL MEDICAL COLLEGEAND WEILL CORNELL GRADUATE SCHOOL OF MEDICAL SCIENCESBOARD OF OVERSEERS—JULY 1, 2007
Sanford I . Weill, ChairmanHushang Ansary, Vice ChairmanBarbara B. Friedman, Vice ChairmanArthur J. Mahon, Vice ChairmanHer Highness Sheikha Mouza Bint Nasser Al-MisnadMadelyn AntoncicRobert AppelBrooke Astor†
Robert A. BelferJessica BibliowiczLloyd C. BlankfeinJ. Thomas ClarkAbby Joseph CohenRichard P. CohenTimothy CollinsDaniel P. Davison†
Sanford B. EhrenkranzIsrael A. EnglanderAnne E. EstabrookJeffrey J. FeilCharlotte M. FordGerald J. FordAntonio M. Gotto Jr.*Paul GouldJeffrey W. GreenbergMaurice R. GreenbergRajat K. GuptaDavid P. Hajjar*Leonard M. HarlanRaymond R. Herrmann Jr.†
John KanasJames M. KiltsHarvey Klein
Charles R. LeeMichael T. MasinPeter C. Meinig*Ronay A. MenschelFabrizio MichelassiHoward P. MilsteinEdwin H. MorgensRupert MurdochMargaret Osmer-McQuade†
Ankit PatelNelson PeltzRonald O. PerelmanCharles PrinceBruce C. RatnerBurton ResnickGene Resnick*Frank H. T. Rhodes†
Isadore RosenfeldZev RosenwaksPeter M. SacerdoteHerbert J. SiegelDavid J. Skorton*A.J.C. (Ian) SmithDaisy Margaret SorosSaul P. Steinberg†
Charles T. Stewart†
Patricia Carry Stewart†
Louis Wade SullivanHarold Tanner†
Samuel O. ThierRichard F. Tucker†
Roger J. Weiss†
Stephen H. Weiss†
* Ex offi cio† Life Overseer

56
Produced by: The Offi ce of Publications and Marketing at Cornell UniversityandThe Division of Financial Affairs Cornell University 341 Pine Tree RoadIthaca, New York [email protected]://www.dfa.cornell.edu 607/255-6240
Additional copies of this report are available at:http://www.accounting.cornell.edu/View_Annual_Reports.cfm
PHOTO CREDITSUniversity Photography
Cornell University is an equal-opportunity, affi rmative-action educator and employer.
This report is printed on recycled paper.
10/2007 1650 FLP 080033