corning inc /ny - shareholder.com · indicate the number of shares outstanding of each of the...
TRANSCRIPT

FORM 10-Q
CORNING INC /NY
(Quarterly Report)
Filed 7/30/2004 For Period Ending 6/30/2004
Address ONE RIVERFRONT PLAZA
CORNING, New York 14831
Telephone 607-974-9000
CIK 0000024741
Industry Communications Equipment
Sector Technology
Fiscal Year 12/28

FORM 10-Q
SECURITIES AND EXCHANGE COMMISSION
WASHINGTON, DC 20549
[X] QUARTERLY REPORT PURSUANT TO SECTION 13 OR 15(d) OF THE SECURITIES EXCHANGE ACT OF 1934
For the quarterly period ended June 30, 2004
[ ] TRANSITION REPORT PURSUANT TO SECTION 13 OR 15(d) OF THE SECURITIES EXCHANGE ACT OF 1934
For the transition period from ___________to____________
Commission file number 1-3247
CORNING INCORPORATED (Registrant)
Registrant's telephone number, including area code: 607-974-9000
Indicate by check mark whether the registrant (1) has filed all reports required to be filed by Section 13 or 15(d) of the Securities Exchange Act of 1934 during the preceding 12 months and (2) has been subject to the filing requirements for the past 90 days.
Yes X No ____
Indicate by check mark whether the registrant is an accelerated filer (as defined in Rule 12b-2 of the Exchange Act).
Yes X No ____
Indicate the number of shares outstanding of each of the issuer's classes of common stock, as of the latest practicable date:
1,393,634,191 shares of Corning's Common Stock, $0.50 Par Value, were outstanding as of June 30, 2004.
New York 16-0393470 ---------------------------------------- ------- ----------------------------- (State of incorporation) (I.R.S. Employer Identification No.) One Riverfront Plaza, Corning, New York 14831 ---------------------------------------- ------- ----------------------------- (Address of principal executive offices) (Zip Code)

INDEX ----- PART I - FINANCIAL INFORMATION ------------------------------ ITEM 1. Financial Statements Page ---- Consolidated Statements of Operations (Unaudite d) for the three and six months ended June 30, 2004 and 2003 3 Consolidated Balance Sheets at June 30, 2004 (U naudited) and December 31, 2003 4 Consolidated Statements of Cash Flows (Unaudite d) for the six months ended June 30, 2004 and 2003 5 Notes to Consolidated Financial Statements (Una udited) 6 Item 2. Management's Discussion and Analysis of Fin ancial Condition and Results of Operations 21 Item 3. Quantitative and Qualitative Disclosures Ab out Market Risk 33 Item 4. Controls and Procedures 33 PART II - OTHER INFORMATION --------------------------- Item 1. Legal Proceedings 34 Item 2. Changes in Securities, Use of Proceeds and Issuer Purchases of Equity Securities 39 Item 3. Defaults Upon Senior Securities N/A Item 4. Submission of Matters to a Vote of Security Holders 40 Item 5. Other Information 41 Item 6. Exhibits and Reports on Form 8-K 41 Signatures 42 Exhibit Index 43 Certifications 46

CORNING INCORPORATED AND SUBSIDIARY COMPANIES CONSOLIDATED STATEMENTS OF OPERATIONS
(Unaudited; in millions, except per share amounts)
The accompanying notes are an integral part of these statements.
For the three months For the six months ended June 30, en ded June 30, ------------------------ ------- ----------------- 2004 2003 2004 2003 --------- -------- ------- -- --------- Net sales $ 971 $ 752 $ 1,8 15 $ 1,498 Cost of sales 625 571 1,1 69 1,117 --------- -------- ------- -- --------- Gross margin 346 181 6 46 381 Operating expenses: Selling, general and administrative expenses 166 148 3 26 300 Research, development and engineering expenses 85 85 1 69 178 Amortization of purchased intangibles 9 9 19 18 Restructuring, impairment and other charges and (credits) (Note 4) (34) 49 100 Asbestos settlement (Note 5) 47 39 66 337 --------- -------- ------- -- --------- Operating income (loss) 73 (149) 66 (552) Interest income 4 9 10 17 Interest expense (37) (42) ( 73) (82) (Loss) gain on repurchases and retirement of debt, net (Note 11) (9) 13 ( 32) 17 Other income, net 5 20 1 6 --------- -------- ------- -- --------- Income (loss) before income taxes 36 (149) ( 28) (594) (Provision) benefit for income taxes (Note 7) (24) 34 ( 12) 178 --------- -------- ------- -- --------- Income (loss) before minority interests and equity earnings 12 (115) ( 40) (416) Minority interests (11) 33 ( 11) 70 Equity in earnings of associated companies, net of impairments 107 60 2 14 119 --------- -------- ------- -- --------- Net income (loss) $ 108 $ (22) $ 1 63 $ (227) ========= ======== ======= == ========= Basic earnings (loss) per common share (Note 14) $ 0.08 $ (0.02) $ 0. 12 $ (0.19) ========= ======== ======= == ========= Diluted earnings (loss) per common share (Note 14) $ 0.07 $ (0.02) $ 0. 11 $ (0.19) ========= ======== ======= == ========= Shares used in computing per share amounts for: Basic earnings (loss) per common share (Note 14) 1,383 1,244 1,3 71 1,222 ========= ======== ======= == ========= Diluted earnings (loss) per common share (Note 14 ) 1,495 1,244 1,4 46 1,222 ========= ======== ======= == =========

CORNING INCORPORATED AND SUBSIDIARY COMPANIES CONSOLIDATED BALANCE SHEETS
(Unaudited; in millions, except per share amounts)
The accompanying notes are an integral part of these statements.
June 30, December 31, 2004 2003 ----------- ------------- Assets Current assets: Cash and cash equivalents $ 964 $ 833 Short-term investments, at fair value 623 433 --------- --------- Total cash, cash equivalents and short-term in vestments 1,587 1,266 Trade accounts receivable, net of doubtful accou nts and allowances - $37 and $38 566 525 Inventories (Note 6) 501 467 Deferred income taxes 236 242 Other current assets 175 194 --------- --------- Total current assets 3,065 2,694 Investments (Note 8) 1,132 1,045 Property, net of accumulated depreciation - $3,636 and $3,415 3,663 3,620 Goodwill (Note 9) 1,729 1,735 Other intangible assets, net (Note 9) 146 166 Deferred income taxes 1,278 1,225 Other assets 236 267 --------- --------- Total Assets $ 11,249 $ 10,752 ========= ========= Liabilities and Shareholders' Equity Current liabilities: Loans payable $ 312 $ 146 Accounts payable 377 333 Other accrued liabilities (Note 5 and 10) 1,065 1,074 --------- --------- Total current liabilities 1,754 1,553 Long-term debt (Note 11) 2,448 2,668 Postretirement benefits other than pensions 610 619 Other liabilities (Note 5) 405 412 Commitments and contingencies (Note 12) Minority interests 30 36 Shareholders' equity: Preferred stock - Par value $100.00 per share; S hares authorized: 10 million Series C mandatory convertible preferred stock - Shares issued: 5.75 million; Shares outstanding: 637 thousand and 854 thous and 64 85 Common stock - Par value $0.50 per share; Shares authorized: 3.8 billion; Shares issued: 1,417 million and 1,401 million 708 701 Additional paid-in capital 10,350 10,298 Accumulated deficit (4,981) (5,144) Treasury stock, at cost; Shares held: 23 million and 58 million (234) (574) Accumulated other comprehensive income 95 98 --------- --------- Total shareholders' equity 6,002 5,464 --------- --------- Total Liabilities and Shareholders' Equity $ 11,249 $ 10,752 ========= =========

CORNING INCORPORATED AND SUBSIDIARY COMPANIES CONSOLIDATED STATEMENTS OF CASH FLOWS
(Unaudited; in millions)
The accompanying notes are an integral part of these statements.
For the six m onths ended June 30, ------------- ------------ 2004 2003 --------- --------- Cash flows from operating activities: Net income (loss) $ 163 $ (227) Adjustments to reconcile net income (loss) to ne t cash provided by operating activities: Amortization of purchased intangibles 19 18 Depreciation 240 250 Restructuring, impairment and other charges an d credits 100 Asbestos settlement 66 337 Loss (gain) on repurchases and retirement of d ebt, net 32 (17) Undistributed earnings of associated companies (92) (24) Minority interests, net of dividends paid 11 (70) Deferred tax benefit (35) (234) Interest expense on convertible debentures 3 13 Restructuring payments (56) (143) Income tax refund 191 Tax benefit on stock options 11 Changes in certain working capital items: Trade accounts receivable (43) 17 Inventories (33) 34 Other current assets 7 (4) Accounts payable and other current liabilit ies, net of restructuring payments (6) (173) Other, net 20 (20) -------- ------- Net cash provided by operating activities 307 48 -------- ------- Cash flows from investing activities: Capital expenditures (302) (110) Net proceeds from sale of precision lens busines s 9 Net proceeds from sale or disposal of assets 35 43 Net increase in long-term investments and other long-term assets (4) Short-term investments - acquisitions (706) (1,060) Short-term investments - liquidations 514 956 Restricted investments - liquidations 5 6 -------- ------- Net cash used in investing activities (454) (160) -------- ------- Cash flows from financing activities: Net repayments of loans payable (9) (54) Proceeds from issuance of long-term debt, net 396 Repayments of long-term debt (150) (823) Proceeds from issuance of common stock, net 24 281 Cash dividends paid to preferred shareholders (5) (6) Proceeds from the exercise of stock options 27 -------- ------- Net cash provided by (used in) financing activities 283 (602) -------- ------- Effect of exchange rates on cash (5) 35 -------- ------- Net increase (decrease) in cash and cash equivalent s 131 (679) Cash and cash equivalents at beginning of period 833 1,426 -------- ------- Cash and cash equivalents at end of period $ 964 $ 747 ======== =======

CORNING INCORPORATED AND SUBSIDIARY COMPANIES
NOTES TO CONSOLIDATED FINANCIAL STATEMENTS (Unaudited)
1. Basis of Presentation
General
Corning Incorporated and its consolidated subsidiaries is hereinafter sometimes referred to as "the Company," "Registrant," "Corning," "we," "our" or "us."
Corning is a diversified technology company that concentrates its efforts on high-impact growth opportunities. Corning combines its expertise in specialty glass, ceramic materials, polymers and the manipulation of the properties of light, with strong process and manufacturing capabilities to develop, engineer and commercialize significant innovative products for the telecommunications, flat panel display, environmental, life sciences and semiconductor industries.
The unaudited consolidated financial statements reflect all adjustments which, in the opinion of management, are necessary for a fair statement of the results of operations, financial position and cash flows for the interim periods presented. All such adjustments are of a normal recurring nature. The consolidated financial statements have been prepared pursuant to the rules and regulations of the Securities and Exchange Commission and in accordance with accounting principles generally accepted in the United States of America (GAAP) for interim financial information.
The preparation of financial statements in conformity with GAAP requires management to make estimates and assumptions that affect amounts reported therein. Significant estimates and assumptions in these consolidated financial statements include restructuring and other charges and credits, allowances for doubtful accounts receivable, estimates of future cash flows and other assumptions associated with goodwill and long-lived asset impairment tests, estimates of the fair value of assets held for disposal, environmental and legal liabilities, income taxes and deferred tax valuation allowances, and the determination of discount and other rate assumptions for pension and postretirement employee benefit expenses. Due to the inherent uncertainty involved in making estimates, actual results reported in future periods may be different from these estimates.
The results for interim periods are not necessarily indicative of results that may be expected for any other interim period or for the full year. These interim consolidated financial statements should be read in conjunction with Corning's Annual Report on Form 10-K for the year ended December 31, 2003.
Certain amounts for 2003 were reclassified to conform to 2004 classifications.
Stock-Based Compensation
We apply Accounting Principles Board Opinion (APB) No. 25, "Accounting for Stock Issued to Employees" (APB No. 25), for our stock-based compensation plans. The following table illustrates the effect on income (loss) and earnings (loss) per share if we had applied the fair value recognition provisions of Financial Accounting Standards Board (FASB) Statement of Financial Accounting Standards (SFAS) No. 123, "Accounting for Stock-Based Compensation" (SFAS No. 123), to stock-based employee compensation.

For purposes of SFAS No. 123 fair value disclosures, each option grant's fair value is estimated on the grant date using the Black-Scholes option pricing model. The following are weighted-average assumptions used for grants under our stock plans:
During the first quarter of 2004, Corning updated its analysis of the historical stock option exercise behavior of its employees, among other relevant factors, and determined that the best estimate of the stock options' expected term granted in the first quarter was 4 years, compared to our previous expected term estimate of 5 years. Additionally, Corning used a 10-year mean reversion analysis, as allowed by SFAS No. 123, to determine the volatility assumption also used to estimate the fair value of options granted in the first quarter. Prior to 2004, Corning used historical trailing volatility for a period equal to the expected term of our stock options. Corning believes a mean reversion analysis provides a better estimate of future volatility expectations.
Changes in the status of outstanding options follow:
(In millions, except per share amounts) --------------------------------------------------- --------------------------------------------------- ----------------------------- Three months Six months ended June 30, ended June 30, ------------------------- ------------------------- 2004 2003 2004 2003 --------------------------------------------------- --------------------------------------------------- ----------------------------- Net income (loss) - as reported $ 108 $ (22) $ 163 $ (227) Add: Stock-based employee compensation expense determined under APB No. 25, included in reported net income (loss), net of tax 1 3 1 Less: Stock-based employee compensation expense determined under fair value based method, net of tax (28) (34) (57) (69) --------------------------------------------------- --------------------------------------------------- ----------------------------- Net income (loss) - pro forma $ 81 $ (56) $ 109 $ (295) Earnings (loss) per common share: Basic - as reported $ 0.08 $ (0.02) $ 0.12 $ (0.19) Basic - pro forma $ 0.06 $ (0.05) $ 0.08 $ (0.24) Diluted - as reported $ 0.07 $ (0.02) $ 0.11 $ (0.19) Diluted - pro forma $ 0.05 $ (0.05) $ 0.08 $ (0.24) --------------------------------------------------- --------------------------------------------------- -----------------------------
--------------------------------------------------- ---------------------------- Three months Six months ended June 30, ended June 30, -------------------- -------------------- 2004 2003 2004 2003 --------------------------------------------------- ---------------------------- Expected life in years 4 5 4 5 Risk free interest rate 3.7% 2.8% 3.3% 2.9% Expected volatility 50% 79.6% 50% 78.4% --------------------------------------------------- ----------------------------
--------------------------------------------------- ----------------------------- Number of Shares Weighted-Average (in thous ands) Exercise Price --------------------------------------------------- ----------------------------- Options outstanding December 31, 2003 135,3 52 $ 20.58 Options granted under plans 9,3 32 $ 11.66 Options exercised (4,7 03) $ 5.93 Options terminated (7 84) $ 33.15 ----- -- Options outstanding June 30, 2004 139,1 97 $ 20.35 ===== == Options exercisable June 30, 2004 94,0 12 $ 25.19 --------------------------------------------------- -----------------------------

New Accounting Standard
In May 2004, the FASB issued Staff Position (FSP) No. FAS 106-2, "Accounting and Disclosure Requirements Related to the Medicare Prescription Drug, Improvement and Modernization Act of 2003" (FSP No. 106-2), which provides guidance on how companies should account for the impact of the Medicare Prescription Drug, Improvement and Modernization Act of 2003 (the "Act") on its postretirement health care plans. To encourage employers to retain or provide postretirement drug benefits, beginning in 2006 the federal government will provide non-taxable subsidy payments to employers that sponsor prescription drug benefits to retirees that are "actuarially equivalent" to the Medicare benefit. Corning has determined that its postretirement health care plans' prescription drug benefits are actuarially equivalent to Medicare Part D benefits to be provided under the Act. Effective July 1, 2004, Corning will prospectively adopt the accounting guidance of FSP No. 106-2, which will reduce our postretirement health care and life insurance plans' accumulated postretirement benefit obligation by $73 million and annual expense by $10 million.
2. Employee Retirement Plans
Defined Benefit Plans
The following table summarizes the components of net periodic benefit cost (in millions):
For the six months ended June 30, 2004, we contributed $22 million to our domestic and international pension plans. We expect to contribute an additional $23 million in the second half of 2004.
3. Discontinued Operations
On December 13, 2002, we completed the sale of our precision lens business to 3M Company ("3M") for cash proceeds up to $850 million, of which $50 million was deposited in an escrow account. 3M has notified Corning that 3M believes it has certain claims arising out of the representations and warranties made by Corning in connection with the sale of the precision lens business to 3M. The parties are attempting to resolve such claims. At June 30, 2004, approximately $49 million remained in the escrow account. No other gain on the sale of the precision lens business will be recognized until such claims are resolved. Corning and 3M are negotiating a settlement agreement that will likely result in Corning receiving less than half of the amount in escrow.
--------------------------------------------------- --------------------------------------------------- ------------------------------ Pension benefits Pos tretirement benefits --------------------------------------------------- --------------------------------------------------- ------------------------------ Three months Six months Three mon ths Six months ended J une 30, ended June 30, ended June 30, ended June 30, ---------- ---------- -------------------- ------------- ------- -------------------- 2004 2003 2004 2003 2004 2003 2004 2003 --------------------------------------------------- --------------------------------------------------- ------------------------------ Service cost $ 9 $ 11 $ 20 $ 19 $ 2 $ 2 $ 4 $ 4 Interest cost 28 44 66 74 11 12 24 24 Expected return on plan assets (32) (52) (75) (88) Amortization of net loss 5 1 11 1 2 1 5 2 Amortization of prior service cost 2 3 4 6 (1) (1) (3) (2) ---------- --------------------------------------------------- ------------------------------ Net periodic benefit expense 12 7 26 12 14 14 30 28 Curtailment loss (gain) 8 8 (5) (5) Special termination benefits 14 14 9 9 ---------- --------------------------------------------------- ------------------------------ Total expense $ 12 $ 29 $ 26 $ 34 $ 14 $ 18 $ 30 $ 32 --------------------------------------------------- --------------------------------------------------- ------------------------------

4. Restructuring, Impairment and Other Charges and (Credits)
2004 Restructuring Actions
Second Quarter In the second quarter of 2004, we recorded credits of $34 million ($14 million after-tax and minority interest) included in restructuring, impairment and other charges and (credits). A summary of these credits follows:
. We recorded a $25 million gain ($8 million after-tax and minority interest) related to proceeds in excess of assumed salvage values for assets of Corning Asahi Video Products Company (CAV) that were previously impaired but later sold to a third party in China. CAV was our 51% owned affiliate that manufactured glass panels and funnels for use in conventional tube televisions and which was shut down in 2003. In July 2004, we substantially completed the sale of CAV's assets and received proceeds of $7 million ($2 million after-tax and minority interest). . We recorded a $9 million credit ($6 million after-tax) comprised of reversals of reserves related to prior years' restructuring charges. The reversals included $2 million related to employee separation costs that were less than estimated, $5 million related to exit costs that were less than estimated, and $2 million related to assets that were previously impaired.
First Quarter In the first quarter of 2004, we recorded net restructuring, impairment and other charges and (credits) totaling $34 million ($21 million after-tax and minority interest). A summary of these charges and credits follow:
. We recorded $39 million of accelerated depreciation and $1 million of exit costs relating to the final shutdown of our semiconductor materials manufacturing facility in Charleston, South Carolina, which we announced in the fourth quarter of 2003. . We recorded credits of $6 million, primarily related to proceeds in excess of assumed salvage values for assets that were previously impaired.
The following table details the charges, credits and balances of the restructuring liabilities as of and for the six months ended June 30, 2004 (in millions):
--------------------------------------------------- --------------------------------------------------- ------------------------------ Six months Remaining ended June Revisions Net Cash reserve at Jan uary 1, 30, 2004 to existing charges/ payments June 30, 2004 charge plans (reversals ) in 2004 2004 --------------------------------------------------- --------------------------------------------------- ------------------------------ Restructuring charges: Employee related costs $ 78 $ (2) $ (2) $ (41) $ 35 Other charges 108 $ 1 (5) (4) (15) 89 -- --------------------------------------------------- -------------------------- Total restructuring charges $ 186 $ 1 $ (7) $ (6) $ (56) $ 124 -- --------------------------------------------------- -------------------------- Impairment of long-lived assets: Assets to be disposed of by sale or abandonment $ (33) $ (33) Other: Accelerated depreciation $ 39 $ 39 ---------------------------------------- -- Total restructuring, impairment and other charges and (credits) $ 40 $ (40) Tax benefit and minority interest (15) 22 $ 7 ---------------------------------------- -- Restructuring, impairment and other charges and (credits), net $ 25 $ (18) $ 7 --------------------------------------------------- --------------------------------------------------- ------------------------------

Cash payments for employee related costs will be substantially complete by the end of 2005, while payments for exit activities will be substantially completed by the end of 2007. As of June 30, 2004, all of the 1,975 employees from the 2003 restructuring plans have been separated.
2003 Restructuring Actions
Second Quarter In the second quarter of 2003, we recorded net restructuring, impairment and other charges and (credits) totaling $49 million ($3 million after-tax and minority interest). A summary of these charges and credits follows:
. a charge of $54 million ($15 million after-tax and minority interest) related to the shut down of CAV,
. a charge of $33 million ($22 million after-tax) related to the exit of the photonics business,
. a charge of $38 million ($25 million after-tax) related to restructuring and impairment actions in the Telecommunications segment and administrative staffs, and . a credit of $76 million ($59 million after-tax) related to prior years' restructuring and impairment charges, primarily in the Telecommunications segment.
First Quarter In the first quarter of 2003 we recorded net restructuring, impairment and other charges and (credits) totaling $51 million ($12 million after-tax and minority interest). A summary of these charges and credits follows:
. a $17 million ($11 million after-tax) charge associated with the discontinuance of optical switching, which was a photonic product, due to the downturn in the telecommunications industry. The charge included $13 million for employee separation costs and $4 million for asset impairments related to equipment, . a $5 million ($3 million after-tax) charge for other than temporary declines in certain cost investments in the Telecommunications segment, . a $33 million ($21 million after-tax) reversal of prior years' charges related to revised cost estimates of existing restructuring plans, of which $24 million related to employee separation and exit costs which were less than estimated, while $9 million related to proceeds in excess of assumed salvage values for assets that were previously impaired, and . a $62 million ($19 million after-tax and minority interest) asset impairment charge related to CAV.
The following table details the charges, credits and balances of the restructuring reserves as of June 30, 2003 (in millions):
--------------------------------------------------- --------------------------------------------------- ------------------------------ S ix months Six months en ded Remaining e nded June Reversals Net June 30, 20 03 Cash reserve at January 1, 30, 2003 to existing charges/ Non-cash payments June 30, 2003 charge plans (reversals) charges in 2003 2003 --------------------------------------------------- --------------------------------------------------- ------------------------------ Restructuring charges: Employee related costs $ 273 $ 81 $ (49) $ 32 $ (27) $ (124) $ 154 Other charges 132 33 (15) 18 (19) 131 ------------ --------------------------------------------------- ------------------------- Total restructuring charges $ 405 $ 114 $ (64) $ 50 $ (27) $ (143) $ 285 ------------ --------------------------------------------------- ------------------------- Impairment of long-lived assets: Assets to be held and used $ 62 $ 62 Assets to be disposed of by sale or abandonment 28 $ (45) (17) Cost investments 5 5 ------------------------------------ Total impairment charges $ 95 $ (45) $ 50 ------------------------------------ Total restructuring and impairment charges and credits $ 209 $ (109) $ 100 Tax benefit and minority interest (114) 29 (85) ------------------------------------ Restructuring, impairment and other charges and credits, net $ 95 $ (80) $ 15 --------------------------------------------------- --------------------------------------------------- ------------------------------

5. Asbestos Settlement
On March 28, 2003, we announced that we had reached agreement with the representatives of asbestos claimants for the settlement of all current and future non-premises asbestos claims against us and Pittsburgh Corning Corporation (PCC), which might arise from PCC products or operations.
The agreement is expected to be incorporated into a settlement fund as part of a reorganization plan for PCC. The plan was submitted to the federal bankruptcy court at the end of 2003, received a favorable vote from creditor classes in the first quarter of 2004, but remains subject to a number of contingencies. The Bankruptcy Court has set a schedule for briefing leading to final arguments in November 2004. We will make our contributions to the settlement trust under the agreement after the plan is approved, becomes effective and is no longer subject to appeal.
When the plan becomes effective, our settlement will require the contribution of our equity interest in PCC, our one-half equity interest in Pittsburgh Corning Europe N.V. (PCE), and 25 million shares of our common stock. The common stock will be marked-to-market each quarter until the settlement plan is approved, thus resulting in adjustments to income and the settlement liability as appropriate. The agreement also includes the contribution of cash payments with a current value of $140 million over six years beginning one year after the plan becomes effective. We may accelerate a substantial portion of the payments to as early as 2005, as needed, to maximize the related tax benefits. In addition, we will assign insurance policy proceeds from our primary insurance and a portion of our excess insurance as part of the settlement.
The following summarizes the charges we have recorded to reflect the initial settlement and to mark-to-market the value of our common stock:
The minimal tax effect on the charges for the three and six months ended June 30, 2004 reflects the fact that the cumulative asbestos settlement charge recorded to date is in excess of the net amount realizable for tax purposes. Beginning with the first quarter of 2003 and through June 30, 2004, we have recorded charges of $479 million ($327 million after-tax) to reflect the initial settlement and to mark-to-market the value of our common stock.
The carrying value of our stock in PCE and the fair value of 25 million shares of our common stock as of June 30, 2004 ($348 million) have been reflected in other accrued liabilities. The remaining $140 million, representing the net present value of the cash payments discounted at 5.5%, is recorded in other liabilities. See Part II-Other Information, Item 1. Legal Proceedings for a history of this matter.
Three months Six months ended June 30, ended June 30, --------------------- ------------------------ 2004 2003 2004 2003 --------------------------------------------------- ----------------------------- Pretax charge $ 47 $ 39 $ 66 $ 337 After-tax charge $ 45 $ 24 $ 63 $ 216 --------------------------------------------------- -----------------------------
6. Inventories (in millions) --------------------------------------------------- ----------------------------- June 30, 2004 December 31, 2003 --------------------------------------------------- ----------------------------- Finished goods $ 127 $ 141 Work in process 146 113 Raw materials and accessories 144 138 Supplies and packing materials 84 75 --------------------------------------------------- ----------------------------- Total inventories $ 501 $ 467 --------------------------------------------------- -----------------------------

7. Income Taxes
Our (provision) benefit for income taxes and the related effective (income tax) benefit rates were as follows (in millions):
The effective (income tax) benefit rate for the three and six months ended June 30, 2004 and 2003 differed from the U.S. statutory income tax rate of 35% due to the impact of restructuring, impairment and other charges and (credits), asbestos settlement and debt transactions.
8. Investments
At June 30, 2004 and December 31, 2003, our total investments accounted for by the equity method were $1.1 billion and $978 million, respectively. Summarized results of operations of our two significant equity method investments follow (in millions):
Samsung Corning Precision Glass Co., Ltd. (Samsung Corning Precision)
Our investment in Samsung Corning Precision, a 50%-owned South Korea based manufacturer of liquid crystal display glass, was $395 million and $299 million at June 30, 2004 and December 31, 2003, respectively.
Corning and Samsung Corning Precision routinely enter into purchase and sale transactions for glass. Sales to Samsung Corning Precision were insignificant for the quarter ended June 30, 2004 and $7 million for the quarter ended June 30, 2003. Sales to Samsung Corning Precision were $6 million and $12 million for the six months ended June 30, 2004 and 2003, respectively. Purchases from Samsung Corning Precision totaled $15 million and $5 million for the quarters ended June 30, 2004 and 2003, and $37 million and $8 million for the six months ended June 30, 2004 and 2003, respectively. Balances due to and from Samsung Corning Precision were immaterial at June 30, 2004 and December 31, 2003. Profits related to inventories on hand at the end of a period are eliminated during consolidation.
Dow Corning Corporation (Dow Corning)
--------------------------------------------------- --------------------------------------------------- ------------------------------ Three months Six months ended June 30, ended June 30, ------------------------ ------------ ------------- 2004 2003 2004 2003 --------------------------------------------------- --------------------------------------------------- ------------------------------ (Provision) benefit for income taxes $ (24) $ 34 $ (12) $ 178 Effective (income tax) benefit rate (66.7)% 22.8% (42.9)% 30.0% --------------------------------------------------- --------------------------------------------------- ------------------------------
--------------------------------------------------- --------------------------------------------------- ------------------------------ Three months Six months ended June 30, ended June 30, ------------------------ ------------ -------------- 2004 2003 2004 2003 --------------------------------------------------- --------------------------------------------------- ------------------------------ Statement of Operations: Net sales $ 264 $ 134 $ 499 $ 241 Gross profit $ 205 $ 94 $ 384 $ 170 Net income $ 145 $ 64 $ 271 $ 114 --------------------------------------------------- --------------------------------------------------- ------------------------------
--------------------------------------------------- --------------------------------------------------- ------------------------------ Three months Six months ended June 30, ended June 30, ------------------------ ------------ -------------- 2004 2003 2004 2003 --------------------------------------------------- --------------------------------------------------- ------------------------------ Statement of Operations: Net sales $ 852 $ 713 $ 1,666 $ 1,371 Gross profit $ 278 $ 221 $ 508 $ 406 Net income $ 36 $ 54 $ 88 $ 90 --------------------------------------------------- --------------------------------------------------- ------------------------------

Our investment in Dow Corning, a 50%-owned U.S. based manufacturer of silicone products, was $207 million and $185 million at June 30, 2004 and December 31, 2003, respectively.
During the second quarter of 2004, Dow Corning recorded charges related to restructuring actions and adjustments to interest liabilities recorded on its emergence from bankruptcy. Our equity earnings included $21 million related to these charges. Subject to future rulings by the bankruptcy court and potential changes in estimated bankruptcy-related liabilities, it is possible that Dow Corning may record bankruptcy-related charges in the future. For information related to Dow Corning litigation and bankruptcy proceedings see Part II-Other Information, Item 1. Legal Proceedings.
9. Goodwill and Other Intangible Assets
The changes in the carrying amount of goodwill for the six months ended June 30, 2004 follow (in millions):
We must exercise judgment in assessing the recoverability of goodwill. See Risk Factors and Critical Accounting Estimates in our 2003 Annual Report on Form 10-K for more information.
Other intangible assets follow (in millions):
Amortized intangible assets are primarily related to the Telecommunications segment.
Amortization expense related to these intangible assets is expected to be approximately $16 million in 2005, $11 million in 2006, $11 million in 2007, and insignificant thereafter.
--------------------------------------------------- --------------------------------------------------- ------------------------------ Te lecom- Display Unallocated mun ications Technologies and Other Total --------------------------------------------------- --------------------------------------------------- ------------------------------ Balance at January 1, 2004 $ 1,576 $ 9 $ 150 $ 1,735 Foreign currency translation (3) (3) Other (3) (3) --------------------------------------------------- --------------------------------------------------- ------------------------------ Balance at June 30, 2004 $ 1,570 $ 9 $ 150 $ 1,729 --------------------------------------------------- --------------------------------------------------- ------------------------------
--------------------------------------------------- --------------------------------------------------- ------------------------------ June 30, 2004 D ecember 31, 2003 -- --------------------------------------------------- -------------------------- Accumulated Accumulated G ross Amortization Net Gross Amortization Net --------------------------------------------------- --------------------------------------------------- ------------------------------ Amortized intangible assets: Patents and trademarks $ 144 $ 65 $ 79 $ 145 $ 57 $ 88 Non-competition agreements 112 99 13 113 89 24 Other 4 1 3 4 1 3 -- --------------------------------- --------- -------------------------- Total amortized intangible assets 260 165 95 262 147 115 Other intangible assets: Intangible pension assets 51 51 51 51 -- --------------------------------- --------- -------------------------- Total $ 311 $ 165 $ 146 $ 313 $ 147 $ 166 --------------------------------------------------- --------------------------------------------------- ------------------------------

10. Product Warranty Liability
Our product warranty reserves relate primarily to our Telecommunications segment. A reconciliation of the changes in the product warranty liability during the six months ended June 30 follows (in millions):
11. Long-Term Debt
During the second quarter of 2004, we issued 10 million shares of common stock and paid $9 million in cash in exchange for 97,500 of our 3.5% convertible debentures with a book value of $98 million. In accordance with SFAS No. 84, "Induced Conversions of Convertible Debt," we recorded a loss of $9 million ($9 million after-tax) reflecting the fair value of the cash paid and incremental shares issued beyond those required by the terms of the debentures. The increase in equity due to issuance of shares from treasury stock was $88 million.
During the first quarter of 2004, our long-term debt transactions included the following:
Issuance of Long-Term Debt
In March 2004, we issued $400 million of senior unsecured notes, of which $200 million aggregate principal amount of 5.90% notes mature on March 15, 2014 and $200 million aggregate principal amount of 6.20% notes mature on March 15, 2016. These senior unsecured notes were issued under our existing $5 billion universal shelf registration statement, which became effective in March 2001. We realized net proceeds of approximately $396 million from the issuance of these notes. We will pay interest semi-annually on these senior unsecured notes on March 15 and September 15.
Loss on Repurchases and Retirement of Debt, Net
3.5% convertible debentures During the first quarter of 2004, we issued 22 million shares of common stock and paid $24 million in cash in exchange for our 3.5% convertible debentures with a book value of $213 million resulting in a loss of $23 million ($21 million after-tax). Zero coupon convertible debentures During the first quarter of 2004, we repurchased and retired 150,000 zero coupon convertible debentures with a book value of $119 million in exchange for cash of $117 million. The gain on the transaction was offset by the write-off of the unamortized issuance costs.
12. Commitments and Contingencies
In 2003, we adopted the initial recognition and measurement provisions of FASB Interpretation No. 45 (FIN 45). We do not routinely provide significant third-party guarantees and, as a result, this interpretation has not had a material effect on our financial statements.
2004 2003 --------------------------------------------------- ----------------------------- Balance at January 1 $ 41 $ 64 Provision based on current year sales 4 1 Adjustments to liability existing on January 1 (4) (9) Foreign currency translation (1) 2 Settlements made during the current period (2) (8) ------ ----- Balance at June 30 $ 38 $ 50 --------------------------------------------------- -----------------------------

We provide financial guarantees and incur contingent liabilities in the form of purchase price adjustments related to attainment of milestones, stand-by letters of credit and performance bonds. These guarantees have various terms, and none of these guarantees are individually significant. We have also agreed to provide a credit facility related to Dow Corning as discussed in Note 10 to the Consolidated Financial Statements in our 2003 Annual Report on Form 10-K. Corning's obligation to fund the Dow Corning $150 million credit facility may be triggered if in the next ten years Dow Corning is unable to meet its obligations to fund the settlement payments required under its Bankruptcy Plan. Corning believes that Dow Corning has sufficient cash flow and liquidity to meet its current obligations. As of June 30, 2004, we were contingently liable for the items described above totaling $352 million, compared with $445 million at December 31, 2003. We believe a significant majority of these guarantees and contingent liabilities will expire without being funded.
From time to time, we are subject to uncertainties and litigation and are not always able to predict the outcome of these items with assurance. Various legal actions, claims and proceedings are pending against us, including those arising out of alleged product defects, shareholder matters, product warranties, patents, asbestos and environmental matters. These issues are discussed in Part II-Other Information, Item 1. Legal Proceedings of this Form 10-Q.
13. Comprehensive Income (Loss)
Comprehensive income (loss), net of tax, was as follows (in millions):
14. Earnings (Loss) Per Common Share
The reconciliation of the amounts used in the basic and diluted earnings (loss) per common share computations was as follows (in millions, except per share amounts):
--------------------------------------------------- --------------------------------------------------- -------- Thre e months Six months ended June 30, ended June 30, ---------- -------------- ----------------------- - 2004 2003 2004 2003 --------------------------------------------------- --------------------------------------------------- -------- Net income (loss) $ 108 $ (22) $ 163 $ (227 ) Other comprehensive income (5) (9) (3) 28 --------------------------------------------------- --------------------------------------------------- -------- Total comprehensive income (loss) $ 103 $ (31) $ 160 $ (199 ) --------------------------------------------------- --------------------------------------------------- --------
--------------------------------------------------- --------------------------------------------------- --------------------------- Three months ended June 30, ---- --------------------------------------------------- --------------------------- 2004 2003 ---- --------------------------------- ------------- --------------------------- Net Weighted- Per Share Net Weighted- Per Share Inco me Average Shares Amount Loss Ave rage Shares Amount --------------------------------------------------- --------------------------------------------------- --------------------------- Basic earnings (loss) per common share $ 108 1,383 $ 0.08 $ (22) 1,244 $ (0.02) --------------------------------------------------- --------------------------------------------------- --------------------------- Effect of dilutive securities: Stock options 34 7% mandatory convertible preferred stock 35 3.5% convertible debentures 2 43 --------------------------------------------------- --------------------------------------------------- --------------------------- Diluted earnings (loss) per common share $ 110 1,495 $ 0.07 $ (22) 1,244 $ (0.02) --------------------------------------------------- --------------------------------------------------- ---------------------------

The following potential common shares were excluded from the calculation of diluted earnings (loss) per common share due to their anti-dilutive effect or, in the case of stock options, because their exercise price was greater than the average market price for the periods presented (in millions):
15. Operating Segments
SFAS No. 131, "Disclosures about Segments of an Enterprise and Related Information," set standards for reporting information regarding operating segments in financial statements. Operating segments are defined as components of an enterprise about which separate financial information is available that is evaluated regularly by the chief operating decision maker, or decision making group, in deciding how to allocate resources and in assessing performance. Our Chief Operating Decision-Making group (CODM) is comprised of the chairman and chief executive officer, vice chairman and chief financial officer, president and chief operating officer, president-Corning Technologies, executive vice president-chief administrative officer and executive vice president-chief technology officer.
Effective with the first quarter of 2004, we revised our reportable operating segments from Telecommunications and Technologies to Telecommunications, Display Technologies, Environmental Technologies and Life Sciences. Prior year information has been restated to conform to this revision. The following provides a brief description of the products and markets served by each reportable segment:
. Telecommunications - manufactures optical fiber and cable and hardware and equipment components for the worldwide telecommunications industry; . Display Technologies - manufactures liquid crystal display glass substrates for flat panel displays; . Environmental Technologies - manufactures ceramic substrates and filters for automobile and diesel applications; and . Life Sciences - manufactures glass and plastic consumables for scientific applications.
--------------------------------------------------- --------------------------------------------------- ----------------------------- Six months ended June 30, -- --------------------------------------------------- ----------------------------- 2004 2003 -- ------------------------------------ ----------- ----------------------------- Net Weighted- Per Share Net Weighted- Per Share I ncome Average Shares Amount Loss A verage Shares Amount --------------------------------------------------- --------------------------------------------------- ----------------------------- Basic earnings (loss) per common share $ 163 1,371 $ 0.12 $ (227) 1,222 $ (0.19) --------------------------------------------------- --------------------------------------------------- ----------------------------- Effect of dilutive securities: Stock options 36 7% mandatory convertible preferred stock 39 --------------------------------------------------- --------------------------------------------------- ----------------------------- Diluted earnings (loss) per common share $ 163 1,446 $ 0.11 $ (227) 1,222 $ (0.19) --------------------------------------------------- --------------------------------------------------- -----------------------------
--------------------------------------------------- --------------------------------------------------- ------------------------------ Three months Six months ended June 30, ended June 30, ------------------------ ---------------------- 2004 2003 2004 2003 --------------------------------------------------- --------------------------------------------------- ------------------------------ Potential common shares excluded from the calculati on of diluted earnings (loss) per common share: Stock options 15 12 7% mandatory convertible preferred stock 77 77 3.5% convertible debentures 69 50 69 4.875% convertible notes 6 6 6 6 Zero coupon convertible debentures 3 11 3 12 ------------------------------------ ------------------------- Total 9 178 59 176 ==================================== ========================= Stock options excluded from the calculation of dilu ted earnings (loss) per share because the exercise pr ice was greater than the average market price of the common shares 58 91 57 90 --------------------------------------------------- --------------------------------------------------- ------------------------------

The change in our segment presentation reflects how Corning's CODM allocates resources and assesses the performance of its businesses. Specifically, the CODM is significantly increasing its level of review of the Display Technologies segment due to the recent increase in growth and capital spending in that segment. In addition, the CODM is increasing its review of the Environmental Technologies and Life Sciences segments to strengthen the overall balance and stability of Corning's portfolio of businesses.
All other operating segments that do not meet the quantitative threshold for separate reporting (e.g., specialty materials, ophthalmic products and conventional video components), certain corporate investments (e.g., Dow Corning, Samsung Corning Company Ltd. and Steuben), discontinued operations and unallocated expenses have been grouped as "Unallocated and Other". Unallocated expenses include research and other expenses related to new business development; gains or losses on repurchases and retirement of debt; charges related to the asbestos litigation; and restructuring and impairment charges related to the corporate research and development or staff organizations. Unallocated and Other also represents the reconciliation between the totals for the reportable segments and our consolidated total.
We prepare the financial results for our operating segments on a basis that is consistent with the manner in which we internally disaggregate financial information to assist in making internal operating decisions. We include the earnings of equity affiliates that are closely associated with our operating segments in the respective segment's net income. We have allocated certain common expenses among segments differently than we would for stand-alone financial information prepared in accordance with GAAP. These expenses include interest, taxes and corporate functions. Segment net income may not be consistent with measures used by other companies. The accounting policies of our operating segments are the same as those applied in the consolidated financial statements.

--------------------------------------------------- --------------------------------------------------- ------------------------------ Operating Segments Tele com- Display Environmental Life Unallocated Consolidated (in millions) munic ations Technologies Technologies Sciences and Other Total --------------------------------------------------- --------------------------------------------------- ------------------------------ For the three months ended June 30, 2004 Net sales $ 392 $ 277 $ 141 $ 79 $ 82 $ 971 Research, development and engineering expenses (1) $ 23 $ 19 $ 21 $ 9 $ 13 $ 85 Restructuring, impairment and other charges and (credits) (2) $ (1) $ (33) $ (34) Interest expense (3) $ 16 $ 11 $ 5 $ 2 $ 3 $ 37 Benefit (provision) for income taxes $ 11 $ (32) $ (2) $ (2) $ 1 $ (24) (Loss) income before minority interests and equity (losses) earnings (4)(5) $ (21) $ 64 $ 4 $ 5 $ (40) $ 12 Minority interests (6) (11) (11) Equity in earnings of associated companies, net of impairments 71 36 107 ---- --- -------- -------- ------- -------- -------- Net (loss) income $ (21) $ 135 $ 4 $ 5 $ (15) $ 108 --------------------------------------------------- --------------------------------------------------- ------------------------------ For the three months ended June 30, 2003 Net sales $ 347 $ 135 $ 117 $ 72 $ 81 $ 752 Research, development and engineering expenses (1) $ 32 $ 12 $ 20 $ 7 $ 14 $ 85 Restructuring, impairment and other charges and (credits) (2) $ (19) $ 68 $ 49 Interest expense (3) $ 22 $ 9 $ 5 $ 2 $ 4 $ 42 Benefit (provision) for income taxes $ 5 $ (11) $ (2) $ (2) $ 44 $ 34 (Loss) income before minority interests and equity earnings (4)(5) $ (53) $ 22 $ 6 $ 4 $ (94) $ (115) Minority interests (6) 33 33 Equity in (losses) earnings of associated companies, net of impairments (7) (8) 31 (3) 40 60 ---- --- -------- -------- ------- -------- -------- Net (loss) income $ (61) $ 53 $ 3 $ 4 $ (21) $ (22) --------------------------------------------------- --------------------------------------------------- ------------------------------ For the six months ended June 30, 2004 Net sales $ 704 $ 507 $ 282 $ 158 $ 164 $ 1,815 Research, development and engineering expenses (1) $ 48 $ 35 $ 41 $ 18 $ 27 $ 169 Restructuring, impairment and other charges and (credits) (2) $ (5) $ 5 Interest expense (3) $ 32 $ 22 $ 10 $ 3 $ 6 $ 73 Benefit (provision) for income taxes $ 34 $ (58) $ (5) $ (5) $ 22 $ (12) (Loss) income before minority interests and equity (losses) earnings (4)(5) $ (68) $ 117 $ 10 $ 10 $ (109) $ (40) Minority interests (6) 1 (12) (11) Equity in earnings of associated companies, net of impairments 3 136 75 214 ---- --- -------- -------- ------- -------- -------- Net (loss) income $ (64) $ 253 $ 10 $ 10 $ (46) $ 163 --------------------------------------------------- --------------------------------------------------- ------------------------------ For the six months ended June 30, 2003 Net sales $ 699 $ 252 $ 232 $ 145 $ 170 $ 1,498 Research, development and engineering expenses (1) $ 70 $ 24 $ 41 $ 14 $ 29 $ 178 Restructuring, impairment and other charges and (credits) (2) $ (28) $ 128 $ 100 Interest expense (3) $ 43 $ 18 $ 10 $ 4 $ 7 $ 82 Benefit (provision) for income taxes $ 30 $ (17) $ (4) $ (6) $ 175 $ 178 (Loss) income before minority interests and equity (losses) earnings (4)(5) $ ( 113) $ 35 $ 9 $ 12 $ (359) $ (416) Minority interests (6) 70 70 Equity in (losses) earnings of associated companies, net of impairments (7) (11) 55 (1) 76 119 ---- --- -------- -------- ------- -------- -------- Net (loss) income $ ( 124) $ 90 $ 8 $ 12 $ (213) $ (227) --------------------------------------------------- --------------------------------------------------- ------------------------------

(1) Non-direct research, development and engineering expenses are allocated based upon direct project spending for each segment. (2) Related tax (expense) benefit follows: For the three months ended June 30, 2004: $0, $0, $0, $0, $(7) and $(7). For the three months ended June 30, 2003: $2, $0, $0, $0, $16 and $18. For the six months ended June 30, 2004: $(1), $0, $0, $0, $8 and $7. For the six months ended June 30, 2003: $(2), $0, $0, $0, $28 and $26. (3) Interest expense is allocated to segments based on a percentage of segment net operating assets. Consolidated subsidiaries with independent capital structures do not receive additional allocations of interest expense. (4) Many of Corning's administrative and staff functions are performed on a centralized basis. Where practicable, Corning charges these expenses to segments based upon the extent to which each business uses a centralized function. Other staff functions, such as corporate finance, human resources and legal are allocated to segments primarily as a percentage of sales. (5) (Loss) income before minority interests and equity (losses) earnings includes an allocation of depreciation of corporate property, plant and equipment not specifically identifiable to a segment. Related depreciable assets are not allocated to segment assets. (6) Minority interests include the following restructuring, impairment and other charges and (credits): For the three and six months ended June 30, 2004, gains from the sale of assets of Corning Asahi Video Products Company in excess of assumed salvage value of $13 and $14, respectively. For the three and six months ended June 30, 2003, charges related to impairment of long-lived assets of Corning Asahi Video Products Company of $28 and $59, respectively. (7) Equity in (losses) earnings of associated companies, net of impairments includes $7 related to impairments of equity investments in the Telecommunications segment for the three and six months ended June 30, 2003.
A reconciliation of reportable segment net income (loss) to consolidated net income (loss) follows:
(1) Non-reportable operating segments net income (loss) includes the results of non-reportable operating segments. (2) Non-segment loss and other includes the results of non-segment operations and other corporate activities. (3) Benefit for income taxes includes taxes associated with non-segment restructuring, impairment and other charges. (4) Equity in earnings of associated companies, net of impairments includes amounts derived from corporate investments, primarily Dow Corning Corporation.
16. Subsequent Events
On July 1, 2004, Corning received notice from substantially all of the holders of its $100 million 7.625% debentures that they had exercised their put options which were to expire July 2, 2004. Settlement on these debentures will occur in the third quarter of 2004. These debentures are classified as loans payable as of June 30, 2004 and December 31, 2003.
On July 8, 2004, Corning announced the sale of its frequency control business, which is part of the Telecommunications segment. The frequency control business had 2003 annual sales of $76 million. We expect to close the transaction in the third quarter of 2004 and recognize a pretax loss approximating $25 million.
Three months Six months ended June 30, e nded June 30, ------------------------ ------- ------------------ 2004 2003 2004 2003 --------- --------- ------- -- ---------- Net income (loss) of reportable segments $ 123 $ (1) $ 2 09 $ (14) Non-reportable operating segments net income (loss) (1) 19 (26) 1 (47) Unallocated amounts: Non-segment loss and other (2) (4) (14) (7) (29) Non-segment restructuring, impairment and other (charges) and credits 4 (10) 4 (10) Asbestos settlement (47) (39) ( 66) (337) Interest income 4 9 10 17 (Loss) gain on repurchases of debt (9) 13 ( 32) 17 Benefit for income taxes (3) 1 21 3 133 Equity in earnings of associated companies, net of impairments (4) 17 25 41 43 --------- --------- ------- -- --------- Net income (loss) $ 108 $ (22) $ 1 63 $ (227) ========= ========= ======= == =========

On July 21, 2004, Corning and Chi Mei Optoelectronics Corp. (Chi Mei) entered into a long-term purchase and supply agreement of large size LCD glass. The agreement is a five-year contract by which the Display Technologies segment will supply Generation 5.5 glass to Chi Mei's new LCD fabrication facility in Tainan, Taiwan. The contract calls for significant quantities of LCD glass to be supplied to Chi Mei starting in 2005. As part of the agreement, Chi Mei will make advance cash deposits of $510 million to Corning in several installments in 2004 and 2005 for a portion of the contracted glass to be purchased.
The key terms of this contract follow:
. The customer will make cash deposits totaling $510 million to be paid in installments. The first installment of $102 million deposit was received in July 2004. Corning will receive a second $102 million deposit in the fourth quarter of 2004. The customer will make four remaining deposits of $76.5 million on a quarterly basis through the fourth quarter of 2005.
. Upon receipt of the cash deposits made by the customer, Corning will record a customer deposit liability, which will be applied in the form of credits against future glass purchases over the life of the contract.
. Corning will supply up to maximum agreed upon quantities of glass substrates to the customer over a five-year period beginning in the first quarter of 2005 through the fourth quarter of 2009.
. As glass is shipped to the customer, Corning will recognize revenue at the selling price and issue a credit memo for an agreed amount of the customer deposit liability. These credit memos will be applied against receivables resulting from the sale of glass to Chi Mei and will thus reduce operating cash flows over the five year period of the contract.
. In the event the customer does not make all customer deposit installment payments or elects not to purchase the agreed upon quantities of glass substrates, subject to specific conditions outlined in the agreement, Corning may retain certain amounts of the customer deposit. Likewise, if Corning does not deliver glass substrates to Chi Mei, subject to specific conditions outlined in the agreement, Corning may be required to return certain amounts of the customer deposit.

ITEM 2. MANAGEMENT'S DISCUSSION AND ANALYSIS OF FIN ANCIAL CONDITION AND RESULTS OF OPERATIONS
Overview
We continue to focus on three key priorities in 2004: protect our financial health, improve our profitability, and invest in the future. We continue to make progress towards all three in 2004.
Financial Health During the second quarter of 2004, we continued to make strides in improving our balance sheet and delivering positive cash flows from operating activities. The following are the highlights for the quarter:
. As part of our ongoing debt reduction program, we retired $98 million of our 3.5% convertible debentures.
. We reduced our days sales outstanding to 53 days, primarily as a result of more timely settlement of our accounts receivable balances relating to customers in the Display Technologies segment. . We improved our total debt to capital ratio to 31% at June 30, 2004 compared to 34% at December 31, 2003. . We generated sufficient cash flows from operating activities for the three and six months ended June 30, 2004 to cover the capital expenditures for those respective periods. . We ended the quarter with $1.6 billion in cash, cash equivalents, and short-term investments at June 30, 2004. This represents an increase of approximately $300 million compared to our balance at December 31, 2003, primarily due to the issuance of $400 million senior unsecured notes in the first quarter of 2004.
Profitability For the three months ended June 30, 2004, we generated net income of $108 million, or $0.07 per share. This represents an improvement of $130 million, or $0.09 per share, compared to the prior year quarter. This improvement was primarily driven by the growth of our Display Technologies segment and the impact of our restructuring actions, most noticeably in the Telecommunications segment. For the six months ended June 30, 2004, our net income improved by $390 million, or $0.30 per share, compared to the prior year period. The drivers for this improvement include the same items identified for the three months ended comparison, as well as the lower charges incurred in 2004 related to the asbestos settlement.
Investing in our Future We continue to invest in a wide array of technologies, with our focus being glass substrates for active matrix liquid crystal displays (LCDs), diesel filters and substrates in response to tightening emissions control standards, and optical fiber and cable and hardware and equipment that will enable fiber-to-the-premises. Our research, development and engineering expenses were 9% of sales for the three and six months ended June 30, 2004. This was down from the respective periods ended June 30, 2003, but we believe our current spending levels are adequate to enable us to execute our growth strategies.
Our capital expenditures are primarily focused on expanding manufacturing capacity for liquid crystal display (LCD) glass substrates in the Display Technologies segment and diesel products in the Environmental Technologies segment. Total capital expenditures for the three and six months ended June 30, 2004 were $168 million and $302 million, respectively. Of these amounts, $127 million and $225 million, respectively, were directed toward the Display Technologies segment. In order to keep pace with the LCD market expansion, and due to faster than anticipated cash payments related to certain construction projects in Taiwan, we have increased our 2004 forecasted consolidated capital spending to $950 million to $1 billion. Of this amount, $750 million to $800 million will be directed toward expanding our manufacturing capacity in the Display Technologies segment.

RESULTS OF CONTINUING OPERATIONS
Selected highlights for the second quarter follow (dollars in millions):
Net Sales Net sales increased 29%, or $219 million, for the three months ended June 30, 2004, compared to the prior year quarter. The primary drivers of this growth were the continued high demand for glass substrates in our Display Technologies segment and demand for products in our Telecommunications segment due to general increases in network spending, particularly in North America and Europe. For the six months ended June 30, 2004, our net sales increased $317 million, or 21%, compared to the prior year period. The growth in the Display Technologies segment was the primary driver. Strong performance in the Environmental Technologies segment, for both automotive and diesel products, as well as our other operating segments more than offset the sales decreases resulting from our exiting of the conventional video and photonic technologies businesses. Movements in foreign exchange rates, primarily the Japanese Yen and Euro, did not have a significant impact on sales for the three and six months ended June 30, 2004, compared to their respective 2003 periods.
Gross Margin As a percentage of net sales, gross margin improved 12 percentage points for the three months ended June 30, 2004, compared to the prior year quarter. For the six months ended June 30, 2004, the improvement was 11 percentage points compared to the prior year period. The improvement in both periods can be attributed to: (a) lower depreciation and fixed costs due to the restructuring actions taken in 2003, most notably the exit of the conventional television businesses, and (b) revenue growth in the Display Technologies segment of 105% and 101% for the respective three and six month periods.
--------------------------------------------------- --------------------------------------------------- ------------------------------ Three months Six months ended June 30, ended June 30, ------------------------ ------------------------- 2004 2003 2004 2003 --------------------------------------------------- --------------------------------------------------- ------------------------------ Net sales $ 971 $ 752 $ 1,815 $ 1,498 Gross margin $ 346 $ 181 $ 646 $ 381 (gross margin %) 36% 24% 36% 25% Selling, general and administrative expenses $ 166 $ 148 $ 326 $ 300 (as a % of net sales) 17% 20% 18% 20% Research, development and engineering expenses $ 85 $ 85 $ 169 $ 178 (as a % of net sales) 9% 11% 9% 12% Restructuring, impairment and other charges and (cr edits) $ (34) $ 49 $ 100 (as a % of net sales) (4)% 7% 7% Asbestos settlement $ 47 $ 39 $ 66 $ 337 (as a % of net sales) 5% 5% 4% 22% Income (loss) before income taxes $ 36 $ (149) $ (28) $ (594) (as a % of net sales) 4% (20)% (2)% (40)% (Provision) benefit for income taxes $ (24) $ 34 $ (12) $ 178 (as a % of net sales) (2)% 5% (1)% 12% Equity in earnings of associated companies, net of impairments $ 107 $ 60 $ 214 $ 119 (as a % of net sales) 11% 8% 12% 8% Net income (loss) $ 108 $ (22) $ 163 $ (227) (as a % of net sales) 11% (3)% 9% (15)% --------------------------------------------------- --------------------------------------------------- ------------------------------

Selling, General and Administrative Expenses As a percentage of sales, selling, general and administrative expenses decreased 3 points and 2 points for the three and six months ended June 30, 2004, respectively, compared to the corresponding periods in 2003. For the three and six months ended June 30, 2004, selling, general and administrative expenses increased $18 million and $26 million, respectively, compared to the corresponding periods in 2003. These increases were related to general increases in compensation costs and additional headcount. The additional headcount is primarily to support the growth in the Display Technologies segment.
Research, Development and Engineering As a percentage of sales, research, development and engineering expenses decreased by 2 points and 3 points for the three and six months ended June 30, 2004, respectively, compared to the corresponding periods in 2003. The decline of $9 million in the six month period is reflective of the exit from the photonic technologies business in 2003 offset by increased spending in Display Technologies and Life Sciences to fund new product development.
Restructuring, Impairment and Other Charges and (Credits) Restructuring, impairment and other charges and (credits) was a credit of $34 million for the three months ended June 30, 2004 compared to a net charge of $49 million for the prior year quarter. For the six months ended June 30, 2004, charges and credits from restructuring and impairment actions have offset each other, compared to a net charge of $100 million for the prior year period. Refer to Note 4 to the Consolidated Financial Statements for additional information.
Asbestos Settlement For the three and six months ended June 30, 2004, we recorded charges of $47 million and $66 million, respectively, related to the quarterly mark-to-market of our common stock associated with the asbestos settlement agreement. For the three and six months ended June 30, 2003, we recorded charges of $39 million and $337 million, respectively, as part of our asbestos settlement, the latter of which included $298 million associated with the initial settlement. Refer to Note 5 to the Consolidated Financial Statements for additional information.
Income (Loss) Before Income Taxes For the three months ended June 30, 2004, we recognized $36 million of income before income taxes compared to a loss of $149 million for the prior year quarter. For the six months ended June 30, 2004, we incurred a loss before income taxes of $28 million compared to a loss of $594 million for the prior year period. For both the three and six month comparisons, the key drivers are outlined under Gross Margin, Restructuring, Impairment and Other Charges and (Credits), and Asbestos Settlement.
In addition to the above, the following had a material effect on the results of our income (loss) before income taxes:
Refer to Note 11 to the Consolidated Financial Statements and Corning's 2003 Annual Report on Form 10-K for additional information regarding the gains (losses) recognized on the repurchase and retirement of debt for the respective periods.
Income Taxes Our (provision) benefit for income taxes and the related effective (income tax) benefit rates were as follows (in millions):
--------------------------------------------------- --------------------------------------------------- ----------------------------- Three months Six months ended June 30, ended June 30, ------------------- ---------------------- 2004 2003 2004 2003 --------------------------------------------------- --------------------------------------------------- ----------------------------- (Loss) gain on repurchases and retirement of debt, net $ (9) $ 13 $ (32) $ 17 --------------------------------------------------- --------------------------------------------------- -----------------------------
--------------------------------------------------- --------------------------------------------------- -------------------- Three months Six m onths ended June 30, ended J une 30, ---------------------- ----------- ------------ 2004 2003 2004 2003 --------------------------------------------------- --------------------------------------------------- -------------------- (Provision) benefit for income taxes $ (24) $ 34 $ (12) $ 178 Effective (income tax) benefit rate (66.7)% 22.8% (42.9)% 30.0% --------------------------------------------------- --------------------------------------------------- --------------------

The effective (income tax) benefit rate for the three and six months ended June 30, 2003 and 2004 differed from the U.S. statutory income tax rate of 35%, due to the impact of restructuring, impairment and other charges and (credits), asbestos settlement and debt transactions.
At June 30, 2004, we have recorded gross deferred tax assets of approximately $2.0 billion with a valuation allowance of approximately $450 million. The valuation allowance is primarily attributable to the uncertainty regarding the realization of specific foreign and state tax benefits, net operating losses and tax credits. The net deferred tax assets of approximately $1.5 billion consist of a combination of domestic (U.S. federal, state and local) and foreign tax benefits for: (a) items which have been recognized for financial reporting purposes, but which will be reported on tax returns to be filed in the future, and (b) loss and tax credit carryforwards. We have performed the required assessment of positive and negative evidence regarding the realization of the net deferred tax assets in accordance with Statement of Financial Accounting Standards (SFAS) No. 109, "Accounting for Income Taxes," (SFAS No. 109). This assessment included the evaluation of scheduled reversals of deferred tax liabilities, estimates of projected future taxable income and tax planning strategies as well as related key assumptions, which are further described in Note 9 to the Consolidated Financial Statements in Corning's 2003 Annual Report on Form 10-K. We believe the key assumptions underlying our assessment continue to be appropriate. Although realization is not assured, based on our assessment, we have concluded that it is more likely than not that such assets, net of the existing valuation allowance, will be realized. Refer to the Risk Factors and Critical Accounting Estimates in our Annual Report on Form 10-K for additional information.
Equity Earnings For the three months ended June 30, 2004, equity earnings increased $47 million, or 78%, compared to the prior year quarter, primarily due to the strong performance of Samsung Corning Precision Glass Company, Ltd. (Samsung Corning Precision). For the six months ended June 30, 2004, equity earnings increased $95 million, or 80%, compared to the prior year period, primarily due to Samsung Corning Precision. A summary of equity earnings follows (in millions):
During the second quarter of 2004, Dow Corning Corporation (Dow Corning) recorded a restructuring charge and a charge to adjust interest liabilities due to court rulings on its emergence from bankruptcy. Our equity earnings in the second quarter of 2004 included $21 million related to these charges.
Refer to Note 8 to the Consolidated Financial Statements for additional information relating to Samsung Corning Precision and Dow Corning's operating results.
Net Income (Loss) As a result of the above, our net income (loss) and per share data were as follows (in millions, except per share amounts):
Three months Six months ended June 30, ended June 30, ------------------- ---------------------- 2004 2003 2004 2003 --------------------------------------------------- ----------------------------- Samsung Corning Precision $ 71 $ 31 $ 136 $ 55 Dow Corning 17 24 41 42 All other 19 5 37 22 ------ ------ ------- ------- Total equity earnings $ 107 $ 60 $ 214 $ 119 --------------------------------------------------- -----------------------------
--------------------------------------------------- --------------------------------------------------- ------------------------------ Three months Six months ended June 30, ended June 30, ------------------------- ---------------------------- 2004 2003 2004 2003 --------------------------------------------------- --------------------------------------------------- ------------------------------ Net income (loss) $ 108 $ (22) $ 163 $ (227) Basic earnings (loss) per common share $ 0.08 $ (0.02) $ 0.12 $ (0.19) Diluted earnings (loss) per common share $ 0.07 $ (0.02) $ 0.11 $ (0.19) Shares used in computing per share amounts: Basic earning (loss) per common share 1,383 1,244 1,371 1,222 Diluted earnings (loss) per common share 1,495 1,244 1,446 1,222 --------------------------------------------------- --------------------------------------------------- ------------------------------

OPERATING SEGMENTS
Effective with the first quarter of 2004, we revised our reportable operating segments from Telecommunications and Technologies to Telecommunications, Display Technologies, Environmental Technologies and Life Sciences. Prior year information has been restated to conform to this revision. The following provides a brief description of the products and markets served by each reportable segment:
. Telecommunications - manufactures optical fiber and cable and hardware and equipment components for the worldwide telecommunications industry; . Display Technologies - manufactures liquid crystal display glass substrates for flat panel displays; . Environmental Technologies - manufactures ceramic substrates and filters for automobile and diesel applications; and . Life Sciences - manufactures glass and plastic consumables for scientific applications.
The change in our segment presentation reflects how Corning's Chief Operating Decision Making group (CODM) allocates resources and assesses the performance of its businesses. Specifically, the CODM is significantly increasing its level of review of the Display Technologies segment due to the recent increase in growth and capital spending in that segment. In addition, the CODM is increasing its review of the Environmental Technologies and Life Sciences segments to strengthen the overall balance and stability of Corning's portfolio of businesses.
We prepare the financial results for our operating segments on a basis that is consistent with the manner in which we internally disaggregate financial information to assist in making internal operating decisions. We include the earnings of equity affiliates that are closely associated with our operating segments in the respective segment's net income. We have allocated certain common expenses among segments differently than we would for stand-alone financial information prepared in accordance with accounting principles generally accepted in the United States. These expenses include interest, taxes and corporate functions. Segment net income may not be consistent with measures used by other companies. The accounting policies of our operating segments are the same as those applied in the consolidated financial statements.
Telecommunications The following table provides net sales and other data for the Telecommunications segment (in millions):
For the three months ended June 30, 2004, sales increased by $45 million, or 13%, compared to the prior year quarter. This performance was led by sales in North America and Europe, primarily driven by general increases in network spending including demand from the fiber-to-the-premises build-out. For the comparable periods, fiber volumes were up 24% while pricing pressures continued resulting in declines of 9%. Movements in foreign exchange rates, primarily the Japanese Yen and Euro, did not have a significant impact on sales for the three months ended June 30, 2004, compared to the prior year quarter.
Three mont hs Six months ended June 30, ended June 30, ----------- --- --------------- 2004 2 003 2004 2003 --------------------------------------------------- ----------------------------- Net sales: Optical fiber and cable $ 192 $ 178 $ 341 $ 371 Hardware and equipment 200 154 363 295 Photonic technologies 15 33 ----- -- --- ----- ----- Total net sales $ 392 $ 347 $ 704 $ 699 ===== == === ===== ===== Net loss $ (21) $ (61) $ (64) $(124) ===== == === ===== ===== Segment net loss as a percentage of segment sales (5)% (1 8)% (9)% (18)% --------------------------------------------------- -----------------------------

For the six months ended June 30, 2004, sales increased $5 million compared to the prior year period. The strong results in the second quarter of 2004 were substantially offset by the impact of the 2003 exit of the photonic technologies business and a decline of fiber sales in Japan and China in the first quarter of 2004, compared to the prior year quarter. For the comparable six month periods, fiber volumes declined 2% and prices declined 10%. Movements in exchange rates for the comparable six month periods did not significantly impact sales.
The Telecommunications segment experienced losses for each of the periods presented. Performance improved for the respective comparable periods primarily due to the impact of the prior years' restructuring and impairment actions and the exit of the photonic technologies business.
During the second quarter of 2004, the Chinese Ministry of Commerce issued an anti-dumping preliminary determination asserting that Corning had dumped optical fiber in China during 2002 and 2003. The company is continuing to cooperate with the Chinese Ministry of Commerce to reach a final determination. Refer to Critical Accounting Policies and Estimates of this Form 10-Q for additional information regarding the preliminary determination.
Outlook: We expect sales in the third quarter of 2004 to be down from the second quarter of 2004, with fiber volumes declining between 10% and 15% and moderate pricing declines. We expect to see continued strength in North America and Europe, primarily due to seasonal buying patterns, but these will be offset by the impact of the recent China anti-dumping preliminary ruling. Display Technologies The following table provides net sales and other data for the Display Technologies segment (in millions):
For the three months ended June 30, 2004, sales increased $142 million, or 105%, compared to the prior year quarter. This performance was reflective of the overall LCD-market growth. For the second quarter of 2004, glass substrate volumes (measured in square feet of glass sold) increased approximately 80% as LCD panel makers brought on additional capacity during the quarter. Sales were also benefited by modest average price increases, primarily the result of a change in product mix as the market continues to trend toward large size glass substrates (generation 5 and above) which carry a higher selling price per square foot. The sales of the Display Technologies segment are largely Asian based and, as such, are susceptible to movements in the US dollar - Japanese Yen exchange rates. For the second quarter of 2004, sales benefited by approximately 7% from a weakening of the US dollar compared to the same period in 2003.
For the six months ended June 30, 2004, sales increased $255 million, or 101%, compared to the prior year period. The factors affecting the six-month performance are largely the same as those identified for the second quarter of 2004. For the comparable six month period, glass substrate volumes increased approximately 75%, average pricing increases were modest, and movements in the US dollar - Japanese Yen exchange rates benefited sales by approximately 9% compared to the same period in 2003.
Three months Six months ended J une 30, ended June 30, ------- ------- -------------- 2004 2003 2004 2003 --------------------------------------------------- ----------------------------- Sales $ 277 $ 135 $ 507 $ 252 Income before equity earnings $ 64 $ 22 $ 117 $ 35 Equity earnings of associated companies $ 71 $ 31 $ 136 $ 55 Net income $ 135 $ 53 $ 253 $ 90 Segment income before equity earnings as a percentage of segment sales 23% 16% 23% 14% Segment net income as a percentage of segment sales 49% 39% 50% 36% --------------------------------------------------- -----------------------------

For the three and six months ended June 30, 2004, income before equity earnings increased by more than 2.5 times compared to the prior quarter and more than tripled compared to the prior year period. For both periods, the key drivers were the impact of incremental volumes and efficiencies realized through the shift in production toward large size glass substrates. Movements in the U.S. dollar - Japanese Yen exchange rates did not have a significant impact on income before equity earnings for the three and six months ended June 30, 2004, compared to their respective 2003 periods. The increases in our equity earnings from Samsung Corning Precision for the periods presented were largely driven by the same factors identified for our wholly-owned business.
The Display Technologies segment manufactures and sells glass substrates to a concentrated customer base comprised of LCD panel makers primarily located in Japan and Taiwan. LCD panels are used in computer products, such as notebook computers and desktop monitors, consumer electronics products, such as digital cameras and camcorders and car navigation systems, and LCD televisions. For the three and six months ended June 30, 2004, six LCD customers accounted for 80% and 76%, respectively, of the Display Technologies segment sales.
Corning and these customers have typically entered into multi-year supply agreements for the purchase and sale of glass substrates. These agreements provide for Corning to supply a percentage of the customers' requirements and include mechanisms for forecasting and ordering. During the second quarter of 2004, Corning improved the payment terms under these agreements to improve cash flow and reduce its working capital requirements.
The LCD market continues to grow rapidly. This growth is being driven, in part, by higher demand for LCD televisions, for which our LCD customers require larger size glass substrates. Over the past few months, Corning has held discussions with several of its customers to discuss how to meet this demand. As part of its discussions, Corning has sought improved payment terms, including deposits against orders, to provide a greater degree of assurance that we are effectively building capacity to meet the needs of a rapidly growing industry. There can be no assurance that Corning will be able to pace its capacity expansion to the actual demand and, while the industry has grown rapidly, it is possible that glass manufacturing capacity may exceed demand during certain periods.
On July 21, 2004, Corning and Chi Mei Optoelectronics Corp. (Chi Mei) entered into a long-term purchase and supply agreement of large size LCD glass. The agreement is a five-year contract under which Corning will supply Generation 5.5 glass to Chi Mei's new LCD fabrication facility in Tainan, Taiwan. The contract calls for significant quantities of LCD glass to be supplied to Chi Mei starting in 2005. As part of the agreement, Chi Mei will make advance cash deposits of $510 million to Corning in several installments in 2004 and 2005 for a portion of the contracted glass to be purchased. Refer to Note 16 to the Consolidated Financial Statements for a summary of this contract's key terms.
In the ordinary course of business, Corning will continue to negotiate multi-year supply agreements with its large customers where feasible.
Outlook: We expect to see a continuation of the overall industry growth and the trend toward large size substrates into the third quarter. We continue to see positive trends in the penetration rates of LCD's into the end-markets (notebook computers, monitors and televisions), and increasing needs for the large size substrates. Volume growth from the second to third quarter of 2004 is anticipated to be approximately 10% and average pricing is projected to remain stable. In addition, we expect to remain sold out throughout the quarter and plan to bring on additional capacity throughout the year. There can be no assurance that the end-market rates of growth will continue at the high rates experienced in recent quarters. Consumer preferences for panels of differing sizes, or price or other factors, may lead to pauses in market growth from time to time.

Environmental Technologies The following table provides net sales and other data for the Environmental Technologies segment (in millions):
For the three months ended June 30, 2004, sales increased $24 million, or 21%, compared to the prior year quarter. We continue to see strong demand for our automotive and diesel products in response to ever-tightening emission standards around the world. Our automotive products benefited from both an increase in volume and a higher mix of our thin-wall and ultra thin-wall substrates, which allow our customers to meet their emission control requirements in a more cost effective manner. Our diesel products continue to gain greater market penetration, and volumes were almost double the prior year quarter. Although showing strong growth, diesel products represented a modest portion of the total Environmental Technologies sales for the three months ended June 30, 2004. A portion of the sales of the Environmental Technologies segment are susceptible to movements in the US dollar - Euro exchange rates. For the quarter, sales received a minor benefit from a weakening of the US dollar.
For the six months ended June 30, 2004, sales increased $50 million, or 22%, compared to the prior year period. The factors affecting the six-month period performance are largely the same as those identified for the quarter.
For the three and six months ended June 30, 2004, the segment experienced modest net income increases compared to the respective prior year periods. The full benefits of the increases in product volumes and higher mix of thin-wall and ultra thin wall automotive substrates are largely being offset by development and engineering costs for our diesel products.
Outlook: For the third quarter of 2004, we expect to see sales comparable to those of the second quarter. Diesel regulatory trends remain on track for the United States, Europe and Japan, and we anticipate another strong quarter for this product line. Life Sciences The following table provides net sales and other data for the Life Sciences segment (in millions):
For the three months ended June 30, 2004, sales increased $7 million, or 10%, compared to the prior year quarter. Volume increases across the majority of our product lines, coupled with a favorable US dollar - Euro exchange rate, drove the sales increase compared to the second quarter of 2003.
For the six months ended June 30, 2004, sales increased $13 million, or 9%, compared to the prior year period. The factors affecting the six-month period performance are largely the same as those identified for the quarter.
Three mon ths Six months ended June 30, ended June 30, ----------- ----- ----------------- 2004 2003 2004 2003 --------------------------------------------------- ----------------------------- Sales $ 141 $ 117 $ 282 $ 232 Net income $ 4 $ 3 $ 10 $ 8 Segment net income as a percentage of segment sales 3% 3% 4% 3% --------------------------------------------------- -----------------------------
Three mon ths Six months ended June 30, ended June 30, ----------- ----- ----------------- 2004 2003 2004 2003 --------------------------------------------------- ----------------------------- Sales $ 79 $ 72 $ 158 $ 145 Net income $ 5 $ 4 $ 10 $ 12 Segment net income as a percentage of segment sales 6% 6% 6% 8% --------------------------------------------------- -----------------------------

For the three and six months ended June 30, 2004 net income was consistent with that of the comparable period. For the three and six month periods the incremental gross margin improvements resulting from the increase in sales volumes have been largely offset by new product development costs. In addition, for the six month period, the comparison of net income was negatively impacted due to a gain recognized in the first quarter of 2003 on the disposition of a minor product line.
Outlook: For the third quarter of 2004, we expect sales comparable to those of the second quarter. We expect a continuation of the positive trends in pharmaceutical spending, of capital infusion into the biotechnology market, and government spending.
Unallocated and Other The following table provides net sales and other data for the non-reportable operating segments and unallocated items (in millions):
Unallocated and Other includes all other operating segments that do not meet the quantitative threshold for separate reporting (e.g., specialty materials, ophthalmic products, and conventional video components), certain corporate investments (e.g., Dow Corning, Samsung Corning Company. Ltd. and Steuben), discontinued operations and unallocated expenses. Unallocated expenses include research and other expenses related to new business development; gains or losses on repurchases and retirement of debt; charges related to the asbestos litigation; and restructuring and impairment charges related to the corporate research and development or staff organizations. Unallocated and Other also represents the reconciliation between the totals for the reportable segments and our consolidated total.
Sales were down slightly for the three and six months ended June 30, 2004 compared to their respective prior year periods. The 2004 decrease of conventional video components sales is due to our second quarter 2003 decision, along with our partner, to cease production and shut down our 51% owned affiliate, Corning Asahi Video Products Company (CAV), which was a manufacturer of glass panels and funnels for use in conventional tube televisions. The improved sales performance in our other segments is largely due to higher sales generated by our specialty materials business.
Refer to the discussion regarding Restructuring, Impairment, and Other Charges and (Credits) and Asbestos Settlement for a description of the key drivers of net loss for periods presented.
LIQUIDITY AND CAPITAL RESOURCES
Financing Structure During the second quarter of 2004, we issued 10 million shares of common stock and paid $9 million in cash in exchange for 97,500 of our 3.5% convertible debentures with a book value of $98 million. We recorded a loss of $9 million ($9 million after-tax) relating to the retirement of debt.
--------------------------------------------------- --------------------------------------------------- ------------------------------ Three months Six months ended June 30, ended June 30, ------------------------ ------------------------- 2004 2003 2004 2003 --------------------------------------------------- --------------------------------------------------- ------------------------------ Net sales: Conventional Video Components $ 24 $ 2 $ 49 Other businesses $ 82 57 162 121 --------- -------- -------- -------- Total net sales $ 82 $ 81 $ 164 $ 170 ========= ======== ======== ======== Loss before minority interests and equity earnings $ (40) $ (94) $ (109) $ (359) Equity earnings of associated companies $ 36 $ 40 $ 75 $ 76 Net loss $ (15) $ (21) $ (46) $ (213) Loss before minority interests and equity earnings as a percentage of net sales (49)% (116)% (66)% (211)% Net loss as a percentage of net sales (18)% (26)% (28)% (125)% --------------------------------------------------- --------------------------------------------------- ------------------------------
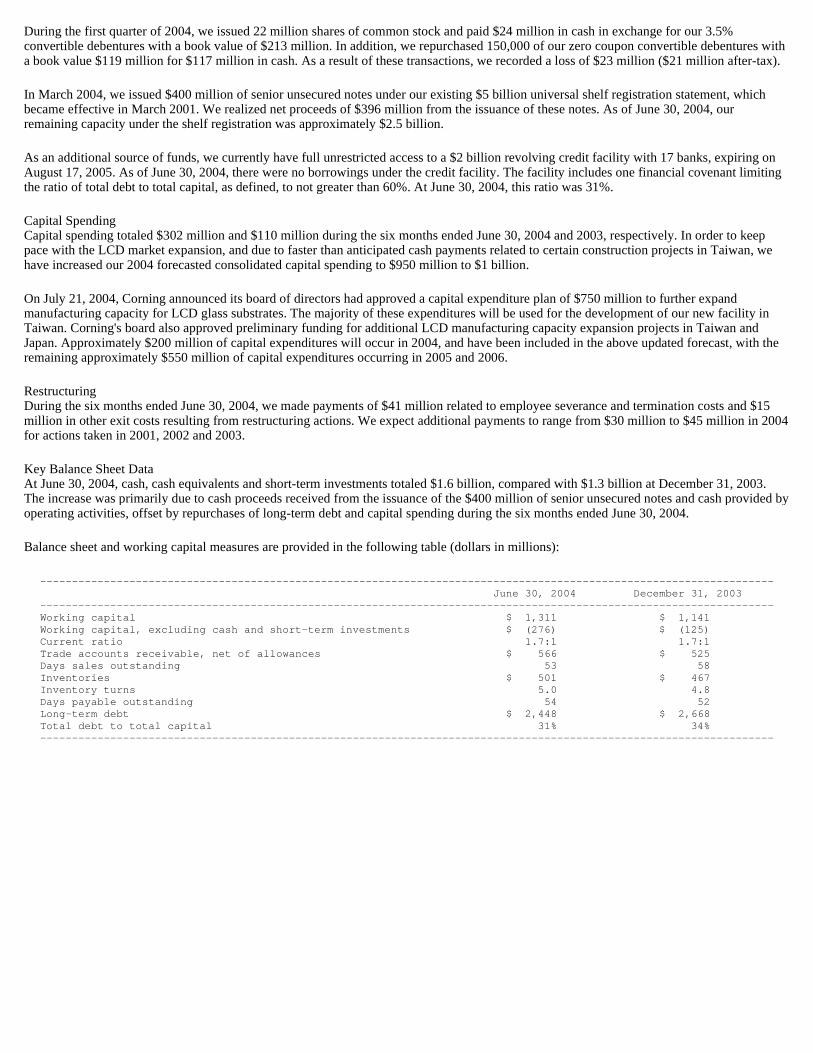
During the first quarter of 2004, we issued 22 million shares of common stock and paid $24 million in cash in exchange for our 3.5% convertible debentures with a book value of $213 million. In addition, we repurchased 150,000 of our zero coupon convertible debentures with a book value $119 million for $117 million in cash. As a result of these transactions, we recorded a loss of $23 million ($21 million after-tax).
In March 2004, we issued $400 million of senior unsecured notes under our existing $5 billion universal shelf registration statement, which became effective in March 2001. We realized net proceeds of $396 million from the issuance of these notes. As of June 30, 2004, our remaining capacity under the shelf registration was approximately $2.5 billion.
As an additional source of funds, we currently have full unrestricted access to a $2 billion revolving credit facility with 17 banks, expiring on August 17, 2005. As of June 30, 2004, there were no borrowings under the credit facility. The facility includes one financial covenant limiting the ratio of total debt to total capital, as defined, to not greater than 60%. At June 30, 2004, this ratio was 31%.
Capital Spending Capital spending totaled $302 million and $110 million during the six months ended June 30, 2004 and 2003, respectively. In order to keep pace with the LCD market expansion, and due to faster than anticipated cash payments related to certain construction projects in Taiwan, we have increased our 2004 forecasted consolidated capital spending to $950 million to $1 billion.
On July 21, 2004, Corning announced its board of directors had approved a capital expenditure plan of $750 million to further expand manufacturing capacity for LCD glass substrates. The majority of these expenditures will be used for the development of our new facility in Taiwan. Corning's board also approved preliminary funding for additional LCD manufacturing capacity expansion projects in Taiwan and Japan. Approximately $200 million of capital expenditures will occur in 2004, and have been included in the above updated forecast, with the remaining approximately $550 million of capital expenditures occurring in 2005 and 2006.
Restructuring During the six months ended June 30, 2004, we made payments of $41 million related to employee severance and termination costs and $15 million in other exit costs resulting from restructuring actions. We expect additional payments to range from $30 million to $45 million in 2004 for actions taken in 2001, 2002 and 2003.
Key Balance Sheet Data At June 30, 2004, cash, cash equivalents and short-term investments totaled $1.6 billion, compared with $1.3 billion at December 31, 2003. The increase was primarily due to cash proceeds received from the issuance of the $400 million of senior unsecured notes and cash provided by operating activities, offset by repurchases of long-term debt and capital spending during the six months ended June 30, 2004.
Balance sheet and working capital measures are provided in the following table (dollars in millions):
--------------------------------------------------- --------------------------------------------------- ------------- June 30, 2004 December 31, 2003 --------------------------------------------------- --------------------------------------------------- ------------- Working capital $ 1,311 $ 1, 141 Working capital, excluding cash and short-term inve stments $ (276) $ (1 25) Current ratio 1.7:1 1. 7:1 Trade accounts receivable, net of allowances $ 566 $ 525 Days sales outstanding 53 58 Inventories $ 501 $ 467 Inventory turns 5.0 4.8 Days payable outstanding 54 52 Long-term debt $ 2,448 $ 2, 668 Total debt to total capital 31% 34% --------------------------------------------------- --------------------------------------------------- -------------

Credit Ratings Our credit ratings remain unchanged from those disclosed in the 2003 Annual Report on Form 10-K as follows:
Management Assessment of Liquidity Our major source of funding for 2004 and beyond will be our existing balance of cash, cash equivalents and short-term investments. From time to time we may also issue debt or equity securities to raise additional cash to fund a portion of our capital expenditures related to our growth businesses. We believe we have sufficient liquidity for the next several years to fund operations, restructuring, the asbestos settlement, research and development, capital expenditures and scheduled debt repayments.
Contractual Obligations There have been no material changes outside the ordinary course of business in the contractual obligations disclosed in our 2003 Annual Report on Form 10-K under the caption "Contractual Obligations."
CRITICAL ACCOUNTING POLICIES AND ESTIMATES
The preparation of financial statements requires management to make estimates and assumptions that affect amounts reported therein. The estimates that required management's most difficult, subjective or complex judgments are described in our 2003 Annual Report on Form 10-K and remain unchanged through the second quarter of 2004.
As discussed under Part II- Other Information, Item 1. Legal Proceedings, on June 16, 2004, the Chinese Ministry of Commerce (the Ministry) issued its preliminary determination relating to its anti-dumping investigation against manufacturers of optical fiber based in the U.S., Korea and Japan. The preliminary determination asserts that Corning had dumped optical fiber in China during the relevant period in 2002 and 2003, and that the responding parties had materially injured Chinese producers. The Ministry stipulated that Corning's preliminary dumping duty was 16%. Chinese purchasers of the affected Corning optical fiber will have to pay the amount of this duty in the form of a cash deposit. Corning is vigorously contesting this preliminary determination through additional filings and may be able to appeal within the Ministry or the Chinese legal system if the final determination is adverse. Corning's fiber export revenues to China were approximately 6% of optical fiber and cable revenues. Corning management estimates that the impact of any potential loss of fiber export volume to China should be less than $0.01 in earnings per share in the second half of 2004. Given the preliminary nature of the ruling by the Ministry, we do not believe this matter results in an interim event of impairment by itself, which would require us to test the Telecommunications segment goodwill for recoverability in accordance with SFAS No. 142. However, should the preliminary determination become final, it will negatively impact our long-term outlook for the Telecommunications segment, and may require us to test goodwill for recoverability.
RATING AGENCY Rating Outlook Last Update Long-Term Debt Last Update --------------------------------------------------- ----------------------------- Standard & Poor's BB+ Stable July 29, 2002 January 16, 2004 Moody's Ba2 Stable July 29, 2002 November 19, 2003 Fitch BB Stable July 24, 2002 July 24, 2003 --------------------------------------------------- -----------------------------

ENVIRONMENT
We have been named by the Environmental Protection Agency under the Superfund Act, or by state governments under similar state laws, as a potentially responsible party for 12 active hazardous waste sites. Under the Superfund Act, all parties who may have contributed any waste to a hazardous waste site, identified by such Agency, are jointly and severally liable for the cost of cleanup unless the Agency agrees otherwise. It is our policy to accrue for the estimated liability related to Superfund sites and other environmental liabilities related to property owned and operated by us based on expert analysis and continual monitoring by both internal and external consultants. We have accrued approximately $21 million for the estimated liability for environmental cleanup and related litigation at June 30, 2004. Based upon the information developed to date, we believe that the accrued amount is a reasonable estimate of our liability and that the risk of an additional loss in an amount materially higher than that accrued is remote.
FORWARD-LOOKING STATEMENTS
The statements in this Quarterly Report on Form 10-Q, in reports subsequently filed by Corning with the SEC on Forms 8-K, and related comments by management which are not historical facts or information and contain words such as "believes," "expects," "anticipates," "estimates," "forecasts," and similar expressions are forward-looking statements. These forward-looking statements involve risks and uncertainties that may cause the actual outcome to be materially different. Such risks and uncertainties include, but are not limited to:
- global economic and political conditions; - tariffs, import duties and currency fluctuations; - product demand and industry capacity; - competitive products and pricing; - sufficiency of manufacturing capacity and efficiencies; - availability and costs of critical components and materials; - new product development and commercialization; - order activity and demand from major customers; - fluctuations in capital spending by customers in the Telecommunications segment and other business segments; - possible disruption in commercial activities due to terrorist activity, armed conflict, political instability or major health concerns; - facility expansions and new plant start-up costs; - effect of regulatory and legal developments; - capital resource and cash flow activities; - ability to pace capital spending to anticipated levels of customer demand, which may fluctuate; - equity company activities; - interest costs; - credit rating and ability to obtain financing and capital on commercially reasonable terms; - adequacy and availability of insurance; - financial risk management; - acquisition and divestiture activities; - level of excess or obsolete inventory; - ability to enforce patents; - adverse litigation; - product and components performance issues; - stock price fluctuations, - the rate of substitution by end-users purchasing LCDs for notebook computers, desktop monitors and televisions; - a downturn in demand for LCD glass substrates; - ability of our customers, most notably in the Display Technologies segment, to maintain profitable operations and obtain financing to fund their manufacturing expansions; - fluctuations in inventory levels in the supply chain; - equity company activities, principally at Dow Corning Corporation and Samsung Corning Corporation, and - other risks detailed in Corning's SEC filings.

ITEM 3. QUANTITATIVE AND QUALITATIVE DISCLOSURES AB OUT MARKET RISK
Market Risk Disclosures
There have been no material changes to our market risk exposure during the first six months of 2004. For a discussion of our exposure to market risk, refer to Item 7A, Quantitative and Qualitative Disclosures About Market Risks, contained in our 2003 Annual Report on Form 10-K.
ITEM 4. CONTROLS AND PROCEDURES
The Company carried out an evaluation, under the supervision and with the participation of the Company's management, including the Company's chief executive officer and its chief financial officer, of the effectiveness of the design and operation of the Company's disclosure controls and procedures as of June 30, 2004, the end of the period covered by this report. Based upon the evaluation, the chief executive officer and chief financial officer concluded that as of the Evaluation Date, the Company's disclosure controls and procedures are effective to ensure that information required to be disclosed by the Company in reports that it files or submits under the Exchange Act is recorded, processed, summarized and reported within the time periods specified in Securities and Exchange Commission rules and forms.
During the fiscal quarter ended June 30, 2004, there has been no change in our internal control over financial reporting that has materially affected or is reasonably likely to materially affect, our internal control over financial reporting.

Part II - Other Information
ITEM 1. LEGAL PROCEEDINGS
Environmental Litigation. Corning has been named by the Environmental Protection Agency under the Superfund Act, or by state governments under similar state laws, as a potentially responsible party at 12 active hazardous waste sites. Under the Superfund Act, all parties who may have contributed any waste to a hazardous waste site, identified by such Agency, are jointly and severally liable for the cost of cleanup unless the Agency agrees otherwise. It is Corning's policy to accrue for its estimated liability related to Superfund sites and other environmental liabilities related to property owned by Corning based on expert analysis and continual monitoring by both internal and external consultants. Corning has accrued approximately $21 million for its estimated liability for environmental cleanup and litigation at June 30, 2004. Based upon the information developed to date, management believes that the accrued reserve is a reasonable estimate of the Company's estimated liability and that the risk of an additional loss in an amount materially higher than that accrued is remote.
Schwinger and Stevens Toxins Lawsuits. In April 2002, Corning was named as a defendant in two actions, Schwinger and Stevens, filed in the U.S. District Court for the Eastern District of New York, which asserted various personal injury and property damage claims against a number of corporate defendants. These claims allegedly arise from the release of toxic substances from a Sylvania nuclear materials processing facility near Hicksville, New York. Amended complaints naming 205 plaintiffs and seeking damages in excess of $3 billion were served in September 2002. The sole basis of liability against Corning was plaintiffs' claim that Corning was the successor to Sylvania-Corning Nuclear Corporation, a Delaware corporation formed in 1957 and dissolved in 1960. Management intends to vigorously contest all claims against Corning for the reason that Corning is not the successor to Sylvania-Corning. Management will also defend on the grounds that almost all of the wrongful death claims and personal injury claims are time-barred. At a status conference in December 2002, the Court decided to "administratively close" the Schwinger and Stevens cases and ordered plaintiffs' counsel to bring new amended complaints with "bellwether" plaintiffs. In these actions, known as Schwinger II and Astuto, the plaintiffs have not named Corning as a defendant. Although it appears that plaintiffs may proceed only against the other corporate defendants, the original Schwinger and Stevens cases remain pending and no order has been entered dismissing Corning. Based upon the information developed to date, and recognizing that the outcome of litigation is uncertain, management believes that the likelihood of a materially adverse impact to Corning's financial statements is remote.
Dow Corning Bankruptcy. Corning and Dow Chemical each own 50% of the common stock of Dow Corning, which has been in reorganization proceedings under Chapter 11 of the U.S. Bankruptcy Code since May 1995. Dow Corning filed for bankruptcy protection to address pending and claimed liabilities arising from many thousand breast-implant product lawsuits each of which typically sought damages in excess of one million dollars. On November 8, 1998, Dow Corning and the Tort Claimants Committee jointly filed a revised Plan of Reorganization (Joint Plan) which provided for the settlement or other resolution of implant claims. The Joint Plan included releases for third parties (including Corning and Dow Chemical as shareholders) in exchange for contributions to the Joint Plan. After review and approvals by the Bankruptcy Court and the U.S. District Court of the Eastern District of Michigan, and an appeal, the District Court on April 2, 2004 entered an order establishing June 1, 2004 as the effective date of the Joint Plan.
Under the terms of the Joint Plan, Dow Corning will establish a Settlement Trust and a Litigation Facility to provide a means for tort claimants to settle or litigate their claims. Dow Corning has the obligation to fund the Trust and the Facility, over a period of up to 16 years, in an amount up to approximately $3.3 billion, subject to the limitations, terms and conditions stated in the Joint Plan. Corning and Dow Chemical have each agreed to provide a credit facility to Dow Corning of up to $150 million ($300 million in the aggregate), subject to the terms and conditions stated in the Joint Plan. As required by the Joint Plan, Dow Corning has fully satisfied (or reserved for) the claims of its commercial creditors in accordance with a March 31, 2004 ruling of the District Court determining the amount of pendency interest allowed on the $810 million in principal owing on such claims. In the second quarter of 2004, Dow Corning recorded a $47 million adjustment to its interest liabilities relating to this matter, of which Corning recognized $14 million reflected in its second quarter equity earnings. Certain commercial creditors have appealed from that ruling to the U.S. Court of Appeals of the Sixth Circuit seeking from Dow Corning an additional sum of approximately $100 million for interest at default rates and enforcement costs. Corning believes the risk of loss to Dow Corning (net of sums reserved) is remote.

In 1995, Corning fully impaired its investment in Dow Corning upon its entry into bankruptcy proceedings and did not recognize equity earnings from the second quarter of 1995 through the end of 2002. Corning began recognizing equity earnings in the first quarter of 2003 when management concluded that its emergence from bankruptcy protection was probable. Corning considers the difference between the carrying value of its investment in Dow Corning and its 50% share of Dow Corning's equity to be permanent. This difference is $249 million. Subject to future rulings by the bankruptcy court and potential changes in estimated bankruptcy-related liabilities, it is possible that Dow Corning may record bankruptcy-related charges in the future.
Corning received no dividends from Dow Corning in 2003 or in the first half of 2004.
Implant Tort Lawsuits. Corning and Dow Chemical, the shareholders of Dow Corning, were named in several thousand state and federal tort lawsuits alleging injuries arising from Dow Corning's implant products. The claims against the shareholders alleged a variety of direct or indirect theories of liability. The federal breast implants cases against Corning were dismissed by summary judgment entered in the U.S. District Court of the Northern District of Alabama in 1995. In state court litigation, Corning was awarded summary judgment in California, Connecticut, Illinois, Indiana, Michigan, Mississippi, New Jersey, New York, Pennsylvania, Tennessee, and Dallas, Harris and Travis Counties in Texas, thereby dismissing approximately 7,000 state cases. Certain Louisiana cases were transferred to the U.S. District Court for the Eastern District of Michigan to which substantially all breast implant cases were transferred in 1997. In light of the confirmation of the Plan of Reorganization, providing a channeling of all claims into facilities established by the Plan and releasing the shareholders, management believes that the likelihood of a materially adverse impact to Corning's financial statements is remote.
Federal Securities Cases. A federal securities class action lawsuit was filed in 1992 against Corning and certain individual defendants by a class of purchasers of Corning stock who allege misrepresentations and omissions of material facts relative to the silicone gel breast implant business conducted by Dow Corning. This action is pending in the U.S. District Court for the Southern District of New York. The class consists of those purchasers of Corning stock in the period from June 14, 1989 to January 13, 1992, who allegedly purchased at inflated prices due to the non-disclosure or concealment of material information. No amount of damages is specified in the complaint. In 1997, the Court dismissed the individual defendants from the case. In June 2003, Corning filed a motion for summary judgment. Corning intends to continue to defend this action vigorously. Based upon the information developed to date and recognizing that the outcome of litigation is uncertain, management believes that the likelihood of a materially adverse impact to Corning's financial statements is remote.
From December 2001 through April 2002, Corning and three of its officers and directors were named defendants in lawsuits alleging violations of the U.S. securities laws in connection with Corning's November 2000 offering of 30 million shares of common stock and $2.7 billion zero coupon convertible debentures, due November 2015. In addition, the Company and the same three officers and directors were named in lawsuits alleging misleading disclosures and non-disclosures that allegedly inflated the price of Corning's common stock in the period from September 2000 through July 9, 2001. The plaintiffs in these actions seek to represent classes of purchasers of Corning's stock in all or part of the period indicated. On August 2, 2002, the U.S. District Court of the Western District of New York entered an order consolidating these actions for all purposes, designating lead plaintiffs and lead counsel, and directing service of a consolidated complaint. The consolidated amended complaint requests substantial damages in an unspecified amount to be proved at trial. In February 2003, defendants filed a motion to dismiss the complaint for failure to allege the requisite elements of the claims with particularity. The Court heard arguments on May 29 and June 9, 2003 and on April 9, 2004 entered a Decision and Order dismissing the complaint. In May 2004, Plaintiffs filed a notice of appeal to the U.S. Court of Appeals of the Second Circuit. Management is prepared to defend these lawsuits vigorously. Recognizing that the outcome of litigation is uncertain, management believes that the likelihood of a materially adverse impact to Corning's financial statements, net of applicable insurance, is remote.

Pittsburgh Corning Corporation. Corning and PPG Industries, Inc. ("PPG") each own 50% of the capital stock of PCC. Over a period of more than two decades, PCC and several other defendants have been named in numerous lawsuits involving claims alleging personal injury from exposure to asbestos. On April 16, 2000, PCC filed for Chapter 11 reorganization in the U.S. Bankruptcy Court for the Western District of Pennsylvania. As of the bankruptcy filing, PCC had in excess of 140,000 open claims and had insufficient remaining insurance and assets to deal with its alleged current and future liabilities. More than 100,000 additional claims have been filed with PCC after its bankruptcy filing. At the time PCC filed for bankruptcy protection, there were approximately 12,400 claims pending against Corning in state court lawsuits alleging various theories of liability based on exposure to PCC's asbestos products and typically requesting monetary damages in excess of one million dollars per claim. Corning has defended those claims on the basis of the separate corporate status of PCC and the absence of any facts supporting claims of direct liability arising from PCC's asbestos products. Corning is also currently named in approximately 11,300 other cases (approximately 42,300 claims) alleging injuries from asbestos and similar amounts of monetary damages per claim. Those cases have been covered by insurance without material impact to Corning to date. Asbestos litigation is inherently difficult, and past trends in resolving these claims may not be indicators of future outcomes.
In the bankruptcy court, PCC in April 2000 obtained a preliminary injunction against the prosecution of asbestos actions arising from PCC's products against its two shareholders to afford the parties a period of time (the Injunction Period) in which to negotiate a plan of reorganization for PCC ("PCC Plan"). The Injunction Period was extended on several occasions and will now continue, pending developments with respect to the PCC Plan as described below.
On May 14, 2002, PPG announced that it had agreed with certain of its insurance carriers and representatives of current and future asbestos claimants on the terms of a settlement arrangement applicable to claims arising from PCC's products. The announced arrangement would permit PPG and certain of its insurers to make contributions of cash over a period of years, PPG's shares in PCC and Pittsburgh Corning Europe N.V. (PCE), a Belgian corporation, and an agreed number of shares of PPG's common stock in return for a release and injunction channeling claims against PPG into a settlement trust under the PCC Plan.
On March 28, 2003, Corning announced that it had also reached agreement with representatives of current and future asbestos claimants on a settlement arrangement that will be incorporated into the PCC Plan. This settlement is subject to a number of contingencies, including approval by the bankruptcy court. Corning's settlement will require the contribution, when the Plan becomes effective, of its equity interest in PCC, its one-half equity interest in PCE, and 25 million shares of Corning common stock. Corning also will be making cash payments of $140 million (net present value as of June 30, 2004) in six installments beginning one year after the Plan is effective. In addition, Corning will assign policy rights or proceeds under primary insurance from 1962 through 1984, as well as rights to proceeds under certain excess insurance, most of which falls within the period from 1962 through 1973. In return for these contributions, Corning expects to receive a release and an injunction channeling asbestos claims against it into a settlement trust under the PCC Plan.
Corning recorded an initial charge of $298 million ($192 million after-tax) in the period ending March 31, 2003 to reflect the settlement terms. However, the amount of the charge for this settlement requires adjustment each quarter based upon movement in Corning's common stock price prior to contribution of the shares to the trust. In the second quarter of 2004, Corning recorded an additional charge of $47 million ($45 million after-tax) to reflect the mark-to-market of Corning common stock. Beginning with the first quarter of 2003 and through June 30, 2004, Corning recorded total charges of $479 million ($327 million after-tax) to reflect the settlement and to mark-to-market the value of Corning common stock.
Two of Corning's primary insurers and several excess insurers have commenced litigation for a declaration of the rights and obligations of the parties under insurance policies, including rights that may be affected by the settlement arrangement described above. Corning is vigorously contesting these cases. Management is unable to predict the outcome of this insurance litigation.

The PCC Plan received a favorable vote from creditors in March 2004. Hearings to consider objections to the Plan were held in the Bankruptcy Court in May 2004. That Court has set a schedule for briefing leading to final arguments in November 2004. Additional appeals by objecting parties are reasonably possible. Although the confirmation of the PCC Plan is subject to a number of contingencies, apart from the quarterly adjustment in the value of 25 million shares of Corning common stock, management believes that the likelihood of a material adverse impact to Corning's financial statements is remote.
Astrium. In December of 2000, Astrium, SAS and Astrium, Ltd. filed a complaint for negligence in the U.S. District Court for the Central District of California against TRW, Inc., Pilkington Optronics Inc., Corning NetOptix, Inc., OFC Corporation and Optical Filter Corporation claiming damages in excess of $150 million. The complaint alleges that certain cover glasses for solar arrays used to generate electricity from solar energy on satellites sold by Astrium's corporate successor were negligently coated by NetOptix or its subsidiaries (prior to Corning's acquisition of NetOptix) in such a way that the amount of electricity the satellite can produce and their effective life were materially reduced. NetOptix has denied that the coatings produced by NetOptix or its subsidiaries caused the damage alleged in the complaint, or that it is legally liable for any damages that Astrium may have experienced. In April 2002, the Court granted motions for summary judgment by NetOptix and other defendants to dismiss the negligence claims, but permitted plaintiffs to add fraud and negligent misrepresentation claims against all defendants and a breach of warranty claim against NetOptix and its subsidiaries. In October 2002, the Court again granted defendants' motions for summary judgment and dismissed the negligent misrepresentation and breach of warranty claims. The intentional fraud claims were dismissed against all non-settling defendants on February 25, 2003. On March 19, 2003, Astrium appealed all of the Court's Rulings regarding the various summary judgment motions to the Ninth Circuit Court of Appeals. The Circuit Court has stayed the appeal pending a decision in a case being appealed to the California Supreme Court involving similar issues of law. Recognizing that the outcome of litigation is uncertain, management believes that the likelihood of a materially adverse impact to Corning's financial statements is remote.
Furukawa Electric Company. On February 3, 2003, The Furukawa Electric Company filed suit in the Tokyo District Court in Japan against Corning Cable Systems International Corporation ("CCS International") alleging infringement of Furukawa's Japanese Patent No. 2,023,966 which relates to separable fiber ribbon units used in optical cable. Furukawa's complaint requests slightly over (Y)6 billion in damages (approximately $56 million) and an injunction against further sales in Japan of these fiber ribbon units. CCS International has denied the allegation of infringement, asserted that the patent is invalid, and is defending vigorously against this lawsuit. Several hearings have been held before the Tokyo District Court and the next hearing is scheduled for July 30, 2004. Management believes that the likelihood of a materially adverse impact to Corning's financial statements is remote.
Chinese Anti-Dumping Investigation. On July 1, 2003, the Chinese Ministry of Commerce announced an anti-dumping investigation against manufacturers of optical fiber based in the U.S, Korea and Japan, alleging that standard single-mode optical fiber was sold in China at lower prices than in the respective home country. This matter does not present a claim for damages. On June 16, 2004 the Ministry's preliminary determination was issued which found that Corning had dumped optical fiber in China during the relevant period in 2002 and 2003, and that the responding parties had materially injured Chinese producers. The Ministry stipulated that Corning's preliminary dumping duty was 16%. Chinese purchasers of the affected Corning optical fiber will have to pay the amount of this duty in the form of a cash deposit. Corning is vigorously contesting this preliminary determination through additional filings and may be able to appeal within the Ministry or the Chinese legal system if the final determination is adverse. Corning's fiber export revenues to China were approximately 6% of optical fiber and cable revenues. Corning management estimates that the impact of any potential loss of fiber export volume to China should be less than $0.01 in earnings in the second half of 2004.

PicVue Electronics Ltd., PicVue OptoElectronics International, Inc. and Eglasstrek Gmbh. In June 2002, Corning brought an action seeking to restrain the use of its trade secrets and for copyright infringement relating to certain aspects of the fusion draw machine used for liquid crystal display glass melting. This action is pending in the U.S. District Court for the Western District of New York against these three named defendants. The District Court in July 2003 denied the PicVue motion to dismiss and granted a preliminary injunction in favor of Corning, subject to posting a bond in an amount to be determined. PicVue, a Taiwanese company, responded in July 2003 with a counterclaim alleging violations of the antitrust laws and claiming damages of more than $120 million as well as requesting trebled damages. PicVue has appealed the District Court's ruling and the District Court has deferred ruling on the bond amount until the completion of such appeal. The appellate court affirmed the grant of the preliminary injunction, but remanded the case for the District Court to clarify the scope of the injunction and to consider what, if any, bond should be posted. The parties have submitted papers to the District Court addressing the issues remanded. The District Court has not ruled on the remanded issues or determined the amount of the bond. Recognizing that the outcome of litigation is uncertain, management believes that the PicVue counterclaim is without merit and that the likelihood of a materially adverse impact to Corning's financial statements is remote.
Tyco Electronics Corporation and Tyco Technology Resources, Inc. On August 13, 2003, CCS Holdings Inc. ("CCS"), a Corning subsidiary, filed an action in the U.S. District Court for the Middle District of North Carolina against Tyco Electronics Corporation and Tyco Technology Resources, Inc. ("Tyco"), asking the court to declare a Tyco patent invalid and not infringed by CCS. The patent generally relates to a type of connector for optical fiber cables. Tyco has responded with a motion to dismiss the action for lack of jurisdiction. That motion has been fully briefed by the parties, and Tyco has requested a hearing. Management has not estimated the range of monetary damages that may be claimed if CCS does not prevail on its claim that the Tyco patent is invalid or not infringed. Recognizing that the outcome of litigation is uncertain, management believes that the risk of a material impact on Corning's financial statements is remote.
Grand Jury Investigation of Conventional Cathode Ray Television Glass Business. In August 2003, CAV was served with a federal grand jury document subpoena related to pricing, bidding and customer practices involving conventional cathode ray television glass picture tube components. Eight employees or former employees have each received a related subpoena. CAV is a general partnership, 51% owned by Corning and 49% owned by Asahi Glass America, Inc. CAV's only manufacturing facility in State College, Pennsylvania closed in the first half of 2003 due to declining sales. CAV is cooperating with the government investigation. Management is not able to estimate the likelihood that any charges will be filed as a result of the investigation.

ITEM 2. CHANGES IN SECURITIES, USE OF PROCEEDS AND ISSUER PURCHASES OF EQUITY SECURITIES
This table provides information about our purchases of our common stock during the fiscal first and second quarters of 2004:
Issuer Purchases of Equity Securities*
* During the quarters ended March 31 and June 30, 2004, we did not have a publicly announced program for repurchase of shares of our common stock and did not repurchase our common stock in open-market transactions outside of such a program.
** This column reflects the following transactions during the fiscal first and second quarters of 2004: (i) the deemed surrender to us of 32,039 shares of common stock to pay the exercise price and to satisfy tax withholding obligations in connection with the exercise of employee stock options, and (ii) the surrender to us of 24,176 shares of common stock to satisfy tax withholding obligations in connection with the vesting of restricted stock issued to employees.
--------------------------------------------------- --------------------------------------------------- ------------------------------ Total Average Total Number of Approximate Dollar Number Price Shares Purchased as Value of Shares that of Shares Paid per Part of Publicly May Yet Be Purchased Period Purchased** Share** Announced Plan* Under the Plan* --------------------------------------------------- --------------------------------------------------- ------------------------------ January 1-31, 2004 32,178 $11.76 0 $0 February 1-29, 2004 18,400 $12.81 0 $0 March 1-31, 2004 815 $12.90 0 $0 April 1-30, 2004 3,523 $12.05 0 $0 May 1-31, 2004 1,299 $11.00 0 $0 June 1-30, 2004 0 $ 0 0 $0 --------------------------------------------------- --------------------------------------------------- ------------------------------ Total 56,215 $12.12 0 $0 --------------------------------------------------- --------------------------------------------------- ------------------------------

ITEM 4. SUBMISSION OF MATTERS TO A VOTE OF SECURITY HOLDERS
a) Our annual meeting of shareholders was held on April 29, 2004. At that meeting, shareholders elected Jeremy R. Knowles, Eugene C. Sit, William D. Smithburg, Hansel E. Tookes II and Wendell P. Weeks as directors for terms expiring at our annual meeting of shareholders in 2007. In addition, shareholders voted to ratify the appointment of PricewaterhouseCoopers LLP as independent auditors for fiscal year 2004 and also approved one shareholder proposal. Those elected and the results of voting are as follows:
Item (a) Nomination and Election of Directors
John Seely Brown, Gordon Gund, John M. Hennessy and H. Onno Ruding continued as directors for terms expiring at the annual meeting of shareholders in 2005 and James B. Flaws, James R. Houghton, James J. O'Connor, Deborah D. Rieman and Peter F. Volanakis continued as directors for terms expiring at the annual meeting of shareholders in 2006.
Name Votes For Votes Withheld Jeremy R. Knowles 1,181,000,093 41,829,292 Eugene C. Sit 1,191,810,795 31,018,591 William D. Smithburg 1,173,417,361 49,412,024 Hansel E. Tookes II 1,187,475,972 35,353,414 Wendell P. Weeks 1,159,330,333 63,499,053
Item (b) Votes For Votes Against Abstain Ratify 1,184,664,105 30,342,087 7,823,193 appointment of PricewaterhouseCoopers LLP as independent auditors for 2004 fiscal year
Item (c) Votes For Votes Against Abstain Broker Non-Votes Shareholder proposal 583,927,357 295,920,081 15,594,968 327,386,979 urging Board to seek shareholder approval for future severance agreements with senior executives

ITEM 5. OTHER INFORMATION
At the April 29, 2004 annual meeting of shareholders, a majority of votes were cast in favor of an advisory shareholder proposal urging the Board of Directors to seek shareholder approval for certain future severance agreements with senior executive officers. At that meeting, Corning announced it would duly consider the recommendation. In response, the Compensation Committee and Board of Directors considered and adopted a policy on July 21, 2004 implementing this proposal. The new Board policy is to seek shareholder approval for any future severance agreements entered after July 21, 2004 with senior executive officers that provide benefits exceeding 2.99 times the sum of such senior executive officer's base salary plus bonus.
ITEM 6. EXHIBITS AND REPORTS ON FORM 8-K
A report on Form 8-K was filed April 22, 2004, in connection with the registrant's results for the quarter ended March 31, 2004, furnishing material pursuant to Item 12 and Item 9.*
A report on Form 8-K was filed April 29, 2004, in connection with the CEO's remarks at the annual meeting of shareholders held on April 29, 2004, furnishing material pursuant to Item 9.*
A report on Form 8-K was filed July 19, 2004, in connection with the registrant's results for the quarter ended June 30, 2004, furnishing material pursuant to Item 12 and Item 9.*
* Information furnished under Item 9 or Item 12 of Form 8-K is not incorporated by reference, is not deemed filed and is not subject to liability under Section 18 of the Securities and Exchange Act of 1934, as amended.
* Other items under Part II are not applicable.
(a) Exhibits Exhibit Number Exhibit Name -------------- ------------ 12 Computation of Ratio of Earnings to Fixed Charges. 24 Power of Attorney 31.1 Certification Pursuan t to Rule 13a-15(e) and 15d-15(e), As adopted Pursuant to Section 302 of the Sarbanes-Oxley Ac t of 2002. 31.2 Certification Pursuan t to Rule 13a-15(e) and 15d-15(e), As adopted Pursuant to Section 302 of the Sarbanes-Oxley Ac t of 2002. 32 Certification Pursuan t to 18 U.S.C. Section 1350, As adopted Pursuant t o Section 906 of the Sarbanes-Oxley Act of 2002. (b) Reports on Form 8-K

SIGNATURES
Pursuant to the requirements of the Securities and Exchange Act of 1934, the registrant has duly caused this report to be signed on its behalf by the undersigned thereunto duly authorized.
CORNING INCORPORATED (Registrant)
July 30, 2004 /s/ JAMES B. FLAWS --------------- ------------------------------------------ Date James B. Flaws Vice Chairman and Chief Financial Officer (Principal Financial Officer) July 30, 2004 /s/ KATHERINE A. ASBECK --------------- ------------------------------------------ Date Katherine A. Asbeck Senior Vice President and Controller (Principal Accounting Officer)

EXHIBIT INDEX
Exhibit Number Exhibit Name -------------- ------------ 12 Computation of Ratio of Ear nings to Fixed Charges. 24 Power of Attorney 31.1 Certification Pursuant to R ule 13a-15(e) and 15d-15(e), As adopted Pursuant to Sect ion 302 of the Sarbanes-Oxley Act of 2002. 31.2 Certification Pursuant to R ule 13a-15(e) and 15d-15(e), As adopted Pursuant to Sect ion 302 of the Sarbanes-Oxley Act of 2002. 32 Certification Pursuant to 1 8 U.S.C. Section 1350, As adopted Pursuant to Section 906 of the Sarbanes-Oxley Act of 2002.

Exhibit 12
CORNING INCORPORATED AND SUBSIDIARY COMPANIES COMPUTATION OF RATIO OF EARNINGS TO FIXED CHARGES (In millions, except ratios)
For the six months ended June 30, 2004 ------------------------ Loss before income taxes $ (28) Adjustments: Distributed income of equity investees 123 Amortization of capitalized interest 3 Fixed charges net of capitalized interest 84 ----------- Income before taxes and fixed charges, as adjusted $ 182 =========== Fixed charges: Interest incurred $ 79 Portion of rent expense which represents an appropriate interest factor 10 Amortization of debt costs 2 ----------- Total fixed charges 91 Capitalized interest (7) ----------- Total fixed charges, net of capitalized interest $ 84 =========== Ratio of earnings to fixed charges 2.0 ===========

Exhibit 24
CORNING INCORPORATED
POWER OF ATTORNEY
KNOW ALL MEN BY THESE PRESENTS, that the undersigned director and/or officer of Corning Incorporated, a New York corporation (the "Corporation"), does hereby make, constitute and appoint Katherine A. Asbeck, William D. Eggers and James B. Flaws and each or any one of them, the undersigned's true and lawful attorneys-in-fact, with power of substitution, for the undersigned and in the undersigned's name, place and stead, to sign and affix the undersigned's name as director and/or officer of the Corporation to (1) a Form 10-K, Annual Report, pursuant to the Securities Exchange Act of 1934, as amended (the "1934 Act"), for the fiscal year ended December 31, 2003, or other applicable form, including any and all exhibits, schedules, amendments, supplements and supporting documents thereto, including, but not limited to, the Form 11-K Annual Reports of the Corporation's 401(k) Plans and similar plans pursuant to the 1934 Act, and all amendments, supplementations and corrections thereto, to be filed by the Corporation with the Securities and Exchange Commission (the "SEC"), as required in connection with its registration under the 1934 Act; and (2) one or more Registration Statements, on Form S-8, or other applicable forms, and all amendments, including post-effective amendments, thereto, to be filed by the Corporation with the SEC in connection with the registration under the Securities Act of 1933, as amended, of securities of the Corporation, and to file the same, with all exhibits thereto and other supporting documents, with the SEC.
IN WITNESS WHEREOF, the undersigned has subscribed these presents this 9th day of February, 2004.
/s/ Eugene C. Sit --------------------------- Eugene C. Sit

Exhibit 31.1
CERTIFICATIONS
I, James R. Houghton, certify that:
1. I have reviewed this quarterly report on Form 10-Q of Corning Incorporated;
2. Based on my knowledge, this report does not contain any untrue statement of a material fact or omit to state a material fact necessary to make the statements made, in light of the circumstances under which such statements were made, not misleading with respect to the period covered by this report;
3. Based on my knowledge, the financial statements, and other financial information included in this report, fairly present in all material respects the financial condition, results of operations and cash flows of the registrant as of, and for, the periods presented in this quarterly report;
4. The registrant's other certifying officer and I are responsible for establishing and maintaining disclosure controls and procedures (as defined in Exchange Act Rules 13a-15(e) and 15d-15(e)) for the registrant and we have:
a) designed such disclosure controls and procedures, or caused such disclosure controls and procedures to be designed under our supervision, to ensure that material information relating to the registrant, including its consolidated subsidiaries, is made known to us by others within those entities, particularly during the period in which this report is being prepared;
b) evaluated the effectiveness of the registrant's disclosure controls and procedures and presented in this report our conclusions about the effectiveness of the disclosure controls and procedures, as of the end of the period covered by this report based on such evaluation; and
c) disclosed in this report any change in the registrant's internal control over financial reporting that occurred during the registrant's most recent fiscal quarter (the registrant's fourth fiscal quarter in the case of an annual report) that has materially affected, or is reasonably likely to materially affect, the registrant's internal control over financial reporting;
5. The registrant's other certifying officer and I have disclosed, based on our most recent evaluation of internal control over financial reporting, to the registrant's auditors and the audit committee of registrant's board of directors (or persons performing the equivalent function):
a) all significant deficiencies and material weaknesses in the design or operation of internal control over financial reporting which are reasonably likely to adversely affect the registrant's ability to record, process, summarize and report financial information; and
b) any fraud, whether or not material, that involves management or other employees who have a significant role in the registrant's internal controls over financial reporting.
July 30, 2004 /s/ JAMES R. HOUGHTON ---------------------- ----------------------------------------- Date James R. Houghton Chairman and Chief Executive Officer

Exhibit 31.2
CERTIFICATIONS
I, James B. Flaws, certify that:
1. I have reviewed this quarterly report on Form 10-Q of Corning Incorporated;
2. Based on my knowledge, this report does not contain any untrue statement of a material fact or omit to state a material fact necessary to make the statements made, in light of the circumstances under which such statements were made, not misleading with respect to the period covered by this report;
3. Based on my knowledge, the financial statements, and other financial information included in this report, fairly present in all material respects the financial condition, results of operations and cash flows of the registrant as of, and for, the periods presented in this quarterly report;
4. The registrant's other certifying officer and I are responsible for establishing and maintaining disclosure controls and procedures (as defined in Exchange Act Rules 13a-15(e) and 15d-15(e)) for the registrant and we have:
a) designed such disclosure controls and procedures, or caused such disclosure controls and procedures to be designed under our supervision, to ensure that material information relating to the registrant, including its consolidated subsidiaries, is made known to us by others within those entities, particularly during the period in which this report is being prepared;
b) evaluated the effectiveness of the registrant's disclosure controls and procedures and presented in this report our conclusions about the effectiveness of the disclosure controls and procedures, as of the end of the period covered by this report based on such evaluation; and
c) disclosed in this report any change in the registrant's internal control over financial reporting that occurred during the registrant's most recent fiscal quarter (the registrant's fourth fiscal quarter in the case of an annual report) that has materially affected, or is reasonably likely to materially affect, the registrant's internal control over financial reporting;
5. The registrant's other certifying officer and I have disclosed, based on our most recent evaluation of internal control over financial reporting, to the registrant's auditors and the audit committee of registrant's board of directors (or persons performing the equivalent function):
a) all significant deficiencies and material weaknesses in the design or operation of internal control over financial reporting which are reasonably likely to adversely affect the registrant's ability to record, process, summarize and report financial information; and
b) any fraud, whether or not material, that involves management or other employees who have a significant role in the registrant's internal controls over financial reporting.
July 30, 2004 /s/ JAMES B. FLAWS ---------------------- ----------------------------------------- Date James B. Flaws Vice Chairman and Chief Financial Officer

Exhibit 32
CORNING INCORPORATED
CERTIFICATION PURSUANT TO 18 U.S.C. SECTION 1350,
AS ADOPTED PURSUANT TO
SECTION 906 OF THE SARBANES-OXLEY ACT OF 2002
In connection with the Quarterly Report of Corning Incorporated (the "Company") on Form 10-Q for the period ended June 30, 2004 as filed with the Securities and Exchange Commission on the date hereof (the "Report"), we, James R. Houghton and James B. Flaws, Chairman and Chief Executive Officer and Vice Chairman and Chief Financial Officer, respectively, of the Company, certify, pursuant to 18 U.S.C. Section 1350, as adopted pursuant to Section 906 of the Sarbanes-Oxley Act of 2002, that:
(1) The Report fully complies with the requirements of section 13(a) or 15(d) of the Securities Exchange Act of 1934; and
(2) The information contained in the Report fairly presents, in all material respects, the financial condition and results of operations of the Company.
A signed original of this written statement required by Section 906 has been provided to Corning Incorporated and will be retained by Corning Incorporated and furnished to the Securities and Exchange Commission or its staff upon request.
End of Filing
© 2005 | EDGAR Online, Inc.
July 30, 2004 /s/ JAMES R. HOUGHTON ----------------------- --------------------------------------------- Date James R. Houghton Chairman and Chief Executive Officer July 30, 2004 /s/ JAMES B. FLAWS ----------------------- --------------------------------------------- Date James B. Flaws Vice Chairman and Chief Financial Officer