corot fields before corot – processing of large photometric databases zoltán csubry konkoly...
TRANSCRIPT
CoRoT fields before CoRoT – CoRoT fields before CoRoT – Processing of Large Photometric Processing of Large Photometric
DatabasesDatabases
Zoltán CsubryZoltán Csubry
Konkoly ObservatoryKonkoly ObservatoryBudapest, HungaryBudapest, Hungary
Hungarian CoRoT DayBudapest, 2007. 03. 12.
IntroductionIntroduction
PPrevious talk: revious talk: József József BenkBenkőő - - CoRoT fields before CoRoT CoRoT fields before CoRoT
GoalGoal: Find variable stars in NSVS database (in : Find variable stars in NSVS database (in CoRoT eyes)CoRoT eyes)
This talk presents the method we used to reach This talk presents the method we used to reach our goalour goal
Pre-selection of candidatesPre-selection of candidates
ROTSE database: huge amount of photomertic data, ROTSE database: huge amount of photomertic data, pre-selection is neededpre-selection is needed
Variability index (Akerlof et al, 2000): correlation Variability index (Akerlof et al, 2000): correlation between the residuals from the comparison of each between the residuals from the comparison of each magnitude to the mean valuemagnitude to the mean value
→→IIvarvar>4.5>4.5σσ is a good criteria for variable star candidates is a good criteria for variable star candidates Stars with 11 or less good data points are omittedStars with 11 or less good data points are omitted Reduces the field to about Reduces the field to about 82 00082 000 candidates candidates
(in CoRoT field of view and magnitude range)(in CoRoT field of view and magnitude range)
DifficultiesDifficulties
Still large amount of data Still large amount of data → automated data → automated data processing algorithm requiredprocessing algorithm required
Noisy and inhomogeneous data set Noisy and inhomogeneous data set False signals (random or systematic errors, False signals (random or systematic errors,
trends, sampling effects etc.) trends, sampling effects etc.)
→ → automatic data processing is very obscure automatic data processing is very obscure (difficult to separate false and real signals)(difficult to separate false and real signals)
→ → We used a two-step semi-automated methodWe used a two-step semi-automated method
TiFrAnTiFrAn
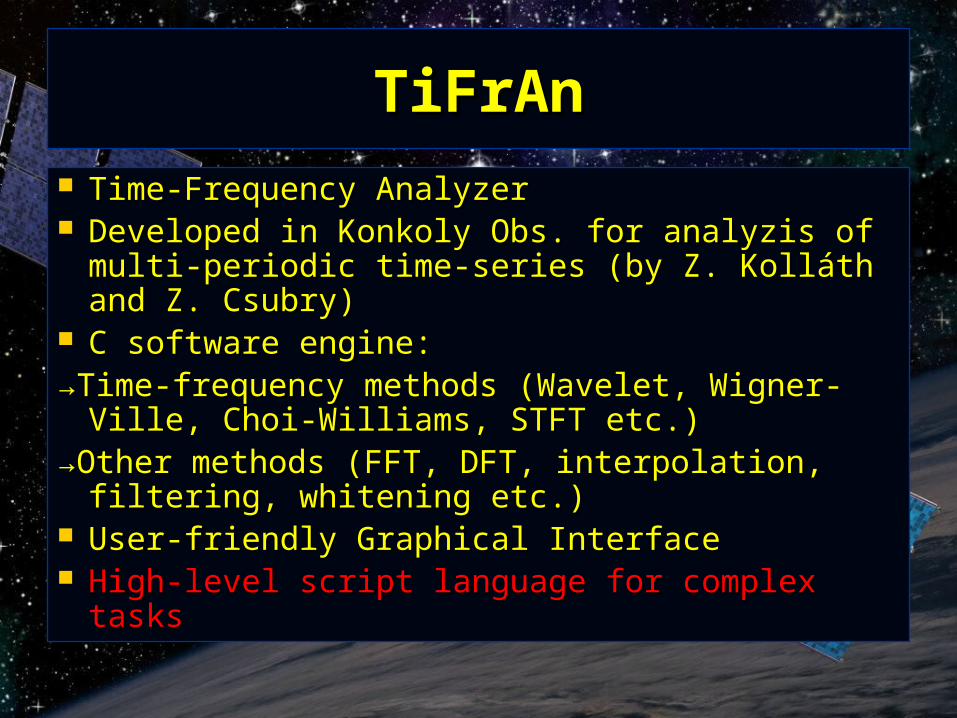
Time-Frequency AnalyzerTime-Frequency Analyzer Developed in Konkoly Obs. Developed in Konkoly Obs. for analyzis of multi-for analyzis of multi-
periodic time-series (by Z. Kolláth and Z. Csubry)periodic time-series (by Z. Kolláth and Z. Csubry) C software engineC software engine::→→Time-frequency methods (Wavelet, Wigner-Ville, Time-frequency methods (Wavelet, Wigner-Ville,
Choi-Williams, STFT etc.)Choi-Williams, STFT etc.)→→Other methods (FFT, DFT, interpolation, filtering, Other methods (FFT, DFT, interpolation, filtering,
whitening etc.)whitening etc.) User-friendly Graphical InterfaceUser-friendly Graphical Interface High-level script language for complex tasksHigh-level script language for complex tasks
TiFrAn script languageTiFrAn script language
Compatible with TclCompatible with Tcl Enables complete and/or repeatable tasks, and Enables complete and/or repeatable tasks, and
automatic processing of large data setsautomatic processing of large data sets Flexible output (PostScript figures and full log Flexible output (PostScript figures and full log
of data processing steps)of data processing steps)
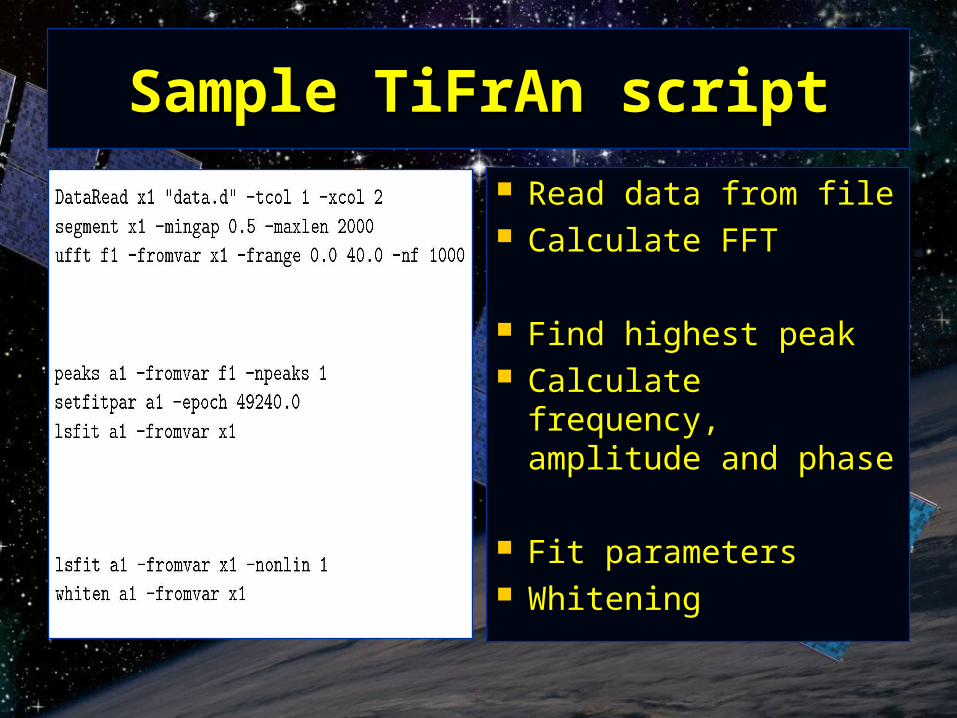
Sample TiFrAn scriptSample TiFrAn script
Read data from fileRead data from file Calculate FFTCalculate FFT
Find highest peakFind highest peak Calculate frequency, Calculate frequency,
amplitude and phaseamplitude and phase
Fit parametersFit parameters WhiteningWhitening
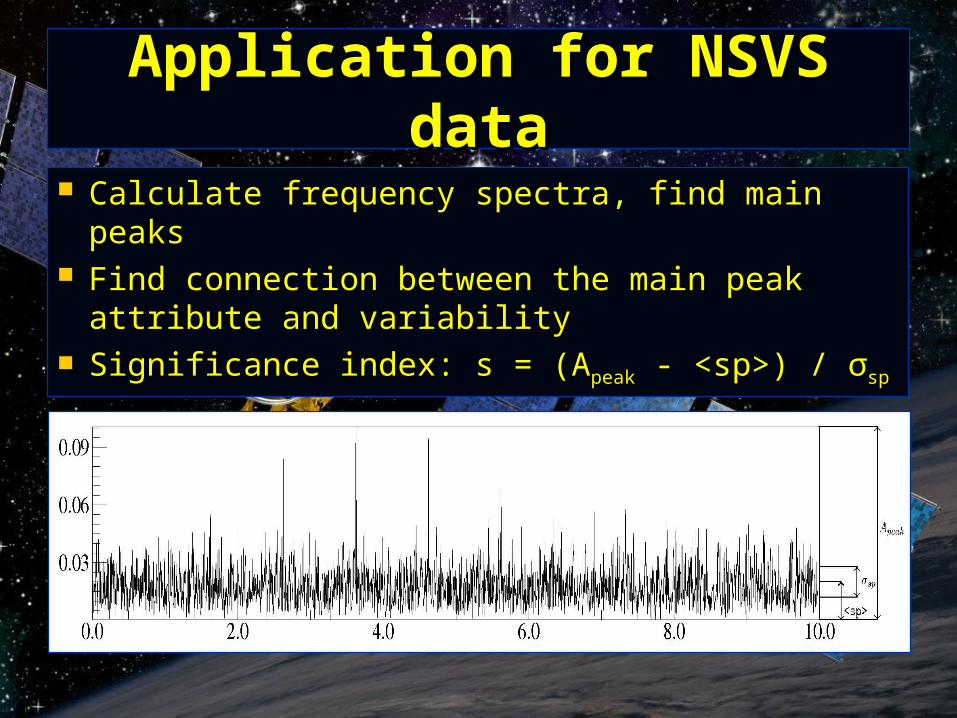
Application for NSVS dataApplication for NSVS data
Calculate frequency spectra, find main peaksCalculate frequency spectra, find main peaks Find connection between the main peak attribute and Find connection between the main peak attribute and
variabilityvariability Significance index: s = (ASignificance index: s = (Apeakpeak - <sp>) / - <sp>) / σσspsp
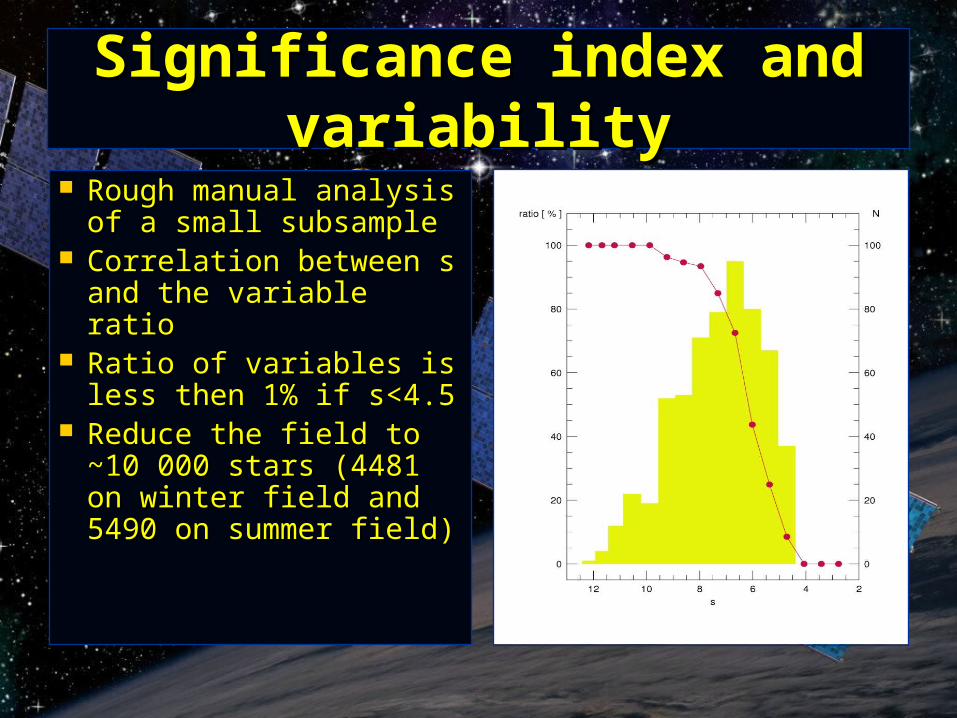
Significance index and variabilitySignificance index and variability
Rough manual analysis Rough manual analysis of a small subsampleof a small subsample
Correlation between Correlation between ss and the variable ratioand the variable ratio
Ratio of variables is less Ratio of variables is less then 1% if s<4.5then 1% if s<4.5
Reduce the field to ~10 Reduce the field to ~10 000 stars (4481 on 000 stars (4481 on winter field and 5490 on winter field and 5490 on summer field)summer field)
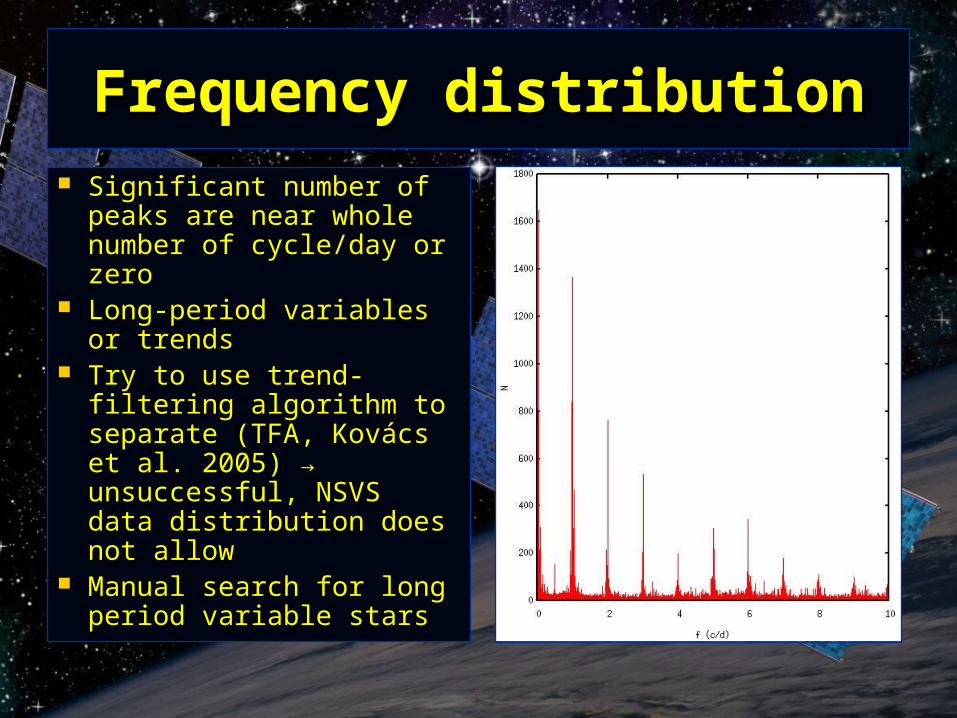
Frequency distributionFrequency distribution
Significant number of peaks Significant number of peaks are near whole number of are near whole number of cycle/day or zerocycle/day or zero
Long-period variables or Long-period variables or trendstrends
Try to use trend-filtering Try to use trend-filtering algorithm to separate (TFA, algorithm to separate (TFA, Kovács et al. 2005Kovács et al. 2005) ) → → unsuccessful, NSVS data unsuccessful, NSVS data distribution does not allowdistribution does not allow
Manual search for long Manual search for long period variable starsperiod variable stars
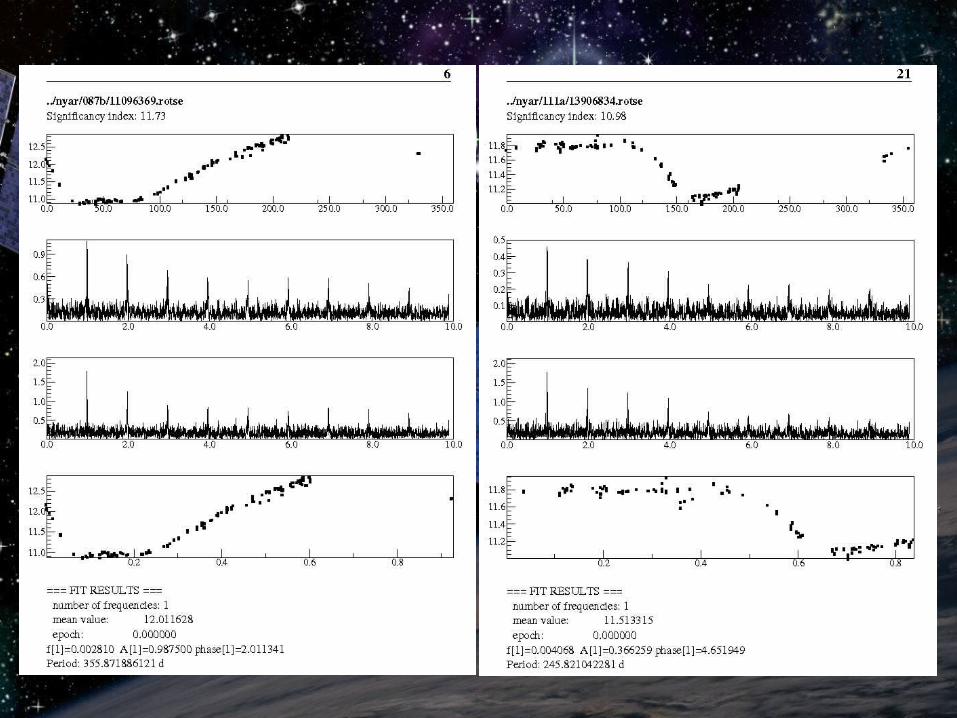
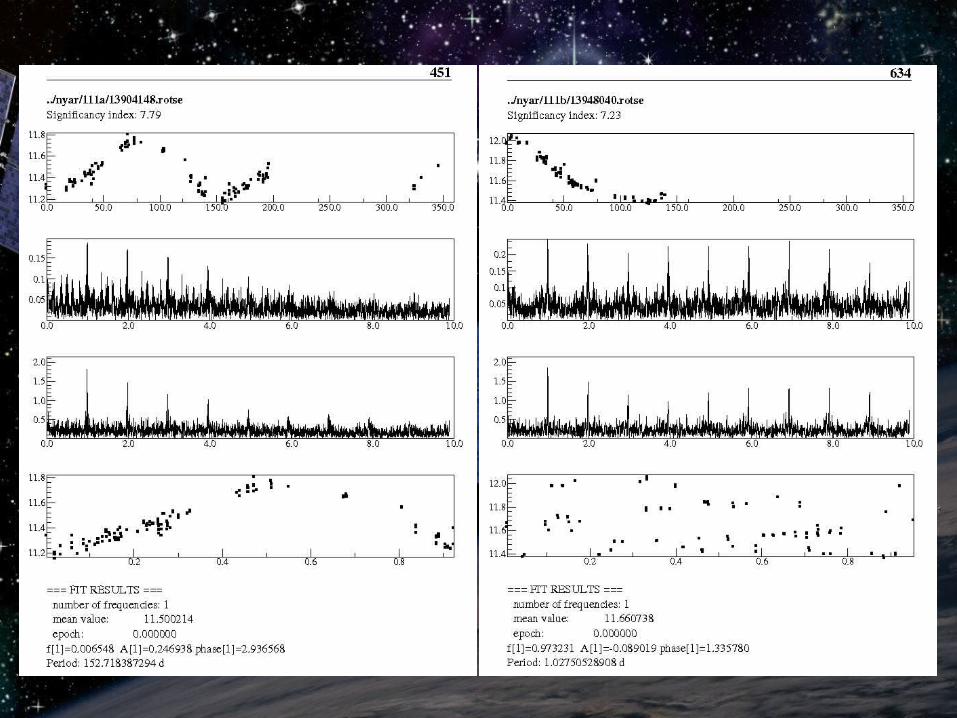
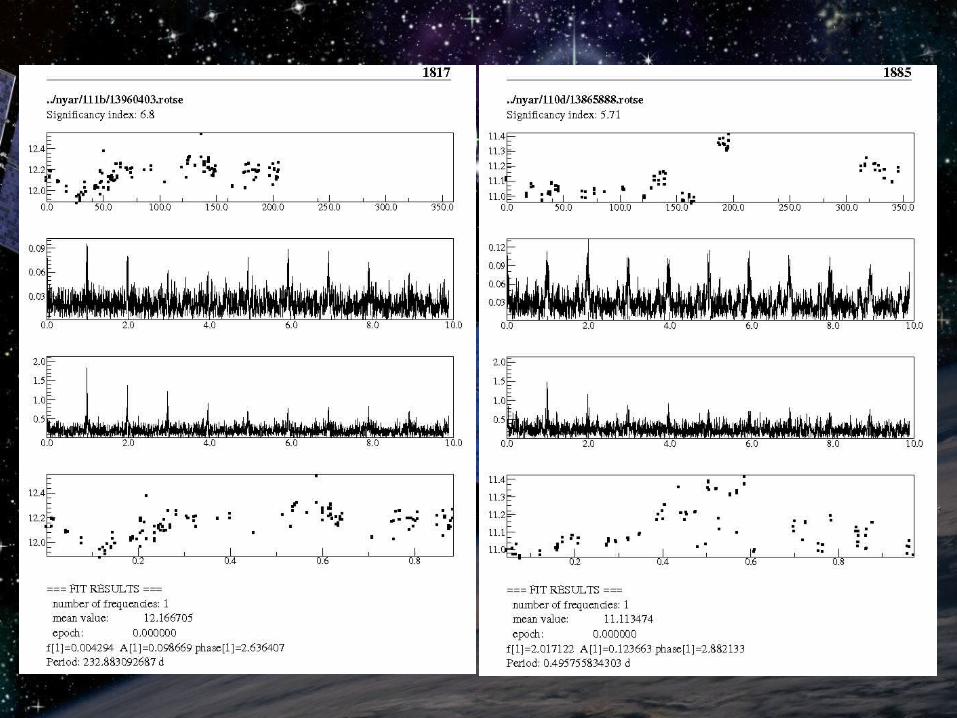
Long period variablesLong period variables
Manual examination of TiFrAn output: Manual examination of TiFrAn output: variable stars with large amplitude and long variable stars with large amplitude and long period are easy to findperiod are easy to find
From higher significance index to lowerFrom higher significance index to lower Lower s: semiregular and irregular variables, Lower s: semiregular and irregular variables,
results are somewhat obscureresults are somewhat obscure
→ → some of the stars are labeled as variable some of the stars are labeled as variable candidatecandidate
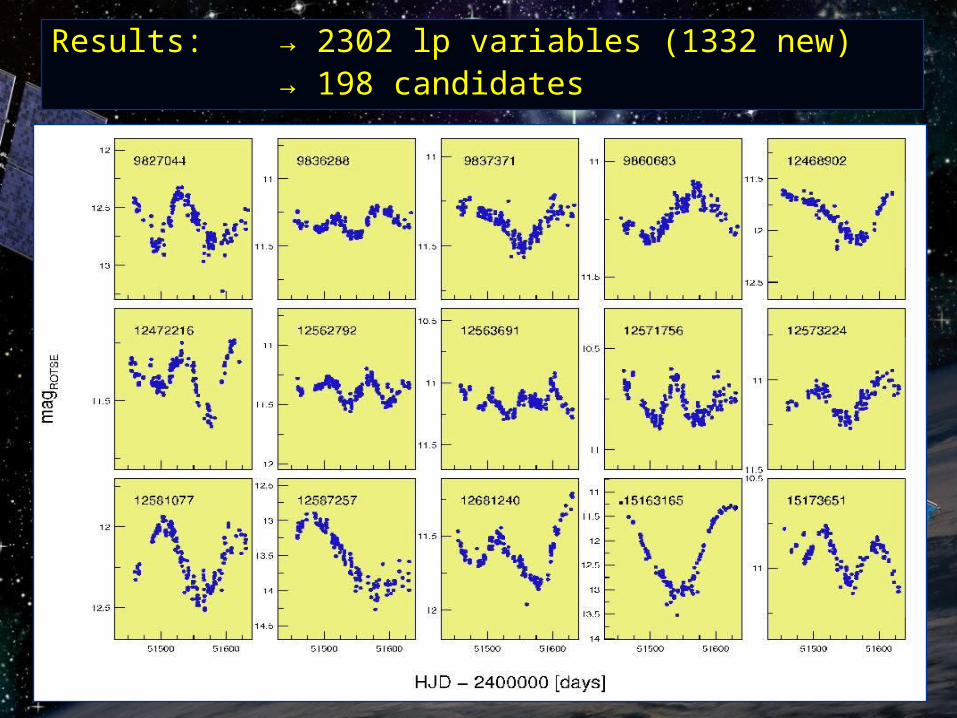
Results:Results: → 2302 lp variables (1332 new)→ 2302 lp variables (1332 new)→ → 198 candidates198 candidates
Reprocessing of remaining light curvesReprocessing of remaining light curves
Whitening to eliminate sampling effectsWhitening to eliminate sampling effects Recalculate significance indexRecalculate significance index If s > 4.5 If s > 4.5 → Place back into the data pool for → Place back into the data pool for
further analyzis further analyzis
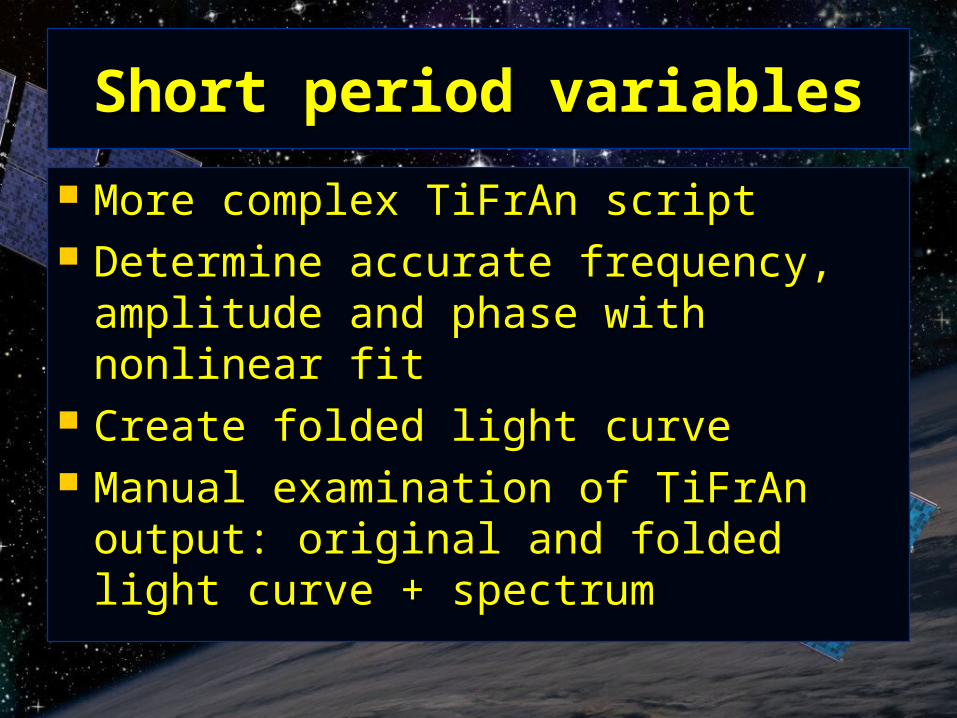
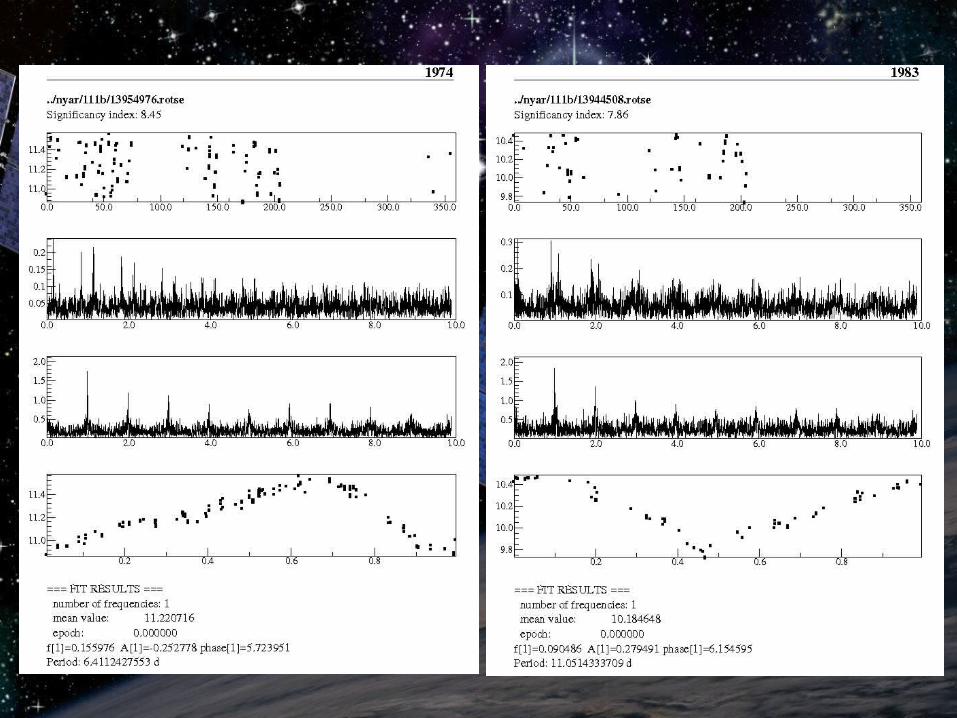
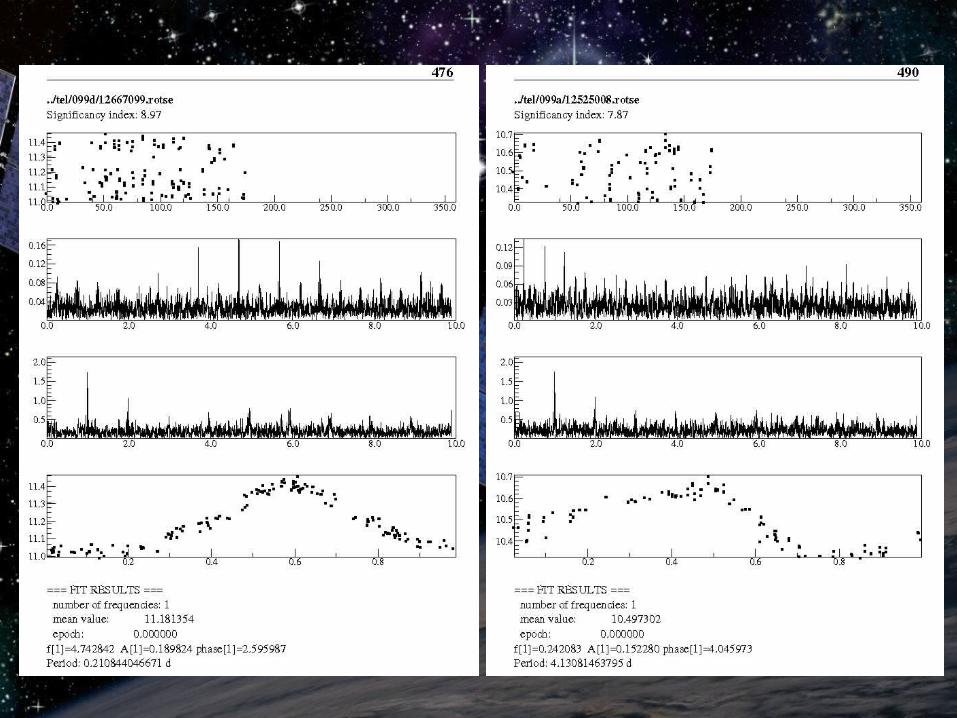
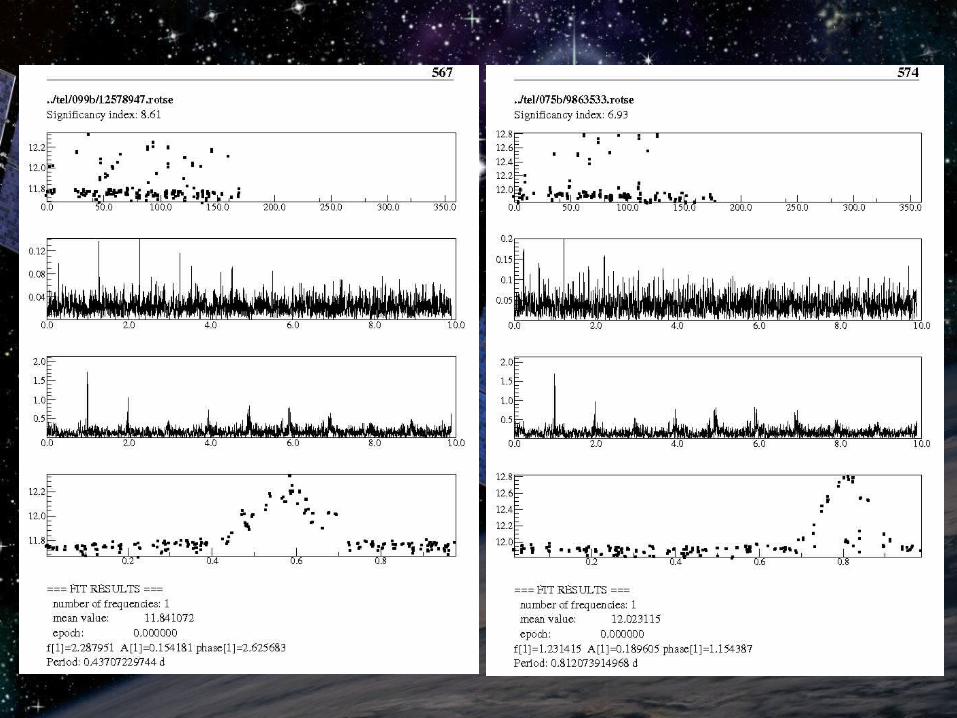
Short period variablesShort period variables
More complex TiFrAn scriptMore complex TiFrAn script Determine accurate frequency, amplitude and Determine accurate frequency, amplitude and
phase with nonlinear fitphase with nonlinear fit Create folded light curveCreate folded light curve Manual examination of TiFrAn output: Manual examination of TiFrAn output:
original and folded light curve + spectrumoriginal and folded light curve + spectrum
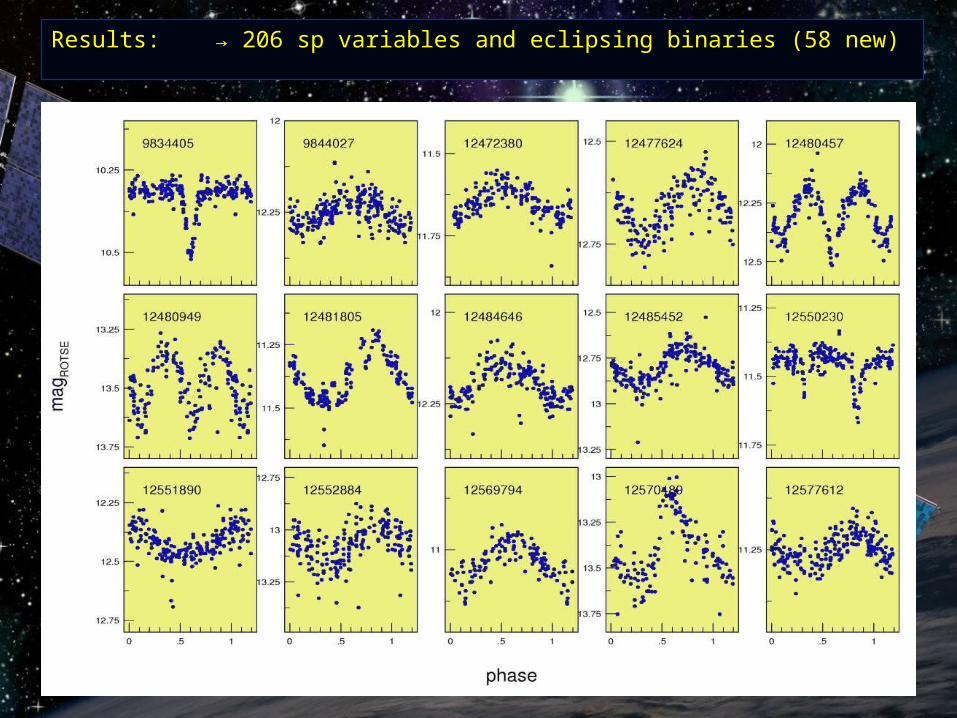
Results:Results: → 206 sp variables and eclipsing binaries (58 new)→ 206 sp variables and eclipsing binaries (58 new)
ConclusionConclusion Automatized analyzis of noisy and inhomogeneous Automatized analyzis of noisy and inhomogeneous
data is very difficult, usually manual intervention data is very difficult, usually manual intervention neededneeded
Two-step semi-automated method works well:Two-step semi-automated method works well:1. Reduce the number of candidates automatically1. Reduce the number of candidates automatically2. Final selection manually2. Final selection manually
Results: 2512 variable stars in COROT fields (1396 Results: 2512 variable stars in COROT fields (1396 new)new)→ → 2302 long period variables2302 long period variables→ → 161 short period variables161 short period variables→ → 45 eclipsing binaries45 eclipsing binaries

ThankThank You! You!