corporate directory...company secretaries seow han chiang winston lee sock wei registered and head...
TRANSCRIPT


SAKARI RESOURCES LIMITED Annual Report 2015 1
CORPORATE DIRECTORY
DirectorsMr Surong Bulakul ChairmanMs Rosaya Teinwan (w.e.f 1 Dec 2015) Chief Executive OfficerMr Pitipan Tepartimargorn Non-Executive DirectorMr Thanakorn Poolthavee Independent DirectorMr Han Eng Juan Independent DirectorMs Julie Therese Hall Independent Director
Audit, Risk and Compliance CommitteeMr Han Eng Juan ChairmanMr Thanakorn Poolthavee Member
Remuneration Committee and Nomination CommitteeMr Pitipan Tepartimargorn ChairmanMs Julie Therese Hall Member
Company Secretaries Seow Han Chiang WinstonLee Sock Wei
Registered and Head Office 391B Orchard RoadNgee Ann City Tower B 17-01Singapore 238874Tel (65) 6499 4100Fax (65) 6327 4222
Website www.sakariresources.com
Share Register Boardroom Corporate & Advisory Services Pte. Ltd. 50 Raffles Place #32-01Singapore Land Tower, Singapore 048623
Independent Auditors PricewaterhouseCoopers8 Cross StreetPWC BuildingSingapore 0484245 Audit Partner: Graham Lee

SAKARI RESOURCES LIMITED Annual Report 20152
SAKARI RESOURCES LIMITED
FIVE YEAR SUMMARY
Y/E 31 Dec ($M) 2011 2012 2013 2014 2015
Coal sales volume (Mt) 10.7 10.8 11.2 9.8 7.3
Coal revenue 1,010.4 924.0 811.2 632.7 401.5
Other revenue 3.1 3.2 1.7 2.2 4.1
COGS (696.7) (759.9) (746.0) (568.5) (363.1)
Gross profit 316.8 167.3 66.9 66.4 42.5
Other operating income/(expense) 13.1 6.2 (7.6) 4.6 (153.6)
Administrative, Corp & Technical (57.2) (31.0) (27.4) (21.7) (14.3)
Operating profit 272.8 142.5 31.9 49.3 (125.4)
Financial expenses (13.4) (13.5) (11.9) (8.2) (4.1)
PBT 259.4 129.0 20.0 41.1 (129.5)
Tax (69.1) (20.5) (10.6) (34.2) (49.3)
Net profit 190.3 108.5 9.4 7.0 (178.8)
Dividend (114.2) (65.1) - (1.7) -
Dividend Payout % 60% 60% 0% 25% 0%
EBITDA 321.2 230.4 187.5 145.7 77.2
Balance Sheet
Total Current assets 317.6 318.3 269.0 215.7 130.1
Total long-term assets 869.7 902.3 855.2 819.8 683.5
Total current liabilities 178.6 290.4 337.3 261.6 197.2
Total long-term liabilities 377.7 274.3 163.0 143.5 166.4
Total equity 631.0 656.0 624.0 630.4 450.0
Net debt 128.6 157.6 214.4 154.6 161.7

SAKARI RESOURCES LIMITED Annual Report 2015 3
Dear Shareholders
2015 saw no easing of the pressure on prices in the seaborne thermal coal industry. This was the fourth consecutive year of price declines that we have had to endure and we have continued to adjust our work practices and strategies in the face of the challenges that this backdrop has presented. I can say with confidence that your Board is satisfied that the Group is doing all that it can to keep operations cash positive whilst maintaining the long-term value of our coal resources and that shareholders should view the outcome for 2015 as a creditable performance in very difficult circumstances.
Sakari in 2015
We kept a strong focus on costs in all areas of the business throughout 2015, making reductions in some areas and improving efficiency wherever possible. We are aware that cost cutting can lead to a loss of expertise and know-how and we have made every effort to ensure that, when we do implement savings, we do not lose any of these intangible assets of our Group.
The Group’s gross profit margin was 11%, the same as 2014 despite the pressure from lower coal prices, and we reduced our overheads by 34% from 2014 and our finance costs by 50%. This demonstrates the good response our management made to the challenges that lower prices have presented on margins. In our review of the whole Group however, it became clear that international coal prices will not stage a
quick recovery and that we had to allow for the impairment of the value of our mines and intangible assets in our books. This impairment resulted in a non-cash write-down of $149.3 million in our assets and was the primary cause of the Group’s loss of $178.8 million in 2015. Our balance sheet is able to absorb this substantial loss without any threat to the Group’s financial stability as the impairment charge does not affect cash: we held cash of $33.2 million at the year end with substantial unused borrowing lines for our operations. In view of the loss, your Board has not recommended any dividend for 2015.
Shareholder Developments
We have persisted in our promise to keep PTT aware of the wish of most shareholders for some form of liquidity for their shares. PTT has acknowledged the problem that minorities have but, to date, has not been able to propose any solution. We will continue to keep the matter in PTT’s consideration.
Directorate
Mr Peerachat Pinprayong, who was appointed as Acting Chief Executive Officer in August 2014, stood down from this position to concentrate on another role in PTT Group and was replaced by Ms Rosaya Teinwan on 1 December 2015. We thank Mr Peerachat for his contribution to the Group since he was first appointed to the Board in 2010 and we welcome Ms Rosaya.
CHAIRMAN’S STATEMENT
SAKARI RESOURCES LIMITED Annual Report 20154
Conclusion
We remain firm in our belief that thermal coal will remain as a primary energy source for decades to come and that the current oversupply that has persisted for so many years will come to an end in the foreseeable future. We are at last seeing real signs that producers are cutting back volumes with major producing countries like Colombia and Indonesia reducing their exports in 2015. Lower production will help to bring the international markets back into balance more quickly and end the current over supply that is the cause of the pressure on coal prices.
When prices do strengthen, the decisions that Sakari has made over the last few years to preserve its resource to the highest extent possible will allow us to give back to
shareholders some of the sacrifices that you have suffered recently. In the meantime we must remain focused on our commitments to cost control and cash preservation.
In closing I would once again like to offer my sincere appreciation to the many public officers and communities that we deal with in Indonesia and elsewhere for their diligent approach to the issues that arise in the course of Sakari’s daily business, to my fellow Directors for their support and to Sakari’s staff for the commitment and loyalty that they have shown.
Mr Surong Bulakul Chairman
CHAIRMAN’S STATEMENT (cont'd)

SAKARI RESOURCES LIMITED Annual Report 2015 5
Surong Bulakul Chairman
Mr Surong was appointed to the Board of Sakari in February 2013, became Acting CEO in September 2013 and Chairman in May 2014. He holds a BSc in Industrial Engineering and Operations Research, a Master of Engineering in Operations Research and an MBA from Cornell University, USA. He joined PTT Group in 1973 where he has held senior management positions including Chief Operating Officer Infrastructure, PTT Public Company Limited. In addition to being Chairman of Sakari, he is also the Chairman of Global Power Synergy Company Limited, PTT Power Group’s flagship, a Director of IRPC Public Company Limited, other PTT group companies and the Provincial Electricity Authority of Thailand.
Rosaya Teinwan Acting Chief Executive Officer
Ms Rosaya Teinwan, who was appointed to the Board and the position of Acting CEO on 1 December 2015, has been employed by PTT Group since 1991. She holds a BSc in Electrical Engineering, a Master of Business Administration (MBA) and specializes in organizational development and planning. Ms Rosaya has been involved in the upstream and downstream business of PTT Group for many years, her last appointment being Executive Vice President of PTT and the acting President of PTT Green Energy Pte Ltd.
Han Eng Juan Independent
Mr Han who holds a Bachelor of Accountancy (Hons) (NUS) is a qualified accountant. He is a Director of the Singapore Deposit Insurance Corporation Limited, a Council Member and Chairman of the Audit Committee of the Singapore Red Cross Society. Mr Han has been awarded the Public Administration Medal (Silver) for service in the public sector and the Public Service Medal for community work. In the public sector, Mr Han has held senior positions in the Board of Commissioners of Currency Singapore and the Monetary Authority of Singapore. His last position in the private sector was as Senior Managing Director and Singapore Country Head of Dexia Banque Internationale à Luxembourg.
BOARD OF DIRECTORS

SAKARI RESOURCES LIMITED Annual Report 20156
Julie Therese Hall Independent
Ms Hall is a qualified geologist and also holds several diplomas in corporate directorship and financial planning. She is a Senior Fellow of the Corporate Directors Association, a member of the Australian Institute of Directors and a Senior Fellow of the Financial Securities Institute. Ms Hall has almost 30 years’ experience in mining projects in Australia and Asia, including 13 years at BHP Ltd. She is an Executive Director of Far East Energy Corporate Pty Limited and its subsidiaries, and a Director of Pegnel Resources Pty Limited, a private resources consultancy company.
Pitipan Tepartimagorn Non-Executive
Mr Pitipan holds a Bachelor of Engineering from King Mongkut’s Institute of Technology Ladkrabang and is a Master of Political Science in Public Administration from Thammasat University. He is a Senior Executive Vice President of PTT Group’s Human Resources & Organization Excellence and is Chairman of two PTT group subsidiaries, PTT ICT Solutions Company Limited and PTT Polymer Logistics Company Limited. Mr Pitipan was appointed as a director of Sakari in May 2014. He has vast experience in human resources development and enhancing benefits from cross-cultures in organisations.
Thanakorn Poolthavee Independent
Mr Thanakorn holds a B. Eng. in Mining from Chulalongkorn University, Thailand. He has extensive experience in the energy industry in a career that has included his holding the position of Deputy Governor, Fuel for The Electricity Generating Authority of Thailand (EGAT). He was formerly a Director of EGAT International Co. Ltd and Ratchaburi Electricity Generating Holding PLC. Mr Thanakorn was appointed to Sakari’s Board in May 2014.
BOARD OF DIRECTORS (cont'd)

SAKARI RESOURCES LIMITED Annual Report 2015 7
Management focus in 2015 was on ensuring that the Group would deliver the best positive performance from the operations at our mines whilst aggressively pursuing areas to improve efficiency and to reduce costs. Our planning had considered the likelihood of continued weak prices and, as a drop in coal prices throughout most of the year became a reality, we had to implement our decisions in response to the changing environment and keep our plans under constant review. We faced many hard decisions during 2015, including production cuts, costs cuts and headcount reduction and I am pleased with the manner in which management and staff have responded to these changes.
Sakari’s Performance in 2015
The Group’s loss of $178.8 million after taxation (2014: $7 million profit) includes a very substantial non-cash impairment charge of $149.3 million and tax expense of $49.3 million arising from prior year tax assessment. In terms of performance of the underlying business, the Group achieved a gross profit of $42.5 million (2014: $66.4 million) despite a $231.2 million reduction in revenue resulting from lower ASP and a decision to cut production by 21% from 10.0 Mt in 2014 to 7.9 Mt in 2015.
The decision to cut production was one of the more difficult decision that the Group faced but it was necessary as demand from our customers did not warrant higher levels of production and our stock levels
were running at historically high levels. Aside from the cost of holding stock, high stock levels involve their own operational problems such as spontaneous combustion risk, which add to costs, and so during much of H2 2015, we sought to reduce stocks rather than maintain production levels.
The non-cash impairment charge was $149.3 million and resulted in the removal of goodwill and other intangible assets from the Group’s balance sheet that were mainly related to the original cost of acquisition of our mines.
We decided to make significant staff cuts in our Head Office, to relocate the technical support office out of Balikpapan and to reduce headcount in the site administration offices, all of which helped to reduce our Administrative, Technical and Support costs to $14.3 million in 2015 (2014: 21.7 million). The benefit of these decisions will also be seen in 2016 and beyond.
Our treasury operations contributed to performance by reducing the Groups financial expenses by nearly 50% to 4.1 million (2014: $8.2 million).
Overall, I am very satisfied that management and staff have done all that they could to minimise the impact of market pressures on the Group’s operational and financial performance and that the outcome for 2015, with a solid EBITDA of $77.2 million, was a good outcome under all the difficult and challenging circumstances.
CHIEF EXECUTIVE OFFICER’S REVIEW
Dear Shareholders
SAKARI RESOURCES LIMITED Annual Report 20158
Exploration
In view of our search for savings in all parts of the business, we reduced exploration predominantly to infill drilling to assist operations. Further exploration at Sebuku is not necessary at this point and we have a very good detailed information and knowledge of the resource and reserves at Jembayan.
Business Development
Management was been much occupied with internal and operational matters in 2015 and we did not devote much effort to non-organic business development. However, with adversity comes opportunity and this is an area that we will need to consider carefully in 2016.
Sustainability
Sakari’s Sustainability Report for 2015 is included in this Annual Report.
Marketing
Sakari’s ASP in 2015 was $54.39/t (2014: $63.48/t), which we estimate to be a 7.4% premium to the mark-to-market level when compared to the Newcastle Index. Tiger Energy Trading Pte Ltd, the Group’s marketing subsidiary, has worked hard to maintain
excellent relationships with all our customers, which is vital when competition is so intense. The Group earned net despatch on its coal deliveries once again in 2015 thanks to the marketing team’s diligent work and co-operation with sites.
Outlook
I foresee further difficult times in 2016 for Indonesian coal producers despite the evidence that many companies are cutting production. Indonesia itself, and our own mines, have a cost base in US$ that means relative to our peers and competitors in countries such as Australia and South Africa, some of our core costs are increasing. These are structural problems that we will need to consider with our suppliers if we are to remain fully competitive.
Sakari is committed to keeping its status as one of Indonesia’s premier thermal export companies and we will continue to work hard to maintain operations that deliver the best possible returns for all stakeholders.
Rosaya Teinwan Chief Executive Officer
CHIEF EXECUTIVE OFFICER’S REVIEW (cont'd)

SAKARI RESOURCES LIMITED Annual Report 2015 9
FINANCIAL REVIEW
Revenue and Profit
($m) 2015 2014 YoY Change
Revenue 405.6 634.9 -36%
EBITDA 77.2 145.7 -47%
Net Profit/(Loss) After Tax (178.8) 7.0 -2,654%
EBITDA Margin (%) 19% 23% -17%
The most significant cause of the Group’s 2015 loss was an impairment charge of $149.3 million, which reduced the carrying amount of goodwill by $78.5 million and the book value mining properties by $70.8 million. The impairment charge arose due to the pressure on the long-term thermal coal price outlook resulting from continued significant oversupply.
In response to the over-supply situation, the Group reduced its production volume in 2015, particularly in H2 2015, and ASP was lower compared to 2014 due to falls in international prices. The poor market condition and the strategic decision to reduce production resulted in a fall in revenue by 36% from 2014.
A year-on-year decrease in EBITDA margin was caused by the difference in unrealised exchange gains/losses between 2014 and 2015. However, the Group EBITDA remained strong at $77.2 million (19% of revenue), demonstrating the fundamental operational strength that underlies the Group’s business and the sound judgements management has made in decisions to control costs. Without the measured response to the pressure on margins caused by reduced revenue, the Group’s operating result and EBITDA would have been substantially lower.
The Group’s incurred a tax charge of $49.3 million in 2015 despite the loss, primarily due to prior year tax assessment.

SAKARI RESOURCES LIMITED Annual Report 201510
FINANCIAL REVIEW (cont'd)
The Group’s total assets significantly decreased by 21% from 2014 due to the impairment of goodwill and the value of mining properties.
In 2015, we improved the borrowing terms of our financial facilities, which were
arranged through our holding company, PTT, and this lowered the financing cost for the Group to $4.1 million (2014: $8.2 million).
Pimporn Sailasuta Chief Financial Officer
Balance Sheet
($m) 2015 2014
Total current assets 130.1 215.7
Total long-term assets 683.5 819.8
Total current liabilities 197.2 261.6
Total long-term liabilities 166.4 143.5
Total equity 450.0 630.4

SAKARI RESOURCES LIMITED Annual Report 2015 11
OPERATIONS’ REVIEW
Production and Sales Volumes
Kt Year Ended 31 December
Sebuku 2015 2014
Coal mined 2,568 3,568
Product coal 1,928 3,132
Own coal sales 1,849 3,074
Jembayan
Coal mined 5,354 6,636
Product coal 5,956 6,882
Own coal sales 5,287 6,779
Total
Coal mined 7,922 10,204
Product coal 7,884 10,014
Own coal sales 7,136 9,853
Overview
In line with the prolonged depressed coal market, SAR continued to consolidate mining operations and intensified efforts on cost reduction initiatives.
Total production volume dropped by 2.1 Mt or 21%. This is in line with SAR planned strategy for 2015 to maintain optimum production level sufficient to meet all contractual obligations while preserving SAR's coal reserves.
Despite the reduction in production volume, we are pleased to report that SAR's average mining cost was reduced by $8.25 or 16% per ton. The reduction in production cost is mainly attributable to past and on-going cost improvement
initiatives across the entire value chain from pit to ship. In addition, the drop in fuel cost has also contributed to the lower production cost.
As coal demand remained bearish with prices continuing to move south, coupled with the volat i l i ty of oi l prices and global influences on the coal industry in Indonesia, SAR management has developed and put in place action plans to mitigate potential risks that could disrupt our mining operations and profitability in Indonesia.

SAKARI RESOURCES LIMITED Annual Report 201512
OPERATIONS’ REVIEW (cont'd)
Jembayan
Jembayan coal production was reduced by 926Kt or 13% compared to 2014. The lower production volume was in line with our strategy of optimising production level in tandem with market demands and without compromising Jembayan's coal reserves.
As reported, mining in the two main pits which started in 2014 are at its optimum production level. This has contributed significantly to Jembayan coal production for 2015, and will continue to be the main production source for Jembayan in the coming years. Both pits are strategically designed and developed with flexibility that allows us to respond to market changes in a more efficient manner.
In addition to its own production, Jembayan continues to engage neighbouring mines actively on joint mining activities. These ini t iat ives wil l continue to improve utilization of Jembayan’s infrastructures, thus generating additional revenue and help to reduce Jembayan’s fixed cost.
Sebuku
Sebuku's coal production was reduced by 1,204Kt or 38% compared to 2014. The lower p roduc t ion vo lume was strategically planned to minimize the impact from low coal prices. Despite higher mud mining volume and other operational challenges encountered in the northern area of MBR, Sebuku is able to continue to reduce its overall production
cost as a result of effective cost reduction initiatives. As coal from MBR has a higher sulphur and ash content, Sebuku will continue to face production cost challenges ahead, and the management will continue to focus on new cost reduction initiatives to ensure that Sebuku can overcome these challenges and continue its operations in coming years.
Quality, Security, Safety, Health and Environmental (QSSHE)
For information on Sakari’s QSSHE and other Sustainable business initiatives, please see our Sustainability Report in this Annual Report.
David Lim Chief Operating Officer
SAKARI RESOURCES LIMITED Annual Report 2015 13
MARKETING AND SALES REVIEW
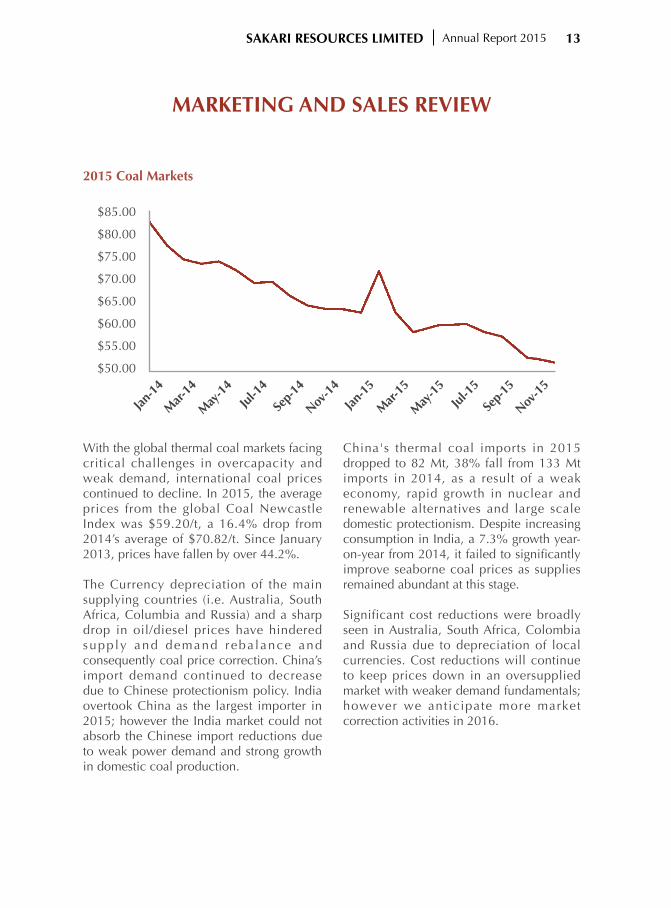
With the global thermal coal markets facing critical challenges in overcapacity and weak demand, international coal prices continued to decline. In 2015, the average prices from the global Coal Newcastle Index was $59.20/t, a 16.4% drop from 2014’s average of $70.82/t. Since January 2013, prices have fallen by over 44.2%.
The Currency depreciation of the main supplying countries (i.e. Australia, South Africa, Columbia and Russia) and a sharp drop in oil/diesel prices have hindered supply and demand reba lance and consequently coal price correction. China’s import demand continued to decrease due to Chinese protectionism policy. India overtook China as the largest importer in 2015; however the India market could not absorb the Chinese import reductions due to weak power demand and strong growth in domestic coal production.
China's thermal coal imports in 2015 dropped to 82 Mt, 38% fall from 133 Mt imports in 2014, as a result of a weak economy, rapid growth in nuclear and renewable alternatives and large scale domestic protectionism. Despite increasing consumption in India, a 7.3% growth year-on-year from 2014, it failed to significantly improve seaborne coal prices as supplies remained abundant at this stage.
Significant cost reductions were broadly seen in Australia, South Africa, Colombia and Russia due to depreciation of local currencies. Cost reductions will continue to keep prices down in an oversupplied market with weaker demand fundamentals; however we anticipate more market correction activities in 2016.
2015 Coal Markets
$85.00
$80.00
$75.00
$70.00
$65.00
$60.00
$55.00
$50.00
Jan-1
4
Mar-
14
May
-14
Jul-1
4
Sep-
14
Nov-1
4
Jan-1
5
Mar-
15
May
-15
Jul-1
5
Sep-
15
Nov-1
5

SAKARI RESOURCES LIMITED Annual Report 201514
MARKETING AND SALES REVIEW (cont'd)
Tiger Energy’s Performance
The Group’s ASP in 2015 was $54.39/t, which includes contributions from trading and derivative transactions. With the new challenge on changing of Sebuku product quality (higher sulphur content), on the mark-to-market basis, we estimate that our ASP still represents a premium of 7.4% to the global Coal Newcastle index average. The ASP declined 14.7% year-on-year whilst the global Coal Newcastle index average declined 16.4% year-on-year.
On the coa l t rad ing bus ine s s , t he partnership initiated from 2014 with some producers remain on-going. We also maximize the Group profitability by enhanced sales of by-product coal from Sebuku washing plant. The total sales of coal from third party mines and new products amounted to 0.34Mt in 2015.
For another year, Tiger Energy’s shipping and logistics team achieved a net despatch by working closely with customers and site operations. This has emphasized Sakari’s reputation as a reliable producer which is beneficial in a weaker market.
Despite the challenging market condition, Tiger Energy keeps a strong focus on providing the highest quality level of service for its customers and continuous efforts to develop new markets and new products that add value to the Group.
Rosaya Teinwan PresidentTiger Energy Trading Pte Ltd
SAKARI RESOURCES LIMITED Annual Report 2015 15
SUSTAINABILITY
Overview
Sakari aspires to conduct business in line with the principles of sustainable development through providing leadership, building trust and creating a sustainable future for the society and the environment in which it operates through innovation, excellence and transparency. We encourage stakeholders to actively share information with us to provide feedback on any issues affecting our relationships. This Sustainability Report covers the period 1 January 2015 to 31 December 2015 and has been prepared in accordance with the principles set out in ISO26000. Community
Sakari is integrally involved with, and sees itself as part of, the local communities in the area of our mines who are key stakeholders in Sakari's operations. An objective of our work with communities is to offer development opportunities, education and training so that they may be more self-sufficient after mining in their area (with its consequential benefits) has finished. We recognize the rights of community members and treat them with respect and equality. Each of our mines has a Community Development Department, whose purpose is to ensure that we implement our Community Social Responsibility (CSR) programmes to achieve the goal of enriching the lives of local community members who are affected by, or interact with, our operations. To ensure engagement with communities is effective, social mapping programmes have been undertaken at both Jembayan and Sebuku in prior years: the data obtained has greatly assisted us to further identify areas where our sustainability efforts may best be applied. Regular meetings are held with community members, village leaders and local politicians to discuss current and potential programmes. During 2015 Sakari staff also participated in local government strategic planning sessions to ensure our efforts are synchronized with those of local government bodies. Below is a summary of the major initiatives that Sakari supported during 2015:
1. Infant mortality: Sakari regularly work with the local communities to reduce infant mortality and to improve maternal health by donating food supplements to infants and pregnant mothers.

SAKARI RESOURCES LIMITED Annual Report 201516
SUSTAINABILITY (cont'd)
2. Farming and livestock farming: We continued to devote resources to the integrated Farming System (IFS) programmes that we have promoted and we have increased the self-sufficiency of many local community members. The farms are starting to generate modest amounts of regular income. During 2015 Jembayan has helped to establish new micro-farms and demonstration plots in mined-out areas of 40 hectares which are well integrated with livestock farming. By coordinating with the Provincial Farming Department, many training sessions have been provided to the community, focusing on growing rice and beans and livestock farming particularly cows and goats. The programme for development of rice paddy fields links with the government’s Food Defence Programme.
Similarly, Sebuku participated in the local government’s Project Cetak Sawah (create new rice paddy fields), which created 32 hectares of floodable rice paddy fields, some of which use our land that we have rehabilitated after mining. The harvest in late 2015 resulted in an average yield of 4.5 tons per hectare.
At Jembayan, we partnered with local government to participate in the Two Million Cows project. We donated 50 cows and 20 hectares and built some cow-sheds for housing the animals. Similarly, the Goat Breeding project was also targeted as a way for community members to create a sustainable source of food and income. In 2015, Mekarsari Group, the group of goat livestock created by Jembayan’s Community Development Program was awarded a second place of the provincial livestock award. We target to achieve the award for the Cow livestock project in the future.
3. Education remains in our focus: in 2015 we provided training for school children to become computer literate and donated several computers to increase the availability of the programme. We provided many books to local libraries and encouraged reading. We also awarded several scholarships to various higher educational institutions for outstanding achievers. We also undertook several projects to build new schools and facilitate repairs to existing schools.
4. Health awareness was again promoted in many villages by having regional doctors provide health screening and training on general health and hygiene. Sakari also donated and helped improve infrastructure such as roads, bridges, sewers and drains in an effort to improve the living conditions in villages around our mine sites.
5. Disaster relief assistance Sakari staff provided general ad-hoc disaster relief assistance to victims of fires and floods on a wider basis than just those living near our mines. This ranged from giving blood to donating food, small household items and care packages.
SAKARI RESOURCES LIMITED Annual Report 2015 17
SUSTAINABILITY (cont'd)
6. Social activities and community bonding have been made by sponsoring local community cultural, religious, sporting and educational activities. In this programme, Sakari contributes food and household items and our staff volunteer to assist the community organizers who host these events. Another way we support this goal is by building community halls for general use by villagers.
Staff participated in a mass blood donation programme which resulted in approximately 230 litres of blood being made available for members of the public.
Consumer
We have considered our coal products carefully and concluded that nothing we sell is inherently dangerous to customers in the form in which it is sold. It is organically and chemically stable and can be handled, stored and stockpiled safely with low risk to the environment and people, given that normal industry safety standards are followed. Sakari discloses specifications for its products in a clear and transparent manner. Independent analysis of the products prior to sale ensures that customers are certain about quality and that a fair price is achieved for each sale. Any discrepancies between quoted and actual specifications are openly resolved with customers. Many of Sakari’s customers request multi-year contracts so that they can enjoy stable supplies and a long-term relationship with Sakari. These long-term relationships evidence the value we place on consumer service, support and responsibility when making sales. Environment
Minimizing the effect our operations have on the environment is another of the Sakari’s sustainability focuses. Our goal is to reduce the impact of our footprint on the local flora and fauna so as to preserve the ecosystem and protect biodiversity in areas under our care. Ensuring that our impact is minimal will contribute to the long-term livelihoods of local communities who rely on a well-balanced environment for their day to day living. We ensure that we are achieving our goals through diligent monitoring of air and water quality and look to the future targets through ongoing environmental impact assessments. Both mines are regularly visited by staff from the Department of Mines and Energy and other state and local government agencies that undertake environmental audits and reviews. The results of the 2015 audits and reviews were positive, with only minor items raised, most of which have been rectified at the date of this report.

SAKARI RESOURCES LIMITED Annual Report 201518
SUSTAINABILITY (cont'd)
During 2015 we continued to work with an independent third-party consultant, Environment Resource Management (ERM) Indonesia, to perform independent audits of our Environmental Management Systems at Jembayan Site. The matters arising from the audits were not significant and are in the process of being rectified and will be re-checked by ERM Indonesia in 2016. In collaboration with ERM Indonesia, Jembayan conducted a preliminary energy audit on the total amount of energy we consumed and saved during the last 3 years. This audit is mandatory for those companies that consume energy more than 6,000 toe (ton of equivalent) of fuel. In 2015, Jembayan has obtained an approval from the authority for our document on environmental impact assessments. This is our efforts to proactively manage and minimize the impact on areas being prepared for future mining. Total area of 196 hectares of disturbed land were re-vegetated which achieved 100% of the Target for 2015. This brings the total rehabilitated area over Jembayan’s life of mine to 865 hectares as at December 2015. According to carbon stock calculation, these areas can reduce 7,454 tons of carbon and provide 18,413 tons of biomass. During the year Sebuku focused on rehabilitation of areas which were previously used as intermediate coal stockpiles, with topsoil being spread and seedlings planted to ensure the return of native vegetation. Total area of 28 hectares were re-vegetated, bringing the total rehabilitated area over Sebuku’s life of mine to 692 hectares as at December 2015.
Awards and Certifications
In 2015, Jembayan received the Gold Provincial PROPER Award for environmental excellence. This is the second time Jembayan has received this prestigious award. This award recognizes outstanding performance in hazardous waste recycling and management, implementation of Environmental Impact Assessments, compliance with all relevant environmental regulations and permits, and the effectiveness of corporate social responsibility (CSR) programmes. This represents and reflects consistent efforts and commitments in pursuing environmental excellence.
Jembayan was also awarded the rank of ADITAMA (First Place) for the Mine Environment Management Award which was organized by Ministry of Energy and Natural Resources. This represents the culmination of several years of concerted efforts of striving for environmental excellence, evidencing our enduring commitment to nurture the environments in which Sakari's businesses operate

SAKARI RESOURCES LIMITED Annual Report 2015 19
SUSTAINABILITY (cont'd)
In 2015 Sebuku retained the level of Blue National PROPER Award and was also awarded the rank of PRATAMA (third place) under the Mine Environment Management Award.
Both mines remained certified under ISO 14001:2004 Environmental Management Systems throughout the year. Year 2015 was the second period of the 3-year cycle for Jembayan in applying ISO 14001:2004. Fair Operating Practices
Fair Operating Practices (FOP) relates to Sakari applying ethical practices in dealings with all other entities. FOP consists of five key areas; anti-corruption, responsible political involvement, fair competition, promoting social responsibility and respect for property rights. FOP is a core area that Sakari monitors at the corporate level and reports upon annually. Sakari has a long history of conducting its operations in accordance with principles of FOP and during 2014 we operated all business units with the ethics and transparency expected by our Corporate Code of Conduct. Each year, all staff are required to confirm they have read the code and agree to comply with its terms. A central contracts register has been established to assist in confirming that Sakari has complied with FOP in the negotiation of key contracts. Human Rights
Sakari has a solid reputation for upholding international human rights’ principles.Supporting Sakari’s adherence to these principles are our Corporate Code of Conduct, our Whistleblower Policy, policies for equal opportunity of employment, training procedures, our Occupational Health and Safety Policy, anti‐discrimination procedures, local community procedures, purchasing procedures, marketing procedures and our Legal and Anti-Corruption Policy.
A statement on human rights has been adopted by senior management and staff has been made aware of this statement. Ongoing business operations with communities, suppliers and customers have not revealed any indication of possible breaches of the commitment to human rights. Should Sakari become aware that a breach may have occurred, Sakari would immediately review the matter and determine appropriate remedial action.
SAKARI RESOURCES LIMITED Annual Report 201520
SUSTAINABILITY (cont'd)
Labour Safety
Safety of all personnel is of paramount importance to Sakari. Management is fully committed to creating a workplace that places safety as the primary objective, striving to achieve zero injuries. Occupational health and safety is an integral part of employee culture at all levels of the Group. A comprehensive framework of health and safety policies and procedures has been implemented to protect our staff and ensure Sakari complies with all relevant laws and regulations. Sakari encourages our key stakeholders to exercise the highest levels of safety standards relevant to their area of operations. Personal safety equipment is readily available for all persons.
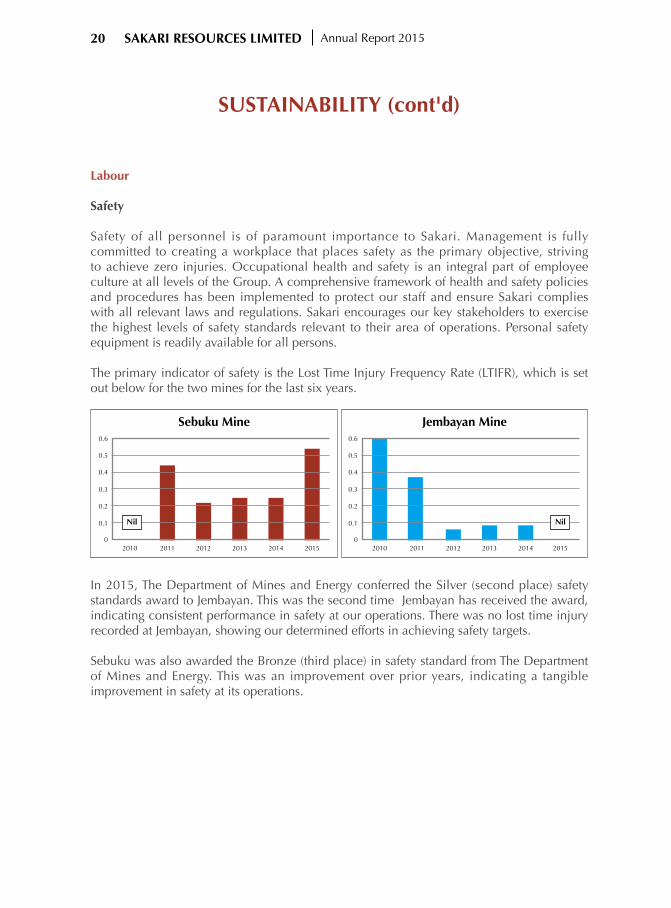
The primary indicator of safety is the Lost Time Injury Frequency Rate (LTIFR), which is set out below for the two mines for the last six years.
In 2015, The Department of Mines and Energy conferred the Silver (second place) safety standards award to Jembayan. This was the second time Jembayan has received the award, indicating consistent performance in safety at our operations. There was no lost time injury recorded at Jembayan, showing our determined efforts in achieving safety targets. Sebuku was also awarded the Bronze (third place) in safety standard from The Department of Mines and Energy. This was an improvement over prior years, indicating a tangible improvement in safety at its operations.
Sebuku Mine Jembayan Mine
Nil Nil
2010 2010
0.6 0.6
0.5 0.5
0.4 0.4
0.3 0.3
0.2 0.2
0.1 0.1
0 02011 20112012 20122013 20132014 20142015 2015

SAKARI RESOURCES LIMITED Annual Report 2015 21
SUSTAINABILITY (cont'd)
Employees
In an effort to build a more efficient and professional team, the average number of direct-hired employees over the years have been curtailed continuously over the last 3 years, with the greatest drop of 17% from 2014 compared to 2015. The following table provides the average number of employees and contractors over in 2015:-
JMB Mine SBK Mine Supports
Average Headcount 340 282 100
Average Contractors' Headcount 2,598 977 0
Group local employment 89% 75% 65%
Group Women Employed 7% 5% 39%
Disabled Employed 0 0 0%
Average training hrs per employee 20 26 20
Whistleblower complaints 0 0 0
Formal complaints 0 0 0
Employees with written contracts 100% 100% 100%
Unionized employees 82% 0 0
That our organization choose to build our key competitiveness through our people is fundamental to our success. We have set out to deliver greater values to our shareholders by focusing on facilitating a culture where our employees work smarter through coaching, training, knowledge sharing and career development.
Employee Social Dialogue
SPIRIT which is PTT’s preferred acronym stands for:
SYNERGYPERFORMANCE EXCELLENCE
INNOVATIONRESPONSIBILITY FOR SOCIETY
INTEGRITY AND ETHICSTRUST AND RESPECT
Our corporate value SPIRIT enables us to align the aspirations of our major shareholder with our people in a common purpose and providing clear guidance for the way we do our business.

SAKARI RESOURCES LIMITED Annual Report 201522
SUSTAINABILITY (cont'd)
Generally the coal mining industry does not attract female empolyees. However, in 2015 Sakari has seen an increase in number of female empolyees in its workforce.
Union and management representatives continue to build on its amicable and harmonious relationship which was facilitated by regular bipartite sessions. Organisation Governance
As stakeholders become more aware of global issues, corporate performance is not only measured from the financial level but also in terms of governance, social and environmental performance. Sakari strives to ensure that good governance is present at all levels of the Group’s business, encouraging fair, equitable and ethical decision making with transparency. During 2015, Sakari continued working on implementation of the Sakari Group Governance Policies which Sakari has adopted based primarily on the governance framework of the PTT Group since 2014. We have aligned our strategic planning process with a systematic planning process of PTT Group to ensure that our corporate strategy is comprehensively reviewed and formulated towards short term and long term objectives.
Our commitment in 2016 is to review and update Sakari Group Authority Matrix and relevant standard operating procedures to align with the new Sakari Group Organization Structure as well as to ensure good governance and transparency.

SAKARI RESOURCES LIMITED Annual Report 2015 23
SAKARI RESOURCES LIMITED(Incorporated in Singapore)AND ITS SUBSIDIARIES
ANNUAL REPORTFor the financial year ended 31 December 2015
ContentsPage
24 Directors’ Statement
28 Independent Auditor’s Report
30 Consolidated Income Statement
31 Consolidated Statement of Comprehensive Income
32 Balance Sheets
34 Consolidated Statement of Changes in Equity
35 Consolidated Statement of Cash Flows
36 Notes to the Financial Statements

SAKARI RESOURCES LIMITED Annual Report 201524
DIRECTORS’ STATEMENTFor the financial year ended 31 December 2015
DIR
ECTO
RS’
STA
TEM
ENT
The directors present their statement to the members together with the audited financial statements of Sakari Resources Limited and its subsidiaries (the “Group”) for the financial year ended 31 December 2015 and the balance sheet of Sakari Resources Limited (the “Company”) as at 31 December 2015.
In the opinion of the directors,
(a) the balance sheet of the Company and the consolidated financial statements of the Group as set out on pages 30 to 100 are drawn up so as to give a true and fair view of the financial position of the Company and of the Group as at 31 December 2015 and the financial performance, changes in equity and cash flows of the Group for the financial year covered by the consolidated financial statements; and
(b) at the date of this statement, there are reasonable grounds to believe that the Company, will be able to pay its debts as and when they fall due.
Directors
The directors of the Company in office at the date of this statement are as follows:
Mr Surong Bulakul Non-executive Chairman Mr Han Eng Juan Independent DirectorMs Julie Therese Hall Independent Director Mr Thanakorn Poolthavee Independent Director Mr Pitipan Tepartimargorn Non-executive Director Ms Rosaya Teinwan Chief Executive Officer/Executive Director (appointed on 1 December 2015)
Arrangements to enable directors to acquire shares or debentures
Neither at the end of nor at any time during the financial year was the Company a party to any arrangement whose object was to enable the directors of the Company to acquire benefits by means of the acquisition of shares in, or debentures of, the Company or any other body corporate, other than as disclosed under “Share options” in this statement.
Directors' interests in shares or debentures
(a) According to the register of directors' shareholdings, none of the directors holding office at the end of the financial year had any interest in the shares or debentures of the Company or its related corporations, except as follows:

SAKARI RESOURCES LIMITED Annual Report 2015 25
DIRECTORS’ STATEMENTFor the financial year ended 31 December 2015
Directors' interests in shares or debentures (continued)
Holdings registered in name of director or nominee
Holdings in which a director is deemed to have an interest
At 31.12.2015
At 1.1.2015 or date of
appointment, if later
At 31.12.2015
At 1.1.2015 or date of
appointment, if later
PTT Public Company Limited Ultimate holding corporation(No. of ordinary shares)Mr Pitipan Tepartimargorn 4,334 4,334 - -Mr Surong Bulakul 97,261 118,183 - -Ms Rosaya Teinwan 19,096 11,288 - -
(No. of unsecured bonds)Ms Rosaya Teinwan 100 100 - -
PTT Exploration and Production Public Company LimitedRelated corporation(No. of ordinary shares)Mr Surong Bulakul 14,349 14,349 - -Mr Pitipan Tepartimargorn - 3,000 - -
PTT Global Chemical PlcRelated corporation(No. of ordinary shares)Mr Pitipan Tepartimargorn 17,081 4,081 - -Mr Surong Bulakul 26,651 26,651 - -
IRPC Public Company LimitedRelated corporation(No. of ordinary shares)Mr Pitipan Tepartimargorn 500,000 450,000 - -Mr Surong Bulakul 35,000 35,000 - -Ms Rosaya Teinwan 40,000 40,000 - -
Thai Oil Public Company LimitedRelated corporation(No. of ordinary shares)Mr Surong Bulakul 64,700 64,700 - -Ms Rosaya Teinwan 6,800 6,800 - -
Dhipaya Insurance Public Company LimitedRelated corporation(No. of ordinary shares)Mr Surong Bulakul 7,500 7,500 - -
SAKARI RESOURCES LIMITED Annual Report 201526
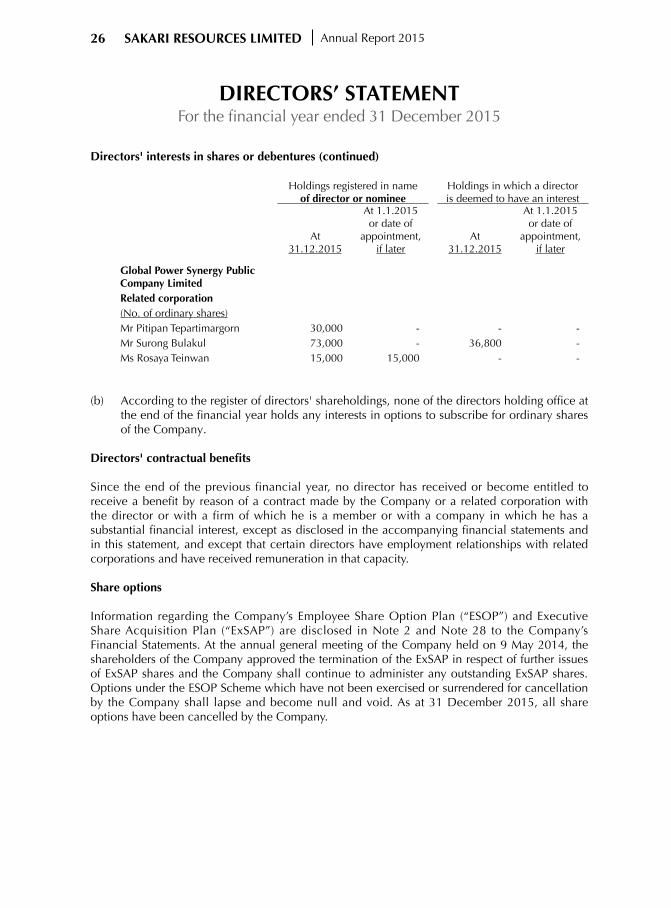
Directors' interests in shares or debentures (continued)
(b) According to the register of directors' shareholdings, none of the directors holding office at the end of the financial year holds any interests in options to subscribe for ordinary shares of the Company.
Directors' contractual benefits
Since the end of the previous financial year, no director has received or become entitled to receive a benefit by reason of a contract made by the Company or a related corporation with the director or with a firm of which he is a member or with a company in which he has a substantial financial interest, except as disclosed in the accompanying financial statements and in this statement, and except that certain directors have employment relationships with related corporations and have received remuneration in that capacity.
Share options
Information regarding the Company’s Employee Share Option Plan (“ESOP”) and Executive Share Acquisition Plan (“ExSAP”) are disclosed in Note 2 and Note 28 to the Company’s Financial Statements. At the annual general meeting of the Company held on 9 May 2014, the shareholders of the Company approved the termination of the ExSAP in respect of further issues of ExSAP shares and the Company shall continue to administer any outstanding ExSAP shares. Options under the ESOP Scheme which have not been exercised or surrendered for cancellation by the Company shall lapse and become null and void. As at 31 December 2015, all share options have been cancelled by the Company.
Global Power Synergy Public Company LimitedRelated corporation(No. of ordinary shares)Mr Pitipan Tepartimargorn 30,000 - - -Mr Surong Bulakul 73,000 - 36,800 -Ms Rosaya Teinwan 15,000 15,000 - -
Holdings registered in name of director or nominee
Holdings in which a director is deemed to have an interest
At 31.12.2015
At 1.1.2015 or date of
appointment, if later
At 31.12.2015
At 1.1.2015 or date of
appointment, if later
DIRECTORS’ STATEMENTFor the financial year ended 31 December 2015

SAKARI RESOURCES LIMITED Annual Report 2015 27
Options issued to directors
There were no options granted during the period by the Company to any person to take up unissued shares in the Company. No options have been granted during the financial year ended 31 December 2015 to subscribe for unissued shares of the Company.
There were no unissued shares of the Company under option at the end of the financial year.
On behalf of the directors
Rosaya Teinwan Surong BulakulDirector Director
5 February 2016
DIRECTORS’ STATEMENTFor the financial year ended 31 December 2015

SAKARI RESOURCES LIMITED Annual Report 201528
INDEPENDENT AUDITOR'S REPORT TO THE MEMBERS OF SAKARI RESOURCES LIMITED
Report on the Financial Statements
We have audited the accompanying financial statements of Sakari Resources Limited (the "Company") and its subsidiaries (the "Group") set out on pages 30 to 100, which comprise the consolidated balance sheet of the Group and the balance sheet of the Company as at 31 December 2015, and the consolidated income statement, statement of comprehensive income, statement of changes in equity and statement of cash flows of the Group for the financial year then ended, and a summary of significant accounting policies and other explanatory information.
Management’s Responsibility for the Financial Statements
Management is responsible for the preparation of financial statements that give a true and fair view in accordance with the provisions of the Singapore Companies Act (the “Act”) and Singapore Financial Reporting Standards, and for devising and maintaining a system of internal accounting controls sufficient to provide a reasonable assurance that assets are safeguarded against loss from unauthorised use or disposition; and transactions are properly authorised and that they are recorded as necessary to permit the preparation of true and fair financial statements and to maintain accountability of assets. Auditor's Responsibility
Our responsibility is to express an opinion on these financial statements based on our audit. We conducted our audit in accordance with Singapore Standards on Auditing. Those standards require that we comply with ethical requirements and plan and perform the audit to obtain reasonable assurance about whether the financial statements are free from material misstatement.
An audit involves performing procedures to obtain audit evidence about the amounts and disclosures in the financial statements. The procedures selected depend on the auditor’s judgement, including the assessment of the risks of material misstatement of the financial statements, whether due to fraud or error. In making those risk assessments, the auditor considers internal control relevant to the entity’s preparation of financial statements that give a true and fair view in order to design audit procedures that are appropriate in the circumstances, but not for the purpose of expressing an opinion on the effectiveness of the entity’s internal control. An audit also includes evaluating the appropriateness of accounting policies used and the reasonableness of accounting estimates made by management, as well as evaluating the overall presentation of the financial statements.
We believe that the audit evidence we have obtained is sufficient and appropriate to provide a basis for our audit opinion.
IND
EPEN
DEN
T A
UD
ITO
R'S
REP
ORT

SAKARI RESOURCES LIMITED Annual Report 2015 29
Report on the Financial Statements (continued)
Opinion
In our opinion, the consolidated financial statements of the Group and the balance sheet of the Company are properly drawn up in accordance with the provisions of the Act and Singapore Financial Reporting Standards so as to give a true and fair view of the financial position of the Group and of the Company as at 31 December 2015, and of the financial performance, changes in equity and cash flows of the Group for the financial year ended on that date.
Report on other Legal and Regulatory Requirements
In our opinion, the accounting and other records required by the Act to be kept by the Company and by those subsidiary corporations incorporated in Singapore, of which we are the auditors, have been properly kept in accordance with the provisions of the Act.
PricewaterhouseCoopers LLPPublic Accountants and Chartered Accountants
Singapore, 5 February 2016
SAKARI RESOURCES LIMITED Annual Report 201530
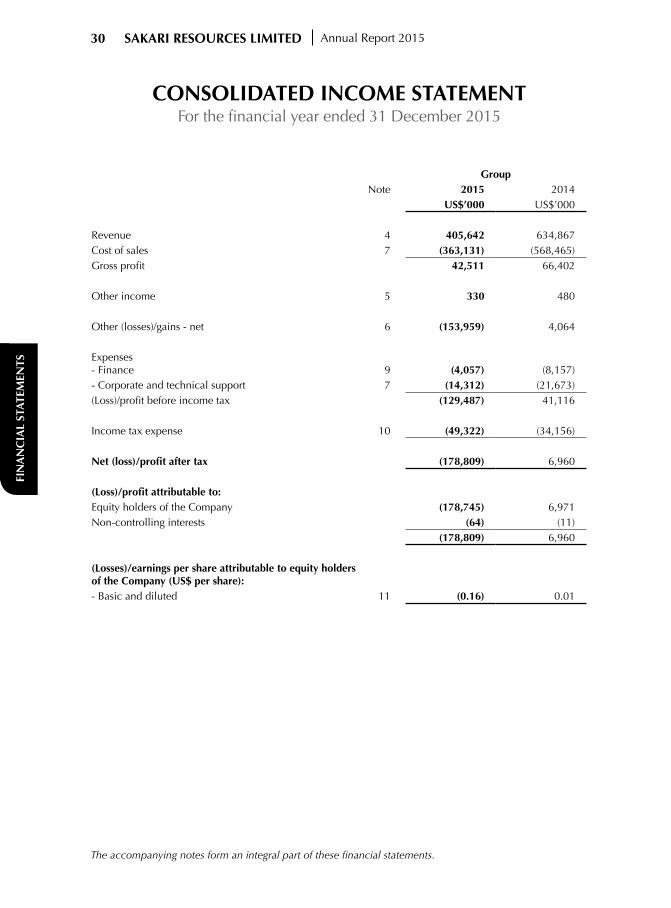
GroupNote 2015 2014
US$’000 US$’000
Revenue 4 405,642 634,867Cost of sales 7 (363,131) (568,465)Gross profit 42,511 66,402
Other income 5 330 480
Other (losses)/gains - net 6 (153,959) 4,064
Expenses- Finance 9 (4,057) (8,157)- Corporate and technical support 7 (14,312) (21,673)(Loss)/profit before income tax (129,487) 41,116
Income tax expense 10 (49,322) (34,156)
Net (loss)/profit after tax (178,809) 6,960
(Loss)/profit attributable to:Equity holders of the Company (178,745) 6,971Non-controlling interests (64) (11)
(178,809) 6,960
(Losses)/earnings per share attributable to equity holders of the Company (US$ per share):- Basic and diluted 11 (0.16) 0.01
CONSOLIDATED INCOME STATEMENTFor the financial year ended 31 December 2015
FIN
AN
CIA
L ST
ATE
MEN
TS
The accompanying notes form an integral part of these financial statements.

SAKARI RESOURCES LIMITED Annual Report 2015 31
GroupNote 2015 2014
US$'000 US$'000
(Loss) / profit for the year (178,809) 6,960
Other comprehensive income/(loss):Item that will not be reclassified subsequently to profit or loss: Remeasurement of defined benefit plans 184 (957)Item that may be reclassified subsequently to profit or loss: Available-for-sale financial assets - Fair value (loss)/gain 17 (31) 912Other comprehensive income/(loss), net of tax 153 (45)
Total comprehensive (loss)/income (178,656) 6,915
Total comprehensive (loss)/income attributable to:Equity holders of the Company (178,592) 6,926Non-controlling interests (64) (11)
(178,656) 6,915
CONSOLIDATED STATEMENT OF COMPREHENSIVE INCOMEFor the financial year ended 31 December 2015
The accompanying notes form an integral part of these financial statements.

SAKARI RESOURCES LIMITED Annual Report 201532
Group Company
2015 2014 2015 2014
Note US$'000 US$'000 US$'000 US$'000
ASSETSCurrent assetsCash and cash equivalents 12 33,245 60,358 1,117 19,005Trade and other receivables 13 47,578 79,012 489,681 486,083Inventories 14 29,061 31,360 - -Tax receivables 15 20,247 44,985 - -
130,131 215,715 490,798 505,088
Non-current assetsOther receivables 16 4,287 4,992 - -Available-for-sale financial assets 17 1,974 2,005 - -Investments in subsidiaries - - 67,202 67,202Property, plant and equipment 18 643,190 711,937 207 213Exploration and evaluation 19 13,543 13,543 - -Intangible assets (goodwill) 20 - 78,540 - -Tax receivables 15 14,308 - - -Deferred income tax assets 21 6,222 8,796 - -
683,524 819,813 67,409 67,415
Total assets 813,655 1,035,528 558,207 572,503
LIABILITIESCurrent liabilitiesTrade and other payables 22 74,925 98,583 6,031 3,733Current income tax liabilities 24,227 19,658 3,352 2,009Derivative financial instruments 23 487 - - -Borrowings 24 95,000 140,000 95,000 140,000Provisions 25 2,567 3,357 1,039 1,230
197,206 261,598 105,422 146,972
Non current liabilitiesBorrowings 24 100,000 75,000 100,000 75,000Deferred income tax liabilities 27 54,019 54,980 180 3,039Provisions 26 12,382 13,549 - -
166,401 143,529 100,180 78,039
Total liabilities 363,607 405,127 205,602 225,011
Net assets 450,048 630,401 352,605 347,492
BALANCE SHEETSAs at 31 December 2015
The accompanying notes form an integral part of these financial statements.

SAKARI RESOURCES LIMITED Annual Report 2015 33
Group Company
2015 2014 2015 2014
Note US$'000 US$'000 US$'000 US$'000
EQUITY Capital and reserves attributable to equity holders of the CompanyShare capital 28 328,558 328,558 328,558 328,558Treasury shares 28 (286) (286) (286) (286)Other reserves 29 (11,966) (12,119) 8,612 8,612Retained profits 30 133,949 314,391 15,721 10,608
450,255 630,544 352,605 347,492Non-controlling interests (207) (143) - -Total equity 450,048 630,401 352,605 347,492
BALANCE SHEETSAs at 31 December 2015
The accompanying notes form an integral part of these financial statements.

SAKARI RESOURCES LIMITED Annual Report 201534
Sharecapital
Treasuryshares
Otherreserves
Retained profits Total
Non-controlling interests
Total equity
Note US$'000 US$'000 US$'000 US$'000 US$'000 US$’000 US$’000
2015Beginning of financial year 328,558 (286) (12,119) 314,391 630,544 (143) 630,401Loss for the year - - - (178,745) (178,745) (64) (178,809)Other comprehensive
income for the year - - 153 - 153 - 153Total comprehensive income/(loss) for the year - - 153 (178,745) (178,592) (64) (178,656)
Dividend relating to 2014 paid - - - (1,697) (1,697) - (1,697)
Total transactions with owners, recognised directly in equity - - - (1,697) (1,697) - (1,697)
End of financial year 328,558 (286) (11,966) 133,949 450,255 (207) 450,048
2014Beginning of financial year 327,687 - (10,999) 307,420 624,108 (132) 623,976Profit for the year - - - 6,971 6,971 (11) 6,960Other comprehensive loss
for the year - - (45) - (45) - (45)Total comprehensive (loss)/income for the year - - (45) 6,971 6,926 (11) 6,915
Transferred to share capital 28 871 - (871) - - - -Purchase of treasury shares 28 - (286) - - (286) - (286)Share option buy-back - - (104) - (104) - (104)Share-based compensation expense 29(a) - - (100) - (100) - (100)Total transactions with owners, recognised directly in equity 871 (286) (1,075) - (490) - (490)
End of financial year 328,558 (286) (12,119) 314,391 630,544 (143) 630,401
CONSOLIDATED STATEMENT OF CHANGES IN EQUITYFor the financial year ended 31 December 2015
The accompanying notes form an integral part of these financial statements.

SAKARI RESOURCES LIMITED Annual Report 2015 35
Group
Note 2015 2014
US$'000 US$'000
Cash flows from operating activities
Receipts from customers 434,153 661,677
Payments to suppliers and employees (343,371) (515,776)
Payments for derivative financial instruments (1,385) (2,572)
89,397 143,329
Interest received 491 319
Income taxes paid (35,037) (28,015)
Income tax refunded - 21,365
Net cash provided by operating activities 37 54,851 136,998
Cash flows from investing activities
Payments for property, plant and equipment (55,387) (64,967)
Proceeds from sale of property, plant and equipment - 238
Payments for exploration and evaluation - (474)
Loan to related corporation (2) (750)
Net cash used in investing activities (55,389) (65,953)
Cash flows from financing activities
Purchase of treasury shares - (286)
Payments for cancellation of share options - (111)
Proceeds from borrowings 145,000 290,000
Repayment of borrowings (165,000) (342,500)
Interest paid (3,880) (10,492)
Dividends paid to equity holders of the Company 31 (1,697) -
Net cash used in financing activities (25,577) (63,389)
Net (decrease)/increase in cash and cash equivalents (26,115) 7,656
Cash and cash equivalents at beginning of the financial year 60,358 52,888
Effect of exchange rate movements on cash and cash equivalents (998) (186)
Cash and cash equivalents at end of the financial year 12 33,245 60,358
CONSOLIDATED STATEMENT OF CASH FLOWSFor the financial year ended 31 December 2015
CONSOLIDATED STATEMENT OF CHANGES IN EQUITYFor the financial year ended 31 December 2015
The accompanying notes form an integral part of these financial statements.
NOTES TO THE FINANCIAL STATEMENTSFor the financial year ended 31 December 2015
SAKARI RESOURCES LIMITED Annual Report 201536
These notes form an integral part of and should be read in conjunction with the accompanying financial statements.
1. General information
On 15 February 2013, Sakari Resources Limited (the "Company") delisted from the Main Board of the Singapore Exchange Securities Trading Limited. The Company is incorporated and domiciled in Singapore. The address of its registered office is 391B Orchard Road, Ngee Ann City, Tower B #17-01, Singapore 238874. Sakari Resources Limited and its subsidiaries together are referred to in these financial statements as the Group.
The principal activity of the Company is that of investment holding. The Group is principally engaged in the exploration for and mining and marketing of coal.
The Company's immediate parent company is PTT Mining Ltd, a company incorporated in Hong Kong.
The Company's ultimate parent company is PTT Public Company Limited, a company incorporated in Thailand. The address of PTT Public Company Limited is 555 Vibhavadi Rangsit Road, Chatuchak, Bangkok 10900, Thailand.
2. Summary of significant accounting policies
(a) Basis of preparation
These financial statements have been prepared in accordance with Singapore Financial Reporting Standards (“FRS”) under the historical cost convention, except as disclosed in the accounting policies below.
The preparation of financial statements in conformity with FRS requires management to exercise its judgement in the process of applying the Group's accounting policies. It also requires the use of certain critical accounting estimates and assumptions. The areas involving a higher degree of judgement or complexity, or areas where assumptions and estimates are significant to the financial statements are disclosed in Note 3.
Interpretations and amendments to published standards effective in 2015
On 1 January 2015, the Group adopted the new or amended FRS and Interpretations of FRS (“INT FRS”) that are mandatory for application for the financial year. Changes to the Group's accounting policies have been made as required, in accordance with the transitional provisions in the respective FRS and INT FRS.
The adoption of these new or amended FRS and INT FRS did not result in substantial
changes to the accounting policies of the Group and the Company and had no material effect on the amounts reported for the current or prior financial years.

NOTES TO THE FINANCIAL STATEMENTSFor the financial year ended 31 December 2015
SAKARI RESOURCES LIMITED Annual Report 2015 37
2. Summary of significant accounting policies (continued)
(b) Group accounting
(i) Subsidiaries
Consolidation
Subsidiaries are all entities (including structured entities) over which the Group has control. The Group controls an entity when the Group is exposed to, or has rights to, variable returns from its involvement with the entity and has the ability to affect those returns through its power over the entity. Subsidiaries are fully consolidated from the date on which control is transferred to the Group. They are de-consolidated from the date on which control ceases.
In preparing the consolidated financial statements, transactions, balances and unrealised gains on transactions between group entities are eliminated. Unrealised losses are also eliminated but are considered an impairment indicator of the asset transferred. Accounting policies of subsidiaries have been changed where necessary to ensure consistency with the policies adopted by the Group.
Non-controlling interests comprise the portion of a subsidiary’s net results of operations and its net assets, which is attributable to the interests that are not owned directly or indirectly by the equity holders of the Company. They are shown separately in the consolidated income statement, consolidated statement of comprehensive income, statement of changes in equity, and balance sheet. Total comprehensive income is attributed to the non-controlling interests based on their respective interests in a subsidiary, even if this results in the non-controlling interests having a deficit balance.
Acquisitions
The acquisition method of accounting is used to account for business combinations entered into by the Group.
The consideration transferred for the acquisition of a subsidiary or business comprises the fair value of the assets transferred, the liabilities incurred and the equity interests issued by the Group. The consideration transferred also includes the fair value of any contingent consideration arrangement.
If the business combination is achieved in stages, the acquisition date carrying value of the acquirer’s previously held equity interest in the acquiree is re-measured to fair value at the acquisition date; any gains or losses arising from such re-measurement are recognised in profit or loss.

NOTES TO THE FINANCIAL STATEMENTSFor the financial year ended 31 December 2015
SAKARI RESOURCES LIMITED Annual Report 201538
2. Summary of significant accounting policies (continued)
(b) Group accounting (continued)
(i) Subsidiaries (continued)
Acquisitions (continued)
Acquisition-related costs are expensed as incurred.
Identifiable assets acquired and liabilities and contingent liabilities assumed in a business combination are, with limited exceptions, measured initially at their fair values at the acquisition date.
On an acquisition-by-acquisition basis, the Group recognises any non-controlling interest in the acquiree at the date of acquisition either at fair value or at the non-controlling interest’s proportionate share of the acquiree’s identifiable net assets.
The excess of (a) the consideration transferred, the amount of any non-controlling interest in the acquiree and the acquisition-date fair value of any previous equity interest in the acquiree over the (b) fair values of the identifiable assets acquired net of the fair values of the liabilities and any contingent liabilities assumed, is recorded as goodwill. Please refer to the paragraph “Intangible assets” for the accounting policy on goodwill subsequent to initial recognition.
Disposals When a change in the Group’s ownership interest in a subsidiary results in a
loss of control over the subsidiary, the assets and liabilities of the subsidiary including any goodwill are derecognised. Amounts previously recognised in other comprehensive income in respect of that entity are also reclassified to profit or loss or transferred directly to retained profits if required by a specific Standard.
Any retained equity interest in the entity is remeasured at fair value. The difference between the carrying amount of the retained interest at the date when control is lost and its fair value is recognised in profit or loss.
Please refer to the paragraph “Investment in subsidiaries” for the accounting policy on investments in subsidiaries in the separate financial statements of the Company.
NOTES TO THE FINANCIAL STATEMENTSFor the financial year ended 31 December 2015
SAKARI RESOURCES LIMITED Annual Report 2015 39
2. Summary of significant accounting policies (continued)
(b) Group accounting (continued)
(ii) Transactions with non-controlling interests
Changes in the Group’s ownership interest in a subsidiary that do not result in a loss of control over the subsidiary are accounted for as transactions with equity owners of the Company. Any difference between the change in the carrying amounts of the non-controlling interest and the fair value of the consideration paid or received is recognised within equity attributable to the equity holders of the Company.
(c) Foreign currency translation
(i) Functional and presentation currency
Items included in the financial statements of each entity in the Group are measured using the currency of the primary economic environment in which the entity operates ("functional currency"). The financial statements are presented in United States Dollars, which is the functional currency of the Company.
(ii) Transactions and balances
Transactions in a currency other than the functional currency (“foreign currency”) are translated into the functional currency using the exchange rates at the dates of the transactions. Currency translation differences resulting from the settlement of such transactions and from the translation of monetary assets and liabilities denominated in foreign currencies at the closing rates at the balance date are recognised in profit or loss.
Foreign exchange gains and losses impacting profit or loss are presented in the income statement within other (losses)/gains – net.
Non-monetary items that are measured at fair value in a foreign currency are translated using the exchange rates at the date when the fair value was determined. Translation differences on assets and liabilities carried at fair value are reported as part of the fair value gain or loss. For example, translation differences on non-monetary assets and liabilities such as equities held at fair value through profit or loss are recognised in profit or loss as part of the fair value gain or loss and translation differences on non-monetary assets such as equities classified as available-for-sale financial assets are recognised in other comprehensive income.

NOTES TO THE FINANCIAL STATEMENTSFor the financial year ended 31 December 2015
SAKARI RESOURCES LIMITED Annual Report 201540
2. Summary of significant accounting policies (continued)
(c) Foreign currency translation (continued)
(iii) Translation of Group entities’ financial statements
The results and financial position of all the Group entities (none of which has the currency of a hyperinflationary economy) that have a functional currency different from the presentation currency are translated into the presentation currency as follows:
(i) Assets and liabilities are translated at the closing exchange rates at the reporting date;
(ii) Income and expenses are translated at average exchange rates (unless the average is not a reasonable approximation of the cumulative effect of the rates prevailing on the transaction dates, in which case income and expenses are translated using the exchange rates at the dates of the transactions); and
(iii) All resulting currency translation differences are recognised in other comprehensive income and accumulated in the currency translation reserve. These currency translation differences are reclassified to profit or loss on disposal or partial disposal of the entity giving rise to such reserve.
Goodwill and fair value adjustments arising on the acquisition of foreign operations are treated as assets and liabilities of the foreign operations and translated at the closing rates at the reporting date.
(d) Revenue recognition
Revenue is measured at the fair value of the consideration received or receivable. Amounts disclosed as revenue are net of value added tax, rebates, discounts and penalties.
The Group recognises revenue when the amount of revenue and related cost can be reliably measured, it is probable that the collectability of the related receivables is reasonably assured and when the specific criteria for each of the Group’s activities are met as follows:
(i) Sale of goods – Coal
Revenue from these sales are recognised when a Group entity has delivered the products to locations specified by its customers and the customers have accepted the products in accordance with the sales contract and the collectability of the related receivable is reasonably assured.
NOTES TO THE FINANCIAL STATEMENTSFor the financial year ended 31 December 2015
SAKARI RESOURCES LIMITED Annual Report 2015 41
2. Summary of significant accounting policies (continued)
(d) Revenue recognition (continued)
(ii) Provisional pricing
Revenue from the sale of coal where the coal is provisionally priced pending a renegotiation of the sales contract is initially recognised at the invoiced provisional price. Subsequently, a best estimate based on the final benchmark price adjustment using an appropriate benchmark calculation is made. The difference between the carrying amount of the revenue recognised for the sale and the estimated price adjustment is recognised in revenue. This adjustment will continue until the contract price is negotiated.
(iii) Rendering of services
Revenue from logistic services is recognised over the period in which the services are rendered, by reference to completion of the specific transaction assessed on the basis of the actual service provided as a proportion of the total services to be performed.
(iv) Interest income
Interest income is recognised using the effective interest method.
(v) Dividend income
Dividends are recognised when the right to receive payment is established.
(e) Income taxes
Current income tax for current and prior periods is recognised at the amount expected to be paid to or recovered from the tax authorities, using the tax rates and tax laws that have been enacted or substantively enacted by the balance sheet date.
Deferred income tax is recognised for all temporary differences arising between the tax bases of assets and liabilities and their carrying amounts in the financial statements except when the deferred income tax arises from the initial recognition of goodwill or an asset or liability in a transaction that is not a business combination and affects neither accounting nor taxable profit or loss at the time of the transaction.
A deferred income tax liability is recognised on temporary differences arising on investments in subsidiaries, except where the Group is able to control the timing of the reversal of the temporary difference and it is probable that the temporary difference will not reverse in the foreseeable future.

NOTES TO THE FINANCIAL STATEMENTSFor the financial year ended 31 December 2015
SAKARI RESOURCES LIMITED Annual Report 201542
2. Summary of significant accounting policies (continued)
(e) Income taxes (continued)
A deferred income tax asset is recognised to the extent that it is probable that future taxable profit will be available against which the deductible temporary differences and tax losses can be utilised.
Deferred income tax is measured:
(i) at the tax rates that are expected to apply when the related deferred income tax asset is realised or the deferred income tax liability is settled, based on tax rates and tax laws that have been enacted or substantively enacted by the balance sheet date; and
(ii) based on the tax consequence that will follow from the manner in which the Group expects, at the balance sheet date, to recover or settle the carrying amounts of its assets and liabilities.
Current and deferred income taxes are recognised as income or expenses in profit or loss, except to the extent that the tax arises from a business combination or a transaction which is recognised directly in equity. Deferred tax arising from a business combination is adjusted against goodwill on acquisition.
(f) Leases
The Group leases office space, residential properties and office equipment under operating leases from non related parties. Leases of office space, residential properties and office equipment where substantially all the risks and rewards incidental to ownership are retained by the lessors are classified as operating leases. Payments made under operating leases (net of any incentives received from the lessors) are recognised in profit or loss on a straight line basis over the period of the lease.
(g) Investments in subsidiaries
Investments in subsidiaries are carried at cost less accumulated impairment losses in the Company’s balance sheet. On disposal of such investments, the difference between disposal proceeds and the carrying amounts of the investments are recognised in profit or loss.
(h) Cash and cash equivalents
For the purpose of presentation in the consolidated statement of cash flows, cash and cash equivalents include cash on hand, deposits held at call with financial institutions which are subject to an insignificant risk of change in value, and bank

NOTES TO THE FINANCIAL STATEMENTSFor the financial year ended 31 December 2015
SAKARI RESOURCES LIMITED Annual Report 2015 43
2. Summary of significant accounting policies (continued)
(h) Cash and cash equivalents (continued)
overdrafts. Bank overdrafts are presented as current borrowings on the balance sheet. For cash subjected to restriction, assessment is made on the economic substance of the restriction and whether they meet the definition of cash and cash equivalents.
(i) Trade receivables
Trade receivables are recognised initially at fair value and subsequently measured at amortised cost using the effective interest method, less provision for impairment. Trade receivables are generally due for settlement within 14 days. They are presented as current assets unless collection is not expected for more than 12 months after the reporting date.
Collectability of trade receivables is reviewed on an ongoing basis. Debts which are known to be uncollectible are written off by reducing the carrying amount directly. An allowance account (provision for impairment of trade receivables) is used when there is objective evidence that the Group will not be able to collect all amounts due according to the original terms of the receivables. Significant financial difficulties of the debtor, probability that the debtor will enter bankruptcy or financial reorganisation, and default or delinquency in payments are considered indicators that the trade receivable is impaired. The amount of the impairment allowance is the difference between the asset's carrying amount and the present value of estimated future cash flows, discounted at the original effective interest rate. Cash flows relating to short-term receivables are not discounted if the effect of discounting is immaterial.
The amount of the impairment loss is recognised in cost of sales. When a trade receivable for which an impairment allowance had been recognised becomes uncollectible in a subsequent period, it is written off against the allowance account. Subsequent recoveries of amounts previously written off are credited against other (losses)/gains - net in profit or loss.
(j) Inventories
Run of mine coal and finished product coal is valued at the lower of cost and net realisable value. The cost of coal inventories is determined using the weighted average cost method. Costs includes direct material, overburden removal, mining, processing, labour incurred in the extraction process and an appropriate proportion of variable and fixed overhead costs directly related to mining activities. Net realisable value is the estimated selling price in the ordinary course of business, less the estimated costs of completion and applicable variable selling expenses.
Inventories are classified as follows:
(i) Run of mine: This is material extracted through the mining process.

NOTES TO THE FINANCIAL STATEMENTSFor the financial year ended 31 December 2015
SAKARI RESOURCES LIMITED Annual Report 201544
2. Summary of significant accounting policies (continued)
(j) Inventories (continued)
(ii) Finished product coal: These are products that have passed through all stages of the production process.
(iii) Consumables: These are goods or supplies to be either directly or indirectly consumed in the production process.
(k) Financial assets
Classification
The Group classifies its financial assets in the following categories: financial assets at fair value through profit or loss (including derivative financial instruments), loans and receivables and available-for-sale financial assets. The classification depends on the nature of the asset and the purpose for which the assets were acquired. Management determines the classification of its financial assets at initial recognition.
(i) Financial assets at fair value though profit or loss
Financial assets at fair value through profit or loss are financial assets held for trading. A financial asset is classified in this category if acquired principally for the purpose of selling in the short term. Derivatives are classified as held for trading unless they are designated as hedges. Assets in this category are classified as current assets if they are expected to be settled within 12 months; otherwise they are classified as non-current.
(ii) Loans and receivables
Loans and receivables are non-derivative financial assets with fixed or determinable payments that are not quoted in an active market. They are included in current assets, except for those with maturities greater than 12 months after the reporting period which are classified as non-current assets. Loans and receivables are presented as “trade and other receivables” (note 13), “other receivables” (note 16) and “cash and cash equivalents” (note 12) on the balance sheet.
(iii) Available for sale financial assets
Available-for-sale financial assets, comprising principally marketable equity securities, are non-derivatives that are either designated in this category or not classified in any of the other categories. They are included in non-current assets unless the investment matures or management intends to dispose of the investment within 12 months of the end of the reporting period.

NOTES TO THE FINANCIAL STATEMENTSFor the financial year ended 31 December 2015
SAKARI RESOURCES LIMITED Annual Report 2015 45
2. Summary of significant accounting policies (continued)
(k) Financial assets (continued)
Recognition and derecognition
Regular way purchases and sales of financial assets are recognised on the trade date the date on which the Group commits to purchase or sell the asset. Financial assets are derecognised when the rights to receive cash flows from the financial assets have expired or have been transferred and the Group has transferred substantially all risks and rewards of ownership. On disposal of a financial asset, the difference between the carrying amount and the sale proceeds is recognised in profit or loss. Any amount in other comprehensive income relating to that asset is reclassified to profit or loss.
Initial measurement
Financial assets are initially recognised at fair value plus transaction costs except for financial assets at fair value through profit or loss, which are recognised at fair value. Transaction costs of financial assets carried at fair value through profit or loss are expensed in profit or loss.
Subsequent measurement
Loans and receivables are subsequently carried at amortised cost using the effective interest method.
Available-for-sale financial assets and financial assets at fair value through profit or loss are subsequently carried at fair value. Gains or losses arising from changes in the fair value of the financial assets at fair value through profit or loss category are presented in profit or loss within other (losses)/gains - net in the period in which they arise.
Changes in the fair values of available-for-sale equity securities (i.e. non-monetary items) are recognised in other comprehensive income and accumulated in the fair value reserve, together with the related currency translation differences.
Impairment
The Group assesses at the end of each balance sheet date whether there is objective evidence that a financial asset or group of financial assets is impaired and recognises an allowance for impairment when such evidence exists.

NOTES TO THE FINANCIAL STATEMENTSFor the financial year ended 31 December 2015
SAKARI RESOURCES LIMITED Annual Report 201546
2. Summary of significant accounting policies (continued)
(k) Financial assets (continued)
(i) Loans and receivables
Significant financial difficulties of the debtor, probability that the debtor will enter bankruptcy and default or significant delay in payments are objective evidence that these financial assets are impaired.
The carrying amount of these assets is reduced through the use of an impairment allowance account which is calculated as the difference between the carrying amount and the present value of estimated future cash flows, discounted at the original effective interest rate. When the asset becomes uncollectible, it is written off against the allowance account. Subsequent recoveries of amounts previously written off are recognised against the same line item in profit or loss.
The impairment allowance is reduced through profit or loss in a subsequent
period when the amount of impairment loss decreases and the related decrease can be objectively measured. The carrying amount of the asset previously impaired is increased to the extent that the new carrying amount does not exceed the amortised cost had no impairment been recognised in prior periods.
(ii) Available-for-sale financial assets
In addition to the objective evidence of impairment described above, a significant or prolonged decline in the fair value of an equity security below its cost is considered as an indicator that the available-for-sale financial asset is impaired.
If any evidence of impairment exists, the cumulative loss that was previously recognised in other comprehensive income is reclassified to profit or loss. The cumulative loss is measured as the difference between the acquisition cost (net of any principal repayments and amortisation) and the current fair value, less any impairment loss previously recognised as an expense. The impairment losses recognised as an expense on equity securities are not reversed through profit or loss.
(l) Offsetting of financial instruments
Financial assets and liabilities are offset and the net amount reported in the balance sheet when there is a legally enforceable right to offset and there is an intention to settle on a net basis or realise the asset and settle the liability simultaneously.

NOTES TO THE FINANCIAL STATEMENTSFor the financial year ended 31 December 2015
SAKARI RESOURCES LIMITED Annual Report 2015 47
2. Summary of significant accounting policies (continued)
(m) Derivative financial instruments and hedging activities
Derivative financial instruments are initially recognised at fair value on the date the derivative contracts are entered into and are subsequently remeasured to their fair value at the end of each reporting period. The accounting for subsequent changes in fair value depends on whether the derivative is designated as a hedging instrument, and if so, the nature of the item being hedged. The Group designates certain derivatives as either:
- hedges of the fair value of recognised assets or liabilities or a firm commitment (fair value hedges)
- hedges of a particular risk associated with the cash flows of recognised assets and liabilities and highly probable forecast transactions (cash flow hedges), or
- hedges of a net investment in a foreign operation (net investment hedges).
Fair value changes on derivatives that are not designated or do not qualify for hedge accounting are recognised in profit or loss when the changes in fair value arise.
The carrying amount of a derivative designated as a hedge is presented as a non-current asset or liability if the remaining expected life of the hedged item is more than 12 months and as a current asset or liability if the remaining expected life of the hedged item is less than 12 months. The fair value of the trading derivative is presented as a current asset or liability.
(n) Property, plant and equipment
(i) Measurement
All items of property, plant and equipment are initially recognised at cost and subsequently carried at cost less accumulated depreciation and accumulated impairment losses.
(ii) Components of cost
The cost of an item of property, plant and equipment initially recognised includes its purchase price (including import duties and non-refundable purchase taxes) any cost that is directly attributable to bringing the asset to the location and condition necessary for it to be capable of operating in the manner intended by management, as well as the estimated future costs of dismantling and removing the asset. Cost also includes borrowing costs that are directly attributable to the acquisition, construction or production of a qualifying asset.

NOTES TO THE FINANCIAL STATEMENTSFor the financial year ended 31 December 2015
SAKARI RESOURCES LIMITED Annual Report 201548
2. Summary of significant accounting policies (continued)
(n) Property, plant and equipment (continued)
(iii) Mining properties Mining properties are classified as an asset under property, plant and
equipment. Once a mining project has been established as commercially viable, expenditure other than that on buildings, plant and equipment or land rights is capitalised under mining properties together with any amount transferred from exploration and evaluation.
Mining properties comprise:
• Capitalised exploration and evaluation assets for properties now in production
• Development expenditure (including pre-production stripping)
• Acquisition costs and mineral rights acquired
• Production stripping (as described below in “deferred stripping costs”)
Development expenditure
Development activities commence after project sanctioning by the appropriate level of management. Judgement is applied by management in determining when a project is economically viable. Development expenditure is capitalised and classified as mining properties. Costs associated with commissioning new assets, in the period before they are capable of operating in the manner intended by management are capitalised. Development costs incurred after the commencement of production are capitalised to the extent they are expected to give rise to a future economic benefit. Interest on borrowings related to construction or development projects is capitalised until the point when substantially all the activities that are necessary to make the asset ready for its intended use are complete.
Deferred stripping costs
Overburden and other mine waste materials are often removed during the initial development of a mine site in order to access the mineral deposit. This activity is referred to as development stripping. The directly attributable costs are capitalised under mining properties. Capitalisation of development stripping costs ceases at the time that saleable material begins to be extracted from the mine.
Production phase stripping commences once saleable material is extracted from the mine.

NOTES TO THE FINANCIAL STATEMENTSFor the financial year ended 31 December 2015
SAKARI RESOURCES LIMITED Annual Report 2015 49
2. Summary of significant accounting policies (continued)
(n) Property, plant and equipment (continued)
(iii) Mining properties (continued) Production stripping commences from the point saleable materials are being
extracted from the mine. Stripping costs incurred during the production phase might benefit current period production and improve access to ore bodies in future periods. Where benefits are realised in the form of inventory produced in the current period, these costs are accounted for as part of the cost of producing inventory. Where a benefit of improved access exists, the costs are recognised as part of mine properties when the following criteria are met:
(a) it is probable that the future economic benefit (improved access to the ore body) associated with the stripping activity will flow to the entity;
(b) the component of the ore body for which access has been improved can be accurately identified; and
(c) the costs relating to the stripping activity associated with that component can be measured reliably.
In identifying the components of the ore body, mining operations personnel will analyse the Group’s mine plans. Generally a component will be subset of the total ore body and a mine may have several components, for example, certain quantities of coal within separate mining pits.
The stripping activity asset is initially measured at cost, which is the accumulation of costs directly incurred to perform the stripping activity that improves access to the identified component of ore, plus an allocation of directly attributable overhead costs. This is accounted for as an addition to an existing asset, which the Group has determined to be “Mining Properties”.
When the costs of stripping to improve access to an ore body are not clearly distinguishable from the costs of producing current inventories, i.e., there is a mixture of waste and ore being removed, the stripping costs are allocated based on a relevant measure of production. This production measure is calculated for the identified component of the ore body. The Group uses the expected volume of waste extracted compared with the actual volume for a given volume of ore production.
The stripping activity asset is subsequently amortised using the units of production method over the life of the identified component of the ore body for which access has been improved. Economically recoverable reserves, which comprise proven and probable reserves, are used to determine the expected useful life of the identified component of the ore body. The stripping activity asset is then carried at cost less depreciation and impairment losses, if any.
NOTES TO THE FINANCIAL STATEMENTSFor the financial year ended 31 December 2015
SAKARI RESOURCES LIMITED Annual Report 201550
2. Summary of significant accounting policies (continued)
(n) Property, plant and equipment (continued)
(iv) Depreciation of plant, property and equipment
The depreciable amount of items of property, plant and equipment are depreciated over their useful lives, or over the remaining life of the mine if shorter. Depreciation commences when an asset is available for use. The major categories of property, plant and equipment are depreciated either on a units-of-production and/or straight-line basis as follows:
Units-of-production basis
For mining properties and land rights and certain mining equipment, the economic benefits from the asset are consumed in a pattern which is linked to the production level. Except as noted below, such assets are depreciated on a units-of-production basis.
Straight line basis
Assets which have a physical life shorter than the related mine or whose usage is not directly related to production levels, are depreciated on a straight line basis as follows:
• Buildings 20 years
• Plant and equipment 3 – 15 years
• Capital work in progress Not depreciated
Residual values and useful lives are reviewed, and adjusted if appropriate, at each balance sheet date. Changes to the estimated residual values or useful lives are accounted for prospectively. In applying the units-of- production method, depreciation/amortisation is normally calculated using the quantity of material extracted from the mine in the period as a percentage of the total quantity of material to be extracted in current and future periods based on proved and probable reserves. Non-reserve material may be included in depreciation/amortisation calculations where there is a high degree of confidence in its economic extraction. Reserves/resources and life of mine estimates are reviewed on an annual basis and depreciation calculations are adjusted accordingly where necessary.
NOTES TO THE FINANCIAL STATEMENTSFor the financial year ended 31 December 2015
SAKARI RESOURCES LIMITED Annual Report 2015 51
2. Summary of significant accounting policies (continued)
(n) Property, plant and equipment (continued)
(v) Subsequent expenditure
Subsequent expenditure relating to property, plant and equipment that has already been recognised is added to the carrying amount of the asset only when it is probable that future economic benefits associated with the item will flow to the Group and the cost of the item can be measured reliably. All other repair and maintenance expenses are recognised in the income statement when incurred.
(vi) Disposal
On disposal of an item of property, plant and equipment, the difference between the disposal proceeds and its carrying amount is recognised in profit or loss.
(o) Exploration and evaluation expenditure
Exploration and evaluation activity involves the search for mineral resources, the determination of technical feasibility and the assessment of the commercial viability of an identified resource. Costs incurred before the Group has obtained the legal rights to explore an area are recognised in the income statement. Exploration and evaluation expenditure are capitalised in respect of each area of interest for which the rights to tenure are current and where:
(i) The exploration and evaluation expenditures are expected to be recouped through successful development and exploitation of the area of interest; or alternatively, by its sale; or
(ii) Exploration and evaluation activities in the area of interest have not reached a stage which permits a reasonable assessment of the existence (or otherwise) of economically recoverable reserves, and active and significant operations in, or in relation to, the areas of interest are continuing.
Exploration and evaluation expenditure comprises costs that are directly attributable to: acquisition of rights to explore, researching and analysing existing exploration data, gathering exploration data through topographical, geochemical and geophysical studies, exploratory drilling, trenching and sampling, determining and examining the volume and grade of the resource, examining and testing extraction and treatment methods, surveying transportation and infrastructure requirements, compiling pre-feasibility and feasibility studies and/or gaining access to areas of interest including occupancy and relocation compensation.

NOTES TO THE FINANCIAL STATEMENTSFor the financial year ended 31 December 2015
SAKARI RESOURCES LIMITED Annual Report 201552
2. Summary of significant accounting policies (continued)
(o) Exploration and evaluation expenditure (continued)
General and administration costs are allocated to, and included in, the cost of an exploration and evaluation asset only to the extent that those costs can be related directly to operational activities in the area of interest to which the exploration and evaluation asset relates. In all other cases, these costs are expensed as incurred.
Exploration and evaluation assets are transferred to mining properties, a component of property, plant and equipment, when the technical feasibility and commercial viability of extracting the mineral resource are demonstrable and sanctioned by the Board.
Capitalised exploration and evaluation expenditure is written off where the above conditions are no longer satisfied.
Exploration and evaluation assets are assessed for impairment when facts and
circumstances suggest that the carrying amount of an exploration and evaluation asset may exceed its recoverable amount. Where a potential impairment is indicated, assessment is performed for each area of interest in conjunction with the group of operating assets (representing a cash generating unit) to which the exploration and evaluation asset is attributable. To the extent that capitalised exploration and evaluation expenditure is not expected to be recovered it is charged to the income statement.
Cash flows associated with exploration and evaluation expenditure are classified as investing activities in the consolidated statement of cash flows.
(p) Intangible assets
Goodwill on acquisitions of subsidiaries and businesses on or after 1 January 2010 represents the excess of (i) the sum of the consideration transferred, the amount of any non-controlling interest in the acquiree and the acquisition-date fair value of any previous equity interest in the acquiree over (ii) the fair value of the identifiable net assets acquired.
Goodwill on acquisition of subsidiaries and businesses prior to 1 January 2010 represents the excess of the cost of acquisition over the fair value of the Group's share of the identifiable net assets and contingent liabilities of the acquired subsidiaries at the date of acquisition.
Goodwill on subsidiaries is recognised separately as an intangible asset and carried at cost less accumulated impairment losses.

NOTES TO THE FINANCIAL STATEMENTSFor the financial year ended 31 December 2015
SAKARI RESOURCES LIMITED Annual Report 2015 53
2. Summary of significant accounting policies (continued)
(p) Intangible assets (continued)
Gains and losses on the disposal of subsidiaries include the carrying amount of goodwill relating to the entity sold, except for goodwill arising from acquisitions prior to 1 January 2001. Such goodwill was adjusted against retained profits in the year of acquisition and is not recognised in profit or loss on disposal.
(q) Impairment of non-financial assets
(i) Goodwill
Goodwill recognised separately as an intangible asset is tested for impairment annually and whenever there is indication that the goodwill may be impaired.
For the purpose of impairment testing of goodwill, goodwill is allocated to each of the Group’s cash-generating-units (“CGU”) expected to benefit from synergies arising from the business combination.
An impairment loss is recognised when the carrying amount of a CGU, including the goodwill, exceeds the recoverable amount of the CGU. The recoverable amount of a CGU is the higher of the CGU’s fair value less cost to sell and value-in-use.
The total impairment loss of a CGU is allocated first to reduce the carrying amount of goodwill allocated to the CGU and then to the other assets of the CGU pro-rata on the basis of the carrying amount of each asset in the CGU.
An impairment loss on goodwill is recognised as an expense and is not reversed in a subsequent period.
(ii) Property, plant and equipment Investment in subsidiaries
Property, plant and equipment and investments in subsidiaries are tested for impairment whenever there is any objective evidence or indication that these assets may be impaired.
For the purpose of impairment testing, the recoverable amount (i.e. the higher of the fair value less cost to sell and the value-in-use) is determined on an individual asset basis unless the asset does not generate cash inflows that are largely independent of those from other assets. If this is the case, the recoverable amount is determined for the CGU to which the asset belongs.

NOTES TO THE FINANCIAL STATEMENTSFor the financial year ended 31 December 2015
SAKARI RESOURCES LIMITED Annual Report 201554
2. Summary of significant accounting policies (continued)
(q) Impairment of non-financial assets (continued)
(ii) Property, plant and equipment Investment in subsidiaries (continued)
If the recoverable amount of the asset (or CGU) is estimated to be less than its carrying amount, the carrying amount of the asset (or CGU) is reduced to its recoverable amount.
The difference between the carrying amount and the recoverable amount is recognised as an impairment loss in profit and loss.
An impairment loss for an asset other than goodwill is reversed only if, there has been a change in the estimates used to determine the asset’s recoverable amount since the last impairment loss was recognised. The carrying amount of this asset is increased to its revised recoverable amount, provided that this amount does not exceed the carrying amount that would have been determined (net of any accumulated amortisation or depreciation) had no impairment loss been recognised for the asset in prior years.
A reversal of impairment loss for an asset other than goodwill is recognised in profit or loss, unless the asset is carried at revalued amount, in which case, such reversal is treated as a revaluation increase. However, to the extent that an impairment loss on the same revalued asset was previously recognised as an expense, a reversal of that impairment is also recognised in profit or loss.
(r) Trade and other payables
Trade and other payables represent liabilities for goods and services provided to the group prior to the end of financial year which are unpaid. They are classified as current liabilities if payment is due within one year or less (or in the normal operating cycle of the business if longer). Otherwise, they are presented as non-current liabilities.
Trade and other payables are initially recognised at fair value, and subsequently carried at amortised cost using the effective interest method.
(s) Borrowings
Borrowings are initially recognised at fair value (net of transaction costs) and subsequently carried at amortised cost. Any difference between the proceeds (net of transaction costs) and the redemption value is recognised in profit or loss over the period of the borrowings using the effective interest method.

NOTES TO THE FINANCIAL STATEMENTSFor the financial year ended 31 December 2015
SAKARI RESOURCES LIMITED Annual Report 2015 55
2. Summary of significant accounting policies (continued)
(s) Borrowings (continued)
Borrowings are presented as current liabilities unless the Group has an unconditional right to defer settlement for at least 12 months after the balance sheet date in which case they are presented as non-current liabilities.
(t) Borrowing costs
Borrowing costs are recognised in profit or loss using the effective interest method except for those costs that are directly attributable to borrowings acquired specifically for the construction or development of property, plant and equipment. This includes those costs on borrowings acquired specifically for the construction or development of property, plant and equipment, as well as those in relation to general borrowings used to finance the construction or development of property, plant and equipment.
(u) Provisions
Provisions are recognised when the Group has a present legal or constructive obligation as a result of past events, it is more likely than not that an outflow of resources will be required to settle the obligation and the amount has been reliably estimated. Provisions are not recognised for future operating losses.
Provision for rehabilitation and dismantling
The Group has present obligations to dismantle, remove, restore and rehabilitate certain items of property, plant and equipment and mining pits. The Group recognises the estimated costs of dismantlement, removal or restoration of items of property, plant and equipment arising from the acquisition or use of assets. The provisions are estimated based on the best estimate of the expenditure required to settle or transfer the obligation, taking into consideration the time value of money.
The estimated costs are measured at the present value of the expenditure expected to be required to settle the obligation using the pre-tax discount rate that reflects the current market assessment of the time value of money and the risks specific to the obligation. The increase in the provision due to the passage of time is recognised in the income statement under finance expenses. Changes in the estimated timing or amount of the expenditure or discount rate are recognised in profit or loss when the changes arise.
(v) Employee compensation
Employee benefits are recognised as an expense, unless the cost qualifies to be capitalised as an asset.

NOTES TO THE FINANCIAL STATEMENTSFor the financial year ended 31 December 2015
SAKARI RESOURCES LIMITED Annual Report 201556
2. Summary of significant accounting policies (continued)
(v) Employee compensation (continued)
(i) Wages and salaries
Liabilities for wages and salaries expected to be settled within 12 months of the reporting date are recognised under Trade and other payables in respect of employees' services up to the reporting date and are measured at the amounts expected to be paid when the liabilities are settled.
(ii) Other long-term employee benefit obligations
The liability for long service leave and annual leave which is not expected to be settled within 12 months after the end of the period in which the employees render the related service is recognised in the provision for employee benefits and measured as the present value of expected future payments to be made in respect of services provided by employees up to the end of the reporting period using the projected unit credit method. Consideration is given to expected future wage and salary levels, experience of employee departures and periods of service. Expected future payments are discounted using market yields at the end of the reporting period on national government bonds with terms to maturity and currency that match, as closely as possible, the estimated future cash outflows.
(iii) Termination benefits
Termination benefits are those benefits which are payable when employment is terminated before the normal retirement date, or whenever an employee accepts voluntary redundancy in exchange for these benefits. The Group recognises termination benefits when it is demonstrably committed to either: terminating the employment of current employees according to a detailed formal plan without possibility of withdrawal; or providing termination benefits as a result of an offer made to encourage voluntary redundancy. Benefits falling due more than 12 months after balance sheet date are discounted to present value.
(iv) Defined contribution plans
Defined contribution plans are post employment benefit plans under which the Group pays fixed contributions into separate entities such as the Central Provident Fund of Singapore on a mandatory, contractual or voluntary basis. The Group has no further payment obligations once the contributions have been paid.

NOTES TO THE FINANCIAL STATEMENTSFor the financial year ended 31 December 2015
SAKARI RESOURCES LIMITED Annual Report 2015 57
2. Summary of significant accounting policies (continued)
(v) Employee compensation (continued)
(v) Defined benefit plans
Defined benefit plans are post-employment benefit pension plans other than defined contribution plans, which the Group pays to an employee on termination of employment, whether the termination is voluntary or not. These benefits are mandatory under certain jurisdictions the Group operates within.
The liability recognised in the balance sheet in respect of a defined benefit pension plan is the present value of the defined benefit obligation at the reporting date less the fair value of plan assets, together with adjustments for unrecognised past-service costs. The defined benefit obligation is calculated annually by independent actuaries using the projected unit credit method. The present value of the defined benefit obligation is determined by discounting the estimated future cash outflows using interest rates of government bonds (considering there is no deep market for high-quality corporate bonds) that are denominated in the currency in which the benefits will be paid, and have tenures approximating to that of the related post-employment benefit obligations.
Actuarial gains and losses arising from changes in actuarial assumptions are charged or credited to equity in other comprehensive income in the period when they arise.
Past service costs are recognised immediately in profit or loss.
(vi) Share based compensation
The Group operated equity-settled share-based compensation plans. Share-based payment benefits were provided to employees via the Executive Share Acquisition Plan ("ExSAP") and Employee Share Option Plan ("ESOP").
The fair value of the employee services received in exchange for the grant of options under the ESOP was recognised as an expense with a corresponding increase in the share-based payment reserve over the vesting period. The total amount to be recognised over the vesting period is determined by reference to the fair value of the options granted on the date of the grant. Non market vesting conditions were included in the estimation of the number of shares under options that are expected to become exercisable on the vesting date. At each balance sheet date, the Group revised its estimates of the number of shares under option that are expected to become exercisable on the vesting

NOTES TO THE FINANCIAL STATEMENTSFor the financial year ended 31 December 2015
SAKARI RESOURCES LIMITED Annual Report 201558
date and recognised the impact of the revision of the estimates in profit or loss, with a corresponding adjustment to the share-based payment reserve over the remaining vesting period.
Upon the exercise of options, the proceeds received (net of transaction costs) and the balance previously recognised in the share-based payment reserve relating to those options was transferred to the share capital account.
Share based compensation benefits were also provided to employees via the
ExSAP by allowing participants to purchase shares in the Company at a price approved by the Board by way of a Company provided interest free loan. The subscription price of an award under ExSAP was the last traded share price of the Company on the Singapore Exchange before the date of grant of the award, rounded to nearest whole cent. A holding lock was placed over the shares in the Company until the loan is repaid in full. The fair value of the employee services received in exchange for the grant of shares under the ExSAP was recognised as an expense with a corresponding increase in the share based payment reserve. When the loan under the ExSAP was fully repaid, the proceeds received (net of transaction costs) and the related balance previously recognised in the share based payment reserve were credited to the share capital account when the ordinary shares were paid up.
At the annual general meeting of the Company held on 9 May 2014, the shareholders of the Company approved the termination of the ExSAP in respect of further issues of ExSAP shares and the Company shall continue to administer any outstanding ExSAP shares. Options under the ESOP Scheme which have not been exercised or surrendered for cancellation by the Company shall lapse and become null and void. As at 31 December 2015, all share options have been cancelled by the Group.
(vii) Profit-sharing and bonus plans
The Group recognises a liability and an expense for bonuses and profit-sharing based on a formula that takes into consideration the profit attributable to the company’s shareholders after certain adjustments. The Group recognises a provision where contractually obliged or where there is a past practice that has created a constructive obligation.
2. Summary of significant accounting policies (continued)
(v) Employee compensation (continued)
(vi) Share based compensation (continued)
NOTES TO THE FINANCIAL STATEMENTSFor the financial year ended 31 December 2015
SAKARI RESOURCES LIMITED Annual Report 2015 59
2. Summary of significant accounting policies (continued)
(w) Share capital and treasury shares
Ordinary shares are classified as equity. Incremental costs directly attributable to the issuance of new ordinary shares are deducted against the share capital account.
When any entity within the Group purchases the Company’s ordinary shares (“treasury shares”), the carrying amount which includes the consideration paid and any directly attributable transaction cost is presented as a component within equity attributable to the Company’s equity holders, until they are cancelled, sold or reissued.
When treasury shares are subsequently cancelled, the cost of treasury shares are
deducted against the share capital account if the shares are purchased out of capital of the Company, or against the retained profits of the Company if the shares are purchased out of earnings of the Company.
When treasury shares are subsequently sold or reissued pursuant to an employee share option scheme, the cost of treasury shares is reversed from the treasury share account and the realised gain or loss on sale or reissue, net of any directly attributable incremental transaction costs and related income tax, is recognised in the capital reserve.
(x) Dividends to the Company’s shareholders
Dividends to the Company’s shareholders are recognised when the dividends are approved for payment.
(y) Earnings per share
(i) Basic earnings per share
Basic earnings per share is calculated by dividing the net profit after income tax attributable to equity holders of the Company, by the weighted average number of ordinary shares outstanding during the financial year.
(ii) Diluted earnings per share For the purpose of calculating diluted earnings per share, profit attributable to
equity holders of the Company and the weighted average number of ordinary shares outstanding are adjusted for the effects of dilutive potential ordinary shares.

NOTES TO THE FINANCIAL STATEMENTSFor the financial year ended 31 December 2015
SAKARI RESOURCES LIMITED Annual Report 201560
3. Critical accounting estimates, assumptions and judgements
Estimates, assumptions and judgements are continually evaluated and are based on historical experience and other factors, including expectation of future events that are believed to be reasonable under the circumstances.
(i) Estimation for the provision for rehabilitation and dismantling
Provisions for rehabilitation and dismantling of property, plant and equipment and mining pits are estimated taking into consideration facts and circumstances of the Group’s mining properties available at the balance sheet date. These estimates are based on the expenditure required to transfer or settle the obligation for rehabilitation and dismantling, taking into consideration the time value of money. Cost estimates can vary in response to many factors including changes to the relevant legal or local/national government ownership requirements, the Group’s environmental policies, the emergence of new restoration techniques, the timing of the expenditures and the effects of inflation. Experience gained at other mine or production sites is also a significant consideration. Cost estimates are updated throughout the life of the operation.
The expected timing of expenditure included in cost estimates can also change, for example in response to changes in ore reserves, production rates, operating license or economic conditions. Cash flows are discounted if this has a material effect. The selection of appropriate sources on which to base calculation of the risk free discount rate used for this purpose also requires judgement.
Changes in these estimates and assumptions may impact the carrying value of the provision for rehabilitation and dismantling of property, plant and equipment and mining pits. The provision recognised is reviewed at each reporting date and updated based on the facts and circumstances available at that time.
(ii) Estimated impairment of non financial assets
Goodwill is tested for impairment annually and whenever there is an indication that goodwill may be impaired. Property, plant and equipment, exploration and evaluation and investment in subsidiaries, are tested for impairment whenever there is any objective evidence or indication that these assets may be impaired. The recoverable amounts of assets and where applicable, cash generating units, are determined based on value-in-use calculations which require the use of estimates.
The determination of fair value and value-in-use requires management to make estimates and assumptions about expected production and sales volumes, commodity prices (considering current and historical prices, price trends and related

NOTES TO THE FINANCIAL STATEMENTSFor the financial year ended 31 December 2015
SAKARI RESOURCES LIMITED Annual Report 2015 61
factors), reserves, operating costs, closure and rehabilitation costs and future capital expenditure. These estimates and assumptions are subject to risk and uncertainty; hence there is a possibility that changes in circumstances will alter these projections, which may impact the recoverable amount of the assets. In such circumstances, some or all of the carrying value of the assets may be further impaired or the impairment charge reduced with the impact recorded in profit or loss.
An impairment charge of US$149.3 million arose in the Jembayan and Sebuku CGUs in the financial year ended 31 December 2015, which reduced the carrying amount of goodwill by US$78.5 million and mining properties by US$70.8 million. If the estimated coal price used in the value-in-use calculation for these CGUs had been 2% lower than management’s estimates as at 31 December 2015, the Group would have recognised a further impairment charge on mining properties of US$3.3 million in these CGUs.
If the estimated weighted cost of capital used in determining the pre-tax discount rate
applied to the discounted cash flows for the two CGUs had been 0.5% higher than management’s estimates (for example, 9.5% instead of 9%) at 31 December 2015, the Group would have recognised a further impairment charge on mining properties of US$16.0 million in these CGUs.
(iii) Uncertain tax positions
The Group is subject to income taxes in Singapore and Indonesia. The Group operates in these jurisdictions where legislative applications can give rise to uncertain tax positions. Management believe that the current tax positions taken by the Group are appropriate and supportable by expert advice where relevant. In determining the income tax liabilities, management is required to estimate the amount of capital allowances and the deductibility of certain expenses ("uncertain tax positions") at each jurisdiction. Where the final tax outcome of these matters is different from the amounts that were initially recognised, such differences will impact the income tax and deferred tax provisions in the year in which such determination is made.
Deferred tax assets, including those arising from unrecouped tax losses, capital
allowances and temporary differences, are recognised only where it is considered more likely than not that they will be recovered, which is dependent on the generation of sufficient future taxable profits. Assumptions about the generation of future taxable profits depend on management’s estimates of future cash flows. These depend on estimates of future production, sales volumes or sales of service, commodity prices, reserves, operating costs, restoration and reclamation costs, capital expenditure, dividends and other capital management transactions.
3. Critical accounting estimates, assumptions and judgements (continued)
(ii) Estimated impairment of non financial assets (continued)

NOTES TO THE FINANCIAL STATEMENTSFor the financial year ended 31 December 2015
SAKARI RESOURCES LIMITED Annual Report 201562
3. Critical accounting estimates, assumptions and judgements (continued)
(iv) Determination of coal reserves
Judgement is required in determining the Group's coal reserves taking into account various assumptions regarding mining costs and the sale price of the particular resource concerned. The Group's economically recoverable coal reserves are sensitive to the cost and revenue assumptions used due to the geological structure of the deposits, which means that, all other factors remaining the same, if the cost assumption is higher or the price assumption is lower, the Group estimates lower reserves, and if the cost assumption is lower or the price assumption is higher, the Group estimates more reserves. The Group bases all assumptions on geological reports and uses only measured reserves.
Additional geological data is gathered during the course of mining operations and this, in conjunction with the various assumptions used, could result in a change in estimated coal reserves from period to period. Changes in estimated coal reserves could affect the Group’s financial results in a numbers of ways, including the rate of depreciation and amortisation of plant, property and equipment as well as the carrying value of certain mine assets due to change in estimates of mine life and future discounted cash flows.
(v) Deferred stripping costs
Certain mining costs, principally those that relate to the stripping of waste and which relate to future economically recoverable coal to be mined, are capitalised and included in mining properties, which is classified in the balance sheet under property, plant and equipment. These costs are deferred and subsequently taken to the cost of production through the amortisation of mining properties. The waste to ore ratio and the remaining life of the mine are regularly assessed by the Board and senior management to ensure the carrying value and rate of deferral is appropriate taking into consideration the available facts and circumstances from time to time.
The carrying value of the deferred stripping cost as at 31 December 2015 is US$79 million (2014: US$51 million) respectively.
(vi) Capitalisation and impairment of exploration and evaluation assets
Exploration and evaluation expenditures are capitalised on the balance sheet, in respect of areas of interest for which the rights of tenure are current and where such costs are expected to be recouped or exploration and/or evaluation activities in the area have not yet reached a stage which permits a reasonable assessment of the existence of economically recoverable reserves. The carrying value of assets within each area of interest are reviewed regularly taking into consideration the available facts and circumstances, and to the extent to which the capitalised value exceeds its recoverable value, the excess is provided for or written off in the year in which this is determined.
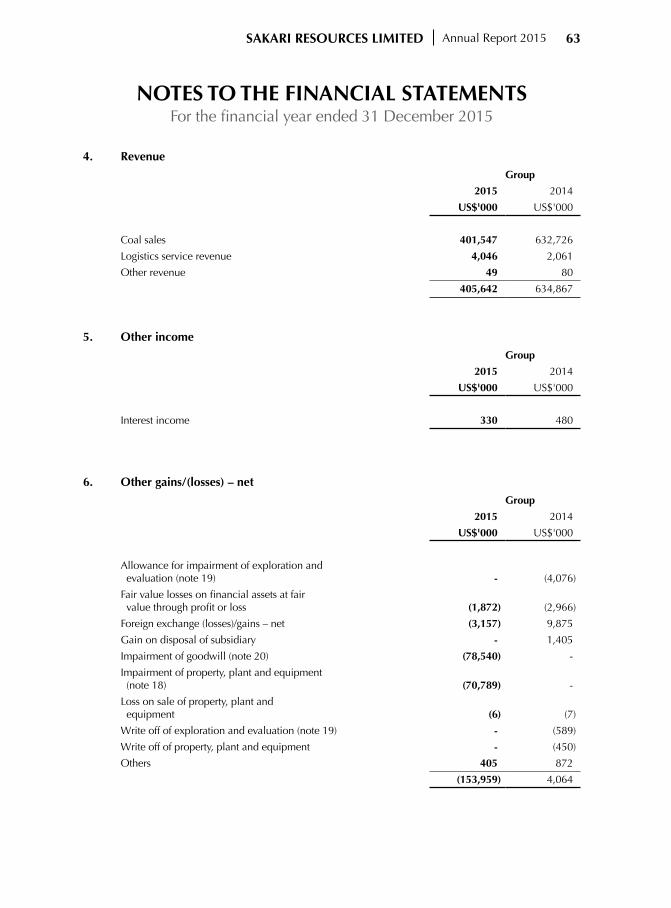
NOTES TO THE FINANCIAL STATEMENTSFor the financial year ended 31 December 2015
SAKARI RESOURCES LIMITED Annual Report 2015 63
4. Revenue
Group
2015 2014
US$'000 US$'000
Coal sales 401,547 632,726
Logistics service revenue 4,046 2,061
Other revenue 49 80
405,642 634,867
5. Other income
Group
2015 2014
US$'000 US$'000
Interest income 330 480
6. Other gains/(losses) – net
Group
2015 2014
US$'000 US$'000
Allowance for impairment of exploration and evaluation (note 19) - (4,076)
Fair value losses on financial assets at fair value through profit or loss (1,872) (2,966)
Foreign exchange (losses)/gains – net (3,157) 9,875
Gain on disposal of subsidiary - 1,405
Impairment of goodwill (note 20) (78,540) -
Impairment of property, plant and equipment (note 18) (70,789) -
Loss on sale of property, plant and equipment (6) (7)
Write off of exploration and evaluation (note 19) - (589)
Write off of property, plant and equipment - (450)
Others 405 872
(153,959) 4,064

NOTES TO THE FINANCIAL STATEMENTSFor the financial year ended 31 December 2015
SAKARI RESOURCES LIMITED Annual Report 201564
7. Expenses by nature
Group
2015 2014
US$'000 US$'000
Depreciation and amortisation (note 18) 41,667 58,240
Deferred stripping amortisation (note 18) 11,671 38,399
Mining 188,034 274,022
Processing 13,489 21,120
Movement in inventories 6,111 25,985
Barging and shipping 32,671 52,065
Agency fees and royalties 27,035 57,111
Direct site support 9,673 12,764
Employee compensation (note 8) 19,036 27,242
Corporate, consulting and technical services fees 5,630 6,338
Operating leases rentals 740 707
Allowance for impairment of other receivables 1,042 (95)
Write off of bad debt (trade) - 692
Other expenses 20,644 15,548
Total cost of sales and corporate and technical support expenses 377,443 590,138
8. Employee compensation
Group
2015 2014
US$'000 US$'000
Wages and salaries 15,305 17,633
Share based compensation expense (note 29) - (100)
Termination benefits 1,863 7,268
Employer’s contributions to defined contribution plans 608 660
Other staff benefits 1,260 1,781
19,036 27,242

NOTES TO THE FINANCIAL STATEMENTSFor the financial year ended 31 December 2015
SAKARI RESOURCES LIMITED Annual Report 2015 65
9. Finance expenses
Group
2015 2014
US$'000 US$'000
Interest expense 3,826 7,900
Bank charges 231 257
4,057 8,157
10. Income taxes
Group
2015 2014
US$'000 US$'000
Income tax expense
Tax expense attributable to profit is made up of:
Current income tax 12,089 25,764
Deferred income tax expense/(benefit) 403 (4,289)
12,492 21,475
Under provision in prior financial year:
Current income tax 35,623 12,591
Deferred income tax 1,207 90
36,830 12,681
Total income tax expense 49,322 34,156
Deferred income tax included in income tax expense comprises:
Decrease/(increase) in deferred tax assets (note 21) 436 (1,667)
Increase/(decrease) in deferred tax liabilities (note 27) 1,174 (2,532)
1,610 (4,199)

NOTES TO THE FINANCIAL STATEMENTSFor the financial year ended 31 December 2015
SAKARI RESOURCES LIMITED Annual Report 201566
10. Income taxes (continued)
The tax expense on the (loss)/profit differs from the amount that would arise using the Singapore standard rate of income tax as explained below:
Group
2015 2014
US$'000 US$'000
(Loss)/profit before income tax (129,487) 41,116
Tax calculated at tax rate of 17% (2014: 17%) (22,012) 6,990
Effects of:
Expenses not deductible for tax purposes 31,143 9,056
Income subject to tax incentive 681 481
Different tax rates in other countries 2,680 4,948
Under provision in prior years 36,830 12,681
Income tax expense 49,322 34,156
11. (Losses)/earnings per share
Basic and diluted (losses)/earnings per share is calculated by dividing the net (loss)/profit attributable to equity holders of the Company by the weighted average number of ordinary shares outstanding during the financial year. There are no dilutive potential ordinary shares at balance sheet date.
Group
2015 2014
Basic and diluted (losses)/earnings per share
Net (losses)/profit attributable to equity holders of the Company (US$'000) (178,745) 6,971
Weighted average number of ordinary shares outstanding (’000) 1,137,052 1,137,052
Basic (losses)/earnings per share (US$) (0.16) 0.01

NOTES TO THE FINANCIAL STATEMENTSFor the financial year ended 31 December 2015
SAKARI RESOURCES LIMITED Annual Report 2015 67
12. Cash and cash equivalents
Group Company
2015 2014 2015 2014
US$'000 US$'000 US$'000 US$'000
Cash at bank and on hand 33,245 49,316 1,117 19,005
Short term bank deposits - 11,042 - -
33,245 60,358 1,117 19,005
13. Trade and other receivables
Group Company
2015 2014 2015 2014
US$'000 US$'000 US$'000 US$'000
Trade receivables
Non-related parties 29,550 57,976 - -
Less: Allowance for impairment (1,220) (178) - -
Trade receivable - net 28,330 57,798 - -
Other receivables
- Related corporation 753 766 502 504
- Subsidiaries - - 488,879 490,667
- Non-related parties 11,476 11,633 804 863
12,229 12,399 490,185 492,034
Less: Allowance for impairment - - (832) (6,460)
Other receivables - net 12,229 12,399 489,353 485,574
Accrued Income 4,619 5,972 - -
Prepayments 2,400 2,843 328 509
7,019 8,815 328 509
47,578 79,012 489,681 486,083
Other receivables due from subsidiaries are unsecured, interest-bearing at the London Interbank Offered Rate (“LIBOR”) plus 3.44% (2014: LIBOR plus 4.50%-6.00%) and are repayable on demand.
Other receivables due from a related corporation are non-trade in nature, interest-free and repayable on demand.

NOTES TO THE FINANCIAL STATEMENTSFor the financial year ended 31 December 2015
SAKARI RESOURCES LIMITED Annual Report 201568
14. Inventories
Group
2015 2014
US$'000 US$'000
Run of mine stockpiles 10,415 10,084
Finished product coal 14,814 17,022
Consumables 3,832 4,254
29,061 31,360
15. Tax receivables
Tax receivables represent advance tax payments made by the Group which can be credited against the Group’s future corporate income tax payable. Tax receivables are presented as current assets if they are expected to be realised within 12 months after balance sheet date.
16. Other receivables
Group
2015 2014
US$'000 US$'000
Security deposits 4,287 4,992
Long term security bonds and deposits placed with various agencies, which will be settled on completion of certain governmental or legal requirements.
17. Available for sale financial assets
Group
2015 2014
US$'000 US$'000
Beginning of financial year 2,005 1,093
Fair value (loss)/gain recognised in other comprehensive income [note 29(e)] (31) 912
End of financial year 1,974 2,005

NOTES TO THE FINANCIAL STATEMENTSFor the financial year ended 31 December 2015
SAKARI RESOURCES LIMITED Annual Report 2015 69
17. Available for sale financial assets (continued)
Available-for-sale financial assets are analysed as follows:Group
2015 2014
US$'000 US$'000
Listed securities Equity securities – Australia 1,974 2,005
18. Property, plant and equipment
Capital work in progress
Mining properties Buildings
Plant and equipment Land rights Total
US$’000 US$’000 US$’000 US$’000 US$’000 US$’000
Group 2015
Beginning of financial year 22,288 559,635 525 63,901 65,588 711,937Additions 5,994 43,497 41 2,160 3,694 55,386Transfers (to)/from other
classes (11,629) 2,984 - 874 7,771 -Depreciation/
amortisation charge (note 7) - (30,807) (57) (7,523) (3,280) (41,667)
Deferred stripping amortisation (note 7) - (11,671) - - - (11,671)
Disposal/write off - - - (6) - (6)Impairment - (70,789) - - - (70,789)End of financial year 16,653 492,849 509 59,406 73,773 643,190
At 31 December 2015Cost 16,653 1,032,551 3,771 142,188 97,994 1,293,157Accumulated
depreciation/ amortisation - (468,913) (3,262) (82,782) (24,221) (579,178)
Impairment - (70,789) - - - (70,789)Net book amount 16,653 492,849 509 59,406 73,773 643,190

NOTES TO THE FINANCIAL STATEMENTSFor the financial year ended 31 December 2015
SAKARI RESOURCES LIMITED Annual Report 201570
18. Property, plant and equipment (continued)
Capital work in progress
Mining properties Buildings
Plant and equipment Land rights Total
US$’000 US$’000 US$’000 US$’000 US$’000 US$’000
Group 2014
Beginning of financial year 20,794 596,789 930 71,598 53,563 743,674Additions 10,934 46,007 - 1,769 7,350 66,060Transfers (to)/from other classes (9,199) - - 492 8,707 -
Depreciation/ amortisation charge
(note 7) - (44,090) (184) (9,934) (4,032) (58,240)Deferred stripping
amortisation (note 7) - (38,399) - - - (38,399)Disposal/write off (241) (672) (221) (24) - (1,158)End of financial year 22,288 559,635 525 63,901 65,588 711,937
At 31 December 2014Cost 22,288 986,070 3,759 139,467 86,529 1,238,113Accumulated depreciation/ amortisation - (426,435) (3,234) (75,566) (20,941) (526,176)
Net book amount 22,288 559,635 525 63,901 65,588 711,937
Included within additions for mining properties in the consolidated financial statements are deferred stripping costs amounting to US$40 million (2014: US$35 million).
Mining properties are amortised on a units-of-production basis. The units-of-production calculation is based on estimated coal reserves.
CompanyPlant and
equipmentCapital work
in progress Total
US$'000 US$'000 US$'000
2015
Beginning of financial year 213 - 213
Additions 22 101 123
Depreciation charge (129) - (129)
End of financial year 106 101 207

NOTES TO THE FINANCIAL STATEMENTSFor the financial year ended 31 December 2015
SAKARI RESOURCES LIMITED Annual Report 2015 71
CompanyPlant and
equipmentCapital work
in progress Total
US$'000 US$'000 US$'000
At 31 December 2015
Cost 2,932 101 3,033
Accumulated depreciation (2,826) - (2,826)
Net book amount 106 101 207
CompanyPlant and
equipmentCapital work
in progress Total
US$'000 US$'000 US$'000
2014
Beginning of financial year 410 264 674
Additions 135 10 145
Transfers (to)/from other classes 33 (33) -
Depreciation charge (364) - (364)
Write off (1) (241) (242)
End of financial year 213 - 213
At 31 December 2014
Cost 2,913 - 2,913
Accumulated depreciation (2,700) - (2,700)
Net book amount 213 - 213
19. Exploration and evaluationGroup
2015 2014US$'000 US$'000
Beginning of financial year 17,619 17,734Expenditure incurred - 474Write off - (589)
17,619 17,619Less: allowance for impairment (4,076) (4,076)Exploration and expenditure - net 13,543 13,543
18. Property, plant and equipment (continued)

NOTES TO THE FINANCIAL STATEMENTSFor the financial year ended 31 December 2015
SAKARI RESOURCES LIMITED Annual Report 201572
20. Intangible assets
Group GoodwillUS$'000
2015Beginning of financial year 78,540Impairment (note 6) (78,540)End of financial year -
At 31 December 2015Cost 98,103Accumulated impairment losses (98,103)Net book amount -
2014Beginning and end of financial year 78,540
At 31 December 2014Cost 98,103Accumulated impairment losses (19,563)Net book amount 78,540
As at 31 December 2015, goodwill is allocated to the Group’s cash-generating units (“CGUs”) as follows:
2015 2014US$'000 US$'000
Mining operationsJembayan - 48,074Sebuku - 30,466Total - 78,540
The recoverable amounts of the CGUs were determined based on value-in-use assessments, using discounted cash flows over the period of Life of Mine (“LOM”) of each mining operation. The value-in-use computations were determined by estimating cash flows until the end of the life of each mine operation based on long-term production plans, including closure restoration and environmental clean-up costs. The key assumptions used in the value-in-use calculations are the thermal coal price, operating costs, and a discount rate of 9%. Thermal coal prices are based on the Newcastle forward price curve obtained from market observable prices. Strip Ratios and production profiles of both operations are derived from developed LOM plans. Operating costs are based on developed LOM plans and follow current contractual terms and pricing with an

NOTES TO THE FINANCIAL STATEMENTSFor the financial year ended 31 December 2015
SAKARI RESOURCES LIMITED Annual Report 2015 73
inflationary element included thereafter over the remaining LOM. A pre-tax discount rate of 9 per cent has been applied.
In 2015, an impairment charge of US$78.5 million (2014: Nil) was recognised against the goodwill and included within “Other (losses)/gains - net” in the consolidated income statement. The impairment charge arose due to significant pressures on thermal coal prices and a sharp decrease in demand as a result of the global economic crisis which has adversely impacted the Group’s mining operations.
21. Deferred income tax assets
Group Company
2015 2014 2015 2014
US$'000 US$'000 US$'000 US$'000
To be recovered after one year 15,590 16,026 791 2,254
Set-off of deferred tax assets pursuant to set-off provisions (note 27) (9,368) (7,230) (791) (2,254)
Net deferred income tax assets 6,222 8,796 - -
Deferred income tax assets are recognised for tax losses and capital allowances carried forward to the extent that realisation of the related tax benefits through future taxable profits is probable.
Movement in deferred income tax assets account is as follows:
GroupTax
lossesDepreciation
and amortisationInterestpayable Provisions Total
US$'000 US$'000 US$’000 US$'000 US$'000
2015
Beginning of financial year 6,802 3,308 2,255 3,661 16,026
Tax credited/(charged) to the income statement 3,371 (264) (1,861) (461) 785
Over provision in respect of prior year (157) (1,064) - - (1,221)
End of financial year 10,016 1,980 394 3,200 15,590
20. Intangible assets (continued)

NOTES TO THE FINANCIAL STATEMENTSFor the financial year ended 31 December 2015
SAKARI RESOURCES LIMITED Annual Report 201574
GroupTax
lossesDepreciation
and amortisationInterestpayable Provisions Total
US$'000 US$'000 US$’000 US$'000 US$'000
2014
Beginning of financial year 3,603 2,664 2,464 5,804 14,535
Tax credited/(charged) to the income statement 3,373 (1,612) (209) 221 1,773
Under/(over) provision in respect of prior year 2 2,256 - (2,364) (106)
Others (176) - - - (176)
End of financial year 6,802 3,308 2,255 3,661 16,026
CompanyTax
lossesDepreciation
and amortisationInterestpayable Provisions Total
US$'000 US$'000 US$’000 US$'000 US$'000
2015
Beginning of financial year - (37) 2,255 36 2,254
Tax credited/(charged) to the income statement - 18 (1,860) 379 (1,463)
End of financial year - (19) 395 415 791
2014
Beginning of financial year - (70) 2,464 889 3,283
Tax credited/(charged) to the income statement - 33 (209) (81) (257)
Over provision in respect of prior year - - - (772) (772)
End of financial year - (37) 2,255 36 2,254
21. Deferred income tax assets (continued)

NOTES TO THE FINANCIAL STATEMENTSFor the financial year ended 31 December 2015
SAKARI RESOURCES LIMITED Annual Report 2015 75
Group Company
2015 2014 2015 2014
US$'000 US$'000 US$'000 US$'000
Trade payables 22,284 33,947 - -
Other payables
- Ultimate parent holding corporation
416 - - -
- Subsidiaries - - - 6
- Related corporation 90 123 25 86
- Non-related parties 5,045 5,564 444 568
Accrued expenses 47,090 58,949 5,562 3,073
74,925 98,583 6,031 3,733
Other payables to the subsidiaries and a related corporation are unsecured, non-interest bearing and repayable on demand.
23. Derivative financial instruments
The derivatives used by the Group are over-the-counter commodity derivatives in the form of gas-oil swaps which are measured at fair value and which will settle within 12 months of balance sheet date. The Group did not apply hedge accounting in 2014 and 2015.
24. Borrowings
Group Company
2015 2014 2015 2014
US$'000 US$'000 US$'000 US$'000
Current
Borrowings from a related corporation 95,000 140,000 95,000 140,000
Non-current
Borrowings from a related corporation 100,000 75,000 100,000 75,000
Total borrowings 195,000 215,000 195,000 215,000
22. Trade and other payables
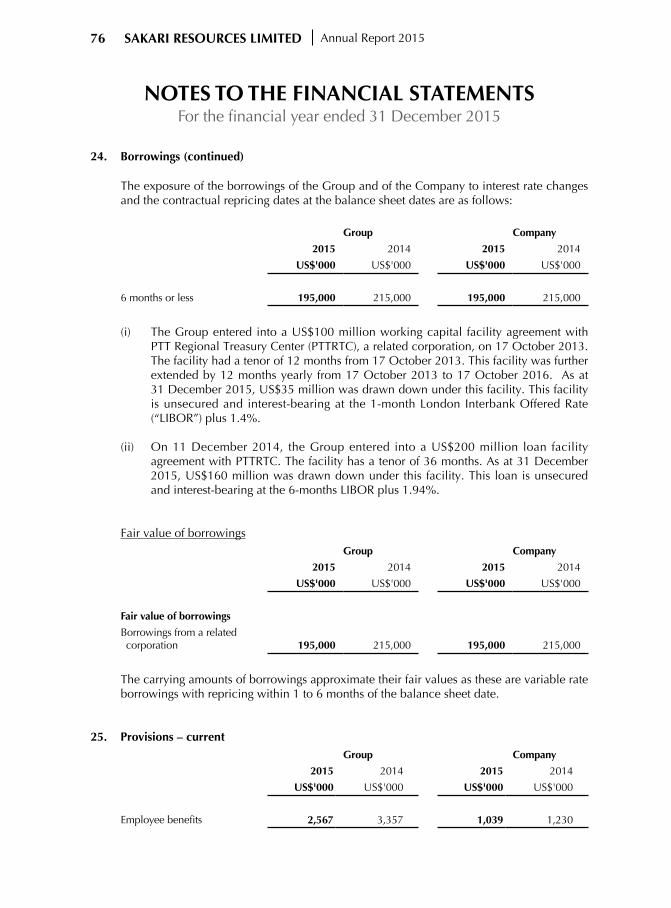
NOTES TO THE FINANCIAL STATEMENTSFor the financial year ended 31 December 2015
SAKARI RESOURCES LIMITED Annual Report 201576
24. Borrowings (continued)
The exposure of the borrowings of the Group and of the Company to interest rate changes and the contractual repricing dates at the balance sheet dates are as follows:
Group Company
2015 2014 2015 2014
US$'000 US$'000 US$'000 US$'000
6 months or less 195,000 215,000 195,000 215,000
(i) The Group entered into a US$100 million working capital facility agreement with PTT Regional Treasury Center (PTTRTC), a related corporation, on 17 October 2013. The facility had a tenor of 12 months from 17 October 2013. This facility was further extended by 12 months yearly from 17 October 2013 to 17 October 2016. As at 31 December 2015, US$35 million was drawn down under this facility. This facility is unsecured and interest-bearing at the 1-month London Interbank Offered Rate (“LIBOR”) plus 1.4%.
(ii) On 11 December 2014, the Group entered into a US$200 million loan facility agreement with PTTRTC. The facility has a tenor of 36 months. As at 31 December 2015, US$160 million was drawn down under this facility. This loan is unsecured and interest-bearing at the 6-months LIBOR plus 1.94%.
Fair value of borrowings Group Company
2015 2014 2015 2014
US$'000 US$'000 US$'000 US$'000
Fair value of borrowings
Borrowings from a related corporation 195,000 215,000 195,000 215,000
The carrying amounts of borrowings approximate their fair values as these are variable rate borrowings with repricing within 1 to 6 months of the balance sheet date.
25. Provisions – currentGroup Company
2015 2014 2015 2014
US$'000 US$'000 US$'000 US$'000
2,567 3,357 1,039 1,230Employee benefits

NOTES TO THE FINANCIAL STATEMENTSFor the financial year ended 31 December 2015
SAKARI RESOURCES LIMITED Annual Report 2015 77
25. Provisions – current (continued)
Movements in provisions
Movements in provision for employee benefits are as follows:
Group Employee benefits
US$'000
2015
Beginning of financial year 3,357
Provision written back (53)
Provision utilised during the year (737)
End of financial year 2,567
2014
Beginning of financial year 3,898
Provision written back 2,145
Provision utilised during the year (2,686)
End of financial year 3,357
Company Employee benefits
US$'000
2015
Beginning of financial year 1,230
Provision written back (191)
End of financial year 1,039
2014
Beginning of financial year 2,055
Provision made (113)
Provision utilised during the year (712)
End of financial year 1,230

NOTES TO THE FINANCIAL STATEMENTSFor the financial year ended 31 December 2015
SAKARI RESOURCES LIMITED Annual Report 201578
26. Provisions – non-currentGroup
2015 2014US$'000 US$'000
Employee benefits (a) 4,141 5,189Rehabilitation and dismantling (b) 8,241 8,360
12,382 13,549
(a) Employee benefits
Provision for employee benefits represents the amounts provided for in respect of defined benefit plans required by certain jurisdictions the Group operates in. The Group is required to pay these benefits on termination of employment, whether the termination was voluntary or not. These amounts are disclosed as non-current as they are not expected to be paid within 12 months from the balance sheet date.
(b) Rehabilitation and dismantling
Provision for rehabilitation and dismantling represents the expected cost to dismantle and remove or restore and rehabilitate properties and mining pits which the Group utilises. This provision represents the best estimate of the present value of the expenditure required to settle the obligation at the balance sheet date. This amount represents provisions that are expected to be settled more than 12 months from the balance sheet date.
(c) Movements in provisions
Movements in each class of provision are as follows:
GroupEmployee
benefitsRehabilitation
and dismantling Total
US$'000 US$'000 US$'000
2015
Beginning of financial year 5,189 8,360 13,549
Provision made/(written back) 399 (119) 280
Provision utilised during the year (1,447) - (1,447)
End of financial year 4,141 8,241 12,382

NOTES TO THE FINANCIAL STATEMENTSFor the financial year ended 31 December 2015
SAKARI RESOURCES LIMITED Annual Report 2015 79
26. Provisions – non-current (continued)
(c) Movements in provisions (continued)
GroupEmployee
benefitsRehabilitation and
dismantling TotalUS$'000 US$'000 US$'000
2014Beginning of financial year 4,196 7,425 11,621Provision made 2,362 935 3,297Provision utilised during the year (1,369) - (1,369)End of financial year 5,189 8,360 13,549
27. Deferred income tax liabilitiesGroup Company
2015 2014 2015 2014US$'000 US$'000 US$'000 US$'000
To be settled after one year 63,387 62,210 971 5,293Set-off of deferred tax liabilities pursuant to set-off provisions (note 21) (9,368) (7,230) (791) (2,254)Net deferred income tax liabilities 54,019 54,980 180 3,039
Movement in deferred income tax liabilities account is as follows:
GroupMining
properties Other TotalUS$'000 US$'000 US$'000
2015
Beginning of financial year 56,903 5,307 62,210Tax charged/(credited) to the income statement 5,510 (4,322) 1,188Over provision in respect of prior year - (14) (14)Other 4 (1) 3End of financial year 62,417 970 63,387
2014Beginning of financial year 59,251 5,386 64,637Tax credited to the income statement (2,453) (63) (2,516)Over provision in respect of prior year - (16) (16)Other 105 - 105End of financial year 56,903 5,307 62,210
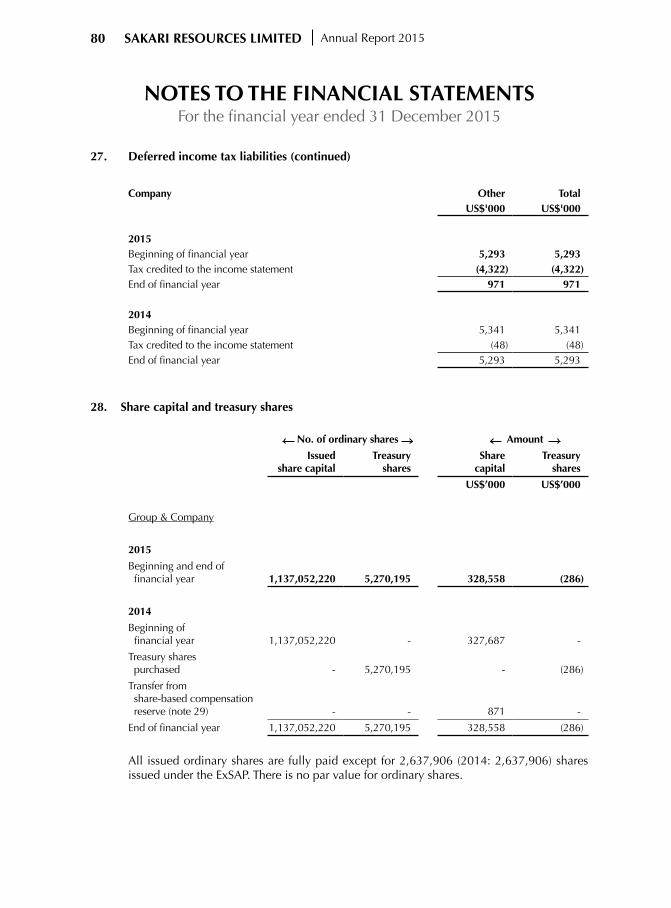
NOTES TO THE FINANCIAL STATEMENTSFor the financial year ended 31 December 2015
SAKARI RESOURCES LIMITED Annual Report 201580
Company Other TotalUS$'000 US$'000
2015Beginning of financial year 5,293 5,293Tax credited to the income statement (4,322) (4,322)End of financial year 971 971
2014Beginning of financial year 5,341 5,341Tax credited to the income statement (48) (48)End of financial year 5,293 5,293
28. Share capital and treasury shares
No. of ordinary shares Amount
Issuedshare capital
Treasury shares
Share capital
Treasury shares
US$’000 US$’000
Group & Company
2015
Beginning and end of financial year 1,137,052,220 5,270,195 328,558 (286)
2014
Beginning of financial year 1,137,052,220 - 327,687 -
Treasury shares purchased - 5,270,195 - (286)
Transfer from share-based compensation reserve (note 29) - - 871 -
End of financial year 1,137,052,220 5,270,195 328,558 (286)
All issued ordinary shares are fully paid except for 2,637,906 (2014: 2,637,906) shares issued under the ExSAP. There is no par value for ordinary shares.
27. Deferred income tax liabilities (continued)

NOTES TO THE FINANCIAL STATEMENTSFor the financial year ended 31 December 2015
SAKARI RESOURCES LIMITED Annual Report 2015 81
28. Share capital and treasury shares (continued)
Fully paid ordinary shares including those issued under the ExSAP carry one vote per share and carry a right to dividends as and when declared by the Company.
(a) Share cancellation
At the annual general meeting of the Company held on 9 May 2014, the shareholders of the Company approved the termination of the ExSAP in respect of further issues of ExSAP shares and the Company shall continue to administer any outstanding ExSAP shares.
The shareholders of the Company also approved the purchase or acquisition of up to 7,908,101 ExSAP shares which were outstanding. 5,270,195 of the ExSAP shares were cancelled as at 31 December 2014. There was no share cancellation as at 31 December 2015.
(b) Share options
Movement in the number of unissued ordinary shares under option and their exercise prices are as follows:
Beginning of financial
year
Granted during
financial year
Exercised during
financial year
Forfeited/lapsed during
financial year
End of financial
yearExercise
priceExercise
period
20142012 Options 346,154 - - (346,154) -
27.04.2014 - 27.04.2017
2012 Options 492,615 - - (492,615) -
31.01.2014 - 31.01.2017
2011 Options 274,390 - - (274,390) -
21.04.2013 - 21.04.2016
2011 Options 429,260 - - (429,260) -
23.02.2013 - 23.02.2016
2010 Options 383,750 - - (383,750) -
23.06.2011 - 23.06.2015
1,926,169 - - (1,926,169) -
The fair value at grant date is independently determined using a Binomial Option Pricing Model that takes into account the exercise price, the term of the option, the vesting and performance criteria, the impact of dilution, the non-tradable nature of the option, the share price at grant date and expected price volatility of the underlying share, the expected dividend yield and the risk free interest rate for the term of the option.
In 2014, all share options under the ESOP scheme that were not exercised or surrendered for cancellation had lapsed and became null and void.

NOTES TO THE FINANCIAL STATEMENTSFor the financial year ended 31 December 2015
SAKARI RESOURCES LIMITED Annual Report 201582
28. Share capital and treasury shares (continued)
(b) Share options (continued)
There were no share options granted to key management and employees under the Employee Share Option Plan (“ESOP”) for 2014 and 2015.
29. Other reserves
Group Company
2015 2014 2015 2014
US$'000 US$'000 US$'000 US$'000
Share-based compensation reserve (a) 8,612 8,612 8,612 8,612
Capital reserve (b) (13,526) (13,526) - -
General reserve (c) 329 329 - -
Merger reserve (d) (7,752) (7,752) - -
Fair value reserve(e) 1,111 1,142 - -
Remeasurement of defined benefit plans (740) (924) - -
(11,966) (12,119) 8,612 8,612
Other reserves are non-distributable.
(a) Share-based compensation reserve
Group Company
2015 2014 2015 2014
US$'000 US$'000 US$'000 US$'000
Beginning of financial year 8,612 9,687 8,612 9,687
Transferred to share capital (note 28) - (871) - (871)
Share option buy-back - (104) - (104)
Share-based compensation expense (note 8) - (100) - (100)
End of financial year 8,612 8,612 8,612 8,612

NOTES TO THE FINANCIAL STATEMENTSFor the financial year ended 31 December 2015
SAKARI RESOURCES LIMITED Annual Report 2015 83
29. Share capital and treasury shares (continued)
(b) Capital reserve
In January 2005, the Group acquired the remaining 20% equity interest of PT Bahari Cakrawala Sebuku (“PT BCS”) for a consideration of US$15,821,000. The acquisition consideration was satisfied by the allotment and issuance of 6,145,537 shares of S$1 each at a premium of S$3.18 per share. This reserve of US$13,526,000 represents the difference between the value of the consideration paid for the acquisition of the 20% minority interest in PT BCS prior to 2006 and the amount that these minority interests were recognised in the financial statements.
(c) General reserveGroup
2015 2014
US$'000 US$'000
Beginning and end of financial year 329 329
The revised Indonesian Limited Company Law No. 40/2007 dated 16 August 2007 requires Indonesian companies to set up a general reserve amounting to 20% of the company’s issued and paid up share capital. This reserve has been created in respect of the Group’s Indonesian subsidiaries.
(d) Merger reserve
Merger reserve arising from a restructuring exercise representing the excess of cash consideration paid over the subsidiaries capital acquired and accounted for using the pooling of interest method.
(e) Fair value reserve
Group
2015 2014
US$'000 US$'000
Beginning of financial year 1,142 230
Fair value gain on available-for-sale financial assets (note 17)
(31) 912
End of financial year 1,111 1,142
The available-for-sale reserve represents the mark to market over the cost of the investment (note 17).

NOTES TO THE FINANCIAL STATEMENTSFor the financial year ended 31 December 2015
SAKARI RESOURCES LIMITED Annual Report 201584
30. Retained profits
Group Company
2015 2014 2015 2014
US$'000 US$'000 US$'000 US$'000
Beginning of financial year 314,391 307,420 10,608 7,904
Net (loss)/profit after tax (178,745) 6,971 6,810 2,704
Dividends paid (note 31) (1,697) - (1,697) -
End of financial year 133,949 314,391 15,721 10,608
31. Dividends
2015 2014
US$'000 US$'000
Final dividend paid in respect of 2014 of 0.15 cents per share 1,697 -
32. Capital commitments
Capital expenditures contracted for at the balance sheet dates but not recognised in the financial statements are as follows:
Group Company
2015 2014 2015 2014
US$'000 US$'000 US$'000 US$'000
Property, plant and equipment 984 1,426 149 18
33. Operating lease commitments
The Group leases office space, residential properties and certain office equipment from non-related parties under non-cancellable operating lease agreements. The leases have varying terms, escalation clauses and renewal rights.

NOTES TO THE FINANCIAL STATEMENTSFor the financial year ended 31 December 2015
SAKARI RESOURCES LIMITED Annual Report 2015 85
33. Operating lease commitments (continued)
The future minimum lease payables under non-cancellable operating leases contracted for at the balance sheet dates but not recognised as liabilities are as follows:
Group Company
2015 2014 2015 2014
US$'000 US$'000 US$'000 US$'000
Not later than one year 1,314 1,384 541 608
Between one and five years 617 1,174 266 816
1,931 2,558 807 1,424
34. Financial risk management
Financial risk factors
The Group's activities are exposed to market risk (including currency risk, price risk and interest rate risk), credit risk and liquidity risk. The Group’s overall risk management strategy seeks to minimise any adverse effects from the unpredictability of financial and commodity markets on the Group’s financial performance. The Group uses financial instruments such as over-the-counter commodity swaps to hedge certain market risk exposures.
The Board of Directors is responsible for setting the objectives and underlying principles of financial risk management for the Group. The Treasury Committee then establishes the detailed policies such as authority levels, oversight responsibilities, risk identification and measurement, exposure limits and hedging strategies, in accordance with the objectives and principles set by the Board of Directors.
Financial risk management is carried out by a central treasury department, trading department and reporting department and these teams evaluate and hedge financial risks in co-operation with the Group’s operating units. Regular reports are also submitted to management and the Board of the Directors.
(a) Market risk
(i) Currency risk
The Group operates in Singapore and Indonesia. Entities in the Group regularly transact in their respective functional currency, which is the United States dollar ("USD"). Currency risk arises when transactions are denominated in foreign currencies such as the Singapore dollar (“SGD”), Australian dollar (“AUD”) and Indonesia rupiah (“IDR”).

NOTES TO THE FINANCIAL STATEMENTSFor the financial year ended 31 December 2015
SAKARI RESOURCES LIMITED Annual Report 201586
34. Financial risk management (continued)
(a) Market risk (continued)
(i) Currency risk (continued)
The Group’s exposure to foreign currencies is not significant. The Group does not use any financial instruments such as forward exchange contracts to mitigate the currency risks which is consistent with the Group’s Treasury Risk Management policy.
The Group’s foreign currency exposure based on the information provided to key management is as follows:
SGD IDR AUD TotalUS$’000 US$’000 US$’000 US$’000
At 31 December 2015Financial assetsCash and cash equivalents 505 6,760 204 7,469Trade and other receivables 266 10,231 24 10,521Available-for-sale financial assets - - 1,974 1,974
771 16,991 2,202 19,964
Financial liabilitiesTrade and other payables 2,019 8,962 444 11,425
2,019 8,962 444 11,425
Net financial (liabilities)/assets (1,248) 8,029 1,758 8,539
At 31 December 2014Financial assetsCash and cash equivalents 541 14,307 382 15,230Trade and other receivables 331 863 43 1,237Available-for-sale financial assets - - 2,005 2,005
872 15,170 2,430 18,472
Financial liabilitiesTrade and other payables 2,036 2,264 570 4,870
2,036 2,264 570 4,870
Net financial (liabilities)/assets (1,164) 12,906 1,860 13,602

NOTES TO THE FINANCIAL STATEMENTSFor the financial year ended 31 December 2015
SAKARI RESOURCES LIMITED Annual Report 2015 87
34. Financial risk management (continued)
(a) Market risk (continued)
(i) Currency risk (continued)
The Company’s foreign currency exposure based on the information provided to key management is as follows:
2015 2014
SGD AUD Total SGD AUD Total
Financial assets
Cash and cash equivalents 190 204 394 299 141 440
Trade and other receivables 160 - 160 187 33 220
350 204 554 486 174 660
Financial liabilities
Trade and other payables 1,920 159 2,079 1,936 60 1,996
1,920 159 2,079 1,936 60 1,996
Net financial (liabilities)/assets (1,570) 45 (1,525) (1,450) 114 (1,336)
There are no foreseeable movements in the relevant exchange rates that are likely to have a material impact on the Groups’ and Company’s results.
(ii) Price risk
The Group is exposed to thermal coal price risk generated by its mining activities. The Group sells coal either on a contracted or spot basis, with prices either fixed or index linked. Coal price risk is managed through contractual arrangements negotiated directly with customers, usually for a period of 12 months and through the use of derivative financial instruments.
Fuel is a major component of the Group's operating costs. The Group's exposure to changes in fuel prices is ultimately based on reference to a USD Mean of Platts Singapore ("MOPS") Gas Oil assessment price. This benchmark reference is used to determine diesel fuel prices in Indonesia, which are primarily passed through to the Group by mine contractors through rise and fall adjustment clauses. Historically, as sources of energy

NOTES TO THE FINANCIAL STATEMENTSFor the financial year ended 31 December 2015
SAKARI RESOURCES LIMITED Annual Report 201588
generation, there is a positive correlation between coal and oil prices, and this has served as a natural hedge to the Group's exposure to changing fuel prices.
The Group uses derivative financial instruments in the form of gas-oil swaps to hedge adverse movements in coal prices received by customers and gas-oil prices paid as part of the Group’s mining costs. These instruments are over-the-counter derivative contracts referenced to indices and therefore underlying commodity prices of coal and gas-oil. If the referenced price had increased/decreased by 10% (2014: 10%) with all other variables including tax rate being held constant, the profit after tax would have been higher/lower by US$173,495 (2014:US$Nil).
The Group has an equity investment which is classified as available-for-sale on the balance sheet that is exposed to equity securities price risk. If the price for the equity security listed on the Australian Securities Exchange had changed by 10% (2014: 10%) with all other variables including tax rate being held constant, the other comprehensive income would have been higher/lower by US$197,400 (2014: US$200,500).
(iii) Cash flow and fair value interest rate risks
Cash flow interest rate risk is the risk that the future cash flows of a financial instrument will fluctuate because of changes in market interest rates. Fair value interest rate risk is the risk that the fair value of a financial instrument will fluctuate due to changes in market interest rates. As the Group has no significant interest bearing assets, the Group’s income is substantially independent of changes in market interest rates.
The Group's main interest rate risk arises from borrowings. Borrowings issued at variable rates expose the Group to cash flow interest rate risk.
The Group's borrowings are at variable rates and are denominated in USD. If the USD interest rates had increased/decreased by 0.50% (2014: 0.50%) with all other variables including tax rate being held constant, the profit after tax would have been lower/higher by US$912,000 (2014: US$1,125,000) as a result of higher/lower interest expense on these borrowings.
34. Financial risk management (continued)
(a) Market risk (continued)
(ii) Price risk (continued)
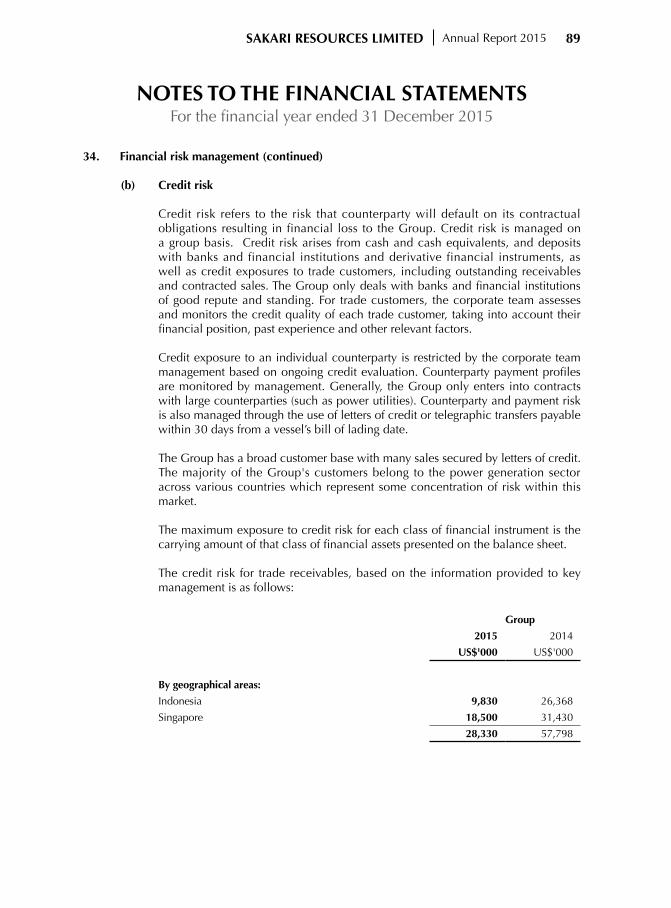
NOTES TO THE FINANCIAL STATEMENTSFor the financial year ended 31 December 2015
SAKARI RESOURCES LIMITED Annual Report 2015 89
34. Financial risk management (continued)
(b) Credit risk
Credit risk refers to the risk that counterparty will default on its contractual obligations resulting in financial loss to the Group. Credit risk is managed on a group basis. Credit risk arises from cash and cash equivalents, and deposits with banks and financial institutions and derivative financial instruments, as well as credit exposures to trade customers, including outstanding receivables and contracted sales. The Group only deals with banks and financial institutions of good repute and standing. For trade customers, the corporate team assesses and monitors the credit quality of each trade customer, taking into account their financial position, past experience and other relevant factors.
Credit exposure to an individual counterparty is restricted by the corporate team management based on ongoing credit evaluation. Counterparty payment profiles are monitored by management. Generally, the Group only enters into contracts with large counterparties (such as power utilities). Counterparty and payment risk is also managed through the use of letters of credit or telegraphic transfers payable within 30 days from a vessel’s bill of lading date.
The Group has a broad customer base with many sales secured by letters of credit. The majority of the Group's customers belong to the power generation sector across various countries which represent some concentration of risk within this market.
The maximum exposure to credit risk for each class of financial instrument is the carrying amount of that class of financial assets presented on the balance sheet. The credit risk for trade receivables, based on the information provided to key management is as follows:
Group
2015 2014
US$'000 US$'000
By geographical areas:
Indonesia 9,830 26,368
Singapore 18,500 31,430
28,330 57,798

NOTES TO THE FINANCIAL STATEMENTSFor the financial year ended 31 December 2015
SAKARI RESOURCES LIMITED Annual Report 201590
34. Financial risk management (continued)
(b) Credit risk (continued)
(i) Financial assets that neither past due nor impaired
Bank deposits that are neither past due nor impaired are mainly deposits with banks with high credit-ratings assigned by international credit-rating agencies. Trade receivables that are neither past due nor impaired are substantially with companies with a good collection track record with the Group.
(ii) Financial assets that are past due and/or impaired
Where financial assets are past due but not impaired, the Group has assessed that the credit quality of these amounts has not changed and the amounts are still considered recoverable.
The age analysis of trade receivables past due but not impaired is as follows:
Group Company
2015 2014 2015 2014
US$'000 US$'000 US$'000 US$'000
Past due < 3 months 14,944 25,405 - -
Past due 3 to 6 months 2,366 538 - -
Past due > 6 months 690 789 - -
18,000 26,732 - -
The carrying amount of trade receivables individually determined to be impaired and the movement in the related allowance for impairment are as follows:
Group Company
2015 2014 2015 2014
US$'000 US$'000 US$'000 US$'000
Past due > 6 months 1,220 178 - -
Less: Allowance for impairment (1,220) (178) - -
- - - -
Beginning of financial year (178) (273) - -
Allowance written back/(made) (1,042) 95 - -
End of financial year (1,220) (178) - -

NOTES TO THE FINANCIAL STATEMENTSFor the financial year ended 31 December 2015
SAKARI RESOURCES LIMITED Annual Report 2015 91
34. Financial risk management (continued)
(c) Liquidity risk
Prudent liquidity risk management implies maintaining at all times sufficient cash and marketable securities and the availability of funding through an adequate amount of committed credit facilities so as to enable the Group to meet its obligations as and when they fall due. At the balance sheet date, assets held by the Group and Company for managing liquidity risk included cash and short-term deposits as disclosed in note 12.
Liquidity risk management covers daily, short term, and long term needs. The appropriate levels of liquidity are determined by both the nature of the Group's business and its risk profile. The Group monitors its liquidity position on a daily basis and prepares short term weekly cash flows of up to thirty weeks, on a monthly basis. In addition to this, the Group looks at cash flows on a medium term (< 12 months) and long term (> 12 months) basis through regular forecasts, annual budgets and long term business plans.
The table below analyses the maturity profile of the Group's and Company's financial liabilities, including derivative financial instruments into relevant maturity groupings based on the remaining period from the balance sheet date to the contractual maturity date. The amounts disclosed in the table are the contractual undiscounted cash flows.
Less than 1 year
Between 1 and 2 years
Between 2 and 5 years
Over 5 years
US$’000 US$’000 US$’000 US$’000
2015
Group
Trade and other payables (74,925) - - -
Derivative financial instruments (487) - - -
Borrowings (99,275) (102,245) - -
(174,687) (102,245) - -
Company
Trade and other payables (6,031) - - -
Borrowings (99,275) (102,245) - -
(105,306) (102,245) - -

NOTES TO THE FINANCIAL STATEMENTSFor the financial year ended 31 December 2015
SAKARI RESOURCES LIMITED Annual Report 201592
Less than 1 year
Between 1 and 2 years
Between 2 and 5 years
Over 5 years
US$’000 US$’000 US$’000 US$’000
2014
Group
Trade and other payables (98,583) - - -
Borrowings (142,624) (76,681) - -
(241,207) (76,681) - -
Company
Trade and other payables (3,733) - - -
Borrowings (142,624) (76,681) - -
(146,357) (76,681) - -
(d) Capital risk
The Group's objectives when managing capital are to maintain an optimal capital structure so as to maximise shareholder value and to safeguard the Group's ability to continue as a going concern. The capital structure of the Group consists of debt, which includes borrowings, cash and cash equivalents and equity attributable to equity holders of the Company, comprising issued capital, reserves and retained profits.
In order to maintain or achieve an optimal capital structure, the Group may adjust the amount of dividend payment, return capital to shareholders, issue new shares, buy back issued shares, obtain new borrowings or sell assets to reduce borrowings.
The gearing ratio is calculated as net debt divided by the total book value of capital. Net debt is calculated as borrowings plus trade and other payables less cash and cash equivalents. Total capital is calculated as equity plus net debt.
The Group and the Company are in compliance with all externally imposed capital requirements for the financial years ended 31 December 2014 and 2015.
34. Financial risk management (continued)
(c) Liquidity risk (continued)

NOTES TO THE FINANCIAL STATEMENTSFor the financial year ended 31 December 2015
SAKARI RESOURCES LIMITED Annual Report 2015 93
34. Financial risk management (continued)
(d) Capital risk (continued)
Group Company
2015 2014 2015 2014
US$'000 US$'000 US$'000 US$'000
Net debt 236,680 253,225 199,914 199,728
Total equity 450,048 630,401 352,605 347,492
Total capital 686,728 883,626 552,519 547,220
Gearing ratio 34% 29% 36% 36%
(e) Fair value measurement
The following table presents assets and liabilities measured at fair value and classified by level of the following fair value measurement hierarchy:
i. Quoted prices (unadjusted) in active markets for identical assets or liabilities (Level 1);ii. Inputs other than quoted prices included within Level 1 that are observable
for the asset or liability, either directly (i.e. as prices) or indirectly (i.e. derived from prices) (Level 2); and
iii Inputs for the asset or liability that are not based on observable market data (unobservable inputs) (Level 3).
Level 1 Level 2 Level 3 Total
US$'000 US$'000 US$'000 US$'000
Group
2015
Assets
Available-for-sale financial assets 1,974 - - 1,974
Liabilities
Derivative financial instruments - 487 - 487

NOTES TO THE FINANCIAL STATEMENTSFor the financial year ended 31 December 2015
SAKARI RESOURCES LIMITED Annual Report 201594
Level 1 Level 2 Level 3 Total
US$'000 US$'000 US$'000 US$'000
Group
2014
Assets
Available-for-sale financial assets 2,005 - - 2,005
The fair value of financial instruments traded in active markets (such as trading and available-for-sale securities) is based on the quoted market prices at the balance sheet date. The quoted market prices used for financial assets held by the Group is the current bid price. These instruments are included in Level 1.
The fair value of financial instruments that are not traded in an active market (e.g. over-the-counter derivatives) is determined by using valuation techniques. The Group uses a variety of methods and makes assumptions that are based on market conditions existing at balance sheet date. Quoted market prices and index-linked prices for similar instruments are used to estimate fair value. These investments are classified as Level 2. In infrequent circumstances, where a valuation technique for these instruments is based on significant unobservable inputs, such instruments are classified as Level 3.
(f) Financial instruments by category
The carrying amount of the different categories of financial instruments is as disclosed on the face of the balance sheet and in Note 13, Note 17, Note 23 and Note 26 to the financial statements.
Group Company
2015 2014 2015 2014
US$'000 US$'000 US$'000 US$'000
Loans and receivables 80,823 139,370 490,798 505,088
Financial liabilities at amortised cost 269,925 313,583 201,031 218,733
34. Financial risk management (continued)
(e) Fair value measurement (continued)

NOTES TO THE FINANCIAL STATEMENTSFor the financial year ended 31 December 2015
SAKARI RESOURCES LIMITED Annual Report 2015 95
35. Related party transactions
(a) Key management personnel compensation
Group
2015 2014
US$'000 US$'000
Salaries and other short term employee benefits 1,167 1,408
1,167 1,408
Included in the total above is compensation provided to directors of the Company amounting to US$287,782 (2014: US$289,409*)
*Previously stated US$202,549 comparative figures have been restated to correct for the inadvertent omission of one director's fees.
(b) Sales and purchases of goods and services
In addition to the information disclosed elsewhere in the financial statements, the following transactions took place between the Group and related parties at terms agreed between the parties:
Group
2015 2014
US$'000 US$'000
Consultancy fees paid to related corporation 104 125
Sales of coal to related corporation - 3,703
Despatch income from related corporation - 10
Derivatives loss with ultimate holding company 1,735 33
Dividend paid to immediate parent company 1,617 -
Employee compensation paid to intermediate holding corporation
521 162
Interest expense payable to related corporation 3,820 3,288
Related corporations comprise mainly companies which are controlled or significantly influenced by the Group's ultimate holding company that are not part of the Group or companies which are controlled or significantly influenced by key management personnel and their close family members.

NOTES TO THE FINANCIAL STATEMENTSFor the financial year ended 31 December 2015
SAKARI RESOURCES LIMITED Annual Report 201596
36. Subsidiaries
The consolidated financial statements incorporate the assets, liabilities and results of the following subsidiaries in accordance with the accounting policy described in note 2(b):
Name of entityCountry of incorporation Principal activity Equity holding
2015 2014
% %
Tiger Energy Trading Pte Ltd (a) Singapore Trading 100 100
Sakari Energy Trading Pte Ltd (a) Singapore Investment holding 100 100
Sakari Energy Pte Ltd (a) Singapore Dormant 100 100
Reyka Wahana Digdjaya Pte Ltd (b) Singapore Dormant 100 100
PT Bahari Cakrawala Sebuku (c) Indonesia Coal mining 100 100
PT Sinergy Consultancy Services (c) Indonesia Management services 100 100
PT Reyka Wahana Digdjaya (c) Indonesia Investment holding 100 100
Sakari Marine & Infrastructure Pte Ltd (a) Singapore Marine Engineering 100 100
Sakari Australia Pty Ltd (b)(d) Australia Management services - 100
PT Bumiborneo Pertiwi Nusantara (c) Indonesia Investment holding 100 100
PT Borneo Citrapertiwi Nusantara (c) Indonesia Investment holding 100 100
PT Separi Energy (c) Indonesia Investment holding 100 100
PT Jembayan Muarabara (c) Indonesia Coal mining 100 100
PT Kemilau Rindang Abadi (c) Indonesia Coal mining 100 100
PT Arzara Baraindo Energitama (c) Indonesia Coal mining 100 100
PT Karbon Mahakam (c) Indonesia Coal mining 100 100
PT Metalindo Bumi Raya (c) Indonesia Coal mining 100 100
PT Citra Pertiwi Nusantara (c) Indonesia Asset holding 100 100
PT Bahari Perdana Persada (c) Indonesia Dormant 100 100
PT Bahari Putra Perdana (c) Indonesia Dormant 100 100
PT Bumi Borneo Metalindo (c) Indonesia Dormant 100 100
PT Sakti Utama Luas (b) Indonesia Dormant 100 100
PT Makassar Prima Coal Indonesia Dormant 70 70
PT Cakrawala Abadi Jaya (b) Indonesia Dormant 100 100
PT Tri Tunggal Lestari Bersama (b) Indonesia Dormant 100 100
PT Cakrawala Bara Borneo (b) Indonesia Dormant 100 100
Sakari Royal Limited (b) Cambodia Coal Exploration 70 70
(a) Audited by PricewaterhouseCoopers LLP, Singapore. (b) Not required to be audited under the law of the country of incorporation. (c) Audited by KAP Tanudiredja, Wibisana, Rintis & Rekan - a member firm of the PricewaterhouseCoopers global network. (d) The Company was dissolved in 2015.
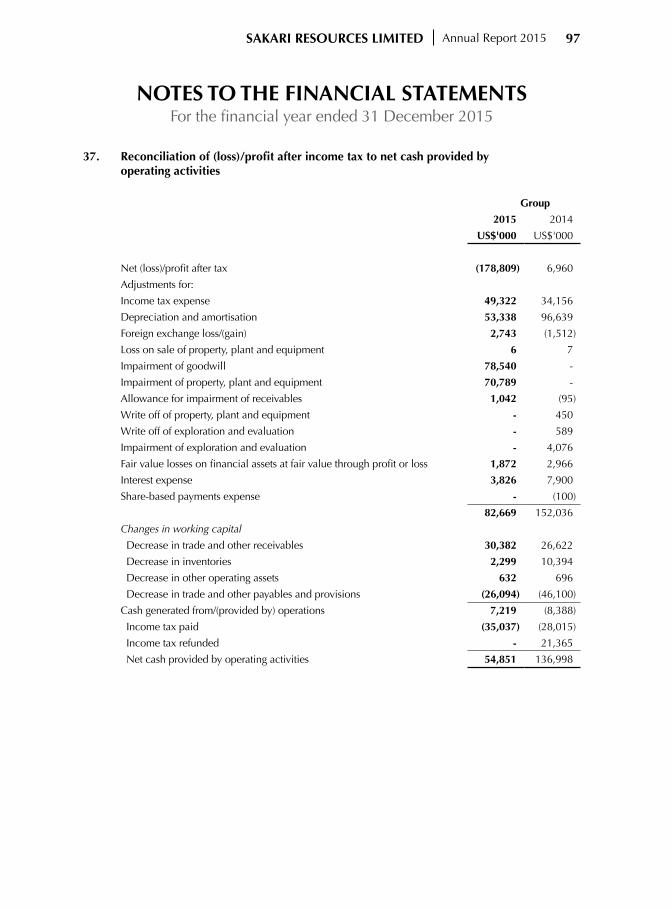
NOTES TO THE FINANCIAL STATEMENTSFor the financial year ended 31 December 2015
SAKARI RESOURCES LIMITED Annual Report 2015 97
37. Reconciliation of (loss)/profit after income tax to net cash provided by operating activities
Group
2015 2014
US$'000 US$'000
Net (loss)/profit after tax (178,809) 6,960
Adjustments for:
Income tax expense 49,322 34,156
Depreciation and amortisation 53,338 96,639
Foreign exchange loss/(gain) 2,743 (1,512)
Loss on sale of property, plant and equipment 6 7
Impairment of goodwill 78,540 -
Impairment of property, plant and equipment 70,789 -
Allowance for impairment of receivables 1,042 (95)
Write off of property, plant and equipment - 450
Write off of exploration and evaluation - 589
Impairment of exploration and evaluation - 4,076
Fair value losses on financial assets at fair value through profit or loss 1,872 2,966
Interest expense 3,826 7,900
Share-based payments expense - (100)
82,669 152,036
Changes in working capital
Decrease in trade and other receivables 30,382 26,622
Decrease in inventories 2,299 10,394
Decrease in other operating assets 632 696
Decrease in trade and other payables and provisions (26,094) (46,100)
Cash generated from/(provided by) operations 7,219 (8,388)
Income tax paid (35,037) (28,015)
Income tax refunded - 21,365
Net cash provided by operating activities 54,851 136,998

NOTES TO THE FINANCIAL STATEMENTSFor the financial year ended 31 December 2015
SAKARI RESOURCES LIMITED Annual Report 201598
38. New or revised accounting standards and interpretations
Below are the mandatory standards, amendments and interpretations to existing standards that have been published, and are relevant for the Group’s accounting periods beginning on or after 1 January 2016 or later periods and which the Group has not early adopted:
(a) FRS 16 Property plant and equipment and FRS 38 Intangible assets (effective for annual periods beginning on or after 1 January 2016)
This amendment clarifies that the use of revenue-based methods to calculate the depreciation of an asset is not appropriate because revenue generated by an activity that includes the use of an asset generally reflects factors other than the consumption of the economic benefits embodied in the asset. This has also clarified that revenue is generally presumed to be an inappropriate basis for measuring the consumption of the economic benefits embodied in an intangible asset. The presumption may only be rebutted in certain limited circumstances. These are where the intangible asset is expressed as a measure of revenue; or where it can be demonstrated that revenue and the consumption of the economic benefits of the intangible asset are highly correlated.
This amendment is not expected to have any significant impact on the financial statements of the Group.
(b) FRS 1 Presentation of financial statements (effective for annual periods beginning on or after 1 January 2016)
The amendment clarifies guidance in FRS 1 on materiality and aggregation, the presentation of subtotals, the structure of financial statements and the disclosure of accounting policies.
This amendment is not expected to have any significant impact on the financial statements of the Group.
(c) FRS 115 Revenue from contracts with customers (effective for annual periods beginning on or after 1 January 2017*)
This is the converged standard on revenue recognition. It replaces FRS 11 Construction contracts, FRS 18 Revenue, and related interpretations. Revenue is recognised when a customer obtains control of a good or service. A customer obtains control when it has the ability to direct the use of and obtain the benefits from the good or service. The core principle of FRS 115 is that an entity recognises revenue to depict the transfer of promised goods or services to customers in an amount that reflects the consideration to which the entity expects to be entitled in

NOTES TO THE FINANCIAL STATEMENTSFor the financial year ended 31 December 2015
SAKARI RESOURCES LIMITED Annual Report 2015 99
exchange for those goods or services. An entity recognises revenue in accordance with that core principle by applying the following steps:
- Step 1: Identify the contract(s) with a customer - Step 2: Identify the performance obligations in the contract - Step 3: Determine the transaction price - Step 4: Allocate the transaction price to the performance obligations in the contract - Step 5: Recognise revenue when (or as) the entity satisfies a performance obligation
FRS 115 also includes a cohesive set of disclosure requirements that will result in an entity providing users of financial statements with comprehensive information about the nature, amount, timing and uncertainty of revenue and cash flows arising from the entity’s contracts with customers.
This amendment is not expected to have any significant impact on the financial statements of the Group.
*(The effective date of IFRS 15 Revenue from contracts with customers has been deferred from 1 January 2017 to 1 January 2018. No such deferral has been made for FRS 115 Revenue from contracts with customers as at 31 October 2015).
(d) FRS 109 Financial instruments (effective for annual periods beginning on or after 1 January 2018)
The complete version of FRS 109 replaces most of the guidance in FRS 39. FRS
109 retains but simplifies the mixed measurement model and establishes three primary measurement categories for financial assets: amortised cost, fair value through Other Comprehensive Income (OCI) and fair value through Profit or Loss. The basis of classification depends on the entity’s business model and the contractual cash flow characteristics of the financial asset. Investments in equity instruments are required to be measured at fair value through profit or loss with the irrevocable option at inception to present changes in fair value in OCI. There is now a new expected credit losses model that replaces the incurred loss impairment model used in FRS 39.
38. New or revised accounting standards and interpretations (continued)
(c) FRS 115 Revenue from contracts with customers (effective for annual periods beginning on or after 1 January 2017*) (continued)

NOTES TO THE FINANCIAL STATEMENTSFor the financial year ended 31 December 2015
SAKARI RESOURCES LIMITED Annual Report 2015100
For financial liabilities there were no changes to classification and measurement except for the recognition of changes in own credit risk in other comprehensive income, for liabilities designated at fair value, through profit or loss. FRS 109 relaxes the requirements for hedge effectiveness by replacing the bright line hedge effectiveness tests. It requires an economic relationship between the hedged item and hedging instrument and for the ‘hedged ratio’ to be the same as the one management actually use for risk management purposes. Contemporaneous documentation is still required but is different to that currently prepared under FRS 39.
This amendment is not expected to have any significant impact on the financial statements of the Group.
39. Authorisation of financial statements
These financial statements were authorised for issue in accordance with a resolution of the Board of Directors of Sakari Resources Limited on 5 February 2016.
38. New or revised accounting standards and interpretations (continued)
(d) FRS 109 Financial instruments (effective for annual periods beginning on or after 1 January 2018) (continued)

SAKARI RESOURCES LIMITED Annual Report 2015 101
GLOSSARY
The following definitions apply throughout this Annual Report:
“ASP” Average selling price
“Board” The Board of Directors of Sakari
“CEO” Chief Executive Officer
“Sakari”, “Company” Sakari Resources Limited
“Group” Sakari and its subsidiaries
“ha” Hectares
“Mt” Millions of metric tonnes
“pa” per year
“PTT” PTT Public Company Limited Ltd, Sakari’s ultimate holding company
“t” One metric tonne
“Kt” Thousands of metric tonnes
“$”, “US$” United States dollars
“CY” Calendar year

SAKARI RESOURCES LIMITED Annual Report 2015102
This page has been intentionally left blank.

SAKARI RESOURCES LIMITED Annual Report 2015 103
SAKARI RESOURCES LIMITED(Company Registration Number: 199504024R)
(Incorporated in the Republic of Singapore)
NOTICE OF ANNUAL GENERAL MEETING
NOTICE IS HEREBY GIVEN that the Annual General Meeting of SAKARI RESOURCES LIMITED (“the Company”) will be held at the Marie I and II, York Hotel, 21 Mount Elizabeth, Singapore 228516 on Tuesday, 24 May 2016 at 14:00 for the following purposes:
AS ORDINARY BUSINESS
To consider and, if thought fit, to pass the following resolutions as Ordinary Resolutions, with or without any modifications:
1. To receive and adopt the Directors’ Statement and the Audited Financial Statements of the Company for the year ended 31 December 2015 together with the Auditors’ Report thereon. (Resolution 1)
2. To re-elect the following Directors retiring pursuant to Articles 94 and 100 of the Company’s Constitution:
Ms Julie Therese Hall [Retiring under Article 94] (Resolution 2)
Mrs Rosaya Teinwan [Retiring under Article 100] (Resolution 3)
Ms Julie Therese Hall will, upon re-election as a Director of the Company, remain as a member of the Remuneration and Nomination Committee.
3. To re-appoint Mr Han Eng Juan as a Director of the Company who was previously re-appointed to hold office until this Annual General Meeting pursuant to Section 153(6) of the Companies Act, Cap. 50, which was in force immediately before 3 January 2016. (Resolution 4)
Mr Han Eng Juan will, upon re-appointment as a Director of the Company, remain as
Chairman of the Audit, Risk and Compliance Committee.
4. To approve the payment of directors’ fees of up to S$501,000 payable by the Company for the year ending 31 December 2016. (Resolution 5)
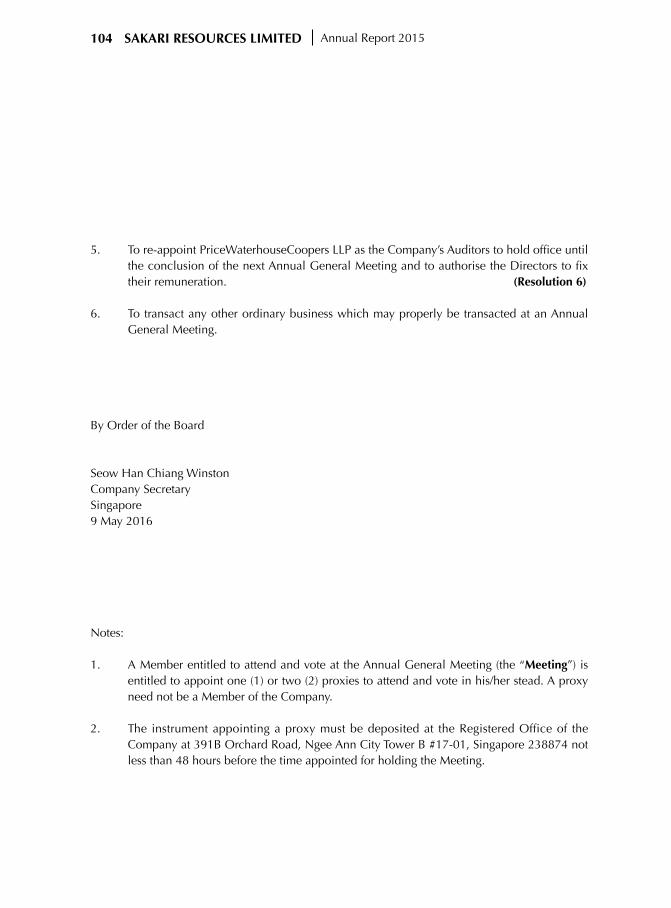
SAKARI RESOURCES LIMITED Annual Report 2015104
5. To re-appoint PriceWaterhouseCoopers LLP as the Company’s Auditors to hold office until the conclusion of the next Annual General Meeting and to authorise the Directors to fix their remuneration. (Resolution 6)
6. To transact any other ordinary business which may properly be transacted at an Annual General Meeting.
By Order of the Board
Seow Han Chiang WinstonCompany SecretarySingapore9 May 2016
Notes:
1. A Member entitled to attend and vote at the Annual General Meeting (the “Meeting”) is entitled to appoint one (1) or two (2) proxies to attend and vote in his/her stead. A proxy need not be a Member of the Company.
2. The instrument appointing a proxy must be deposited at the Registered Office of the Company at 391B Orchard Road, Ngee Ann City Tower B #17-01, Singapore 238874 not less than 48 hours before the time appointed for holding the Meeting.
