corporate governance and market microstructure: evidence on...
TRANSCRIPT
International Journal of Academic Research in Accounting, Finance and Management Sciences Vol. 4, No.2, April 2014, pp. 58–71
E-ISSN: 2225-8329, P-ISSN: 2308-0337 © 2014 HRMARS
www.hrmars.com
Corporate Governance and Market Microstructure: Evidence on Institutional Investors in the Tunisian Stock Exchange
Nadia Belkhir BOUJELBÉNE1
Abdelfatteh BOURI2
Jean-Luc PRIGENT3
1,2Research Unit Corporate Finance Financial Theory – COFFIT, Faculty of Economics
Sciences and Management,University of Sfax, 3018 Sfax, Tunisia, 1E-mail: [email protected],
2E-mail: [email protected]
3Research Unit THéorie Economique, Modélisation et Applications –THEMA,
University of Cergy,Pontoise. 33, boulevard du Port, F-95011 Cergy-Pontoise Cedex, France,
3E-mail: [email protected]
Abstract This paper investigates the relationship between market microstructure and corporate governance
in the Tunisian Stock Market. We examine in particular, the relationship between stock liquidity and institutional ownership by the type of institutions (e.g. banks, insurance companies, investment companies, pension funds). We consider eight liquidity measures: absolute quoted bid-ask spread, relative quoted bid-ask spread, absolute effective bid-ask spread, relative effective bid-ask spread, depth, lambda, turnover ratio and Amihud (2002) illiquidity ratio. For our sample, institutional ownership was found to have a significant negative impact on the stock liquidity as measured by Amihud (2002) illiquidity ratio. Our findings support the contention that the relationship between stock liquidity and institutional ownership varies significantly across institution. The ownership of insurance companies increases the bid-ask spreads. The investment companies have a significant and negative effect on the liquidity more than the other types of institutions.
Key words Institutional ownership, liquidity, bid-ask spread, adverse selection
DOI: 10.6007/IJARAFMS/v4-i2/776 URL: http://dx.doi.org/10.6007/IJARAFMS/v4-i2/776
1. Introduction
In the past few years, the relationship between the market microstructure and corporate governance has become the subject a popular discussion. A fundamental objective of the present study is to explore how institutional ownership influences the stock market liquidity and whether these effects vary with institution type in the emerging stocks markets. We derive implications using market microstructure theories that relate investors’ characteristics to liquidity.
Several studies show that large institutional ownership increases the spreads and the degree of information asymmetry (e.g. Dennis and Weston, 2001; Agarwal, 2007; Rubin, 2007; Brockman and Yan, 2009), and institutional trading is probably directed by information (e.g. Ali et al., 2004; Bushee and Goodman, 2007). These studies are undertaken for developed capital markets where the institutional environments differ greatly from the Tunisian one. The Tunisian Financial system is fragmented and dominated by banks. Moreover, financial institutions, including insurance, investment and securities companies, own important proportions of shares in the listed companies and are often among the five largest blockholders. The main characteristic of ownership is that it is highly concentrated.
This paper has three distinct features that differentiate it from the existing studies. Firstly, it is the first study to investigate the influence of institutional investors on the liquidity in the Tunisian Stock Exchange. Secondly, we gather transaction data from pure order driven market, while previous studies collected
International Journal of Academic Research in Accounting, Finance and Management Sciences Vol. 4 (2), pp. 58–71, © 2014 HRMARS
59
transaction data from quote-driven markets. Thirdly, we explore a set of better measures of liquidity such as quoted spread, effective spread, market depth, turnover, lambda and price impact (Amihud illiquidity ratio).
2. Literature review
A number of studies, such as those of Keim and Madhaven (1995) and Chakravarty (2001) have examined the interaction between institutional trading, liquidity and price pressure although other studies have examined the relationship between institutional ownership, spread and measures of adverse selection. These studies focusing on institutional investors play an important role and ponder whether these investors are informed or not. A higher institutional ownership leads to asymmetry information and therefore low liquidity. The influence of institutional investors on the liquidity could be reinforced by that the practices in the settlement of the share price (Lakonishok, Shleifer and Vishny, 1992). As the ownership structure can determine the extent of the spread and its adverse selection component, the spread can also determine ownership structure.
Two hypotheses are generated by institutional ownership: hypothesis of adverse selection and hypothesis of liquidity. The hypothesis of adverse selection assures that large institutional ownership creates information asymmetry and thus increases the spread. Institutional investors are often regarded as more informed than individuals and generate the information asymmetry. The hypothesis of liquidity implies that the increase of institutional ownership should lead to a high liquidity and a narrow spread with a high trading volume and an increase in the number of trading activities and that of the analysts following.
The expected impact of institutional ownership on liquidity is ambiguous. On the one hand, institutional investors are considered to have access to private information about the firm either because they have resources to make analyses on the firm and acquire information, or they occupy the position of a director when they have a large fraction of the capital. Glosten and Milgrom (1985) proved that the market makers have a problem of adverse selection of informed investors and thus they are brought to widen spreads. Hence, increased institutional ownership should lead to wider spreads and higher adverse selection costs. In addition, institutional investors usually conduct a block of transactions on the market and the size of their transactions implies a higher cost of inventory position. Market makers are made to expand the spread and thus they would be forced to own a larger inventory position in stocks with a higher institutional ownership. These factors explain the negative impact of institutional ownership on liquidity. On the other hand, institutional investors are indirect, and their investment policy is to hold diversified portfolios that compensate them. These institutional investors are considered heterogeneous. Thus, the spreads would be a decreasing function of institutional ownership.
The relationship between institutional ownership and liquidity has been the subject of various empirical studies. Some studies (Kothare and Laux, 1995; Sarin et al. 2000; Rubin, 2007) suggest that the relationship is negative between these two variables (Kothare and Laux, 1995; Sarin et al. 2000; Rubin, 2007). In contrast, other authors (Falkenstein, 1996; Dennis and Weston, 2001; Jennings Schnatterly and Seguin, 2002; Fehle, 2004) show a positive correlation between institutional ownership and liquidity, which supports the hypothesis that institutional investors prefer the most liquid shares. Finally, other studies consider that there is no significant relationship between these two variables (Naes, 2004; Sharma, 2005).
Fabozzi (1979) examines the relationship between institutional ownership and bid-ask spreads and found no significant relationship for a sample of NASDAQ stocks. However, Benston and Hagerman (1974) found that bid-ask spreads are positively correlated with price, unsystematic risk and institutional ownership, while they are negatively correlated with the number of shareholders and the market makers, for a sample of NYSE stocks. In the same context, Kothare and Laux (1995) find that bid-ask spreads are positively related to institutional ownership. These authors treat institutional ownership as exogenous. Falkenstein (1996) points out that the spreads and institutional ownership could be determined simultaneously when the institutions prefer large and liquid stocks. For this reason, Dennis and Weston (2001) found that the relative spread is negatively related to institutional ownership. Until the market maker may enlarge the spread in trading with institutional investors, the latter prefer stocks with narrower spreads because they are more liquid. According to the hypothesis that institutional are informed, Dennis and Weston (2001) argued that the relationship between the costs of adverse selection and the proportion of institutional ownership is positive. Their results corroborate those obtained by Tinic (1972) and Hamilton (1978) who found a negative relation between
International Journal of Academic Research in Accounting, Finance and Management Sciences Vol. 4 (2), pp. 58–71, © 2014 HRMARS
60
institutional ownership and bid-ask spreads for a sample of NYSE and NASDAQ stocks, respectively. In contrast, Chiang and Venkatesh (1988) found no significant relationship for a sample of NYSE stocks.
Sarin et al. (2000) treat both ownership structure and spreads as endogenous and they show that greater institutional ownership leads to larger spreads, the adverse selection components of the spread, and smaller quoted depths. Rubin (2007) finds a two-sided relation between institutional ownership and liquidity. On the one hand, liquidity is positively related with institutional ownership; on the other hand, liquidity is negatively related with institutional concentration. Agarwal (2009) finds a non-monotonic relationship between institutional holdings and stock liquidity.
Institutional investors can identify and choose securities that meet their preferences and goals. Banks, insurance companies and pension funds has to count on publicly available information to justify the caution of their investments. An addition of a large position by mutual funds and investment companies can indicate that an institution possesses any informative advantage. Consequently, concentration of ownership by mutual funds and investment companies is a stronger signal of information asymmetry than that of banks, insurance companies and pension funds.
In this context, Bennett, Sias, and Starks (2001) affirm that the correlation between turnover and the ownership of banks is five times as small as the correlation between the turnover and the investment companies ownership, it is 3.5 times as small as the correlation between the turnover and the mutual funds ownership and it is 50 percent less than the correlation with insurance companies and other institutional ownership.
The study of Jennings, Schnatterly and Seguin (2002) confirms the negative relationship between the proportion of the shares held by the institutional ownership and the spreads for 35 quarters of companies quoted on NASDAQ during the first quarter of 1983 until the third quarter of 1991. This negative correlation indicates that institutional investors turn their portfolio at a rate higher than that of individual investors and those short horizons of investment prefer more liquid shares. In other words, the narrow spread causes the increases of institutional ownership. Indeed, the authors find a negative relation between institutional ownership and adverse selection component of spread. Jennings, Schnatterly and Seguin (2002) execute Granger-causation tests and find that changes in spread cause changes in institutional ownership; this result reflects preferences of the institutional investors for more liquid shares. The increases in institutional ownership lead to decreases in abnormal spreads. This result proves that changes in the institutional ownership lead to changes in the informational environment of the company.
Barabanov and McNamara (2002) use total institutional ownership, type of institution (banks, pension funds of pension, etc.) and a new measure of concentration of the ownership, which is similar to the index of Herfindahl, to explain the multi-return periods and the contemporary spread for 72 quarters of shares of NASDAQ exchanged during the period 1983-2000. Their results support the hypothesis according to which the relative spreads are negatively and significantly related to the institutional ownership and positively and significantly related to the concentration of ownership. Barabanov and Mc Namara (2002) show that the relative bid-ask spreads are negatively related to the level of institutional ownership.
Fehle (2004) examined the relationship between bid-ask spread measured both as effective and specialist spreads and institutional ownership. He found that spreads are negatively related to institutional ownership. This inverse relation is reversed for two types of institutions, banks and investment companies. The author also found that the turnover is raised for banks and investment companies.
3. Structure of the Tunisian Stock Exchange (BVMT)
The Tunisian Stock Exchange (BVMT) is a purely an order driven market where investors can choose between market and limit orders, so as liquidity is provided only by limit order traders. Orders are submitted by brokers on the behalf of investors and executed through an automated trading system, using a computerized limit-order book, known as SUPERCAC.
Trading is executed from 8:30 a.m. to 11:30 a.m. from Monday to Friday. It begins by a pre-opening session (from 9:00 a.m. to 10:00 a.m.) during which investors can deposit, change or cancel orders but no share exchange is permitted. A theoretical opening price is displayed in real time to show the market tendency. The values are classified according to their liquidity. The least liquid values are with dimensions of

International Journal of Academic Research in Accounting, Finance and Management Sciences Vol. 4 (2), pp. 58–71, © 2014 HRMARS
61
fixing whereas the most liquid values are with dimensions of continuous. With the opening 10:00 a.m. the system calculates a fixing price for each value according to the orders present on the market.
There are two main trading methods: call auction and continuous trading. The market opens by a call auction for all stocks at some point of time during the first five-minute opening period. For the more actively traded stocks, this is followed by a continuous market until 11:30 a.m. but, for illiquid stocks. A second call is set at 10:15 a.m. for securities not traded at the open call and a last call takes place at 11:00 a.m. Market orders have no limit on prices and look for immediate execution while limit orders specify a price either above the current ask or below the current bid and offer price improvement relative to market orders. A market order is matched with the best opposite quote of the order book. Limit orders are held in the limit order book until they are matched with incoming market orders to produce exchanges; otherwise, they are annulled or modified. A limit order faces the risk of non-execution whereas a market order executes with certainty. At the end of each month, all orders are purged from the limit order book.
4. Data
Our sample was chosen from all the Tunisian firms listed in the Tunisian Stock Exchange (BVMT) for the period 1 January 2001 to 31 December 2007. The initial sample contains firms from both financial and nonfinancial sectors. We exclude firms for which trading and liquidity data are not available. The trading data include transaction prices, trading volume and market capitalization. The liquidity data include the five best bid and ask prices updated with the corresponding bid and ask size, and the number of orders in each quote.
We constructed variables measuring different dimension of institutional ownership using data collected manually from the firm’s annual reports of the official bulletins of the Tunisian Stock Exchange (BVMT), from the leaflets of issue of shares and from financial statements published in the official bulletins of the Tunisian Stock Exchange (BVMT) for seven years for the reason that there is no electronic database on Tunisian firm ownership.
For each firm and each year, we construct the proportion of a firm’s outstanding shares held by all institutions and the proportion held by members of each of the types of institutions, such as banks, insurance companies, investment firms and pension funds. The ownership data are only available on the 31st December of each year. Our data will be organized in the form of panel data in order to increase the number of observations (because the number of the listed companies in Tunisia is low). The final sample consists of 210 firm-year observations.
The objective of our research design is to measure the effect of institutional ownership and the types of institutions on stock liquidity. Given the multiple facets of liquidity in financial research, it is difficult for one measure to capture its various dimensions. Liquidity is the dependent variable in our analysis. We use eight alternative measures to proxy liquidity, which consist of absolute quoted bid-ask spread, relative quoted bid-ask spread, absolute effective bid-ask spread, relative effective bid-ask spread, depth, lambda, turnover ratio (Datar et al., 1998; Chan and Faff, 2005; Lam and Tam, 2011; Hearn and Piesse, 2013) and Amihud (2002) illiquidity ratio. The liquidity measures, which are calculated for each firm from 2001 to 2007, are defined as follows:
The absolute quoted bid-ask spread (AQS) is defined as the quoted ask price minus the quoted bid price, where Ask and bid are the best ask and bid prices, respectively, at the end-of-day.
ttt BidAskAQS (1)
The relative quoted bid-ask spread (RQS) is defined as the quoted ask price minus the quoted bid price scaled by their midpoint.
)2
( tt
tt
t BidAsk
BidAskRQS
(2)
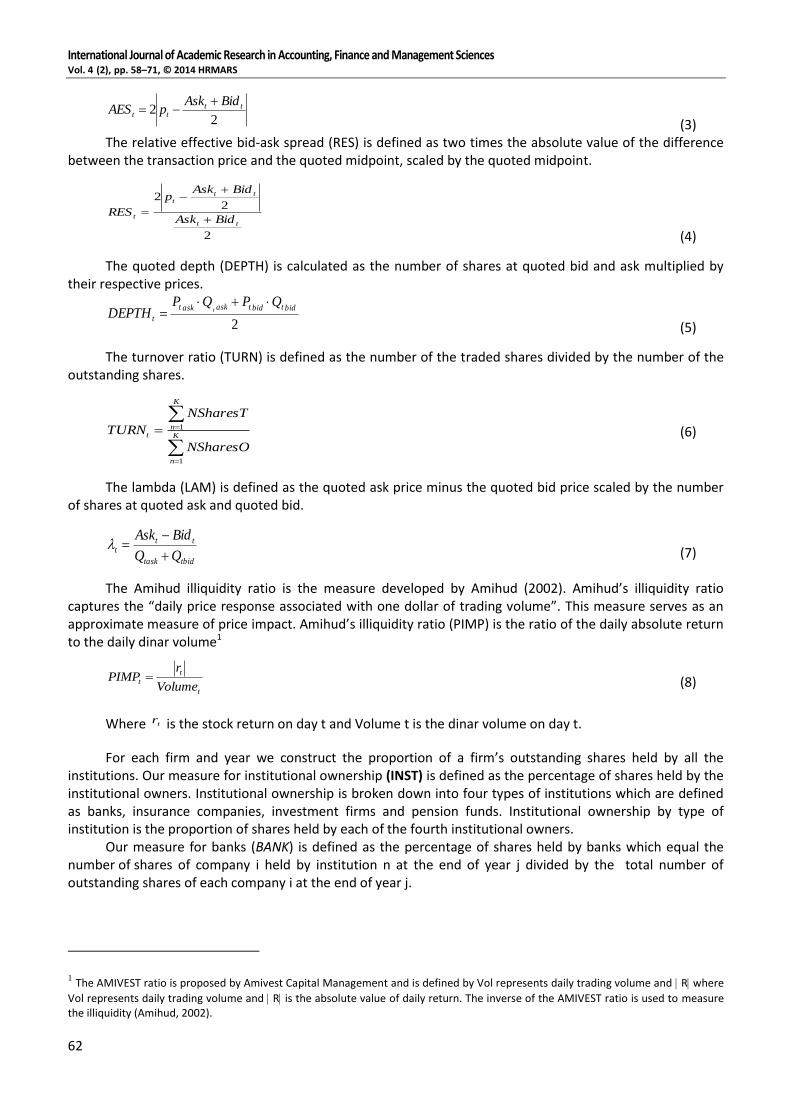
The absolute effective bid-ask spread (AES) is defined as two times the absolute value of the difference between the transaction price and the quoted midpoint.
International Journal of Academic Research in Accounting, Finance and Management Sciences Vol. 4 (2), pp. 58–71, © 2014 HRMARS
62
22 tt
tt
BidAskpAES
(3) The relative effective bid-ask spread (RES) is defined as two times the absolute value of the difference
between the transaction price and the quoted midpoint, scaled by the quoted midpoint.
2
22
tt
ttt
t BidAsk
BidAskp
RES
(4)
The quoted depth (DEPTH) is calculated as the number of shares at quoted bid and ask multiplied by their respective prices.
2
bidtbidtaskaskt
t
QPQPDEPTH t
(5)
The turnover ratio (TURN) is defined as the number of the traded shares divided by the number of the outstanding shares.
K
n
K
nt
NSharesO
NSharesT
TURN
1
1 (6)
The lambda (LAM) is defined as the quoted ask price minus the quoted bid price scaled by the number of shares at quoted ask and quoted bid.
tbidtask
ttt
BidAsk
(7)
The Amihud illiquidity ratio is the measure developed by Amihud (2002). Amihud’s illiquidity ratio captures the “daily price response associated with one dollar of trading volume”. This measure serves as an approximate measure of price impact. Amihud’s illiquidity ratio (PIMP) is the ratio of the daily absolute return to the daily dinar volume1
t
t
tVolume
rPIMP (8)
Where tr is the stock return on day t and Volume t is the dinar volume on day t.
For each firm and year we construct the proportion of a firm’s outstanding shares held by all the institutions. Our measure
for institutional ownership (INST) is defined as the percentage of shares held by the
institutional owners. Institutional ownership is broken down into four types of institutions which are defined as banks, insurance companies, investment firms and pension funds. Institutional ownership by type of institution is the proportion of shares held by each of the fourth institutional owners.
Our measure for banks (BANK) is defined as the percentage of shares held by banks which equal the
number of shares of company i held by institution n at the end of year j divided by the total number of outstanding shares of each company i at the end of year j.
1 The AMIVEST ratio is proposed by Amivest Capital Management and is defined by Vol represents daily trading volume and R where
Vol represents daily trading volume and R is the absolute value of daily return. The inverse of the AMIVEST ratio is used to measure the illiquidity (Amihud, 2002).

International Journal of Academic Research in Accounting, Finance and Management Sciences Vol. 4 (2), pp. 58–71, © 2014 HRMARS
63
ij
Bkn
n
inj
NShares
NUB
ijBANK
1
(9) Where NUBinj is the number of shares of company i held by banks at the end of year j; KB is the number of banks in company i.
NSharesij is the number of outstanding shares of company i at the end of year j. The percentage of shares held by insurance companies, INSUij, is defined as:
ij
Ikn
n
inj
NShares
NUB
ijINSU
1
(10)
Where KI is the number of insurance companies in company i. Our measure
for pension funds (PFUND) is defined as the percentage of shares held by pension funds
which equal to the number of shares of company i held by institution n at the end of year j divided by the total number of outstanding shares of each company i at the end of year j.
ij
Pkn
n
inj
NShares
NUB
ijPFUND
1
(11)
Where KP is the number of pension funds in company i. The percentage of shares held by investment firms, INVESij, is defined as:
ij
INkn
n
inj
NShares
NUB
ijINVES
1
(12)
Where KIN is the number of investment firms in company i. We separate the effect of institutional ownership on stock liquidity by including several control
variables that have been used as liquidity proxies in previous researches (Rubin, 2007; Ree and Wang, 2009; Brockman, Chung and Yan, 2009; Jacoby and Zheng, 2010). We include share price (PRICE), trading volume (TRAD), return volatility (RVOL) and firm size (SIZE) as these have been shown to be correlated with many measures of liquidity. Share price is the average of closing daily price. Price levels can affect the liquidity of stock. Trading volume is defined as the total trading volume divided by of trading days. Return volatility is a measure of the standard deviation of daily close-to-close returns. Firm size is the natural log of the market value of the firm’s equity, calculated at the end of each trading day and averaged over the year. The purpose of the log transformation is to reduce skewness. This variable was also used by Brockman, Chung and Yan, 2009.
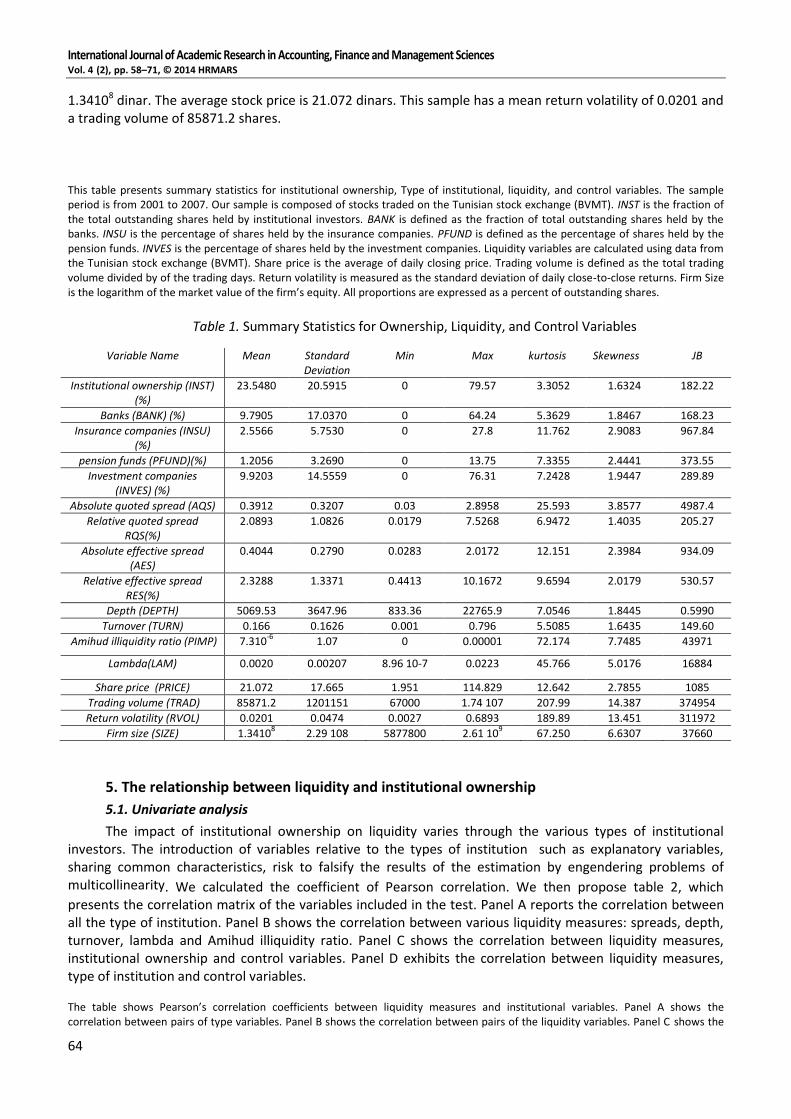
Descriptive statistics In table 1, we report descriptive statistics for many variables used in our analysis. The mean proportion
of outstanding shares held by institutions is 23.5 percent. Similarly, Jennings, Schnatterly and Seguin (2002) found that this value is equal to 23.21 percent for a sample of NASDAQ stocks. The statistics shows a considerable deviation from 0 percent to 79.57 percent. The values of skewness and Kurtosis of this series show that the distribution of institutional ownership is leptokurtic (kurtosis > 3) and asymmetric (skewness > 0). These features show a highly concentrated ownership in the Tunisian firms. Of the four institutional types, investment firms hold, on average, the greatest proportion of outstanding shares with 9.92 percent. Pension funds are present for only a small portion of the sample with 1.205 percent.
Given that the liquidity measures are highly skewed, we employ the log transformation of some measures. The relative effective spread (RES) is greater than the relative quoted spread (RQS). The average relative quoted bid-ask spread is 2.0893 percent however the average relative effective bid-ask spread is 2.3288 percent. The average depth is 5069.53. The Amihud illiquidity ratio
has a mean of 7.310-6 and a
standard deviation of 1.07, after multiplying by 1000000. These measures are similar to those reported in the existing studies (Jacoby and Zheng, 2010; Ree and Wang, 2009). The average market capitalization of firms is
International Journal of Academic Research in Accounting, Finance and Management Sciences Vol. 4 (2), pp. 58–71, © 2014 HRMARS
64
1.34108 dinar. The average stock price is 21.072 dinars. This sample has a mean return volatility of 0.0201 and a trading volume of 85871.2 shares.
This table presents summary statistics for institutional ownership, Type of institutional, liquidity, and control variables. The sample period is from 2001 to 2007. Our sample is composed of stocks traded on the Tunisian stock exchange (BVMT). INST is the fraction of the total outstanding shares held by institutional investors. BANK is defined as the fraction of total outstanding shares held by the banks. INSU is the percentage of shares held by the insurance companies. PFUND is defined as the percentage of shares held by the pension funds. INVES is the percentage of shares held by the investment companies. Liquidity variables are calculated using data from the Tunisian stock exchange (BVMT). Share price is the average of daily closing price. Trading volume is defined as the total trading volume divided by of the trading days. Return volatility is measured as the standard deviation of daily close-to-close returns. Firm Size is the logarithm of the market value of the firm’s equity. All proportions are expressed as a percent of outstanding shares.
Table 1. Summary Statistics for Ownership, Liquidity, and Control Variables
Variable Name Mean Standard Deviation
Min Max kurtosis Skewness JB
Institutional ownership (INST) (%)
23.5480 20.5915 0 79.57 3.3052 1.6324 182.22
Banks (BANK) (%) 9.7905 17.0370 0 64.24 5.3629 1.8467 168.23
Insurance companies (INSU) (%)
2.5566 5.7530 0 27.8 11.762 2.9083 967.84
pension funds (PFUND)(%) 1.2056 3.2690 0 13.75 7.3355 2.4441 373.55
Investment companies (INVES) (%)
9.9203 14.5559 0 76.31 7.2428 1.9447 289.89
Absolute quoted spread (AQS) 0.3912 0.3207 0.03 2.8958 25.593 3.8577 4987.4
Relative quoted spread RQS(%)
2.0893 1.0826 0.0179 7.5268 6.9472 1.4035 205.27
Absolute effective spread (AES)
0.4044 0.2790 0.0283 2.0172 12.151 2.3984 934.09
Relative effective spread RES(%)
2.3288 1.3371 0.4413 10.1672 9.6594 2.0179 530.57
Depth (DEPTH) 5069.53 3647.96 833.36 22765.9 7.0546 1.8445 0.5990
Turnover (TURN) 0.166 0.1626 0.001 0.796 5.5085 1.6435 149.60
Amihud illiquidity ratio (PIMP) 7.310-6
1.07 0 0.00001 72.174 7.7485 43971
Lambda(LAM) 0.0020 0.00207 8.96 10-7 0.0223 45.766 5.0176 16884
Share price (PRICE) 21.072 17.665 1.951 114.829 12.642 2.7855 1085
Trading volume (TRAD) 85871.2 1201151 67000 1.74 107 207.99 14.387 374954
Return volatility (RVOL) 0.0201 0.0474 0.0027 0.6893 189.89 13.451 311972
Firm size (SIZE) 1.34108 2.29 108 5877800 2.61 10
9 67.250 6.6307 37660
5. The relationship between liquidity and institutional ownership
5.1. Univariate analysis
The impact of institutional ownership on liquidity varies through the various types of institutional investors. The introduction of variables relative to the types of institution such as explanatory variables, sharing common characteristics, risk to falsify the results of the estimation by engendering problems of multicollinearity. We calculated the coefficient of Pearson correlation. We then propose table 2, which presents the correlation matrix of the variables included in the test. Panel A reports the correlation between all the type of institution. Panel B shows the correlation between various liquidity measures: spreads, depth, turnover, lambda and Amihud illiquidity ratio. Panel C shows the correlation between liquidity measures, institutional ownership and control variables. Panel D exhibits the correlation between liquidity measures, type of institution and control variables. The table shows Pearson’s correlation coefficients between liquidity measures and institutional variables. Panel A shows the correlation between pairs of type variables. Panel B shows the correlation between pairs of the liquidity variables. Panel C shows the

International Journal of Academic Research in Accounting, Finance and Management Sciences Vol. 4 (2), pp. 58–71, © 2014 HRMARS
65
correlation between pairs of major liquidity and institutional variable and control variables. Panel D shows the correlation between pairs of major liquidity, type of institutional variables and control variables. AQS is the quoted ask price minus the quoted bid price. RQS is the quoted ask price minus the quoted bid price scaled by their midpoint. AES is defined as two times the absolute value of the difference between the transaction price and the quoted midpoint. RES is defined as two times the absolute value of the difference between the transaction price and the quoted midpoint, scaled by the quoted midpoint. DEPTH is the number of shares at quoted bid and ask multiplied by their respective prices. LAM is defined as the quoted ask price minus the quoted bid price scaled by the number of shares at quoted ask and quoted bid. TURN is the number of shares traded divided by the number of shares outstanding. PIMP is the ratio of the daily absolute return to the daily dinar volume. INST is the proportion of shares outstanding held by institutional investors. BANK is defined as the fraction of total shares outstanding held by the banks. INSU is the percentage of shares held by the insurance companies. PFUND is defined as the percentage of shares held by the pension funds. INVES is the percentage of shares held by the investment companies. PRICE is the average of daily closing price. TRAD is defined as total trading volume divided by of trading days. VOL is measured as the standard deviation of daily close-to-close returns. SIZE is the logarithm of the market value of the firm’s equity.* denotes significance at the 10 percent level, ** denotes significance at the 5 percent level, and *** denotes significance at the 1 percent level.
Table 2. Correlation matrix
Panel A BANK INSU FUND INVES
BANK 1 INSU 0.0743 1
PFUND -0.1652*** -0.1527** 1 INVES -0.2110*** 0.1084 -0.2254*** 1
Panel B AQS RQS% AES RES% DEPTH TURN LAM PIMP
AQS 1 RQS% 0.0410 1 AES 0.2321*** 0.1901*** 1
RES% 0.8919*** 0.6607*** 0.3432*** 1 DEPTH 0.2018*** -0.3961*** 0.2347*** -0.5378*** 1 TURN -0.0871 -0.1327* -0.0418 -0.1088 0.1265* 1 LAM 0.7576*** 0.1644*** 0.7304*** 0.2089*** 0.0393 -0.0150*** 1 PIMP -0.0121 0.4624*** -0.0300 0.6409*** -0.6605*** -0.1706** 0.0692 1
Panel C AQS RQS% AES RES% DEPTH TURN LAM PIMP
INST 0.1753** 0.1001 0.1514** 0.1018 -0.1078 -0.1725** 0.1450** 0.1092 PRICE 0.5398*** -0.3059*** 0.5626*** -0.4129*** -0.3206*** 0.0580 0.4607*** -0.5426*** TRAD -0.4141* -0.3391*** -0.4006* -0.4529*** 0.4679*** 0.4203*** -0.3915*** -0.4392* RVOL 0.0367 0.0196 0.0544 0.0393 0.0144 -0.0133 0.0176 0.0399 SIZE 0.0265 -0.4213*** 0.0086 -0.6081*** 0.2046*** -0.2234*** -0.0926 -0.6239*
Panel D AQS RQS% AES RES% DEPTH TURN LAM PIMP
BANK 0.1584** 0.0836 0.1187* 0.0906 -0.0654 -0.1990*** 0.0958 0.0681 INSU 0.2523*** 0.0990 0.2260*** 0.0702 -0.1393** -0.2407*** 0.1877*** 0.0394
PFUND -0.3035*** 0.0033 -0.3037*** -0.0367 0.4073*** -0.1132 -0.3782*** -0.1422** INVES 0.0384 0.0023 0.0484 0.0002 -0.1169* 0.1109 0.1096 0.0672 PRICE 0.5398*** -0.3059*** 0.5626*** -0.4129*** -0.3206*** 0.0580 0.4607*** -0.5426*** TRAD -0.4141* -0.3391*** -0.4006* -0.4529*** 0.4679*** 0.4203*** -0.3915*** -0.4392* RVOL 0.0367 0.0196 0.0544 0.0393 0.0144 -0.0133 0.0176 0.0399 SIZE 0.0265 -0.4213*** 0.0086 -0.6081*** 0.2046*** -0.2234*** -0.0926 -0.6239*
A close examination of this table shows that there is not a strong relationship between explanatory
variables and confirms the absence of multicollinearity. Panel A shows that banks (BANK) are negatively correlated at 1% significance level with pension funds (PFUND) and investment companies (INVES). In addition, insurance companies (INSU) are inversely correlated with pension funds (PFUND). Panel B indicates that relative quoted spread (RQS) shows a strong negative correlation with depth (DEPTH) and turnover (TURN). The relative effective spread (RES) is positively correlated with relative quoted spread (RQS) and lambda (LAM). The correlation is strong. Panel C provides the correlation structure between liquidity measures, institutional ownership and control variables. As predicted by the theory, institutional ownership is positively correlated with quoted bid-ask spread. The illiquidity measures decrease if the trading volume (TRAD) is higher. Panel B shows that depth exhibits a strong negative correlation with insurance companies
International Journal of Academic Research in Accounting, Finance and Management Sciences Vol. 4 (2), pp. 58–71, © 2014 HRMARS
66
(INSU) and investment companies (INVES) and a strong positive correlation with pension funds (PFUND). The correlation matrix shows that some variables are highly correlated. For this reason, we will present in the following section the regression to examine the true relationship between the independent variables and liquidity.
5.2 Multivariate analysis
To examine the relation between institutional ownership and stock liquidity while controlling for other factors, we estimate the following regression:
ititititititit SIZERVOLTRADPRICEINSTLIQ 654310
(13)
Where itiit
i = 1, ... N and t = 1, ... T μi represents a firm-specific effect, fixed or random, νit is a standard residual term and β0, β1, β2, β3, β4,
β5, β6 are the estimated coefficients of the model. LIQ is either absolute quoted bid ask spread, relative quoted bid ask spread, absolute effective bid -ask
spread, relative effective bid -ask spread, quoted depths, turnover, or price impact. We use natural logarithms of relative spreads, quoted depths, turnover, and firm size to reduce heteroskedasticity. INST is the percentage of shares by institutional investors. From results of earlier researches, we expect the coefficient on trading volume and price to be negative, and the coefficient on return volatility to be positive.
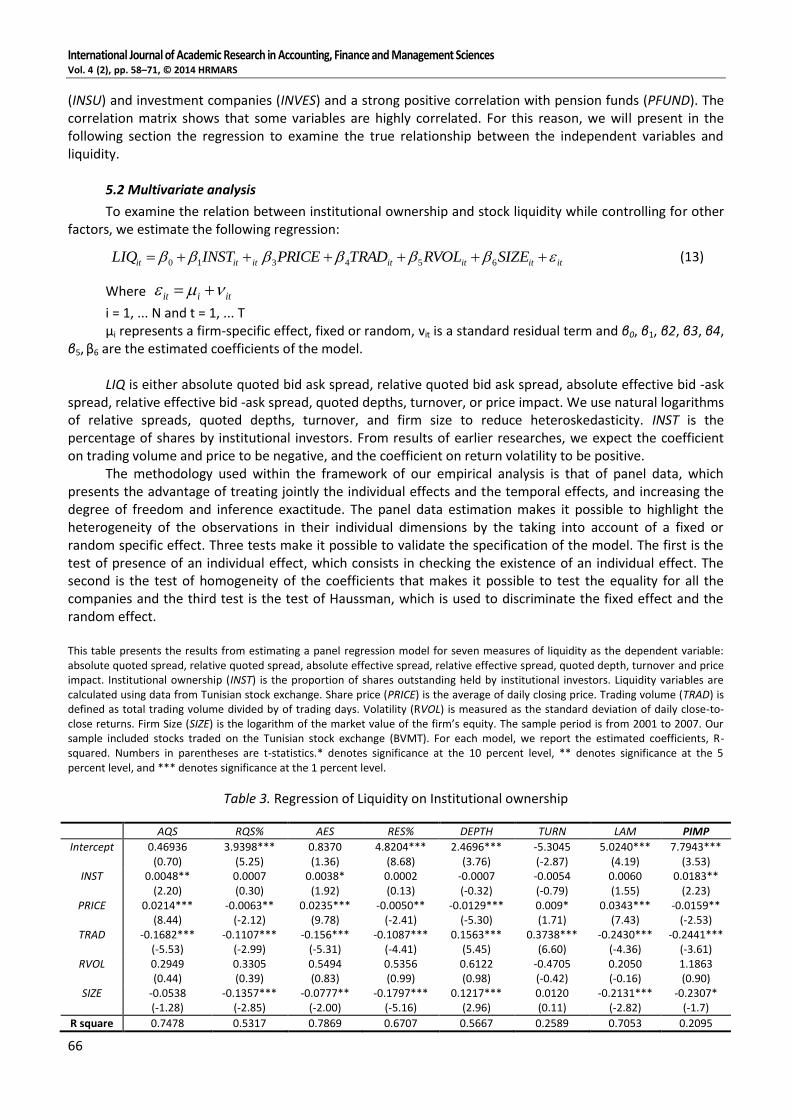
The methodology used within the framework of our empirical analysis is that of panel data, which presents the advantage of treating jointly the individual effects and the temporal effects, and increasing the degree of freedom and inference exactitude. The panel data estimation makes it possible to highlight the heterogeneity of the observations in their individual dimensions by the taking into account of a fixed or random specific effect. Three tests make it possible to validate the specification of the model. The first is the test of presence of an individual effect, which consists in checking the existence of an individual effect. The second is the test of homogeneity of the coefficients that makes it possible to test the equality for all the companies and the third test is the test of Haussman, which is used to discriminate the fixed effect and the random effect. This table presents the results from estimating a panel regression model for seven measures of liquidity as the dependent variable: absolute quoted spread, relative quoted spread, absolute effective spread, relative effective spread, quoted depth, turnover and price impact. Institutional ownership (INST) is the proportion of shares outstanding held by institutional investors. Liquidity variables are calculated using data from Tunisian stock exchange. Share price (PRICE) is the average of daily closing price. Trading volume (TRAD) is defined as total trading volume divided by of trading days. Volatility (RVOL) is measured as the standard deviation of daily close-to-close returns. Firm Size (SIZE) is the logarithm of the market value of the firm’s equity. The sample period is from 2001 to 2007. Our sample included stocks traded on the Tunisian stock exchange (BVMT). For each model, we report the estimated coefficients, R-squared. Numbers in parentheses are t-statistics.* denotes significance at the 10 percent level, ** denotes significance at the 5 percent level, and *** denotes significance at the 1 percent level.
Table 3. Regression of Liquidity on Institutional ownership
AQS RQS% AES RES% DEPTH TURN LAM PIMP
Intercept 0.46936 (0.70)
3.9398*** (5.25)
0.8370 (1.36)
4.8204*** (8.68)
2.4696*** (3.76)
-5.3045 (-2.87)
5.0240*** (4.19)
7.7943*** (3.53)
INST 0.0048** (2.20)
0.0007 (0.30)
0.0038* (1.92)
0.0002 (0.13)
-0.0007 (-0.32)
-0.0054 (-0.79)
0.0060 (1.55)
0.0183** (2.23)
PRICE 0.0214*** (8.44)
-0.0063** (-2.12)
0.0235*** (9.78)
-0.0050** (-2.41)
-0.0129*** (-5.30)
0.009* (1.71)
0.0343*** (7.43)
-0.0159** (-2.53)
TRAD -0.1682*** (-5.53)
-0.1107*** (-2.99)
-0.156*** (-5.31)
-0.1087*** (-4.41)
0.1563*** (5.45)
0.3738*** (6.60)
-0.2430*** (-4.36)
-0.2441*** (-3.61)
RVOL 0.2949 (0.44)
0.3305 (0.39)
0.5494 (0.83)
0.5356 (0.99)
0.6122 (0.98)
-0.4705 (-0.42)
0.2050 (-0.16)
1.1863 (0.90)
SIZE -0.0538 (-1.28)
-0.1357*** (-2.85)
-0.0777** (-2.00)
-0.1797*** (-5.16)
0.1217*** (2.96)
0.0120 (0.11)
-0.2131*** (-2.82)
-0.2307* (-1.7)
R square 0.7478 0.5317 0.7869 0.6707 0.5667 0.2589 0.7053 0.2095

International Journal of Academic Research in Accounting, Finance and Management Sciences Vol. 4 (2), pp. 58–71, © 2014 HRMARS
67
The multivariate regression analysis contains some regression models, each with different liquidity
measures as a dependent variable, and institutional ownership and control variables as independent variables. Table 3 present the regressions results for absolute quoted spread, relative quoted spread, absolute effective spread, relative effective spread, lambda, quoted depth, turnover and Amihud (2002) illiquidity ratio (price impact). Institutional ownership illustrates a positive impact on absolute quoted spread and absolute effective spread. A 10% increase in institutional ownership leads to a 0.048% increase in absolute quoted spread and a 0.038% increase in absolute effective spread. This result is consistent with our univariate result in table 3. The institutional ownership coefficients for relative quoted spread and relative effective spread are positive but not significant. Our result is not consistent with the findings of Rubin (2007). The institutional ownership coefficient for Amihud (2002) illiquidity ratio (0.0237) is positive and significant, suggesting that institutional ownership decreases the market liquidity. Thus, institutions generally have greater resources than individual investors do to allocate towards gathering and analyzing information about a firm. Furthermore, economies of scale and professional expertise give institutional investors lower marginal costs in producing and processing information, and thus are better informed than other investors. Their information advantage can therefore affect liquidity. These factors explain the negative relation between institutional ownership and liquidity.
For the control variables included in all the regression models (except for return volatility variable), the estimated coefficients are significant and mostly consistent with the expected sign in line with previous studies. We find negative and statistically significant effects of the stock price (PRICE) and trading volume (TRAD) on the bid-ask spread. The estimated coefficients of the stock price (PRICE) and trading volume (TRAD) are statistically significant at 1 percent level. These empirical results are consistent with the theoretical predictions of Stoll (1978), and the empirical evidence reported in Sarin et al. (2000), Heflin and Shaw (2000), Attig, Gadhoum and Lang (2003), and Rubin (2007) but are contrary to the evidence documented in Comerton-Forde and Rydge (2006) study. We find a positive relation between the spread and the return volatility (RVOL). The coefficient for this variable is not significant in any of the estimated regression. Firm size is associated with lower spread, greater depth, and lower price impact. These results are consistent with the theory and previous studies of liquidity determinants.
Previous studies on the impact of institutional ownership treat institutions as homogenous investors with the same reporting. However, the effect of institutional ownership on the stock liquidity varies across the different types of institution. In this section, we investigate the effects of institutional ownership variables on stock liquidity by including the percentage of shares held by each of the four categories. We use the following pooled cross-sectional time series model:
ititit
ititititit
SIZERVOL
TRADPRICEINVESPFUNDINSUBANKLIQ
87
6543210 (14)
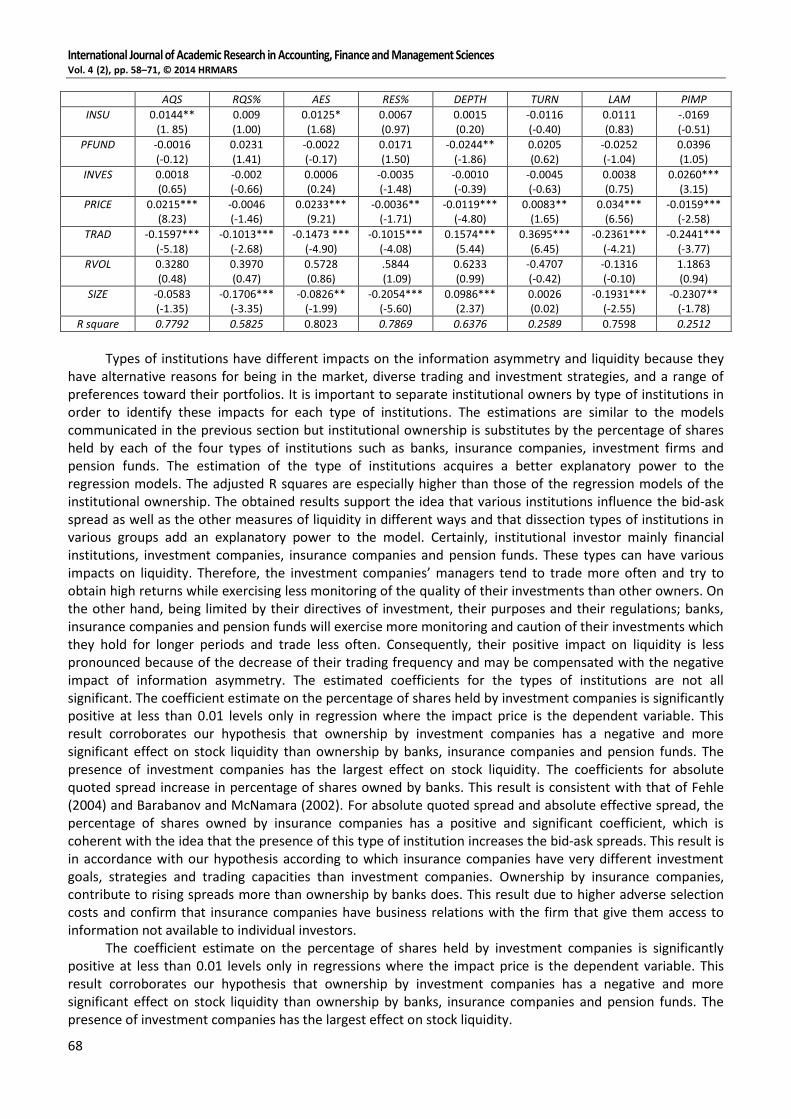
This table presents the results from estimating a panel regression model for some measures of liquidity as the dependent variable: absolute quoted spread, relative quoted spread, absolute effective spread, relative effective spread, quoted depth, turnover, lambda and price impact. BANK is defined as the fraction of total shares outstanding held by the banks. INSU is the percentage of shares held by the insurance companies. PFUND is defined as the percentage of shares held by the pension funds. INVES is the percentage of shares held by the investment companies. Liquidity variables are calculated using data from Tunisian stock exchange. Share price (PRICE) is the average of daily closing price. Trading volume (TRAD) is defined as total trading volume divided by of trading days. Volatility (RVOL) is measured as the standard deviation of daily close-to-close returns. Firm Size (SIZE) is the logarithm of the market value of the firm’s equity. The sample period is from 2001 to 2007. Our sample included stocks traded on the Tunisian stock exchange (BVMT). For each model, we report the estimated coefficients, R-squared. Numbers in parentheses are t-statistics.* denotes significance at the 10 percent level, ** denotes significance at the 5 percent level, and *** denotes significance at the 1 percent level.
Table 4. Regression of Liquidity on Type of Institution
AQS RQS% AES RES% DEPTH TURN LAM PIMP
Intercept 0.4925 (0.73)
4.4223*** (5.25)
0.8776 (1.35)
5.1789*** (8.92)
2.8170*** (4.28)
-5.0140*** (-2.64)
4.6715*** (3.95)
7.9023*** (3.63)
BANK 0.0053** (1.94)
0.0026 (0.85)
0.0040* (1.65)
0.0024 (1.00)
-0.0002 (-0.09)
-0.0157 (-1.11)
0.0055 (1.18)
-.0189 (-1.16)
International Journal of Academic Research in Accounting, Finance and Management Sciences Vol. 4 (2), pp. 58–71, © 2014 HRMARS
68
AQS RQS% AES RES% DEPTH TURN LAM PIMP
INSU 0.0144** (1. 85)
0.009 (1.00)
0.0125* (1.68)
0.0067 (0.97)
0.0015 (0.20)
-0.0116 (-0.40)
0.0111 (0.83)
-.0169 (-0.51)
PFUND -0.0016 (-0.12)
0.0231 (1.41)
-0.0022 (-0.17)
0.0171 (1.50)
-0.0244** (-1.86)
0.0205 (0.62)
-0.0252 (-1.04)
0.0396 (1.05)
INVES 0.0018 (0.65)
-0.002 (-0.66)
0.0006 (0.24)
-0.0035 (-1.48)
-0.0010 (-0.39)
-0.0045 (-0.63)
0.0038 (0.75)
0.0260*** (3.15)
PRICE 0.0215*** (8.23)
-0.0046 (-1.46)
0.0233*** (9.21)
-0.0036** (-1.71)
-0.0119*** (-4.80)
0.0083** (1.65)
0.034*** (6.56)
-0.0159*** (-2.58)
TRAD -0.1597*** (-5.18)
-0.1013*** (-2.68)
-0.1473 *** (-4.90)
-0.1015*** (-4.08)
0.1574*** (5.44)
0.3695*** (6.45)
-0.2361*** (-4.21)
-0.2441*** (-3.77)
RVOL 0.3280 (0.48)
0.3970 (0.47)
0.5728 (0.86)
.5844 (1.09)
0.6233 (0.99)
-0.4707 (-0.42)
-0.1316 (-0.10)
1.1863 (0.94)
SIZE -0.0583 (-1.35)
-0.1706*** (-3.35)
-0.0826** (-1.99)
-0.2054*** (-5.60)
0.0986*** (2.37)
0.0026 (0.02)
-0.1931*** (-2.55)
-0.2307** (-1.78)
R square 0.7792 0.5825 0.8023 0.7869 0.6376 0.2589 0.7598 0.2512
Types of institutions have different impacts on the information asymmetry and liquidity because they
have alternative reasons for being in the market, diverse trading and investment strategies, and a range of preferences toward their portfolios. It is important to separate institutional owners by type of institutions in order to identify these impacts for each type of institutions. The estimations are similar to the models communicated in the previous section but institutional ownership is substitutes by the percentage of shares held by each of the four types of institutions such as banks, insurance companies, investment firms and pension funds. The estimation of the type of institutions acquires a better explanatory power to the regression models. The adjusted R squares are especially higher than those of the regression models of the institutional ownership. The obtained results support the idea that various institutions influence the bid-ask spread as well as the other measures of liquidity in different ways and that dissection types of institutions in various groups add an explanatory power to the model. Certainly, institutional investor mainly financial institutions, investment companies, insurance companies and pension funds. These types can have various impacts on liquidity. Therefore, the investment companies’ managers tend to trade more often and try to obtain high returns while exercising less monitoring of the quality of their investments than other owners. On the other hand, being limited by their directives of investment, their purposes and their regulations; banks, insurance companies and pension funds will exercise more monitoring and caution of their investments which they hold for longer periods and trade less often. Consequently, their positive impact on liquidity is less pronounced because of the decrease of their trading frequency and may be compensated with the negative impact of information asymmetry. The estimated coefficients for the types of institutions are not all significant. The coefficient estimate on the percentage of shares held by investment companies is significantly positive at less than 0.01 levels only in regression where the impact price is the dependent variable. This result corroborates our hypothesis that ownership by investment companies has a negative and more significant effect on stock liquidity than ownership by banks, insurance companies and pension funds. The presence of investment companies has the largest effect on stock liquidity. The coefficients for absolute quoted spread increase in percentage of shares owned by banks. This result is consistent with that of Fehle (2004) and Barabanov and McNamara (2002). For absolute quoted spread and absolute effective spread, the percentage of shares owned by insurance companies has a positive and significant coefficient, which is coherent with the idea that the presence of this type of institution increases the bid-ask spreads. This result is in accordance with our hypothesis according to which insurance companies have very different investment goals, strategies and trading capacities than investment companies. Ownership by insurance companies, contribute to rising spreads more than ownership by banks does. This result due to higher adverse selection costs and confirm that insurance companies have business relations with the firm that give them access to information not available to individual investors.
The coefficient estimate on the percentage of shares held by investment companies is significantly positive at less than 0.01 levels only in regressions where the impact price is the dependent variable. This result corroborates our hypothesis that ownership by investment companies has a negative and more significant effect on stock liquidity than ownership by banks, insurance companies and pension funds. The presence of investment companies has the largest effect on stock liquidity.

International Journal of Academic Research in Accounting, Finance and Management Sciences Vol. 4 (2), pp. 58–71, © 2014 HRMARS
69
For quoted depth, the estimated coefficient of ownership of pension funds is negative and statistically significant. This result is coherent with our hypothesis that this type of institution reduces stock liquidity.
Most of our control variables are significant and maintain their signs. There is a significant positive correlation between the absolute spreads and the stock price. We also find that there is a significant negative correlation between the spreads and the trading volume and a significant positive relation between the depth and the trading volume, as well as between the turnover and the trading volume. In addition, there is a significant positive relationship between the firm’s size and the depth, and a negative relationship between the firm’s size and various spreads. These results are consistent with theory and empirical evidence
(Attig et al. 2006; Belkhir and Bouri, 2008; Brockman et al. 2009).
6. Conclusions
This paper is an analysis of institutional ownership effect on stock liquidity. We collect trading data, liquidity data and ownership structure data about the 30 most actively traded companies in the Tunisian stock market during the period 2001-2007. The singularity of this study lies in adding depth, lambda, turnover ratio and Amihud (2002) illiquidity ratio to our analysis as an additional proxy for liquidity. This innovation follows prior researches that argue that these measures may be higher measures of liquidity. Our study is of interest since it is the first paper that tries to discuss how institutional ownership influence stock liquidity. The results show that absolute quoted spread and absolute effective spread increase institutional ownership. We also find that institutional ownership coefficient for Amihud (2002) illiquidity ratio is positive and significant. Our test results are consistent with the idea that institutional ownership decreases market liquidity. Institutional investors are distinct from other investors due to their information advantage. By examining the effect of different types of institutions on stock liquidity, we find that the percentages of institutional ownership by each group are positively related to absolute bid-ask spreads. Ownership by insurance companies, contributes to rising spreads more than ownership by banks does. Ownership by investment companies has a significantly stronger impact on Amihud (2002) illiquidity ratio than banks and insurance companies do.
Our study is subject to some limitations. The period presented in our study is very limited; we find it interesting to extend it so as to cover the Tunisian revolution. Besides, our survey is restricted to institutional ownership, we encourage future research to use other mechanisms of corporate governance and extent this analysis and explore other emerging stock markets.
This study also corresponds to a natural starting point for some further work and suggests a future research to address the question of the effect of institutional ownership on the return volatility. An excellent way to achieve such task is to refer to the work of Zhian et al. (2013) who finds that foreign institutional ownership increases the firm-level return volatility by strengthening the positive impact of liquidity on volatility.
The results of our study are interesting both from an academic and a practical point of view. First, the study provides a contribution to the literature by enlarging the market-level database from emerging market economies. Second, these results may be helpful for the Tunisian legislator to improve the efficiency of corporate governance and the market efficiency and reduce externalities and for investors to comprehend the influence of trading practices on stock price. Third, the identification of the factors which can influence liquidity and trading activity as well as the knowledge of the various sources of transaction costs can incite the stock exchange authorities to maintain optimal regulatory policies and select efficient trading systems in response to information asymmetry.
References
1. Aitken M., Comerton-Forbe (2003). How should liquidity be measured? Pac Basin Financ J 11: 45–59. 2. Agarwal P. (2007). Institutional ownership and stock liquidity. Working Paper, Cornell University -
Johnson Graduate School of Management. 3. Agarwal et al (2009). Why do foreign investors underperform domestic investors in trading
activities? Evidence from Indonesia. J Financ Mark 12: 32–53. 4. Ali A., Durtchi C., Lev B., Trombley M. (2004). Changes in institutional ownership and subsequent
earnings announcement abnormal returns. J Account Audit Finance 19: 221–248.
International Journal of Academic Research in Accounting, Finance and Management Sciences Vol. 4 (2), pp. 58–71, © 2014 HRMARS
70
5. Amihud Y. (2002). Illiquidity and stock returns: cross section and effects. J Financ Mark 5:31–56. 6. Attig N., Fong, Lang Gadhoum Y. (2006). Effects of large shareholding on information asymmetry and
stock liquidity. J Banking Finance 30(10): 2875–2892. 7. Attig N., Gadhoum Y., Lang L.H.P. (2003). Bid-ask spread, asymmetric information and ultimate
ownership. European Financial Management Association (EFMA) Meeting, Helsinki. 8. Barabanov S., McNamara M. (2002). Market perception of information asymmetry: Concentration of
ownership by different types of institutions and bid-ask spread. SSRN working paper. 9. Belkhir N., Bouri A. (2008). Ownership Structure and Bid-Ask Spread: Evidence from Tunisian
Companies. Corp Own Contr 5(3):445–451. 10. Bennet et al (2003). Greener pastures and the impact of dynamic institutional preferences. J Financ
Econ. 11. Benston G.J., Hagerman R.L. (1974). Determinants of bid-ask Spreads in the over-the counter
market. J Financ Econ 1(4):353–364. 12. Brockman P., Chung D.Y., Yan X. (2009). Block ownership, trading activity and market liquidity. J
Financ Quant Analys 44 (6):1403–1426. 13. Bushee BJ, Goodman TH (2007). Which institutional investors trade based on private information
about earnings and returns. J Accoun Resea 45:289–321. 14. Chakravarty S. (2001). Stealth-trading: Which traders’ trades move stock prices? J Financ Econ
61(2):289–307. 15. Chiang R., Venkatesh P.C. (1988). Insider holdings and perceptions of information asymmetry. J
Finance 43:1041–1048. 16. Chung K.H., Elder J., Kim J.C. (2010). Corporate Governance and Liquidity. J Financ Quant Analy
45:265–291. 17. Datar V.T., Naik N.Y., Radcliffe R. (1998). Liquidity and Stock Returns: An Alternative Test. J Financ
Mark 1(2):203–219. 18. Demsetz H. (1968). The cost of transacting. Quat J Econ 20(82):33–53. 19. Demsetz H., Lehn K. (1985). The structure of corporate ownership: causes and consequences. J Polit
Econ 93:1155–1177. 20. Demsetz H. (1968). Corporate Control, Insider Trading and Rates of Return. Am Econ Rev 76:3–16. 21. Denis D.J., Denis D.K. (1994). Majority owner-managers and organizational efficiency. J Corp Finance
1:91–118. 22. Dennis P. and J. Weston (2001). Who's Informed? An Analysis of Stock Ownership and Informed
Trading », Working paper, AFA. 23. Fabozzi, F. (1979). Bid-ask spreads for over-the-counter stocks, Journal of Economics and Business,
Vol. 32, pp. 56–65. 24. Falkenstein, E. (1996). Preferences for stock characteristics as revealed by mutual fund portfolio
holdings, Journal of Finance, Vol. 51, pp. 111–136. 25. Fang V.W., Noe T.H., Tice S. (2009). Stock Market Liquidity and Firm Value. J Financ Econ 94:150–
169. 26. Fehle F. (2004). Bid-Ask Spreads and Institutional Ownership. Rev Quant Financ Accou 22:275–292. 27. Gaspar J.M., Massa M. (2007). Local Ownership as Private Information: Evidence on the Monitoring-
Liquidity Trade-Off. J Financ Econ 83(3):751–792. 28. Ginglinger E., Hamon J. (2007). Ownership, control and market liquidity. DRM-Cereg, University
Paris-Dauphin. 29. Glosten L.R., Harris L.E. (1988). Estimating the components of the bid-Ask spread, J Financ Econ
21:123–142. 30. Glosten L.R., Milgrom P.R. (1985). Bid-Ask and Transaction Prices in a specialist market with
heterogeneously informed traders. J Financ Econ 14:71–100. 31. Gosnell T., Keown J.A., Pinkerton M.J. (1992). Bankruptcy and Insider Trading: Differences between
Exchange-Listed and OTC Firms. J Finance 47:349–362. 32. Goyenko R., Holden C.W., Trzcinka C.A. (2009) Do liquidity measures measure liquidity? J Financ
Econ 92:153–181.

International Journal of Academic Research in Accounting, Finance and Management Sciences Vol. 4 (2), pp. 58–71, © 2014 HRMARS
71
33. Grinblatt M., Keloharju M. (2000). The investment behaviour and performance of various investor-types: A study of Finland’s unique data set. J Financ Econ 55:43–67.
34. Grossman S.J., Stiglitz J.E. (1980). On the impossibility of informationally efficient markets. Am Econ Rev 70(3):393–408.
35. Hamilton J.L. (1978). Marketplace organisation and marketability: NASDAQ, the stock exchange and the Nationnel Market System. J finance 33:487–503.
36. Hearn B., Piesse J. (2013). Firm level governance and institutional determinants of liquidity: Evidence from Sub Saharan Africa. Int Rev Financ Anal 28:93‒111.
37. Heflin F., Shaw W.K. (2000). Blockholder Ownership and Market Liquidity. J Financ Quant Analy 35:621–633.
38. Holmström B., Tirole J. (1993). Market liquidity and performance monitoring. J Polit Econ 101(4):678–709.
39. Jacoby G., Zheng S. (2010). Dispersion ownership and market liquidity. Inter Rev Financ Analy 19:81–88.
40. Jennings W., Schnatterly K., Seguin P. (2002). Institutional ownership, information and liquidity. Innov in Inves Corp Finance 7:41–71.
41. Kahn C., Winton A. (1998). Ownership structure, speculation and shareholder intervention. J Finance 53:99–130.
42. Keim D.B., Madhaven A. (1995). The Upstairs Market for Large-Block Transactions: Analysis and Measurement of Price Effects. Rev Financ Stu 9(1):1–36.
43. Kini O., Mian S. (1995). Bid-ask spread and ownership structure. J Financ Rese 58:401–414. 44. Kothare M., Laux P. (1995). Trading costs and the trading systems for NASDAQ stocks. Financ Analy
J:42–53. 45. Lakonishok J., Shleifer A., Vishny R.W. (1992). The impact of institutional trading on stock price. J
Financ Econ 32:23–42. 46. Lam K., Tam L. (2011). Liquidity and asset pricing: Evidence from the Hong Kong stock market. J Bank
Finance 35(9). 47. Lin J., Sanger G., Booth G. (1995). Trade size and components of the bid-ask spread. Rev Financ Stud
8(4):1153–1183. 48. Maug E. (1998). Large shareholders as monitors: Is there a trade-off between liquidity and control? J
Finance 53:65–98. 49. Merton R. (1987). A simple model of capital market equilibrium with incomplete information. J
Finance 42(3):483–510. 50. Naes R. (2004). Ownership Structure and Stock Market Liquidity. Working Paper, Norges Bank 28. 51. Rhee S.G., Wang J. (2009). Foreign institutional ownership and stock market liquidity: Evidence from
Indonesia. J Bank Finance. 33(7):1312–1324. 52. Rubin A. (2007). Ownership level, ownership concentration and liquidity. J Financ Mark 10(3):219–
248. 53. Sarin A., Shastri K.A., Shastri K. (2000). Ownership structure and stock market liquidity. Working
Paper, Santa Clara University. 54. Seasholes M.S. (2004). Re-examining information asymmetries in emerging stock Markets. Working
Paper, University of California- Berkeley. 55. Stoll, Hans R. (1978). The Pricing of security dealer services: an Empirical study of NASDAQ stocks. J
finance 33(4):1153–1173. 56. Tinic S.M. (1972). The economics of liquidity services. Q J econ 86: 97–93. 57. Zhian C., Jinmin D., Donghui L., Rui O. (2013). Does foreign institutional ownership increase return
volatility? Evidence from China. J bank finance 37(2): 660–669.