corporate governance, profitability and bank
TRANSCRIPT
International Journal of Research and Innovation in Social Science (IJRISS) |Volume IV, Issue III, March 2020|ISSN 2454-6186
www.rsisinternational.org Page 240
Corporate Governance, Profitability and Bank
Capitalization Strategies: A Case of Banking Sector
in Pakistan Zahra Jamil
1, Zain Saeed Qureshi
2
1,2M Phil Scholar, Department of Commerce, Bahauddin Zakariya University Multan, Pakistan
Abstract: The purpose of this study is to search out the
association between the corporate governance, profitability and
capitalization strategies of domestic financial sample of
institution in Pakistan.
This study finds out the relationship between the corporate
governance, profitability and capitalization strategies of financial
institution in Pakistan. To evaluate results, data is collected from
financial statement of schedule banks listed in Pakistan stock
exchange. Data is collected from2006- 2018.This study find that
corporate governance mechanism which favors the banks
shareholder interest as associated with low capitalization
strategies. A governance mechanism having the board
independence, intermediate board size and CEO duality is
considered share holder friendly corporate governance. Board
size negatively affect the financial institutions capitalization.
Effective board size is also negatively associated with financial
institutions capitalization strategies. Corporate governance shift
risk from shareholder of banks to debt holder. Low
capitalization is favorable to the shareholder. This negative
association represents that corporate governance is positively
associated with banking sector instability. Corporate governance
having disadvantage by increasing the risk of bank. This
disadvantage is compensating with benefit that good governance
that underperformance of the management has been restricted.
CEO compensation negative associated with bank capitalization
strategies. Higher risk taking is cases of low capitalization
increased compensation of the CEO. Corporate governance code
2012 suggest that the chair of the board and CEO must be
different person. Chairman of the board must be nonexecutive
director and its role in the board leadership.
The profitability measures show the significant and positive
relationship with the capitalization strategies. Some how the
some of the capitalization strategies shows the negative and
insignificant relationship with the profitability.
Payout decision mean distribution of residual earing to the
owner of the financial institution. Payout is very critical in case
of income shocks. Corporate governance negatively associated
with payout polices of financial institutions. Financial institutions
scale back dividend in case of negative income shock.
Consequently, it’s concluded that good corporate governance
favors the shareholder interest by decreasing capitalization
strategies and aggressive payout of financial institutions has been
restricted.
Keywords:- Bank capital, corporate governance, dividend
payouts, profitability, executive compensation
I. INTRODUCTION
1.1 Back ground of the study:
The financial sector of every country is life blood of economy.
The modern trades and commerce get finance from these
financial institutions. The strength of financial institution
signifies the strength of economy (Hussain & Bhatti,
2010).The financial sector, possesses insufficient capital that
defines the chances of occurs failure (bankruptcy) of the
financial institutions according to Demirguc-Kunt, Huizinga,
& Ma, 2016).
According to national income upsurge, motivated people to
make savings and deposits. When boost the economic growth
organizations to acquire and oversee more money effectively
facilitate financial sectors. So as compared to market oriented
financial system rather than more high effects on growth of
banks oriented in financial system. Fase and Abma (2003);
(Tadesse, 2002). The economic growth all over the financial
institutions development is very crucial. (Andersen & Tarp,
2003).
When insufficient capital in financial institution chances of
occurs failure (bankruptcy) of the financial institutions.
Therefore, to finds out the reason of failure in financial sector
with the capitalization strategies. However, the financial
institutions used two (capitalization strategies) methods. First
of all, financial sector describes the amount of capital, shows
financial sector then business is going in daily situation. And
as a result, positive and covey good impact on the function
and progress of stock market, so high capitalization most
important thing at time of financial crises.
1.2 Study objective:
study purpose is the financial institutions regulators like rules
and regulations and all activities and central bank
emphasizes on the requirement of the corporate governance
mechanism in financial institution because poor governance
enhances, chances of financial crises (Blinder, 2010;
Committee, 2010; Kirkpatrick, 2009). The study mainly
consisted on the governance four widely used mechanism that
are bored size and board independence in addition to CEO
compensation or the board size effectiveness and also focuses
on the profitability of the banks i.e. ROA and ROE with the

International Journal of Research and Innovation in Social Science (IJRISS) |Volume IV, Issue III, March 2020|ISSN 2454-6186
www.rsisinternational.org Page 241
capitalization strategies. this study objective is to determine
that the shareholders how much effected by the governance
mechanism and also how profitability effected on the
strategies of the capitalization in Pakistan.
1. In what ways, the board size influence on the
strategies of the capitalization (banks) in Pakistan.
2. In what ways, the board independence impact on the
strategies of the capitalization (banks) in Pakistan.
3. In what ways, the board size, effectiveness impact on
the strategies of the capitalization (banks) in
Pakistan.
4. In what ways, the CEO‟s and Chairman impact on
the strategies of the capitalization (banks) in
Pakistan.
5. In what ways, the executive compensation scheme‟s
impact on the strategies of the capitalization (banks)
in Pakistan.
6. Implications of the executive compensation scheme
and corporate governance on bank payout policies.
7. How profitability measures, impact on the bank
capitalization strategies in Pakistan
1.3 Problem statement:
The currently study, on profitability and corporate governance
mechanism in banks, with capitalization strategies generally
focuses on two major issues.
1. In what way the governance effect on risk taking ex-
ante bank.
2. Bank impartiality proceeding by the corporate
governance implications during crises.
3. How profitability measures influence on the bank
capitalization strategies.
Firstly problem address by the Pathan (2009) discuss about
the board size and bank risk relationship, in USA during 1997
to 2004 period and 212 bank holding corporations taken as
sample.
In other hand one issue is account that more shareholding
CEO and externally director adversely associated with banks
failure prospect for the period of 2007 to 2010, ( J. Berger and
Milkman 2012). Ellul and Yerramilli (2013), try to find and
more focus on the association between the control of risk and
under banking sector performance. During the work and task
achieving Indicates that the performance increases.
1.4 Research Gap:
The research gap of my study is the corporate governance
mechanism association with the strategies of capitalization in
Pakistan. Also considered the profitability measure with
capitalization strategies. The generous studies are conducted
on the corporate governance in financial institutions in
Pakistan i.e. ( Burki & Ahmad, 2010). The profitability
measures in what ways it impacted with governance. The
governance mechanism with conventional and Islamic
banking. ( Halkias, Awan & Ahmed, 2013). The ownership
structure and financial liberalization of the finacail sector ( Di
Patti and Hardy, 2012, Javid and Iqbal, 2010). Capital
structure (Ahmed Sheik & wang 2012) but still no one
touched or considered the corporate governance, profitability
and bank capitalization strategies in Pakistan.
1.5 Significance of the study:
This research gives addition to the current study literature.
The study investigates the profitability, corporate governance,
and capitalization strategies decision of financial sector in
Pakistan. The study describes how they influences on the
financial sector comprise the risk-taking behavior with low
capital). On the other hand, the profitability relationship with
bank capitalization strategies also be explained in terms of
empirical results. The sample period of our study is 2006-
2018 also added to prior study literature of corporate
governance, profitability and bank capitalization. This study
helps to determine the relationship of executive compensation
schemes by the complementary mechanism analysis of
corporate governance, profitability measures (ROA, ROE) on
bank capitalization operations in Pakistan. The research
provides to current literature on corporate governance and the
policies (payout) of the financial institution.
II. LITERATURE REVIEW
2.1 Corporate governance:
Basic definition, Dr. sir Adrian Cadbury the chairman of the
committee. Report published in 1992 under the title of “the
financial Aspect of corporate governance” related this
committee.
According to the Cadbury (1992), “Corporate governance is
the system that manages and control the organizations. Boards
of directors are liable to control and manage the mechanism of
the governance in the institutions. The agency theory is the
base of firm‟s theory, detailed its concepts by the economist
Adam Smith (1976) writes the theory agency in this they talk
about the persons manages their money beneficiary or not.
Many of the authors describes, the agent expecting the
formula to guide the beneficial decisions & for those who give
to take decision permission.
2.2 Corporate governance and bank regulation:
The function of financial institutions in impacting the progress
of governance mechanism, (principles), that are became an
important regulatory issue that has received a little bit
attention.
The major reasons of the bank activities restricted and the link
of banking trade. The number one issue when any bank
concerned with activities of underwriting, real estate
investment and insurance (John et al., 1994, and Saunders,
1985). The number two extent that the moral hazard
motivated to riskier behavior, banks will have many ways to
increases the level of risk if give permission to relate with the
wider boarder limit of activities (Boyd et al., 1998).). The
particular features that rise to governance mechanism were

International Journal of Research and Innovation in Social Science (IJRISS) |Volume IV, Issue III, March 2020|ISSN 2454-6186
www.rsisinternational.org Page 242
different from the non-financial firms. First one is financiala
leverage and it is 90% possess by the financial institutions.
(Berger 7 Bouwmam, 2013; De-Angelo & Stulz, 2015; Esty,
1997, 1998; Hopt, 2013, Macy & o‟Hara, 2003). The main
capital was provided by the depositors and definitely by the
debt holders to financial firms. According to ornall and
Strebulaev (2014) the percentage lies between the 87 to 95 of
the financial sectors whereas non-financial leverage ratio
between the 20 to 30 %. The chance of the failure increases
for the financial sector.
So, it is concluded that regulatory plays a very vital role in
maintaining the rules and standards. In order to establish the
management practices in banks, more reliable, efficient and
accountable.
2.3 Board Size:
The board size consists of how many boards of directors were
in the board. The larger board size easily solved the agency
problem because every director possesses different knowledge
so this helpful for the financial sector. (Haji, 2013). Esa and
Ghazali, 2012 sates their study on the Malaysian background.
The sample period 2005-2007. The results show that
corporate governance increases the social responsibility and
the size of the board increases than efficiency was reduced,
giving the more powers to CEO so they control over the
organization.
H1 The larger size of board may be associated to the higher or
lower banking capitalization, while the intermediate board
size is associated to the lowest banking capitalization.
2.4 CEO chairman Separation:
According to the structure of tier 2 the CEO and chairmanship
running by the same person. Fama and Jensen in (1983),
discussed and gives the justification about them first. They
disclosed and proposed the management decision and giving
free hand to compile and execute companies‟ expensive
proposal by monitoring their activities.
If the control of management decision and administrative
authorities doing by the same person than it is very difficult
for him or her to stay with same kind of positive attitude in
order to manages the company affairs. The CEO delegates
their power of authority by not giving permission to the board
of supervisory authority to take decision So, the control of
CEO is not permit by the board.
2.5 Board Independence:
The board of independence is usually considered as the
internal corporate mechanism the shareholders is the
representations in order to oversee the operations and to
support or protect to the interest of the firms. Daily et.,
al.2003;Hermalin and Wiesbach 2003, the number researcher
using the agency theory and their dependency on resource for
this many approaches applied to examine association between
board independence and firm performance.. According to the
Armstrong et al., 2012, suggest that the small and low board
with concern with hire compensation schemes. Li et al (2010)
evaluates the influence of mechanism of the governance with
related to the listed firms. Its results indicate that the effective
directors exert the negative effects. Jiang and Kim (2015).
The bank has the opportunity to choose the corporate
governance and value of the discretion along with the
regulatory framework of every country. It reflects the mixture
of the national legal requirement.
H2 banks with more independent boards and with boards not
chaired by the CEO have lower capitalization.
2.6 CEO Compensation:
The international sample of banks provides the information on
CEO total compensation annually, share ownership and the
fair value of options given to the CEO, and this information
on the Vega and delta bases for the sample banks of US. The
board added value to the firms by performing two special
roles. Number one they provide the strategic awareness in
areas, where the management is not possesses the expertise.
The independent directors maintaining the better association
with external environment. Sarkar and Sarkar,
2009).Furthermore, bank capitalization, we noticed how
mechanism of corporate governance and CEO compensation
different from the bank leaning to linger to establish the
payout policies regard with shareholder banks in the system of
repurchases share and dividends after experiencing it suffers
from the negative income shock. This one is the risky strategy
that results to increases in the banking distress. The payout
policies may treat as the shareholder interest as it pointed to
the lower bank capitalization. Therefore, we postulate the
hypothesis that is given below.
H3 while the association among executive compensation and
bank capitalization may be unclear, higher risk incentives
entrenched in executive compensation should be negatively
associated with bank capitalization.
2.7 Corporate Governance and the Payout Policies:
DeAngelo in 2006, defines the optimal policies that
prerequisite and allocate firm‟s for free cash flow. According
to him the life cycle, theory is the combination of the
Jensen(1986) agency theory.. the payout policies in banking
sector, whenever the bank faces the adverse situation. These
are related to the decision of the managers that refer to the
institution‟s earning whether how much it is distributed
among the stockholder in the form of dividend (Okafor and
Mgbame 2011).
H4 corporate governance and executive compensation that are
associated with lower bank capitalization are also associated
with continued payouts to shareholders subsequent to major
negative income shocks.
2.8 Bank capitalization and profitability:
The relationship of the profitability and banking capital has
been examined by the number of researchers. According to
Ozili (2017), describes that regulatory framework of the bank

International Journal of Research and Innovation in Social Science (IJRISS) |Volume IV, Issue III, March 2020|ISSN 2454-6186
www.rsisinternational.org Page 243
capital has a positive influenced on the financial sector.
Berger and Bouman (2013), suggested that banking
capitalization impact on financial performance of the banks so
it will unable to survive.
Lee and Hsieh (2013) describes the profitability and bank
positively associated in Asian countries. Barth, Caprio, and
Levine (2008) and Berger and Bouwman (2013) make an
argue about the influence of capital on bank profitability is not
clear yet. Based on the above statements we hypothesized:
H5: bank capitalization strategies had the positive and
significant relationship on profitability (performance) of the
bank‟s (Return on Asset, Return on Equity).
III. RESEARCH METHODOLOGY
The population of my study is Financial institutions of
Pakistan and 20 listed banks of the Pakistan Stock Exchange
(PSX).The aim of this research is to examine the relationship
between the governance mechanism, executive compensation
and profitability of the banking sector on the payout and
capitalization strategies in Pakistan. The size of the sample
consists of the listed financial banks in Pakistan stock
exchange. The Islamic and conventional bank both were
taken. The data were collected from the period 2006 to 2018
of listed bank of financial institutions in Pakistan. The 34
banks in total that are listed on the Pakistan stock exchange.
The data were collected from the published reports yearly by
these banks. The sample of 20 banks was used in this study.
the remaining anomalies were omitted due to data breach or
its operating period started after the 2006, due to not upload
the latest year annual report of banks and some of them are
now amalgamated into another bank.
CAPit= α+β1 BIit-1 +β2 CDit-1+β3 BSit-1+β4 BSEit-1+β5 LogAit-
1+β6 ROAit-1+β7 OSit-1 +εit
TIER = α+β1 BIit-1 +β2 CDit-1+β3 BSit-1+β4 BSEit-1+β5 LogAit-
1+β6 ROAit-1+β7 OSit-1 +εit______1
TC= α+β1 BIit-1 +β2 CDit-1+β3 BSit-1+β4 BSEit-1+β5 LogAit-1+β6
ROAit-1+β7 OSit-1 +εit_________2
CER= α+β1 BIit-1 +β2 CDit-1+β3 BSit-1+β4 BSEit-1+β5 LogAit-1+β6
ROAit-1+β7 OSit-1 +εit________3
TCR= α+β1 BIit-1 +β2 CDit-1+β3 BSit-1+β4 BSEit-1+β5 LogAit-1+β6
ROAit-1+β7 OSit-1 +εit__________4
MV= α+β1 BIit-1 +β2 CDit-1+β3 BSit-1+β4 BSEit-1+β5 LogAit-1+β6
ROAit-1+β7 OSit-1 +εit___________5
In this above equation CAP stands for (capitalization
strategies), BS board size, assets (log of assets), BI board
independence, ROA (return on assets), BSE board size
effectiveness, OS ownership concentration.
CAPit= α+ REMit-1 +β2 LogAit-1+β3 ROAit-1+β7 OSit-1 +εit
TR = α+ REMit-1 +β2 LogAit-1+β3 ROAit-1+β7 OSit-1
+εit________1
TC = α+ REMit-1 +β2 LogAit-1+β3 ROAit-1+β7 OSit-1
+εit_________2
TER = α+ REMit-1 +β2 LogAit-1+β3 ROAit-1+β7 OSit-1
+εit_________3
TCR= α+ REMit-1 +β2 LogAit-1+β3 ROAit-1+β7 OSit-1
+εit__________4
MV= α+ REMit-1 +β2 LogAit-1+β3 ROAit-1+β7 OSit-1
+εit_______5
Above mentioned equation CAP stands for capital strategies,
Total compensation of the CEO (REM), Assets (log of assets),
ROA (Return on Asset), OS (ownership concentration).
Payout= α+β1 BIit-1 +β2 CDit-1+β3 BSit-1+β4 BSEit-1+β5
REMit+β6 ICit++εit
DIV = α+β1 BIit-1 +β2 CDit-1+β3 BSit-1+β4 BSEit-1+β5 REMit+β6
ICit++εit______1
DR = α+β1 BIit-1 +β2 CDit-1+β3 BSit-1+β4 BSEit-1+β5 REMit+β6
ICit++εit________2
The payout means the banking decision polices to pay the
dividends, DR (dividends to total assets), DI dummy of
dividends in this case given one to those who paid the
dividend otherwise 0.
DIV= α+β1 BIit-1 +β2 CDit-1+β3 BSit-1+β4 BSEit-1+β5 REMit+β6
ICit++εit_____3
DR = α+β1 BIit-1 +β2 CDit-1+β3 BSit-1+β4 BSEit-1+β5 REMit+β6
ICit++εit________4
In that above equation is the payout policies which means is
to establish to develop the decisions in order to pay the CEO
compensation, board independence, board size, income shock
and board size effectiveness.
CAPit= α+ β1ROAit-1 β2 ROEit-1+εit
TR = α+ β1ROAit-1 β2 ROEit-1+εit ______1
TC = α+ β1ROAit-1 β2 ROEit-1+εit _______2
TER = α+ β1ROAit-1 β2 ROEit-1+εit ______3
TCR= α+ β1ROAit-1 β2 ROEit-1+εit ______4
MV= α+ β1ROAit-1 β2 ROEit-1+εit _______5
In above mentioned equation is CAP (capital strategies), it
develops to find out the impact of the profitability with the
capitalization strategies where ROA (Return on Asset) and
ROE (Return on Equity) it is widely used measures.
International Journal of Research and Innovation in Social Science (IJRISS) |Volume IV, Issue III, March 2020|ISSN 2454-6186
www.rsisinternational.org Page 244
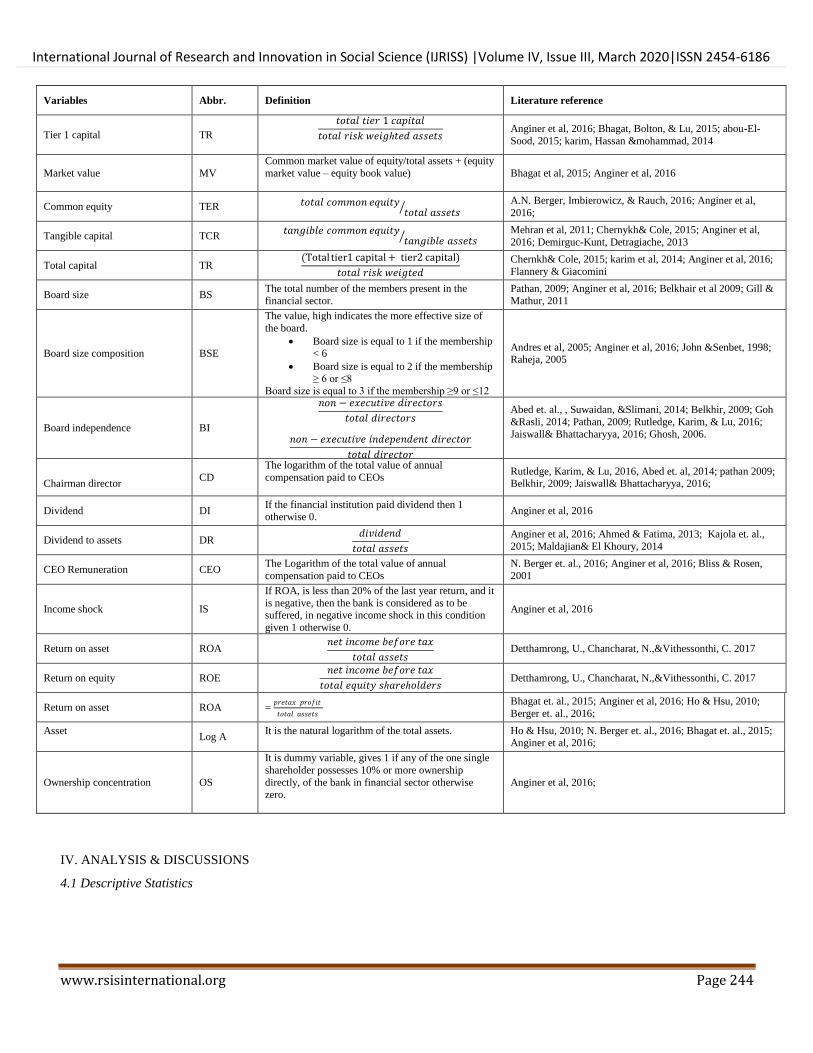
Variables Abbr. Definition Literature reference
Tier 1 capital TR
𝑡𝑜𝑡𝑎𝑙 𝑡𝑖𝑒𝑟 1 𝑐𝑎𝑝𝑖𝑡𝑎𝑙
𝑡𝑜𝑡𝑎𝑙 𝑟𝑖𝑠𝑘 𝑤𝑒𝑖𝑔ℎ𝑡𝑒𝑑 𝑎𝑠𝑠𝑒𝑡𝑠
Anginer et al, 2016; Bhagat, Bolton, & Lu, 2015; abou-El-
Sood, 2015; karim, Hassan &mohammad, 2014
Market value MV
Common market value of equity/total assets + (equity
market value – equity book value)
Bhagat et al, 2015; Anginer et al, 2016
Common equity TER 𝑡𝑜𝑡𝑎𝑙 𝑐𝑜𝑚𝑚𝑜𝑛 𝑒𝑞𝑢𝑖𝑡𝑦𝑡𝑜𝑡𝑎𝑙 𝑎𝑠𝑠𝑒𝑡𝑠
A.N. Berger, Imbierowicz, & Rauch, 2016; Anginer et al,
2016;
Tangible capital TCR 𝑡𝑎𝑛𝑔𝑖𝑏𝑙𝑒 𝑐𝑜𝑚𝑚𝑜𝑛 𝑒𝑞𝑢𝑖𝑡𝑦
𝑡𝑎𝑛𝑔𝑖𝑏𝑙𝑒 𝑎𝑠𝑠𝑒𝑡𝑠 Mehran et al, 2011; Chernykh& Cole, 2015; Anginer et al,
2016; Demirguc-Kunt, Detragiache, 2013
Total capital TR (Total tier1 capital + tier2 capital)
𝑡𝑜𝑡𝑎𝑙 𝑟𝑖𝑠𝑘 𝑤𝑒𝑖𝑔𝑡𝑒𝑑
Chernkh& Cole, 2015; karim et al, 2014; Anginer et al, 2016;
Flannery & Giacomini
Board size BS The total number of the members present in the
financial sector.
Pathan, 2009; Anginer et al, 2016; Belkhair et al 2009; Gill &
Mathur, 2011
Board size composition BSE
The value, high indicates the more effective size of
the board.
Board size is equal to 1 if the membership < 6
Board size is equal to 2 if the membership ≥ 6 or ≤8
Board size is equal to 3 if the membership ≥9 or ≤12
Andres et al, 2005; Anginer et al, 2016; John &Senbet, 1998; Raheja, 2005
Board independence BI
𝑛𝑜𝑛 − 𝑒𝑥𝑒𝑐𝑢𝑡𝑖𝑣𝑒 𝑑𝑖𝑟𝑒𝑐𝑡𝑜𝑟𝑠
𝑡𝑜𝑡𝑎𝑙 𝑑𝑖𝑟𝑒𝑐𝑡𝑜𝑟𝑠
𝑛𝑜𝑛 − 𝑒𝑥𝑒𝑐𝑢𝑡𝑖𝑣𝑒 𝑖𝑛𝑑𝑒𝑝𝑒𝑛𝑑𝑒𝑛𝑡 𝑑𝑖𝑟𝑒𝑐𝑡𝑜𝑟
𝑡𝑜𝑡𝑎𝑙 𝑑𝑖𝑟𝑒𝑐𝑡𝑜𝑟
Abed et. al., , Suwaidan, &Slimani, 2014; Belkhir, 2009; Goh
&Rasli, 2014; Pathan, 2009; Rutledge, Karim, & Lu, 2016;
Jaiswall& Bhattacharyya, 2016; Ghosh, 2006.
Chairman director
CD
The logarithm of the total value of annual
compensation paid to CEOs
Rutledge, Karim, & Lu, 2016, Abed et. al, 2014; pathan 2009; Belkhir, 2009; Jaiswall& Bhattacharyya, 2016;
Dividend DI If the financial institution paid dividend then 1 otherwise 0.
Anginer et al, 2016
Dividend to assets DR 𝑑𝑖𝑣𝑖𝑑𝑒𝑛𝑑
𝑡𝑜𝑡𝑎𝑙 𝑎𝑠𝑠𝑒𝑡𝑠
Anginer et al, 2016; Ahmed & Fatima, 2013; Kajola et. al.,
2015; Maldajian& El Khoury, 2014
CEO Remuneration CEO The Logarithm of the total value of annual
compensation paid to CEOs
N. Berger et. al., 2016; Anginer et al, 2016; Bliss & Rosen,
2001
Income shock IS
If ROA, is less than 20% of the last year return, and it
is negative, then the bank is considered as to be suffered, in negative income shock in this condition
given 1 otherwise 0.
Anginer et al, 2016
Return on asset ROA 𝑛𝑒𝑡 𝑖𝑛𝑐𝑜𝑚𝑒 𝑏𝑒𝑓𝑜𝑟𝑒 𝑡𝑎𝑥
𝑡𝑜𝑡𝑎𝑙 𝑎𝑠𝑠𝑒𝑡𝑠 Detthamrong, U., Chancharat, N.,&Vithessonthi, C. 2017
Return on equity ROE 𝑛𝑒𝑡 𝑖𝑛𝑐𝑜𝑚𝑒 𝑏𝑒𝑓𝑜𝑟𝑒 𝑡𝑎𝑥
𝑡𝑜𝑡𝑎𝑙 𝑒𝑞𝑢𝑖𝑡𝑦 𝑠ℎ𝑎𝑟𝑒ℎ𝑜𝑙𝑑𝑒𝑟𝑠 Detthamrong, U., Chancharat, N.,&Vithessonthi, C. 2017
Return on asset ROA = 𝑝𝑟𝑒𝑡𝑎𝑥 𝑝𝑟𝑜𝑓𝑖𝑡
𝑡𝑜𝑡𝑎𝑙 𝑎𝑠𝑠𝑒𝑡𝑠
Bhagat et. al., 2015; Anginer et al, 2016; Ho & Hsu, 2010;
Berger et. al., 2016;
Asset
Log A It is the natural logarithm of the total assets.
Ho & Hsu, 2010; N. Berger et. al., 2016; Bhagat et. al., 2015; Anginer et al, 2016;
Ownership concentration OS
It is dummy variable, gives 1 if any of the one single
shareholder possesses 10% or more ownership
directly, of the bank in financial sector otherwise zero.
Anginer et al, 2016;
IV. ANALYSIS & DISCUSSIONS
4.1 Descriptive Statistics

International Journal of Research and Innovation in Social Science (IJRISS) |Volume IV, Issue III, March 2020|ISSN 2454-6186
www.rsisinternational.org Page 245
Table 4.1
Variable Obs Mean Std. dev. Min Max
Market Value 260 0.1323 0.1189 0.0125 0.8351
Tangible Capital 260 0.0946 0.0964 0.0020 0.8895
Common Equity 260 0.0990 0.0845 0.0023 0.5431
Tier 1 Capital 260 0.1428 0.1121 0.0028 0.9713
Total Capital 260 0.1666 0.1015 0.0173 0.6543
board Independence 260 0.2837 0.0422 0.1538 0.3333
Board Size 260 8.65 1.5929 4 13
Board Size Effectiveness 260 2.4692 0.5152 1 3
Non- executive Directors 260 0.6153 0.2066 0 0.9167
CEO Remuneration 260 4.6454 0.4142 2.6599 5.8686
Dividends 260 0.6308 0.4835 0 1
Dividends to Assets 260 0.0113 0.0554 0 0.758
Asset 260 8.4070 0.5377 6.6047 9.6392
Return on Asset 260 0.0110 0.0269 -0.1037 0.2184
Return on Equity 260 0.1567 0.1939 -0.8792 0.5254
Ownership 260 0.55 0.4985 0 1
Income Shock 260 0.1192 0.3247 0 1
We study the influence of corporate governance and executive
compensation on five alternative indicators of bank
capitalization. Firstly, Tier 1 capital it is the regulatory capital
ratio. The tier 1 capital is divided by risk weighted assets and
both were computed on the bases of Basel rules. Tier 1 capital
comprises perpetual, non-cumulative preferred equity,
common equity and it can be considered a measure of funds to
which cumulatively added by preferred and common
shareholders that can be depleted through losses while the
banks continue as a going concern. As shown as in table 4.1,
the mean value of Tier 1 capital ratio is 14.28%. In Pakistan,
the 7.5% Tier 1 capital is required for banks. Therefore, the
mean value of Tier 1 capital in our sample is 14.28% shows
that it is greater than the require 7.5% which means that the
average Pakistan banks having additional capital to risk-
weighted assets ratios as per law requirement.
Next one is Total capital; it is the broader regulatory ratio that
constructed as sum of Tier 1 capital and Tier 2 capital divided
by risk-weighted assets. The Tier 2 capital comprises
subordinated debt, hybrid capital, loan loss reserves, and
valuation reserves. However, not only Tier 2 capital can be
considered as cushion to secure the banks from insolvency.
The average Total capital ratio is 16.66%. It shows that a
higher capital ratio is maintained by the average of banks in
Pakistan. According to law, the Total capital ratio at least
equal to 10%.
Total common equity ratio is a limited measure of bank
capitalization. It is constructed as total common equity by
total assets.it should be related to the common shareholders,
as it shows the capital that common shareholders have at
stake. Interest of the common shareholders is important for
banks management and board because they have the voting
rights. Total equity ratio mean value is 9%, which represent
the investment of common share holder in the capital of bank
and reaming capital 91 consist of other stakeholder investment
into the banks. Total equity ratio is limited measure that‟s
why we also considered the tangible equity ratio (TCR), it is
calculated as tangible capital divided by tangible assets (i.e.
total assets – non-tangible assets). Tangible capital ratio has
mean value of 9%.
Final, indicator of bank capitalization is market value, it is
formed as the ratio of market value of bank‟s common equity
to the proxy for market value of a bank‟s total assets,
calculated as the sum of total assets and the market value of
common equity subtracted the book value of common equity.
The market value average is 13.23%.
We measured the payout ratio with two variable first one is
dividend ratio i.e. dummy variable either bank pays dividend
or not. The average 63.08% of the banks paid dividend in
Pakistan. Second one is dividend to total asset ratio. The
dividend, which is returned to shareholders, as compared with
the total assets of the company. The mean value is 1.12%. The
amount of dividend is very low that are given to the
shareholder as compare to assets of the banks.

International Journal of Research and Innovation in Social Science (IJRISS) |Volume IV, Issue III, March 2020|ISSN 2454-6186
www.rsisinternational.org Page 246
Now, the corporate governance variables that are related to
board size, board size effectiveness and board independence.
To begin with the board size, I represent the number of board
members. The mean value is 8.65%, this value ranges from 4
to 13. The board size having the effect on the organization
decision making process. The board size effectiveness mean
value is 2.46% so, its value shows that the board size is
usually effective in the banking sector. Low board size does
not contest with the concentration of the shareholder nor the
high board effective. High board produce the free stipulation
problem and also results problems in decision making.
The board independence indicates the outsider percentage of
the board of directors that are present in the companies‟
board, alignment of the management moves with directors as
more outsider director more the consent of shareholders. The
corporate governance code requisite that 1/3rd
of the board
must be independent in any organization. The average of
board independence in Pakistan is 28%.
CEO compensation is the remuneration of the CEO that is
annually provided by the companies. On average in the
Pakistan every CEO granted with amount 4.64 million rupees.
The profitability measures used (ROA, ROE), the average
mean value of the ROA is 1.1% and the gross ROE ratio
average value is 15.67. that shows the influence of the
profitability on the strategies.
The control bank specific variable that has been already
introduced. The number one is the log of the assets in total,
their higher value shows the larger financial sectors. The large
institutions maintain the low level of the capitalizing policies.
The second one is return on assets so that represents that if the
banks earns high profit than the ratio of capitalization
definitely increased. The last and third one is ownership
concentration i.e. the dummy variable if any one single owner
possesses 10% ownership gives 1 otherwise 0. It is related to
low strategies of capitalization.
4.3 Correlation table
mv Tcr Ter tr tc bi bs bse rem Div dr size roa roe os inshok
mv 1
tcr 0.5593* 1
Ter 0.5844* 0.8359* 1
Tr 0.4181* 0.5579* 0.6357* 1
Tc 0.4335* 0.5475* 0.6121* 0.9538* 1
Bi 0.0684 0.0198 0.0678 0.117 0.1079 1
Bs -0.055 -0.039 -0.0984 -0.0441 -0.0193 -
0.2671* 1
Bse 0.0658 -0.0112 -0.0117 0.0612 0.0693 0.6725* 0.4973* 1
Rem -0.1115 -0.067 -0.0536 -
0.1660*
-
0.1398* -0.0028 0.02 -0.0428 1
Div 0.0093 -
0.2207*
-
0.2572*
-
0.2838*
-
0.2187* -0.1058 0.2276* 0.0472 0.1978* 1
Dr 0.2885* 0.4072* 0.0302 -0.0247 -0.0175 -0.0533 -0.098 -
0.1318* 0.1008 0.1570* 1
Size -
0.3422*
-
0.4553*
-
0.5092*
-
0.4985*
-
0.4345* -0.108 0.1940* -0.0005 0.3550* 0.6869* 0.013 1
Roa 0.2011* 0.2312* -0.0081 -0.1194 -0.0722 -
0.1364* 0.1683* -0.0282 0.1285* 0.4342* 0.4383* 0.3618* 1
Roe -0.055 -
0.1605*
-
0.2197*
-
0.1787*
-
0.1364* -0.078 0.2942* 0.0621 0.1374* 0.5274* 0.0598 0.5077* 0.6209* 1
Os -
0.1588* -0.0153 -0.0059 0.0202 0.0301 0.0259 0.117 0.0887
-
0.2655*
-
0.3236* -0.018
-
0.2324*
-
0.2269* -0.1163 1
Inshok 0.1742* 0.2952* 0.3539* 0.3641* 0.3340* 0.0957 -0.1206 0.0105 -
0.1545*
-
0.4071* -0.0355
-
0.5004*
-
0.5800*
-
0.4772* 0.1658* 1
In this table we show the pairwise correlation at 5% standard
error in parenthese. In this table there is the problem of
multicolinerity in two variable and these are my dependent
variable so that‟s why it is fine because we should not run into
one equation. Tier 1 ratio and total capital ratio has 0.95
percent. According to the (Kennedy, 1985)If the value is
higher than .08) or According to Tabachnick and Fidell,
(1996) greater than 0.9 then it will be the alarming problem.
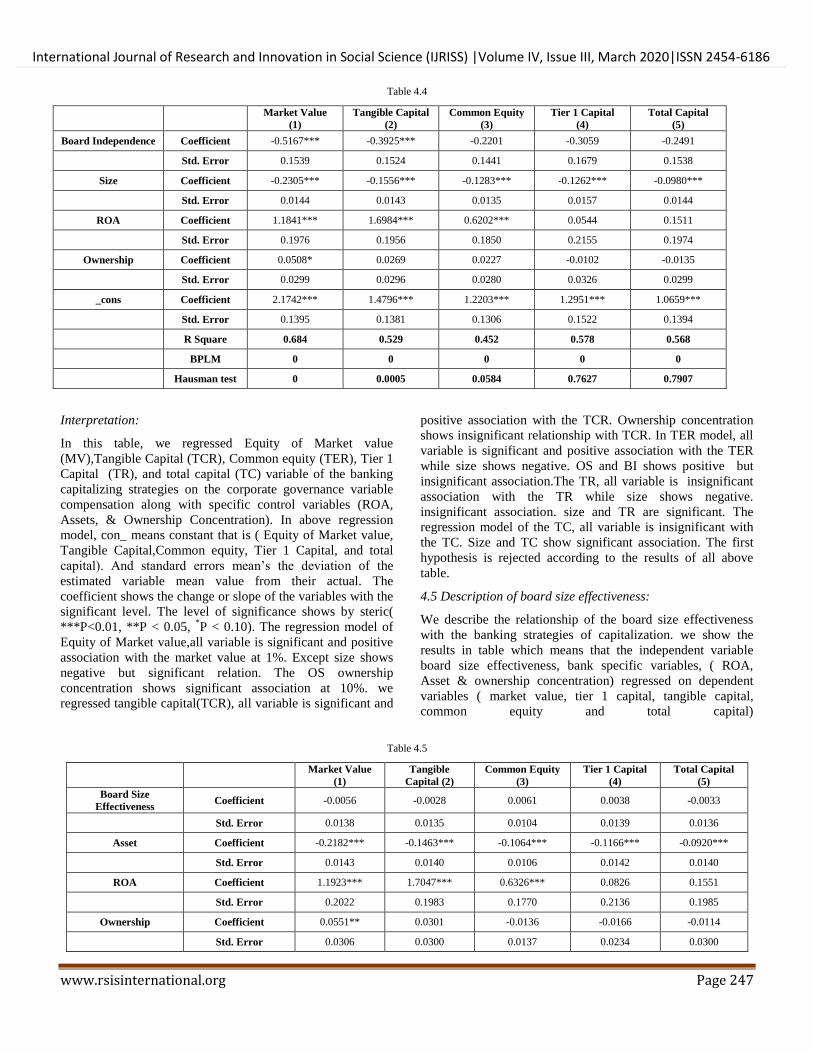
4.4 Description board Independence
We describe the relationship of the board independence with
the banking strategies of capitalization. we shows the results
in this table which means that the independent variable board
independence, bank specific variables, ( ROA, Asset &
ownership concentration) regressed on dependent variables (
market value, tier 1 capital, tangible capital, common equity
and total capital)
International Journal of Research and Innovation in Social Science (IJRISS) |Volume IV, Issue III, March 2020|ISSN 2454-6186
www.rsisinternational.org Page 247
Table 4.4
Market Value
(1)
Tangible Capital
(2)
Common Equity
(3)
Tier 1 Capital
(4)
Total Capital
(5)
Board Independence Coefficient -0.5167*** -0.3925*** -0.2201 -0.3059 -0.2491
Std. Error 0.1539 0.1524 0.1441 0.1679 0.1538
Size Coefficient -0.2305*** -0.1556*** -0.1283*** -0.1262*** -0.0980***
Std. Error 0.0144 0.0143 0.0135 0.0157 0.0144
ROA Coefficient 1.1841*** 1.6984*** 0.6202*** 0.0544 0.1511
Std. Error 0.1976 0.1956 0.1850 0.2155 0.1974
Ownership Coefficient 0.0508* 0.0269 0.0227 -0.0102 -0.0135
Std. Error 0.0299 0.0296 0.0280 0.0326 0.0299
_cons Coefficient 2.1742*** 1.4796*** 1.2203*** 1.2951*** 1.0659***
Std. Error 0.1395 0.1381 0.1306 0.1522 0.1394
R Square 0.684 0.529 0.452 0.578 0.568
BPLM 0 0 0 0 0
Hausman test 0 0.0005 0.0584 0.7627 0.7907
Interpretation:
In this table, we regressed Equity of Market value
(MV),Tangible Capital (TCR), Common equity (TER), Tier 1
Capital (TR), and total capital (TC) variable of the banking
capitalizing strategies on the corporate governance variable
compensation along with specific control variables (ROA,
Assets, & Ownership Concentration). In above regression
model, con_ means constant that is ( Equity of Market value,
Tangible Capital,Common equity, Tier 1 Capital, and total
capital). And standard errors mean‟s the deviation of the
estimated variable mean value from their actual. The
coefficient shows the change or slope of the variables with the
significant level. The level of significance shows by steric(
***P<0.01, **P < 0.05, *P < 0.10). The regression model of
Equity of Market value,all variable is significant and positive
association with the market value at 1%. Except size shows
negative but significant relation. The OS ownership
concentration shows significant association at 10%. we
regressed tangible capital(TCR), all variable is significant and
positive association with the TCR. Ownership concentration
shows insignificant relationship with TCR. In TER model, all
variable is significant and positive association with the TER
while size shows negative. OS and BI shows positive but
insignificant association.The TR, all variable is insignificant
association with the TR while size shows negative.
insignificant association. size and TR are significant. The
regression model of the TC, all variable is insignificant with
the TC. Size and TC show significant association. The first
hypothesis is rejected according to the results of all above
table.
4.5 Description of board size effectiveness:
We describe the relationship of the board size effectiveness
with the banking strategies of capitalization. we show the
results in table which means that the independent variable
board size effectiveness, bank specific variables, ( ROA,
Asset & ownership concentration) regressed on dependent
variables ( market value, tier 1 capital, tangible capital,
common equity and total capital)
Table 4.5
Market Value
(1)
Tangible
Capital (2)
Common Equity
(3)
Tier 1 Capital
(4)
Total Capital
(5)
Board Size
Effectiveness Coefficient -0.0056 -0.0028 0.0061 0.0038 -0.0033
Std. Error 0.0138 0.0135 0.0104 0.0139 0.0136
Asset Coefficient -0.2182*** -0.1463*** -0.1064*** -0.1166*** -0.0920***
Std. Error 0.0143 0.0140 0.0106 0.0142 0.0140
ROA Coefficient 1.1923*** 1.7047*** 0.6326*** 0.0826 0.1551
Std. Error 0.2022 0.1983 0.1770 0.2136 0.1985
Ownership Coefficient 0.0551** 0.0301 -0.0136 -0.0166 -0.0114
Std. Error 0.0306 0.0300 0.0137 0.0234 0.0300
International Journal of Research and Innovation in Social Science (IJRISS) |Volume IV, Issue III, March 2020|ISSN 2454-6186
www.rsisinternational.org Page 248
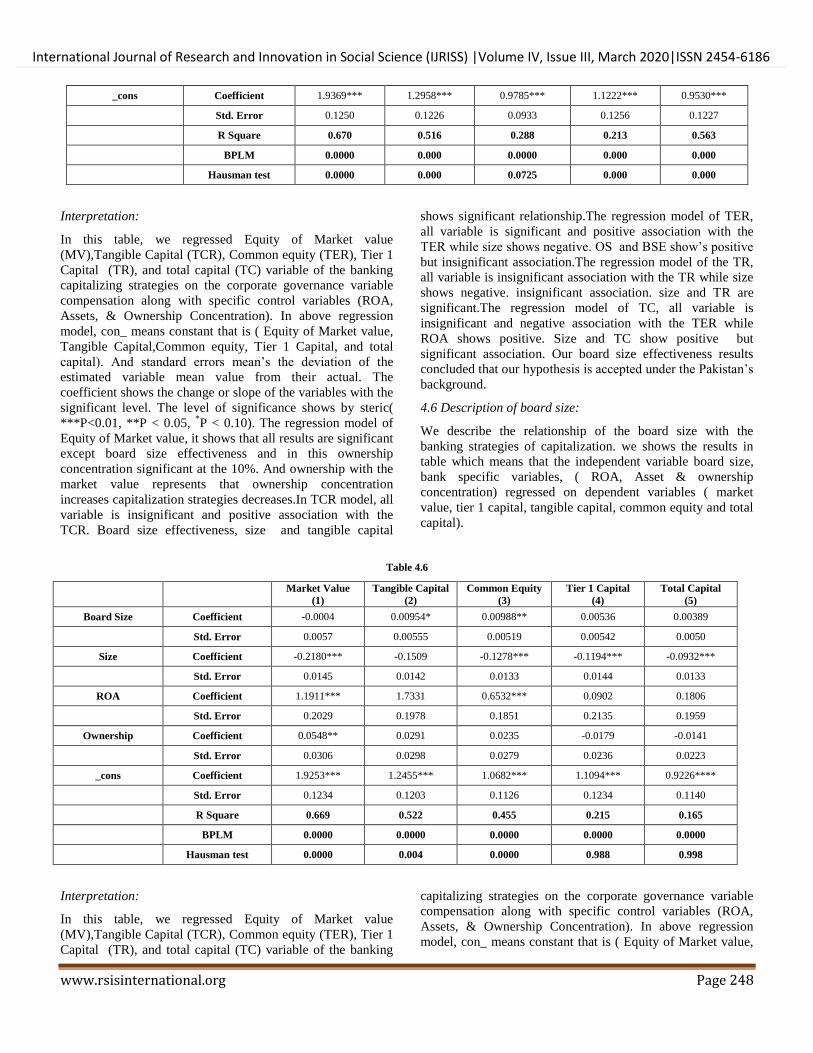
_cons Coefficient 1.9369*** 1.2958*** 0.9785*** 1.1222*** 0.9530***
Std. Error 0.1250 0.1226 0.0933 0.1256 0.1227
R Square 0.670 0.516 0.288 0.213 0.563
BPLM 0.0000 0.000 0.0000 0.000 0.000
Hausman test 0.0000 0.000 0.0725 0.000 0.000
Interpretation:
In this table, we regressed Equity of Market value
(MV),Tangible Capital (TCR), Common equity (TER), Tier 1
Capital (TR), and total capital (TC) variable of the banking
capitalizing strategies on the corporate governance variable
compensation along with specific control variables (ROA,
Assets, & Ownership Concentration). In above regression
model, con_ means constant that is ( Equity of Market value,
Tangible Capital,Common equity, Tier 1 Capital, and total
capital). And standard errors mean‟s the deviation of the
estimated variable mean value from their actual. The
coefficient shows the change or slope of the variables with the
significant level. The level of significance shows by steric(
***P<0.01, **P < 0.05, *P < 0.10). The regression model of
Equity of Market value, it shows that all results are significant
except board size effectiveness and in this ownership
concentration significant at the 10%. And ownership with the
market value represents that ownership concentration
increases capitalization strategies decreases.In TCR model, all
variable is insignificant and positive association with the
TCR. Board size effectiveness, size and tangible capital
shows significant relationship.The regression model of TER,
all variable is significant and positive association with the
TER while size shows negative. OS and BSE show‟s positive
but insignificant association.The regression model of the TR,
all variable is insignificant association with the TR while size
shows negative. insignificant association. size and TR are
significant.The regression model of TC, all variable is
insignificant and negative association with the TER while
ROA shows positive. Size and TC show positive but
significant association. Our board size effectiveness results
concluded that our hypothesis is accepted under the Pakistan‟s
background.
4.6 Description of board size:
We describe the relationship of the board size with the
banking strategies of capitalization. we shows the results in
table which means that the independent variable board size,
bank specific variables, ( ROA, Asset & ownership
concentration) regressed on dependent variables ( market
value, tier 1 capital, tangible capital, common equity and total
capital).
Table 4.6
Market Value
(1)
Tangible Capital
(2)
Common Equity
(3)
Tier 1 Capital
(4)
Total Capital
(5)
Board Size Coefficient -0.0004 0.00954* 0.00988** 0.00536 0.00389
Std. Error 0.0057 0.00555 0.00519 0.00542 0.0050
Size Coefficient -0.2180*** -0.1509 -0.1278*** -0.1194*** -0.0932***
Std. Error 0.0145 0.0142 0.0133 0.0144 0.0133
ROA Coefficient 1.1911*** 1.7331 0.6532*** 0.0902 0.1806
Std. Error 0.2029 0.1978 0.1851 0.2135 0.1959
Ownership Coefficient 0.0548** 0.0291 0.0235 -0.0179 -0.0141
Std. Error 0.0306 0.0298 0.0279 0.0236 0.0223
_cons Coefficient 1.9253*** 1.2455*** 1.0682*** 1.1094*** 0.9226****
Std. Error 0.1234 0.1203 0.1126 0.1234 0.1140
R Square 0.669 0.522 0.455 0.215 0.165
BPLM 0.0000 0.0000 0.0000 0.0000 0.0000
Hausman test 0.0000 0.004 0.0000 0.988 0.998
Interpretation:
In this table, we regressed Equity of Market value
(MV),Tangible Capital (TCR), Common equity (TER), Tier 1
Capital (TR), and total capital (TC) variable of the banking
capitalizing strategies on the corporate governance variable
compensation along with specific control variables (ROA,
Assets, & Ownership Concentration). In above regression
model, con_ means constant that is ( Equity of Market value,

International Journal of Research and Innovation in Social Science (IJRISS) |Volume IV, Issue III, March 2020|ISSN 2454-6186
www.rsisinternational.org Page 249
Tangible Capital,Common equity, Tier 1 Capital, and total
capital). And standard errors mean‟s the deviation of the
estimated variable mean value from their actual. The
coefficient shows the change or slope of the variables with the
significant level. The level of significance shows by steric(
***P<0.01, **P < 0.05, *P < 0.10). The regression model of
Equity of Market value, all variable is significant and positive
association with the market value at 1%. Except size shows
negative but significant relation. The OS ownership
concentration shows significant association at 5%. Board size
shows insignificant relationship with market value. The TC
model shows, all variable is insignificant and positive
association with the TC. Board size and tangible capital shows
significant relationship with market value. TER shows
significant and positive association with the TER while size
shows negative. OS shows positive but insignificant
association. TR , all variable is significant association with the
TR while size shows negative. insignificant association. size
and TR are significant. The regression model of the TC, all
variable is insignificant and positive association with the TC
while size shows negative. Size and TC show positive but
significant association. All the above results it is concluded
that, we accept the hypothesis on Pakistan data results.
4.7 Description of Remuneration
We describe the relationship of the remuneration with the
banking strategies of capitalization. we shows the results in
table, which means that the independent variable
remuneration, bank specific variables, ( ROA, Asset &
ownership concentration) regressed on dependent variables (
market value, tier 1 capital, tangible capital, common equity
and total capital).
Table 4.7
Market Value
(1)
Tangible Capital
(2)
Common Equity
(3)
Tier 1 Capital
(4)
Total Capital
(5)
Remuneration Coefficient 0.0200 0.0326** 0.0261** -0.0015 0.0121
Std. Error 0.0156 0.0152 0.0127 0.0161 0.0148
Size Coefficient -0.2251*** -0.1576*** -0.1136*** -0.1162*** -0.0952***
Std. Error 0.0152 0.0148 0.0111 0.0152 0.0140
ROA Coefficient 1.1757*** 1.6776*** 0.6264*** 0.0828 0.1662
Std. Error 0.2019 0.1968 0.1759 0.2139 0.1957
Ownership Coefficient 0.0529* 0.0268 -0.0104 -0.0163 -0.0128
Std. Error 0.0305 0.0297 0.0136 0.0236 0.0222
_cons Coefficient 1.8901*** 1.2348*** 0.9313*** 1.1344*** 0.9164***
Std. Error 0.1230 0.1199 0.0937 0.1253 0.1154
R Square 0.672 0.525 0.299 0.212 0.165
BPLM 0 0 0 0 0
Hausman test 0 0 0 0 0.0658
Interpretation:
In this table, we regressed Equity of Market value
(MV),Tangible Capital (TCR), Common equity (TER), Tier 1
Capital (TR), and total capital (TC) variable of the banking
capitalizing strategies on the corporate governance variable
compensation along with specific control variables (ROA,
Assets, & Ownership Concentration). In above regression
model, con_ means constant that is ( Equity of Market value,
Tangible Capital,Common equity, Tier 1 Capital, and total
capital). And standard errors mean‟s the deviation of the
estimated variable mean value from their actual. The
coefficient shows the change or slope of the variables with the
significant level. The level of significance shows by steric(
***P<0.01, **P < 0.05, *P < 0.10). The regression model of
Equity of Market value, all variable is significant and positive
association with the Common equity at 1%. Except size shows
negative but significant relation. The OS ownership
concentration shows significant association at 10%.
remuneration shows insignificant relationship with
compensation.Tangible Capital (TCR) results, all variable is
significant and positive association with the Common equity
at 1%. Except size shows negative but significant. The
remuneration shows significant association at 5%. OS
ownership concentration shows insignificant relationship with
compensation. Common equity (TER),all variable is
significant association with the Common equity at 1%. The
remuneration shows significant association at 10%. OS
ownership concentration shows insignificant relationship with
compensation. Tier 1 Capital (TR), all variable is
insignificant association with the total capital but only the
explanatory variable size and dependent variable Tier 1
Capital shows the significant impact at 1%. Total capital
(TC) all variable is insignificant association with the total
capital but only the explanatory variable size and dependent

International Journal of Research and Innovation in Social Science (IJRISS) |Volume IV, Issue III, March 2020|ISSN 2454-6186
www.rsisinternational.org Page 250
variable total capital shows the significant impact at 1%. The
results concluded that our fourth hypothesis is accepted on the
Pakistan data results.
4.8 Description of profitability
We describe the relationship of the profitability with the
banking strategies of capitalization. we shows the results in
this table which means that the independent variable
profitability, bank specific variables, ( ROA, Asset &
ownership concentration) regressed on dependent variables (
market value, tier 1 capital, tangible capital, common equity
and total capital).
Table 4.8
Market Value
(1)
Tangible Capital
(2)
Common Equity
(3) Tier 1 Capital (4)
Total Capital
(5)
ROA Coefficient 1.0467*** 1.6108*** 0.5452*** 0.0004*** 0.1126***
Std. Error 0.2827 0.2375 0.2156 0.2407 0.2138
_cons Coefficient 0.1208*** 0.0769*** 0.0930*** 0.1428*** 0.1653***
Std. Error 0.0070 0.0059 0.0053 0.0059 0.0053
R Square 0.340 0.292 0.240 0.462 0.482
BPLM 0 0.0007 0.002 0 0
Hausman test 0 0.0341 0.0017 0.0898 0.205
Interpretation:
The results show‟s that when run the regression, the
relationship of profitability ROA of the profitability shows the
positive and significant association with the capitalization
strategies. . The level of significance shows by steric(
***P<0.01, **P < 0.05, *P < 0.10). The equity of market
value shows the positive and significant relationship with
ROA. The results show‟s that when run the regression, the
relationship of profitability ROA shows positive and
significant relationship with TCR. In TER model, ROA has
positive and significant association with the TER. ROA has
negative and insignificant association with TR. The TC, the
relationship of profitability with the capitalization strategies is
positive but significant relationship with total capital. All
above related its, proves that our null hypothesis is accepted
on Pakistani backgrounds.
Table 4.9
Interpretation:
The results show‟s that when run the regression, the
relationship of profitability (ROE) with the capitalization
strategies, is positive but insignificant relationship with equity
of market value. The level of significance shows by steric(
***P<0.01, **P < 0.05, *P < 0.10). The results show‟s that
when run the regression, the relationship of profitability
(ROE) with the capitalization strategies is negative but
significant relationship with Tangible Capital. It is significant
on 10%. The results show‟s that when run the regression, the
relationship of profitability (ROE) with the capitalization
strategies is negative but insignificant relationship with
common equity The results show‟s that when run the
regression, the relationship of profitability (ROE) with the
capitalization strategies is positive but significant relationship
with Tier 1 Capital The results show‟s that when run the
regression, the relationship of profitability with the
capitalization strategies is positive but significant relationship
Market Value
(1)
Tangible Capital
(2)
Common Equity
(3)
Tier 1 Capital
(4)
Total Capital
(5)
ROE Coefficient 0.0705 -0.0123* 0.0133* 0.0351* 0.0375*
Std. Error 0.0488 0.0437 0.0368 0.0406 0.0360
_cons Coefficient 0.1213*** 0.0965*** 0.0969*** 0.1373*** 0.1607***
Std. Error 0.0100 0.0089 0.0075 0.0083 0.0073
R Square 0.309 0.156 0.220 0.464 0.484
BPLM 0.000 0.000 0.000 0.000 0.000
Hausman test 0.000 0.03 0.000 0.08 0.2
International Journal of Research and Innovation in Social Science (IJRISS) |Volume IV, Issue III, March 2020|ISSN 2454-6186
www.rsisinternational.org Page 251
with total capital. All above related models proves that our
null hypothesis is accepted on Pakistani backgrounds.
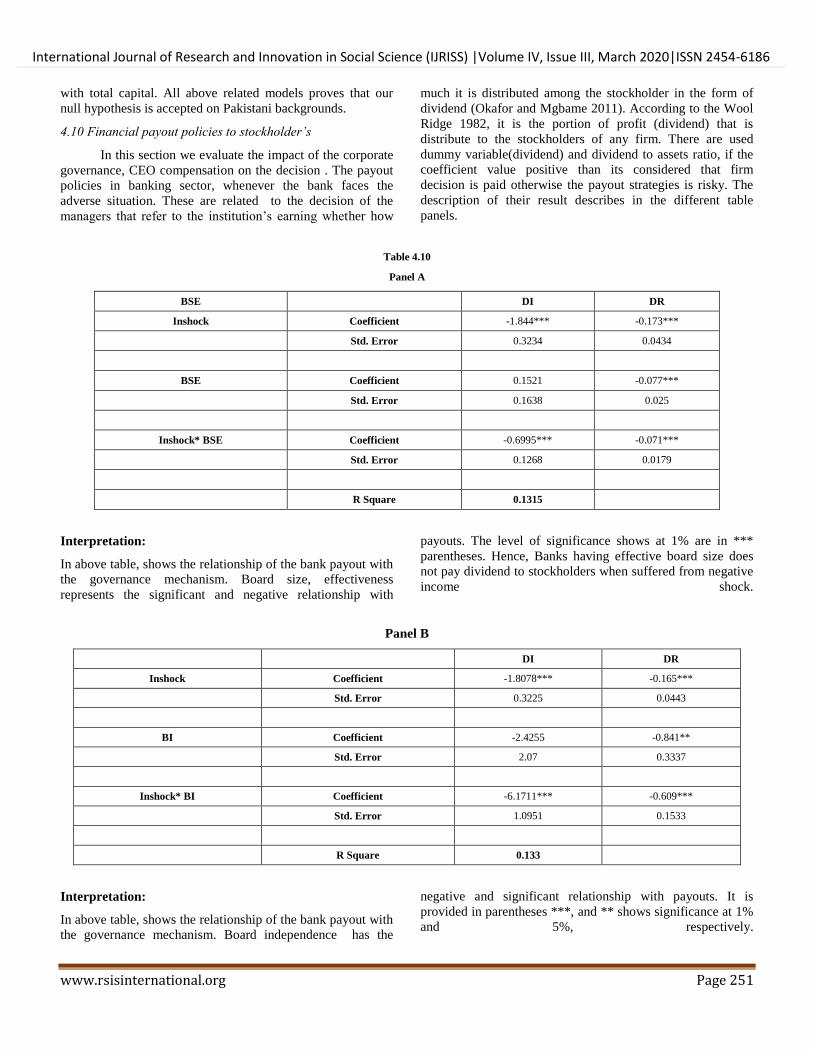
4.10 Financial payout policies to stockholder’s
In this section we evaluate the impact of the corporate
governance, CEO compensation on the decision . The payout
policies in banking sector, whenever the bank faces the
adverse situation. These are related to the decision of the
managers that refer to the institution‟s earning whether how
much it is distributed among the stockholder in the form of
dividend (Okafor and Mgbame 2011). According to the Wool
Ridge 1982, it is the portion of profit (dividend) that is
distribute to the stockholders of any firm. There are used
dummy variable(dividend) and dividend to assets ratio, if the
coefficient value positive than its considered that firm
decision is paid otherwise the payout strategies is risky. The
description of their result describes in the different table
panels.
Table 4.10
Panel A
BSE
DI DR
Inshock Coefficient -1.844*** -0.173***
Std. Error 0.3234 0.0434
BSE Coefficient 0.1521 -0.077***
Std. Error 0.1638 0.025
Inshock* BSE Coefficient -0.6995*** -0.071***
Std. Error 0.1268 0.0179
R Square 0.1315
Interpretation:
In above table, shows the relationship of the bank payout with
the governance mechanism. Board size, effectiveness
represents the significant and negative relationship with
payouts. The level of significance shows at 1% are in ***
parentheses. Hence, Banks having effective board size does
not pay dividend to stockholders when suffered from negative
income shock.
Panel B
DI DR
Inshock Coefficient -1.8078*** -0.165***
Std. Error 0.3225 0.0443
BI Coefficient -2.4255 -0.841**
Std. Error 2.07 0.3337
Inshock* BI Coefficient -6.1711*** -0.609***
Std. Error 1.0951 0.1533
R Square 0.133
Interpretation:
In above table, shows the relationship of the bank payout with
the governance mechanism. Board independence has the
negative and significant relationship with payouts. It is
provided in parentheses ***, and ** shows significance at 1%
and 5%, respectively.

International Journal of Research and Innovation in Social Science (IJRISS) |Volume IV, Issue III, March 2020|ISSN 2454-6186
www.rsisinternational.org Page 252
Panel C
DI DR
Inshock Coefficient -1.7737*** -0.1852***
Std. Error 0.32512 0.04511
BS Coefficient 0.18994*** -0.0085
Std. Error 0.0598 0.00784
Inshock* BS Coefficient -0.219*** -0.022***
Std. Error 0.03897 0.0054
R Square 0.16071
Interpretation:
The payout polices regressed on the board size, that represents
the positive and significant relationship with payouts. It is
significant at 1%. The sector (financial) in negative income
shock even continuous to pay and the dividend is backed by
the small firm size in case, suffers from the negative income
shocks.
Panel D
DI DR
Inshock Coefficient -1.7963*** -0.1823***
Std. Error 0.33064 0.04681
REM Coefficient 0.48744** 0.08077**
Std. Error 0.20116 0.03215
Inshock* REM Coefficient -0.3905*** -0.0352***
Std. Error 0.06899 0.00944
R Square 0.146
Interpretation:
The regression run to search out the relationship between
remuneration of the CEO and the bank payouts. CEO
compensation variable is regressed on bank payout
polices.CEO compensation shows positiveand significant
relationship with corporate payouts. The *, **, and *** are
provided in parentheses it shows the significance at 10%, 5%
and 1%, respectively. In this situation, continuous to pay even
in the negative income shocks by Financial institutions.
V. CONCLUSION AND FUTURE RECOMMENDATION
The primary purpose of the financial institution is to do the
maximization of the wealth of stakeholders. The decision of
payouts and financing are very essential in order to achieve
the goals. Equity or debt is the source of assets it relates to the
financing decisions. The distribution of profit related to the
payout, it is provided by the banks to shareholders or gaining
of the capital is given to the stockholder by the scheme of
reinvesting the earning into the assets of the banks. The price
of the stock when appreciated, in this situation when sell these
stocks then received the capital gains. According to the
empirical results and findings involved one and only payouts
and capitalization decisions along with governance
mechanism. In few decade‟s the demand of good and effective
governance system is increased. This is because to support or
protect the stockholder and put the control over through in the
time of financial collapse in the countries who are developed.
The collapse of financial influenced the economy. So, the
platform related to stock exchange and financial markets in
Pakistan has been introduced. All the listed firms must follow
the code compliance of 2002 of the corporate governance. The
study searches out the relationship of the corporate
governance. The profitability with capitalization strategies of
banks. The secondary data used to postulate our results. We
collect our data from the scheduled banks through their annual
International Journal of Research and Innovation in Social Science (IJRISS) |Volume IV, Issue III, March 2020|ISSN 2454-6186
www.rsisinternational.org Page 253
reports, these banks are listed on the Pakistan stock exchange.
The sample period is from the 2006-2018. The results show
that the governance favors the stockholders (banks) interest
that related with low capitalization strategies. The governance
involved board size effectiveness, board independence, CEO
duality a compensation which taken as the friendly
shareholder and corporate governance, it moves the risk from
the stockholders towards the debt holder. The board size and
board independent shows the negative associations with the
financial institution therefore, low capital is in favor of
stockholder. This shows the governance associated positively
with instability of the banks. The demerit of governance is it
increases the bank risk. This demerit restricted to the
governance in order to outperform under management. The
low capital increase when it is taking the high risk that
effected on CEO. According to 2012 of the governance
compliances recommended CEO and the chairman/
chairperson must be different. The non-executive directors of
the board must be chairman and play role in the board
leadership. The profitability measure shows that it also
impacts on the capitalization policies. The profitability
increases and shows positive and significant association with
the strategies of the capitalization.
In financial institution the payout decision defined as “ it is
the residual earning that are distributed among the owner of
the firm”. In case of income shock the payout becomes very
critical. Corporate governance associated negatively with
payout on the financial institution. It backs the dividend when
they suffered from negative income shock. So, it is summed
up with that better corporate governance, favor and protect to
the stockholder results in decreases the capital strategy and
payout restricted by the financial institution. The profitability
also related to the capitalization strategies if higher the profit
than it is impacted good on banking capitalization and wise
versa.
It is recommended to must consider the other variables of the
governance, board characteristics and the other proxies of the
profit that whether it is impacting on the capitalization. Last
one, the index of corporate governance shall be prepared in
order to search out the influences and association with the
banking capitalization strategies.
5.2 Limitations of the study
The limitation of our research given below:
It only covers the listed schedule bank of Pakistan. It
is the developing country.
The sample of our study considered only the listed
bank, not the private banks, specialized and foreign
banks.
The research was conducted on only four variables of
the governance with capitalization (Board size, board
size effectiveness, board independence, CEO) and
other important variables. (Board committee,
corporate ethics, audit committee and also impact on
bank capitalization.
The profitability measures ROA, ROE only be
considered to evaluate the impact on capitalization
banks. So, the must related to other main proxies like
EPS etc.
The research we conducted on a few characteristics
of the board. (Board independence, board size, board
size effectiveness and CEO). Also, research
considered the age, education, gender character,
tenure of directorship it may also explore the
relationship.
Therefore, the above, mentioned limitations, the worth of our
research is not neglected and compromised. The study puts
addition to the current literatures, especially in the field of
corporate governance and banking capitalization.
REFERENCES
[1] Adams, R. B., & Mehran, H. (2003). Board structure, banking firm performance and the bank holding company organizational
form. In Federal Reserve Bank of Chicago Proceedings (No. 866).
[2] Aggarwal, R., & Jacques, K. T. (1998). Assessing the impact of prompt corrective action on bank capital and risk. Economic
Policy Review, 4(3).
[3] Ahmed Haji, A., &Mohd Ghazali, N. A. (2013). A longitudinal examination of intellectual capital disclosures and corporate
governance attributes in Malaysia. Asian Review of
Accounting, 21(1), 27-52. [4] Ahmed Sheikh, N., & Wang, Z. (2012). Effects of corporate
governance on capital structure: empirical evidence from Pakistan.
Corporate Governance: The international journal of business in society, 12(5), 629-641.
[5] Ajinkya, B., Bhojraj, S., & Sengupta, P. (2005). The association
between outside directors, institutional investors and the properties of management earnings forecasts. Journal of accounting
research, 43(3), 343-376.
[6] Andersen, T. B., & Tarp, F. (2003). Financial liberalization, financial development and economic growth in LDCs. Journal of
international development, 15(2), 189-209. [7] Anderson, R. C., & David, M. (2003). Reeb, 2003, Founding-
family ownership and firm performance: Evidence from the S&P
500. Journal of Finance, 58(3), 1301-1328. [8] Anginer, D., Demirguc-Kunt, A., Huizinga, H., & Ma, K. (2016).
Corporate governance and bank capitalization strategies. Journal
of Financial Intermediation, 26, 1-27. [9] Anum Mohd Ghazali, N. (2010). Ownership structure, corporate
governance and corporate performance in Malaysia. International
Journal of Commerce and Management, 20(2), 109-119. [10] Armstrong, C. S., Balakrishnan, K., & Cohen, D. (2012).
Corporate governance and the information environment: Evidence
from state antitakeover laws. Journal of Accounting and Economics, 53(1-2), 185-204.
[11] Aubuchon, C. P., & Wheelock, D. C. (2010). The geographic
distribution and characteristics of US bank failures, 2007-2010: do
bank failures still reflect local economic conditions? Federal
Reserve Bank of St. Louis Review, 92(5), 395-415.
[12] Becht, M., Bolton, P., & Röell, A. (2011). Why bank governance is different. Oxford Review of Economic Policy, 27(3), 437-463.
[13] Beck, T., Demirguc‐Kunt, A. S. L. I., Laeven, L., & Levine, R.
(2008). Finance, firm size, and growth. Journal of Money, Credit and Banking, 40(7), 1379-1405.
[14] Beck, T., Demirgüç-Kunt, A., & Merrouche, O. (2013). Islamic
vs. conventional banking: Business model, efficiency and stability. Journal of Banking & Finance, 37(2), 433-447.
[15] Berger, A. N., & Bouwman, C. H. (2009). Bank capital, survival,
and performance around financial crises. Documento de trabajo, Wharton Financial Institutions Center. Disponible en: http://fic.
wharton. upenn. edu/fic/papers/09/0924. pdf.
International Journal of Research and Innovation in Social Science (IJRISS) |Volume IV, Issue III, March 2020|ISSN 2454-6186
www.rsisinternational.org Page 254
[16] Berger, A. N., & Bouwman, C. H. (2013). How does capital affect
bank performance during financial crises? Journal of Financial
Economics, 109(1), 146-176. [17] Berger, A. N., & Di Patti, E. B. (2006). Capital structure and firm
performance: A new approach to testing agency theory and an
application to the banking industry. Journal of Banking & Finance, 30(4), 1065-1102.
[18] Berger, A. N., Demirgüç-Kunt, A., Levine, R., &Haubrich, J. G.
(2004). Bank concentration and competition: An evolution in the making. Journal of Money, Credit and Banking, 433-451.
[19] Berger, A. N., Imbierowicz, B., & Rauch, C. (2016). The roles of
corporate governance in bank failures during the recent financial crisis. Journal of Money, Credit and Banking, 48(4), 729-770.
[20] Berger, J., & Milkman, K. L. (2012). What makes online content
viral? Journal of marketing research, 49(2), 192-205. [21] Bhatti, G. A., & Hussain, H. (2010). Evidence on structure
conduct performance hypothesis in Pakistani commercial
banks. International Journal of Business and Management, 5(9), 174.
[22] Black, B. (2001). The corporate governance behavior and market
value of Russian firms. Emerging markets review, 2(2), 89-108.
[23] Burki, A. A., & Ahmad, S. (2010). Bank governance changes in
Pakistan: Is there a performance effect? Journal of Economics and Business, 62(2), 129-146.
[24] Cadbury, A. (1992). Report of the committee on the financial
aspects of corporate governance (Vol. 1): Gee. [25] Calem, P., & Rob, R. (1999). The impact of capital-based
regulation on bank risk-taking. Journal of Financial
Intermediation, 8(4), 317-352. [26] Caprio, G., & Levine, R. (2002). Corporate governance in finance:
Concepts and international observations. Financial sector
governance: The roles of the public and private sectors, 17-50. [27] Claessens, S., Klingebiel, D., &Lubrano, M. (2000). Corporate
governance reform issues in the Brazilian equity markets. World
Bank. [28] Cole, R. A., & White, L. J. (2012). Déjà vu all over again: The
causes of US commercial bank failures this time around. Journal
of Financial Services Research, 42(1-2), 5-29.
[29] Coombes, P., & Watson, M. (2001). Corporate reform in the
developing world. The McKinsey Quarterly, 89-89.
[30] Daily, C. M., Dalton, D. R., & Rajagopalan, N. (2003). Governance through ownership: Centuries of practice, decades of
research. Academy of Management Journal, 46(2), 151-158.
[31] De Andres, P., Azofra, V., & Lopez, F. (2005). Corporate boards in OECD countries: Size, composition, functioning and
effectiveness. Corporate Governance: An International Review,
13(2), 197-210. [32] De Jong, A., DeJong, D. V., Mertens, G., &Wasley, C. E. (2005).
The role of self-regulation in corporate governance: Evidence and
implications from the Netherlands. Journal of corporate finance, 11(3), 473-503.
[33] DeAngelo, H., &Stulz, R. M. (2015). Liquid-claim production,
risk management, and bank capital structure: Why high leverage is optimal for banks. Journal of Financial Economics, 116(2), 219-
236.
[34] DeAngelo, H., DeAngelo, L., & Skinner, D. J. (2009). Corporate
payout policy. Foundations and Trends® in Finance, 3(2–3), 95-
287.
[35] Demirguc‐Kunt, A., Detragiache, E., & Merrouche, O. (2013). Bank capital: Lessons from the financial crisis. Journal of Money,
Credit and Banking, 45(6), 1147-1164.
[36] Devriese, J., Dewatripont, M., Heremans, D., & Nguyen, G. (2004). Corporate governance, regulation and supervision of
banks. Financial Stability Review, 2(1), 95-120.
[37] DeYoung, R., & Torna, G. (2013). Nontraditional banking activities and bank failures during the financial crisis. Journal of
Financial Intermediation, 22(3), 397-421.
[38] di Patti, E. B., & Hardy, D. C. (2005). Financial sector liberalization, bank privatization, and efficiency: Evidence from
Pakistan. Journal of Banking & Finance, 29(8), 2381-2406.
[39] Donaldson, G., & Lorsch, J. W. (1983). Decision making at the
top: The shaping of strategic direction: basic books New York.
[40] Donaldson, T., & Dunfee, T. W. (1999). Ties that Bind: A Social Contracts Approach to Business Ethics (Harvard Business School
Press, Boston).
[41] Dong, J., & Gou, Y. N. (2010). Corporate governance structure, managerial discretion, and the R&D investment in
China. International Review of Economics & Finance, 19(2), 180-
188. [42] Edmans, A., & Liu, Q. (2011). Inside debt. Review of Finance,
15(1), 75-102.
[43] Eisenberg, T., Sundgren, S. and Wells, M.T. (1998), “Larger board size and decreasing firm value in small firms”, Journal of
Financial Economics, Vol. 48, pp. 35-54.
[44] Ellul, A., &Yerramilli, V. (2013). Stronger risk controls, lower risk: Evidence from US bank holding companies. The Journal of
Finance, 68(5), 1757-1803.
[45] Esa, E., & Anum Mohd Ghazali, N. (2012). Corporate social responsibility and corporate governance in Malaysian
government-linked companies. Corporate Governance: The
international journal of business in society, 12(3), 292-305.
[46] Esty, D. C. (1998). Non-governmental organizations at the World
Trade Organization: cooperation, competition, or exclusion. J. Int'l Econ. L., 1, 123.
[47] Faff, R. (2001). An examination of the Fama and French three-
factor model using commercially available factors. Australian Journal of Management, 26(1), 1-17.
[48] Fase, M. M., & Abma, R. (2003). Financial environment and
economic growth in selected Asian countries. Journal of Asian economics, 14(1), 11-21.
[49] Forker, J. J. (1992). Corporate governance and disclosure
quality. Accounting and Business research, 22(86), 111-124. [50] Goshi, et al., 2002. Board structure, executive compensation and
firm performance. Evidence from India. Mumbai, India. Indra
Ghandi Institute of Development Research. [51] Gray, R., Owen, D., & Adams, C. (1996). Accounting &
accountability: changes and challenges in corporate social and
environmental reporting: Prentice Hall.
[52] Grullon, G., &Michaely, R. (2002). Dividends, share repurchases,
and the substitution hypothesis. the Journal of Finance, 57(4),
1649-1684. [53] Halkias, D., Shahzad Bukhari, K., Awan, H. M., & Ahmed, F.
(2013). An evaluation of corporate governance practices of
Islamic banks versus Islamic bank windows of conventional banks: A case of Pakistan. Management Research Review, 36(4),
400-416.
[54] Haugen, R. A., &Senbet, L. W. (1986). Corporate finance and taxes: a review. Financial Management, 5-21.
[55] Hawley, J. P., & Williams, A. T. (1996). Corporate governance in
the United States: the rise of fiduciary capitalism. School of Economics and Business Administration.
[56] Hermalin, B. E. and M. S. Weisbach (2003, Apr). Boards of
directors as an endogenously determined institution: A survey of the economic literature. Economic Policy Review 9 (1), 7–26.
[57] Hoechle, D., Schmid, M., Walter, I., & Yermack, D. (2012). How
much of the diversification discount can be explained by poor
corporate governance?. Journal of Financial Economics, 103(1),
41-60.
[58] Hopt, K. J. (2013). Corporate governance of banks and other financial institutions after the financial crisis. Journal of
Corporate Law Studies, 13(2), 219-253.
[59] Hossain, M. Tan, L. M. & Adams, M. B. (1994). Voluntary disclosure in an emerging capital market : some empirical
evidence from companies listed on the Kula lumpur stock
exchange. The International Journal of Accounting, Vol 3, No 29, 334-351.
[60] Javid, A. Y., & Iqbal, R. (2010). Corporate governance in
Pakistan: Corporate valuation, ownership and financing. [61] Jiang, F., & Kim, K. A. (2015). Corporate governance in China: A
modern perspective.

International Journal of Research and Innovation in Social Science (IJRISS) |Volume IV, Issue III, March 2020|ISSN 2454-6186
www.rsisinternational.org Page 255
[62] Johan, D., Dewatripont, M., Heremans, D., & Nguyen, G. (2004).
Corporate governance, regulation and supervison of
banks. Financial Stability Review, National Bank of Belgium. [63] John, K., & Senbet, L. W. (1998). Corporate governance and
board effectiveness. Journal of Banking & Finance, 22(4), 371-
403. [64] Kiel, G. C., & Nicholson, G. J. (2003). Board composition and
corporate performance: How the Australian experience informs
contrasting theories of corporate governance. Corporate Governance: An International Review, 11(3), 189-205.
[65] Laeven, L., & Levine, R. (2009). Bank governance, regulation and
risk taking. Journal of Financial Economics, 93(2), 259-275. [66] Lee, C. C., & Hsieh, M. F. (2013). The impact of bank capital on
profitability and risk in Asian banking. Journal of international
money and finance, 32, 251-281. [67] Lipton, M., & Lorsch, J. W. (1992). A modest proposal for
improved corporate governance. The business lawyer, 59-77.
[68] Macey, J. R., & O'hara, M. (2003). The corporate governance of banks.
[69] Mehran, H., Morrison, A. D., & Shapiro, J. D. (2011). Corporate
governance and banks: What have we learned from the financial
crisis?
[70] Muhammad Awan, H., Shahzad Bukhari, K., & Iqbal, A. (2011). Service quality and customer satisfaction in the banking sector: A
comparative study of conventional and Islamic banks in Pakistan.
Journal of Islamic Marketing, 2(3), 203-224. [71] Naimi, M., Nor, M., Rohami, S., & Wan-Hussin, W. N. (2010).
Corporate governance and audit report lag in Malaysia. Corporate
Governance and Audit Report Lag in Malaysia (October 20, 2010). Asian Academy of Management Journal of Accounting and
Finance, 6(2).
[72] O'Donovan, G. (2007). The corporate culture handbook: How to plan, implement and measure a successful culture change
programme. Development and Learning in Organizations: An
International Journal, 22(1). [73] Okafor, C. A., &Chijoke-Mgbame, A. M. (2011). Dividend policy
and share price volatility in Nigeria. Jorind, 9(1), 202-210.
[74] O'Sullivan, M. (2001). Contests for corporate control: Corporate
governance and economic performance in the United States and
Germany. OUP Catalogue.
[75] Ozili, P. K., &Uadiale, O. (2017). Ownership concentration and bank profitability. Future Business Journal, 3(2), 159-171.
[76] Pearce, J. A., & Robinson, R. B. (2004). Hostile takeover defenses
that maximize shareholder wealth. Business Horizons, 47(5), 15-24.
[77] Pound, B., & Martinez Cairo, L. (1983). Leucaena: its cultivation
and uses. Leucaena: its cultivation and uses.
[78] Prasanna, P. K. (2006). Corporate Governance-Independent Directors and Financial Performance: An Empirical Analysis.
In Indian Institute of Capital Markets 9th Capital Markets
Conference Paper. [79] Raheja, C. G. (2005). Determinants of board size and composition:
A theory of corporate boards. Journal of financial and quantitative
analysis, 40(02), 283-306. [80] Ross, S. (1973) „The economic theory of agency: the principal‟s
problem‟, American Economic Review 63: 134–9.
[81] Sarkar, J. (2009). Board independence & corporate governance in India: Recent trends & challenges ahead. Indian Journal of
Industrial Relations, 576-592.
[82] Saunders, P., &Klau, F. (1985). The role of the public sector: causes and consequences of the growth of government (No. 4).
Organization for Economic.
[83] Sesil, J. C., Lin, Y. P., & Director, S. M. (2006). Stock Option Adoption and Irrational Exuberance: The Impact On
Profitability. Available at SSRN 873411.
[84] Smith, C. W., &Stulz, R. M. (1985). The determinants of firms'
hedging policies. Journal of financial and quantitative
analysis, 20(4), 391-405. [85] Song, J., &Windram, B. (2004). Benchmarking audit committee
effectiveness in financial reporting. International Journal of
Auditing, 8(3), 195-205. [86] Suchman, M. C. (1995). Managing legitimacy: Strategic and
institutional approaches. Academy of management review, 20(3),
571-610. [87] Tadesse, S. (2002). Financial architecture and economic
performance: international evidence. Journal of Financial
Intermediation, 11(4), 429-454. [88] Uzun, H., Szewczyk, S. H., & Varma, R. (2004). Board
composition and corporate fraud. Financial Analysts
Journal, 60(3), 33-43. [89] Vafeas, N., &Theodorou, E. (1998). The relationship between
board structure and firm performance in the UK. The British
Accounting Review, 30(4), 383-407.
[90] Wagner III, J. A., Stimpert, J. L., &Fubara, E. I. (1998). Board
composition and organizational performance: Two studies of
insider/outsider effects. Journal of Management studies, 35(5), 655-677.
[91] Zywicki, T. J., & Adamson, J. (2008). The Law & Economics of
Subprime Lending.

International Journal of Research and Innovation in Social Science (IJRISS) |Volume IV, Issue III, March 2020|ISSN 2454-6186
www.rsisinternational.org Page 256
APPENDIX
Banks for sampling
BANK NAME BRANCHES
1.ALLIED BANK LIMITED 1,048
2.ASKARI BANK LIMITED 391
3.BANK AL-HABIB LIMITED 630
4.BANK ALFALAH LIMITED 420
5. BANK ISLAMI PAKISTAN LIMITED 176
6.The BANK OF KHYBER LIMITED 131
7.The BANK OF PUNJAB 405
8. Faysal Bank LIMITED 281
9.HABIB BANK LIMITED 1,663
10.HABIBMETROPOLITANBAN LIMITED 237
11.JS BANKLIMITED 243
12. MCB BANKLIMITED 1,247
13 MEEZAN BANK LIMITED 551
14. NATIONAL BANK OF PAKISTAN 1,406
15. SAMBA Bank LIMITED 34
16. SONERI BANK LIMITED 266
17. STANDARD CHARTERED BANK
(PAKISTAN) LIMITED
101
18. SUMMIT BANK 193
19. UNITED Bank LIMITED 1,311
20. SILK BANK LIMITED 88