corporate incentives and nuclear safety - agricultural and
TRANSCRIPT
Corporate Incentives and Nuclear Safety
Catherine Hausman∗
October, 2012
Job Market Paper
Abstract
Beginning in the late 1990s, approximately half of all commercial U.S. nuclear power
reactors were sold by price-regulated public utilities to independent power producers.
At the time of the ownership transfers, some policy makers raised concerns that these
profit-maximizing corporations would ignore safety. Others claimed that corporations
would improve reactor management, with positive effects on safety. This paper pro-
vides the first comprehensive evidence of the effect of these ownership transfers on
plant safety. Using data on a variety of safety measures and a difference-in-difference
estimation strategy, I find no evidence that safety deteriorated; for some measures, it
even improved following divestiture. Moreover, for given levels of generation, safety
substantially improved. Ownership transfers led to increased operating efficiency, and
these gains do not appear to have come at the cost of public safety. To provide intuition
for these findings, I show how these results are consistent with the incentives faced by
nuclear plant operators.
Key words: nuclear safety, nuclear power, deregulation
JEL: D22, D62, L51, L94
∗Ph.D. candidate, Agricultural and Resource Economics, UC Berkeley, and research assistant, EnergyInstitute at Haas, Haas School of Business. Email: [email protected]. I am grateful to Max Auffham-mer, Peter Berck, Severin Borenstein, Lucas Davis, and Catherine Wolfram for their invaluable advice. Ithank Michael Anderson, Meredith Fowlie, Daniel Hausman, Joshua Hausman, Koichiro Ito, Per Peterson,Charles Seguin, and Anna Spurlock for excellent comments. This work was supported in part under aresearch contract from the California Energy Commission to the Energy Institute at Haas. All errors aremine.

Corporate Incentives and Nuclear Safety C. Hausman
1 Introduction
Nuclear power plants currently make up 10 percent of all electric generating capacity in
the United States and 20 percent of all actual generation (NRC 2010). They have been
praised for their low marginal cost and lack of carbon emissions; at the same time, safety
concerns continue to plague the industry. In the past two decades, a dramatic change to
the industry has taken place: approximately half of all U.S. nuclear power plants have been
sold off by price-regulated utilities and now operate in competitive markets. Surprisingly,
there is little evidence on how ownership transfers have affected safety. This paper provides
the first comprehensive analysis of the impact of these nuclear power plant divestitures1 on
safety. Using data on a variety of safety measures and a difference-in-difference estimation
strategy, I find no evidence that safety deteriorated; for some measures, it even improved
following divestiture. Moreover, for given levels of generation, safety substantially improved.
Ownership transfers led to the alignment of private incentives to increase operating efficiency,
and these gains do not appear to have come at the cost of public safety.
As electricity generation markets were deregulated in the late 1990s and early 2000s,
price-regulated utilities sold off their nuclear reactors. Almost half of U.S. reactors are now
owned by independent power producers. At the same time, ownership of nuclear plants
became increasingly consolidated; whereas most investor-owned utilities operated one or two
reactors prior to deregulation, two companies alone (Entergy and Exelon) currently own
over one quarter of U.S. reactors. Concurrent with these ownership changes, generation
rose: operating efficiency, as measured by the ratio of generation to capacity, increased from
75 percent in the 1990s to over 90 percent in the 2000s. The deregulation of electricity
generation markets was undertaken in part to increase efficiency and lower costs. It was
thought that, under rate of return regulation, incentives were not aligned for utilities to
minimize costs in the generation portion of their business. Robust empirical evidence now
shows that efficiency gains were indeed realized at both fossil-fuel-fired plants and nuclear
plants after the restructuring of electricity markets. Davis and Wolfram (2012) attribute a
10 percentage point increase in operating efficiency at nuclear power plants to divestiture
from investor-owned utilities.
While there is now some consensus that electricity market restructuring led to the align-
ment of private costs and thus to efficiency gains, less is known about the effect of the market
changes on external costs. Even as deregulation began in the late 1990s, some feared that
the independent power producers purchasing nuclear plants would ignore safety concerns in
1As described below, divestiture refers to the process whereby utilities transfer generation assets tounregulated companies, and it can involve either transfer to an unregulated subsidiary of the regulatedutility or sale to an independent power producer.
1

Corporate Incentives and Nuclear Safety C. Hausman
the interest of maximizing profits. Others claimed that deregulation and consolidation would
improve reactor management, and that the new owners would work hard to avoid costly plant
shutdowns. David Lochbaum of the Union of Concerned Scientists was quoted in the New
York Times as saying “[t]he new owner of a nuclear power plant clearly has a commitment
to a nuclear future... you can also make the counterargument that the new owner is only
trying to make a quick buck, to recoup their investment and make some money.”2
My empirical strategy exploits the fact that only half of the reactors in the U.S. were
divested and that the timing of divestiture varied widely. These differences in divestiture
were largely the outcome of differential electricity deregulation legislation across states. I
make the identifying assumption that this timing is exogenous to nuclear safety. To exam-
ine the validity of this assumption, I test for the possibility of selection bias. Looking at
pre-divestiture safety records, I find no statistically or economically significant differences
between the plants that later divest and those that remain controlled by investor-owned
utilities.
Unfortunately, while catastrophic events may represent the largest social cost of nuclear
power, their risk is not observable directly. I am, however, able to analyze data from the
Nuclear Regulatory Commission (NRC) on five safety measures: initiating events (unplanned
power changes), fires, escalated enforcement actions,3 collective worker radiation exposure,
and average worker radiation exposure. The NRC compiles these data from both operator
reports and regular inspections. I choose these five measures in part because they may be the
least open to manipulation by plant operators. Unplanned power changes, for instance, are
not possible to hide from safety inspectors, since generation to the electrical grid is metered.
Additionally, these measures represent a broad portion of the risk to plants. Initiating
events cover a large portion of the internal event core damage risk to nuclear plants (Eide,
Rasmuson, and Atwood 2005). Also, the NRC’s authority to use escalated enforcement
actions “extends to any area of licensed activity that affects the public health and safety;”4
I thus use these as the best measure available of the failure of a reactor’s operator to follow
federal safety regulations.
I find that divestiture leads to a 16 percent reduction in the expected number of initiating
events, a 46 percent reduction in the expected number of fires, and a 29 percent reduction
in the expected number of escalated enforcement actions. While the point estimates are
2Wald, Matthew L. 2000. “Safety a Worry as Companies Shop for Nuclear Reactors” New York Times,February 22.
3As described in the data section, escalated enforcement occurs when the Nuclear Regulatory Commissionimposes notices of violation and/or financial penalties on plants it deems out of compliance with safetyregulations.
4http://www.nrc.gov/about-nrc/regulatory/enforcement/program-overview.html (Accessed July, 2011).
2

Corporate Incentives and Nuclear Safety C. Hausman
not very precisely estimated, the magnitude of the coefficients is economically significant.
Furthermore, moderate increases in the number of events can be ruled out at the five percent
level. The results are robust to a number of specification checks, including various count
models and OLS estimation. For radiation exposure, I find a reduction of 25 percent for
collective worker exposure and 18 percent for average worker exposure. I also examine the
effect of divestiture on safety for given levels of generation. This is important because the
results described above include an indirect generation effect. The direct effect of divestiture
on unsafe events is negative, but divestiture also increases generation, thereby increasing
the exposure of the plant to an event. I find larger reductions in the expected number of
unsafe events for given levels of generation, and the results are statistically significant at the
1 percent level for initiating events and 5 percent level for escalated enforcement.
The results are stable across reactor type and location, alleviating concerns about selec-
tion bias. Allowing for heterogeneity in the safety response, I find that newer and larger reac-
tors experienced the largest effects. I find limited evidence of intra-firm spillovers, suggesting
my main results are a lower bound on the overall effect. I find no effect of consolidation.
There is some empirical evidence for learning over time at divested plants, consistent with
anecdotal evidence.
These findings are consistent with the incentives faced by nuclear plant operators. Nuclear
power plant operators have strong incentives to avoid outages. Because wholesale electricity
prices are much higher than variable costs for nuclear plants, any outage leads to large losses
in operating profits. Thus unsafe events that lead to plant shutdowns incur private costs
for plants beyond the costs of the repairs themselves. On the other hand, maintenance to
prevent unsafe events is costly if it requires a plant to shut down. Prior to divestiture, plants
may have been able to pass on some of the costs of outages to their ratepayers; since this
is not possible in competitive generation markets, divestiture likely changed their incentives
for maintenance. Ex-ante predictions about the effect of divestiture on maintenance are not
possible, for reasons discussed below. However, both anecdotal evidence and my empirical
results suggest that divestiture led to improved plant management and thus to better safety
records.
This paper contributes to several strands of literature. First, restructuring transformed
the electricity industry in many parts of the U.S., stimulating interest among economists
and policy makers in understanding the consequences of these broad market reforms. This
literature is part of a larger literature on the evolution of markets following deregulation.
Electricity serves as a useful empirical setting in this broader literature for a few reasons: (1)
electricity is a homogeneous good, so quality changes do not confound the analysis; (2) some
states deregulated while others did not, and the timing of deregulation varied. This process,
3

Corporate Incentives and Nuclear Safety C. Hausman
while not random, has generally been thought to be exogenous to power plant operations.
Several important outcomes have been analyzed in this context, including operating effi-
ciency (Bushnell and Wolfram 2005; Davis and Wolfram 2012; Fabrizio, Rose, and Wolfram
2007; and Zhang 2007), market power (Borenstein, Bushnell, and Wolak 2002; Bushnell,
Mansur, and Saravia 2008), and emissions (Fowlie 2010). This paper is the first to analyze
safety, which plays a crucial role in energy production and particularly in nuclear power.
Nuclear power is controversial precisely because of the potential for catastrophic events, so
understanding how deregulation impacted the probability of unsafe events is crucial.
This paper also contributes to the literature on nuclear power safety. Analyses of nuclear
power safety emerged following accidents at Three Mile Island and Chernobyl (e.g. David,
Maude-Griffin, and Rothwell 1996, Feinstein 1989, Hanemann et al. 1992, Rothwell 1989,
and Rust and Rothwell 1995), and the recent accident at the Fukushima Daiichi facility
has renewed interest in understanding the risks the public faces from nuclear plants. This
paper does not claim to answer the broad questions of whether the world should use nuclear
power to meet its energy needs or of how safety should be regulated. It does, however,
speak to how a major market transformation in the U.S. impacted almost half of the nuclear
fleet.5 Moreover, it relates to the wider literature on the structure of the nuclear power
sector (including Davis 2012, MIT 2003, and MIT 2009). This sector comprises a significant
portion of the U.S. electricity industry, and interest in it has been renewed in recent years
because of its status as a carbon-free source of large-scale baseload electricity generation.
Third, this paper is germane to the literature on the consequences of deregulation for
outcomes beyond private efficiency gains. When the airline industry was deregulated, for
instance, concerns were raised about airline safety (Barnett and Higgins 1989, Golbe 1986,
Kennet 1993, and Rose 1990). Importantly, though, one of the main mechanisms through
which safety and profitability are related in air travel is in the consumer’s demand function;
this mechanism is not expected to operate in the case of nuclear power generation, as elec-
tricity is not differentiable for end-users. In related work, water privatization led to concerns
about increases in water-borne illness (Galiani et al. 2005). Papers in this literature are
necessarily industry-specific: the interaction of private cost reductions with changes to qual-
ity or changes to external costs is highly context-dependent. However, this paper provides
intuition for the mechanisms at work, some of which are generalizable beyond the nuclear
power industry.
5One related paper is Verma, Mitnick and Marcus (1999), which finds mixed results for the effect ofincentive regulation programs prior to divestiture on power plant safety.
4

Corporate Incentives and Nuclear Safety C. Hausman
2 Background and Related Literature
2.1 Electricity Deregulation
Deregulation refers to the broad set of reforms proposed for the U.S. electricity sector in the
late 1990s; the set of reforms actually implemented and their timeline varied by state. Prior
to deregulation, and in states where deregulation did not occur, local monopoly utilities bun-
dled generation, transmission, and distribution services. Local public utilities commissions
(PUCs) set the prices the utilities received so the utilities could recover fixed costs plus a fair
rate-of-return; one example of such regulation is average-cost pricing. This cost of service
pricing is the most extreme form regulation took; typically, some incentives for generators to
keep costs low were built into the regulatory process. During deregulation, proposed reforms
included separating generation, transmission, distribution, and retailing components of the
sector and applying various reforms to each of these. Generation was opened to competition
(with transmission and distribution still considered natural monopolies), and prices, entry
and exit were deregulated. Retail reforms allowed consumers to choose between competing
suppliers. Overviews of the economic and political arguments motivating electricity deregula-
tion, the various forms deregulation could take, and the ex-ante concerns about deregulation
can be found in Joskow (1997) and White (1996). As of 2010, fifteen states and the District
of Columbia had restructured their electricity sector.
Divestiture refers to the process whereby utilities transfer generation assets to unregulated
companies. This can refer to either transfer to an unregulated subsidiary of the regulated
utility or sale to an independent power producer. In some states, this was required by
legislation, to prevent market power following deregulation. For nuclear power reactors, this
entry into competitive wholesale markets is the main component of deregulation expected
to affect operations.
The main economic argument for generation deregulation was to increase efficiency and
lower costs. Efficiency gains with deregulation are generally thought to come from aligning
incentives vis-a-vis input choices, as in the Averch and Johnson (1962) model, described
below, or from correcting agency problems, as in the Laffont and Tirole (1986) model. For
overviews of these models and their extensions, see Baron (1989) and Kahn (1988). There is
robust empirical evidence of efficiency gains at power plants in the U.S. following deregulation
(Fabrizio, Rose, and Wolfram 2007, Zhang 2007, and Davis and Wolfram 2012).
An important assumption in the modeling and empirical sections of this paper is that
electricity deregulation was exogenous to nuclear power plant performance. The rationale for
this assumption is that divestiture was tied very closely to state-level electricity deregulation,
which was driven by a host of political and economic factors (Ando and Palmer 1998). Past
5

Corporate Incentives and Nuclear Safety C. Hausman
nuclear power plant construction certainly was one motivator for deregulation, through the
“stranded costs” problem. Since electricity prices were set at average rather than marginal
cost, historical nuclear construction led to regulated electricity rates that were much higher
than wholesale prices. Thus states with high historical nuclear fixed costs may have been
more likely to deregulate (Joskow 1997, Griffin and Puller 2005). Davis and Wolfram (2012)
find a slightly higher construction cost for plants that were eventually divested, however the
difference is small (4 percent) and not statistically significant. Moreover, any difference in
past nuclear construction costs should be time-invariant, and as such can be controlled for
in empirical specifications with fixed effects. To my knowledge, poor nuclear safety records
did not play a role in electricity restructuring.
Note that the impact of divestiture should be interpreted as including two endogenous
features. First, it is possible that a utility seeking to sell its nuclear reactor would invest in
plant improvements prior to the sale. This is particularly likely at poor performers, which
utilities might be afraid they would be unable to sell. Second, while the act of divestiture
may be exogenous to plant characteristics and performance, which company buys the plant
is not exogenous. That is, there were several companies that purchased divested reactors,
and they likely sorted on plant characteristics. Neither feature of deregulation affects the
validity of the empirical estimation in this paper, but rather the mechanisms through which
the impact of divestiture operates.
2.2 Nuclear Power
There are currently 65 nuclear power plants in the U.S., accounting for 10 percent of total
electric capacity. Because nuclear power plants are “baseload,” meaning that they run
around the clock, they contribute 20 percent of total electricity generation (NRC 2010).
Most of the nuclear plants in the U.S. have multiple reactors, and there are currently 104
operating reactors. Of the 65 plants, 29 have one operating reactor, 33 have two, and 3 have
3 reactors each. Design capacity ranges from 470 to 1304 megawatts.6 There are two types of
reactors in the United States, pressurized-water reactors (PWRs) and boiling-water reactors
(BWRs), made by four companies: Babcock & Wilcox Co (B&W), Combustion Engineering,
Inc. (CE), General Electric Co. (GE) and Westinghouse Corp. In both types of reactor,
fuel assemblies containing enriched uranium create heat, which then produces steam to turn
a turbine.
Nuclear power plants have both advantages and disadvantages relative to fossil fuels
6Here and throughout this paper, capacity refers to megawatts-electrical. Capacity can be measured inMWe (megawatts-electrical) or MWt (megawatts-thermal). The difference between the two arises from theloss of energy through waste heat.
6

Corporate Incentives and Nuclear Safety C. Hausman
plants. Once a nuclear power plant is built, its marginal costs are low.7 Furthermore, it
emits no carbon dioxide. Nuclear power also has advantages over alternative energies such
as wind and solar, as it is not intermittent. Also, it can theoretically be built in areas where
wind and solar are cost ineffective and hydroelectric resources are unavailable. However,
nuclear power has several large disadvantages. Plants are expensive to build, so the levelized
cost of nuclear power may be higher than that of fossil fuel plants (Davis 2012). Accidents at
nuclear power plants can be catastrophic, and the public has been understandably wary in the
wake of the events at Three Mile Island (in 1979), Chernobyl (in 1986), and Fukushima (in
2011). An additional concern is the potential for terrorists to acquire radioactive materials
or attack U.S. nuclear sites. Finally, one of the main issues raised by environmentalists is the
treatment, storage, and transport of spent nuclear fuel. The U.S. currently has no national
program to deal with nuclear waste; neither does it reuse spent fuel. Spent fuel assemblies
are generally stored in pools at power plants, but some plants have reached their capacity
for storing spent fuel in pools. Additional storage is available in dry casks at power plants
or at separate storage facilities. As of 2009, approximately 60,000 metric tons of spent fuel
were stored at power plants (NRC 2010).
Nuclear power plant safety is regulated in the U.S. by the Nuclear Regulatory Commis-
sion (NRC), a government agency. The NRC also regulates nuclear research facilities and
radioactive waste. It is responsible for licensing and inspections. The NRC has the ability
to require unsafe plants to shut down; it can also apply fines for safety violations. The NRC
does not appear to enforce its safety regulations differentially between price-regulated and
divested plants.8
Incentives for safety may be affected by liability insurance, which is highly regulated.
Both investor-owned utilities and independent power producers are regulated according to
the Price-Anderson Act (PAA). The PAA has a three-tiered liability system for all facili-
ties. Nuclear power operating companies are required to purchase the maximum insurance
coverage available in the private market, $375 million annually as of 2010. The second tier
is a joint pool; companies are required to pay retrospective premiums in the event of an
accident. Companies must prove to the NRC that they will be able to make these payments
by, for instance, posting a bond. Retrospective payment is currently set at approximately
$112 million per reactor per incident. The federal government is responsible for all payments
7According to the EIA’s Electric Power Annual (EIA 2011), variable costs (including operating, mainte-nance, and fuel) were 2.17 cents per kilowatt-hour for nuclear plants and 4.05 for fossil-steam plants. Fornuclear plants, operating and maintenance costs represent the majority of variable costs; for fossil-steamplants, fuel costs are the largest portion.
8See, e.g., the NRC’s policy statement in the Federal Register regarding electricity market restructuring:“Final Policy Statement on the Restructuring and Economic Deregulation of the Electric Utility Industry.”Federal Register 62:160 (19 August 1997): 44071-44078.
7
Corporate Incentives and Nuclear Safety C. Hausman
above this primary and secondary coverage. The Price-Anderson Act covers liability claims
but not on-site damages; the NRC separately requires companies to maintain funds for these
damages.
2.3 Incentives and Safety
To provide context for the empirical results that follow, I discuss the incentives for safety
faced by nuclear power plants; a formal derivation of this model is given in Appendix 1. Most
of the costs of a nuclear power plant are fixed and are incurred at the time of construction.
The plants’ marginal cost is much lower than the market price of electricity generation,
which is determined by the marginal cost of the marginal plant.9 According to a recent
Energy Information Administration report (EIA 2011), variable costs are 2.17 cents per
kilowatt-hour for nuclear plants and 4.05 for fossil-fuel steam plants. As such, even when
demand is very low, nuclear plants can earn large operating profits. Thus they generally
run continuously except for outages related to repairs and refueling.10 Any outages, planned
or unplanned, lead to large losses of operating profits.11 Maintenance decisions are thus,
in part, a trade-off between incurring downtime for plant repairs and preventing unplanned
outages. This trade-off is less relevant if maintenance can be conducted while the plant is
still generating.
Consider a profit-maximizing plant choosing a level of maintenance, which affects either
reliability (i.e., avoiding unplanned outages), safety, or both. The costs of unreliability are
private (limited to lost revenues for the plant) while safety costs are social (representing
risk to the general public).12 In many cases, the maintenance that reduces outages has
complementarities with safety (MIT 2003). The firm chooses the level of maintenance that
equates private marginal benefits (e.g., avoiding unplanned outages) with private marginal
costs (maintenance costs as well as foregone revenues if the plant must be down for repairs).
Since not all safety costs are internalized, the firm chooses a lower level of safety maintenance
than is socially optimal. Furthermore, if the same maintenance improves both reliability and
9For representative supply and demand curves showing nuclear marginal costs compared to fossil fuelcosts, see Griffin and Puller (2005).
10Vary rarely, nuclear plants are asked to reduce generation to preserve stability on the electrical grid.11There is potential for the owner of a nuclear power plant to use outages to exercise market power, if it
owns other generators. However, if the other generators have higher marginal costs than the nuclear plant,exercising market power by shutting down the nuclear plant is not the first-best strategy of the firm. Rather,the firm would take the higher cost plant offline. Moreover, if the nuclear power plant has a firm contract tosell, the owner will be required to purchase replacement power when the plant is down. Since the replacementpower is more costly than the nuclear plant’s generation, the firm has no incentive to exercise market powerby taking the nuclear plant offline.
12Indeed, liability for nuclear power plants is capped in the U.S. under the Price-Anderson Act describedin section 2.2.
8

Corporate Incentives and Nuclear Safety C. Hausman
safety, the sub-optimal level of maintenance leads to socially sub-optimal levels of both relia-
bility and safety. If, however, reliability maintenance and safety maintenance are unrelated,
the firm will choose the socially optimal level of reliability but a sub-optimal level of safety.
The incentives are less clear under rate of return regulation. As described in section 2.1,
prices in regulated electricity markets are set by local public utilities commissions (PUCs)
so that monopoly utilities recover their costs. Accordingly, variable costs are passed on to
rate payers, and utilities are additionally allowed a fair rate-of-return on their fixed costs. If
the regulatory compact is that the utilities commission will allow the utility to pass on all
costs to consumers, then the regulated plant has no incentive to minimize costs. In practice
regulation usually involves some incentives for generators, but utilities are typically able to
pass on to consumers a greater portion of their costs than are independent power producers.13
In regulated environments, when a nuclear power plant is not generating, the utility will
substitute with a more expensive plant (for instance, natural gas-fired), and then pass on
this higher generation cost to its customers. Thus the incentives to avoid unplanned outages
may be lower at a plant operating under rate-of-return regulation. In the short term, this
is mitigated by the ability of the regulated plant to pass on its maintenance costs. In the
long term, however, a deregulated plant may have a greater incentive to improve technical
efficiency to lower maintenance costs.
As described in section 2.1, a key argument for electricity deregulation was to increase
efficiency by aligning cost incentives and correcting agency problems. Davis and Wolfram
(2012) find that reactors are available to generate for a significantly higher percentage of
the time following divestiture. This improved operating efficiency appears to have come
in the form of shorter refueling outages, enabled by changes in management practices.14
One newspaper article describes Entergy, one of the larger owners of divested plants, flying
a specialist and his equipment on the company jet from one reactor to another to fix an
electrical generator.15
13For instance, a 1996 New York Times article cited one consultant to utility regulators as saying “[t]he oldregime was a regulatory compact... a company with higher costs simply built that into the rate structure”(Johnson, Kirk. 1996. “For Nuclear Power Plant, Bottom Line Is Death Knell.” New York Times, October11). The president of Entergy was quoted in 2001 as saying (Wall Street Journal, September 17), “[w]henyou’ve got hundreds of millions invested – and no regulators or fuel-adjustor clauses, just the competitivemarketplace – you must make all your decisions toward the middle of the road and away from the shoulders...As a prudent business matter, you simply cannot risk a long shutdown costing a million dollars a day in lostrevenue while all your expenses go on.”
14For instance, one article described how “America’s deregulation of wholesale power markets put a painfulsqueeze on the country’s dozens of nuclear plants, many of which were run as one-shot investments byincompetent local utilities. That is rapidly changing thanks to a flurry of mergers and joint ventures thatis consolidating the industry into the hands of serious managers.” Source: Vaitheeswaran, Vijay. 2004. “ANuclear Renaissance?” Wall Street Journal, March 30.
15Wald, Matthew L. 2001. “Despite Fear, Deregulation Leaves Nuclear Reactors Working Harder, Longer
9

Corporate Incentives and Nuclear Safety C. Hausman
Where practices that improve reliability also improve safety, divested plants may have
similarly improved safety records. For instance, unplanned outages and power changes, which
represent both reliability and safety costs, might be expected to fall following divestiture.
This possibility is explored in the empirical section of this paper. On the other hand, safety
incidents that do not affect plant reliability may not fall after divestiture. In the case where
safety and reliability are uncorrelated, the effect of divestiture on safety will depend on
whether the divested plant internalizes more or less of the cost of a safety event. Liability
under the Price-Anderson Act does not differentiate between plants owned by investor-owned
utilities and those owned by independent power producers. However, divested plants could
internalize more or less of the cost of a safety event if, for instance, they are subject to
a differential level of public scrutiny following an accident or place differential value on
reputation.16
As described in section 2, the Nuclear Regulatory Commission regulates nuclear safety
in the U.S. With perfect information and regulatory oversight, the socially optimal level of
safety could be achieved in both the price-regulated and competitive generation markets.
Note that there is still room for safety to improve following divestiture: if divested plants
attain greater technical efficiency because of the alignment of cost incentives for reliability,
the socially optimal level of maintenance would be higher.
In addition to the framework I present here, two theoretical models could be applied under
price regulation: (1) the Averch-Johnson (1962) model, in which firms over-invest in capital,
and (2) agency models, such as Laffont and Tirole (1986), in which firms exert sub-optimal
levels of effort. Averch and Johnson show that plants under rate-of-return regulation over-
invest in capital relative to labor. The intuition is simple; under rate-of-return regulation,
a firm’s profits are a function of its capital investments. If the allowed rate-of-return on
investment is higher than the firm’s cost of capital, the firm over-invests in capital relative
to labor. The Averch-Johnson effect may explain the construction of nuclear power plants,
but it is likely not relevant in the operation of nuclear plants. A long history of cost overruns
in nuclear power plant construction meant that many local regulators were wary of approving
further capital expenditures (Joskow and Schmalensee 1986).
Fabrizio et al. (2007) cite agency models in explaining why deregulation may improve
operating efficiency at thermal power plants. In agency models such as Laffont and Tirole
(1986), efforts to run a firm efficiently by reducing costs provides some disutility to the
firm’s manager. The regulator fails to compensate the manager for this disutility, perhaps
and Safer.” New York Times, February 18.16The empirical portion of this paper examines whether consolidation affected safety records: companies
that own many plants may internalize more safety costs if an incident at one plant leads to scrutiny at allplants.
10

Corporate Incentives and Nuclear Safety C. Hausman
because effort is unobservable or unverifiable, so the manager exerts less effort than is socially
optimal. For nuclear plants, efforts to maintain reliability and safety are unobservable to
public utilities commissions, since outages and accidents are stochastic. A manager could
exert minimal effort while blaming outages and accidents on bad luck. In the case of nuclear
plants this is likely mitigated by an aversion on the part of both the manager and the public
utilities commission to the public scrutiny that follows extended outages or severe accidents.
In that case, managers would be more willing to exert effort to maintain safety and reliability,
and regulators would be less willing to treat outages and accidents as bad luck. Finally, an
argument similar to that made by Laffont and Tirole is made by Kahn (1988); he points out
that utilities that are lax about cost reductions and other efficiency gains may not engage
in cross-firm cooperation.
Overall, the impact of divestiture on plant safety is theoretically ambiguous. It depends
crucially on a number of issues, including (1) whether state regulators allowed the monopoly
utility prior to divestiture to pass on maintenance costs and/or replacement power costs;
(2) whether maintenance for reliability has additional safety benefits; (3) whether divested
plants internalize more or less of the cost of safety events; and (4) the level of federal17 safety
regulations. Since many of these factors are unobservable, I next turn to empirical evidence
of the effect of divestiture.
3 Data
3.1 Power Plant Safety
For the empirical analysis, I compile data on a variety of risks to nuclear plants. The Nuclear
Regulatory Commission (NRC) tracks a number of safety measures for all reactors in the
United States. Reactor operators are required, under the Code of Federal Regulations (10
C.F.R. §50), to provide reports to the NRC following any shutdown, deviation from technical
specifications, or event resulting in degraded plant safety. These licensee event reports
contain information by date and by plant on the specific event or condition involved, including
narrative descriptions. These are publicly available from the NRC. Additionally, the NRC
performs regular plant inspections. These can involve inspectors permanently stationed
at the plant, regional inspectors, and inspectors for specific areas such as health physics
or security. Inspections may involve reviewing records, observing drills and simulations,
observing maintenance procedures, and testing equipment. Results are made public by the
17All safety regulations are administered at the federal level. However, public scrutiny may vary acrossstates.
11

Corporate Incentives and Nuclear Safety C. Hausman
NRC.
The NRC additionally synthesizes and publishes data on safety measures of particular
interest for this study:
• initiating events, including unplanned outages and power changes
• fires
• worker radiation exposure
• escalated enforcement actions, including orders and fines
Data are available since 1988 on initiating events in the report “Rates of Initiating Events at
U.S. Nuclear Power Plants 1988–2010.” All scrams (or trips), which are unplanned outages,
are categorized as initiating events. Unplanned power changes that are not scrams are also
categorized as initiating events. Each initiating event is assigned to one of 16 categories,
such as “stuck open safety relief valve” or “loss of feedwater.” The advantage of analyzing
initiating events is that they represent a significant portion of the internal risk to plants
(Eide, Rasmuson, and Atwood 2005). Since initiating events correspond to unplanned loss
of power (either total loss of power, as in a scram, or partial loss of power), these are events
in which reliability maintenance overlaps with safety maintenance.
I also analyze fires, a safety event of particular interest to the NRC, for which I have data
since 1990. The NRC dataset, “Fire Events Data from Licensee Event Reports,” gives the
original source document citation, the event date, the plant’s mode at the time of the fire
(e.g., power operating, refueling), operating capacity on the date of the fire, the physical area
involved, (e.g., turbine building versus auxiliary building), and whether an alert was declared
(either because more than 15 minutes were required to extinguish the fire, or because the fire
affected the safety systems need for plant shutdown). Following a fire at the Browns Ferry
plant in 1975,18 the NRC revised fire regulations. The NRC now performs fire inspections on
a regular basis and analyzes fire events for national trends. However, as recently as 2008, the
Government Accountability Office (GAO) released a report calling for stricter regulations.
The consequences of a fire depend on both where the fire starts (for instance, whether it is
close to the reactor building), and on how rapidly the fire can be extinguished. According to
the GAO (2008) report, “[t]he most commonly reported cause of fires was electrical followed
by maintenance-related causes and the ignition of oil-based lubricants or coolant. Although
13 fires were classified as significant alerts, and some of these fires damaged or destroyed
unit equipment, NRC officials stated that none of these fires degraded units’ safe shutdown
18This fire was caused by a worker checking for air leaks with a lit candle. The fire caused extensivedamage, including to emergency core cooling systems.
12

Corporate Incentives and Nuclear Safety C. Hausman
capabilities or resulted in damage to nuclear units’ core or containment buildings” (p 4).
The report concluded that the NRC still needs to resolve several long-standing issues.
Additionally, I observe annual radiation exposure to individuals at the plant since 1974,
using data from the NRC’s “Occupational Radiation Exposure at Commercial Nuclear Power
Reactors and Other Facilities (NUREG-0713).” Plants are required to report the radiation
exposure of each monitored worker to the NRC, which reviews radiation control and mon-
itoring during its regular plant inspections.19 Monitoring procedures vary over time, but
details of the regulation are given by 10 C.F.R. §20, “Standards for Protection against Ra-
diation,” which describes the “as low as (is) reasonably achievable” guidelines for radiation
doses. Since the number of individuals could systematically vary across time (for instance,
if divested plants employ fewer people), I analyze two separate measures. The first is collec-
tive worker radiation exposure, which sums exposure across all people; the second is average
worker radiation exposure, which normalizes by the number of individuals monitored.20 Data
are at the annual facility level, in contrast to the other measures. Reporting procedures at
plants with both operational reactors and permanently shut-down reactors vary: at some fa-
cilities, radiation exposure is reported separately for each reactor, whereas at some facilities
they are reported in a combined measure. I drop observations that combine operational and
permanently shut-down reactors (Browns Ferry for all years, Dresden for all years, Indian
Point 2 prior to 2004, San Onofre prior to 1999, and Three Mile Island for all years).
A final measure of interest for safety is on “escalated enforcement,” and is available in
the form of NRC dataset “Escalated Enforcement Actions Issued to Reactor Licensees.”
This tracks, since 1996, the notices of violation and penalties the NRC has imposed on
reactors,21 ranked according to severity level. It is part of the NRC’s enforcement program,
which focuses on compliance with regulatory requirements and identification and correction
of violations. Three sanctions are possible: notices of violation (NOVs), civil penalties (i.e.,
monetary fines), and orders (e.g., to suspend operations). Minor violations are documented,
but the lowest level of violations are not part of the “escalated enforcement” program.22 For
each case, the NRC publicly posts the violation type (NOV and/or order) and severity, the
amount of any civil penalty, the date issued, and a short description. This measure tends to
19For instance, a 2003 inspection report for Beaver Valley described NRC review of personnel dosimeters;frisking instruments; radiation portal monitors; protective clothing and self-contained breathing apparatus;radiological work permits; and daily health physics status meetings.
20The collective exposure measure, summing across workers, may be the most relevant measure of overallexposure. If, however, there are nonlinearities in the dose response function, then the average exposure forindividual workers is also of interest.
21For plants with multiple reactors, notices of violation and penalties may refer to only one reactor, butmore commonly refer to all the reactors at the plant.
22Additional information on the enforcement process is available in the NRC Enforcement Manual on theNRC website.
13

Corporate Incentives and Nuclear Safety C. Hausman
lead to public scrutiny; the NRC may call a public meeting or issue a press release, and the
violations are often reported by the media.23
3.2 Generation and Divestitures
Generation data are from the U.S. Department of Energy, Energy Information Administra-
tion (EIA) Power Plant Report (EIA-923). This survey (previously published as the EIA-906
and EIA-759 reports) provides monthly net generation in megawatt-hours for each nuclear
reactor. I include only reactors operating as of January 1, 2000; this excludes a few reactors
that were closed during the 1980s and 1990s.24 To calculate capacity factor, I normalize gen-
eration by reactor design capacity. Reactor design capacity is from the EIA “Nuclear Power
Generation and Fuel Cycle Report 1997, Appendix C: Nuclear Units Ordered in the United
States, 1953-1996.” Divestiture dates are from Davis and Wolfram (2012); they compile the
dates from the EIA and cross-check them against SEC filings.
3.3 Summary Statistics and Pre-Treatment Observables
Table 1 gives summary statistics on the five safety measures of interest plus generation and
capacity factor for all 103 power reactors used in my analysis.25 The average reactor has
slightly fewer than one initiating event per year. Fires are quite rare. Worker radiation
exposure averages 116 person-REMs per year. In 2008, this corresponded to roughly 1,300
workers per facility with an average dose of 0.1 rem and a maximum dose of 0.2 rem; for
comparison, the average person in the U.S. receives 0.3 rem from background sources of
radiation and 0.3 rem from man-made sources (NCRP 2009). The average unit has one
escalated enforcement intervention every two years, while producing over 7 million MWh of
electricity. The average capacity factor was 88 percent. Note that capacity factors can be
negative, since generation measured is net, rather than gross. It can also be greater than 100
percent, because of uprates that allow the unit to produce more generation than the initial
design allowed.
To examine the potential for selection bias, table 2 shows mean values for each variable
by the reactors’ eventual divestiture status. Data are from 1996-1998; 1996 is the first year
for which all safety measures are available, and 1998 is the last year in which no plants
23See, e.g., Whitaker, Barbara. 2007. “Indian Point Guard Slept on Job, N.R.C. Says.” New York Times,September 2.
24Most of these reactors were small and experimental. Exceptions include Browns Ferry 1, Millstone 1,and San Onofre 1.
25There are currently 104 reactors in operation. For the empirical section of this paper, I drop BrownsFerry 1. This reactor was shut down from 1985 to 2007, and re-opened only following substantial investment.
14

Corporate Incentives and Nuclear Safety C. Hausman
are divested. Panel A shows that the safety measures are not statistically different at the
5 percent level between the plants that later divest and those that do not. Panel B shows
that reliability measures are statistically different at the 1 percent level; plants that were
later divested have substantially lower generation levels and capacity factors. As Davis and
Wolfram (2012) discuss, reactors that were later divested had much lower generation in the
late 1990s, which is explained by several long outages at a few plants.
Finally, panel C examines differences in observable fixed reactor characteristics. There
is a statistically significant difference in the proportion of boiling water reactors (BWRs)
divested versus pressurized water reactors (PWRs). As such, I will test whether the effect
of divestiture is robust to considering each type separately. There is no significant difference
in age, capacity, number of reactors at each plant, or manufacturer (with the exception of
reactors made by General Electric). There is a difference in the location of the divested
facilities; this is not surprising, given the regional differences in deregulation patterns. To
address concerns about selection bias, I later examine the robustness of the main results to
excluding certain states and regions.
4 Empirical Evidence
4.1 Graphical Analysis
As a first pass, I plot unsafe events across time for a set of divested reactors against a set
of control reactors. Figure 1 shows the sum of the three count variables (initiating events,
fires, and escalated enforcement)26 for fourteen “case” reactors divested in 2001 to Exelon27
compared to all “control” reactors that were never divested. These “case” reactors (two
reactors each at the Braidwood, Byron, Dresden, La Salle, Limerick, Peach Bottom, and
Quad Cities plants) are chosen because they share a divestiture date of January 1, 2001 and
thus can be shown easily on one graph; evidence for all divested reactors follows. Several
features of the graph are worth noting. First, the number of incidents has declined across
time. Second, the trajectory at the plants that eventually divested appears indistinguishable
from the control plants in the pre-period. Finally, the number of incidents at the Exelon
plants has declined since divestiture relative to the control plants.
26Summing across the three variables is an imperfect measure, since some double-counting is involved. Forinstance, a fire may set off an initiating event, or a severe initiating event may trigger escalated enforcementactions. As such, this measure is meant merely to serve as an illustration. The empirical analysis that followsconsiders each variable separately.
27These reactors were previously owned by either Commonwealth Edison Company or Philadelphia ElectricCompany. These two companies merged in 2000 to form Exelon, which now operates these reactors and threeothers in competitive markets.
15

Corporate Incentives and Nuclear Safety C. Hausman
Next, I plot an event study graph of the effect of divestiture on each safety measure
at the quarterly level for all plants, intended to motivate the regressions that follow. This
plot has the advantage of allowing me to examine pre-treatment trends in the number of
unsafe events. While table 2 showed no difference in the pre-divestiture mean levels of unsafe
events, this plot looks more flexibly at trends. Specifically, I plot the coefficients βj from the
following regression:
eventi,t =32∑
j=−19
βj · 1[τi,t = j]i,t + vt + εi,t
where τi,t denotes the quarter relative to divestiture, with τi,−19 denoting nineteen quarters
prior to divestiture, τi,0 denoting the quarter of divestiture, etc. The dummy variables
vt are quarter-of-sample effects. Thus the plotted coefficients βj compare case reactors
to the control reactors that never divest, net of time effects. The time effects play an
important role, as unsafe events have generally been trending down; not including them
would thus overstate the effect of divestiture. Figure 2 shows this for the sum of the three
count variables: initiating events, fires, and escalated enforcement.28 The figure additionally
shows the pre-divestiture and post-divestiture means (1j
∑j=−1j=−19 βj and 1
j
∑j=32j=1 βj) in dashed
grey lines. There is a decrease in incidents following divestiture, although it is smaller than
the quarterly noise. The effect is not immediate, implying that there may be an adjustment
period following divestiture, or there may be learning over time at divested units. The
variance in the measure appears to decrease following divestiture; this is likely a direct
implication of the count nature of the data. For a Poisson process, any reduction in the
mean will also imply a reduction in the variance.
Overall, the graphical evidence indicates that divestiture had a small negative effect on
the quarterly count of safety incidents. The effect is delayed and may have a downward trend,
indicating either slow adjustment, learning over time, or both. The effect of divestiture is
small relative to the noise. However, noise decreases in the post-divestiture period.
4.2 Regression Analysis
I next provide formal tests of the effect of divestiture on safety. Since initiating events, fires,
and escalated enforcement are count variables with a large number of zero observations, OLS
is not expected to perform well. Accordingly, I begin with a standard count specification,
the Poisson regression with fixed effects. The probability of a given number of events yi,t
occurring in a year is
28Figures A.1-A.3 in Appendix 2 show the coefficients for each individual type of event.
16

Corporate Incentives and Nuclear Safety C. Hausman
Pr(yi,t|xit) =exp{− exp(xitB)}{exp(xitB)}yit
yit!(1)
with xitB = β ·divesti,t+αi+vt+εi,t and yit = 0, 1, 2... Here, divesti,t is a divestiture dummy,
αi is a reactor fixed effect, and vt is a set of year effects. Standard errors are bootstrapped
with 500 repetitions and clustered by reactor to account for arbitrary dependence across
years.29 The fixed effects αi are an important feature of this model; in addition to flexibly
controlling for unobserved characteristics, they help alleviate the overdispersion problem in
Poisson models. The Poisson process assumes equality of the mean and variance, whereas
in empirical settings the variance is often larger than the mean. This overdispersion leads
to faulty inference (Type I error), with the null hypothesis rejected when it should not be.
Fixed effects partially alleviate the problem by requiring only that the mean and variance
be equal within groups, thus allowing for greater heterogeneity.
For specifications using radiation exposure, OLS regressions are used since radiation
exposure is a continuous variable. These data are collected by plant rather than reactor, so
I include facility fixed effects
eventi,t = β · divesti,t + αi + vt + εi,t (2)
One limitation of the estimates given in the previous two equations is that they are for
the net effect of divestiture on safety, and are composed of two effects: the direct effect of
divestiture plus an indirect effect through generation. That is, since the plants are operating
for a greater percentage of the time, they may be more exposed to unsafe events. Hence
an alternative outcome of interest is not the overall effect on safety, but rather the effect
on the number of unsafe events for a given level of generation. One way to allow for this
possibility empirically is to scale the safety variables by capacity factor (realized generation
as a percent of total possible generation) in each year; this is analogous to the engineering
analyses that scale by reactor critical-years. This approach is not feasible at a monthly level;
noise is introduced by large outliers in months when unsafe events occur despite very low
capacity factors. These outliers can occur, for instance, if an unsafe event occurs early in
the month and is then followed by an extended outage. Regressions at the annual level
largely alleviate this problem; they smooth across months with low capacity factors. As
such, all regressions are run at the annual level. For the results shown, I have dropped the
approximately thirty observations for which capacity factor is less than 0.01. For the count
variables, the normalization is accomplished by including capacity factor as an exposure
29Alternatively, one could cluster at the plant level. This increases the standard errors somewhat but doesnot generally change inference. Estimates of these standard errors are shown in appendix table A.1.
17

Corporate Incentives and Nuclear Safety C. Hausman
variable (i.e., as a regressor, with the coefficient on the logged variable equal to 1) in the
Poisson specification. For the continuous variables, the left-hand side variable is divided by
capacity factor.
Results for both normalized and non-normalized outcome variables are given in table 3.
Panel A shows the total effect of divestiture on safety, whereas panel B shows the effect
for a given capacity factor. To compare the magnitude in the OLS specifications with the
magnitude in the count specifications, I have shown the percentage change in the expected
number of counts attributable to divestiture for all regressions.30 For all five of the safety
measures, the coefficient on divestiture is negative in panel A. For initiating events, the coef-
ficient is -0.18; for fires, the coefficient is -0.62; and for escalated enforcement, the coefficient
is -0.35. For collective worker radiation exposure, divestiture is associated with a drop of
42 person-rems; average exposure drops by 0.03 rems. While the point estimates are not
precisely estimated, the magnitude of the coefficient is economically significant for all five
measures. For initiating events, for instance, divestiture leads to a 16 percent reduction in
the expected monthly event count. For fires, the change is -46 percent, and for escalated
enforcement the change is -29 percent. Furthermore, some moderate positive effects can be
ruled out at the 5 percent level: for initiating events, the upper bound of the 95 percent
confidence interval is 0.07; for escalated enforcement, it is 0.04.
When the dependent variable is scaled by capacity factor (panel B), the coefficient on
divestiture is more negative. Divestiture leads to a 27 percent change in initiating events
for a given capacity factor, and the coefficient is statistically significant at the 1% level. For
fires, the change in expected value is 54 percent (significant at the 10 percent level), and for
escalated enforcement, 38 percent (significant at the 5 percent level). For the two worker
radiation exposure variables, the effect is even larger, but it is not precisely estimated.
Overall, it appears that divestitures did not lead to worsened safety records, and they
may have led to some decreases in unsafe events. Moreover, divestitures increased generation,
and controlling for this, safety substantially improved. Both the total effect on safety (when
unscaled by capacity factor) and the effect controlling for generation are of policy interest.
As such, all tables throughout this paper provide estimates for both outcomes.
These results match anecdotal evidence that deregulation led to improved safety. Whereas
the NRC had expressed concerns about plant safety following deregulation, a regional ad-
ministrator said in 2001 that “[m]ost people have gotten the understanding if you do it right
30The percentage change in the expected number of counts is defined as E[yit|dit=1;αi,vt]−E[yit|dit=0;αi,vt]E[yit|dit=0;αi,vt]
.
For the count specifications, E[yit|dit;αi, vt] = exp(β ·divesti,t+αi+vt). Accordingly, the percentage changein the expected number of counts is equal to exp(β) − 1. For the OLS specifications, E[yit|dit;αi, vt] =β · divesti,t + αi + vt. Accordingly, the percentage change in the expected number of counts is equal to
βE[yit|dit=0;αi,vt]
.
18

Corporate Incentives and Nuclear Safety C. Hausman
the first time, and you emphasize safety and managing things better, it has a positive effect
on the bottom line.”31
4.3 Simultaneity between Safety and Generation
Ideally, one would treat the simultaneity between safety and generation as a full system of
equations to estimate the direct effect of divestiture on each. To understand this simultaneity,
consider two cases. First, if a fire occurs in the turbine area, the plant must shut down until
repairs can be made; in this case, unsafe events lead to lower generation. On the other
hand, if a plant shuts down for some exogenous reason, it is less likely to have a fire, because
the turbine is not moving. In this case, increased generation leads to more unsafe events.
Throughout this section, I focus on initiating events and fires, for which this intuition is
most applicable. It is less clear that there is simultaneity between generation and escalated
enforcement (which are the product of a long-term evaluation by the NRC) or between
generation and radiation exposure.
Unfortunately, because I do not observe the generation level at a plant prior to a fire, the
direct effect of generation on safety cannot be observed separately from the direct effect of
safety on generation. While I do observe the total generation for a month, this is conditional
on whether a fire occurred.
The full system of equations is
s = f(d, g,X)
g = k(d, s,X)
Here s is an unsafe event, g is generation, d is a divestiture dummy (the variable of
interest), and X is a vector of exogenous variables. The direct effect of divestiture on each
endogenous varaible cannot be estimated econometrically for this system, unless there is an
instrumental variable for each equation. Unfortunately, there are no credible candidates for
such instruments. Refueling outages, for instance, might affect unsafe events only through
their impact on generation, but refueling outages occur at the same time as other planned
31Source: Wald, Matthew L. 2001. “Despite Fear, Deregulation Leaves Nuclear Reactors Working Harder,Longer and Safer.” New York Times, February 18. The same article gives an example of how Entergy’spractices improved safety: “On one of the occasions Pilgrim shut down, a warning light in the control roomalerted operators to a low oil level in a pump that circulates water in the reactor. . . Longtime employeessay Boston Edison would have done the same, but probably not what Entergy did next: set to work ondesigning a bigger oil reservoir and a more sophisticated monitoring system, so that the plant never has toshut again because of a similar uncertainty.”
19

Corporate Incentives and Nuclear Safety C. Hausman
maintenance, which is certainly correlated with safety.
4.3.1 Calculating the Direct Effect of Divestiture on Safety
However, by making certain assumptions, the direct effect of divestiture on safety can be
calculated from this system. Intuitively, the direct effect of divestiture on unsafe events
could be positive or negative, but divestiture also increases generation, thereby increasing
the exposure of the plant to an event. Then the direct effect on divestiture will be more
negative, or less positive, than the total effect. Consider the total derivative dfdd· 1s
= ∂f∂d·
1s
+(∂f∂g· gs
)·(dgdd· 1g
). We want to know ∂f
∂d, the direct effect, whereas what was estimated
previously was ∂f∂d
, the total effect. Taking the preferred empirical estimate from Davis and
Wolfram (2012), assume that dgdd· 1g
= 0.1; divestiture increases generation by approximately
10 percent. Note that the Davis and Wolfram estimate is also for the total effect, which
includes the indirect effect divestiture on generation through safety. However, the difference
between the direct and total effects in this case are likely small, since unsafe events are
infrequent. Accordingly, assume a direct effect of 10 percent for now; the difference between
the direct and indirect effects are explored below. Also, make the neutral assumption that∂f∂g· gs
= 1; a one percent increase in generation time leads to an expected increase in unsafe
events of one percent.32 Finally, recall that the total effect of divestiture ∂f∂d· 1s
is empirically
estimated to be a reduction of 16 percent for initiating events and 46 percent for fires.33
Then the direct effect of divestiture on unsafe events is calculated to be -0.26 for initiating
events and -0.56 for fires. Thus while divestiture leads to a total effect of a reduction of
16 percent in initiating events, the direct effect is a reduction of 26 percent. The difference
arises from the indirect effect through generation. These results do not change much when
the relationship between generation and unsafe events is allowed to vary. For ∂f∂g· gs
= 0.5,
the direct effect of divestiture is -0.21 for initiating events and -0.51 for fires; for ∂f∂g· gs
= 1.5,
the direct effects are -0.31 and -0.61. Finally, note that these estimates are very similar to
the normalized estimates calculated in the previous section (-0.27 and -0.54).
4.3.2 Calculating the Direct Effect of Divestiture on Generation
A similar exercise can be performed for the effect of divestiture on generation. As described
above, this is likely to be very close to the total effect: there are few unsafe events in any
given month, so the indirect effect of these incidents on generation is likely to be small.
32The elasticity could be smaller if increased generation time allows for built-up expertise. On the otherhand, the elasticity could be larger if there is fatigue, for instance, of employees as generation time increases.
33The relevant statistics from table 3 are not the raw coefficients from each regression, but rather thepercentage change in expected value.
20
Corporate Incentives and Nuclear Safety C. Hausman
Suppose the elasticity of generation with respect to initiating events is -0.016: a one percent
increase in events leads to an expected decrease in generation of 0.016 percent. This assumed
elasticity is derived from (1) noting that initiating events only occur in approximately 10
percent of months, and (2) assuming that an incident leads to five days of lost generation
time, i.e., 13 percent of the month’s generation. Similarly, the elasticity of generation with
respect to fires is -0.002, from noting that fires occur in 0.7 percent of months and assuming
eight days of lost generation time.34 Finally, recall that the total effect of divestiture is
estimated by Davis and Wolfram (2012) to be an increase in generation of 10 percent. Then
the direct effect of divestiture on generation, after accounting for both fires and initiating
events, is calculated to be 9 percent. This is very close to the total effect of 10 percent,
because unsafe events occur fairly infrequently.
4.4 Robustness Checks
Several robustness checks give very similar results (table 4). First, I estimate a condi-
tional negative binomial with fixed effects specification in columns (1), (4), and (7).35 This
specification is sometimes used to further alleviate the overdispersion problem in Poisson
models. However, the Poisson model may be preferred, since the individual effects αi enter
the conditional negative binomial specification only in the variance parameter. That is, this
specification does not allow for heterogeneity in the mean across units (Allison and Water-
man 2002). An alternative version of the negative binomial model is unconditional: the
individual effects αi enter as dummy variables. This can leads to an incidental parameters
problem for short panels, although simulations have found the resulting bias to be small
(Allison and Waterman 2002). Columns (2), (5), and (8) give results for this unconditional
negative binomial model with mean dispersion parameterization.36 All point estimates and
standard errors are very similar to the results given by the Poisson model. Finally, I show
OLS specifications in columns (3), (6), and (9). To compare the magnitude in the OLS
specifications with the magnitude in the count specifications, I show the percentage change
in the expected number of counts attributable to divestiture for all regressions. Overall,
the results are stable to various assumptions on functional form. Accordingly, for all future
regressions using the three count variables, I show results for the Poisson specification.
34I examined daily generation data and descriptions for twenty randomly selected fires and twenty randomlyselected initiating events. The mean number of days with generation below 50 percent of capacity followingthe event was four for initiating events and seven for fires. There were typically a few more days of rampingwith generation levels slightly lower than 100 percent of capacity.
35The fixed-effects negative binomial model begins with a Poisson specification and then assumes the Pois-son parameter follows a gamma(exp(xitB), αi) distribution. This implies that the variance is proportionalto the mean. The αi parameter is allowed to vary by reactor in the fixed-effects specification.
36Results are nearly identical for a constant dispersion parameterization.
21

Corporate Incentives and Nuclear Safety C. Hausman
4.5 Heterogeneity
I next explore whether heterogeneity can also be observed across reactor fixed characteristics
(tables 5a and 5b). I first divide reactors according to type (BWR versus PWR). Since BWR
reactors were more likely to divested, one might worry about either bias from selection or
about external validity. With the exception of the collective worker radiation exposure
equations (column 4), the coefficient on divestiture is not statistically different for BWR
versus PWR reactors. For collective worker radiation exposure, results are sensitive to the
type of reactor considered
I next divide reactors by age, defining newer reactors (51 of 103) as those entering com-
merical operations in 1979 or later. Finally, I divide by design capacity, defining large
reactors (49 of 103) as those with current capacity of at least 1000 MW. Age and size are
not correlated with divestiture (table 2), but heterogeneity in the effect of divestiture does
appear. There is some evidence that newer and larger reactors improved more, particularly
for initiating events and escalated enforcement. The size and age definitions are highly corre-
lated: the majority of newer reactors are large, and the majority of older reactors are small.
As such, there is unfortunately insufficient power to separately test the effects of size and
age.
4.6 State-Level Selection
Next I exclude a series of states to address potential selection concerns. First I exclude
Michigan, where some but not all reactors were divested; in all other states, either all or
none were divested. Second, I exclude California, where fossil fuel plants but not nuclear
plants were divested. Furthermore, one of the nuclear plants (Diablo Canyon) is subject
to strong incentive regulations. Third, I exclude Iowa and Wisconsin, where reactors were
divested but the electricity market was not deregulated. Finally, I exclude the Northeast,
where most divestitures occurred, to see if unobserved regional differences drive the results.37
For all four specifications (tables 6a and 6b), the results are robust. The coefficient on
divestiture is almost always negative, and the magnitudes are largely unchanged from the
main specification. One exception is collective worker radiation exposure, which is sensitive
to excluding the Northeast.
37Interestingly, Northeast Utilities adopted a strategy of cutting costs (in anticipation of deregulation, andprior to any divestitures) that later proved to compromise safety. An L.A. Times article in 1996 described anindustry leader saying that “Northeast Utilities showed the industry how short-term cost-saving measureslead to safety violations and Nuclear Regulatory Commission scrutiny, which adds huge expense even if thenuclear plant keeps operating” (Source: Kraul, Chris. 1996. “Twilight of the Nukes?” Los Angeles Times,October 13).
22

Corporate Incentives and Nuclear Safety C. Hausman
4.7 Spillovers and Consolidation
Narrative evidence suggests that there have been spillovers of safety practices across plants,
including to the companies operating non-divested plants.38 There are several organizations
that facilitate knowledge-sharing across the plants: the World Association of Nuclear Oper-
ators (WANO), the U.S.-based Institute of Nuclear Power Operations (INPO), the Electric
Power Research Institute (EPRI), and EUCG. INPO, for institute, shares best practices re-
garding safety; EUCG shares blinded financial and management strategies with its members.
If the owners of divested plants share their practices with the owners of non-divested plants,
the regression results above will give a lower bound on the overall effect of divestiture. The
control group (non-divested plants) will have been impacted by divestiture, implying a poor
counterfactual. If the control group improves following divestiture, the coefficient on the
divestiture dummy will be smaller than the true effect on the divested plants. Additionally,
the regression results will fail to capture the effect on the non-divested plants. It is not
possible to empirically test for these spillovers across all plants. There is some suggestive
evidence that this has occurred; for instance, safety records have improved nationwide in the
last decade. This could also, however, be the result of other changes, such as more stringent
NRC regulations.
It is possible to look for evidence of one type of spillover: intra-firm spillovers between
divested and non-divested plants. Three companies currently own both divested and non-
divested reactors: Entergy, Dominion, and NextEra (formerly FPL Group). I add a dummy
variable to the main specification, equal to one for each reactor that is not divested but
is owned by one of these three companies (a total of thirteen reactors). These regressions
compare three groups of reactors: divested units, units that were not divested but are owned
by a company with other divested units, and units that were not divested and whose parent
company owns no divested units. Results are given in table 7. The coefficient on divestiture
is similar to the main results for each safety measure. For the co-ownership variable, results
are generally negative in the non-normalized regressions but not significantly different from
zero. For escalated enforcement, the coefficient on the co-ownership variable is economically
significant; it is also statistically different from zero at the 5 percent level for the non-
normalized outcome variable and at the 10 percent level for the normalized outcome variable.
38For instance, a 1999 Wall Street Journal article cited efficiency gains at Arkansas Nuclear One andSequoyah, two non-divested plants. In both cases, companies were moving to doing more maintenance whilethe plants were online. Arkansas Nuclear One cited improved management learned from its sister plantsowned by Entergy (Schiffler, Antje. 1999. “Power Plants Feel Pressure to Cut Outage Time.” Wall StreetJournal, November 15). A 2003 MIT study argued that “[t]he means of improvement [in capacity factors]include independent peer review and the feedback of operating experience at reactor fleets worldwide, sothat all operators become aware of mishaps that occur.”
23

Corporate Incentives and Nuclear Safety C. Hausman
One possible explanation is that operators fear scrutiny at all of their plants if an escalated
enforcement action is taken at one plant.
Note that this regression can only identify spillovers within companies relative to those
across companies. Indeed, if spillovers across companies are as large as spillovers within
companies, this coefficient would be zero. Unfortunately, it is not possible to test for spillovers
across companies.
Similarly, one might expect consolidation to have an effect. In 1996, before electricity
deregulation, there were 44 companies operating the 66 plants in the U.S. In 2009, there were
26 companies operating the same plants in the U.S. Consolidation could improve plant safety
records in a number of ways: through intra-firm spillovers, economies of scale (for instance,
the ability to move maintenance teams from plant to plant), and through reputation effects
(an incident at one plant leading to increased scrutiny at all plants). However, I do not find
evidence for a consolidation effect (table 8). Here the consolidation variable is defined as the
number of other reactors owned by the same company. In these regressions, the coefficient
on divestiture remains negative, and the coefficient on consolidation is approximately zero
in four equations. For collective worker radiation exposure, the coefficient on consolidation
is negative and statistically significant at the 5 percent level in the non-normalized results.
4.8 Learning
There is some evidence that the benefits of divestiture would increase over time, both because
some plant modifications would take time39 and because the companies would learn over
time. The event study graph (figure 2) showed some evidence of a change in the trend of
safety records at divested relative to non-divested plants. Accordingly, I add linear trends
pre- and post-divestiture at divested plants (because of the year effects, there is insufficient
variation to test for national trends at all plants), with results in table 9. The coefficient on
the linear trend is scaled to represent a three-year change. Overall, trends post-divestiture
are negative, consistent with learning.
5 Conclusion
This paper provides empirical evidence on the effects of divestiture on nuclear power plant
safety in the United States. I examine both the total effect of divestiture on safety and
39An Entergy spokesman was cited in 2003 as saying that Entergy was “able to make some fixes quickly,while turning around operations at other units will take more time.” Source: Ryan, Margaret L., TomHarrison, Jenny Weil, Daniel Horner, Elaine Hiruo and Steve Dolley. 2004. “Reports Show Costs PushUpward for U.S. Operators in 2003.” Nucleonics Week 45(39).
24

Corporate Incentives and Nuclear Safety C. Hausman
the effect when controlling for increased generation levels. The total effect is composed of
both the direct effect on safety and an indirect effect. The latter arises from the fact that
generation increased following divestiture, and thus plants may have experienced an increase
in exposure to unsafe events. The total drop in safety incidents is estimated to be 16 percent
for initiating events, 46 percent for fires, and 29 percent for escalated enforcement. While
none of these effects is statistically significant at the 5 percent level, moderate positive effects
can be ruled out at the 5 percent level. A negative effect of divestiture is similarly found
for worker radiation exposure, measured either collectively or on average. When controlling
for generation increases, I find that the direct effect on safety is more negative and more
statistically significant. For a given capacity factor, the drop in safety incidents is estimated
to be 27 percent for initiating events, 54 percent for fires, and 38 percent for escalated
enforcement. Results are also larger, although imprecisely estimated, for worker radiation
exposure.
The results are similar for a number of robustness checks. In addition, I find larger
effects for newer and larger reactors. Matching anecdotal evidence, I find limited evidence
of intra-firm spillovers. However, there is no evidence of an effect of consolidation. Finally,
there is some evidence for learning over time at divested plants.
Several caveats naturally apply. The empirical safety measures that are available may
not be indicative of the risks of catastrophic events. Given the infrequency of large-scale
nuclear accidents, they cannot be examined using the empirical framework presented in this
paper. Also, safety problems that are uncorrelated with generation (such as on-site security
and post-accident preparation) and that develop over longer time horizons (such as spent
fuel storage and plant decommissioning) may worsen following plant divestiture. Future
work could examine testing and preventive maintenance records for evidence on the effect
of divestiture on large-scale and long-term risks. Future work could also extend the model
to incorporate the dynamic choices of firms, as has been done for the literature on capacity
factors at oil refineries (Chesnes 2009).
Overall, this paper speaks to a number of timely issues, including the changing structure
of the electricity industry and the incentives for safety at nuclear power plants. Although
intuition is given throughout this paper for some of the mechanisms at work, theoretical
predictions of the effect of divestitures on plant safety are not possible. As such, an empirical
analysis of the effect is the best evidence available. While the infrequency of unsafe events
at nuclear plants makes precise statistical estimates difficult, the results match anecdotal
evidence. Furthermore, positive effects of moderate magnitude can be ruled out. Finally, the
evidence is strong that for given levels of generation, safety improved following divestiture.
25

Corporate Incentives and Nuclear Safety C. Hausman
References
[1] Allison, Paul D. and Richard P. Waterman. 2002. “Fixed-Effects Negative BinomialRegression Models.” Sociological Methodology 32(1): 247-265.
[2] Ando, Amy W. and Karen L. Palmer. 1998. “Getting on the Map: The Political Econ-omy of State-Level Electricity Restructuring.” RFF Discussion Paper 98-19-REV.
[3] Averch, Harvey and Leland L. Johnson. 1962. “Behavior of the Firm under RegulatoryConstraint.” American Economic Review 52(5): 1052-1069.
[4] Barnett, Arnold and Mary K. Higgins. 1989. “Airline Safety: The Last Decade.” Man-agement Science 35(1): 1-21.
[5] Baron, David P. 1989. “Design of Regulatory Mechanisms and Institutions.” Handbookof Industrial Organization 2(24): 1347-1447.
[6] Borenstein, Severin, James B. Bushnell, and Frank A. Wolak. 2002. “Measuring Mar-ket Inefficiencies in California’s Restructured Wholesale Electricity Market.” AmericanEconomic Review 92(5): 1376-1405.
[7] Bushnell, James B., Erin T. Mansur, and Celeste Saravia. 2009. “Vertical Arrangements,Market Structure, and Competition: An Analysis of Restructured US Electricity Mar-kets.” American Economic Review 98(1): 237-266.
[8] Bushnell, James B. and Catherine Wolfram. 2005. “Ownership Change, Incentives andPlant Efficiency: The Divestiture of U.S. Electric Generation Plants.” CSEM WorkingPaper 140.
[9] Chesnes, Matthew. 2009. “Capacity and Utilization Choice in the U.S. Oil RefiningIndustry.” Working Paper.
[10] David, Paul A., Roland Maude-Griffin, and Geoffrey Rothwell. 1996. “Learning byAccident? Reductions in the Risk of Unplanned Outages in U.S. Nuclear Power PlantsAfter Three Mile Island.” Journal of Risk and Uncertainty 13(2), pp 175-198.
[11] Davis, Lucas W. 2012. “Prospects for U.S. Nuclear Power.” Journal of Economic Per-spectives 26(1): 49-66.
[12] Davis, Lucas W. and Catherine Wolfram. 2012. “Deregulation, Consolidation, and Ef-ficiency: Evidence from U.S. Nuclear Power.” American Economic Journal: AppliedEconomics 4(4): 194-225.
[13] Eide, Steven A., Dale M. Rasmuson, and Corwin L. Atwood. 2005. “Integrated InitiatingEvent Performance Indicator.” Idaho National Laboratory.
[14] Energy Information Adminstration. 2011. Electric Power Annual 2009. Washington,DC: U.S. Department of Energy.
26

Corporate Incentives and Nuclear Safety C. Hausman
[15] Fabrizio, Kira R., Nancy L. Rose, and Catherine D. Wolfram. (2007). “Do MarketsReduce Costs? Assessing the Impact of Regulatory Restructuring on US Electric Gen-eration Efficiency.” American Economic Review 97(4): 1250-1277.
[16] Feinstein, Jonathan S. 1989. “The Safety Regulation of U.S. Nuclear Power Plants: Vi-olations, Inspections, and Abnormal Occurrences” Journal of Political Economy 97(1):115-154.
[17] Fowlie, Meredith. 2010. “Emissions Trading, Electricity Restructuring, and Investmentin Pollution Abatement.” American Economic Review 100(3): 837-869.
[18] Galiani, Sebastian, Paul Gertler, and Ernesto Schargrodsky. 2005. “Water for Life: TheImpact of the Privatization of Water Services on Child Mortality.” Journal of PoliticalEconomy 113(1): 83-120.
[19] Golbe, Devra L. 1986. “Safety and Profits in the Airline Industry.” Journal of IndustrialEconomics 34(3): 305-318.
[20] Government Accountability Office. 2008. “Nuclear Safety: NRC’s Oversight of FireProtection at U.S. Commercial Nuclear Reactor Units Could Be Strengthened.” ReportGAO-08-747. Washington, D.C.: U.S. Government Accountability Office.
[21] Griffin, James M. and Steven L. Puller. 2005. “A Primer on Electricity and the Eco-nomics of Deregulation.” Electricity Deregulation: Choices and Challenges, Griffin andPuller, eds. Chicago: University of Chicago Press.
[22] Hanemann, W. Michael, Per-Olov Johansson, Bengt Kristrom, and Leif Mattsson. 1992.“Natural Resource Damages from Chernobyl.” Environmental and Resource Economics2(5): 523-525.
[23] Joskow, Paul L. 1997. “Restructuring, Competition and Regulatory Reform in the U.S.Electricity Sector.” Journal of Economic Perspectives 11(3): 119-138.
[24] Joskow, Paul L. and Richard Schmalensee. 1986. “Incentive Regulation for ElectricUtilities.” Yale Journal on Regulation 4(1): 1-49.
[25] Kahn, Alfred E. 1988. The Economics of Regulation: Principles and Institutions. MITPress.
[26] Kennet, D. Mark. 1993. “Did Deregulation Affect Aircraft Engine Maintenance? AnEmpirical Policy Analysis.” RAND Journal of Economics 24(4): 542-558.
[27] Laffont, Jean-Jacques and Jean Tirole. 1986. “Using Cost Observation to RegulateFirms.” Journal of Political Economy 94(3): 614-641.
[28] Massachusetts Institute of Technology (MIT). 2003. “The Future of Nuclear Power: AnInterdisciplinary MIT Study.” MIT Energy Initiative.
[29] Massachusetts Institute of Technology (MIT). 2009. “Update of the MIT 2003 Futureof Nuclear Power: An Interdisciplinary MIT Study.” MIT Energy Initiative.
27

Corporate Incentives and Nuclear Safety C. Hausman
[30] National Council on Radiation Protection and Measurements (NCRP). 2009. “IonizingRadiation Exposure of the Population of the United States.” NCRP Report No 160.
[31] Nuclear Regulatory Commission. 2010. “Information Digest.” NUREG-1350, Volume22.
[32] Rose, Nancy L. 1990. “Profitability and Product Quality: Economic Determinants ofAirline Safety Performance.” Journal of Political Economy 98(5): 944-964.
[33] Rothwell, Geoffrey S. 1989. “Stock Market Reaction to Nuclear Reactor Failures.” Con-temporary Policy Issues 7(3): 96-106.
[34] Rust, John and Geoffrey Rothwell. 1995. “Optimal Response to a Shift in RegulatoryRegime: the Case of the US Nuclear Power Industry.” Journal of Applied Econometrics10(S1): S75-S118.
[35] Verma, Kiran, Barry M. Mitnick, and Alfred A. Marcus. 1999. “Making Incentive Sys-tems Work: Incentive Regulation in the Nuclear Power Industry.” Journal of PublicAdministration Research and Theory 9(3): 395-436.
[36] White, Matthew W. 1996. “Power Struggles: Explaining Deregulatory Reforms in Elec-tricity Markets.” Brookings Papers: Microeconomics 201-250.
[37] Zhang, Fan. 2007. “Does Electricity Restructuring Work? Evidence from the U.S. Nu-clear Energy Industry” Journal of Industrial Economics 55(3): 397-418.
28

Corporate Incentives and Nuclear Safety C. Hausman
Figure 1: Effect of Divestiture on Unsafe Events, 14 Case Reactors versus 55Control Reactors
.51
1.5
22.
5
Rea
ctor
−Le
vel C
ount
by
Yea
r
1995 2000 2005 2010Year
Exelon Control
Notes: This figure plots unsafe events at 14 case reactors and 55 control reactors. Unsafe eventsinclude initiating events, fires, and escalated enforcement. The red line shows the date of divestiture for the case reactors. Seven facilities were divested in 2001 and are operated by Exelon: Braidwood, Byron, Dresden, La Salle, Limerick, Peach Bottom, and Quad Cities; eachhas two reactors. Control reactors are all those that were never divested.
Figure 2: Effect of Divestiture on Unsafe Events, Quarterly Event Study
−.4
−.2
0.2
.4
Rea
ctor
−Le
vel C
ount
by
Qua
rter
−20 −10 0 10 20 30Quarter from Divestiture
Notes: This figure plots unsafe events at divested units relative to non−divested units. Time isnormalized relative to divestiture. Unsafe events include initiating events, fires, and escalatedenforcement. The median divestiture is in 2001. Quarter−of−sample effects have been removed.Dashed grey lines show the pre−period and post−period means.
29

Corporate Incentives and Nuclear Safety C. Hausman
Mean Std. Dev. Min Max
Initiating events 0.86 1.07 0 6
Fires 0.07 0.27 0 2
Collective worker radiation exposure (person-rems) 116.04 89.95 1.40 893.01
Average worker radiation exposure (rems) 0.15 0.06 0.01 0.47
Escalated enforcement 0.44 0.78 0 7
Generation (million MWh) 7.27 2.13 -0.12 11.77
Capacity factor 0.88 0.16 -0.01 1.20
Table 1: Annual Reactor-Level Summary Statistics
Notes: Data are for 103 nuclear power reactors operating in the U.S. from 1996-2009. Initiating events, fires, and escalated
enforcement are count variables. Collective worker radiation exposure is measured in person-rems, and average worker
radiation exposure in rems. Both radiation exposure variables are measured at the plant level. For collective exposure, the
numbers in this table are a simple mean across units within the plant. Some plants (e.g., Browns Ferry) are dropped from the
sample because radiation exposure measurements include closed units. Also, data on these variables is only available through
2008. Capacity factor is defined as generation divided by design capacity. Generation is net, not gross, and accordingly can
take on negative values. Capacity factor can similarly be negative. It can also be greater than 1 because of changes to reactor
capacity over time (uprates). N = 1442 for count variables and reliability measures, 1259 for radiation variables.
A. Safety measures:
B. Reliability measures:
30

Corporate Incentives and Nuclear Safety C. Hausman
never
divested later divested t-stat p-value
Initiating events 0.09 0.08 1.14 0.26
Fires 0.007 0.005 0.93 0.35
Collective worker radiation exposure (person-rems) 12.36 13.64 -0.96 0.34
Average worker radiation exposure (rems) 0.02 0.02 -0.79 0.43
Escalated enforcement 0.07 0.08 -1.30 0.19
Net generation (million MWh) 0.58 0.47 11.26 <0.01
Capacity factor 0.82 0.70 10.54 <0.01
Percent PWR 0.78 0.54 2.65 <0.01
Age in 1998 18.36 18.80 -0.34 0.74
Capacity (MWe) 959.67 921.92 0.88 0.38
Number of operating reactors at plant 1.87 1.71 1.48 0.14
Manufacturer:
Babcock & Wilcox 0.09 0.04 0.99 0.33
Combustion Engineering 0.18 0.08 1.46 0.15
General Electric 0.22 0.46 -2.65 <0.01
Westinghouse 0.51 0.42 0.93 0.35
Location:
West 0.15 0.00 2.83 <0.01
Midwest 0.18 0.38 -2.23 0.03
South 0.67 0.13 6.69 <0.01
Northeast 0.00 0.50 -7.34 <0.01
Table 2: Comparing Divested and Non-Divested Nuclear Reactors
Notes: Data are for the 103 nuclear power reactors operating in the U.S. from 1996-1998, by eventual divestiture status:
independent power producers versus regulated investor-owned utilities. Initiating events, fires, and escalated enforcement are
count variables. Collective worker radiation exposure is measured in person-rems, and average worker radiation exposure in
rems. Both radiation exposure variables are measured at the annual plant level, but here are divided by 12 to represent
monthly means. For collective exposure, the numbers in this table are a simple mean across units within the plant. Some plants
(e.g., Browns Ferry) are dropped from the sample because radiation exposure measurements include closed units. Standard
deviation are in parentheses. For the count variables (measured monthly at reactors), N = 1976 for never divested units, 1728
for later divested units. For the radiation exposure variables (measured annually at plants), N = 95 for never divested plants,
87 for later divested plants. One reactor (Watts Bar 1) starts commercial operation during this time.
A. Safety measures:
B. Reliability measures:
C. Reactor characteristics:
31
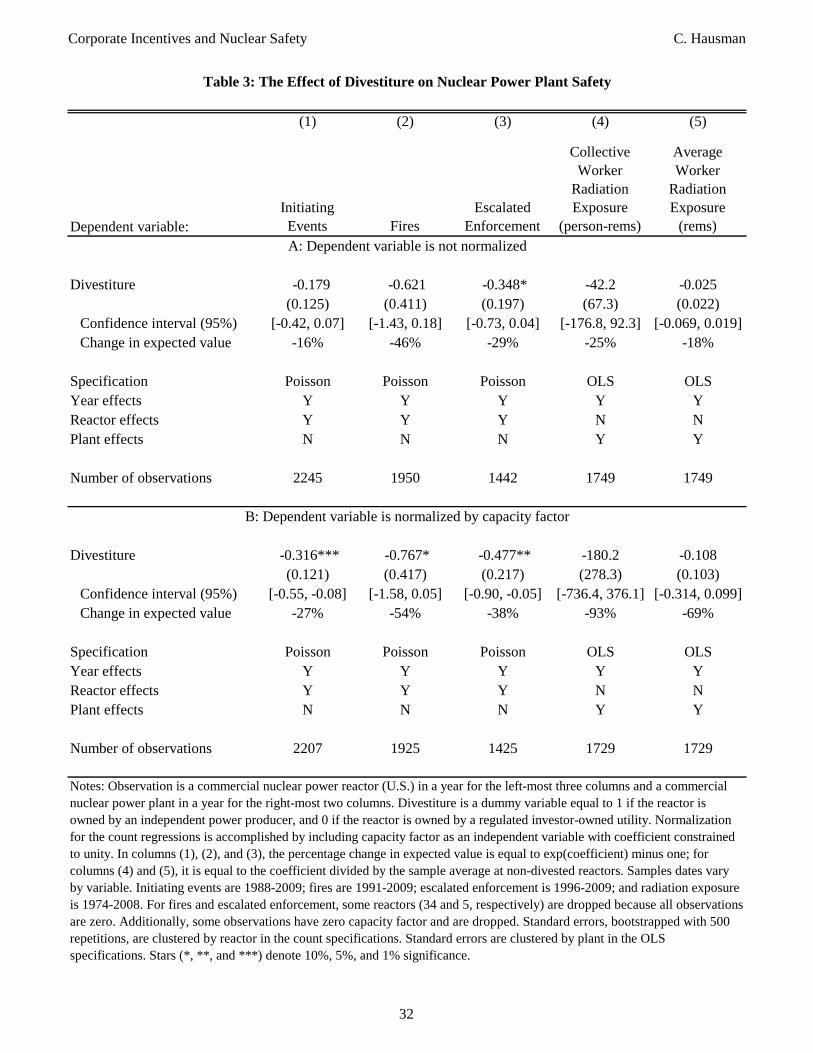
Corporate Incentives and Nuclear Safety C. Hausman
(1) (2) (3) (4) (5)
Dependent variable:
Initiating
Events Fires
Escalated
Enforcement
Collective
Worker
Radiation
Exposure
(person-rems)
Average
Worker
Radiation
Exposure
(rems)
Divestiture -0.179 -0.621 -0.348* -42.2 -0.025
(0.125) (0.411) (0.197) (67.3) (0.022)
Confidence interval (95%) [-0.42, 0.07] [-1.43, 0.18] [-0.73, 0.04] [-176.8, 92.3] [-0.069, 0.019]
Change in expected value -16% -46% -29% -25% -18%
Specification Poisson Poisson Poisson OLS OLS
Year effects Y Y Y Y Y
Reactor effects Y Y Y N N
Plant effects N N N Y Y
Number of observations 2245 1950 1442 1749 1749
Divestiture -0.316*** -0.767* -0.477** -180.2 -0.108
(0.121) (0.417) (0.217) (278.3) (0.103)
Confidence interval (95%) [-0.55, -0.08] [-1.58, 0.05] [-0.90, -0.05] [-736.4, 376.1] [-0.314, 0.099]
Change in expected value -27% -54% -38% -93% -69%
Specification Poisson Poisson Poisson OLS OLS
Year effects Y Y Y Y Y
Reactor effects Y Y Y N N
Plant effects N N N Y Y
Number of observations 2207 1925 1425 1729 1729
Table 3: The Effect of Divestiture on Nuclear Power Plant Safety
Notes: Observation is a commercial nuclear power reactor (U.S.) in a year for the left-most three columns and a commercial
nuclear power plant in a year for the right-most two columns. Divestiture is a dummy variable equal to 1 if the reactor is
owned by an independent power producer, and 0 if the reactor is owned by a regulated investor-owned utility. Normalization
for the count regressions is accomplished by including capacity factor as an independent variable with coefficient constrained
to unity. In columns (1), (2), and (3), the percentage change in expected value is equal to exp(coefficient) minus one; for
columns (4) and (5), it is equal to the coefficient divided by the sample average at non-divested reactors. Samples dates vary
by variable. Initiating events are 1988-2009; fires are 1991-2009; escalated enforcement is 1996-2009; and radiation exposure
is 1974-2008. For fires and escalated enforcement, some reactors (34 and 5, respectively) are dropped because all observations
are zero. Additionally, some observations have zero capacity factor and are dropped. Standard errors, bootstrapped with 500
repetitions, are clustered by reactor in the count specifications. Standard errors are clustered by plant in the OLS
specifications. Stars (*, **, and ***) denote 10%, 5%, and 1% significance.
A: Dependent variable is not normalized
B: Dependent variable is normalized by capacity factor
32

Corporate Incentives and Nuclear Safety C. Hausman
(1) (2) (3) (4) (5) (6) (7) (8) (9)
Dependent variable:
Divestiture -0.21 -0.19 -0.19 -0.60 -0.62 -0.04 -0.35* -0.35* -0.17*
(0.13) (0.13) (0.13) (0.41) (0.41) (0.03) (0.20) (0.20) (0.10)
Change in expected -19% -17% -15% -45% -46% -48% -30% -30% -42%
value
Specification CNB UNB OLS CNB UNB OLS CNB UNB OLS
Year effects Y Y Y Y Y Y Y Y Y
Reactor effects Y Y Y Y Y Y Y Y Y
Number of observations 2245 2245 2245 1950 1950 1950 1442 1442 1442
Divestiture -0.34***-0.34***-0.54*** -0.74** -0.77** -0.07 -0.47** -0.48** -0.31
(0.12) (0.12) (0.20) (0.42) (0.42) (0.04) (0.22) (0.22) (0.28)
Change in expected -29% 26% -31% -52% -54% -68% -51% -38% -54%
value
Specification CNB UNB OLS CNB UNB OLS CNB UNB OLS
Year effects Y Y Y Y Y Y Y Y Y
Reactor effects Y Y Y Y Y Y Y Y Y
Number of observations 2207 2207 2207 1925 1925 1925 1425 1425 1425
Table 4: Robustness Checks: The Effect of Divestiture on Nuclear Power Plant Safety
Notes: Observation is a commercial nuclear power plant (U.S.) in a year. Divestiture is a dummy variable equal to 1 if the
reactor is owned by an independent power producer, and 0 if the reactor is owned by a regulated investor-owned utility. CNB
is a conditional negative binomial; UNB is an unconditional negative binomial with mean dispersion parameterization; OLS
is ordinary least squares. Results are nearly identical with an unconditional negative binomial with constant dispersion
parameterization. Normalization for the count regressions is accomplished by including capacity factor as an independent
variable with coefficient constrained to unity. For the count specifications, the percentage change in expected value is equal
to exp(coefficient) minus one; for OLS, it is equal to the coefficient divided by the mean number of counts at non-divested
reactors. Sample dates vary by variable. Initiating events are 1988-2009; fires are 1991-2009; and escalated enforcement is
1996-2009. For fires and escalated enforcement, some plants (14 and 3, respectively) are dropped in the count regressions
because all observations are zero. Additionally, some observations have zero capacity factor and are dropped. Standard errors
are clustered by reactor. Stars (*, **, and ***) denote 10%, 5%, and 1% significance.
Initiating Events Fires Escalated Enforcement
A: Dependent variable is not normalized
B: Dependent variable is normalized by capacity factor
33

Corporate Incentives and Nuclear Safety C. Hausman
(1) (2) (3) (4) (5)
Dependent variable:
Initiating
Events Fires
Escalated
Enforcement
Collective
Worker
Radiation
Exposure
(person-rems)
Average
Worker
Radiation
Exposure
(rems)
Divestiture, BWR -0.11 -0.57 -0.33 -166.5* -0.065**
(0.13) (0.47) (0.26) (87.5) (0.029)
Divestiture, PWR -0.26 -0.70 -0.36 109.9** 0.024
(0.19) (2.48) (0.24) (48.8) (0.022)
Chi-squared stat 0.53 <0.01 0.01 12.13*** 6.81
Divestiture, older reactors 0.02 -0.29 -0.20 -78.3 -0.045
(0.14) (0.46) (0.21) (89.7) (0.028)
Divestiture, newer reactors -0.40** -1.14 -0.61* 14.5 0.006
(0.17) (9.71) (0.31) (47.7) (0.021)
Chi-squared stat 4.72** 0.01 1.63 1.42 2.95*
Divestiture, small reactors 0.05 -0.61 -0.24 -54.2 -0.060*
(0.14) (0.53) (0.21) (91.3) (0.030)
Divestiture, large reactors -0.41*** -0.63 -0.51 -29.4 0.012
(0.16) (3.30) (0.31) (75.7) (0.021)
Chi-squared stat 6.60** <0.01 0.73 0.06 4.82
Specification Poisson Poisson Poisson OLS OLS
Year effects Y Y Y Y Y
Reactor effects Y Y Y N N
Plant effects N N N Y Y
Number of observations 2245 1950 1442 1749 1749
Table 5a: Heterogeneity by Reactor Characteristics
Notes: A separate regression is run for each heterogeneous effect (PWR versus BWR, reactor vintage, and reactor size).
Observation is a commercial nuclear power reactor (U.S.) in a year for the left-most three columns and a commercial nuclear
power plant in a year for the right-most two columns. Divestiture is a dummy variable equal to 1 if the reactor is owned by an
independent power producer, and 0 if the reactor is owned by an investor-owned utility. I define newer reactors (51 of 103) as
those entering commercial operations in 1979 or later. I define large reactors (49 of 103) as those with current capacity of at
least 1000 MW. Initiating events, fires, and escalated enforcement are count variables. Collective worker radiation exposure
is measured in person-rems, and average worker radiation exposure in rems. Samples dates vary by variable. Initiating events
are 1988-2009; fires are 1991-2009; escalated enforcement is 1996-2009; and radiation exposure is 1974-2008. For fires and
escalated enforcement, some reactors (34 and 5, respectively) are dropped in the count regressions because of all zero
outcomes. Standard errors, bootstrapped with 500 repetitions, are clustered by reactor in the count specifications. Standard
errors are clustered by plant in the OLS specifications. Stars (*, **, and ***) denote 10%, 5%, and 1% significance.
Dependent variable is not normalized
34

Corporate Incentives and Nuclear Safety C. Hausman
(1) (2) (3) (4) (5)
Dependent variable:
Initiating
Events Fires
Escalated
Enforcement
Collective
Worker
Radiation
Exposure
(person-rems)
Average
Worker
Radiation
Exposure
(rems)
Divestiture, BWR -0.26** -0.71 -0.44 -523.3 -0.185
(0.13) (0.49) (0.29) (425.6) (0.180)
Divestiture, PWR -0.37** -0.87 -0.51* 236.9 -0.014
(0.18) (2.55) (0.28) (157.9) (0.069)
Chi-squared stat 0.30 <0.01 0.04 3.50* 0.74
Divestiture, older reactors -0.17 -0.46 -0.35 -320.3 -0.172
(0.14) (0.46) (0.24) (385.8) (0.143)
Divestiture, newer reactors -0.49*** -1.27 -0.72** 40.7 -0.007
(0.16) (9.03) (0.36) (134.4) (0.060)
Chi-squared stat 2.81* 0.01 0.94 1.35 1.89
Divestiture, small reactors -0.13 -0.80 -0.42* -306.7 -0.211
(0.14) (0.54) (0.24) (435.4) (0.167)
Divestiture, large reactors -0.51*** -0.72 -0.56 -45.0 0.003
(0.15) (2.86) (0.35) (216.9) (0.059)
Chi-squared stat 4.29** <0.01 0.13 0.38 1.92
Specification Poisson Poisson Poisson OLS OLS
Year effects Y Y Y Y Y
Reactor effects Y Y Y N N
Plant effects N N N Y Y
Number of observations 2207 1925 1425 1729 1729
Table 5b: Heterogeneity by Reactor Characteristics
Dependent variable is normalized by capacity factor
Notes: A separate regression is run for each heterogeneous effect (PWR versus BWR, reactor vintage, and reactor size).
Observation is a commercial nuclear power reactor (U.S.) in a year for the left-most three columns and a commercial nuclear
power plant in a year for the right-most two columns. Divestiture is a dummy variable equal to 1 if the reactor is owned by an
independent power producer, and 0 if the reactor is owned by an investor-owned utility. Normalization for the count
regressions is accomplished by including capacity factor as an independent variable with coefficient constrained to unity. I
define newer reactors (51 of 103) as those entering commercial operations in 1979 or later. I define large reactors (49 of 103)
as those with current capacity of at least 1000 MW. Initiating events, fires, and escalated enforcement are count variables.
Collective worker radiation exposure is measured in person-rems, and average worker radiation exposure in rems. Samples
dates vary by variable. Initiating events are 1988-2009; fires are 1991-2009; escalated enforcement is 1996-2009; and
radiation exposure is 1974-2008. For fires and escalated enforcement, some reactors (34 and 5, respectively) are dropped in
the count regressions because of all zero outcomes. Additionally, some observations have zero capacity factor and are
dropped. Standard errors, bootstrapped with 500 repetitions, are clustered by reactor in the count specifications. Standard
errors are clustered by plant in the OLS specifications. Stars (*, **, and ***) denote 10%, 5%, and 1% significance.
35

Corporate Incentives and Nuclear Safety C. Hausman
(1) (2) (3) (4) (5)
Dependent variable:
Initiating
Events Fires
Escalated
Enforcement
Collective
Worker
Radiation
Exposure
(person-rems)
Average
Worker
Radiation
Exposure
(rems)
Divestiture -0.14 -0.63 -0.34 -32.9 -0.020
(0.14) (0.45) (0.21) (69.3) (0.022)
Number of observations 2157 1874 1386 1661 1661
Divestiture -0.19 -0.63 -0.36* -43.0 -0.025
(0.13) (0.42) (0.21) (68.2) (0.022)
Number of observations 2157 1874 1386 1716 1716
Divestiture -0.20 -0.60 -0.37* -43.9 -0.031
(0.14) (0.40) (0.22) (69.8) (0.022)
Number of observations 2157 1874 1386 1647 1647
Divestiture -0.33 -1.05 -0.33 16.4 -0.017
(0.20) (15.44) (0.23) (73.8) (0.040)
Number of observations 1721 1494 1106 1289 1289
Notes: Observation is a commercial nuclear power reactor (U.S.) in a year for the left-most three columns and a commercial
nuclear power plant in a year for the right-most two columns. Divestiture is a dummy variable equal to 1 if the reactor is
owned by an independent power producer, and 0 if the reactor is owned by an investor-owned utility. Columns (1), (2), and
(3) are Poisson specifications with year and reactor effects. Columns (4) and (5) are OLS specifications with year and facility
effects. Samples dates vary by variable. Initiating events are 1988-2009; fires are 1991-2009; escalated enforcement is 1996-
2009; and radiation exposure is 1974-2008. For fires and escalated enforcement, some reactors are dropped in the count
regressions because of all zero outcomes. Standard errors, bootstrapped with 500 repetitions, are clustered by reactor in the
count specifications. Standard errors are clustered by plant in the OLS specifications. Stars (*, **, and ***) denote 10%, 5%,
and 1% significance.
Table 6a: State-Level Selection
A. Excluding Michigan
B. Excluding California
C. Excluding Iowa and Wisconsin
D. Excluding Northeast
Dependent variable is not normalized
36
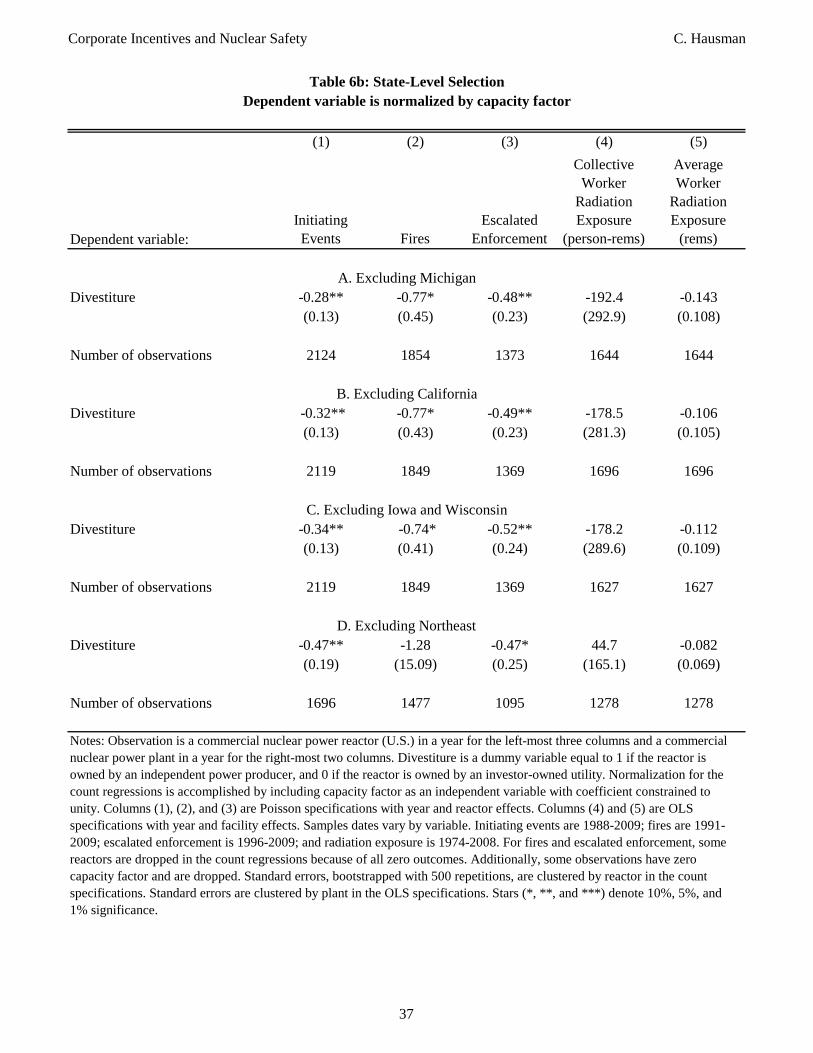
Corporate Incentives and Nuclear Safety C. Hausman
(1) (2) (3) (4) (5)
Dependent variable:
Initiating
Events Fires
Escalated
Enforcement
Collective
Worker
Radiation
Exposure
(person-rems)
Average
Worker
Radiation
Exposure
(rems)
Divestiture -0.28** -0.77* -0.48** -192.4 -0.143
(0.13) (0.45) (0.23) (292.9) (0.108)
Number of observations 2124 1854 1373 1644 1644
Divestiture -0.32** -0.77* -0.49** -178.5 -0.106
(0.13) (0.43) (0.23) (281.3) (0.105)
Number of observations 2119 1849 1369 1696 1696
Divestiture -0.34** -0.74* -0.52** -178.2 -0.112
(0.13) (0.41) (0.24) (289.6) (0.109)
Number of observations 2119 1849 1369 1627 1627
Divestiture -0.47** -1.28 -0.47* 44.7 -0.082
(0.19) (15.09) (0.25) (165.1) (0.069)
Number of observations 1696 1477 1095 1278 1278
Notes: Observation is a commercial nuclear power reactor (U.S.) in a year for the left-most three columns and a commercial
nuclear power plant in a year for the right-most two columns. Divestiture is a dummy variable equal to 1 if the reactor is
owned by an independent power producer, and 0 if the reactor is owned by an investor-owned utility. Normalization for the
count regressions is accomplished by including capacity factor as an independent variable with coefficient constrained to
unity. Columns (1), (2), and (3) are Poisson specifications with year and reactor effects. Columns (4) and (5) are OLS
specifications with year and facility effects. Samples dates vary by variable. Initiating events are 1988-2009; fires are 1991-
2009; escalated enforcement is 1996-2009; and radiation exposure is 1974-2008. For fires and escalated enforcement, some
reactors are dropped in the count regressions because of all zero outcomes. Additionally, some observations have zero
capacity factor and are dropped. Standard errors, bootstrapped with 500 repetitions, are clustered by reactor in the count
specifications. Standard errors are clustered by plant in the OLS specifications. Stars (*, **, and ***) denote 10%, 5%, and
1% significance.
Table 6b: State-Level Selection
Dependent variable is normalized by capacity factor
A. Excluding Michigan
B. Excluding California
C. Excluding Iowa and Wisconsin
D. Excluding Northeast
37

Corporate Incentives and Nuclear Safety C. Hausman
(1) (2) (3) (4) (5)
Dependent variable:
Initiating
Events Fires
Escalated
Enforcement
Collective
Worker
Radiation
Exposure
(person-rems)
Average
Worker
Radiation
Exposure
(rems)
Divestiture -0.21* -0.60 -0.49*** -72.4 -0.024
(0.12) (0.45) (0.19) (63.8) (0.022)
Co-owned -0.04 0.02 -0.80** -144.3 -0.001
(0.21) (0.82) (0.40) (121.6) (0.029)
Specification Poisson Poisson Poisson OLS OLS
Year effects Y Y Y Y Y
Reactor effects Y Y Y N N
Plant effects N N N Y Y
Number of observations 2245 1950 1442 1749 1749
Divestiture -0.34*** -0.74 -0.61*** -187.9 -0.067
(0.11) (0.46) (0.20) (276.5) (0.115)
Co-owned 0.01 0.06 -0.73* -63.6 0.129
(0.20) (0.83) (0.41) (282.8) (0.097)
Specification Poisson Poisson Poisson OLS OLS
Year effects Y Y Y Y Y
Reactor effects Y Y Y N N
Plant effects N N N Y Y
Number of observations 2207 1925 1425 1729 1729
Table 7: Intra-Firm Spillovers
Notes: Co-owned is a dummy equal to 1 if the reactor is not divested, but is owned by a company operating divested units
(Dominion, Entergy, and NextEra). Thus the omitted group is non-divested reactors whose parent company operates no
divested reactors. Observation is a commercial nuclear power reactor (U.S.) in a year for the left-most three columns and a
commercial nuclear power plant in a year for the right-most two columns. Divestiture is a dummy variable equal to 1 if the
reactor is owned by an independent power producer, and 0 if the reactor is owned by a regulated investor-owned utility.
Normalization for the count regressions is accomplished by including capacity factor as an independent variable with
coefficient constrained to unity. Samples dates vary by variable. Initiating events are 1988-2009; fires are 1991-2009;
escalated enforcement is 1996-2009; and radiation exposure is 1974-2008. For fires and escalated enforcement, some
reactors (34 and 5, respectively) are dropped in the count regressions because of all zero outcomes. Additionally, some
observations have zero capacity factor and are dropped. Standard errors, bootstrapped with 500 repetitions, are clustered
by reactor in the count specifications. Standard errors are clustered by plant in the OLS specifications. Stars (*, **, and
***) denote 10%, 5%, and 1% significance.
B: Dependent variable is normalized by capacity factor
A: Dependent variable is not normalized
38
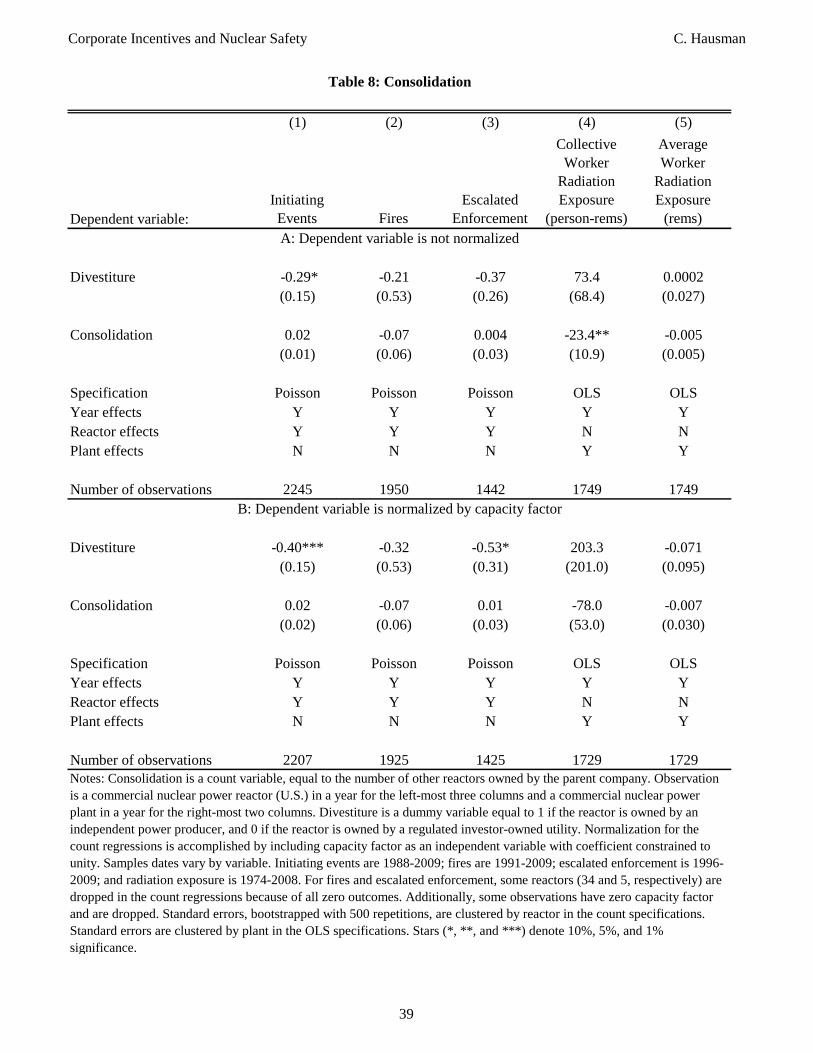
Corporate Incentives and Nuclear Safety C. Hausman
(1) (2) (3) (4) (5)
Dependent variable:
Initiating
Events Fires
Escalated
Enforcement
Collective
Worker
Radiation
Exposure
(person-rems)
Average
Worker
Radiation
Exposure
(rems)
Divestiture -0.29* -0.21 -0.37 73.4 0.0002
(0.15) (0.53) (0.26) (68.4) (0.027)
Consolidation 0.02 -0.07 0.004 -23.4** -0.005
(0.01) (0.06) (0.03) (10.9) (0.005)
Specification Poisson Poisson Poisson OLS OLS
Year effects Y Y Y Y Y
Reactor effects Y Y Y N N
Plant effects N N N Y Y
Number of observations 2245 1950 1442 1749 1749
Divestiture -0.40*** -0.32 -0.53* 203.3 -0.071
(0.15) (0.53) (0.31) (201.0) (0.095)
Consolidation 0.02 -0.07 0.01 -78.0 -0.007
(0.02) (0.06) (0.03) (53.0) (0.030)
Specification Poisson Poisson Poisson OLS OLS
Year effects Y Y Y Y Y
Reactor effects Y Y Y N N
Plant effects N N N Y Y
Number of observations 2207 1925 1425 1729 1729
Table 8: Consolidation
Notes: Consolidation is a count variable, equal to the number of other reactors owned by the parent company. Observation
is a commercial nuclear power reactor (U.S.) in a year for the left-most three columns and a commercial nuclear power
plant in a year for the right-most two columns. Divestiture is a dummy variable equal to 1 if the reactor is owned by an
independent power producer, and 0 if the reactor is owned by a regulated investor-owned utility. Normalization for the
count regressions is accomplished by including capacity factor as an independent variable with coefficient constrained to
unity. Samples dates vary by variable. Initiating events are 1988-2009; fires are 1991-2009; escalated enforcement is 1996-
2009; and radiation exposure is 1974-2008. For fires and escalated enforcement, some reactors (34 and 5, respectively) are
dropped in the count regressions because of all zero outcomes. Additionally, some observations have zero capacity factor
and are dropped. Standard errors, bootstrapped with 500 repetitions, are clustered by reactor in the count specifications.
Standard errors are clustered by plant in the OLS specifications. Stars (*, **, and ***) denote 10%, 5%, and 1%
significance.
A: Dependent variable is not normalized
B: Dependent variable is normalized by capacity factor
39

Corporate Incentives and Nuclear Safety C. Hausman
(1) (2) (3) (4) (5)
Dependent variable:
Initiating
Events Fires
Escalated
Enforcement
Collective
Worker
Radiation
Exposure
(person-rems)
Average
Worker
Radiation
Exposure
(rems)
Divestiture -0.00005 -0.008 -0.41 -38.7 0.030
(0.18) (0.70) (0.27) (42.2) (0.025)
Linear trend pre-divestiture -0.01 -0.06 0.37*** 16.4 -0.013
(0.03) (0.17) (0.11) (24.5) (0.011)
Linear trend post-divestiture -0.13 -0.38 -0.25* -46.5* -0.016
(0.12) (0.38) (0.14) (26.3) (0.010)
Specification Poisson Poisson Poisson OLS OLS
Year effects Y Y Y Y Y
Reactor effects Y Y Y N N
Plant effects N N N Y Y
Number of observations 2245 1950 1442 1749 1749
Divestiture -0.11 -0.07 -0.40 20.5 0.277
(0.17) (0.70) (0.30) (227.7) (0.254)
Linear trend pre-divestiture 0.006 -0.07 0.28** -26.6 -0.119
(0.03) (0.17) (0.12) (100.1) (0.088)
Linear trend post-divestiture -0.19 -0.42 -0.31** -108.8 -0.025
(0.12) (0.38) (0.14) (106.3) (0.050)
Specification Poisson Poisson Poisson OLS OLS
Year effects Y Y Y Y Y
Reactor effects Y Y Y N N
Plant effects N N N Y Y
Number of observations 2207 1925 1425 1729 1729
Table 9: Learning
Notes: Learning variable has been scaled to represent a three-year change. Observation is a commercial nuclear power
reactor (U.S.) in a year for the left-most three columns and a commercial nuclear power plant in a year for the right-most
two columns. Divestiture is a dummy variable equal to 1 if the reactor is owned by an independent power producer, and 0
if the reactor is owned by a regulated investor-owned utility. Normalization for the count regressions is accomplished by
including capacity factor as an independent variable with coefficient constrained to unity. Samples dates vary by variable.
Initiating events are 1988-2009; fires are 1991-2009; escalated enforcement is 1996-2009; and radiation exposure is 1974-
2008. For fires and escalated enforcement, some reactors (34 and 5, respectively) are dropped in the count regressions
because of all zero outcomes. Additionally, some observations have zero capacity factor and are dropped. Standard errors,
bootstrapped with 500 repetitions, are clustered by reactor in the count specifications. Standard errors are clustered by
plant in the OLS specifications. Stars (*, **, and ***) denote 10%, 5%, and 1% significance.
A: Dependent variable is not normalized
B. Dependent variable is normalized by capacity factor
40

Corporate Incentives and Nuclear Safety C. Hausman
Appendix 1: Model
I model profit maximization of a nuclear power plant in a competitive generation market,
then I derive implications for expenditures on reliability and safety maintenance.
Profit-Maximization with Reliability
Consider a baseload nuclear power plant in a deregulated electricity generation market. For
simplification, assume the power plant has only one reactor. The power plant faces a given
price per megawatt-hour (MWh) p and given fuel and other variable costs per MWh, co.
The market price of electricity generation is determined by the marginal cost of the marginal
plant. Variable costs for nuclear plants are lower than for fossil fuel plants, implying that
nuclear plants are not the marginal plants. According to a recent EIA report (EIA 2009),
variable costs are 2.17 cents per kilowatt-hour for nuclear plants and 4.05 for fossil-steam
plants. First, assume that the nuclear plant is a price-taker.40 Second, assume that p > co;
the market price is higher than the nuclear plant’s variable costs.41
If the plant is operating, it operates at capacity, i.e., producing quantity q of electricity.
Let operating (not total) profits π = pq − coq. Assume there are no ramping or start-up
costs. The plant can choose some level of maintenance a to purchase; thus a is an endogenous
effort variable. Increases in a can be thought of as increases in either the quantity or quality
of effort. Most maintenance for nuclear power plants requires the plant to be offline, so
maintenance incurs both direct costs and lost operating profits. The cost of maintenance
is c(a, π), where c(a, π) ≥ 0, ∂c∂a
> 0, ∂c∂π
> 0, ∂2c∂2a
> 0 and ∂2c∂a∂π
> 0. The intuition for
the assumptions on the first and second derivatives with respect to operating profits π is
that additional maintenance requires a longer time offline, so more revenue is lost.42 In any
given period, there is a probability r(a) ∈ (0, 1) that the plant will experience an unplanned
outage (or “scram” or “trip”), conditional on the plant deciding ex-ante to operate. Then
the probability of being able to operate as planned is given by 1− r(a). Assume r′(a) < 0:
maintenance (effort) decreases the probability of an unplanned outage. Also, r′′(a) > 0:
40There is potential for the owner of a nuclear power plant to exercise market power, if it owns othergenerators. However, if the other generators have higher marginal costs than the nuclear plant, exercisingmarket power by shutting down the nuclear plant is not the first-best strategy of the firm. Rather, the firmwould take the higher cost plant offline. Moreover, if the nuclear power plant is baseload, the owner maybe required to purchase replacement power when the plant is down. Since the replacement power is morecostly than the nuclear plant’s generation, the firm has no incentive to exercise market power by taking thenuclear plant offline.
41For representative supply and demand curves showing nuclear marginal costs compared to fossil fuelcosts, see Griffin and Puller (2005).
42It is straightforward to consider the case where ∂c∂π = 0, i.e., maintenance does not require the plant to
be offline.
41

Corporate Incentives and Nuclear Safety C. Hausman
the probability decreases at a decreasing rate. Intuitively, the probability asymptotes as
maintenance increases. In the event of an unplanned outage, the firm earns no revenue (as
it produces no electricity) and incurs additional costs cu > 0. These additional costs may
include repair work, increased (safety) regulatory scrutiny, or bad publicity. The firm’s profit
maximization problem is43
maxa
(1− r(a)) · π − r(a) · cu − c(a, π) (3)
The first-order condition is
−r′(a) · π − r′(a) · cu − ∂c(a, π)
∂a= 0 (4)
The firm chooses the level of maintenance a such that the marginal benefit of an additional
unit of maintenance −r′(a) · π − r′(a) · cu equals the marginal cost ∂c(a,π)∂a
. The marginal
benefit of an additional unit of maintenance is an increased likelihood of earning revenue
and a decreased likelihood of paying for an unplanned outage. Comparative statics on the
exogenous revenue and cost variables is straightforward. By the implicit function theorem,[∂a∂π∂a∂cu
]= −
[−r′′(a) · π − r′′(a) · cu − ∂2c(a, π)
∂2a
]−1·
[−r′(a)− ∂2c
∂a∂π
−r′(a)
](5)
At the profit maximizing level of a,[−r′′(a) · π − r′′(a) · cu − ∂2c(a,π)
∂2a
]is negative (by the
second order condition, which is satisfied according to the above assumptions),44 and recall
that r′(a) is assumed to be negative and ∂2c(a,π)∂2a
positive. The sign on ∂a∂π
is indeterminate;
both planned maintenance outages and unplanned outages lead the firm to lose revenue. If
one instead assumes that maintenance does not require the plant to be offline, i.e., ∂c∂π
= 0,
then maintenance a is increasing in potential revenue. (Note that all results on ∂a∂π
imply the
same result on ∂a∂p
, since ∂π∂p
= 1.) The sign on ∂a∂cu
is positive; maintenance is increasing in
43As an alternative way to see how maintenance costs depend on operating profits, re-write the firm’s totalprofits as (1− r(a)− p(a)) ·π− r(a) · cu− c(a), where r(a) ∈ (0, 1) is the probability of an unplanned outage,and p(a) ∈ (0, 1) is the fraction of time spent on planned outages. Thus all time is spent on either plannedoutages, unplanned outages, or generation. As before, r′(a) < 0, c′(a) > 0, and now p′(a) > 0: the timespent on a planned outage is increasing in the amount of maintenance done. Rearranging the firm’s totalprofit function gives (1 − r(a)) · π − r(a) · cu − p(a) · π − c(a). Let c̃(a, π) = p(a) · π + c(a), so that profitsequal (1 − r(a)) · π − r(a) · cu − c̃(a, π). The latter expression is the same as equation 3, showing how thecost of maintenance depends on operating profits.
44The key assumption for satisfying the second order condition is that r′′(a) > 0. Intuitively, this is satisfiedfor large a if the probability of an unplanned outage asymptotes towards zero as maintenance increases. Ifr(a) is S-shaped, with r′′(a) < 0 for small values of a, there could be a corner solution with no maintenance.All that is necessary to rule out this case is to assume that the optimal a is beyond the inflection point;alternatively, one could assume that the regulatory body governing safety (the NRC) requires a minimumlevel of maintenance.
42

Corporate Incentives and Nuclear Safety C. Hausman
the cost of an unplanned outage.
Profit-Maximization with Reliability and Safety
The above model considers plant reliability rather than safety. Suppose that the probability
of an unsafe event is s(a) ∈ (0, 1) with s′(a) < 0 and s′′(a) > 0; that is, the same maintenance
actions that improve reliability also improve safety. Suppose the total cost of an unsafe event
is cs > 0, of which some fraction θ are borne by the plant, and the remaining fraction (1− θ)are borne by society.45
The firm’s optimum is
maxa
(1− r(a)) · π − r(a) · cu − c(a, π)− s(a) · θ · cs (6)
The social optimum is similar but with θ = 1 (society internalizes all of the safety costs).
The firm’s first-order condition is
−r′(a) · π − r′(a) · cu − ∂c(a, π)
∂a− s′(a) · θ · cs = 0 (7)
The firm, which does not bear the entire safety cost cs, exerts less effort a than is socially
optimal. However, note that even if the firm internalizes none of the safety costs (i.e., θ = 0),
the firm invests in maintenance (because of the reliability costs) that has a positive impact
on safety. The social optimum can be achieved if a regulatory agency requires the firm to
conduct the optimal level of maintenance. In practice, this may be difficult if the regulatory
agency does not have complete information on the cost function c(a, π) or the reliability and
safety functions r(a) and s(a).
Comparative statics are again straightforward. By the implicit function theorem,
∂a∂π∂a∂cu
∂a∂θ
= −[−r′′(a) · π − r′′(a) · cu − ∂2c(a, π)
∂2a− s′(a) · θ · cs
]−1·
−r′(a)− ∂2c
∂a∂π
−r′(a)
−s′(a) · cs
(8)
As before, at the profit maximizing level of a,[−r′′(a) · π − r′′(a) · cu − ∂2c(a,π)
∂2a− s′(a) · θ · cs
]is negative (by the second order condition, which is satisfied according to the above assump-
tions).46 The sign on ∂a∂π
is again indeterminate, and ∂a∂cu
is again positive. Since s′(a) < 0,∂a∂θ> 0; effort is increasing in the portion θ of the safety cost that the firm internalizes.
45See above for a summary of nuclear reactor liability in the U.S. under the Price-Anderson Act (PAA).46As before, the key assumptions for satisfying the second order condition are that r′′(a) > 0 and s′′(a) > 0.
43

Corporate Incentives and Nuclear Safety C. Hausman
At the other extreme, safety could be unrelated to reliability, in that the maintenance
effort that lowers the probability of an unplanned outage is separate from any maintenance
that improves safety. Denote the maintenance that improves reliability as ar and the main-
tenance that improves safety as as. Both require expenditures by the plant: cr(ar, π) and
cs(as, π), with c(.) > 0, ∂c(.)∂a
> 0, and ∂2c∂a∂π
> 0 (beyond these assumptions, I make no as-
sumptions on the functional form of cr(ar, π) as compared to cs(as, π)). As before, additional
maintenance requires a longer time offline, so more revenue is lost (the case where reliability
and safety maintenance do not require being offline can also be considered, with ∂2c∂a∂π
= 0).
The firm’s problem is
maxar,as
(1− r(ar)) · π − r(ar) · cu − cr(ar, π)− s(as) · θ · cs − cs(as, π) (9)
The social optimum is similar but with θ = 1 (society internalizes all of the safety costs).
The firm’s first-order conditions are
−r′(ar) · π − r′(ar) · cu − ∂cr(ar, π)
∂ar= 0 (10)
−s′(as) · θ · cs − ∂cs(as, π)
∂as= 0 (11)
The firm, like the social planner, equates the marginal cost and benefit of reliability mainte-
nance, so that the firm’s choice of ar is equivalent to the social optimum. However, the firm
internalizes only a fraction θ of the benefits associated with improved safety, and exerts a
sub-optimal level of effort on safety maintenance. (With perfect information and regulatory
oversight, the social optimum could again be achieved through regulation of maintenance
levels.) The second order conditions are again satisfied; the Hessian matrix is:[−r′′(ar) · π − r′′(ar) · cu − ∂2cr(ar,π)
∂2ar0
0 −s′′(as) · θ · cs − ∂2cs(as,π)∂2as
](12)
The two diagonal terms are negative, so the matrix is negative definite.
Comparative statics for the firm are:
44

Corporate Incentives and Nuclear Safety C. Hausman
[∂ar
∂π∂ar
∂cu∂ar
∂θ∂as
∂π∂as
∂cu∂as
∂θ
]= −Hessian−1 ·
[∂FOC1
∂π∂FOC1
∂cu∂FOC1
∂θ∂FOC2
∂π∂FOC2
∂cu∂FOC2
∂θ
](13)
= −
[−r′′(ar) · π − r′′(ar) · cu − ∂2cr(ar,π)
∂2ar0
0 −s′′(as) · cs − ∂2cs(as,π)∂2as
]−1
·
[−r′(ar)− ∂2cr
∂ar∂π−r′(ar) 0
− ∂2cs
∂as∂π0 −s′(as) · cs
](14)
Denote the above as follows, where a < 0, b < 0, the sign of c is indeterminate, d > 0,
e < 0, and f > 0:
= −
[a 0
0 b
]−1 [c d 0
e 0 f
](15)
= −
[1a
0
0 1b
][c d 0
e 0 f
](16)
= −
[ca
da
0eb
0 fb
](17)
=
[ind + 0
− 0 +
](18)
Thus ∂ar
∂πagain has an indeterminate sign, ∂ar
∂cuis again positive, and ∂as
∂θis again positive.
As expected, ∂ar
∂θand ∂as
∂cuare both zero: reliability maintenance does not depend on the
costs of safety events and vice-versa. Note that ∂as
∂πis negative: potential operating profits
unambiguously lower the optimal expenditures on safety maintenance. This follows from the
assumption that safety maintenance requires that the plant be offline; if we instead assume∂2c(as,π)∂as∂π
= 0, then potential operating profits will not affect the optimal expenditures on
safety maintenance.
45
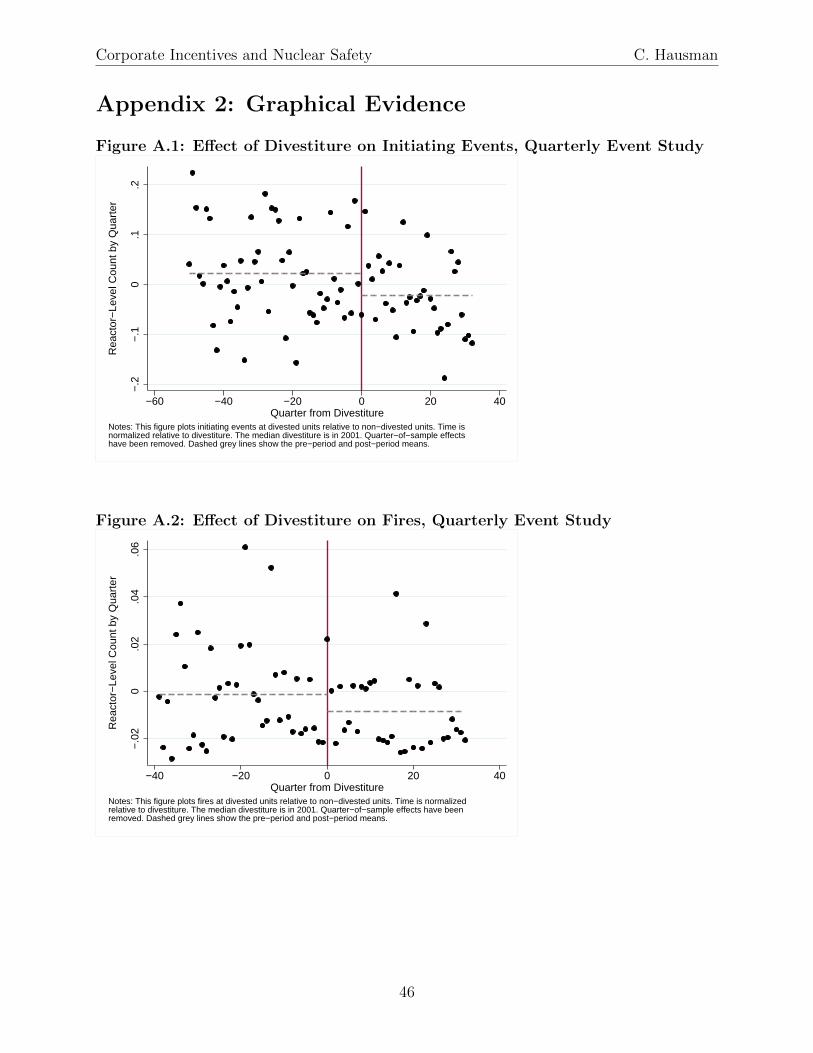
Corporate Incentives and Nuclear Safety C. Hausman
Appendix 2: Graphical Evidence
Figure A.1: Effect of Divestiture on Initiating Events, Quarterly Event Study−
.2−
.10
.1.2
Rea
ctor
−Le
vel C
ount
by
Qua
rter
−60 −40 −20 0 20 40Quarter from Divestiture
Notes: This figure plots initiating events at divested units relative to non−divested units. Time isnormalized relative to divestiture. The median divestiture is in 2001. Quarter−of−sample effectshave been removed. Dashed grey lines show the pre−period and post−period means.
Figure A.2: Effect of Divestiture on Fires, Quarterly Event Study
−.0
20
.02
.04
.06
Rea
ctor
−Le
vel C
ount
by
Qua
rter
−40 −20 0 20 40Quarter from Divestiture
Notes: This figure plots fires at divested units relative to non−divested units. Time is normalizedrelative to divestiture. The median divestiture is in 2001. Quarter−of−sample effects have beenremoved. Dashed grey lines show the pre−period and post−period means.
46
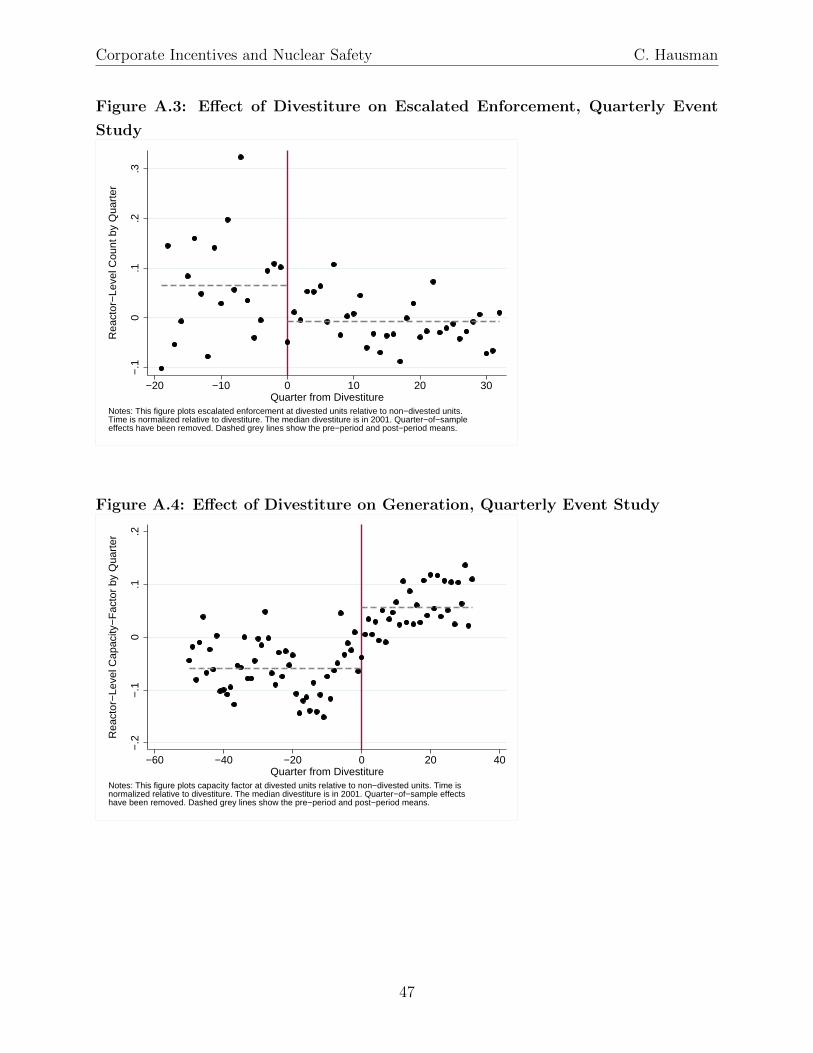
Corporate Incentives and Nuclear Safety C. Hausman
Figure A.3: Effect of Divestiture on Escalated Enforcement, Quarterly Event
Study−
.10
.1.2
.3
Rea
ctor
−Le
vel C
ount
by
Qua
rter
−20 −10 0 10 20 30Quarter from Divestiture
Notes: This figure plots escalated enforcement at divested units relative to non−divested units.Time is normalized relative to divestiture. The median divestiture is in 2001. Quarter−of−sampleeffects have been removed. Dashed grey lines show the pre−period and post−period means.
Figure A.4: Effect of Divestiture on Generation, Quarterly Event Study
−.2
−.1
0.1
.2
Rea
ctor
−Le
vel C
apac
ity−
Fac
tor
by Q
uart
er
−60 −40 −20 0 20 40Quarter from Divestiture
Notes: This figure plots capacity factor at divested units relative to non−divested units. Time isnormalized relative to divestiture. The median divestiture is in 2001. Quarter−of−sample effectshave been removed. Dashed grey lines show the pre−period and post−period means.
47

Corporate Incentives and Nuclear Safety C. Hausman
Figure A.5: Effect of Divestiture on Worker Radiation Exposure, Quarterly
Event Study−
500
5010
015
0
Rea
ctor
−Le
vel C
olle
ctiv
e D
ose
(Per
son−
RE
M)
by Y
ear
−20 −10 0 10Year from Divestiture
Notes: This figure plots collective worker radiation exposure (person−rems)at divested units relative to non−divested units. Time is normalized relative todivestiture. The median divestiture is in 2001. Year−of−sample effects havebeen removed. Dashed grey lines show the pre−period and post−periodmeans.
−.0
50
.05
.1
Rea
ctor
−Le
vel A
vera
ge D
ose
(RE
Ms)
by
Yea
r
−20 −10 0 10Year from Divestiture
Notes: This figure plots average worker radiation exposure (rems) atdivested units relative to non−divested units. Time is normalized relative todivestiture. The median divestiture is in 2001. Year−of−sample effects havebeen removed. Dashed grey lines show the pre−period and post−periodmeans.
48

Corporate Incentives and Nuclear Safety C. Hausman
(1) (2) (3)
Dependent variable: Initiating Events Fires Escalated Enforcement
Divestiture -0.179 -0.621 -0.348
Standard errors, at various levels of the block-bootstrap:
Reactor (0.125) (0.411) (0.197)*
Plant (0.135) (0.451) (0.270)
Plant-year (0.106)* (0.412) (0.233)
Reactor-year (0.102)* (0.370)* (0.183)*
Specification Poisson Poisson Poisson
Year effects Y Y Y
Reactor effects Y Y Y
Plant effects N N N
Number of observations 2245 1950 1442
Divestiture -0.316 -0.767 -0.477
Standard errors, at various levels of the block-bootstrap:
Reactor (0.121)*** (0.417)* (0.217)**
Plant (0.123)** (0.459)* (0.303)
Plant-year (0.106)*** (0.396)* (0.254)*
Reactor-year (0.104)*** (0.357)** (0.206)**
Specification Poisson Poisson Poisson
Year effects Y Y Y
Reactor effects Y Y Y
Plant effects N N N
Number of observations 2207 1925 1425
Table A.1: Alternative Clustering
A: Dependent variable is not normalized
B: Dependent variable is normalized by capacity factor
Notes: Observation is a commercial nuclear power reactor (U.S.) in a year. Divestiture is a dummy variable equal to 1 if the
reactor is owned by an independent power producer, and 0 if the reactor is owned by a regulated investor-owned utility.
Normalization is accomplished by including capacity factor as an independent variable with coefficient constrained to
unity.Samples dates vary by variable. Initiating events are 1988-2009; fires are 1991-2009; and escalated enforcement is
1996-2009. For fires and escalated enforcement, some reactors (34 and 5, respectively) are dropped because all observations
are zero. Additionally, some observations have zero capacity factor and are dropped. Standard errors are bootstrapped with
500 repetitions. Stars (*, **, and ***) denote 10%, 5%, and 1% significance.
49