corporate information model catalog for self service using
TRANSCRIPT
International Journal of Sciences:
Basic and Applied Research
(IJSBAR)
ISSN 2307-4531 (Print & Online)
http://gssrr.org/index.php?journal=JournalOfBasicAndApplied
---------------------------------------------------------------------------------------------------------------------------
59
Corporate Information Model Catalog for Self Service
Using (Online Analytical Processing) OLAP
Methodology
Farhana Sethi*
Global Data & Analytics Business Intelligence - Quality & Governance Manager with Schlumberger Oilfield,
Texas, Houston
Email: [email protected], Tel.: +1-832-853-4059
Abstract
Corporate Information Models(CIM) are Online Analytical Processing (OLAP) Cubes is a data structure that
enables simple and rapid analysis of data by the multiple dimensions that define a business challenge. A
multidimensional cube for reporting composed of multiple Dimension e.g. Customers, Product Lines and
business units. By storing data using OLAP cubes, data is pre-calculated and ready-to-use in the form of pre-
defined analytic reports, eliminating long-running data queries and enabling self-service for business
intelligence users.
Keywords: Application packages; Design Concept; Turnkey Solution; Intranet Portal.
1. Introduction
Online Analytical Processing (OLAP) allows users to analyze database information from multiple database
systems at one time. “The multidimensionality occurs in the online analytical processing (OLAP) engines” [1].
An OLAP Cube is a data structure that allows fast analysis of data according to the multiple Dimensions that
define a business problem. OLAP in a data warehouse enables companies to organize information in multiple
dimensions, which makes it easy for businesses to understand and use data. Since OLAP contains
multidimensional data usually obtained from different and unrelated sources, it requires a special method of
storing that data.
------------------------------------------------------------------------
* Corresponding author.
International Journal of Sciences: Basic and Applied Research (IJSBAR) (2020) Volume 54, No 3, pp 59-88
60
OLAP tools enable users to analyze different dimensions of multidimensional data using self-service. In our
research and implementation scope, we have used OLAP method to provide corporate level multidimensional
data to the business users. Corporate Information Models (CIMs) provide trusted and qualified data from
multiple sources for everyone to build their own business intelligence reports and dashboards. Corporate
Information Models are Online Analytical Processing (OLAP) Cubes – a data structure that enables simple and
rapid analysis of data by the multiple dimensions that define a business problem. A multidimensional cube for
reporting composed of multiple Dimension e.g. Customers, Product Lines, business units and Date. By storing
data using OLAP cubes, data is pre-calculated and ready-to-use, eliminating long-running data queries and
enabling self-service business intelligence. A portal has been developed to provide and display the CIM detail.
The CIM catalog links to over 60 CIMs categorized by the seven main categories called Value streams.
2. Background and concept
Self-Service Analytics is a form of business intelligence (BI) in which line-of-business professionals are
enabled and encouraged to perform queries and generate reports on their own, with nominal IT support. Self-
Service Analytics gives users the ability to develop rapid reports, empowering users to analyze their data. End
users can analyze their data by dynamically modifying, drilling through, or adding calculation functions to a
report. This flexibility decreases IT resource drain freeing up valuable development resources. Self-Service
Analytics gives users the ability to easily build reports with the exact information that users need without tying
up developer resources. This gives business users the ability to take control of their own analytics needs and
helps them to extract maximum value from both their data and their application while simultaneously extending
the overall agility of their organizational BI. Data is the Core of Self-Service Analytics. Without reliable and
robust data any fine-looking report is misleading and eventually unserviceable to the business. With the current
rise of big data “Organizations are recognizing the value of data as a critical business asset to identify trends,
patterns and preferences to drive improved customer experiences and competitive advantage. The problem is,
users too often can’t find the data they need to perform desired analytics. Data tends to be buried in different
systems or siloed in departments across the organization” [2] . “The need fleS- ll elleiciiaieicel e eal ecivel
i ec g lc crlvg eal easineatcrlletrcelle e a ” [3].
2.1. Related work
Many research have focused on finding the requirement and the appropriate solution for self-service Business
Intelligence (SSBI). “Based on data from a literature review, ten challenges divided into two main categories
have been identified. In the coding analysis process, two main categories were identified: “Access and use of
data” and “Self-reliant users”. Challenges that are caused by issues related to data access and usage were
grouped into six sub-categories, while challenges related to users becoming more self-reliant formed four sub-
categories” [4]. One of the key component of this research is to provide a BI tools which is easy to use, Control
of data integrity, security and distribution, Prepare data for visual analytics, Give the right tools to the right user
and educate users on how to select, interpret and analyze data to make decisions. “One common mistake most
organizations make is purchasing a single self-service Business Intelligence (SSBI) tool and allowing everyone
access to it “[5]. When accessing the data used for advanced analytics and decision-making. Traditional BI is

International Journal of Sciences: Basic and Applied Research (IJSBAR) (2020) Volume 54, No 3, pp 59-88
61
not a single software or technology that can solve all problems easily. Instead, according to the definition in [6,
page 2]: “BI combines products, technology, and methods to organize key information that management needs
to improve profit and performance. More broadly, we think of BI as business information and business analyses
within the context of key business processes that lead to decisions and actions and that result in improved
business performance.”[6]
3. Application Overview
The objective of the offered application is to enable business users to overcome the challenges of the traditional
BI software by reacting to the new analytics requirements of the business quickly and effectively .There are
some key features for the application that make it unique and useful, as mentioned below.
CIM Catalog
CIM Catalog is a central repository for all the self-service OLAP models in the organization. It contained over 60
models with their description, facts and dimension detail. OLAP models detail synchronize with Azure Analytics
Services using Azure Pipelines with daily refresh schedule. Catalog provides insight about every column definition
approved by Data Owners, source system detail, connection and access related information. Every model has a
hierarchy and map with main category called value Streams.
Social
Business users and analytics team members can easily communicate issues or feedback using focused discussions
per analytics on CIM catalog such as Feedback, Reviews, and Support and feature requests.
Integrated with the ecosystem
CIM portal set up as Single-Sign-On with viewer integration. It uses Domain Name System (DNS) and CNAME
(Canonical Name record) that is easy to remember and searchable from central internal hub .it also provides
authentication on the mobile integrated with Microsoft Intune which is a cloud-based service that focuses on
mobile device management (MDM) for the organization.
Structure the Catalog using Tags
To make all analytics on CIM catalog discoverable, it provides a taxonomy to the catalogs using tags. This allows
business users to explore what is available in the organization.
Drill down to any combination
Users can easily drill down to the exact combination of what they want to explore. They can also mix and match
with other filters that are available, such as a filter to only select a particular data source.
Supporting Content

International Journal of Sciences: Basic and Applied Research (IJSBAR) (2020) Volume 54, No 3, pp 59-88
62
Add supporting content to each CIM model, like: source data, a user guide, utilization metrics or a video
walkthrough. This makes it substantially easier for new users to know their way around the CIM model, especially
if it requires more context to understand the analytic assets.
Mobile View
Application supports mobile view using RWD. Responsive web design (RWD) is a web development approach
that creates dynamic changes to the appearance of a website, depending on the screen size and orientation of the
device being used to view it.
Integrated Viewer
It provides a view of all CIM model right from within Central Catalog. With central catalog users can request for
access on the OLAP models, read the columns definitions, find the data owners and download pre-built Power BI
report to explore and customize their own analytics.
3.1. Application Architecture
CIM Catalog has been designed and developed in the Microsoft Azure Cloud using SharePoint Online as
described in high level architecture diagram Figure 1.Microsoft Azure is a cloud computing service created by
Microsoft that can be used for deploying and managing applications as well as services through a global
network of Microsoft-managed data centers. In our research, corporate data source modeling being developed
using Microsoft Azure Analysis Services which is linked with CIM catalog using Microsoft Azure Pipeline.
Azure Analysis Services is a fully managed platform as a service (PaaS) that provides enterprise-grade data
models in the Microsoft Azure cloud. Azure Data Factory is Azure's cloud ETL (Extract, Transform, Load)
service for scale-out server-less data integration and data transformation.
Figure 1: High-level Architecture diagram – CIM Catalog
International Journal of Sciences: Basic and Applied Research (IJSBAR) (2020) Volume 54, No 3, pp 59-88
63
3.2. Key technology and components
Key technology and components of Digital store are as follows:
Web Framework
In our research we have considered and compare Angular, Angular JS and React for the selection of web
framework to develop the application. There are several other web framework available such as Vue, Ember,
Meteor, Polymer, Backbone, Aurelia and Mithril. In our research, we have not included the comparison of all other
frameworks. Angular is a web framework and a platform for building mobile and desktop web applications using
HTML and Typescript. Angular is written in Typescript (Typescript is an open-source programming language
developed and maintained by Microsoft). Angular is used in many public-facing application like Google and
YouTube. It is a completely free framework helps to use HTML as a template language, creates RICH Internet
Application and offers its developers a client-side application. We have used Version 9 in our application
development, Angular 9 was released on February 6, 2020. This latest version moves all applications to use the Ivy
compiler and runtime by default. Ivy is the code name for Agular’s next-generation compilation and rendering
pipeline. Also it has been updated to work with Typescript 3.6 and 3.7.
Angular VS. Angular JS
If we compare the performance on Angular with AngularJS then we have better reasons to use Angular. Angular is
at least five times faster than AngularJS due to a much better algorithm for data binding and a component-based
architecture. The components of an Angular application are quite independent and self-sufficient, which makes
them reusable and test friendly. Angular used Typescript and Angular JS uses JavaScript. The main advantage of
Typescript over JavaScript is that Typescript is a superset of JavaScript. So Typescript designed for the
development of a large program that Trans compile to JavaScript. But Typescript may be used to develop a
JavaScript application for both client-side and server-side.
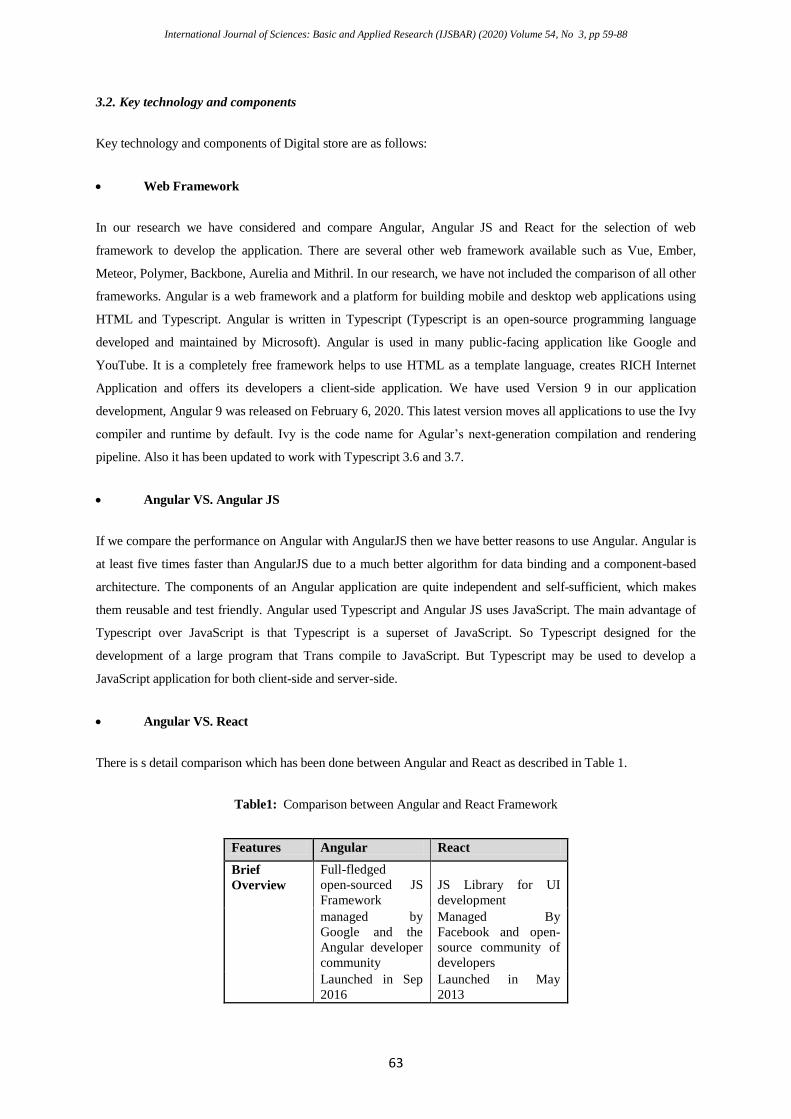
Angular VS. React
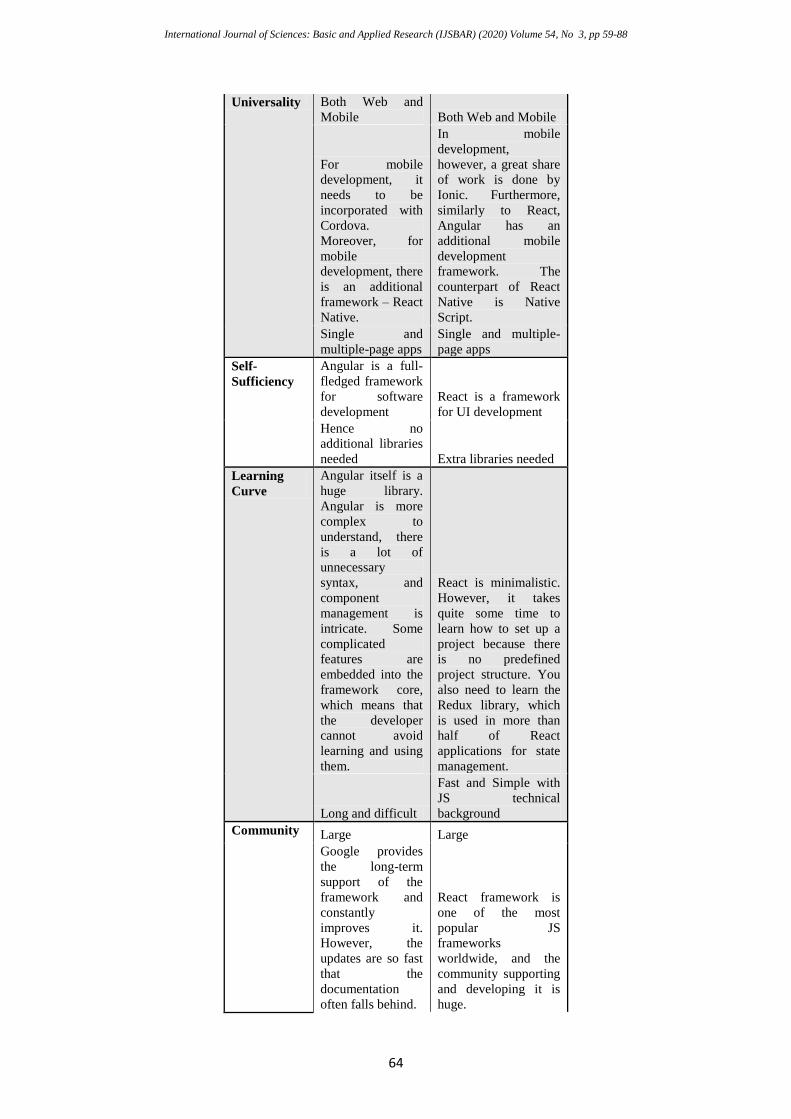
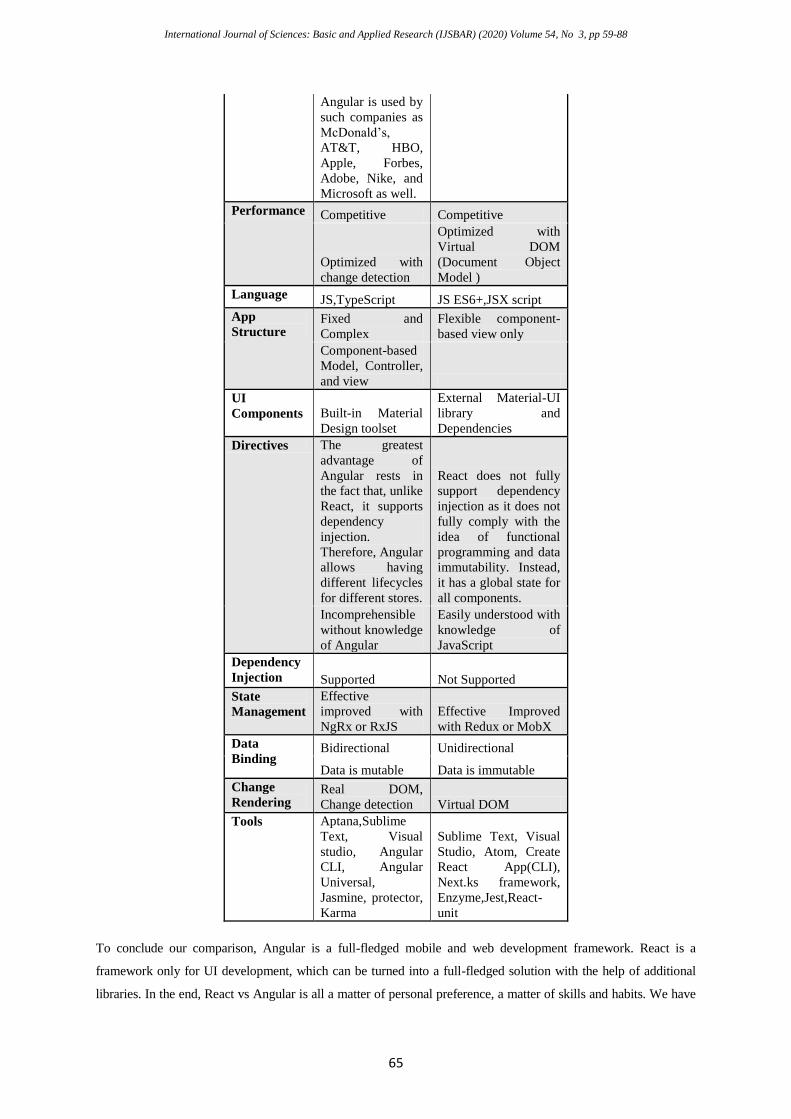
There is s detail comparison which has been done between Angular and React as described in Table 1.
Table1: Comparison between Angular and React Framework
Features Angular React
Brief
Overview
Full-fledged
open-sourced JS
Framework
JS Library for UI
development
managed by
Google and the
Angular developer
community
Managed By
Facebook and open-
source community of
developers
Launched in Sep
2016
Launched in May
2013
International Journal of Sciences: Basic and Applied Research (IJSBAR) (2020) Volume 54, No 3, pp 59-88
64
Universality Both Web and
Mobile Both Web and Mobile
For mobile
development, it
needs to be
incorporated with
Cordova.
Moreover, for
mobile
development, there
is an additional
framework – React
Native.
In mobile
development,
however, a great share
of work is done by
Ionic. Furthermore,
similarly to React,
Angular has an
additional mobile
development
framework. The
counterpart of React
Native is Native
Script.
Single and
multiple-page apps
Single and multiple-
page apps
Self-
Sufficiency
Angular is a full-
fledged framework
for software
development
React is a framework
for UI development
Hence no
additional libraries
needed Extra libraries needed
Learning
Curve
Angular itself is a
huge library.
Angular is more
complex to
understand, there
is a lot of
unnecessary
syntax, and
component
management is
intricate. Some
complicated
features are
embedded into the
framework core,
which means that
the developer
cannot avoid
learning and using
them.
React is minimalistic.
However, it takes
quite some time to
learn how to set up a
project because there
is no predefined
project structure. You
also need to learn the
Redux library, which
is used in more than
half of React
applications for state
management.
Long and difficult
Fast and Simple with
JS technical
background
Community Large Large
Google provides
the long-term
support of the
framework and
constantly
improves it.
However, the
updates are so fast
that the
documentation
often falls behind.
React framework is
one of the most
popular JS
frameworks
worldwide, and the
community supporting
and developing it is
huge.
International Journal of Sciences: Basic and Applied Research (IJSBAR) (2020) Volume 54, No 3, pp 59-88
65
Angular is used by
such companies as
McDonald’s,
AT&T, HBO,
Apple, Forbes,
Adobe, Nike, and
Microsoft as well.
Performance Competitive Competitive
Optimized with
change detection
Optimized with
Virtual DOM
(Document Object
Model )
Language JS,TypeScript JS ES6+,JSX script
App
Structure Fixed and
Complex
Flexible component-
based view only
Component-based
Model, Controller,
and view
UI
Components Built-in Material
Design toolset
External Material-UI
library and
Dependencies
Directives The greatest
advantage of
Angular rests in
the fact that, unlike
React, it supports
dependency
injection.
Therefore, Angular
allows having
different lifecycles
for different stores.
React does not fully
support dependency
injection as it does not
fully comply with the
idea of functional
programming and data
immutability. Instead,
it has a global state for
all components.
Incomprehensible
without knowledge
of Angular
Easily understood with
knowledge of
JavaScript
Dependency
Injection Supported Not Supported
State
Management
Effective
improved with
NgRx or RxJS
Effective Improved
with Redux or MobX
Data
Binding Bidirectional Unidirectional
Data is mutable Data is immutable
Change
Rendering Real DOM,
Change detection Virtual DOM
Tools Aptana,Sublime
Text, Visual
studio, Angular
CLI, Angular
Universal,
Jasmine, protector,
Karma
Sublime Text, Visual
Studio, Atom, Create
React App(CLI),
Next.ks framework,
Enzyme,Jest,React-
unit
To conclude our comparison, Angular is a full-fledged mobile and web development framework. React is a
framework only for UI development, which can be turned into a full-fledged solution with the help of additional
libraries. In the end, React vs Angular is all a matter of personal preference, a matter of skills and habits. We have
International Journal of Sciences: Basic and Applied Research (IJSBAR) (2020) Volume 54, No 3, pp 59-88
66
used Angular v9 for the application development.
Microsoft SharePoint online
SharePoint is a cloud-based service offered from Microsoft that helps organizations share and manage content,
knowledge, and applications to empower teamwork, quickly find information and seamlessly collaborate across the
organization. In our research and deployment we have privileged enterprise infrastructure setup of SharePoint
online in cloud to host the application that provides single sign on authentication using O365 with directory
services, out of the box workflow development for email send and receive and host the database using SharePoint
online Document library and SharePoint lists.
Modern Authentication
Modern Authentication is the term Microsoft uses to refer to their implementation of the OAuth 2.0 authorization
framework for client/server authentication. By default, modern authentication is enabled for SharePoint online.
SharePoint content database
A content database is a database file that stores content for one or more site collections for SharePoint web
application. The content can be pages, files, documents, images and much more. In our case, we have used
SharePoint document library, lists and images to save the Catalog information.
SharePoint Online Workflow
Workflows help people to collaborate on documents and to manage project tasks by implementing business
processes on documents and items in a SharePoint site. There are five commonly used Workflows that can be set
up within SharePoint: 1) Approval Workflows,2) Status Workflows,3) Notification Workflows,4) Automation
Workflows, and 5) Custom Workflows. In our research and deployment we have set up custom workflow to send
emails for Feedback and support form.
Visual studio Code
We have used Visual studio Code for code development. Visual Studio Code is a lightweight but powerful free-
source code editor made by Microsoft for Windows, Linux and macOS that runs on your desktop. It has built-in
source code control including Git support. The Visual Studio (VS) Code product itself ships under a standard
Microsoft product license, as it has a small percentage of Microsoft-specific customizations. It’s free despite the
commercial license. We have all the good reasons to use VS Code for our research and tool deployment.
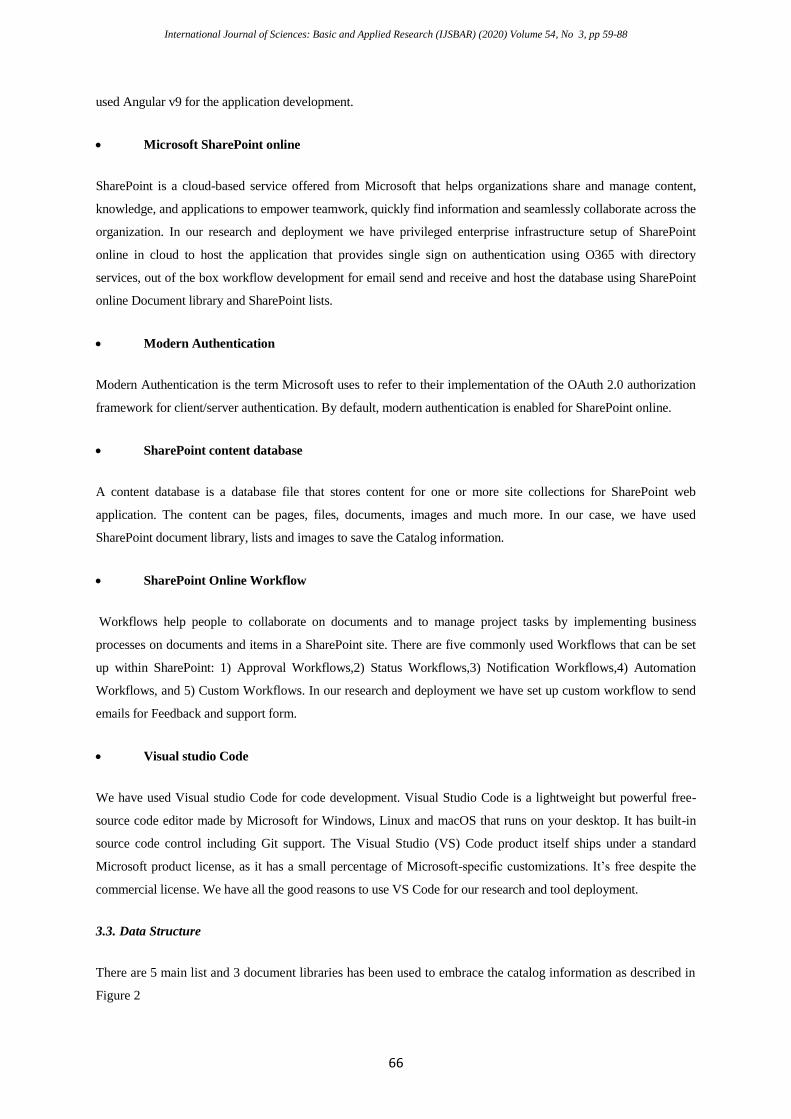
3.3. Data Structure
There are 5 main list and 3 document libraries has been used to embrace the catalog information as described in
Figure 2
International Journal of Sciences: Basic and Applied Research (IJSBAR) (2020) Volume 54, No 3, pp 59-88
67
Figure 2: SharePoint content database
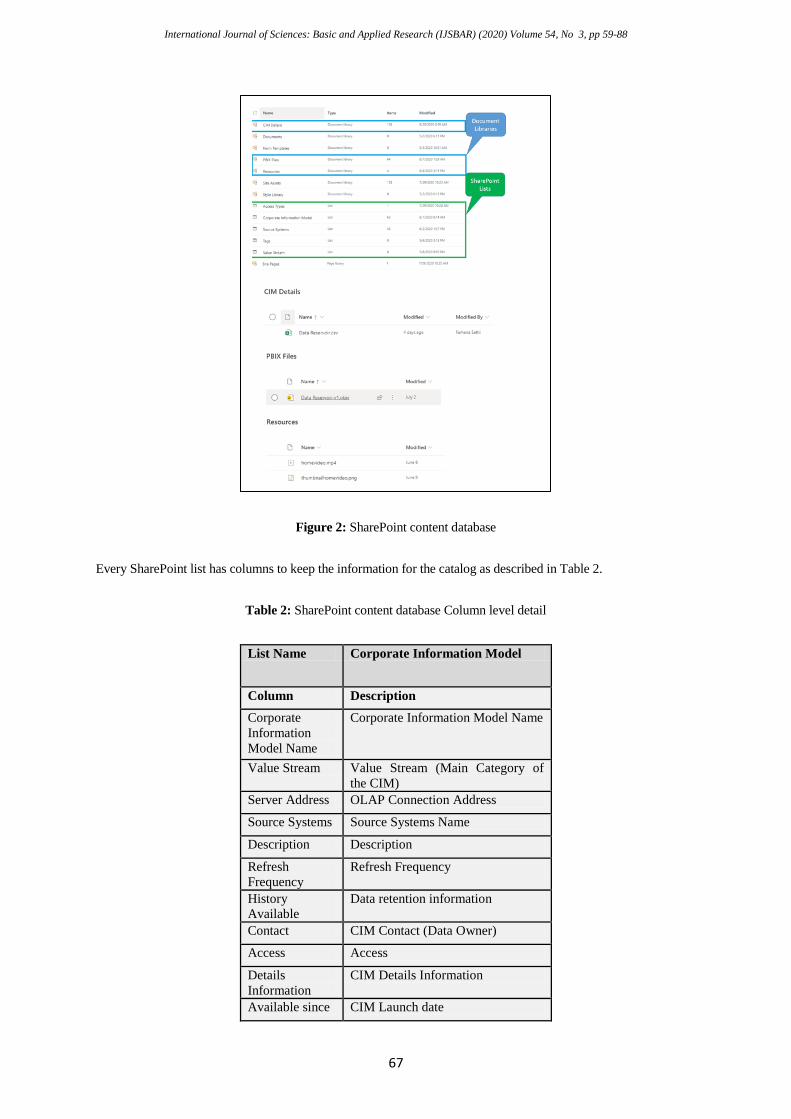
Every SharePoint list has columns to keep the information for the catalog as described in Table 2.
Table 2: SharePoint content database Column level detail
List Name Corporate Information Model
Column Description
Corporate
Information
Model Name
Corporate Information Model Name
Value Stream Value Stream (Main Category of
the CIM)
Server Address OLAP Connection Address
Source Systems Source Systems Name
Description Description
Refresh
Frequency
Refresh Frequency
History
Available
Data retention information
Contact CIM Contact (Data Owner)
Access Access
Details
Information
CIM Details Information
Available since CIM Launch date

International Journal of Sciences: Basic and Applied Research (IJSBAR) (2020) Volume 54, No 3, pp 59-88
68
Tags Tags
CSV File Path CSV File Path for the CIM model
data dictionary
PBIX File Path PBIX File Path
Status Status of the CIM Model
(Production or under development)
List Name Source Systems
Title Enterprise data source system name
List Name Tags
Tag Name Tags name/ Taxonomy to the
catalogs
TagColor Display color for the tags
List Name Value Streams
Value Stream
Name
Main category mapping name
Value Stream
Owner
Category Owner
Value Stream
Data Owner
Category Data Owner
Value Stream
Description
Category description
Value Stream
Acronym
Category Acronym
List Name Access Types
Access Name Access application name
Access Link Access application link
Help Link
3.4. Mapping Techniques
A Smart mapping technique has been used to map OLAP catalog directory with CIM catalog and categories as
described in Figure 3.
Figure 3: Column mapping for Data association
International Journal of Sciences: Basic and Applied Research (IJSBAR) (2020) Volume 54, No 3, pp 59-88
69
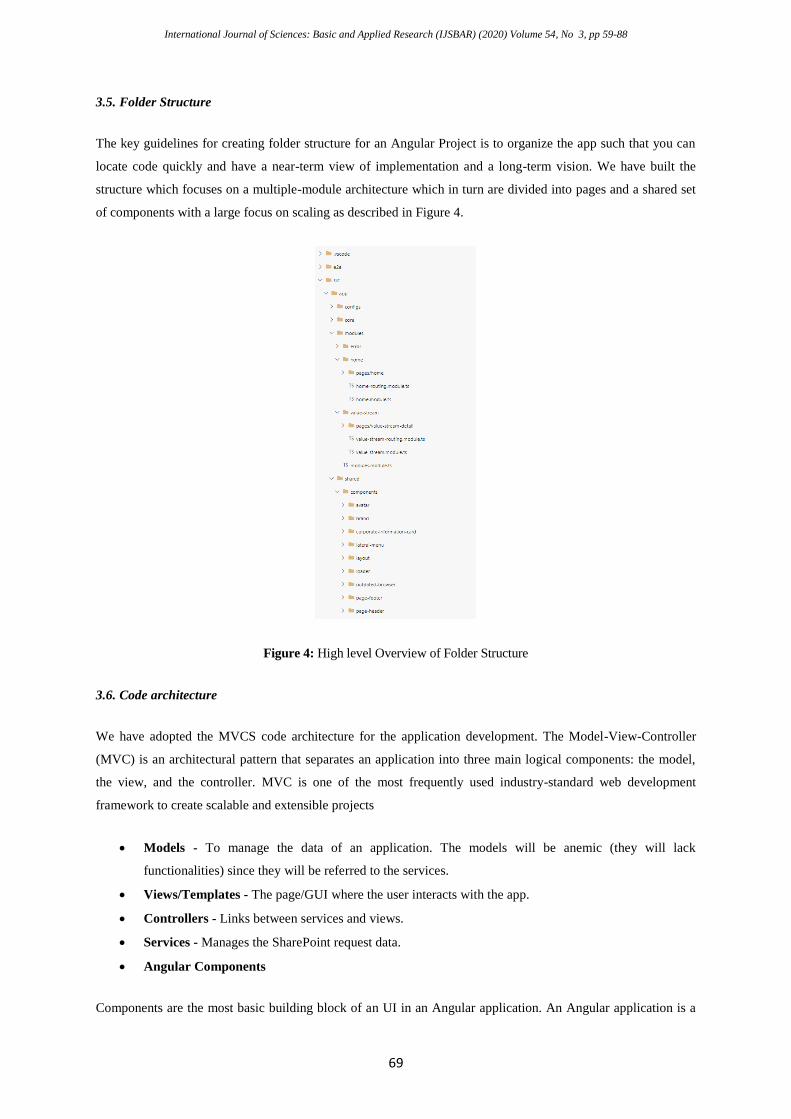
3.5. Folder Structure
The key guidelines for creating folder structure for an Angular Project is to organize the app such that you can
locate code quickly and have a near-term view of implementation and a long-term vision. We have built the
structure which focuses on a multiple-module architecture which in turn are divided into pages and a shared set
of components with a large focus on scaling as described in Figure 4.
Figure 4: High level Overview of Folder Structure
3.6. Code architecture
We have adopted the MVCS code architecture for the application development. The Model-View-Controller
(MVC) is an architectural pattern that separates an application into three main logical components: the model,
the view, and the controller. MVC is one of the most frequently used industry-standard web development
framework to create scalable and extensible projects
Models - To manage the data of an application. The models will be anemic (they will lack
functionalities) since they will be referred to the services.
Views/Templates - The page/GUI where the user interacts with the app.
Controllers - Links between services and views.
Services - Manages the SharePoint request data.
Angular Components
Components are the most basic building block of an UI in an Angular application. An Angular application is a

International Journal of Sciences: Basic and Applied Research (IJSBAR) (2020) Volume 54, No 3, pp 59-88
70
tree of Angular components. Every page has multiple components and one component can belong to many
pages. Below is an example of components breakdown and association with the Storefront landing Page as
described in Figure 5.
Figure 5: Components Association with the Web page
There are no more or less important components, all are important, but there are more complex or more used
components.
3.7. Key Components
There are over 20 components being used to develop the application with all the required features in the scope.
Top 3 key components has been identified and mentioned below in Figure 6, 7 and 8.
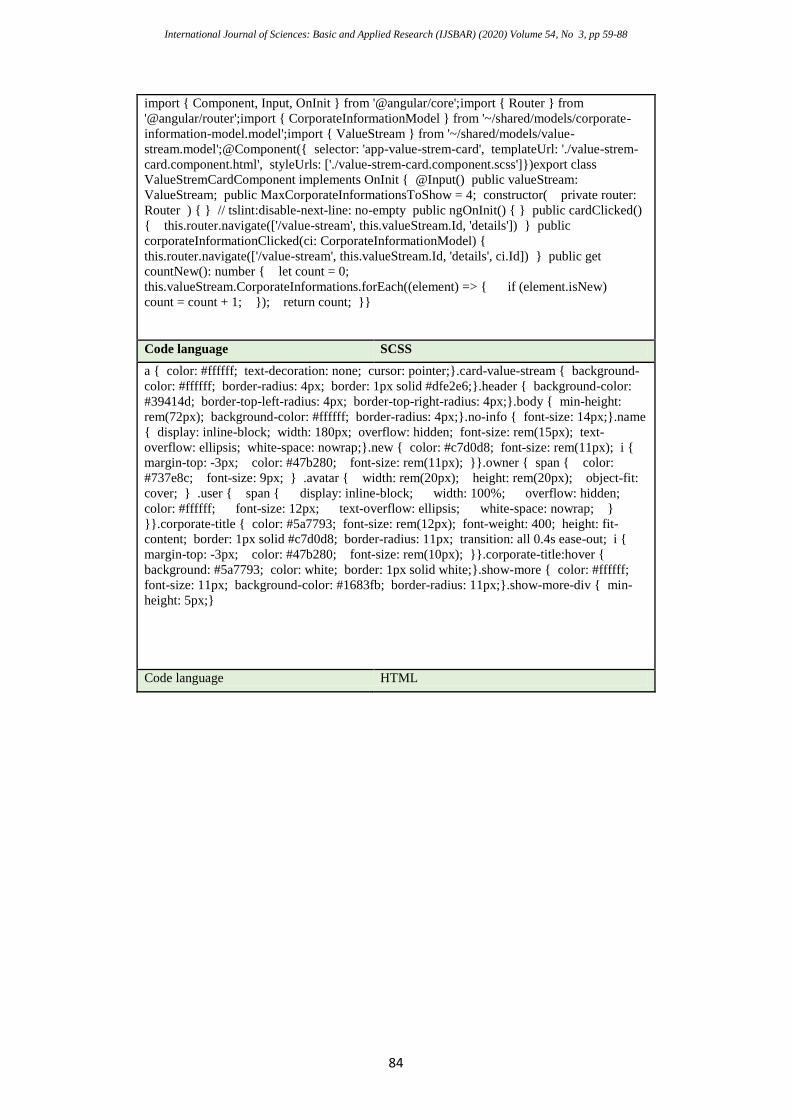
Value Stream Card
Figure 6: Value Stream Card
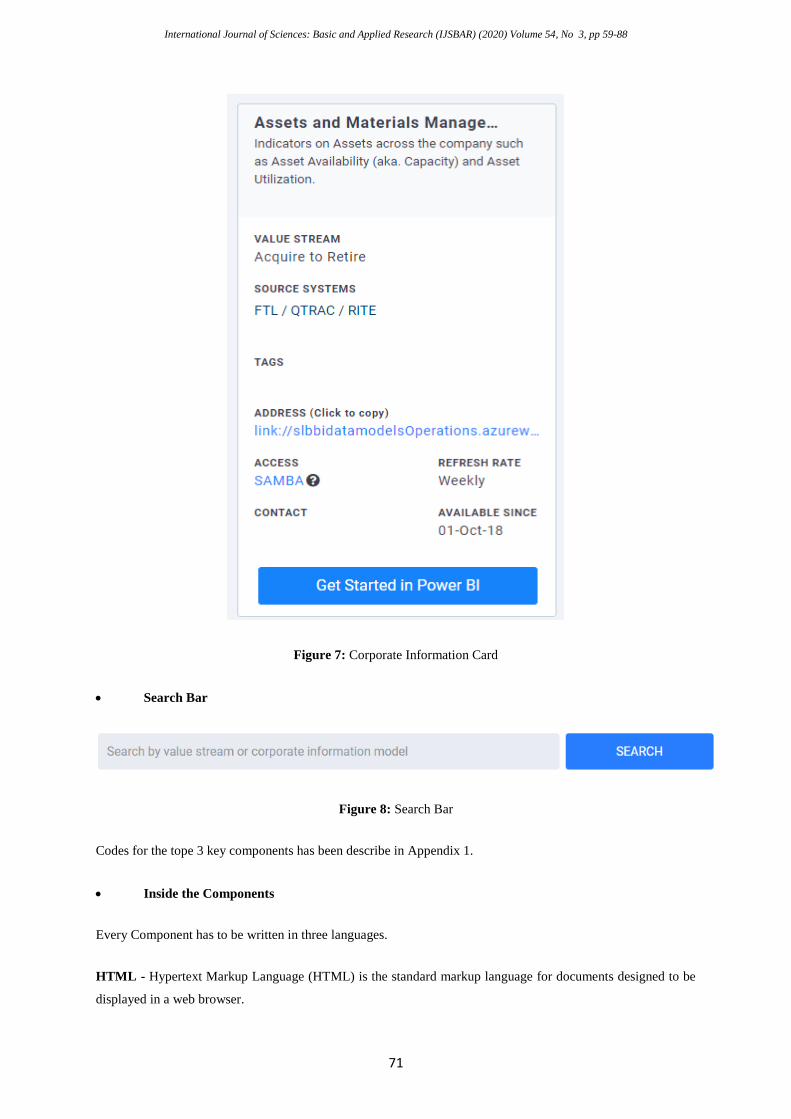
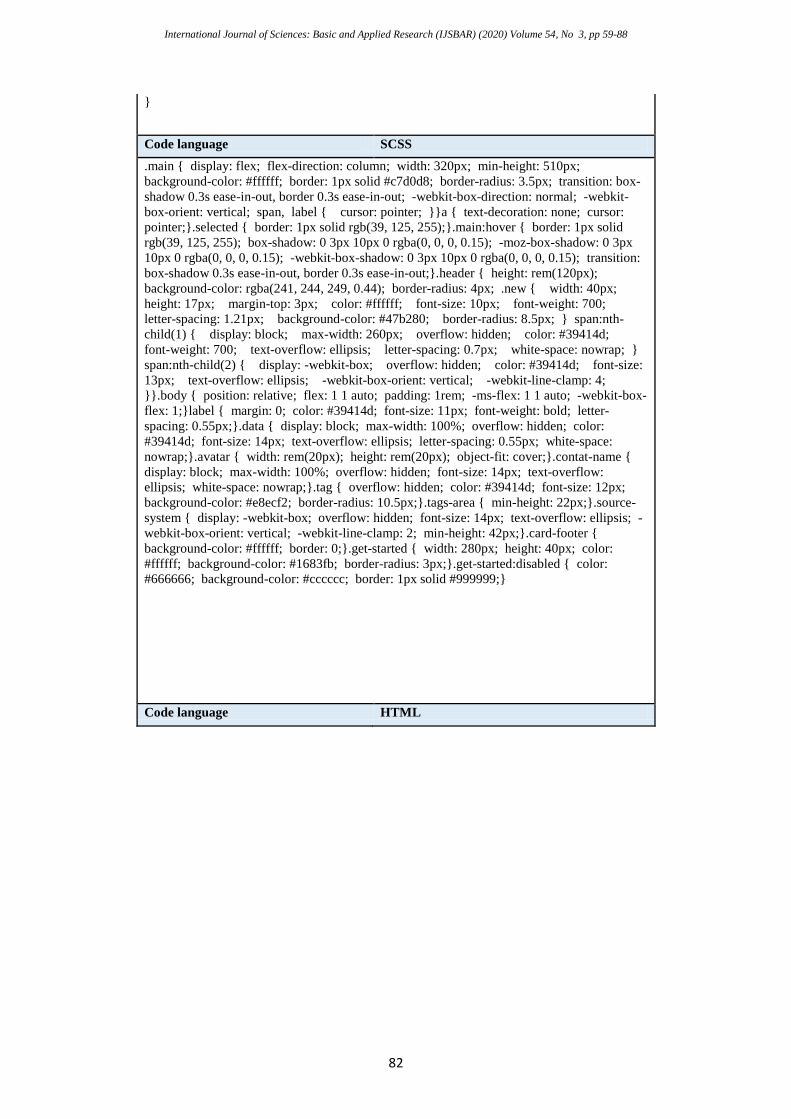
Corporate Information Card
International Journal of Sciences: Basic and Applied Research (IJSBAR) (2020) Volume 54, No 3, pp 59-88
71
Figure 7: Corporate Information Card
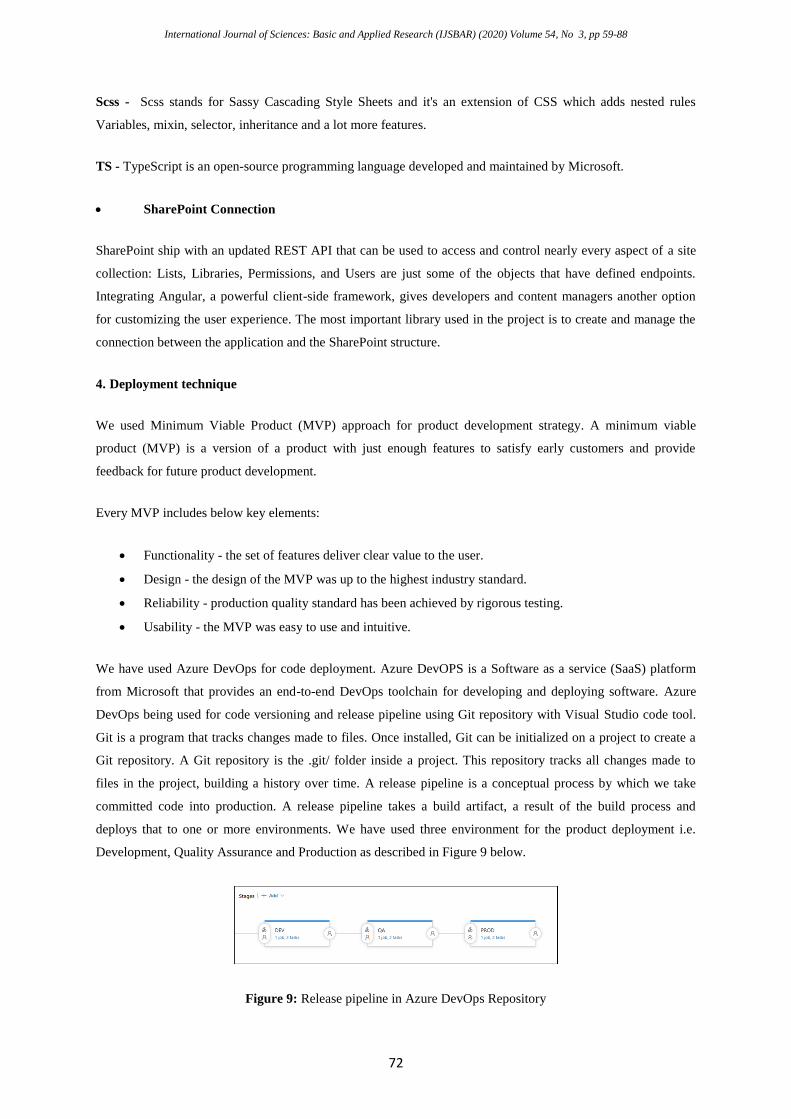
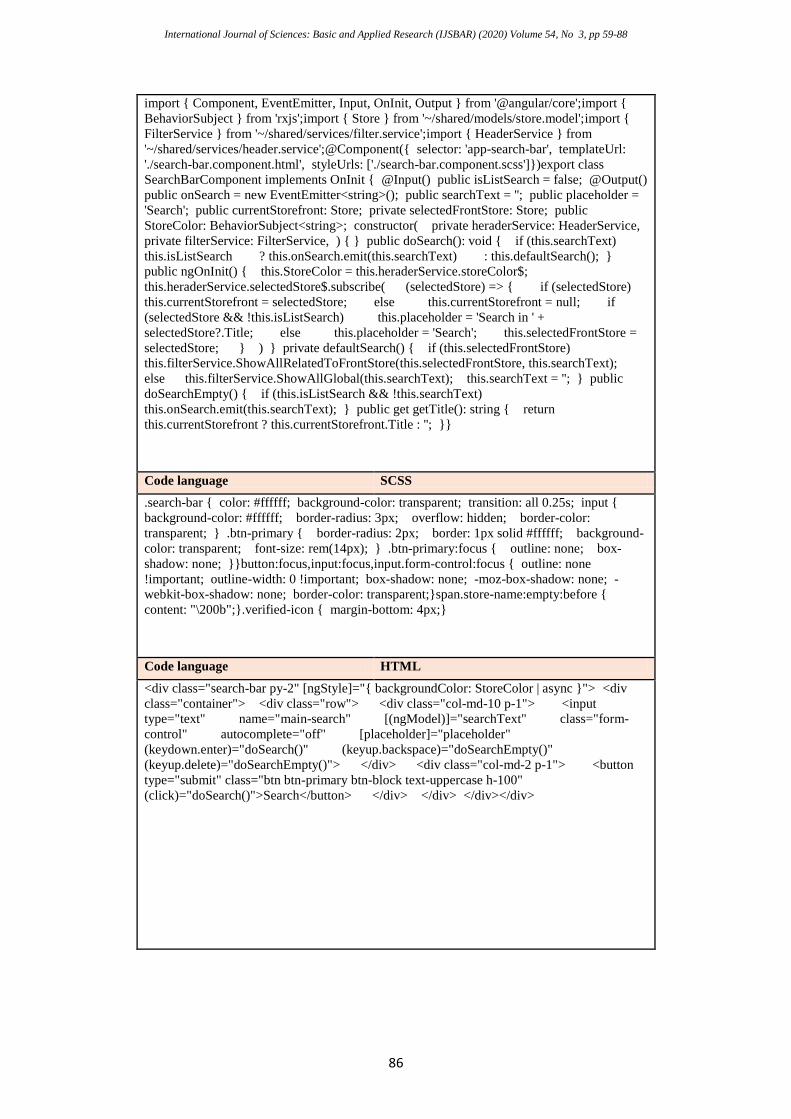
Search Bar
Figure 8: Search Bar
Codes for the tope 3 key components has been describe in Appendix 1.
Inside the Components
Every Component has to be written in three languages.
HTML - Hypertext Markup Language (HTML) is the standard markup language for documents designed to be
displayed in a web browser.
International Journal of Sciences: Basic and Applied Research (IJSBAR) (2020) Volume 54, No 3, pp 59-88
72
Scss - Scss stands for Sassy Cascading Style Sheets and it's an extension of CSS which adds nested rules
Variables, mixin, selector, inheritance and a lot more features.
TS - TypeScript is an open-source programming language developed and maintained by Microsoft.
SharePoint Connection
SharePoint ship with an updated REST API that can be used to access and control nearly every aspect of a site
collection: Lists, Libraries, Permissions, and Users are just some of the objects that have defined endpoints.
Integrating Angular, a powerful client-side framework, gives developers and content managers another option
for customizing the user experience. The most important library used in the project is to create and manage the
connection between the application and the SharePoint structure.
4. Deployment technique
We used Minimum Viable Product (MVP) approach for product development strategy. A minimum viable
product (MVP) is a version of a product with just enough features to satisfy early customers and provide
feedback for future product development.
Every MVP includes below key elements:
Functionality - the set of features deliver clear value to the user.
Design - the design of the MVP was up to the highest industry standard.
Reliability - production quality standard has been achieved by rigorous testing.
Usability - the MVP was easy to use and intuitive.
We have used Azure DevOps for code deployment. Azure DevOPS is a Software as a service (SaaS) platform
from Microsoft that provides an end-to-end DevOps toolchain for developing and deploying software. Azure
DevOps being used for code versioning and release pipeline using Git repository with Visual Studio code tool.
Git is a program that tracks changes made to files. Once installed, Git can be initialized on a project to create a
Git repository. A Git repository is the .git/ folder inside a project. This repository tracks all changes made to
files in the project, building a history over time. A release pipeline is a conceptual process by which we take
committed code into production. A release pipeline takes a build artifact, a result of the build process and
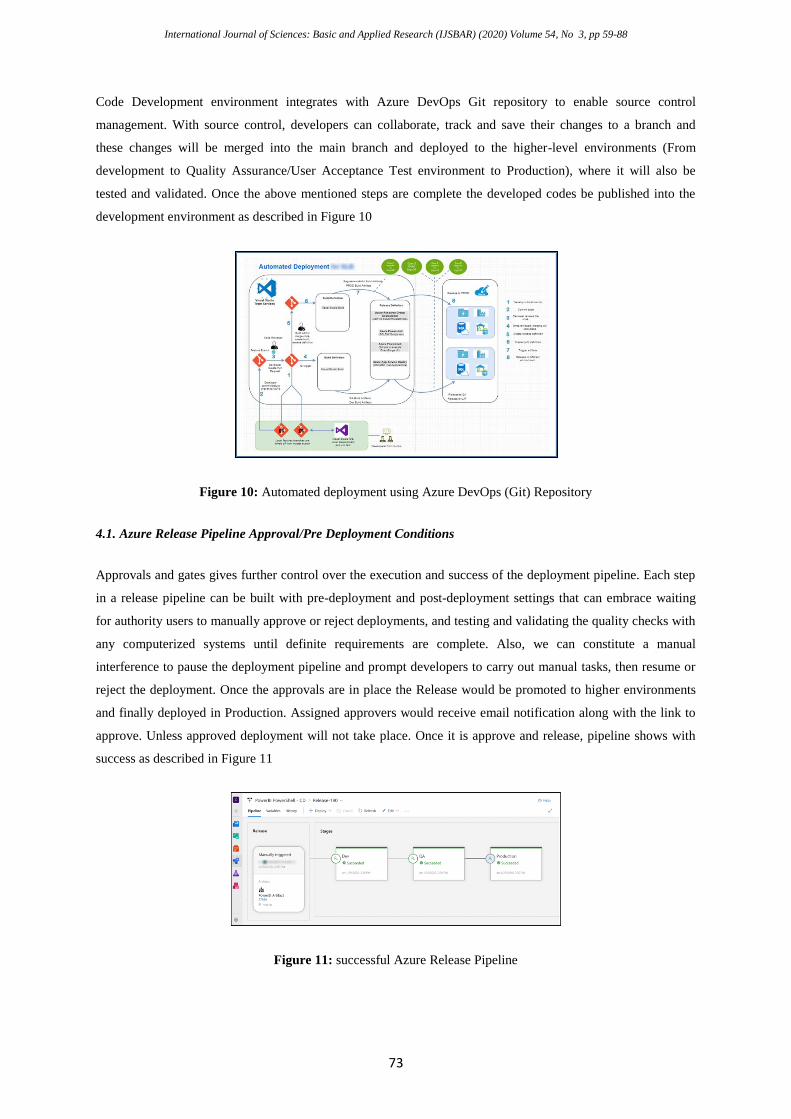
deploys that to one or more environments. We have used three environment for the product deployment i.e.
Development, Quality Assurance and Production as described in Figure 9 below.
Figure 9: Release pipeline in Azure DevOps Repository
International Journal of Sciences: Basic and Applied Research (IJSBAR) (2020) Volume 54, No 3, pp 59-88
73
Code Development environment integrates with Azure DevOps Git repository to enable source control
management. With source control, developers can collaborate, track and save their changes to a branch and
these changes will be merged into the main branch and deployed to the higher-level environments (From
development to Quality Assurance/User Acceptance Test environment to Production), where it will also be
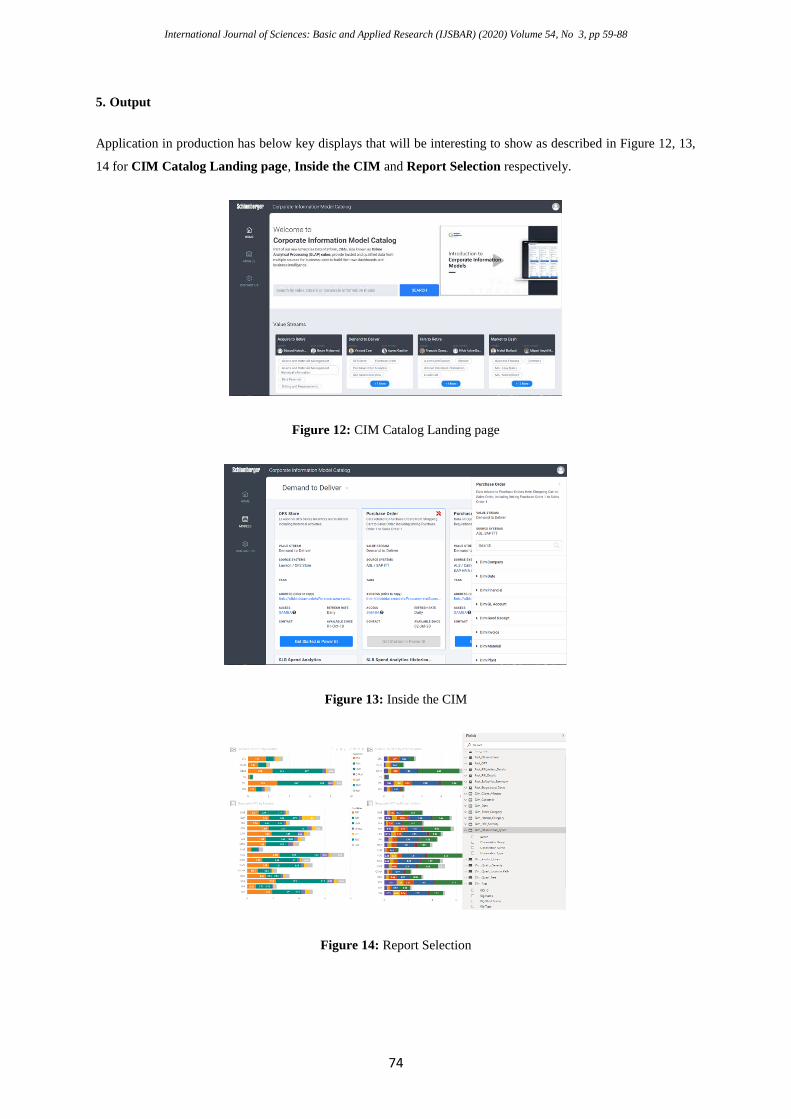
tested and validated. Once the above mentioned steps are complete the developed codes be published into the
development environment as described in Figure 10
Figure 10: Automated deployment using Azure DevOps (Git) Repository
4.1. Azure Release Pipeline Approval/Pre Deployment Conditions
Approvals and gates gives further control over the execution and success of the deployment pipeline. Each step
in a release pipeline can be built with pre-deployment and post-deployment settings that can embrace waiting
for authority users to manually approve or reject deployments, and testing and validating the quality checks with
any computerized systems until definite requirements are complete. Also, we can constitute a manual
interference to pause the deployment pipeline and prompt developers to carry out manual tasks, then resume or
reject the deployment. Once the approvals are in place the Release would be promoted to higher environments
and finally deployed in Production. Assigned approvers would receive email notification along with the link to
approve. Unless approved deployment will not take place. Once it is approve and release, pipeline shows with
success as described in Figure 11
Figure 11: successful Azure Release Pipeline
International Journal of Sciences: Basic and Applied Research (IJSBAR) (2020) Volume 54, No 3, pp 59-88
74
5. Output
Application in production has below key displays that will be interesting to show as described in Figure 12, 13,
14 for CIM Catalog Landing page, Inside the CIM and Report Selection respectively.
Figure 12: CIM Catalog Landing page
Figure 13: Inside the CIM
Figure 14: Report Selection
International Journal of Sciences: Basic and Applied Research (IJSBAR) (2020) Volume 54, No 3, pp 59-88
75
6. Utilization tracking
Utilization tracking for the Web application is one of the key strategy to get the adoption over the period of
time. If you're not tracking enough data, you won't see how trends change over time or why some users behave
one way versus another. You won't understand user engagement. Ultimately, you just won't have the knowledge
to make smart product or marketing decisions. We have enabled and configured Utilization of the CIM Catalog
application due to the precise reasons as follows.
To find out which storefront bring the most traffic and conversions.
Determine where the best visitors are located in the worldwide.
Learn what people are searching for on the application.
Visualize what people click on the most.
Uncover the top content. Which pages keep the visitors on the site the longest.
To identify the worst performing pages.
Determine where people abandon due to having multiple clicks
We have used and compared SharePoint activity tracker and Google analytics to enable application tracking.
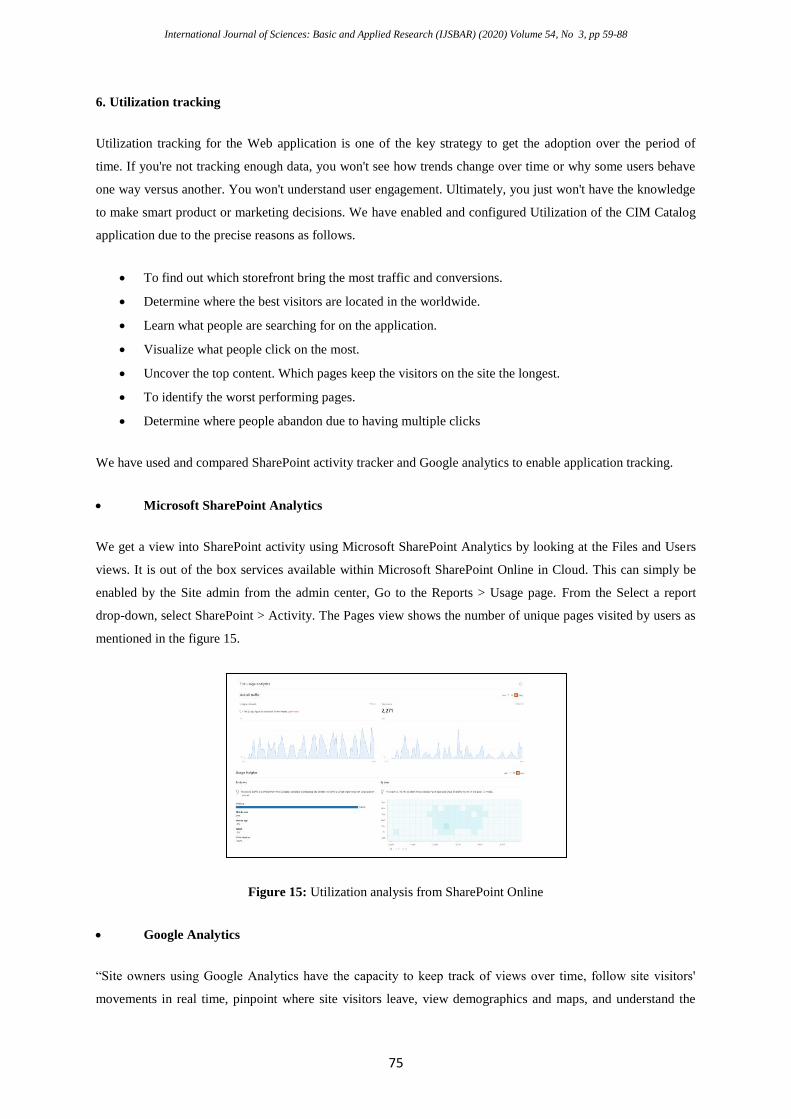
Microsoft SharePoint Analytics
We get a view into SharePoint activity using Microsoft SharePoint Analytics by looking at the Files and Users
views. It is out of the box services available within Microsoft SharePoint Online in Cloud. This can simply be
enabled by the Site admin from the admin center, Go to the Reports > Usage page. From the Select a report
drop-down, select SharePoint > Activity. The Pages view shows the number of unique pages visited by users as
mentioned in the figure 15.
Figure 15: Utilization analysis from SharePoint Online
Google Analytics
“Site owners using Google Analytics have the capacity to keep track of views over time, follow site visitors'
movements in real time, pinpoint where site visitors leave, view demographics and maps, and understand the

International Journal of Sciences: Basic and Applied Research (IJSBAR) (2020) Volume 54, No 3, pp 59-88
76
search terms that initially brought visitors to the website”[7].Google Analytics provide detail analysis and is
used to track website activity such as session duration, pages per session, bounce rate etc. of individuals using
the site, along with the information on the source of the traffic. In order for Google Analytics to function, we
were required to put JavaScript tracking code on each page of our application. When a visitor comes to the
application, the tracking code runs and sends tracking data to Google’s data collection servers. Hence, we have
enabled monitoring for usage analysis over the period of time by adding below line of tracking code in the html
as described in Table 3.
Table 3: Tracking code for Google Analytic
<!-- Global site tag (gtag.js) - Google Analytics -->
<script async src="https://www.googletagmanager.com/gtag/js?id=UA-<XXXXXXXXX-X>"></script>
<script>
window.dataLayer = window.dataLayer || [];
function gtag(){dataLayer.push(arguments);}
gtag('js', new Date());
gtag('config', '-<XXXXXXXXX-X>');
</script>
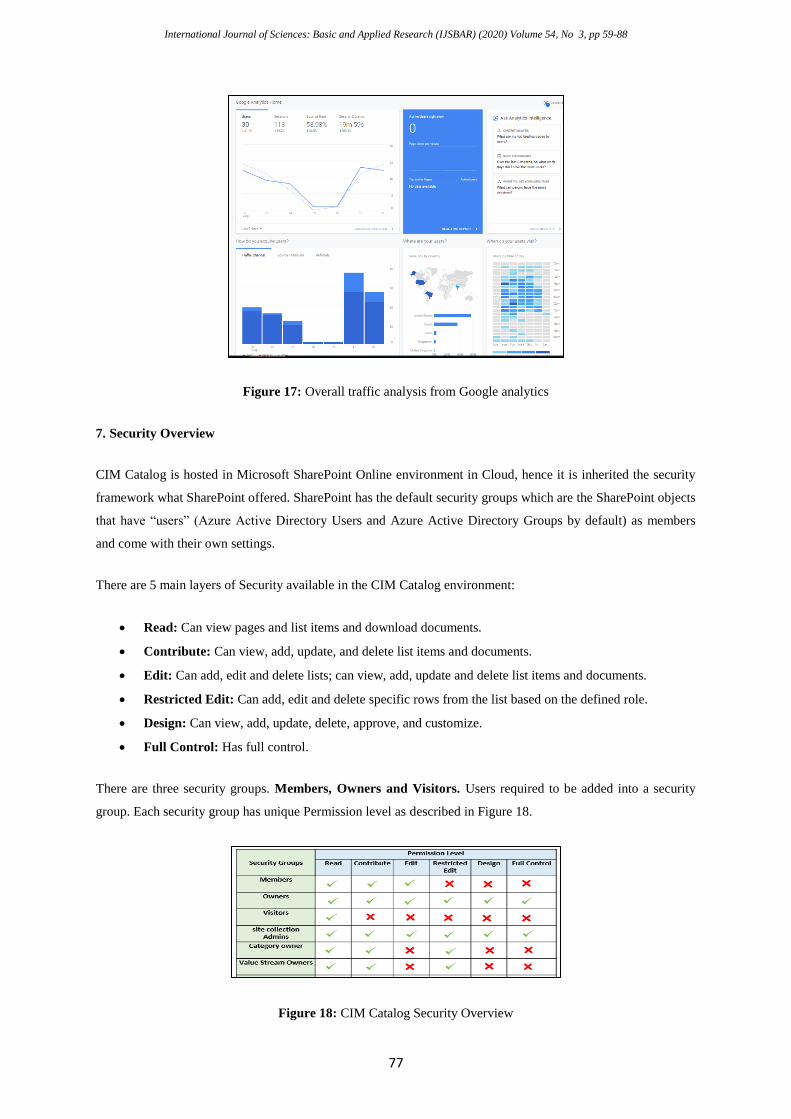
In our analysis we decided to use Google analytics as it provides detail and comprehensive active user’s trend
over the period of time as described in Figure 16 and Figure 17 below.
Figure 16: Active user’s trend in Google Analytics
International Journal of Sciences: Basic and Applied Research (IJSBAR) (2020) Volume 54, No 3, pp 59-88
77
Figure 17: Overall traffic analysis from Google analytics
7. Security Overview
CIM Catalog is hosted in Microsoft SharePoint Online environment in Cloud, hence it is inherited the security
framework what SharePoint offered. SharePoint has the default security groups which are the SharePoint objects
that have “users” (Azure Active Directory Users and Azure Active Directory Groups by default) as members
and come with their own settings.
There are 5 main layers of Security available in the CIM Catalog environment:
Read: Can view pages and list items and download documents.
Contribute: Can view, add, update, and delete list items and documents.
Edit: Can add, edit and delete lists; can view, add, update and delete list items and documents.
Restricted Edit: Can add, edit and delete specific rows from the list based on the defined role.
Design: Can view, add, update, delete, approve, and customize.
Full Control: Has full control.
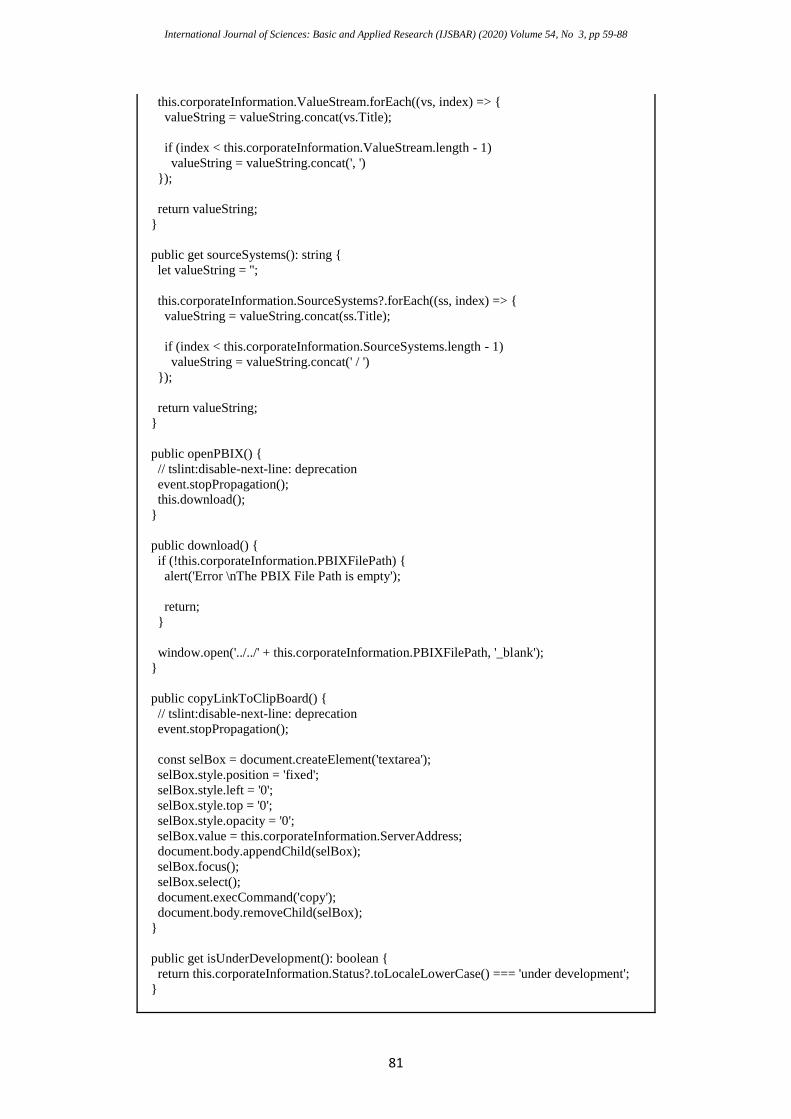
There are three security groups. Members, Owners and Visitors. Users required to be added into a security
group. Each security group has unique Permission level as described in Figure 18.
Figure 18: CIM Catalog Security Overview
International Journal of Sciences: Basic and Applied Research (IJSBAR) (2020) Volume 54, No 3, pp 59-88
78
8. Self-Service for Catalog maintenance
Self-service is the practice of serving oneself and empowered the clients. We have designed and built the
application in a way that it required least support and maintenance from the CIM portal Admins and IT Staff.
One of the key benefits of self-service to an organization is that they save on resources. Also Customers have
better control and privilege on the Content and hence engagement and adoption will increase eventually. We
have considered all those factors in the consideration and designed CIM Catalog application in such a manner
where Category Owner, Product Owners and Co-Owners can maintain their assigned catalog and CIMs on their
own.
Content is the essence of any digital application. The CIM catalog has to be current, consistent, and correct.
There are three main components of CIM Catalog that require to be updated and accurate all the time.
CIM catalog Models and their detail
Data definitions
Connection detail and Power BI report
Every Category Owner, Product Owners and Co-Owners can add/edit or update their assigned CIM models
information from the administrator console from the front end of the CIM portal application.
9. Conclusions
In this paper, we demonstrate that how Corporate information model using OLAP approach can serve as self-
service strategy to business users from corporate level systems. The proposed method can be implemented to
any large organization. The developed scripts has been implemented in real time in the organization.
Furthermore, if the identified approach is also suitable for different processes, the scope of the analysis can be
extended using a similar approach.
10. Recommendation
We recommend further experimental and theoretical studies for Self Service Business Intelligence (SSBI) that
can directly connect to OLAP Cubes and provide a robust solution. “Many researchers argue that most studies
in the field of information systems are predominantly empirical and that more literature studies are needed” [8,
9, 10].
References
[1]. Shaker H. AliEl-Sappagha ;Abdeltawab M. AhmedHendawib;Ali HamedEl Bastawissy. Journal of
King Saud University - Computer and Information Sciences. Volume 23, Issue 2, July 2011, Pages 91-
104
[2]. Paul Brunet. The rise of self-service analytics. http://analytics-magazine.org/rise-self-service-analytics/.
Digital Edition;INFORMS Analytics Society

International Journal of Sciences: Basic and Applied Research (IJSBAR) (2020) Volume 54, No 3, pp 59-88
79
[3]. Ali-Eldin, Amr & zaghloul, M & Salem, Mofreh. (2013). Towards a Self-service Data Analytics
Framework. International Journal of Computer Applications. 80. 41-48. 10.5120/13893-1840.
[4]. Christian Lennerholt University of Skövde. Implementation Challenges of Self Service Business
Intelligence:A Literature Review. Proceedings of the 51st Hawaii International Conference on System
Sciences | 2018
[5]. W. Eckerson, "Business-driven BI: Using New Technologies to Foster Self-Service Access to
Insights", Tableau Software, 2012.
[6]. S. Williams and N. Williams, "The profit impact of business intelligence", Morgan Kaufmann, 2010.
[7]. E. J. Petersen and B. M. Martin, "Misuse, play, and dis-use: Technical and professional
communication's role in understanding and supporting website owners' engagement with Google
Analytics," 2015 IEEE International Professional Communication Conference (IPCC), Limerick, 2015,
pp. 1-5, doi: 10.1109/IPCC.2015.7235786.
[8]. F. Rowe, "What literature review is not: diversity, boundaries and recommendations", European
Journal of Information Systems, 2014, pp. 241-255.
[9]. J. Webster and R. T. Watson, "Analyzing the past to prepare for the future: Writing a literature review",
MIS quarterly, 2002, pp. xiii-xxiii.
[10]. I. Benbasat and R. Weber, "Research Commentary: Rethinking "Diversity" in Information Systems
Research", Information Systems Research, 1996, pp. 389 - 399.

International Journal of Sciences: Basic and Applied Research (IJSBAR) (2020) Volume 54, No 3, pp 59-88
80
Appendix 1
Table 4
Card name Corporate Information Card
Code language TS
import { HttpClient } from '@angular/common/http';
import { Component, EventEmitter, Input, OnInit, Output } from '@angular/core';
import { take } from 'rxjs/operators';
import { AccessType } from '~/shared/models/access-type.model';
import { CorporateInformationModel } from '~/shared/models/corporate-information-
model.model';
import { AccessTypeService } from '~/shared/services/access-type.service';
@Component({
selector: 'app-corporate-information-card',
templateUrl: './corporate-information-card.component.html',
styleUrls: ['./corporate-information-card.component.scss']
})
export class CorporateInformationCardComponent implements OnInit {
@Output()
public cardClicked = new EventEmitter();
@Input()
public corporateInformation: CorporateInformationModel;
@Input()
public parentSelectedIdx = -1;
public accessTypes: Array<AccessType> = [];
// public html = `<span style="min-width: 100px;" class="btn-block btn-danger well-
sm">Never trust not sanitized HTML!!!</span>`;
constructor(private httpClient: HttpClient,
private accessTypeService: AccessTypeService) { }
// tslint:disable-next-line: no-empty
public ngOnInit(): void {
this.accessTypeService.getAccessTypeById(this.corporateInformation.AccessTypes.map((t)
=> { return t.Id }))
.pipe(take(1))
.subscribe((at) => {
this.accessTypes = at;
})
}
public navigate() {
this.cardClicked.emit(this.corporateInformation);
}
public get valueStreams(): string {
let valueString = '';
International Journal of Sciences: Basic and Applied Research (IJSBAR) (2020) Volume 54, No 3, pp 59-88
81
this.corporateInformation.ValueStream.forEach((vs, index) => {
valueString = valueString.concat(vs.Title);
if (index < this.corporateInformation.ValueStream.length - 1)
valueString = valueString.concat(', ')
});
return valueString;
}
public get sourceSystems(): string {
let valueString = '';
this.corporateInformation.SourceSystems?.forEach((ss, index) => {
valueString = valueString.concat(ss.Title);
if (index < this.corporateInformation.SourceSystems.length - 1)
valueString = valueString.concat(' / ')
});
return valueString;
}
public openPBIX() {
// tslint:disable-next-line: deprecation
event.stopPropagation();
this.download();
}
public download() {
if (!this.corporateInformation.PBIXFilePath) {
alert('Error \nThe PBIX File Path is empty');
return;
}
window.open('../../' + this.corporateInformation.PBIXFilePath, '_blank');
}
public copyLinkToClipBoard() {
// tslint:disable-next-line: deprecation
event.stopPropagation();
const selBox = document.createElement('textarea');
selBox.style.position = 'fixed';
selBox.style.left = '0';
selBox.style.top = '0';
selBox.style.opacity = '0';
selBox.value = this.corporateInformation.ServerAddress;
document.body.appendChild(selBox);
selBox.focus();
selBox.select();
document.execCommand('copy');
document.body.removeChild(selBox);
}
public get isUnderDevelopment(): boolean {
return this.corporateInformation.Status?.toLocaleLowerCase() === 'under development';
}
International Journal of Sciences: Basic and Applied Research (IJSBAR) (2020) Volume 54, No 3, pp 59-88
82
}
Code language SCSS
.main { display: flex; flex-direction: column; width: 320px; min-height: 510px;
background-color: #ffffff; border: 1px solid #c7d0d8; border-radius: 3.5px; transition: box-
shadow 0.3s ease-in-out, border 0.3s ease-in-out; -webkit-box-direction: normal; -webkit-
box-orient: vertical; span, label { cursor: pointer; }}a { text-decoration: none; cursor:
pointer;}.selected { border: 1px solid rgb(39, 125, 255);}.main:hover { border: 1px solid
rgb(39, 125, 255); box-shadow: 0 3px 10px 0 rgba(0, 0, 0, 0.15); -moz-box-shadow: 0 3px
10px 0 rgba(0, 0, 0, 0.15); -webkit-box-shadow: 0 3px 10px 0 rgba(0, 0, 0, 0.15); transition:
box-shadow 0.3s ease-in-out, border 0.3s ease-in-out;}.header { height: rem(120px);
background-color: rgba(241, 244, 249, 0.44); border-radius: 4px; .new { width: 40px;
height: 17px; margin-top: 3px; color: #ffffff; font-size: 10px; font-weight: 700;
letter-spacing: 1.21px; background-color: #47b280; border-radius: 8.5px; } span:nth-
child(1) { display: block; max-width: 260px; overflow: hidden; color: #39414d;
font-weight: 700; text-overflow: ellipsis; letter-spacing: 0.7px; white-space: nowrap; }
span:nth-child(2) { display: -webkit-box; overflow: hidden; color: #39414d; font-size:
13px; text-overflow: ellipsis; -webkit-box-orient: vertical; -webkit-line-clamp: 4;
}}.body { position: relative; flex: 1 1 auto; padding: 1rem; -ms-flex: 1 1 auto; -webkit-box-
flex: 1;}label { margin: 0; color: #39414d; font-size: 11px; font-weight: bold; letter-
spacing: 0.55px;}.data { display: block; max-width: 100%; overflow: hidden; color:
#39414d; font-size: 14px; text-overflow: ellipsis; letter-spacing: 0.55px; white-space:
nowrap;}.avatar { width: rem(20px); height: rem(20px); object-fit: cover;}.contat-name {
display: block; max-width: 100%; overflow: hidden; font-size: 14px; text-overflow:
ellipsis; white-space: nowrap;}.tag { overflow: hidden; color: #39414d; font-size: 12px;
background-color: #e8ecf2; border-radius: 10.5px;}.tags-area { min-height: 22px;}.source-
system { display: -webkit-box; overflow: hidden; font-size: 14px; text-overflow: ellipsis; -
webkit-box-orient: vertical; -webkit-line-clamp: 2; min-height: 42px;}.card-footer {
background-color: #ffffff; border: 0;}.get-started { width: 280px; height: 40px; color:
#ffffff; background-color: #1683fb; border-radius: 3px;}.get-started:disabled { color:
#666666; background-color: #cccccc; border: 1px solid #999999;}
Code language HTML

International Journal of Sciences: Basic and Applied Research (IJSBAR) (2020) Volume 54, No 3, pp 59-88
83
<a href="javascript:;" (click)="navigate()" class="cursor-pointer"> <div class="main m-2"
[ngClass]="{'selected': parentSelectedIdx === corporateInformation.Id}"> <div
*ngIf="corporateInformation" class="header d-flex flex-column px-3 pt-2"> <div
class="row no-gutters" *ngIf="corporateInformation"> <div class="d-flex col-md-11">
<span class="mr-2" [attr.title]="corporateInformation.Title">{{corporateInformation.Title}}
</span> <div class="new d-flex align-items-center justify-content-center"
*ngIf="corporateInformation.isNew">NEW</div> </div> <div
*ngIf="isUnderDevelopment" class=" d-flex justify-content-end align-items-center col-md-
1"> <i class="fas fa-tools" tooltip="Under Development"
containerClass="custom-tooltip" style=" font-size: 18px; color: #e00000;"></i>
</div> </div> <span
[attr.title]="corporateInformation.Description">{{corporateInformation.Description}}</span>
</div> <div *ngIf="corporateInformation" class="body"> <div class="d-flex flex-
column"> <label>VALUE STREAM</label> <span [attr.title]="valueStreams"
class="data">{{valueStreams}}</span> </div> <div class="d-flex flex-column mt-3">
<label>SOURCE SYSTEMS</label> <div class="row no-gutters pt-1 tags-area">
<span [attr.title]="sourceSystems" class="source-system">{{sourceSystems}}</span>
</div> </div> <div class="d-flex flex-column mt-3"> <label>TAGS</label>
<div class="row no-gutters pt-1 tags-area"> <span *ngFor="let item of
corporateInformation.Tags" class="tag mr-2 px-2 d-block">{{item.Title}}</span>
</div> </div> <div class="d-flex flex-column mt-3"> <label>ADDRESS (Click to
copy)</label> <span #pop="bs-tooltip" triggers="" tooltip="Copied to
clipboard" [attr.title]="'Click to copy to Clipboard \n' +
corporateInformation.ServerAddress" class="data"
(click)="copyLinkToClipBoard(); pop.show();" (mouseleave)="pop.hide();"
style="color: #1683fb">{{corporateInformation.ServerAddress}}</span> </div> <div
class="row"> <div class="col-md-7"> <div class="d-flex flex-column mt-3">
<label>ACCESS</label> <div class="d-flex"> <div class="d-flex"
*ngFor="let at of accessTypes"> <a (click)="$event.stopPropagation()"
style="color: #1683fb" class="data" href={{at.Url.Url}}
target="_blank">{{at.Title}} </a> <a *ngIf="at.HelpLink"
href="{{at.HelpLink.Url}}" style="font-size: 14px; color: #39414d; padding-left:
0.1rem;" (click)="$event.stopPropagation()" tooltip="{{at.Title}} Help"
[delay]=500 target="_blank"> <i class="fas fa-question-circle pr-
2"></i></a> </div> </div> </div> </div> <div class="col-md-
5"> <div class="d-flex flex-column mt-3"> <label>REFRESH RATE</label>
<span class="data">{{corporateInformation.RefreshFrequency.Value}}</span> </div>
</div> </div> <div class="row"> <div class="col-md-7 pr-0"> <div class="d-
flex flex-column mt-3"> <label>CONTACT</label> <div class="user d-flex"
*ngIf="corporateInformation.Contact"> <img
src="/_layouts/15/userphoto.aspx?size=L&username={{ corporateInformation.Contact.Email
}}" class="avatar img-thumbnail rounded-circle shadow-sm p-0 mr-1"
[attr.title]="corporateInformation.Contact.Title"
[attr.alt]="corporateInformation.Contact.Email"> <span class="contat-name"
[attr.title]="corporateInformation.Contact.Email"> {{
corporateInformation.Contact.Title }} </span> </div> </div> </div>
<div class="col-md-5"> <div class="d-flex flex-column mt-3">
<label>AVAILABLE SINCE</label> <span
[attr.title]="corporateInformation.AvailableSince"
class="data">{{corporateInformation.AvailableSince | date: 'dd-MMM-yy'}}</span>
</div> </div> </div> </div> <div class="card-footer"> <button type="submit"
[disabled]="!corporateInformation.PBIXFilePath || isUnderDevelopment"
(click)="openPBIX()" class="btn btn-block get-started">Get Started in Power
BI</button> </div> </div></a>
Card name Value Stream Card
Code language TS
International Journal of Sciences: Basic and Applied Research (IJSBAR) (2020) Volume 54, No 3, pp 59-88
84
import { Component, Input, OnInit } from '@angular/core';import { Router } from
'@angular/router';import { CorporateInformationModel } from '~/shared/models/corporate-
information-model.model';import { ValueStream } from '~/shared/models/value-
stream.model';@Component({ selector: 'app-value-strem-card', templateUrl: './value-strem-
card.component.html', styleUrls: ['./value-strem-card.component.scss']})export class
ValueStremCardComponent implements OnInit { @Input() public valueStream:
ValueStream; public MaxCorporateInformationsToShow = 4; constructor( private router:
Router ) { } // tslint:disable-next-line: no-empty public ngOnInit() { } public cardClicked()
{ this.router.navigate(['/value-stream', this.valueStream.Id, 'details']) } public
corporateInformationClicked(ci: CorporateInformationModel) {
this.router.navigate(['/value-stream', this.valueStream.Id, 'details', ci.Id]) } public get
countNew(): number { let count = 0;
this.valueStream.CorporateInformations.forEach((element) => { if (element.isNew)
count = count + 1; }); return count; }}
Code language SCSS
a { color: #ffffff; text-decoration: none; cursor: pointer;}.card-value-stream { background-
color: #ffffff; border-radius: 4px; border: 1px solid #dfe2e6;}.header { background-color:
#39414d; border-top-left-radius: 4px; border-top-right-radius: 4px;}.body { min-height:
rem(72px); background-color: #ffffff; border-radius: 4px;}.no-info { font-size: 14px;}.name
{ display: inline-block; width: 180px; overflow: hidden; font-size: rem(15px); text-
overflow: ellipsis; white-space: nowrap;}.new { color: #c7d0d8; font-size: rem(11px); i {
margin-top: -3px; color: #47b280; font-size: rem(11px); }}.owner { span { color:
#737e8c; font-size: 9px; } .avatar { width: rem(20px); height: rem(20px); object-fit:
cover; } .user { span { display: inline-block; width: 100%; overflow: hidden;
color: #ffffff; font-size: 12px; text-overflow: ellipsis; white-space: nowrap; }
}}.corporate-title { color: #5a7793; font-size: rem(12px); font-weight: 400; height: fit-
content; border: 1px solid #c7d0d8; border-radius: 11px; transition: all 0.4s ease-out; i {
margin-top: -3px; color: #47b280; font-size: rem(10px); }}.corporate-title:hover {
background: #5a7793; color: white; border: 1px solid white;}.show-more { color: #ffffff;
font-size: 11px; background-color: #1683fb; border-radius: 11px;}.show-more-div { min-
height: 5px;}
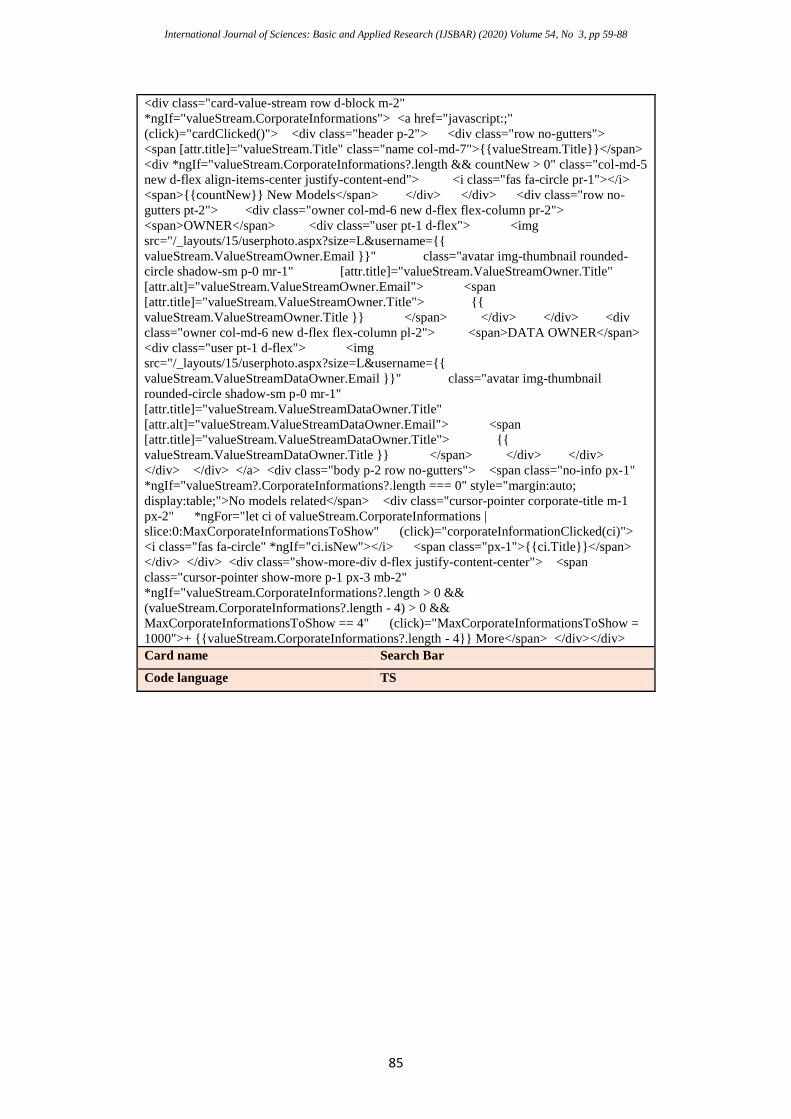
Code language HTML
International Journal of Sciences: Basic and Applied Research (IJSBAR) (2020) Volume 54, No 3, pp 59-88
85
<div class="card-value-stream row d-block m-2"
*ngIf="valueStream.CorporateInformations"> <a href="javascript:;"
(click)="cardClicked()"> <div class="header p-2"> <div class="row no-gutters">
<span [attr.title]="valueStream.Title" class="name col-md-7">{{valueStream.Title}}</span>
<div *ngIf="valueStream.CorporateInformations?.length && countNew > 0" class="col-md-5
new d-flex align-items-center justify-content-end"> <i class="fas fa-circle pr-1"></i>
<span>{{countNew}} New Models</span> </div> </div> <div class="row no-
gutters pt-2"> <div class="owner col-md-6 new d-flex flex-column pr-2">
<span>OWNER</span> <div class="user pt-1 d-flex"> <img
src="/_layouts/15/userphoto.aspx?size=L&username={{
valueStream.ValueStreamOwner.Email }}" class="avatar img-thumbnail rounded-
circle shadow-sm p-0 mr-1" [attr.title]="valueStream.ValueStreamOwner.Title"
[attr.alt]="valueStream.ValueStreamOwner.Email"> <span
[attr.title]="valueStream.ValueStreamOwner.Title"> {{
valueStream.ValueStreamOwner.Title }} </span> </div> </div> <div
class="owner col-md-6 new d-flex flex-column pl-2"> <span>DATA OWNER</span>
<div class="user pt-1 d-flex"> <img
src="/_layouts/15/userphoto.aspx?size=L&username={{
valueStream.ValueStreamDataOwner.Email }}" class="avatar img-thumbnail
rounded-circle shadow-sm p-0 mr-1"
[attr.title]="valueStream.ValueStreamDataOwner.Title"
[attr.alt]="valueStream.ValueStreamDataOwner.Email"> <span
[attr.title]="valueStream.ValueStreamDataOwner.Title"> {{
valueStream.ValueStreamDataOwner.Title }} </span> </div> </div>
</div> </div> </a> <div class="body p-2 row no-gutters"> <span class="no-info px-1"
*ngIf="valueStream?.CorporateInformations?.length === 0" style="margin:auto;
display:table;">No models related</span> <div class="cursor-pointer corporate-title m-1
px-2" *ngFor="let ci of valueStream.CorporateInformations |
slice:0:MaxCorporateInformationsToShow" (click)="corporateInformationClicked(ci)">
<i class="fas fa-circle" *ngIf="ci.isNew"></i> <span class="px-1">{{ci.Title}}</span>
</div> </div> <div class="show-more-div d-flex justify-content-center"> <span
class="cursor-pointer show-more p-1 px-3 mb-2"
*ngIf="valueStream.CorporateInformations?.length > 0 &&
(valueStream.CorporateInformations?.length - 4) > 0 &&
MaxCorporateInformationsToShow == 4" (click)="MaxCorporateInformationsToShow =
1000">+ {{valueStream.CorporateInformations?.length - 4}} More</span> </div></div>
Card name Search Bar
Code language TS
International Journal of Sciences: Basic and Applied Research (IJSBAR) (2020) Volume 54, No 3, pp 59-88
86
import { Component, EventEmitter, Input, OnInit, Output } from '@angular/core';import {
BehaviorSubject } from 'rxjs';import { Store } from '~/shared/models/store.model';import {
FilterService } from '~/shared/services/filter.service';import { HeaderService } from
'~/shared/services/header.service';@Component({ selector: 'app-search-bar', templateUrl:
'./search-bar.component.html', styleUrls: ['./search-bar.component.scss']})export class
SearchBarComponent implements OnInit { @Input() public isListSearch = false; @Output()
public onSearch = new EventEmitter<string>(); public searchText = ''; public placeholder =
'Search'; public currentStorefront: Store; private selectedFrontStore: Store; public
StoreColor: BehaviorSubject<string>; constructor( private heraderService: HeaderService,
private filterService: FilterService, ) { } public doSearch(): void { if (this.searchText)
this.isListSearch ? this.onSearch.emit(this.searchText) : this.defaultSearch(); }
public ngOnInit() { this.StoreColor = this.heraderService.storeColor$;
this.heraderService.selectedStore$.subscribe( (selectedStore) => { if (selectedStore)
this.currentStorefront = selectedStore; else this.currentStorefront = null; if
(selectedStore && !this.isListSearch) this.placeholder = 'Search in ' +
selectedStore?.Title; else this.placeholder = 'Search'; this.selectedFrontStore =
selectedStore; } ) } private defaultSearch() { if (this.selectedFrontStore)
this.filterService.ShowAllRelatedToFrontStore(this.selectedFrontStore, this.searchText);
else this.filterService.ShowAllGlobal(this.searchText); this.searchText = ''; } public
doSearchEmpty() { if (this.isListSearch && !this.searchText)
this.onSearch.emit(this.searchText); } public get getTitle(): string { return
this.currentStorefront ? this.currentStorefront.Title : ''; }}
Code language SCSS
.search-bar { color: #ffffff; background-color: transparent; transition: all 0.25s; input {
background-color: #ffffff; border-radius: 3px; overflow: hidden; border-color:
transparent; } .btn-primary { border-radius: 2px; border: 1px solid #ffffff; background-
color: transparent; font-size: rem(14px); } .btn-primary:focus { outline: none; box-
shadow: none; }}button:focus,input:focus,input.form-control:focus { outline: none
!important; outline-width: 0 !important; box-shadow: none; -moz-box-shadow: none; -
webkit-box-shadow: none; border-color: transparent;}span.store-name:empty:before {
content: "\200b";}.verified-icon { margin-bottom: 4px;}
Code language HTML
<div class="search-bar py-2" [ngStyle]="{ backgroundColor: StoreColor | async }"> <div
class="container"> <div class="row"> <div class="col-md-10 p-1"> <input
type="text" name="main-search" [(ngModel)]="searchText" class="form-
control" autocomplete="off" [placeholder]="placeholder"
(keydown.enter)="doSearch()" (keyup.backspace)="doSearchEmpty()"
(keyup.delete)="doSearchEmpty()"> </div> <div class="col-md-2 p-1"> <button
type="submit" class="btn btn-primary btn-block text-uppercase h-100"
(click)="doSearch()">Search</button> </div> </div> </div></div>