corporate overview - investor presentation - publicly
TRANSCRIPT

1©2020 Harmonic Inc. All rights reserved worldwide.©2020 Harmonic Inc. All rights reserved worldwide.
June 2020
CORPORATE OVERVIEW

2©2020 Harmonic Inc. All rights reserved worldwide.
Harmonic-at-a-Glance
2
CABLE ACCESS
& VIDEO
Two market-leading
business units
$403M
2019 Revenue
SILICON
VALLEY
Headquarters
>5,000
Media & service
provider customers
INNOVATION
VELOCITY
>40 patents filed in
last 24 months
Market Leader in Virtualized Cable Access & Live Video Streaming

3©2020 Harmonic Inc. All rights reserved worldwide.
Gigabit Access & Streaming Video GrowthTwo Major Market Transformation Opportunities
Streaming video
expected to
account for >80%
IP traffic expected to
nearly triple
from 2017 to 2022
26% CAGR | 2017-2022
*Figures (n) refer to 2017, 2022 traffic share | Source: Cisco VNI Global IP Traffic Forecast, 2017-2022

4©2020 Harmonic Inc. All rights reserved worldwide.
Two Focused Business UnitsAddressing Gigabit and Streaming Growth
• Market leader in premium live video
• Leading live OTT streaming transformation
• Strong media customer relationships
VIDEO
• Invented and leading virtualized cable access
• Foundational deployments with industry leaders
• Strong cable customer relationships
CABLE ACCESS

5©2020 Harmonic Inc. All rights reserved worldwide.©2020 Harmonic Inc. All rights reserved worldwide.
VIRTUALIZED CABLE ACCESS
MADE SMARTER
CABLE ACCESS BUSINESS OVERVIEW

6©2020 Harmonic Inc. All rights reserved worldwide.
Virtualization Market Poised For GrowthHarmonic CableOS® Leading the Way
* Source: Dell’Oro January 2020
$0.0
$200.0
$400.0
$600.0
$800.0
$1,000.0
$1,200.0
2017 2018 2019 2020 2021 2022 2023 2024
Millions
vCMTS & Remote PHY Revenue Growth Forecast
vCMTS/vCCAP
RPD/RMDs

7©2020 Harmonic Inc. All rights reserved worldwide.
Virtualization Enabling Multi-Gigabit BroadbandHarmonic Customers Publicly Reporting Compelling Results
192 Service Groups
70%Power Savings
20 1Rack Reduction
30m 15sMean Time to Detect
20,000 70HHP Reach from
Targeted SW Upgrades

8©2020 Harmonic Inc. All rights reserved worldwide.
Virtualized Cable Access Leadership
>1.3 MILLION
cable modems served,
up >94% year-over-year
INNOVATION
Foundational
virtualization patent + 30
unique patent filings
STRATEGIC
RELATIONSHIP
and industry-leading
deployment
Harmonic CableOS is Only Virtualized Solution Deployed

9©2020 Harmonic Inc. All rights reserved worldwide.
Scaling Global Customer Base
Global Industry LeaderInnovative US Tier 2 Operator European Tier 1 Operator
Innovative US Tier 3 Operator
+23Additional Global Cable
Operators Worldwide

10©2020 Harmonic Inc. All rights reserved worldwide.©2020 Harmonic Inc. All rights reserved worldwide.
VIDEO STREAMING
MADE SIMPLER
VIDEOBUSINESS OVERVIEW

11©2020 Harmonic Inc. All rights reserved worldwide.
OTT Streaming Continues to Gain GroundDriving Media Transformation and Investment
Global OTT Video Revenue
New streaming services enabling
access to high-quality content
Greater operational efficiencies with
Cloud / SaaS business models
Sports and live events
expanding on SVOD model

12©2020 Harmonic Inc. All rights reserved worldwide.
Transforming from Broadcast to OTT Streaming
Broadcast Delivery
OTT Delivery
Content Origination
Media Processing
13©2020 Harmonic Inc. All rights reserved worldwide.
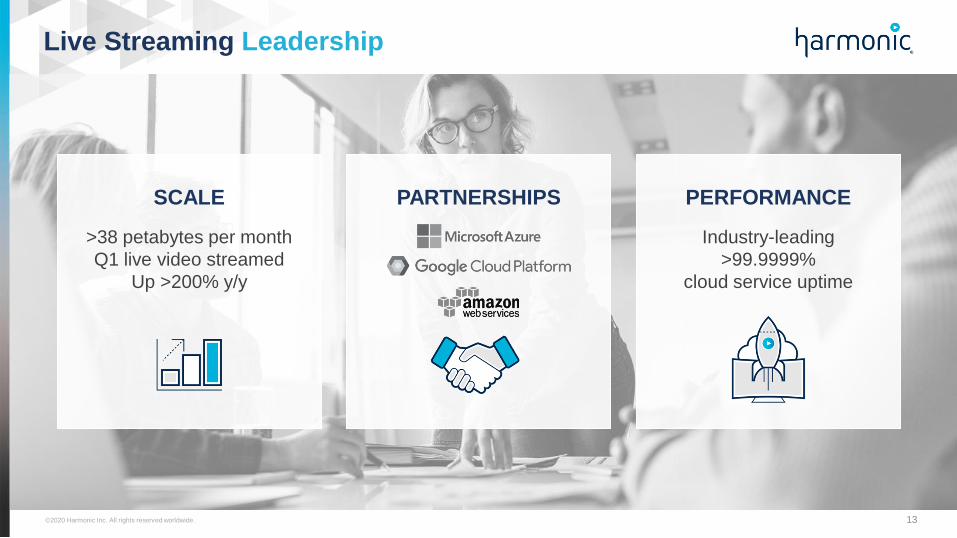
Live Streaming Leadership
SCALE
>38 petabytes per month
Q1 live video streamed
Up >200% y/y
PARTNERSHIPS PERFORMANCE
Industry-leading
>99.9999%
cloud service uptime

14©2020 Harmonic Inc. All rights reserved worldwide.
Expanding Customer BaseNew Harmonic Streaming Customer Relationships
New mobile OTT service
in Indonesia
New live OTT streaming
of open-wheel racing in North
America
New subscription-based
online TV service in the
United States
New premium and
24/7 OTT channels on hybrid
cloud platform
24/7/365 online auction
shopping network

15©2020 Harmonic Inc. All rights reserved worldwide. ©2020 Harmonic Inc. All rights reserved worldwide.©2020 Harmonic Inc. All rights reserved worldwide.
SUMMARY

16©2020 Harmonic Inc. All rights reserved worldwide.
Growth Driver Summary
SUBSTANTIAL
GROWING MARKET
OPPORTUNITY
INDUSTRY-LEADING
TECHNOLOGY
AND IP
STRONG
RELATIONSHIPS
WITH BLUE-CHIP
CUSTOMERS
Market Leader in Virtualized Cable Access & Live Video Streaming

17©2020 Harmonic Inc. All rights reserved worldwide.
Q1 2020 Highlights
17
Strong Recurring
Revenue and
Balance Sheet
Video SaaS growth
Accelerated in Q1 Solid Cable Access
results
and outlook
Strong Cable Access and Streaming Video SaaS Position

18©2020 Harmonic Inc. All rights reserved worldwide.
Cable Access Segment Update
Solid Q1
• Revenue* $24 million, up 85.6% year over year
• Commercially deployed with 27 operators, up 17% sequentially
• Over 1.3 million cable modems served, up 30% sequentially
* Non-GAAP
Positive Outlook
• Deployed customers collectively serve >45 million cable modems
• Customers now standardizing on CableOS for all architectures
– Received first material Tier 1 order for new “shelf” product
• Expanding opportunity, particularly for upstream bandwidth creation

19©2020 Harmonic Inc. All rights reserved worldwide.
Video Segment Update
Mixed Quarter Due To Covid-19
• Revenue* $54.4 million, down 19% year over year
• Appliance sales most impacted
– Reduced March demand, supply chain constraints and increased costs
– Headwinds likely persist in Q2
• SaaS and Service sales remained healthy
Streaming SaaS Growth Accelerating
• Strong Q1 results
– Added 9 new streaming SaaS customers, up 19% sequentially
– New Tier 1 international telecom operator and Tier 1 domestic media wins
– Total 7,300 cloud channels deployed worldwide, up 56% sequentially
• Strong SaaS pipeline growth
* Non-GAAP

20©2020 Harmonic Inc. All rights reserved worldwide.
2020 Strategic Priorities
1. Grow live streaming
———————————————————
2. Expand addressed market via SaaS
———————————————————
3. Deliver segment profitability
Video
1. Scale Tier-1 CableOS deployments
————————————————————
2. Secure additional CableOS design wins
————————————————————
3. Launch new service & FTTH solutions
Cable Access
Focused on growth, employee
wellbeing, shareholder value creation

21©2020 Harmonic Inc. All rights reserved worldwide. ©2020 Harmonic Inc. All rights reserved worldwide.©2020 Harmonic Inc. All rights reserved worldwide.
FINANCIAL RESULTS

22©2020 Harmonic Inc. All rights reserved worldwide.
Financial Metric$ Millions
Q1
2020
Q4
2019
Q1
2019
Q1/Q4
Change
Q1 Y/Y
Change
Total Net Revenue $78.4 $122.2 $80.1 (35.8)% (2.1)%
Cable Revenue $24.0 $43.0 $12.9 (44.1)% 85.6%
Video Revenue $54.4 $79.2 $67.2 (27.7)% (19.1)%
Gross Margin % 48.9% 52.3% 54.5% (3.4)% (5.6)%
Cable Gross Margin% 43.3% 38.3% 39.3% 5.0% 4.0%
Video Gross Margin% 51.3% 60.0% 57.5% (8.7)% (6.2)%
Total Net Revenue $78.4 $122.2 $80.1 (35.8)% (2.1)%
Appliance and integration $47.7 $85.9 $52.4 (44.4)% (8.9)%
SaaS and service $30.7 $36.3 $27.7 (15.4)% 10.5%
SaaS and service revenue % 39.1% 29.7% 34.6% 9.4% 4.5%
SaaS and service gross margin % 51.3% 63.7% 61.3% (12.4)% (10)%
SaaS customers 57 48 25 19% 128%
Q1 2020 Financial Highlights*
* Non-GAAP
Cable Access Segment Revenue up 85.6% year over yearSaaS and Service Revenue up 10.5% year over year

23©2020 Harmonic Inc. All rights reserved worldwide.
Financial Metric$ Millions (except EPS)
Q1
2020
Q4
2019
Q1
2019
Q1/Q4
Change
Q1 Y/Y
Change
Operating Expenses $47.9 $49.2 $47.5 (2.7)% 0.7%
Operating Income (loss) $(9.5) $14.8 $(3.8) $(24.3) $(5.7)
Adjusted EBITDA $(7.0) $17.6 $(1.3) $(24.6) $(5.7)
EPS $(0.10) $0.12 $(0.05) $(0.22) $(0.05)
Diluted Share Count 95.6 97.5 88.2 (1.9) 7.4
Bookings $76.3 $140.1 $81.0 (45.5)% (5.8)%
Book to bill ratio 0.97 1.15 1.01 (15.7)% (4.0)%
Q1 2020 Financial Highlights*
* Non-GAAP

24©2020 Harmonic Inc. All rights reserved worldwide.
Q1 2020 Balance Sheet & Cash Flow Highlights
Financial Metric$ Millions
Q1
2020
Q4
2019
Q1
2019
Cash $71.7 $93.1 $69.9
Cash Provided by (Used in) Operations $(11.0) $30.2 $4.2
Accounts Receivable $93.1 $88.5 $58.9
DSO 107 65 66
Inventories $34.9 $29.0 $29.3
Inventory Days 78 45 72
Backlog and Deferred Revenue $207.9 $210.2 $187.2

25©2020 Harmonic Inc. All rights reserved worldwide.©2020 Harmonic Inc. All rights reserved worldwide.
Q&A

26©2020 Harmonic Inc. All rights reserved worldwide. ©2020 Harmonic Inc. All rights reserved worldwide.©2020 Harmonic Inc. All rights reserved worldwide.
APPENDIX

27©2020 Harmonic Inc. All rights reserved worldwide.
Use of Non-GAAP Financial Measures
In establishing operating budgets, managing its business performance, and setting internal measurement targets, the Company excludes a number
of items required by GAAP. Management believes that these accounting charges and credits, most of which are non-cash or non-recurring in
nature, are not useful in managing its operations and business. Historically, the Company has also publicly presented these supplemental non-
GAAP measures in order to assist the investment community to see the Company “through the eyes of management,” and thereby enhance
understanding of its operating performance. The non-GAAP measures presented here are revenue, segment revenue, gross profit, operating
expenses, income (loss) from operations, non-operating expense, net, net income (loss) and net income (loss) per diluted share. The presentation
of non-GAAP information is not intended to be considered in isolation or as a substitute for results prepared in accordance with GAAP, and is not
necessarily comparable to non-GAAP results published by other companies. A reconciliation of the historical and forward looking non-GAAP
financial measures discussed in this presentation to the most directly comparable historical and forward looking GAAP financial measures is
included with the financial information contained in this presentation. The non-GAAP adjustments described below have historically been excluded
from our GAAP financial measures. These adjustments are acquisition accounting impacts to restructuring and related charges, Cable Access
inventory charge, Avid litigation settlement and associated legal fees and non-cash items, such as warrant amortization, loss on debt
extinguishment, stock-based compensation expense, amortization of intangibles, non-cash interest and other expenses on convertible debt, gain
(loss) on equity investments and adjustments that normalize the tax rate.

28©2020 Harmonic Inc. All rights reserved worldwide.
Q1 2020 GAAP to Non-GAAP Reconciliations(in thousands, except EPS and percentages)

29©2020 Harmonic Inc. All rights reserved worldwide.
Q4 2019 GAAP to Non-GAAP Reconciliations(in thousands, except EPS and percentages)

30©2020 Harmonic Inc. All rights reserved worldwide.
Q1 2019 GAAP to Non-GAAP Reconciliations(in thousands, except EPS and percentages)

31©2020 Harmonic Inc. All rights reserved worldwide.
Adjusted EBITDA Reconciliation(in thousands)

32©2020 Harmonic Inc. All rights reserved worldwide.
Q2 2020 Guidance GAAP to Non-GAAP Reconciliations (in millions, except EPS and percentages)

33©2020 Harmonic Inc. All rights reserved worldwide.
Adjusted EBITDA Reconciliation on Financial Guidance(in millions)
34©2020 Harmonic Inc. All rights reserved worldwide.©2020 Harmonic Inc. All rights reserved worldwide.
THANK YOU