corporate presentation cpfl energia agosto 2016
TRANSCRIPT
March, 2013
Corporate
Presentation
August 2016
1
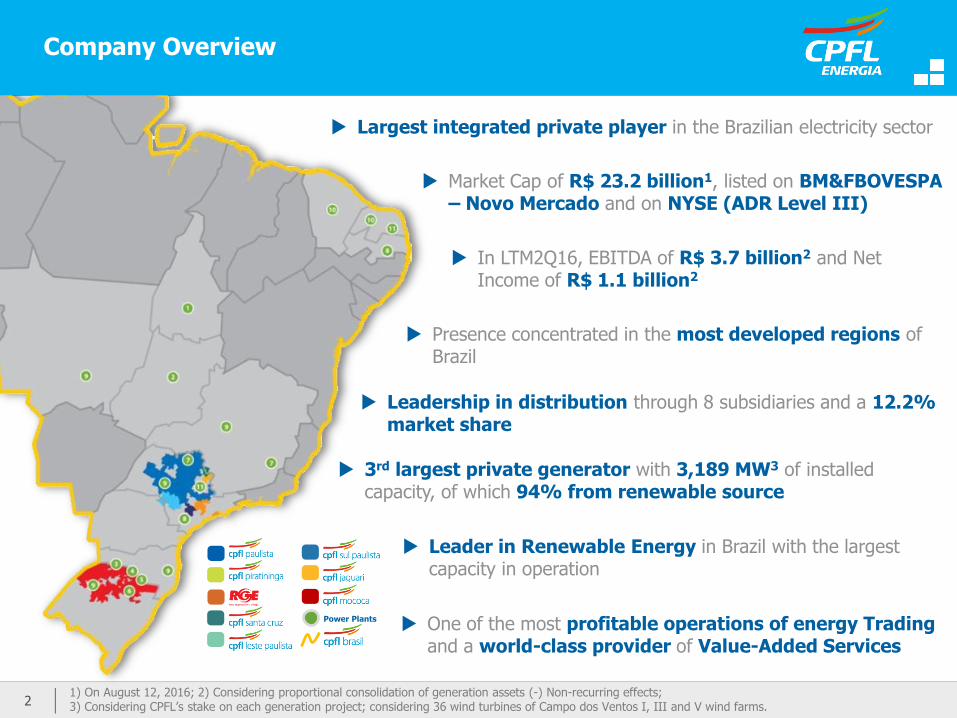
221) On August 12, 2016; 2) Considering proportional consolidation of generation assets (-) Non-recurring effects; 3) Considering CPFL’s stake on each generation project; considering 36 wind turbines of Campo dos Ventos I, III and V wind farms.
Company Overview
Largest integrated private player in the Brazilian electricity sector
Market Cap of R$ 23.2 billion1, listed on BM&FBOVESPA – Novo Mercado and on NYSE (ADR Level III)
In LTM2Q16, EBITDA of R$ 3.7 billion2 and Net Income of R$ 1.1 billion2
Presence concentrated in the most developed regions of Brazil
Leadership in distribution through 8 subsidiaries and a 12.2% market share
3rd largest private generator with 3,189 MW3 of installed capacity, of which 94% from renewable source
Leader in Renewable Energy in Brazil with the largest capacity in operation
One of the most profitable operations of energy Trading and a world-class provider of Value-Added Services
Power Plants
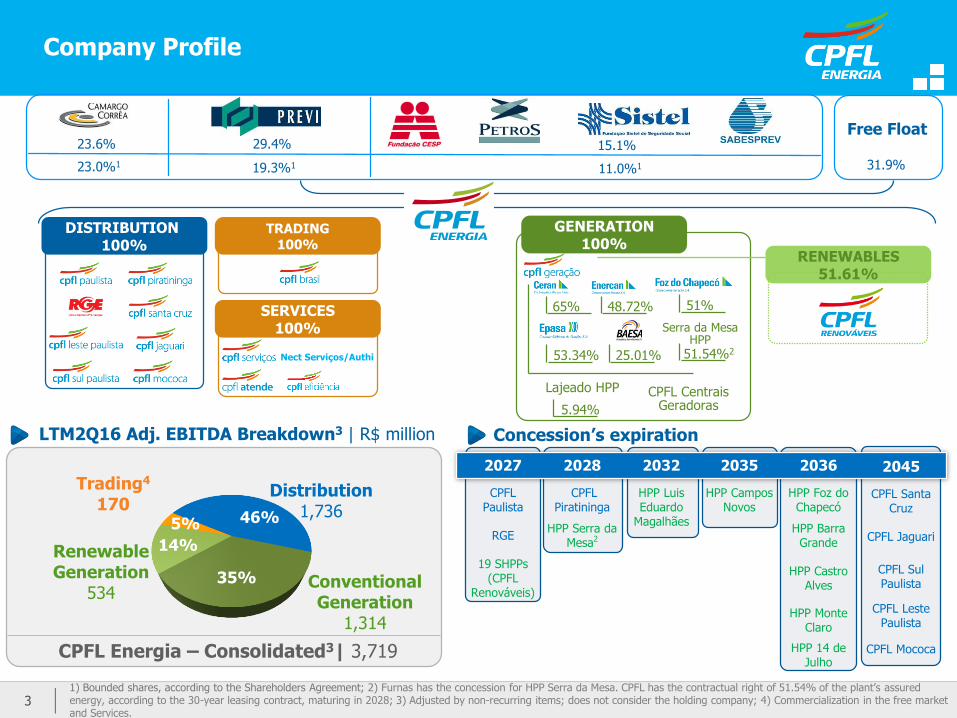
331) Bounded shares, according to the Shareholders Agreement; 2) Furnas has the concession for HPP Serra da Mesa. CPFL has the contractual right of 51.54% of the plant’s assured energy, according to the 30-year leasing contract, maturing in 2028; 3) Adjusted by non-recurring items; does not consider the holding company; 4) Commercialization in the free market and Services.
Company Profile
Lajeado HPP
5.94%
Nect Serviços/Authi
CPFL CentraisGeradoras
DISTRIBUTION 100%
SERVICES100%
RENEWABLES51.61%
65% 48.72% 51%
25.01%
Serra da Mesa HPP
51.54%253.34%
GENERATION100%
TRADING100%
Trading4
170
CPFL Energia – Consolidated3| 3,719
LTM2Q16 Adj. EBITDA Breakdown3 | R$ million Concession’s expiration
2027 2028 2032 2035 2036
CPFL Paulista
CPFL Piratininga
HPP Luis Eduardo
Magalhães
HPP Campos Novos
HPP Foz do Chapecó
RGEHPP Serra da
Mesa2HPP Barra
Grande
19 SHPPs(CPFL
Renováveis)
HPP Castro Alves
HPP Monte Claro
HPP 14 de Julho
2045
CPFL Santa Cruz
CPFL Jaguari
CPFL Sul Paulista
CPFL Leste Paulista
CPFL Mococa
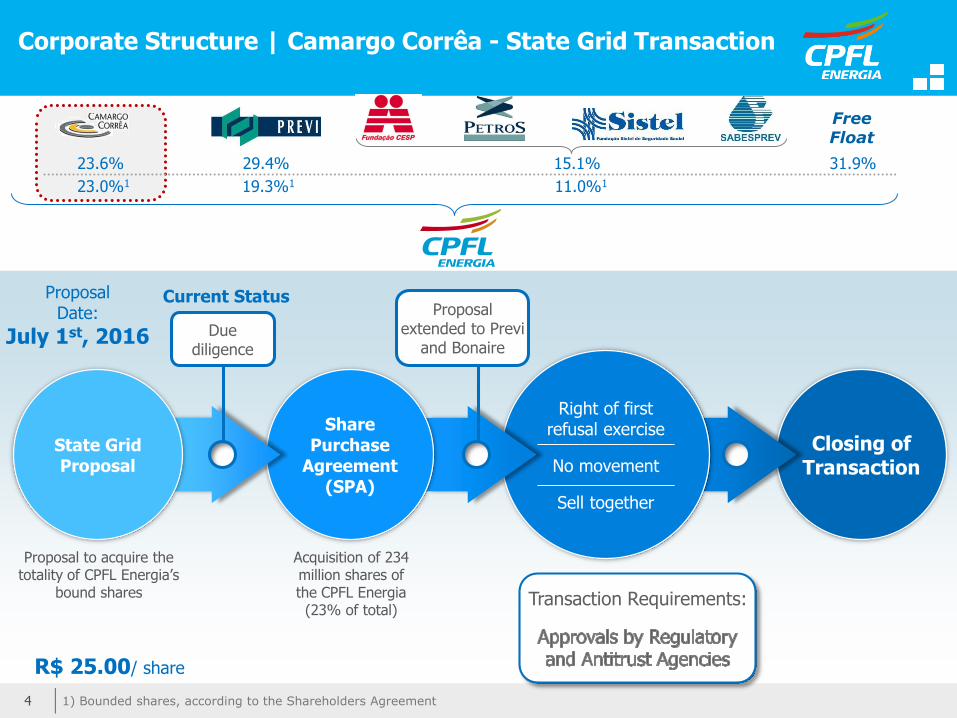
23.0%1 19.3%1 11.0%1
15.1%23.6% 29.4%Free Float
31.9%
Conventional Generation
1,314
Distribution1,73646%
35%
5%
14%Renewable Generation
534
Closing of Transaction
Corporate Structure | Camargo Corrêa - State Grid Transaction
R$ 25.00/ share
23.0%1 19.3%1
23.6% 29.4%
Free Float
31.9%
1) Bounded shares, according to the Shareholders Agreement
Right of first refusal exercise
No movement
Sell together
SharePurchase
Agreement (SPA)
State GridProposal
Duediligence
Proposal extended to Previ
and Bonaire
Proposal to acquire the totality of CPFL Energia’s
bound shares
Acquisition of 234 million shares of the CPFL Energia (23% of total)
Proposal Date:
July 1st, 2016
Current Status
Transaction Requirements:
15.1%
11.0%1
4
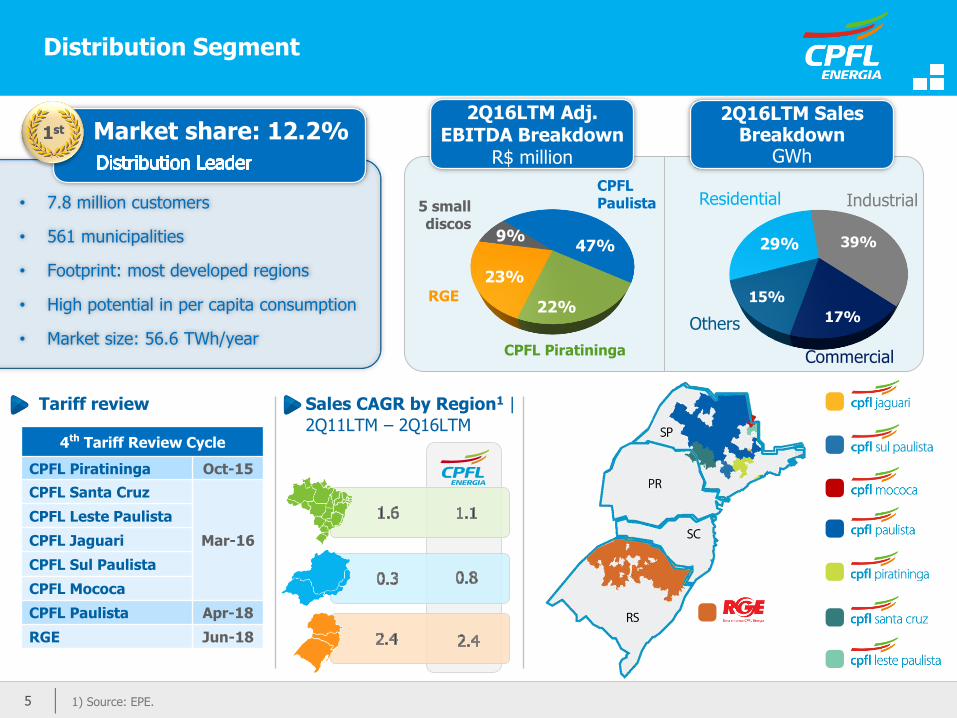
Distribution Segment
• 7.8 million customers
• 561 municipalities
• Footprint: most developed regions
• High potential in per capita consumption
• Market size: 56.6 TWh/year
1st Market share: 12.2%
Industrial
Commercial
Residential
Others
1) Source: EPE.5
29% 39%
17%
15%
5 small discos
47%
22%
9%
23%RGE
CPFL Piratininga
2Q16LTM Adj. EBITDA Breakdown
R$ million
CPFL Paulista
Tariff review Sales CAGR by Region1 |
2Q11LTM – 2Q16LTM4th Tariff Review Cycle
CPFL Piratininga Oct-15
CPFL Santa Cruz
Mar-16
CPFL Leste Paulista
CPFL Jaguari
CPFL Sul Paulista
CPFL Mococa
CPFL Paulista Apr-18
RGE Jun-18
2Q16LTM Sales Breakdown
GWh
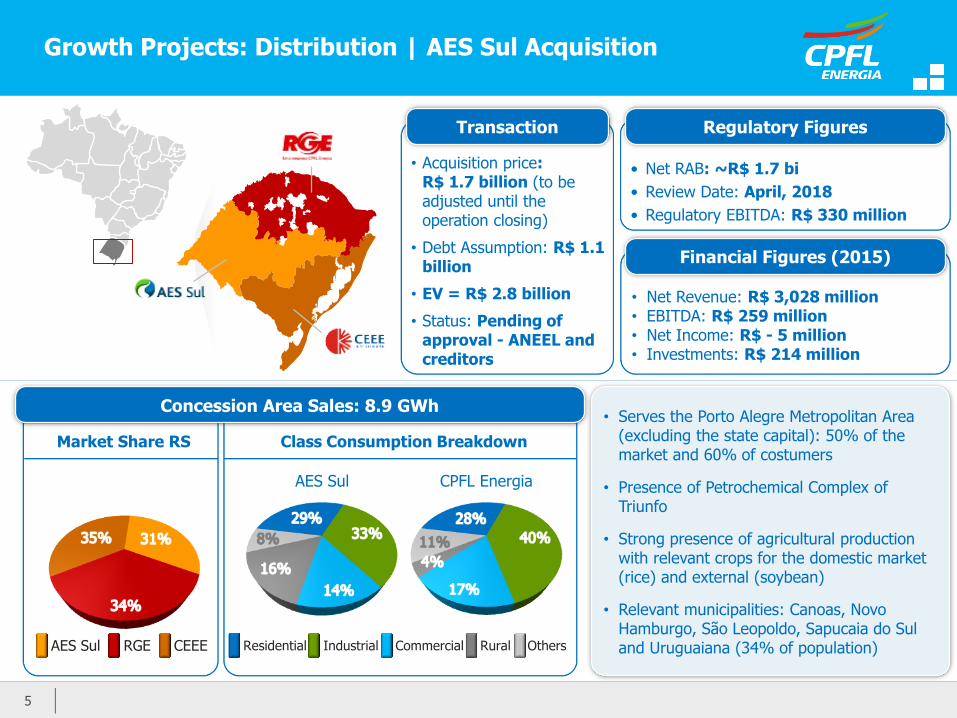
Market Share RS Class Consumption Breakdown
• Serves the Porto Alegre Metropolitan Area (excluding the state capital): 50% of the market and 60% of costumers
• Presence of Petrochemical Complex of Triunfo
• Strong presence of agricultural production with relevant crops for the domestic market (rice) and external (soybean)
• Relevant municipalities: Canoas, Novo Hamburgo, São Leopoldo, Sapucaia do Suland Uruguaiana (34% of population)
• Net RAB: ~R$ 1.7 bi
• Review Date: April, 2018
• Regulatory EBITDA: R$ 330 million
Regulatory Figures
• Net Revenue: R$ 3,028 million• EBITDA: R$ 259 million• Net Income: R$ - 5 million• Investments: R$ 214 million
Concession Area Sales: 8.9 GWh
Financial Figures (2015)
Transaction
• Acquisition price:R$ 1.7 billion (to be adjusted until the operation closing)
• Debt Assumption: R$ 1.1 billion
• EV = R$ 2.8 billion
• Status: Pending of approval - ANEEL and creditors
AES Sul RGE CEEE
AES Sul CPFL Energia
Residential Industrial Commercial Rural Others
Growth Projects: Distribution | AES Sul Acquisition
5
Before AES SUL
AES SulAfter
da AES SulVariation
(%)
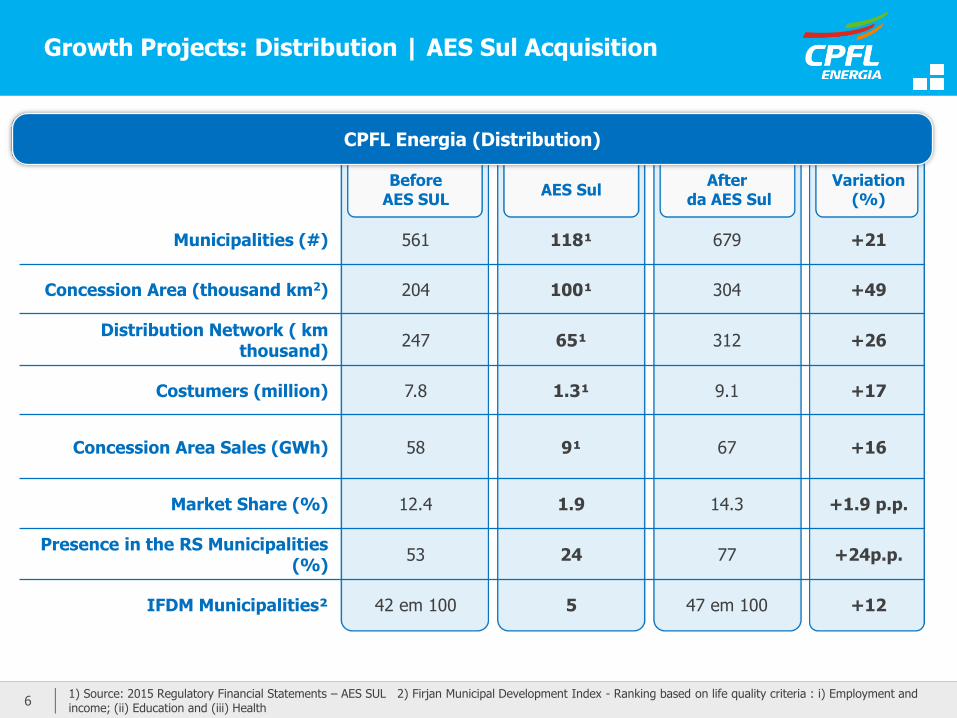
Municipalities (#) 561 118¹ 679 +21
Concession Area (thousand km2) 204 100¹ 304 +49
Distribution Network ( km thousand)
247 65¹ 312 +26
Costumers (million) 7.8 1.3¹ 9.1 +17
Concession Area Sales (GWh) 58 9¹ 67 +16
Market Share (%) 12.4 1.9 14.3 +1.9 p.p.
Presence in the RS Municipalities (%)
53 24 77 +24p.p.
IFDM Municipalities² 42 em 100 5 47 em 100 +12
1) Source: 2015 Regulatory Financial Statements – AES SUL 2) Firjan Municipal Development Index - Ranking based on life quality criteria : i) Employment and income; (ii) Education and (iii) Health
CPFL Energia (Distribution)
Growth Projects: Distribution | AES Sul Acquisition
6
88
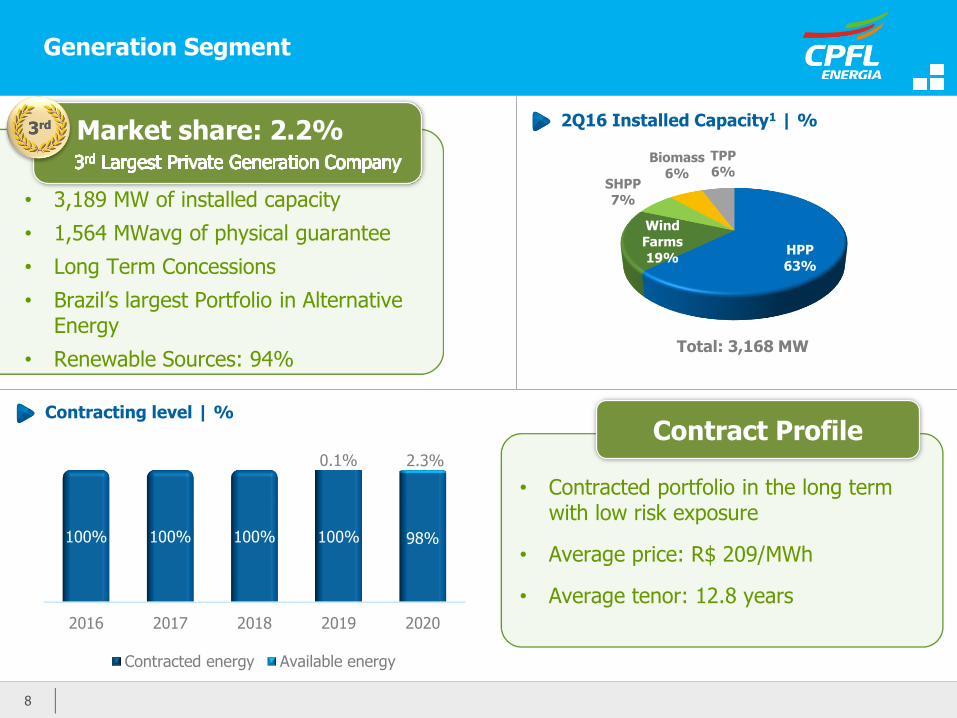
Generation Segment
• 3,189 MW of installed capacity
• 1,564 MWavg of physical guarantee
• Long Term Concessions
• Brazil’s largest Portfolio in Alternative Energy
• Renewable Sources: 94%
3rd Market share: 2.2%
Contracting level | %
2Q16 Installed Capacity1 | %
HPP
63%
Wind
Farms
19%
SHPP
7%
Biomass
6%
TPP
6%
Total: 3,168 MW
2016 2017 2018 2019 2020
100% 100% 100% 100% 98%
0.1% 2.3%
Contracted energy Available energy
• Contracted portfolio in the long term with low risk exposure
• Average price: R$ 209/MWh
• Average tenor: 12.8 years
Contract Profile
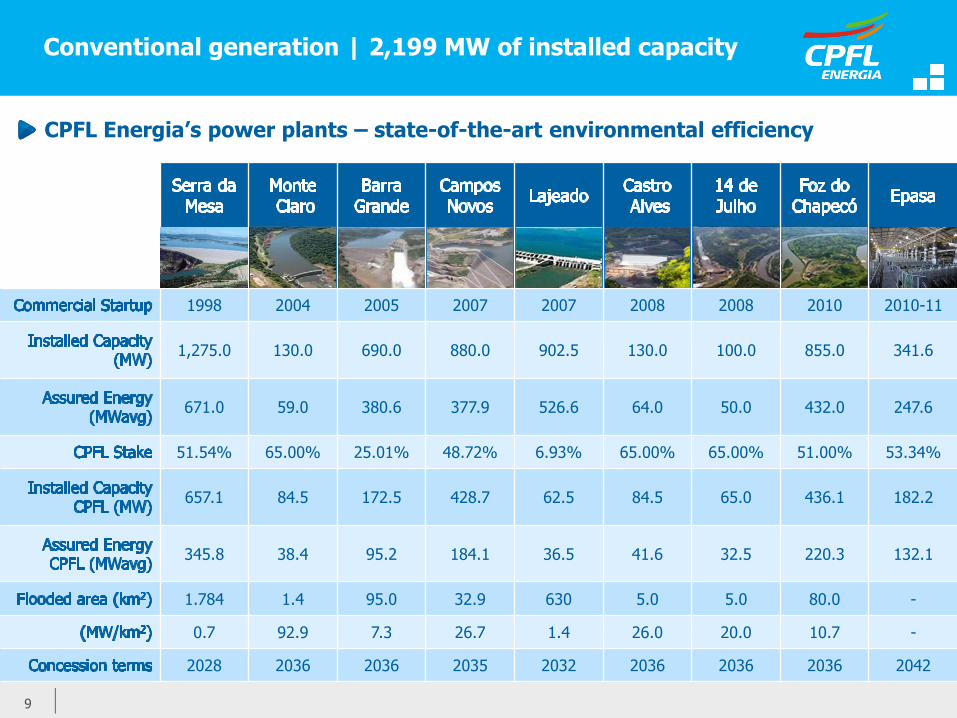
1998 2004 2005 2007 2007 2008 2008 2010 2010-11
1,275.0 130.0 690.0 880.0 902.5 130.0 100.0 855.0 341.6
671.0 59.0 380.6 377.9 526.6 64.0 50.0 432.0 247.6
51.54% 65.00% 25.01% 48.72% 6.93% 65.00% 65.00% 51.00% 53.34%
657.1 84.5 172.5 428.7 62.5 84.5 65.0 436.1 182.2
345.8 38.4 95.2 184.1 36.5 41.6 32.5 220.3 132.1
1.784 1.4 95.0 32.9 630 5.0 5.0 80.0 -
0.7 92.9 7.3 26.7 1.4 26.0 20.0 10.7 -
2028 2036 2036 2035 2032 2036 2036 2036 2042
Conventional generation | 2,199 MW of installed capacity
CPFL Energia’s power plants – state-of-the-art environmental efficiency
9
(MW)
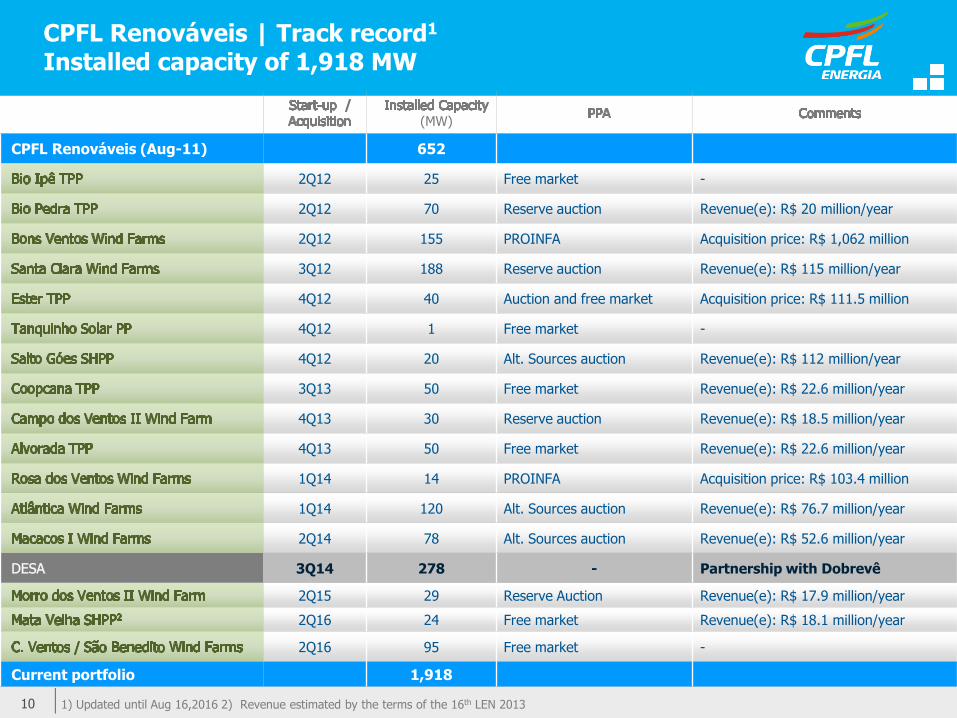
CPFL Renováveis (Aug-11) 652
2Q12 25 Free market -
2Q12 70 Reserve auction Revenue(e): R$ 20 million/year
2Q12 155 PROINFA Acquisition price: R$ 1,062 million
3Q12 188 Reserve auction Revenue(e): R$ 115 million/year
4Q12 40 Auction and free market Acquisition price: R$ 111.5 million
4Q12 1 Free market -
4Q12 20 Alt. Sources auction Revenue(e): R$ 112 million/year
3Q13 50 Free market Revenue(e): R$ 22.6 million/year
4Q13 30 Reserve auction Revenue(e): R$ 18.5 million/year
4Q13 50 Free market Revenue(e): R$ 22.6 million/year
1Q14 14 PROINFA Acquisition price: R$ 103.4 million
1Q14 120 Alt. Sources auction Revenue(e): R$ 76.7 million/year
2Q14 78 Alt. Sources auction Revenue(e): R$ 52.6 million/year
3Q14 278 - Partnership with Dobrevê
2Q15 29 Reserve Auction Revenue(e): R$ 17.9 million/year
2Q16 24 Free market Revenue(e): R$ 18.1 million/year
2Q16 95 Free market -
Current portfolio 1,918
10
CPFL Renováveis | Track record1
Installed capacity of 1,918 MW
1) Updated until Aug 16,2016 2) Revenue estimated by the terms of the 16th LEN 2013
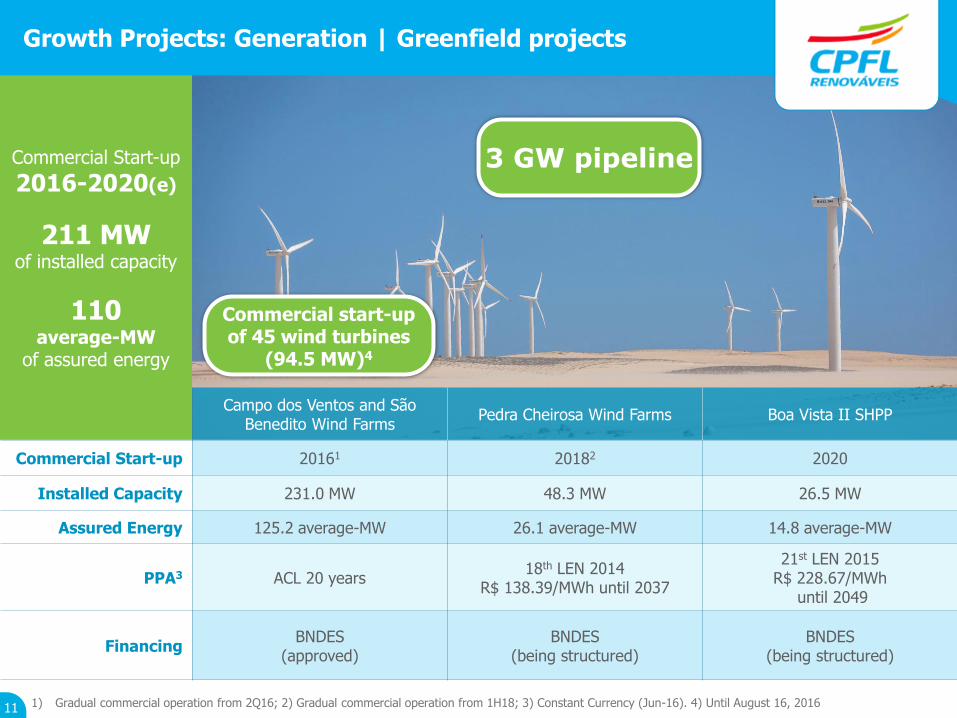
Commercial Start-up
2016-2020(e)
211 MWof installed capacity
110average-MW
of assured energy
1) Gradual commercial operation from 2Q16; 2) Gradual commercial operation from 1H18; 3) Constant Currency (Jun-16). 4) Until August 16, 2016
Campo dos Ventos and São Benedito Wind Farms
Pedra Cheirosa Wind Farms Boa Vista II SHPP
Commercial Start-up 20161 20182 2020
Installed Capacity 231.0 MW 48.3 MW 26.5 MW
Assured Energy 125.2 average-MW 26.1 average-MW 14.8 average-MW
PPA3 ACL 20 years18th LEN 2014
R$ 138.39/MWh until 2037
21st LEN 2015R$ 228.67/MWh
until 2049
FinancingBNDES
(approved)BNDES
(being structured)BNDES
(being structured)
11
Growth Projects: Generation | Greenfield projects
Commercial start-up of 45 wind turbines
(94.5 MW)4
3 GW pipeline
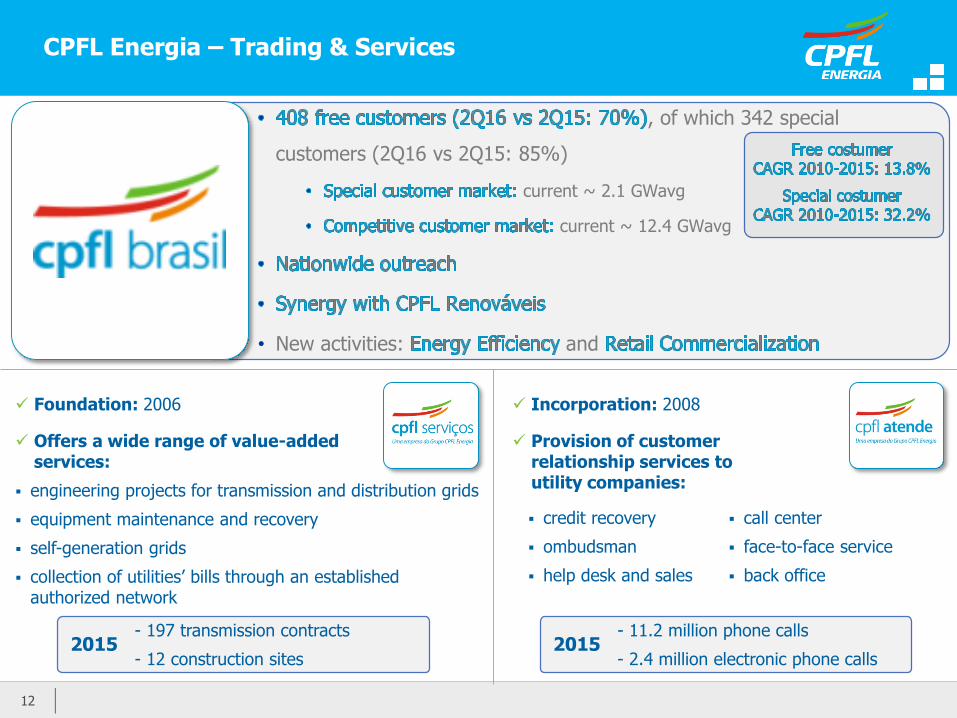
Foundation: 2006
Offers a wide range of value-added services:
engineering projects for transmission and distribution grids
equipment maintenance and recovery
self-generation grids
collection of utilities’ bills through an established authorized network
1212
Incorporation: 2008
Provision of customer relationship services to utility companies:
call center
face-to-face service
back office
credit recovery
ombudsman
help desk and sales
CPFL Energia – Trading & Services
, of which 342 special
customers (2Q16 vs 2Q15: 85%)
current ~ 2.1 GWavg
current ~ 12.4 GWavg
• New activities: and
2015- 197 transmission contracts
- 12 construction sites2015
- 11.2 million phone calls
- 2.4 million electronic phone calls
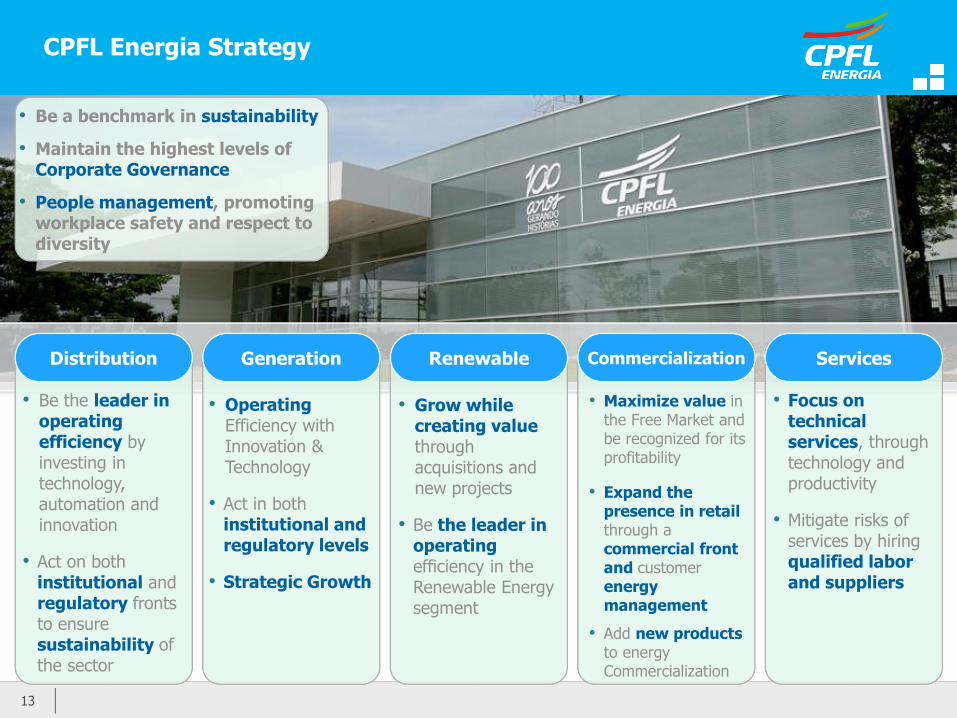
CPFL Energia Strategy
13
• Be a benchmark in sustainability
• Maintain the highest levels of Corporate Governance
• People management, promoting workplace safety and respect to diversity
• Be the leader in operating efficiency by investing in technology, automation and innovation
• Act on both institutional and regulatory fronts to ensure sustainability of the sector
• Focus on technical services, through technology and productivity
• Mitigate risks of services by hiring qualified labor and suppliers
• Maximize value in the Free Market and be recognized for its profitability
• Expand the presence in retail through acommercial front and customer energy management
• Add new products to energy Commercialization
• Grow while creating value through acquisitions and new projects
• Be the leader in operating efficiency in the Renewable Energy segment
• Operating Efficiency with Innovation & Technology
• Act in both institutional and regulatory levels
• Strategic Growth
Distribution Generation Renewable Commercialization Services
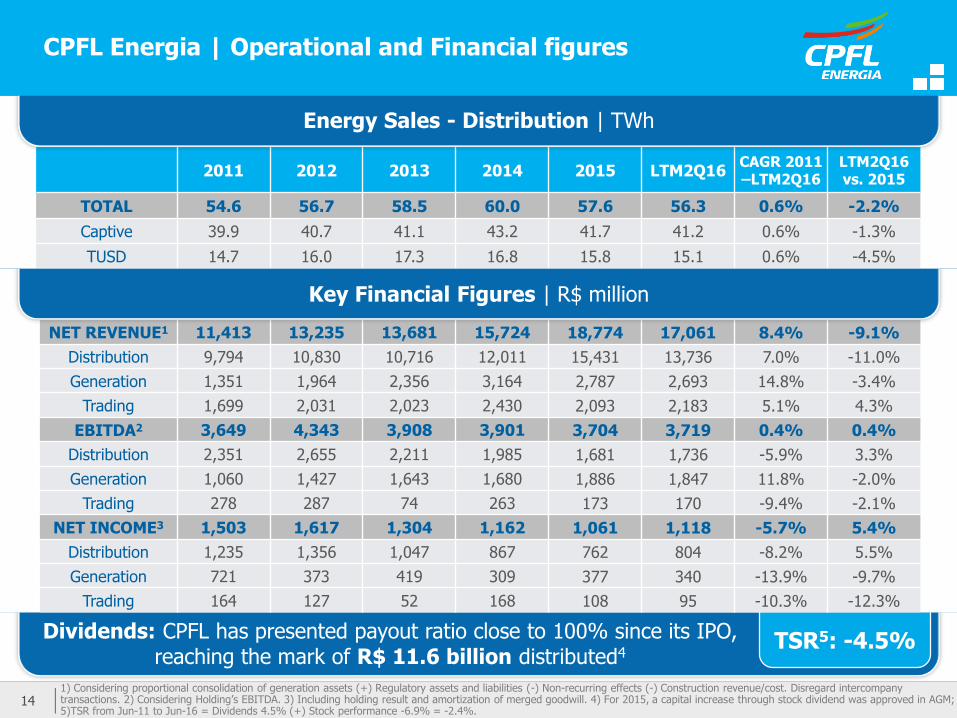
Dividends: CPFL has presented payout ratio close to 100% since its IPO, reaching the mark of R$ 11.6 billion distributed4
TSR5: -4.5%
14141) Considering proportional consolidation of generation assets (+) Regulatory assets and liabilities (-) Non-recurring effects (-) Construction revenue/cost. Disregard intercompany transactions. 2) Considering Holding’s EBITDA. 3) Including holding result and amortization of merged goodwill. 4) For 2015, a capital increase through stock dividend was approved in AGM; 5)TSR from Jun-11 to Jun-16 = Dividends 4.5% (+) Stock performance -6.9% = -2.4%.
NET REVENUE1 11,413 13,235 13,681 15,724 18,774 17,061 8.4% -9.1%
Distribution 9,794 10,830 10,716 12,011 15,431 13,736 7.0% -11.0%
Generation 1,351 1,964 2,356 3,164 2,787 2,693 14.8% -3.4%
Trading 1,699 2,031 2,023 2,430 2,093 2,183 5.1% 4.3%
EBITDA2 3,649 4,343 3,908 3,901 3,704 3,719 0.4% 0.4%
Distribution 2,351 2,655 2,211 1,985 1,681 1,736 -5.9% 3.3%
Generation 1,060 1,427 1,643 1,680 1,886 1,847 11.8% -2.0%
Trading 278 287 74 263 173 170 -9.4% -2.1%
NET INCOME3 1,503 1,617 1,304 1,162 1,061 1,118 -5.7% 5.4%
Distribution 1,235 1,356 1,047 867 762 804 -8.2% 5.5%
Generation 721 373 419 309 377 340 -13.9% -9.7%
Trading 164 127 52 168 108 95 -10.3% -12.3%
Key Financial Figures | R$ million
2011 2012 2013 2014 2015 LTM2Q16CAGR 2011 –LTM2Q16
LTM2Q16 vs. 2015
TOTAL 54.6 56.7 58.5 60.0 57.6 56.3 0.6% -2.2%
Captive 39.9 40.7 41.1 43.2 41.7 41.2 0.6% -1.3%
TUSD 14.7 16.0 17.3 16.8 15.8 15.1 0.6% -4.5%
Energy Sales - Distribution | TWh
CPFL Energia | Operational and Financial figures
15
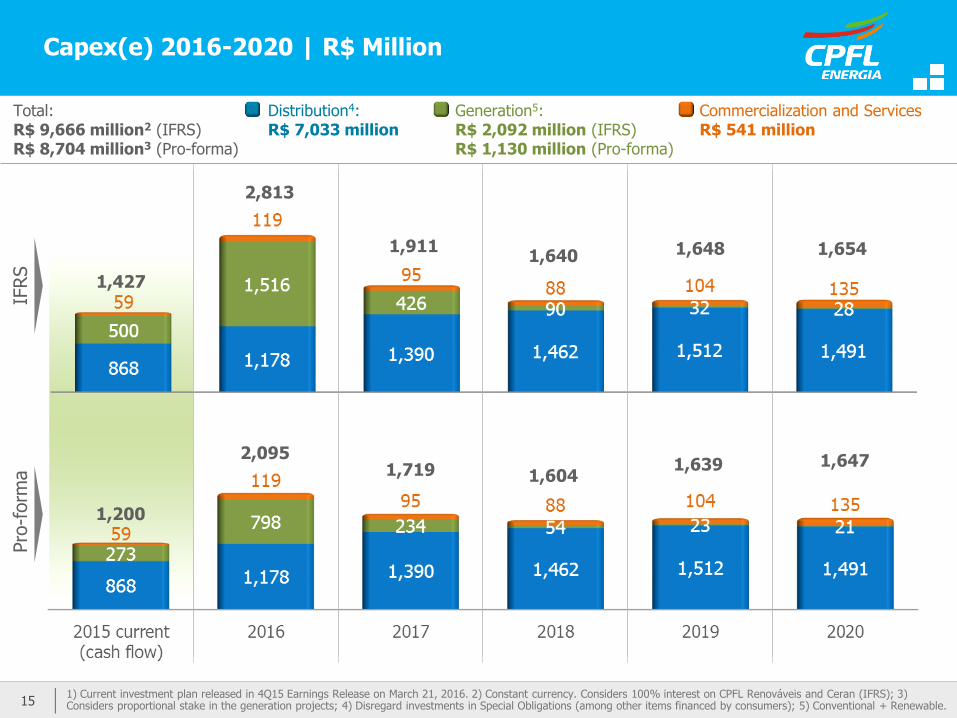
Capex(e) 2016-2020 | R$ Million
1) Current investment plan released in 4Q15 Earnings Release on March 21, 2016. 2) Constant currency. Considers 100% interest on CPFL Renováveis and Ceran (IFRS); 3) Considers proportional stake in the generation projects; 4) Disregard investments in Special Obligations (among other items financed by consumers); 5) Conventional + Renewable.
Total:R$ 9,666 million2 (IFRS)R$ 8,704 million3 (Pro-forma)
Distribution4: R$ 7,033 million
Generation5:R$ 2,092 million (IFRS)R$ 1,130 million (Pro-forma)
Commercialization and ServicesR$ 541 million
1,427
2,813
1,9111,640 1,648 1,654
IFRS
Pro
-form
a
1,200
2,0951,719 1,604
1,639 1,647
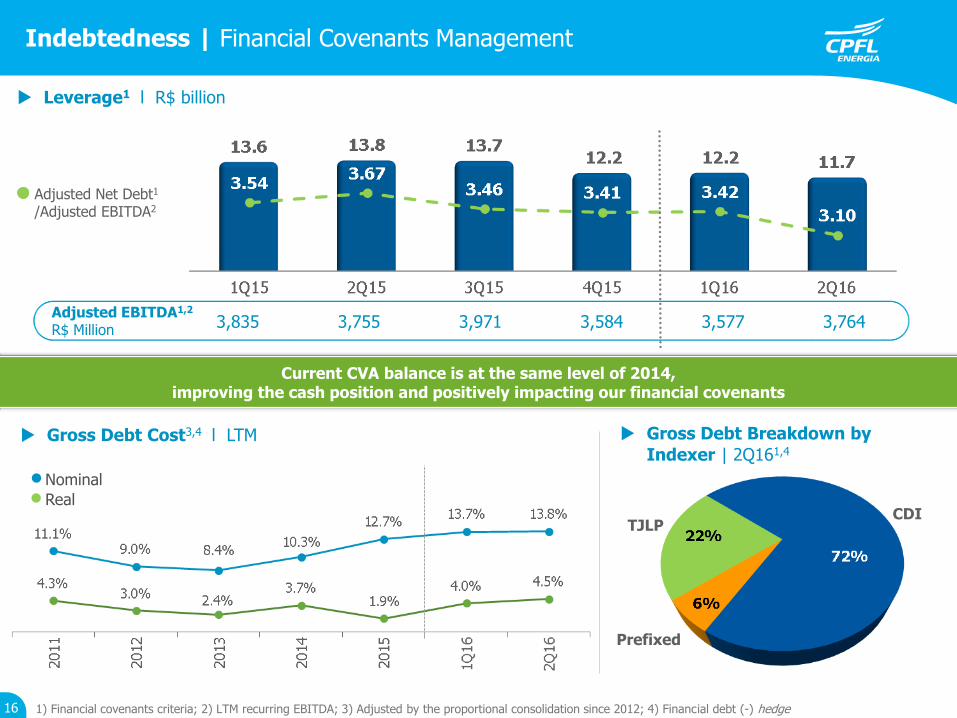
3,835 3,755 3,971 3,584 3,577 3,764Adjusted EBITDA1,2
R$ Million
Current CVA balance is at the same level of 2014, improving the cash position and positively impacting our financial covenants
Nominal
Real
1) Financial covenants criteria; 2) LTM recurring EBITDA; 3) Adjusted by the proportional consolidation since 2012; 4) Financial debt (-) hedge
Leverage1 l R$ billion
Gross Debt Cost3,4 l LTM Gross Debt Breakdown by
Indexer | 2Q161,4
Adjusted Net Debt1
/Adjusted EBITDA2
CDI
Prefixed
TJLP
Indebtedness | Financial Covenants Management
16
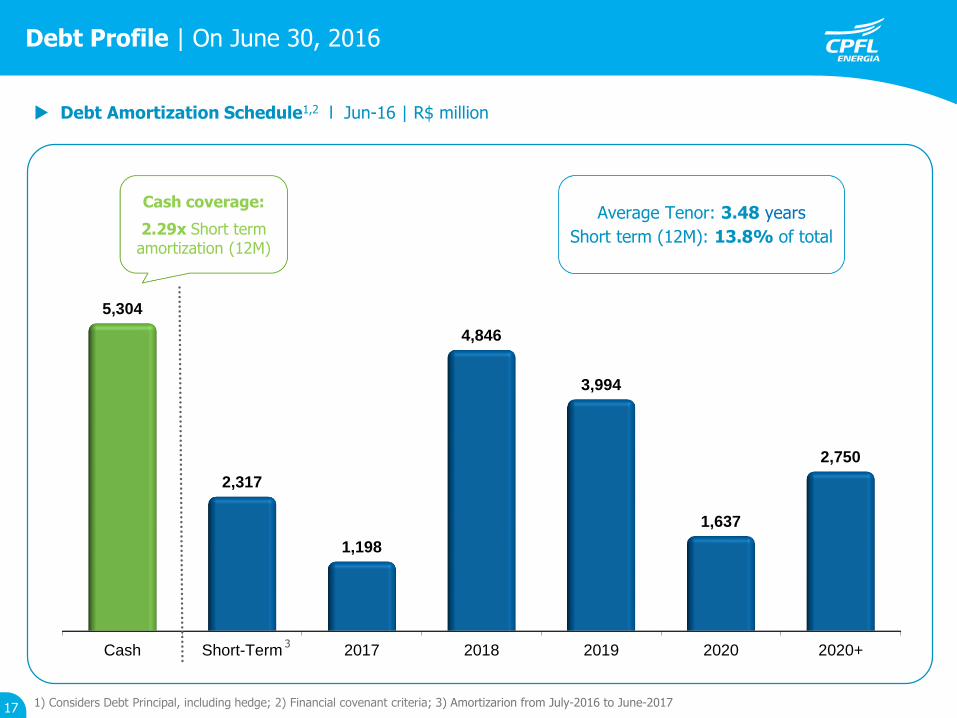
Cash Short-Term 2017 2018 2019 2020 2020+
5,304
2,317
1,198
4,846
3,994
1,637
2,750
Debt Profile | On June 30, 2016
1) Considers Debt Principal, including hedge; 2) Financial covenant criteria; 3) Amortizarion from July-2016 to June-2017
Debt Amortization Schedule1,2 l Jun-16 | R$ million
3
Cash coverage:
2.29x Short termamortization (12M)
Average Tenor: 3.48 years
Short term (12M): 13.8% of total
17
Annex
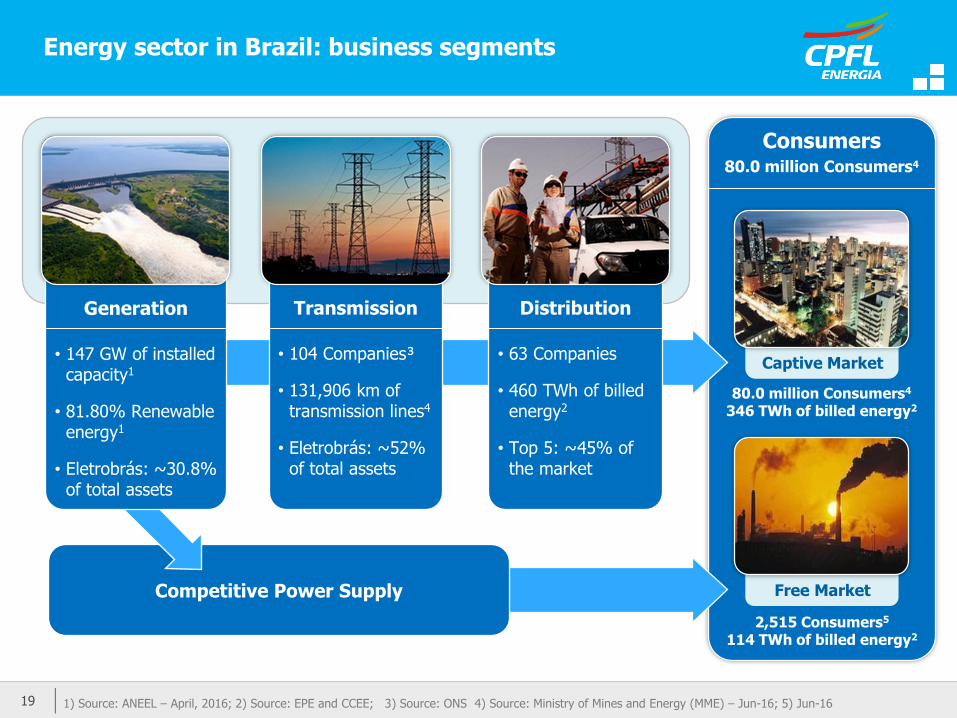
Energy sector in Brazil: business segments
Consumers
1) Source: ANEEL – April, 2016; 2) Source: EPE and CCEE; 3) Source: ONS 4) Source: Ministry of Mines and Energy (MME) – Jun-16; 5) Jun-16
Free Market
Captive Market
80.0 million Consumers4
2,515 Consumers5
114 TWh of billed energy2
80.0 million Consumers4
346 TWh of billed energy2
Transmission
• 104 Companies³
• 131,906 km of transmission lines4
• Eletrobrás: ~52%of total assets
Distribution
• 63 Companies
• 460 TWh of billed energy2
• Top 5: ~45% of the market
Competitive Power Supply
Generation
• 147 GW of installed capacity1
• 81.80% Renewable energy1
• Eletrobrás: ~30.8% of total assets
19
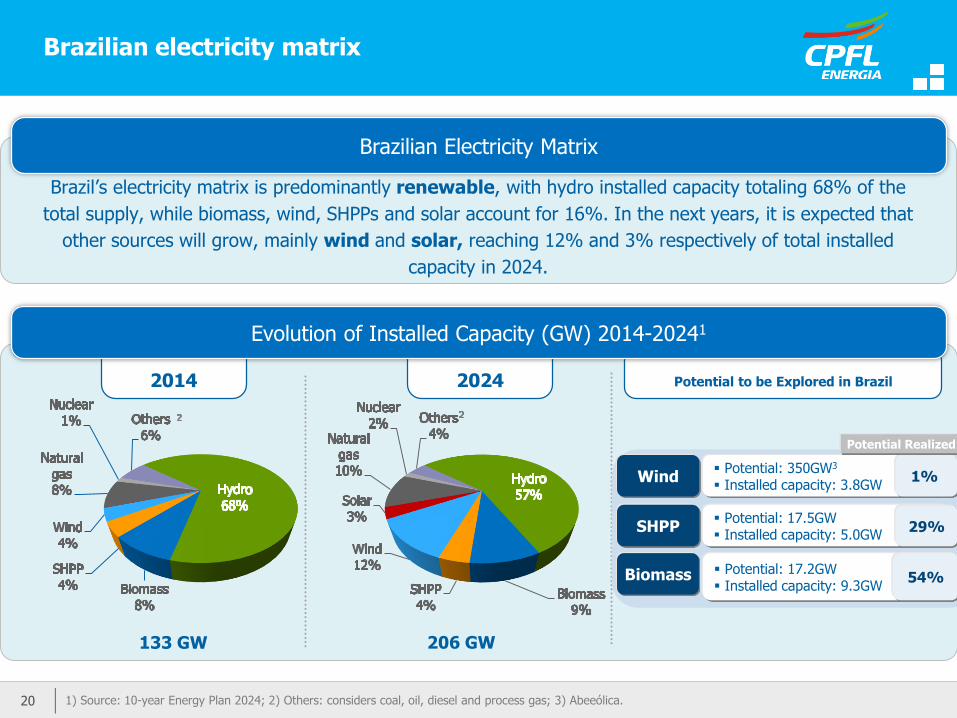
Brazilian electricity matrix
1) Source: 10-year Energy Plan 2024; 2) Others: considers coal, oil, diesel and process gas; 3) Abeeólica.
Brazil’s electricity matrix is predominantly renewable, with hydro installed capacity totaling 68% of the
total supply, while biomass, wind, SHPPs and solar account for 16%. In the next years, it is expected that
other sources will grow, mainly wind and solar, reaching 12% and 3% respectively of total installed
capacity in 2024.
Brazilian Electricity Matrix
133 GW 206 GW
2014 2024
20
Wind Potential: 350GW3
Installed capacity: 3.8GW1%
SHPP Potential: 17.5GW Installed capacity: 5.0GW
29%
Biomass Potential: 17.2GW Installed capacity: 9.3GW
54%
Potential Realized
Potential to be Explored in Brazil
Evolution of Installed Capacity (GW) 2014-20241
21
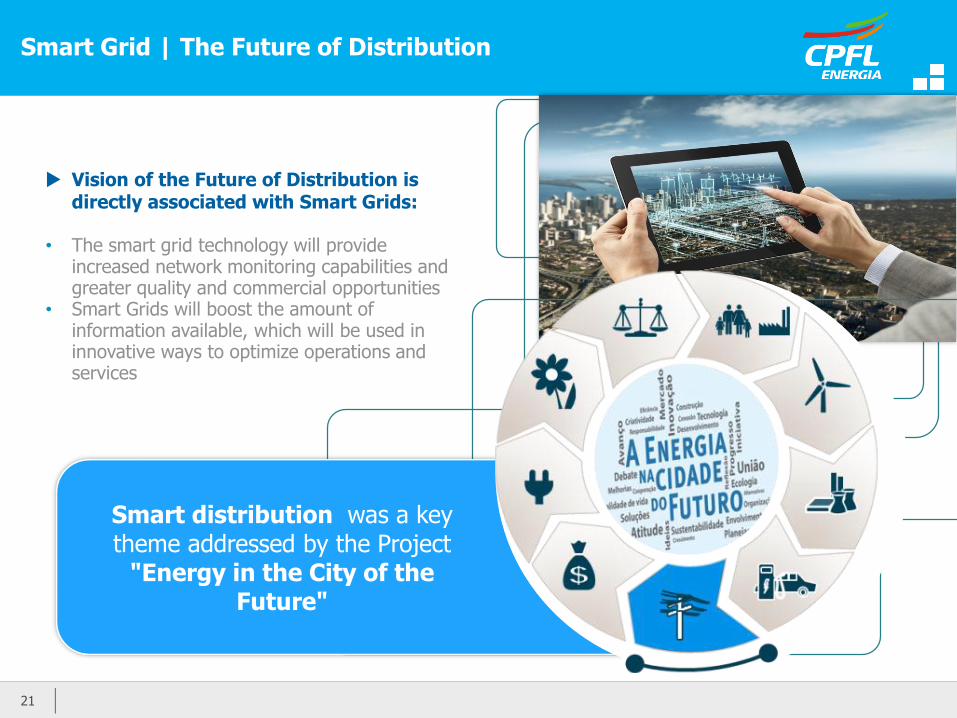
Smart distribution was a key theme addressed by the Project
"Energy in the City of the Future"
• The smart grid technology will provide increased network monitoring capabilities and greater quality and commercial opportunities
• Smart Grids will boost the amount of information available, which will be used in innovative ways to optimize operations and services
Smart Grid | The Future of Distribution
Vision of the Future of Distribution is directly associated with Smart Grids:
22
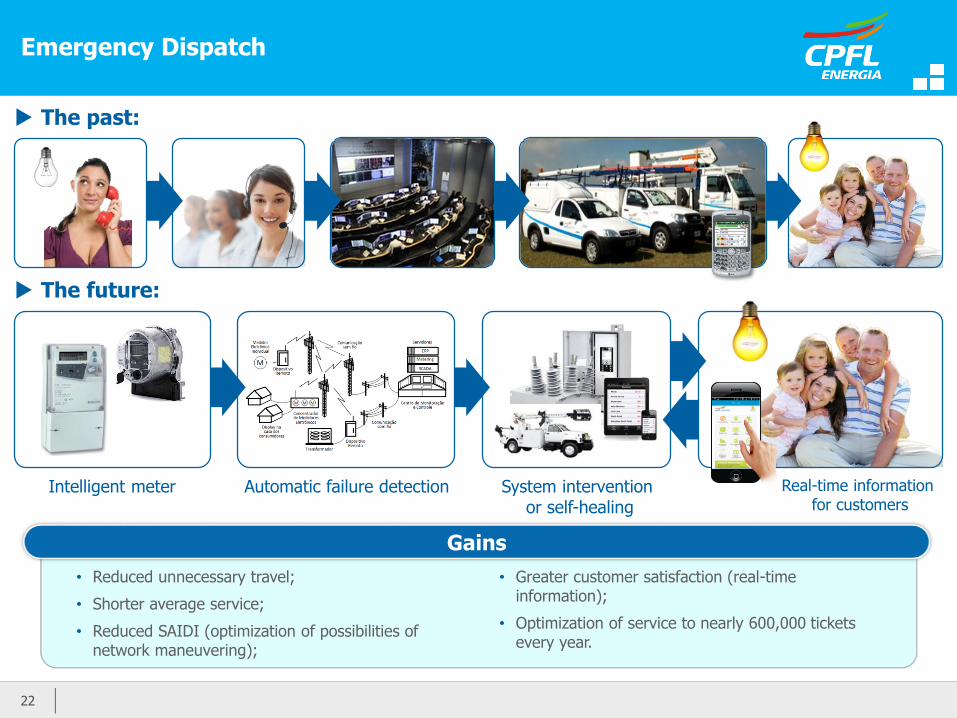
Emergency Dispatch
The past:
The future:
System interventionor self-healing
Automatic failure detection Real-time informationfor customers
Intelligent meter
• Reduced unnecessary travel;
• Shorter average service;
• Reduced SAIDI (optimization of possibilities of network maneuvering);
• Greater customer satisfaction (real-time information);
• Optimization of service to nearly 600,000 tickets every year.
Gains
23
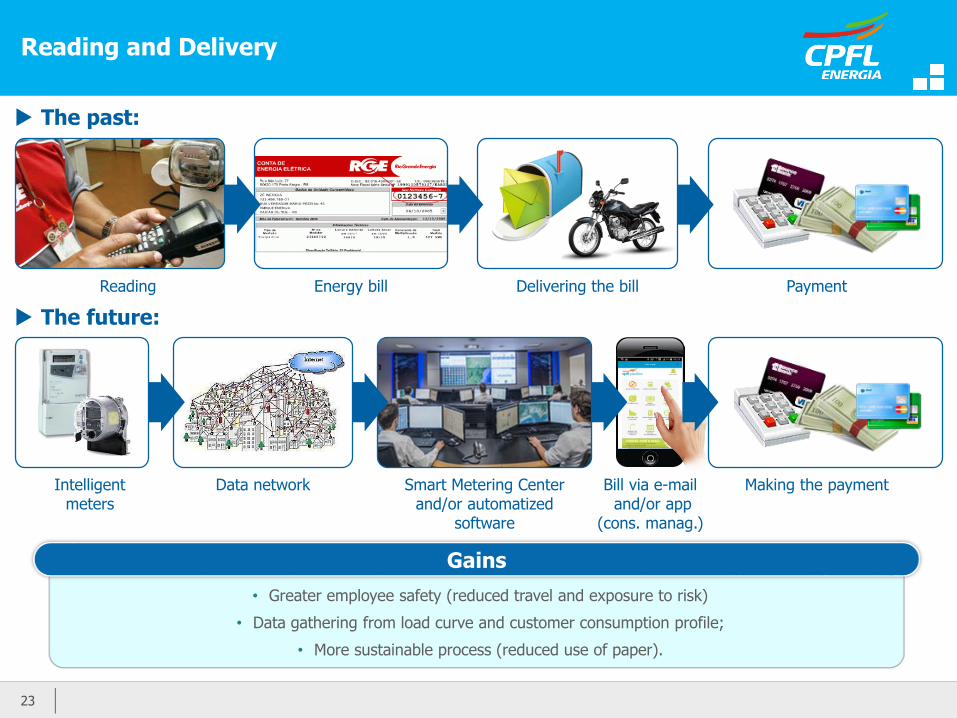
Reading and Delivery
Reading Energy bill Delivering the bill Payment
Making the paymentSmart Metering Center and/or automatized
software
Data networkIntelligent meters
Bill via e-mailand/or app
(cons. manag.)
The past:
The future:
• Greater employee safety (reduced travel and exposure to risk)
• Data gathering from load curve and customer consumption profile;
• More sustainable process (reduced use of paper).
Gains
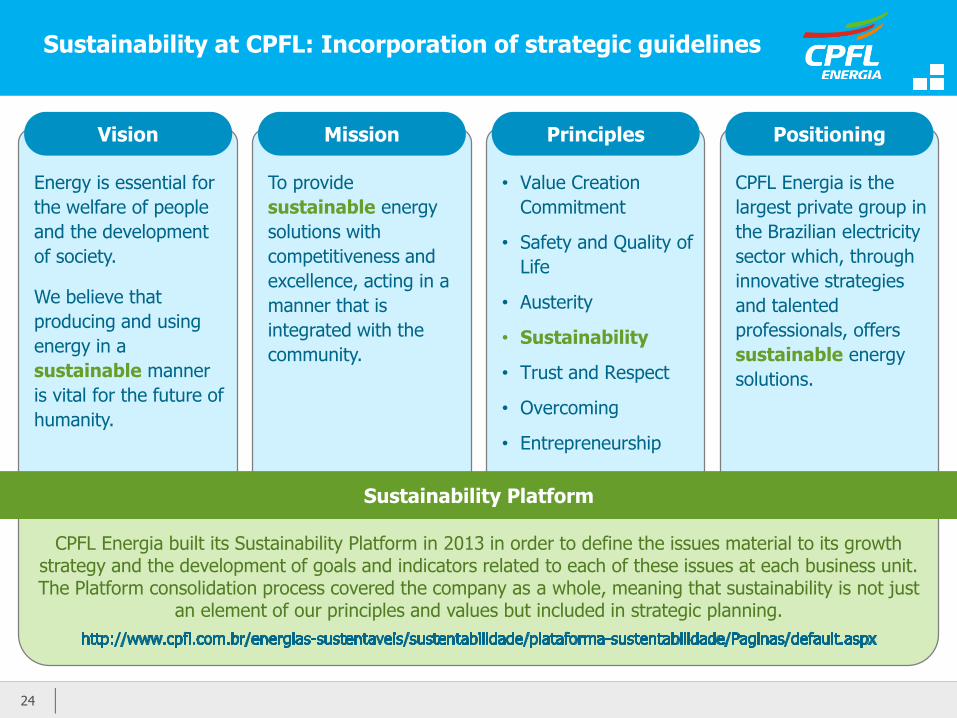
Sustainability at CPFL: Incorporation of strategic guidelines
24
Energy is essential for
the welfare of people
and the development
of society.
We believe that
producing and using
energy in a
sustainable manner
is vital for the future of
humanity.
Vision
To provide
sustainable energy
solutions with
competitiveness and
excellence, acting in a
manner that is
integrated with the
community.
Mission
• Value Creation
Commitment
• Safety and Quality of
Life
• Austerity
• Sustainability
• Trust and Respect
• Overcoming
• Entrepreneurship
Principles
CPFL Energia is the
largest private group in
the Brazilian electricity
sector which, through
innovative strategies
and talented
professionals, offers
sustainable energy
solutions.
Positioning
CPFL Energia built its Sustainability Platform in 2013 in order to define the issues material to its growth strategy and the development of goals and indicators related to each of these issues at each business unit. The Platform consolidation process covered the company as a whole, meaning that sustainability is not just
an element of our principles and values but included in strategic planning.
Sustainability Platform
24
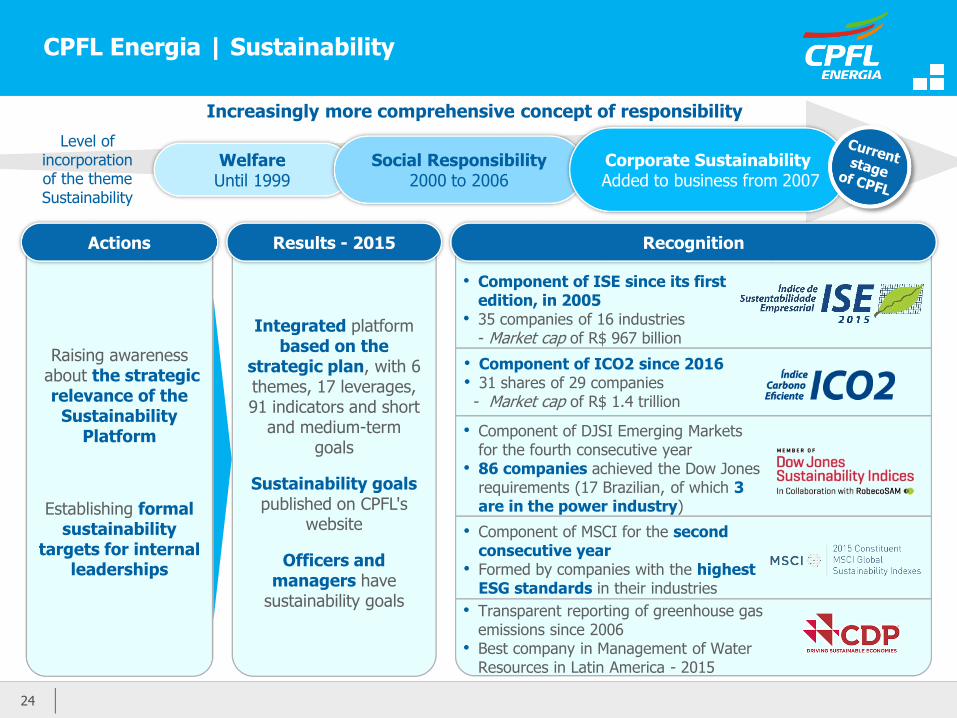
Actions
Raising awarenessabout the strategic relevance of the
Sustainability Platform
Establishing formal sustainability
targets for internal leaderships
Results - 2015
Integrated platform based on the
strategic plan, with 6 themes, 17 leverages, 91 indicators and short
and medium-term goals
Sustainability goals published on CPFL's
website
Officers and managers have
sustainability goals
Recognition
WelfareUntil 1999
Social Responsibility2000 to 2006
Corporate SustainabilityAdded to business from 2007
Level of incorporationof the theme Sustainability
Increasingly more comprehensive concept of responsibility
CPFL Energia | Sustainability
• Component of ISE since its first edition, in 2005
• 35 companies of 16 industries - Market cap of R$ 967 billion
• Component of DJSI Emerging Markets for the fourth consecutive year
• 86 companies achieved the Dow Jones requirements (17 Brazilian, of which 3 are in the power industry)
• Component of MSCI for the second consecutive year
• Formed by companies with the highest ESG standards in their industries
• Transparent reporting of greenhouse gas emissions since 2006
• Best company in Management of Water Resources in Latin America - 2015
• Component of ICO2 since 2016• 31 shares of 29 companies - Market cap of R$ 1.4 trillion