corporate presentation -...
TRANSCRIPT

Corporate PresentationNovember 2017

2
Disclaimer
The material that follows comprises information about Avianca Holdings S.A. (the “Company”) and its subsidiaries, as of the date of the presentation. It has been prepared solely for informational purposes and is not
to be construed as a solicitation or an offer to buy or sell any securities and should not be treated as giving legal, tax, investment or other advice to potential investors. The information presented or contained herein
is in summary form and does not purport to be complete.
No representations or warranties, express or implied, are made as to, and no reliance should be placed on, the accuracy, fairness, or completeness of this information. Neither the Company nor any of its affiliates,
advisers or representatives accepts any responsibility whatsoever for any loss or damage arising from any information presented or contained in this presentation. The information presented or contained in this
presentation is current as of the date hereof and is subject to change without notice, and its accuracy is not guaranteed. Neither the Company nor any of its affiliates, advisers or representatives makes any
undertaking to update any such information subsequent to the date hereof.
This presentation contains forward-looking statements, which are based upon the Company and/or its management’s current expectations and projections about future events. When used in this presentation, the
words “believe,” “anticipate,” “intend,” “estimate,” “expect,” “should,” “may” and similar expressions, or the negative of such words and expressions, are intended to identify forward-looking statements, although
not all forward-looking statements contain such words or expressions. Additionally, all information, other than historical facts included in this presentation is forward-looking information. Such statements and
information are subject to a number of risks, uncertainties and assumptions. Forward-looking statements are not guarantees of future performance and actual results may differ materially from those anticipated due
to many factors. As for forward-looking statements that relate to future financial results and other projections, actual results may be different due to the inherent uncertainty of estimates, forecasts and projections.
Because of these uncertainties, potential investors should not rely on these forward-looking statements. Neither the Company nor any of its affiliates, directors, officers, agents or employees, nor any of the
shareholders or initial purchasers shall be liable, in any event, before any third party (including investors) for any investment or business decision made or action taken in reliance on the information and statements
contained in this presentation or for any consequential, special or similar damages.
Certain data in this presentation was obtained from various external sources, and neither the Company nor its affiliates, advisers or representatives has verified such data with independent sources. Accordingly,
neither the Company nor any of its affiliates, advisers or representatives makes any representations as to the accuracy or completeness of that data, and such data involves risks and uncertainties and is subject to
change based on various factors.
In addition to IFRS financials, this presentation includes certain non-IFRS financial measures, including Adjusted EBITDAR, which is commonly used in the airline industry to view operating results before depreciation,
amortization and aircraft operating lease charges, as these costs can vary significantly among airlines due to differences in the way airlines finance their aircraft and other asset acquisitions. However, Adjusted
EBITDAR should not be considered as an alternative measure to operating profit, as an indicator of operating performance, as an alternative to operating cash flows or as a measure of the Company’s liquidity.
Adjusted EBITDAR as calculated by the Company and as presented in this document may differ materially from similarly titled measures reported by other companies due to differences in the way these measures are
calculated. Adjusted EBITDAR has important limitations as an analytical tool and should not be considered in isolation from, or as a substitute for an analysis of, the Company’s operating results as reported under
IFRS.
The trademarks included herein are the property of the owners thereof and are used for reference purposes only. Such use should not be construed as an endorsement of the products or services of the Company or
this proposed offering.

3
Agenda
Company Overview and Track Record
Leading Airline in Latin America focused on
service excellence
Strong Operational and Financial Performance
1
2
3
Strategic Projects and Full Year Outlook5
Diversified Sources of Revenue with Growing
Non-Passenger Businesses4

Company Overview and Track Record

5
Successful Integration with Further Synergy Generation Potential
Source: Company.(1) Consolidated figures for the eleven months ended December 31, 2010.(2) Includes EBIT contribution of Avianca S.A. and GTH.(3) Maintenance, Repair and Overhaul providers (“MRO”) and Operational Excellence Center (“CEO”).
Well-Defined Integration Plan
▪ Experience operating widebody aircraft offers new
opportunities for traffic from Central America and Lima
▪ Complementary networks offer a unique growth
proposition in Central and South America
▪ Only 2 routes overlapped before combination
Complementary
Routes
Complementary
Fleet
▪ Both airlines shared similar brand and customer
strategies, providing a high standard of service
▪ Talent and commitment aligned with objectives and
similar cultures
Customer
Service
Approach
Great
Talent
Shared Strengths and Values
Total Revenue’16: $4,081MM
Total Revenue‘10: $2,815MM(1)
Single Management Team
Single Loyalty Program
Network & Commercial Integration
Star Alliance
LifeMiles Maximization
Realized Revenue Synergies: $219MM
6.6% 6.2%8.4%5.3% 5.7% 7.2%~4.5%(2)EBIT Margin:
20112012
Core Systems Migration
Single Brand
Single Commercial Code
Revenue ManagementOptimization
Ancillary Revenue
ERPIntra Hub Connectivity Airport Optimization Model
Single Operations Management
Fleet Interchangeability
Cost Control Initiatives
Potential Cost-Reduction Synergies: US$80MM
2015
2016
2014
2017
Network / Fleet Optimization
MRO and CEO(3)
Single Web Page
2013
2010
7.0% - 9.0%

Colombia Domestic
#1
54.5% Market Share(3)
Intra-Home Markets(4)
#1
68.4% Market Share(3)
Home Markets to Spain
#2
24.6% Market Share(3)
6
Leading Airline with Strategic Footprint in the Americas
US$4,081 mm Total Revenues in 2016
100+ Destinations and 6,000+ Weekly Departures
US$879mm Total EBITDAR in 2016
168 Passenger and 12 Freighter Aircraft(1) as of September 2017Average Jet Fleet Age of 7.2 Years
3 Hubs:Bogota, San Salvador and Lima
Source: Company, Aeronáutica Civil de Colombia, and internal data derived from Travelport Marketing Information Data Tapes (“MIDT”). Note: market shares based on number of passengers.(1) 5 Airbus 330F, 5 Airbus 300F and 2 Boeing 767F(2) Brazilian operations reflect the code-share agreement with Oceanair (“Avianca Brasil”), including the licensing of the Avianca trademark(3) Sourced from Company, as of September 2017(4) International traffic within our Home Markets (Colombia, Ecuador, Peru, El Salvador, Costa Rica, Nicaragua, Honduras, Guatemala, Belize, excluding Central American & Caribbean (non-regional))
Complementary Business Lines –20% of Consolidated Revenues in 2016
Single commercial code✓
Single Avianca brand✓
Single website✓
Interchangeability of aircraft✓
Leading Loyalty Coalition Program with 7.5+ mm Members
Geographic Footprint
(NY008B8R) 684268_1.wor(NY008B8R) 684268_1.wor(NY008B8R) 684268_1.wor(NY008B8R) 684268_1.wor(NY008B8R) 684268_1.wor(NY008B8R) 684268_1.wor(NY008B8R) 684268_1.wor(NY008B8R) 684268_1.wor(NY008B8R) 684268_1.wor(NY008B8R) 684268_1.wor(NY008B8R) 684268_1.wor(NY008B8R) 684268_1.wor(NY008B8R) 684268_1.wor(NY008B8R) 684268_1.wor(NY008B8R) 684268_1.wor(NY008B8R) 684268_1.wor(NY008B8R) 684268_1.wor(NY008B8R) 684268_1.wor(NY008B8R) 684268_1.wor(NY008B8R) 684268_1.wor(NY008B8R) 684268_1.wor(NY008B8R) 684268_1.wor(NY008B8R) 684268_1.wor(NY008B8R) 684268_1.wor(NY008B8R) 684268_1.wor(NY008B8R) 684268_1.wor(NY008B8R) 684268_1.wor(NY008B8R) 684268_1.wor(NY008B8R) 684268_1.wor(NY008B8R) 684268_1.wor(NY008B8R) 684268_1.wor(NY008B8R) 684268_1.wor(NY008B8R) 684268_1.wor(NY008B8R) 684268_1.wor(NY008B8R) 684268_1.wor(NY008B8R) 684268_1.wor(NY008B8R) 684268_1.wor(NY008B8R) 684268_1.wor(NY008B8R) 684268_1.wor(NY008B8R) 684268_1.wor(NY008B8R) 684268_1.wor(NY008B8R) 684268_1.wor(NY008B8R) 684268_1.wor(NY008B8R) 684268_1.wor(NY008B8R) 684268_1.wor(NY008B8R) 684268_1.wor(NY008B8R) 684268_1.wor(NY008B8R) 684268_1.wor(NY008B8R) 684268_1.wor
Avianca Brasil(2)
Courier

Leading Airline in Latin America focused on service excellence
Leading Airline with Strategic Footprint in the Americas(5)
Peru(4)
8
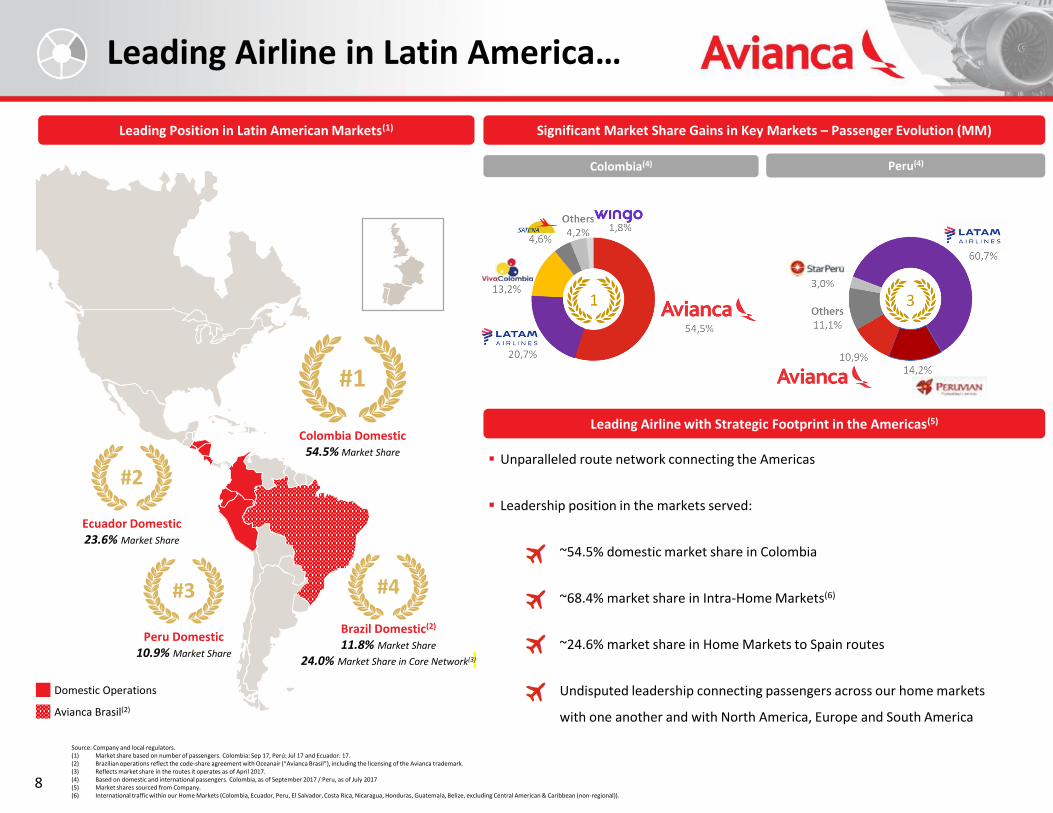
Leading Airline in Latin America…
Source: Company and local regulators.(1) Market share based on number of passengers. Colombia: Sep 17, Perú: Jul 17 and Ecuador: 17.(2) Brazilian operations reflect the code-share agreement with Oceanair (“Avianca Brasil”), including the licensing of the Avianca trademark.(3) Reflects market share in the routes it operates as of April 2017.(4) Based on domestic and international passengers. Colombia, as of September 2017 / Peru, as of July 2017(5) Market shares sourced from Company.(6) International traffic within our Home Markets (Colombia, Ecuador, Peru, El Salvador, Costa Rica, Nicaragua, Honduras, Guatemala, Belize, excluding Central American & Caribbean (non-regional)).
Significant Market Share Gains in Key Markets – Passenger Evolution (MM)
Colombia(4)
Domestic Operations
Avianca Brasil(2)
#1
Colombia Domestic54.5% Market Share
#3
Peru Domestic10.9% Market Share
#4
Brazil Domestic(2)
11.8% Market Share
24.0% Market Share in Core Network(3)
Leading Position in Latin American Markets(1)
#2
Ecuador Domestic23.6% Market Share
▪ Unparalleled route network connecting the Americas
▪ Leadership position in the markets served:
~54.5% domestic market share in Colombia
~68.4% market share in Intra-Home Markets(6)
~24.6% market share in Home Markets to Spain routes
Undisputed leadership connecting passengers across our home markets
with one another and with North America, Europe and South America

Long Term Fleet – 4 Families by 2020 2010 – 9 Families
E190 MD83 B757
ATR72
✓ ATR72s for improved
regional capacity
A330F
Boeing 787
✓More fuel efficient than
many similarly sized
airplanes
A320 Neo
✓ 15% less fuel consumption
✓ Up to 500nm of additional
range
✓ Up to 3% cost savings
✓ 40% more cargo capacity vs.
previous cargo fleet
A320 B767 Regional
A330 B737 F100
✓ Increased fuel efficiency
✓ Improved technical dispatch
reliability
✓ Reduced training costs and
maintenance expenses
✓ Improved range and network
performance
✓ Opportunity to upgage in congested
markets
✓ Increased regional capacity
✓ New A321 Neo (2 for 2017): First
Latin American airline to operate it;
allows savings of up to 20% in jet
fuel, reduces up to 50% acoustic
footprint and reduces the emission
of CO2 by plane by 5K tons;
Jet passenger operative
Fleet average age: 6.3 years
9
Successful Fleet Optimization Leadingto Reduced Complexity
Source: Company.(1) The Airbus A320 Family is comprised of 10 – A318, 16 – A319, 49 – A320, 2 – A321, 10 – A319sharklets, 13 – A320sharklets and 9 – A321sharklets.(2) Avianca also has rights to purchase up to 10 Boeing 787 Dreamliners and 15 ATR72s. In April 30, 2015, the Company signed a Purchase Contract for a total of 100 A320 New Engine Option (NEO) family aircraft with deliveries between 2019 and 2024, which are included in the
contractual delivery schedule set above. In line with our initiatives directed towards enhancing profitability, achieving a leaner capital structure and reducing the current levels of debt, in April 2016, Avianca negotiated with Airbus a significant reduction of its scheduled aircraft deliveries for 2016, 2017, 2018 and 2019 and certain changes to the type of aircraft (both upgrades and downgrades), but did not alter the total deliveries scheduled between 2016 and 2025.
Modern
fleet
providing
platform for
higher
profitability
2017 2018 2019 2020 2021 Total
B787 2 1 3 - - 5
A319 2 - - 4 4 10
A320 - 5 6 14 17 42
A321 2 - - 2 2 6
Total(1) 6 6 9 20 23 63
Backlog Designed to Enhance Fleet Efficiency(2)
2017 – 7 Families
Boeing 787
A320 Family(1)
ATR 72 / 42
A330 Pax / 330F /300F
B767F
E190
Cessna 208
Average Jet Fleet Age of 10.1 Years

Strong Operational and Financial Performance

11
Demand outgrows capacity deployment resulting in record Load Factor
3Q17
ASK Growth
3Q17
Insights
3Q17
Load Factor
Intra Home
Markets1
HM to North
America2
Central America &
Caribbean4
HM to South
America3
Domestic*
Region
-7,4%
3Q17
RPK Growth
-3,2%
7,5%
6,4%
1,2%
11,9%
Capacity reduction in September
(last 10 days) due to pilots' strike
with slight traffic impact
Strong competitive position in
strategic markets drives demand
growth
Traffic and yield improvement
above capacity growth
Yield and demand growth driven
by economic recovery, supports
capacity increase in core markets
Broad traffic growth with yield
improvement driven by economic
recovery
TotalRPK Growth
4.9%
Load Factor
84.6%
Home Markets to
Europe
3,5%
4,9%
3,5%
1,7%
16,1%12,2%
84,8%
79,0%
86,3%
84,0%
78,5%
87,8%
ASK Growth
3.5%
Strong capacity expansion with
traffic and yield growth
*Domestic Market: Colombia, Peru, Ecuador 1 Local Intra-Markets: Colombia, Peru, Ecuador, Salvador, Costa Rica, Guatemala; 2 From Local Markets to North América including México 3 From Colombia, Perú, Ecuador and Costa Rica to Bolivia, Chile, Argentina, Brazil and Uruguay, 4 Belize, Cuba Curazao, Republica Dominicana, Panamá, Costa Rica, Guatemala, Honduras, Nicaragua

12 Source: Company InformationBp: Basics points
Demand recovery in core markets drive yield improvement
Load Factor: 3Q17 has the strongest LF in company history Yield - US¢: Continued yield recovery
RPKs – Millions: Strong demand growth outpaces Aviancas’… ASKs – Millions: capacity deployment across the network…
31.172
28.094 30.800
9M16 9M17
Quarterly RPK 9 Months RPK RPK ex-Strike
10.854
8.689 9.441
9.997
10.483
3Q14 3Q15 3Q16 3Q17
+4.9%
+8.6%
+9.6%
+11.0%
12.733
10.683
11.618
11.973 12.389
3Q14 3Q15 3Q16 3Q17
37.535
35.052
37.190
9M16 9M17
Quarterly ASK 9 Months ASK ASK ex-Strike
+3.5%
+6.4%
+6.1%
+7.1%
Quarterly Load Factor 9 Months Load Factor Load Factor, ex-Strike
85,2%
81,3% 81,3%
83,5% 84,6%
3Q14 3Q15 3Q16 3Q17
83,0%
80,1%82,8%
9M16 9M17
+112 bp
+175 bp
+271 bp
+294 bp
11,9
9,5 8,8 8,9
11,9
9,5 8,8
9,2
3Q14 3Q15 3Q16 3Q17
8,6 8,7
8,6
8,8
9M16 9M17
+2.1%
+4.3%
Quarterly Yield 9 Months Yield Yield, ex-Strike
+ 0.9%
+ 0.9%
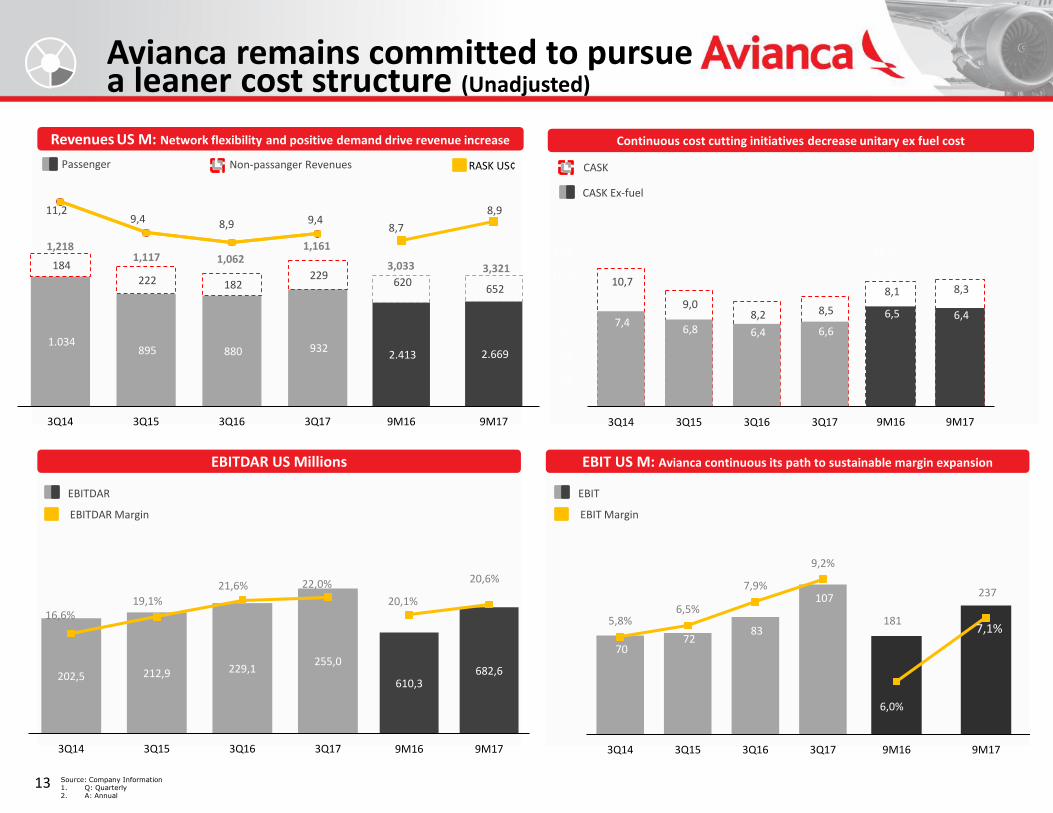
13
Avianca remains committed to pursuea leaner cost structure (Unadjusted)
Revenues US M: Network flexibility and positive demand drive revenue increase
EBITDAR US Millions EBIT US M: Avianca continuous its path to sustainable margin expansion
Continuous cost cutting initiatives decrease unitary ex fuel cost
Source: Company Information1. Q: Quarterly2. A: Annual
EBITDAR Margin
EBITDAR
EBIT Margin
EBIT
610,3 682,6
20,1%
20,6%
9M16 9M17
202,5 212,9 229,1255,0
16,6%19,1%
21,6% 22,0%
3Q14 3Q15 3Q16 3Q17
70 72
83
107
5,8%6,5%
7,9%
9,2%
3Q14 3Q15 3Q16 3Q17
181
237
6,0%
7,1%
9M16 9M17
CASK
CASK Ex-fuel
10,7
9,0 8,2 8,5
7,4 6,8 6,4 6,6
-
2,0
4,0
6,0
8,0
10,0
12,0
3Q14 3Q15 3Q16 3Q17
-
2,0
4,0
6,0
8,0
10,0
12,0
8,1 8,3
6,5 6,4
9M16 9M17
1.034 895 880 932
184
222 182 229
3Q14 3Q15 3Q16 3Q17
Passenger RASK US¢Non-passanger Revenues
3,033
11,29,4 8,9 9,4
2.413 2.669
620 652
9M16 9M17
1,1611,0621,117
1,218
3,321
8,7
8,9

14
Avianca remains committed to pursuea leaner cost structure (Adjusted)
Revenues1 US M: Network flexibility and positive demand drive revenue increase
EBITDAR1 US Millions EBIT1 US M: Avianca continuous its path to sustainable margin expansion
Continuous cost cutting initiatives decrease unitary ex fuel cost
Source: Company Information1. When indicated the figures are adjusted by the following one-time items:$-31,580m: ACDAC’s Foregone Revenues; $-14,530M: ACDAC’s operatives expenses; $ 6,522M: Aerogal's Reservs Adjust, Opex; $ 1,356MM: Engines Incidents B787, Opex.2. Q: Quarterly3. A: Annual
EBITDAR Margin
EBITDAR
EBIT Margin
EBIT
CASK
CASK Ex-fuel
Passenger RASK US¢Non-passanger Revenues
10,5
8,7 8,2 8,6
7,2 6,5 6,4 6,6
-
2,0
4,0
6,0
8,0
10,0
12,0
3Q14 3Q15 3Q16 3Q17
-
2,0
4,0
6,0
8,0
10,0
12,0
7,9 8,3
6,3 6,4
9M16 9M17
2.413 2.701
563 652
9M16 9M17
1.034 895 880 963
158 198 182
229
3Q14 3Q15 3Q16 3Q17
2,977
1,193
1,0621,0931,192
3,352
11,2
9,4 8,9 9,6
8,5
9,0
70
82 83
132
5,9%
7,5% 7,9%
11,0%
3Q14 3Q15 3Q16 3Q17
193
265 6,5%
7,9%
9M16 9M17
202,5 222,6 229,1278,6
17,0%
20,4%21,6%
23,4%
3Q14 3Q15 3Q16 3Q17
2,0%
7,0%
12,0%
17,0%
22,0%
27,0%
622,4 708,7
20,9%
21,1%
9M16 9M17
15,0%
16,0%
17,0%
18,0%
19,0%
20,0%
21,0%
22,0%

129302 278 268
1.142
130
100 92 92
325
0
29 30
550
0
2017 2018 2019 2020 2021+
AIRCRAFT CORPORATE DEBT BONDS
94,33%
1,91% 3,76%
59,66%
22,03%
1,83% 16,49%
By Currency
EurosColombianPesos
U.S.Dollars
Type(1) Currency Avg. Rate
Aircraft Debt U.S. Dollars 3.53%
BondsColombian
Pesos11.19%
Bonds U.S. Dollars 7.95%
CorporateDebt
U.S. Dollars 4.56%
Total 4.65%
15
Debt Overview and Deleveraging Plan
____________________Source: Company.(1) Excludes US$6.3 Millions of corporate debt in COP and US$128.2 Millions of aircraft debt in EUR.(2) Current installments of long term debt + long term debt – cash. Cash includes cash and cash equivalents + restricted cash + available for sale securities + short term certificates of bank deposits + long term restricted cash.(3) Current installments of long term debt + long term debt + (aircraft rentals 12M x 7) – cash. Cash includes cash and cash equivalents + restricted cash + available for sale securities + short term certificates of bank deposits + long term restricted cash.(4) Consolidated net profit for the period plus the sum of income tax expense, depreciation, amortization and impairment and aircraft rentals, minus interest expense, minus interest income, minus derivative instruments, minus foreign exchange.(5) EBITDAR coverage ratio calculated as EBITDAR divided by the sum of aircraft leases and interest expense.
3Q17 Debt Amortization Schedule (US$MM)
3Q17 Debt Profile
By Type(1)
USD Aircraft Debt
COPBonds
USD Bonds
USD CorporateDebt
258
432400
910
1.467

Diversified Sources of Revenue with Growing Non-Passenger Businesses

17
Avianca Holdings: More Thanan Airline
Source: Company.(1) Considers 5 Airbus 330F, 5 Airbus 300F and 2 Boeing 767F.(2) Includes bellies and excludes Colombia domestic operations. Includes commercial agreements with OceanAir Linhas Aereas, not included in official statistics.(3) Last twelve month figures ending June 30, 2017.
Business Lines
PassengerTransport
Loyalty Business
Other Services
Courier and Cargo Services
Business Overview Brands Key Highlights (2017)
■ Result of the combination of Avianca and Taca with
complementary operations in Andean Region and
Central America
■ Extensive route network from hubs in Bogota, San
Salvador and Lima
■ Member of Star Alliance since 2012
■ Aircraft maintenance, crew training and other airport
services to other carriers
■ Travel-related services to customers including all-
inclusive vacation deals
■ In-flight duty-free sales
■ 13 freighter aircraft complemented by passenger fleet
bellies
■ Deprisa is a leading express courier operation in
Colombia with broad domestic and international
product portfolio; UPS allied in Colombia
■ Strong brand recognition and reputation in Colombia
■ One of the largest coalition loyalty programs in Latin
America
■ 20-year agreement, guaranteed exclusivity and seat
availability from Avianca
■ Solid burn-to-earn ratio
■ $3,3 Billions passenger revenue
■ 168 passenger aircraft(1)
■ 28 countries reached
■ 6,000+ weekly departures
■ 12% YoY growth in 2015 in revenue from
external clients
■ 2,700+ hours of flight simulators
commercialized
■ 12 cargo aircraft(1)
■ $671mm revenue
■ 1,917 mm ATKs(2)
■ 1,054 mm RTKs(2)
■ 41.1% | 11.0% market Share Colombia |
Miami
■ 7.5+ mm members(3)
■ 626k+ active co-branded credit cards
■ +322 commercial Partners
■ Freddie award winner 2013 – 2017
Courier

LifeMiles

19
LifeMiles at-a-Glance
Source: Company.(1) LifeMiles home markets include Colombia, Peru, Ecuador and Central America.
LifeMiles won 2 categories in the 2017 Freddie Awards
Best Redemption Ability, Best Promotion, Up-and-Coming Program
Selected Air Companies
Selected Financial Institutions
~70 banks with active contracts
Selected Regional Hotels
Other Selected Commercial Partners
Strong Brand RecognitionStrong and Growing Network Commercial Partners
Co-Branded Credit Cards
Robust Financial and Performance and Leading Market Positions
HomeMarkets(1)
Members (MM) Quarterly Highlights Geographic Presence
2015
Best Promotion
Up and Coming Program
2016
Redemption Ability
Up and Coming Program
Best Promotion
2017
1
1
1
1
1
Best Promotion
Up and Coming Program
1
1
• 3Q’17 revenues increased 8.8% vs 3Q´16
• 626K active cobranded credit cards, an increase of 21.7% vs. 3Q’16
• More than 7.5 million members, a 9.0% increase vs. 3Q’16
• 322 commercial partners, +6.3% vs 3Q’16
4,44,9
5,46
6,57
7,52
2011 2012 2013 2014 2015 2016 3Q17


RTK (MM)(3) Load Factor
21
Increasing Footprint in Latin AmericanMarkets
Source: Company.(1) On a per trip basis.(2) Includes consolidated revenues from the cargo operation in Mexico.(3) Includes bellies and excludes Colombia domestic operations. Includes commercial agreements with OceanAir Linhas Aereas, not included in official statistics.(4) International Cargo – Aeronáutica Civil de Colombia (as of June 2017) – (5) Miami-Dade Aviation Statistics, by airline group (as of June 2017)
▪ First A330F operating under Peruvian certification (COA)
allowing for more efficient asset utilization and network
optimization
▪ Strong performance for 3 Quarter 2017, with an increase of
+8.8% in transported tons when compared to same period in
2016
▪ New A330Fs provide reduced unit costs, higher capacity (up to
40% more than the previous fleet)(1) and improved reliability
Market Share Colombia (2017)(4)
Segment Overview
Market Share Miami (2017)(5)
Key Metrics (Cargo and Courier)
ATK (MM) (3)Revenue (US$MM)(2)
(% Market share by freight carried) (% Market share by freight carried)
149
116
140
3Q16 3Q17
+28.6%
+20.7%
+11.9%
564 631
3Q16 3Q17
+18.5%
311
369
3Q16 3Q17
55,20% 58,45%
3Q16 3Q17
325 bp
41,1%
8,6% 8,6% 8,6%4,9%
3,1%
25,2%
AVH Atlas Latam UPS Skylease Cargolux Others
13,3%11,5% 11,0%
8,0%6,3% 6,0%
44,0%
Atlas UPS AVH Amerijet American Airlines Latam Others
Revenueex-Strike

Full Year Outlook and Additional Information

Avianca is committed to achieve its full year outlook
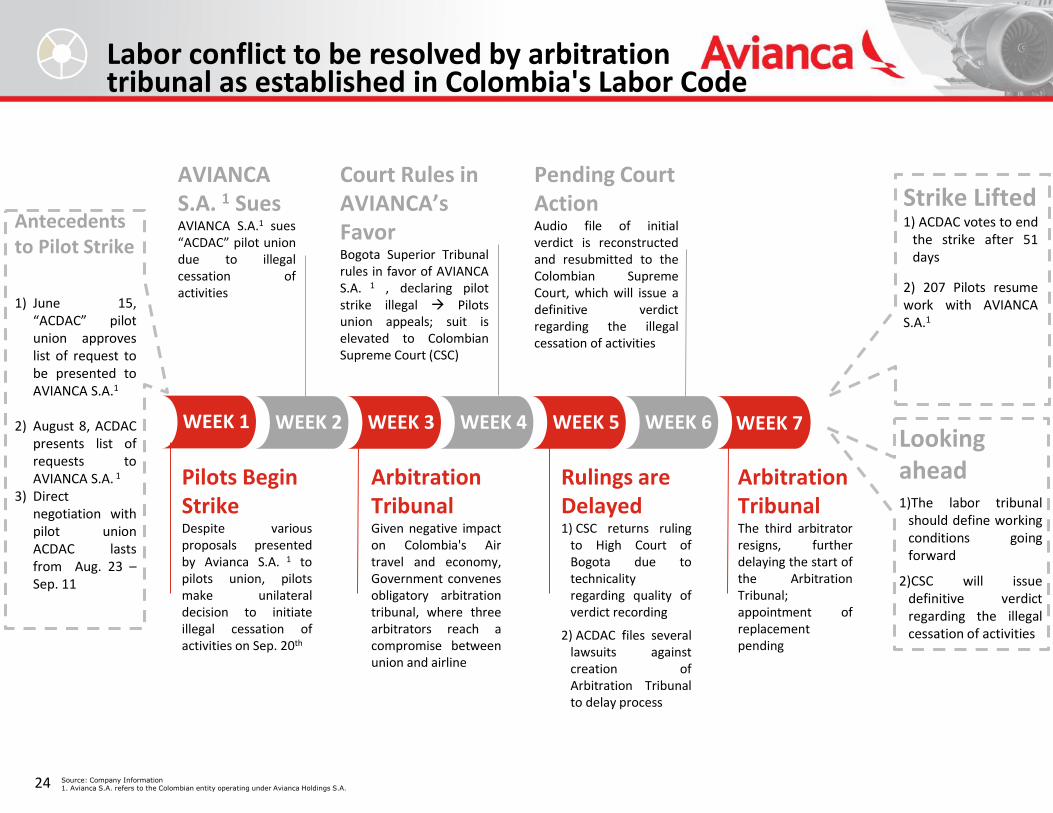
24
Labor conflict to be resolved by arbitrationtribunal as established in Colombia's Labor Code
WEEK 6WEEK 2 WEEK 4WEEK 3 WEEK 5 WEEK 7
Pilots Begin StrikeDespite variousproposals presentedby Avianca S.A. 1 topilots union, pilotsmake unilateraldecision to initiateillegal cessation ofactivities on Sep. 20th
ArbitrationTribunal Given negative impacton Colombia's Airtravel and economy,Government convenesobligatory arbitrationtribunal, where threearbitrators reach acompromise betweenunion and airline
Rulings are Delayed1) CSC returns ruling
to High Court ofBogota due totechnicalityregarding quality ofverdict recording
2) ACDAC files severallawsuits againstcreation ofArbitration Tribunalto delay process
ArbitrationTribunalThe third arbitratorresigns, furtherdelaying the start ofthe ArbitrationTribunal;appointment ofreplacementpending
AVIANCA S.A. 1 SuesAVIANCA S.A.1 sues“ACDAC” pilot uniondue to illegalcessation ofactivities
Court Rules in AVIANCA’s Favor Bogota Superior Tribunalrules in favor of AVIANCAS.A. 1 , declaring pilotstrike illegal Pilotsunion appeals; suit iselevated to ColombianSupreme Court (CSC)
Pending Court Action Audio file of initialverdict is reconstructedand resubmitted to theColombian SupremeCourt, which will issue adefinitive verdictregarding the illegalcessation of activities
Looking ahead 1)The labor tribunal
should define workingconditions goingforward
2)CSC will issuedefinitive verdictregarding the illegalcessation of activities
Antecedentsto Pilot Strike
1) June 15,“ACDAC” pilotunion approveslist of request tobe presented toAVIANCA S.A.1
2) August 8, ACDACpresents list ofrequests toAVIANCA S.A. 1
3) Directnegotiation withpilot unionACDAC lastsfrom Aug. 23 –Sep. 11
Source: Company Information1. Avianca S.A. refers to the Colombian entity operating under Avianca Holdings S.A.
WEEK 1
Strike Lifted1) ACDAC votes to end
the strike after 51days
2) 207 Pilots resumework with AVIANCAS.A.1

25
AVIANCA’s contingency plan mitigateseffects of pilot strike
Source: Company Information
Cost Impact
Revenue Impact
10 strike days took place in the 3Q17. The resulting impact translates intoUSD $ 2.0 - $ 2.5 Million per day in forgone revenues, while variable costsdecreased between USD $ 1.0 - $ 1.5 Million per day.
Avianca has no restrictions on ticket sales; therefore, all tickets for flightsoperated by Avianca are currently available for sale, which significantlyreduced passenger compensation
Avianca confirms EBIT margin guidance of 7%-9% despite impact of pilotsstrike
On September 20th approx. 700 Avianca Colombia Pilot members of theACDAC union, of a total of 1350 Pilots, went on strike effectively reducing thecompany's deployable capacity, measured in ASK, by 45%
Avianca quickly enacted a contingency plan to mitigate the impact, largercapacity aircraft were deployed, more efficient use of staff, change in mix ofoperating carriers, focus on operation of key domestic city pairs, wet leaseaircraft deployed. Avianca also shifted administrative staff to work atairports; Administrative savings program.
For the Fourth Quarter peak season, Avianca Colombia will continue toincorporate new pilots and returning pilots into its domestic operations, tooperate as closely as possible to its pre-strike capacity (measured in ASK)
9,2%
EBIT Adjustedex-ACDAC
Strike Impact on EBIT

Thank YouContact Information:Investor Relations [email protected]: (57) 1 – 5877700 www.aviancaholdings.com

27
Reconciliation of Adjusted EBITDAR
This presentation includes certain references to non-IFRS measures such as our Adjusted EBITDAR and Adjusted EBITDAR margin. Adjusted EBITDAR represents our consolidated net profit for the year plus the sum of
income tax expense, depreciation, amortization and impairment, aircraft rentals and interest expense, minus interest income, minus derivative instruments, minus foreign exchange. Adjusted EBITDAR is presented as
supplemental information, because we believe it is a useful indicator of our operating performance and is useful in comparing our operating performance with other companies in the airline industry. However,
Adjusted EBITDAR should not be considered in isolation, as a substitute for net profit determined in accordance with IFRS or as a measure of a company’s profitability. These supplemental financial measures are not
prepared in accordance with IFRS or Colombian GAAP. Accordingly, you are cautioned not to place undue reliance on this information and should note that Adjusted EBITDAR and Adjusted EBITDAR margin, as
calculated by us, may differ materially from similarly titled measures reported by other companies, including our competitors.
Adjusted EBITDAR is commonly used in the airline industry to view operating results before depreciation, amortization and aircraft operating lease charges, as these costs can vary significantly among airlines due to
differences in the way airlines finance their aircraft and other asset acquisitions. However, Adjusted EBITDAR should not be considered as an alternative measure to operating profit, as an indicator of operating
performance, as an alternative to operating cash flows or as a measure of our liquidity. Adjusted EBITDAR as calculated by us and as presented in this presentation may differ materially from similarly titled measures
reported by other companies due to differences in the way these measures are calculated. Adjusted EBITDAR has important limitations as an analytical tool and should not be considered in isolation from, or as a
substitute for an analysis of, our operating results as reported under IFRS or Colombian GAAP. Some of the limitations are:
Adjusted EBITDAR does not reflect cash expenditures or future requirements for capital expenditures or contractual commitments;
Adjusted EBITDAR does not reflect changes in, or cash requirements for, working capital needs;
Adjusted EBITDAR does not reflect the interest expense or the cash requirements necessary to service interest or principal payments on debt;
Although depreciation and amortization are non-cash charges, the assets being depreciated and amortized will often have to be replaced in the future, and Adjusted EBITDAR does not reflect any cash requirements
for such replacements;
Adjusted EBITDAR does not reflect expenses related to leases of flight equipment and other related expenses; and
other companies may calculate Adjusted EBITDAR or similarly titled measures differently, limiting its usefulness as a comparative measure.