corporate profile - fidelitybank.com.gh bank... · a comprehensive range of products ... pmb ct 42,...
TRANSCRIPT


Financial Highlights
Corporate Profile
Corporate Information
Board of Directors
Executive Committee
Corporate Social Responsibility
Chairman’s Statement
Managing Director’s Report
Directors’ Report
Corporate Governance
Report of the Independent Auditor
Statement of Comprehensive Income
Statement of Financial Position
Statement of Changes in Equity
Statement of Cash Flow
Notes to the Financial Statements
Shareholder Information
Proxy Form
06
08
09
10
15
23
26
28
30
32
33
34
35
36
40
41
98
101
Contents
05
2015 Annual Report06
2015
4,089,082
1,489,843
3,008,685
511,879
614,809
204,675
145,425
1.27
5.76
32
4
1,313
75
109
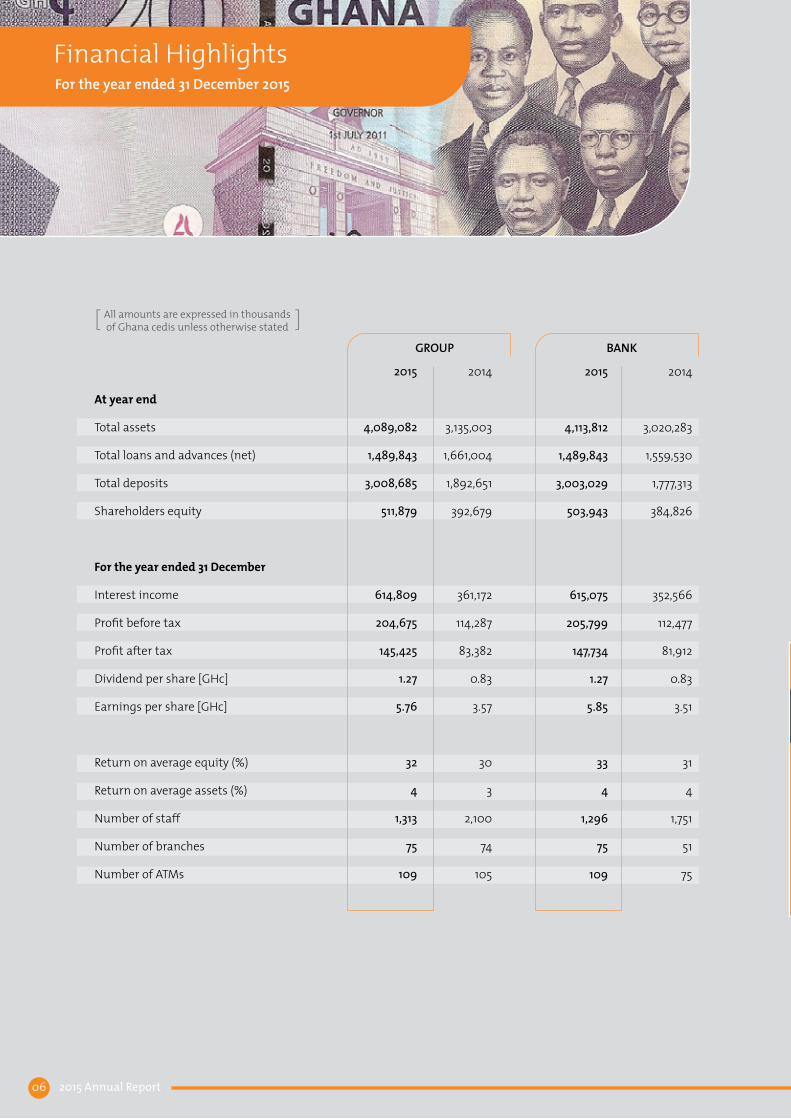
At year end
Total assets
Total loans and advances (net)
Total deposits
Shareholders equity
For the year ended 31 December
Interest income
Profit before tax
Profit after tax
Dividend per share [GHc]
Earnings per share [GHc]
Return on average equity (%)
Return on average assets (%)
Number of staff
Number of branches
Number of ATMs
GROUP BANK
2014
3,135,003
1,661,004
1,892,651
392,679
361,172
114,287
83,382
0.83
3.57
30
3
2,100
74
105
2015
4,113,812
1,489,843
3,003,029
503,943
615,075
205,799
147,734
1.27
5.85
33
4
1,296
75
109
2014
3,020,283
1,559,530
1,777,313
384,826
352,566
112,477
81,912
0.83
3.51
31
4
1,751
51
75
All amounts are expressed in thousands of Ghana cedis unless otherwise stated[ ]
Financial HighlightsFor the year ended 31 December 2015

07
We are on this journey together
We owe our success to our strong belief in offering the best of customer experience.It is our customers who make us who we are, and we take this fact very seriously.

Fidelity Bank was issued with its universal banking license on June 28th 2006, making Fidelity Bank Ghana Limited, the 22nd bank to be licensed by the Bank of Ghana under the new Banking Act, 2004 (Act 673). The Bank is owned by Ghanaian individuals, other institutional investors and its senior executives.
The Bank was formerly Fidelity Discount House, the leading discount house in Ghana. After operating profitably for 8 years, the business environment in the country attracted investors to the idea of establishing a bank.
Fidelity Bank has a team of high calibre professionals with diverse skills and experience. The Bank has invested heavily in technology and continues to invest heavily in training
to ensure that it is at par with the best in the world. Fidelity Bank offers a comprehensive range of products and services to meet the banking and financial needs of existing and potential customers.
Fidelity Bank has two subsidiaries:• Fidelity Asia Bank Limited• Fidelity Securities Limited
On 1 October 2014, the Bank acquired from ProCredit Holding Germany (PCH) and the DOEN Foundation of the Netherlands, 100% of the voting shares of ProCredit Savings and Loans Company Limited (“ProCredit Ghana”), a non-bank financial institution that provided savings and lending services to its clients.
On 11 April 2015, the operations of ProCredit Ghana were merged
with the Bank. Subsequent to the integration, the directors have commenced a process to officially liquidate ProCredit Ghana.
Fidelity Asia Bank Limited (FABL) was established in July 2012 as a wholly owned Asian subsidiary in Malaysia. FABL carries on the business of offshore banking.
Fidelity Securities Limited (FSL), a fully owned subsidiary of the Bank, is the investment banking arm of the Bank. Formerly known as Fidelity Asset Management, FSL’s business involves providing advisory services, issuing of securities, raising of capital and undertaking portfolio investment management for clients.
VisionFidelity Bank’s vision is to become a world-class financial institution that provides superior returns for all stakeholders as follows:Our customers: The best place to bankOur shareholders: The best place to investOur employees: The best place to workOur regulators: The best place to benchmark
MissionTo be amongst the top three Banks in Ghana by 2018 based on all key performance indicators: deposits, fees, quality of loan book, cost to income ratio, and anchored on three key pillars -• our people• our service and processes, and • return to stakeholders.
This will be premised on exceptional Corporate Governance Standards, knowledge of the local market, professionalism, proactivity, innovation and above all its customer-centric culture. This will contribute positively to the development of the industry and by extension the Ghanaian economy.
2015 Annual Report08
Corporate Profile

Board of Directors
Company Secretary
Registered Office
Solicitors
Independent Auditor
Bankers
Dr. William Panford BrayMr. Edward EffahMr. Jim BaidenMr. Kwamina DukerH. E. Mrs. Johanna SvanikierMr. Emmanuel Barima ManuMr. Alex DodooMr. Jacob HinsonMr. Laurent DemeyMrs. Akosua M. Nelson-Cofie
Ms. Maataa Opare
Fidelity Bank Ghana LimitedRidge Tower10 Ambassadorial Enclave, West Ridge, Accra.Ghana
Bari & CoSuite #1, 5th FloorTrust Towers, AdabrakaP.O. Box CT 1466Cantonments, Accra
PricewaterhouseCoopersNo. 12 Airport City, UNA Home, 3rd FloorPMB CT 42, Cantonments, Accra,Ghana
Ghana International BankCitibankCommerzbankBHFBank of ChinaDBS BankMedicapital Bank
- Chairman - Managing Director- Deputy Managing Director
09
Corporate Information

Dr. William Panford BrayChairman
Dr. William Panford Bray is a former Managing Director of Ghana Commercial Bank Limited from 1999-2002. He was acting Chairman/Chief Executive Officer of Ghana Airways between 2002 and 2003. He has over 45 years of working experience in banking and finance, including his service at Barclays Bank Ghana Limited, where he reached the position of Deputy Managing Director. He is a fellow of the Chartered Institute of Bankers (FCIB).
Dr. Bray currently serves as the Chairman of Fidelity Bank Ghana Limited, Enyan Denkyira Rural Bank Limited, and Opportunities Industrialisation Center, Ghana, as Director of Oak House Limited, and as Council Member of the Association of Insolvency and Restructuring Advisors.
Dr. Bray has been honoured with various awards, including Life Fellow, International Biographical Association (LFIBA), International Man of the Year 2000-2001; International Who-is-Who of Professionals 2000 and as a Paul Harris Fellow.
Dr. Bray was honoured with a doctorate degree in Banking and Finance by Dayspring Christian University, Mississippi, USA in 2014. He also received the Lifetime Achievement Award at the Ghana Banking Awards.
Edward EffahManaging Director
Edward Effah is the Managing Director and Chief Executive Officer of Fidelity Bank Ghana Limited. He is also the founder of the Fidelity Group and has been its Chief Executive Officer since inception (1998). Edward has over 20 years experience as a Senior Finance Executive. Previous positions held include: Resident Director of Global Emerging Markets Ghana Limited (GEM), Group Risk Manager of Rudolf Wolff, the City of London-based derivatives and foreign exchange trader and as a Management Consultant and Audit Manager with Coopers and Lybrand, London.
Other directorships held by Edward are: Jacana Partners Limited; Takoradi International Company Limited; Member of Council, University of Ghana; Chairman of College of Health Sciences and Africa Capital Limited. Edward is a Chartered Accountant by profession and a member of the Institute of Chartered Accountants in England and Wales.
Meet the Board
2015 Annual Report10

Jim BaidenDeputy Managing Director
Jim Baiden is the Deputy Managing Director and co-founder of Fidelity Bank and one of the Bank’s 3-member Executive Directors on the Bank’s Board.
Jim is a member of the Executive Management of the Bank and currently has oversight responsibilities for the Retail Banking Strategy of the Bank, Customer Experience, Brand & Corporate Communications amongst others.
In 1998, as a co-founder of Fidelity Discount House, Jim served as the start-up General Manager and was responsible for the day to day business of the Dealing Room. In 2002 he was appointed Executive Director and joined the Board of the Discount House. He worked assiduously with Edward Effah to found Fidelity Bank in 2006 after eight (8) solid years of a hugely successful money market operation of the Discount House.
Jim has gained extensive international experience as an alumnus of Gerald & National. A leading Discount House in the City of London in the 90’s and the Darden School of Management, University of Virginia, USA. Jim also holds a Master’s degree in Banking & Finance from the Finafrica Foundation in conjunction with University of Milan, Italy and a Bachelor’s degree in Economics with Statistics from the University of Ghana Legon. Jim serves on several Boards and is the Chairman of the Action Chapel Scholarship Foundation.
H.E. Mrs. Johanna Odonkor SvanikierNon Executive Director
Her Excellency Mrs. Johanna Odonkor Svanikier is currently Ghana’s Ambassador to France & Portugal and a Permanent Delegate to UNESCO and OIF.
H.E. Mrs. Johanna Odonkor Svanikier (LL.B, LL.M (Lond.), B.L., M.P.A. (Harvard), M.Sc (Oxon)) is a Doctoral Candidate in political science at the University of Oxford, United Kingdom and a research associate at the Oxford Centre for International Development. She is also a barrister, university lecturer and legal and development consultant.
She holds Bachelors and Masters Degrees in law from the London School of Economics, UK, a Masters in Public Administration from Harvard University, U.S.A. and a Masters in Political Science from the University of Oxford, U.K.
She was a Fulbright Scholar at Harvard University. She has been called to the Bar in England and Wales and in Ghana. She is the author of several publications including “Womens’ Rights and the Law in Ghana”
11

Jacob HinsonNon Executive Director
Jacob is the Chief Investment Officer (CIO) of KTH which is one of the largest investment holding companies in Africa.
As CIO he is responsible for managing KTH’s investment strategy, team and portfolio as well as driving its future growth. In recent years, under Jacob’s leadership KTH has expanded beyond South Africa with the conclusion of several substantial investments in West Africa. Jacob has been involved in assessing and concluding transactions across emerging markets, most notably in West Africa, South Africa, Brazil and China.
His career has included previous employment at Deutsche Bank Corporate Finance and Actis Private Equity. Jacob is a qualified chartered accountant CA,(SA) and a Chartered Financial Analyst (CFA) charter holder with the CFA Institute the USA. Jacob is the chairman of Kagiso Media, a large media business in South Africa and also represents KTH on a number of investee company boards in Nigeria, Ghana and South Africa.
Kwamina DukerNon Executive Director
Kwamina Duker (K) was the CEO of OANDA Corporation, a leading provider of foreign exchange services. K initially joined OANDA as Managing Director for Asia Pacific and was responsible for overseeing the company’s operations in the region. Prior to joining OANDA, Mr. Duker headed Deutsche Bank’s eFX business in Asia Pacific originating and implementing dbFX — the first retail online forex trading platform from a major bank. K brings with him over two decades of experience in shaping the global foreign exchange industry and leading major foreign exchange technology platforms in Europe, the Americas and Asia Pacific.
Kwamina Duker is chairman of FX Architects. He obtained his MBA from UCLA Business School.
Meet the Board
2015 Annual Report12

Emmanuel Barima Manu LLBNon Executive Director
Emmanuel Barima Manu LLB, is a co-founding member and the Managing Partner of Bari & Co. He has extensive experience in corporate and commercial practice including negotiation of commercial and business contracts and other varied agreements. Mr. Manu was called to the Ghana Bar in October 1989 and has worked with other law firms like Naoferg Chambers and Law Trust Company.
Barry has advised many clients on commercial transactions, contracts, corporate business and oil and gas laws including African Gold Group Inc, Bulk Oil Storage and Transportation Company Ltd, Elmina Beach Resort, Atholl Energy Limited, Allterrain Services Ghana Limited, Coco Palm Limited and ALTROM Ltd, Switzerland. He has also represented Fidelity Bank on numerous occasions as Lead legal adviser.
Laurent DemeyNon Executive Director
Laurent Demey co-founded Amethis Finance, a leading African Private Equity firm, in 2011.
Laurent Demey started his career with Société Générale in 1992, where he worked in the African M&A Department in Paris and led teams on multi-sectorial privatizations throughout the continent. In 1998, he was appointed to head Société Générale’s West African brokerage firm, Sogebourse, based in Abidjan. He then joined Proparco, where he was first in charge of the Banking and Capital Markets Department, before being asked in 2004 to open and manage an office in Thailand, leading Proparco’s East Asian activities. In 2006, Laurent Demey returned to Paris where he became Chief Investment Officer for Proparco and Deputy CEO, overseeing the investment teams and the international network.
Laurent Demey holds a degree in Engineering from the Ecole Centrale (Paris) and a degree in Development Economics from the Ecole Normale Supérieure (Paris).
13

Alex DodooExecutive Director, Wholesale Banking
Alex is one of the pioneers of Fidelity Discount House. He was responsible for the Money Market Desk and the Marketing Department, where he developed various money market products for the Discount House. Alex joined Fidelity from Ecobank Ghana Limited where he worked for two years in the Treasury function.
He has extensive exposure and experience in investments and foreign exchange, with previous work experience in diverse roles in Allied Dunbar, Mercury Funds Management and the National Bank of Greece, all in the UK (London).
Alex is an Economics graduate of the University of Ghana and an associate member of the Chartered Institute of Bankers (ACIB), London.
Mrs. Akosua M. Nelson-CofieNon Executive Director
Mrs. Akosua M. Nelson-Cofie is currently the Portfolio Manager (Equities) at SSNIT. She has over twenty (20) years extensive experience in portfolio management, investment management, research, project/programme management, microfinance and capacity development. Mrs. Nelson-Cofie also serves on the Board of a number of companies.
She holds an MBA in Finance, MA in Development Studies and a BA (Honours) in Economics with Statistics.
Meet the Board
2015 Annual Report14

Edward Opare Donkor Chief Operating Officer
Edward is a Chartered Accountant with over 15 years experience in the Financial Services Sector. As the COO of the Bank, he oversees Finance, Banking Operations, Business Optimization and Corporate Services and Administration Departments. Until his appointment as the Chief Operating Officer, he had served in various capacities as Director of Banking Operations and Finance Director. Prior to joining Fidelity as Accounts Officer, he worked at Enterprise Insurance Co. Ltd as Technical Trainee and at CDH Insurance Ltd as Senior Accounts Officer.
Edward holds an Executive MBA degree from the University of Ghana Business School and a BA (Hons) in Economics from the same University. He is a member of the Institute of Chartered Accountants, Ghana and has participated in various finance based workshops in both Ghana and overseas including workshops at Harvard and Wharton.
Selom Cofie Atta Director, Retail Network
Selom has over fifteen years banking experience. She joined Fidelity Bank from Barclays in June 2006. During her time with Barclays, she was instrumental in the success of their Personal High Value Proposition. She won several Customer Service Excellence Awards and was one of the selected few on their Talent Development Programme, a programme which seeks to develop the next generation of Barclays Bank Leaders.
Since joining as an Executive Relationship Manager with the Private Banking Department, Selom has held various roles – Head, Customer Care, Regional Sales & Service Manager - Southern Sector, Director, Consumer Banking and currently Director, Retail Network. She is credited with setting up the Customer Care Unit which contributed immensely towards the Bank’s Customer Care Award in 2010. Selom is a Certified International Retail Banker.
Executive Committee
15

Leonard GikunooDirector, Corporate Banking for Energy & Oil And Gas
Leonard is a Corporate and Investment Banking professional with more than fifteen years experience within the financial services sector. He joined Fidelity Bank Ghana Limited in June 2013 as the Director in charge of Corporate Banking - Energy, Mining, Oil& Gas segment.
Prior to joining Fidelity Bank, he was the Vice President responsible for Large Local Corporates within the Corporate & Investment Banking Department of Barclays Bank of Ghana Limited. He spent close to ten years with Barclays Bank with senior corporate relationship management and business development responsibilities across varied segments including the public sector, multinational and local corporates.
Leonard before joining Barclays Bank also worked for Strategic African Securities Limited, an Investment Banking boutique firm in Ghana initially as a manager in charge of trading and research, and later as a Corporate Finance Advisor responsible for capital raising, client due diligence & valuation analysis, mergers and acquisitions analysis, among other key responsibilities.
Leonard holds a BSc (Hons) degree in Business Administration with First Class Honours from the University of Ghana, Legon, an MSc degree in International Securities, Investment and Banking from the Henley Business School, University of Reading, United Kingdom and an MBA degree Finance and Strategy from the Coventry University, Graduate Business School, United Kingdom. Leonard has keen interest in structured finance; project finance; risk management; deal structuring and solutions; business development, customer service and turnaround strategies.
Tunji AlabiChief Information Officer
Tunji Alabi started his IT career with Citibank NA in 1988 in the UK and has experience in Business leadership & Technology with special emphasis in business transformation and strategy.
Tunji has a first degree in Computer Engineering from the Obafemi Awolowo University Ife, Nigeria as well as a Postgraduate degree in Telecommunication from South Bank University in London. He has undertaken several enterprise transformation projects and consulting roles as well as cross functional experience of a wide spectrum of industries ranging from Banking, Oil and Gas, Telecommunications, FMCG and Consulting.
Prior to joining Fidelity Bank, Tunji spent 5 years as Group Head of Technology at Ecobank where he spearheaded the centralization of application and services in 36 Ecobank affiliates across Africa.
Executive Committee
2015 Annual Report16

Steve WilliamsDirector, Treasury
Steve has over 25 years of experience in Treasury Management. Prior to joining Fidelity Bank, he was the Group Treasurer of Ecobank Transnational Inc (ETI) based in Paris, France. Other positions he has held include the Director in charge of Fixed Income Trading for Standard Chartered Bank’s operations in Africa. He was also the Treasurer and Co-Head of Wholesale Banking at Standard Chartered Bank, Zimbabwe, as well as an Executive Director, Treasury and Co- Head Wholesale Banking, Standard Chartered Bank, Ghana. Steve also held the position of Head of Treasury, at the then Ashanti Goldfields Co Ltd.
Steve is currently a member of the Presidential Task Force appointed to set up the Ghana Exim Bank; the current chairman of the Investment Advisory committee of the Petroleum Management Fund, Head of Treasury Faculty, National Banking College, Ghana and member FX Loss Committee and Petroleum Pricing, Ghana.
He holds a BSc (Hon) Chemical Engineering Degree from Kwame Nkrumah University of Science and Technology and MBA (Finance) from the University of Ghana Business School.
Angela Forson Director, Public Sector & Institutional Banking
Angela became the first female director in charge of business in Fidelity Bank and is currently responsible for the Public Sector & Institutional Banking team. Prior to this position, she had worked in many roles in the Bank, including being the Head of the Telcoms and Utilities desk in Corporate Banking.
In her previous job with Databank Financial Services, Angela worked as a Licensed broker/ Investment advisor, traded on the Ghana Stock Market and also managed investment portfolios in asset management.Angela acquired both her Executive MBA and Bachelors of Arts at the premier University of Ghana, Legon. She is a Fortune/US State Department Mentoring Program Alumni.
Angela brings to the Executive Management team, her exposure to the equity markets, money markets and wholesale banking experience.
17

Executive Committee
John Maxwell Addo Jnr Director, Human Resources
John is a senior human resources professional with over twelve years generalist and specialist experience gained mostly with top international banks across the Middle East, Africa and the United Kingdom. He has a breadth and depth of experience across Performance and Rewards Management, Talent and Succession Management, Career Development, Employee Engagement, Industrial Relations, Learning Management, Resourcing, Graduate Programmes, Organizational Development and Executive Coaching.
John has recently joined Fidelity Bank as HR Director. His last role with HSBC Bank was Regional Head of Learning, Talent, Resourcing & Organizational Development (LTROD) for HSBC’s global businesses (Corporate Banking, Client Coverage and Advisory, Global Markets and Private Banking) in the Middle East and Global Head of LTROD for HSBC Amanah (the Islamic Finance Business of HSBC). He was also part of the Global Leadership team for the HSBC Business School. Prior to HSBC, John held various human resources roles for Standard Chartered in Ghana, the UK and the UAE.
John has a Master of Science degree in Industrial Relations and Human Resources Management from the London School of Economics (LSE), a Bachelor of Law from the University of Ghana and a Qualifying Certificate in Law from the Ghana School of Law. He was called to the Ghana Bar in 2001.
Mrs. Shirley-Ann Awuletey-Williams Chief Risk Officer
Shirley-Ann joined Fidelity Bank in May 2008 as a Corporate Account Manager responsible for the Manufacturing & Distribution Desk in the Corporate Banking Department. She was transferred to the Risk Management Department as the Acting Head in January 2009 and was the Director of Credit Risk Management until February 2015. She is currently the Chief Risk Officer of the Bank.
With over twenty years experience in banking, Shirley-Ann previously worked with Merchant Bank (Ghana) Limited (now UMB) in various departments/roles including Domestic Banking, Foreign Operations and SME Banking. In the Corporate & Institutional Banking Department, she managed the Credit Analysts Unit as well as the Business Support function and was a Senior Relationship Manager responsible for the Light Manufacturing Sector. Her core competencies include Account Relationship Management, Credit Analysis/Monitoring and Risk Management.
Shirley-Ann holds a first degree in Agricultural Economics from the University of Ghana, Legon and an MBA in Finance from the University of Leicester School of Management, UK. She is also an Associate of the Chartered Institute of Bankers, Ghana.
2015 Annual Report18

Socrates AframDirector, Finance
Socrates is a results-driven finance professional with proven success in developing smart plans that drive performance towards achieving corporate objectives. Prior to his appointment as Director of Finance, Socrates was the Head of Research and Product Development where he was responsible for developing new products to meet emerging customer needs.
He joined Fidelity Bank in 2007 as Head of Business Performance and has held many roles including Head, Planning and Financial Control.
He has more than a decade’s experience in Ghana’s financial sector. Socrates was a Senior Analyst (Deputy Financial Controller) at United Bank for Africa Ghana (UBA). He also served as a financial analyst at General Leasing and Finance Company Limited where he appraised lease credit applications and assisted in developing the company’s credit rating system. Between 2004-2005, Socrates was Finance and Administration Manager at Export Finance Company Limited and was responsible for statutory and regulatory returns, treasury activities of the Company amongst others.
Socrates holds a Bachelor of Commerce degree from the University of Cape Coast and an MBA in Finance from the University of Ghana. He is a Fellow of the Professional Accounting Body, ACCA UK and certified since 2003.
Dr. William Derban Director, Financial Inclusion, CSR & PMO
William is responsible for the Bank’s micro-finance, payment services and innovative Agency Banking services. His objective is to provide basic banking services to the informal and largely unbanked market, providing services that improve lives.
Dr. Derban has held the position as the Head of Community Relations with Barclays Africa and Emerging Markets where he managed the community investment strategy across 14 countries in Africa, Middle East and Asia. He also held various senior positions in the global community investment and financial inclusion departments.
Dr. William Derban holds many awards in recognition of his work, including the Clinton Global Initiative and the Business in the Community market place Awards, The prestigious Coffey award for excellence in corporate responsibility. His projects have been highlighted in the Financial Times, New African, The BBC, and have been used as case studies by the Harvard Kennedy School, UNDP growing inclusive markets and various academic reports.
Dr William Derban is an alumnus of Nottingham Business School in the UK with a doctorate in Micro- finance and Development Finance. He was one of the founding members of the Micro-finance Club UK and a member of the UK All Parliamentary Group on Micro- finance.
19

Executive Committee
Esi Mills-RobertsonDirector, Personal Banking
Esi began her career as a junior consultant with Deloitte &Touché Consulting before branching into marketing. She later joined Unilever Ghana first as a Brands Manager for the Home Care Division and later as the Marketing Manager in charge of Home & Personal Care.
After almost a decade with the Fast Moving Consumer Goods (FMCG) business, Esi joined Fidelity Bank as Head of Marketing with several years of experience in Brand and Strategic Management, Consumer Insight Mining and Integrated Marketing Communications. She later joined the Consumer Banking Business of the bank first as Head of the Private Banking Business and then as Head of the Personal Banking Department bringing all her experience to bear to deliver profitability to the business.
Prior to her appointment as Director of Personal Banking, Esi headed the Brand & Corporate Communications Department and led some of the bank’s efforts in brand communication. She also spearheaded an integrated campaign to launch Financial Inclusion for Fidelity Bank. She holds an MBA (Marketing Option) from the University of Ghana, Legon and a B.Sc. Computer Science from the Kwame Nkrumah University of Science and Technology.
Julian Kingsley Opuni Director, Commercial & SME Banking
Julian has been in the financial services sector for over 20 years. He initially joined Fidelity Bank as the Head, Commercial Banking at the inception of that unit. He has extensive experience in business development, credit analysis, and sales management and has also been involved in various youth entrepreneurship & business mentoring projects.
Prior to joining the Bank, Julian had a successful career with Lloyds Bank in the UK where he worked for over 18 years. He joined Lloyds on their expedited management training program, holding many roles in operations and retail banking which included branch management. Additionally he held several senior positions in both Business & Corporate Banking, finally leaving as a Senior Manager with responsibility for various business centres to the west of London.
He is an Associate of the Institute of Financial Services (AIFS) and holds a Bsc in Banking & Financial Services from the University of Manchester Institute of Science & Technology. Julian is also an accredited specialist in Manufacturing, Legal and Property lending.
2015 Annual Report20

Alfred A. QuayeDirector, Internal Audit
Alfred is a former bank examiner with several years experience in bank regulation and auditing. He is a good reviewer of operational processes, policies and procedures, identifying inherent weaknesses and driving quality remedial actions for the benefit of customer service and operational support teams in the banking sector.
He joined Fidelity Bank in 2006, as the Head of Internal Control from Standard Trust Bank (now UBA), where he set up the Internal Control department at the Bank’s inception. Alfred started his career as a Banking Supervisor with Bank of Ghana where he gained widespread experience over his thirteen year stay with the Banking Supervision Department including leading on-site examination teams to examine some major commercial banks in Ghana and played a vital role in the official liquidation of Bank for Housing & Construction Limited.
He holds an MBA from the University of Ghana, a Bachelor of Arts degree in Economics, and is a fellow of the Professional Accounting Body, ACCA (UK).
Simon Adu-Gyamfi Director, Banking Operations and Optimization
Simon joined the Bank in May, 2006 from Standard Trust Bank (now UBA) as a Senior Operations Officer and was a key member of the team that set up the Bank’s operating platform. He has worked in various roles that span Branch Management to Head Office Operations. Before his latest appointment, Simon was Head of Special Projects, PMO & Business Optimization and played a critical role during the integration of ProCredit and Fidelity as the Head of the Integration Management Office (IMO). Currently, he is spearheading the Bank’s centralization and operational excellence journey.
Simon holds a BSc in Business Administration (Banking and Finance) and an Executive Master Degree from the University of Ghana. He is a Chartered Accountant with the Association of Chartered Certified Accountants (ACCA).
21

Maataa OpareHead, Legal and Company Secretary
Maataa’s career in Fidelity began as a Legal Officer and subsequently Legal Counsel. Prior to joining the Bank she was a Specialist Contract Manager at Santander Private Banking UK where she provided astute legal guidance to its offshore entity, share dealing service and private banking. The previous six years were spent in Bank of Cyprus UK where she was instrumental in effecting changes brought in by the Consumer Credit Act and the Payment Services Directive. She was responsible for ensuring that relevant regulatory and administrative bodies were updated and acted as secretary for the Executive Credit Committee. Maataa has had over twelve years of experience as an in house lawyer in financial institutions and has also worked in Property Litigation and Product Liability in Hogan Lovells, London. As a Solicitor of the Supreme Court of England & Wales and called to the Bar in Ghana, she is dual jurisdiction qualified.
Maataa holds a Bsc in Politics and International Relations from the University of Southampton. She also took the CPE and Legal Practice Course at the College of Law, Store Street. Her Post-Call was completed at the Ghana School of Law.
Executive Committee
2015 Annual Report22

Corporate Information
pupils, staff and parents during their annual Health Walk and Fun Games dubbed “Walk the Talk, Don’t Leave Me Behind”.
The Bank sponsored the event with food and drinks and also donated an amount of GHS3,000 to the school to meet its pressing needs.
#Literacy Counts –Financial Literacy for YouthJA Africa, Fidelity Bank, GIZ (GmbH), and Prudential Insurance launched a financial literacy campaign at Christ the King International School, Accra in May. Volunteers from Stratcomm and The Abraaj Group were also present to support the campaign and activities of the day. The theme of the campaign, ‘Literacy Counts’, underscored the need to expose young people to money management skills as early as possible. The partners launched the first phase of this campaign through the “Literacy Counts Challenge” - a fun, “hands on” team building experience targeting junior secondary school students.
HealthLaunch of Korle-Bu Critical Care FundFidelity Bank in collaboration with the management of the Korle-Bu Teaching Hospital established a
The success of our revamped Corporate Social Responsibility (CSR) programme was affirmed by our bank being crowned as the Most Socially Responsible Bank in Ghana for the first time at the 2014 Ghana Banking Awards held in September 2015. In the past year, we have substantially increased our strategic partnerships initiatives and seen an exhilarating spike in staff volunteerism.
Still touching Ghanaian Lives.
EducationConstruction of Sanitation Facility at St. Maurice R/C JHS LaIn July, 2015, Fidelity Bank commissioned a 12-seater biofil toilet facility at the St. Maurice R/C JHS in La, Accra. The gesture forms part of the Bank’s drive to improve sanitation in Ghana as a leading indigenous financial institution.
Until the completion of this facility, the St. Maurice R/C JHS used a 45 year old depleted toilet facility which served both the school and community, posing a health and safety hazard to the school’s populace. The newly built GHS45,000 12-seater biofil facility donated by Fidelity Bank replaced the worn out facility and has significantly improved the health and sanitation of the school for both pupils and staff.
The 12-seater biofil toilet uses less water and encourages students to wash their hands – its innovative design connects the wash basin to the toilet and generates water for flushing each time a user washes his/her hands.
Walk the Talk; Don’t Leave Me Behind – Raising Awareness on Disability EducationFidelity Bank recognizes the importance of education especially for special needs children, hence, the Bank’s continuous support of this sector.
In 2015, staff of Fidelity Bank demonstrated their commitment to raising awareness on and supporting special needs education by joining the New Horizon Special School’s (NHSS)
Critical Care Fund for the intensive care unit of the nation’s premier hospital.
The fund will enable the hospital to provide support for patients who cannot afford intensive care and emergency health services. It will also help sustain a steady supply of consumables at the intensive care unit and ensure adequate maintenance of equipment needed to deliver emergency health services.The fund is expected to save the lives of many as it costs no less than GH¢1,000 per day to sustain a patient at the intensive care unit.
Fidelity Bank committed seed capital of GHS50,000 to the fund.
Community Development
Orange Gives to Our CommunitySome Fidelity Bank branches across the country also embarked on voluntary CSR projects during the course of the year.
The Tesano Branch painted the Kindergarten block of Nii Ottokwame
Charity@Work
23

2015 Annual Report24
The Dzorwulu Branch purchased a refrigerator, rechargeable lamps, and various food items to support Officers stationed at the Dzorwulu Police Station.
Tarkwa Branch donated toiletries to the Children’s Ward of the Tarkwa Government Hospital.
Tamale Branch also donated generously to the Anfani Global Orphanage at Bittin in Tamale to put
smiles on the faces of the children during the festive season.The two Ashaiman branches supported policing in their vicinity by donating two bicycles to the Ashaiman Police.
The Osu Danquah Circle Branch presented an air conditioning unit to the Osu Government Maternity Home - Labour Ward to provide a calm and comforting environment for mothers to deliver their babies.
Agricultural and Rural Finance and DevelopmentMASO: Generating Youth Cocoa Farmers in GhanaUnder this project, dubbed MASO, which means ‘I have grabbed/caught’, Solidaridad as the lead partner, with funding from the MasterCard Foundation, is clustering private and public sector organizations to work towards increasing youth participation in Ghana’s cocoa sector. MASO will support young farmers through “CocoAcademies” with training in sustainable cocoa practices. Fidelity will facilitate the training of the youth in financial skills and provide savings accounts to youth beneficiaries. CocoAcademy Centers will also be set up as Fidelity Bank Agents where these youth can go and conduct their financial transactions and save income to expand their farming businesses. An example of our “entire value chain approach”, this initiative is being driven by Corporate and Inclusive Banking & CSR Directorates.
Transforming Agriculture through Digital FinanceFidelity Bank has partnered with SNV Netherlands Development Organization with funding from USAID under a project titled Smart Agri-Finance to build a robust Smart Agent network and provide Smart Accounts to farmers in the three Northern regions under existing SNV projects and USAID’s Feed the Future programs. We will
be providing savings and investment accounts to lessen dependency on credit; insurance products to assuage the effects of inimical events; innovative credit products, for example, a savings-linked one to encourage responsible financial behaviour; and easily accessible, more secure, less expensive payments network to reduce dependency on over the counter cash payouts for goods and services
Strengthening Agric Through LendingFidelity, wanting to play a pioneering role in lending to participants within and across value chains, has partnered with the United States Agency for International Development (USAID) under a guarantee loan fund – Development Credit Authority (DCA) – to reach reach micro, small and medium enterprises (MSMEs) operating in the rice, maize and soy value chains in the demarcated SADA Region of Ghana and on-lend to MFIs, Savings and Loans and rural and community banks (RCBs) in target communities.
Financing Water, Sanitation and Health
Making Access to Finance for WASH a RealityConcerned by the socio-economic impact of Ghana’s dire sanitation situation, Fidelity Bank in 2015 signed an agreement with the Embassy of the Kingdom of Netherlands (EKN) and SNV Netherlands Development Organization to extend credit to micro, small and medium scale enterprises (MSMEs) engaged in the Water, Sanitation and Hygiene (WASH) sector to boost the availability of WASH products and services from the supply side so as to stimulate demand. Dubbed WASH P2P (Possible to Profitable) Fund, the goal is to provide approximately 3,000 subsidized interest rate loans to MSMEs and households with the requisite technical capacity building through the P2P SME Academy.
M/A primary School, Pokuase, and provided the school with crayons, drinking bowls, basins for hand washing, soap dishes, hand towels, 150 exercise books, 150 pencils, erasers, sharpeners, candies, biscuits and many others.
The Achimota Branch also donated to children on admission at the Children’s Ward of the Achimota Hospital and presented them with assorted items including milo, milk, drinks, biscuits, bottled water, sugar, detergents and toilet rolls.
Still touching Ghanaian Lives.
Strategic Partnerships

25
2015 Financial Statement
Operating EnvironmentWorld GDP growth remained flat in 2015 at 3.1%, 0.3% lower than the 3.4% recorded in 2014, according to the January 2016 update of IMF’s World Economic Outlook (WEO). Growth is expected to pick up slowly in 2016 to 3.4% and later to 3.6% in 2017.
Provisional GDP estimates for 2015 by the Ghana Statistical Service showed a growth of 4.1% compared to the revised 2014 GDP growth of 4.0%. This low GDP was primarily due to challenges emanating from the energy crisis and its impact on the service and industrial sectors.
General Price levels were high in 2015 with inflation ending the year at 17.7% from 16.4% at the beginning of the year. Interest rates trended downwards gradually for short-term government securities whilst rates on long-term government securities inched up slightly in the course of the year. The local currency was fairly stable in the last quarter of the year after rapid depreciation, averaging 14.1%, 14.55%, 10.15% against the USD, GBP and EUR respectively in the first two quarters of the year.
2015 Financial PerformanceDespite an unfavourable macroeconomic environment, the Bank delivered strong results through a combination of consistent measures including prudent cost management practices, steady growth in low-cost deposits and improved asset portfolio yields. In keeping with our stated vision of creating value for all our stakeholders, the Bank recorded an improved performance in 2015 relative to 2014 on a number of key parameters. The Bank recorded a growth in balance sheet size of 36% to over GH¢4 billion. Operating income over GH¢552 million which represented 69% growth over last year’s.
Our customer base has increased from 621,829 to 1,024,637 helping to improve our deposit base by 69% to GH¢3 billion. It is worth noting that this growth was primarily driven by current and savings accounts, in accordance with our deposit-led strategy.
As a result of the aforementioned, the Bank recorded an 83% increase in
profit before tax of GH¢205.8 million in 2015 compared to GH¢112.5 million in 2014.
DividendsIn line with regulatory guidelines on the provision of capital reserves, the Board is proposing the maximum allowable dividend of GH¢1.27 per share for this year. We believe this is a prudent balance between maximizing shareholder value and the need to plough back sufficient funds into our operations for future business growth.
StrategyFor 2015, the Bank’s strategic focal points were the following areas; Integration and operational excellence, Technology, Customer Experience, Business growth, and Forex generation.
The Board and Management of the Bank recognized the need to take bold steps to achieve our mission of becoming a top 3 bank in Ghana. After a successful acquisition of ProCredit Savings and Loans Company Limited (“ProCredit Ghana” or PCG) in 2014, Fidelity Bank successfully merged the operations of the two entities and achieved complete integration by April 2015.
Chairman’s Statement
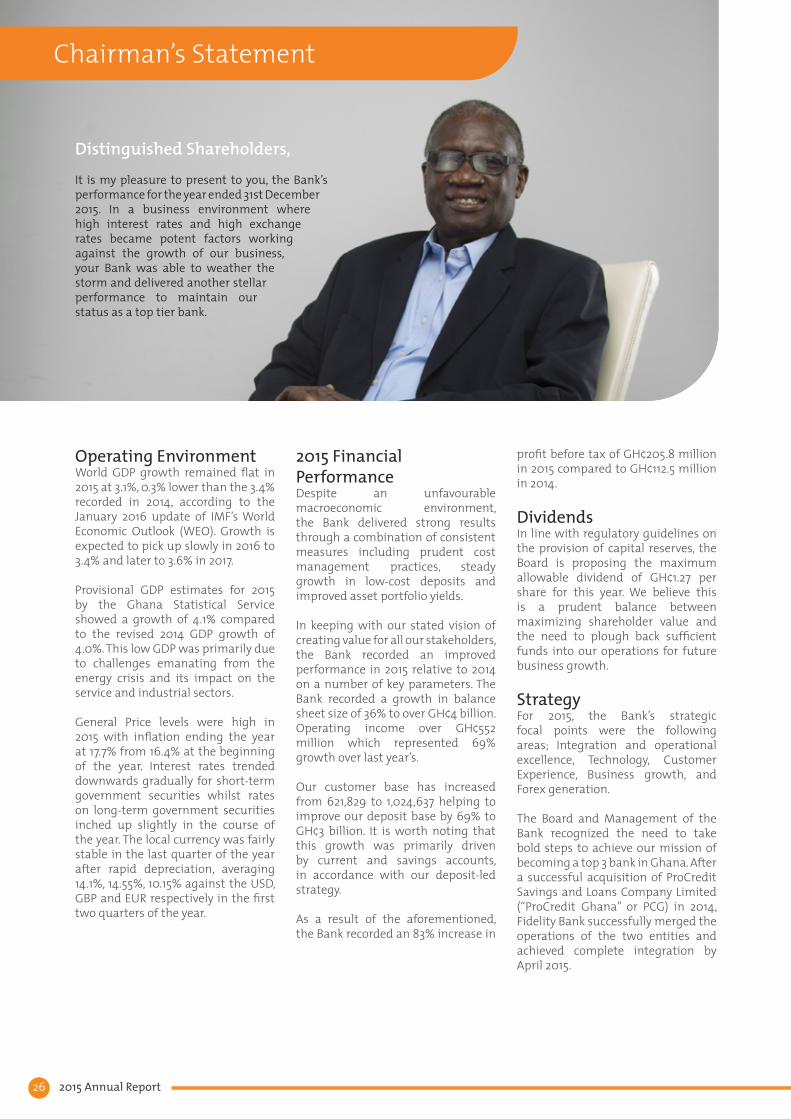
Distinguished Shareholders,
It is my pleasure to present to you, the Bank’s performance for the year ended 31st December 2015. In a business environment where high interest rates and high exchange rates became potent factors working against the growth of our business, your Bank was able to weather the storm and delivered another stellar performance to maintain our status as a top tier bank.
2015 Annual Report26

In terms of technology, our on-going partnership with IBM is beginning to yield positive results and this has allowed us to capitalize on new and existing technologies and to deploy IT solutions to support our business growth plans. As a result, the Bank was able to offer more convenient banking options for our clients.
Corporate GovernanceThe Bank continued to exhibit exemplary corporate governance standards consistent with the mandatory legal provisions. The Board, through its Audit and Credit sub-committees, ensured good internal control processes as well as compliance with regulatory requirements and provisions. A technology sub-committee chaired by Mr Kwamina Duker was also set up. With the help of these Committees and other management committees, the Board continues to work to ensure that sound business ethics are practiced in every area in the Bank.
Through regular review of procedures, the Board is satisfied that the systems in place are adequate to manage the risk inherent in the business, which continues to be a viable concern.
DirectorsThroughout the 2015 financial year, we maintained all the members of the Board of Directors of the Bank.
Conclusion & Outlook for 2016Global growth is expected to rise
marginally to 3.4% in 2016 and thereafter to 3.6% in 2017. Within the local economy, it has been forecasted that real GDP growth will accelerate gradually in 2016 as the economy recovers from the economic challenges it has faced over the past two years as the Government of Ghana is implementing the conditions of the IMF program. Increasing oil production, improved electricity generation, and diminishing deficits will be the main drivers of change though significant risk still exists from Ghana’s exposure to its key commodity-based exports namely cocoa, gold, and oil.
Despite this difficult macroeconomic environment to be faced in 2016, the Bank has laid the foundation to remain strong in the banking industry. The successful integration with ProCredit Ghana continues to be a critical leverage point which will allow the Bank to unlock significant value in the Commercial and SME sectors and enhance its presence in the market whilst its ongoing partnership with IBM will allow it to offer clients a superior customer experience and easy and convenient banking.
Our Board, Management, and staff have contributed tremendously to our success story so far and we look forward to their continued support as we stay the course in achieving our strategic initiatives in the coming year and beyond.
Thank you.
Dr. William Panford Bray Chairman
Chairman’s Statement
27

Introduction2015 was another challenging year for the banking industry and the economy as a whole. Despite improvements in global economic stability from the steady recovery of the Eurozone and other advanced economies, World GDP growth remained flat; adversely affecting trade between Ghana and the rest of the world. Terrorism and geopolitical risks along with the looming emerging market ‘growth crisis’ continued to take their toll on the global economy. This crisis has been building up for a few years but has been especially troubling of late, with China’s economy slowing down, commodity prices tanking, and Emerging Market currencies weakening sharply.
On the local front, huge public sector deficits impacted adversely on key macroeconomic indicators and ushered Ghana into a 3-year Extended Credit Facility program with the IMF. Generally, the cedi performed poorly against major international currencies resulting in total depreciation for 2015 of 15.7%, 12.6% and 7.8% against the USD, GBP, and EUR respectively. Interest rates remained high but relatively stable with short-term government securities decreasing slightly while long-term government securities inched up slightly in the last quarter of 2015. In addition, for most part of 2015, erratic power supply continued to be a significant factor in the stunted growth in the economy with the GDP growing by 4.1%. While this compares favorably with the revised 4.0% recorded in 2014, it pales in comparison with the growth of 14.2% in 2011 when the country started producing oil in commercial quantities.
2015 Financial PerformanceIn spite of this difficult macroeconomic environment, I am pleased to report that the Bank managed to deliver strong results on key performance indicators, generating additional value for stakeholders.
Balance Sheet ReviewOver the period the bank grew its balance sheet
size by 36% to close the year with an asset base of over GH¢ 4 billion. The growth in the assets of the bank was propelled by a 131% growth in investments in government securities. Interbank placements also increased by 53% to GH¢ 709 million. The increase in assets was funded mainly from increases in customer deposits. Customer deposits for 2015 increased by 69% to GH¢3 billion driven mainly by our marketing campaigns and deposit product sales.
Historic Breakdown of Major Asset Classes
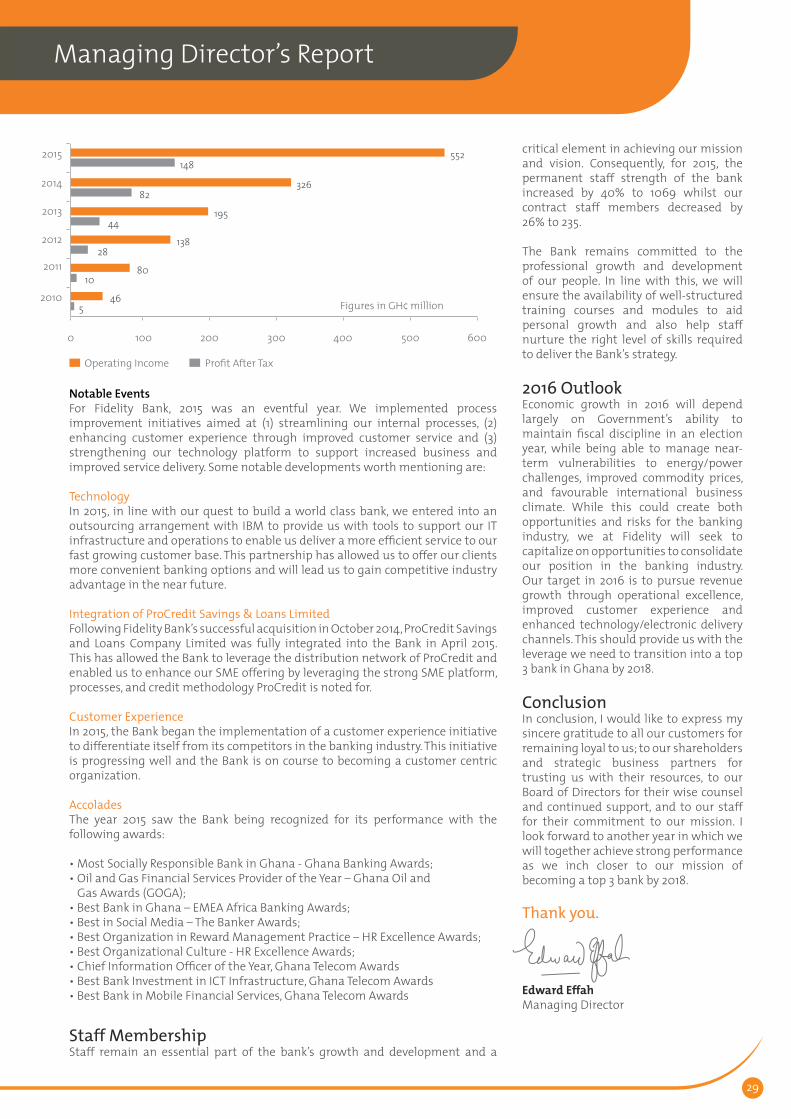
Income Statement AnalysisProfit increased by about 83% to GH¢ 205.8 million compared to GH¢112.5 million recorded in 2014. This was mainly driven by increased operating income. In the year under review, operating income was GH¢ 552 million, representing a growth of 69% over last year’s figure of GH¢ 326 million. Growth in operating income was as a result of a 98% growth in net interest income from GH¢186 million in 2014 to GH¢ 370million in 2015. Growth in fees and commission on the other hand increased but was below expectation due to the shortage in foreign currency and decreased international trade activities in the year. Fees and commission grew by 29% to GH¢ 74 million compared to GH¢57 million in 2014. Operating expense for the year came to GH¢ 292 million, 60% above that of the previous year.
0 200
2010
2011
2012
2013
2014
2015
400
134460
806
463591
1,560
188310
637
248234
410
151203
212
7091,366
1,490
600 800 1,000 1,200 1,400 1,600 1,800
Figures in GH¢ million
Loans & Advances Govt. Securities Other Banks & Fin. Institutions
Managing Director’s Report
Distinguished Shareholders,
It is my pleasure to present to you the Bank’s performance for the 2015 financial year. I am delighted to report that your Bank has at the end of 2015 improved its industry positioning to become the 4th largest bank in Ghana by asset size and deposits after only 9 years in operation. This is proof of our unyielding determination to achieve our mission to become one of the Top 3 banks in Ghana by 2018.
2015 Annual Report28
Notable EventsFor Fidelity Bank, 2015 was an eventful year. We implemented process improvement initiatives aimed at (1) streamlining our internal processes, (2) enhancing customer experience through improved customer service and (3) strengthening our technology platform to support increased business and improved service delivery. Some notable developments worth mentioning are:
TechnologyIn 2015, in line with our quest to build a world class bank, we entered into an outsourcing arrangement with IBM to provide us with tools to support our IT infrastructure and operations to enable us deliver a more efficient service to our fast growing customer base. This partnership has allowed us to offer our clients more convenient banking options and will lead us to gain competitive industry advantage in the near future.
Integration of ProCredit Savings & Loans LimitedFollowing Fidelity Bank’s successful acquisition in October 2014, ProCredit Savings and Loans Company Limited was fully integrated into the Bank in April 2015. This has allowed the Bank to leverage the distribution network of ProCredit and enabled us to enhance our SME offering by leveraging the strong SME platform, processes, and credit methodology ProCredit is noted for.
Customer Experience In 2015, the Bank began the implementation of a customer experience initiative to differentiate itself from its competitors in the banking industry. This initiative is progressing well and the Bank is on course to becoming a customer centric organization.
AccoladesThe year 2015 saw the Bank being recognized for its performance with the following awards:
• Most Socially Responsible Bank in Ghana - Ghana Banking Awards;• Oil and Gas Financial Services Provider of the Year – Ghana Oil and Gas Awards (GOGA); • Best Bank in Ghana – EMEA Africa Banking Awards;• Best in Social Media – The Banker Awards;• Best Organization in Reward Management Practice – HR Excellence Awards;• Best Organizational Culture - HR Excellence Awards;• Chief Information Officer of the Year, Ghana Telecom Awards• Best Bank Investment in ICT Infrastructure, Ghana Telecom Awards• Best Bank in Mobile Financial Services, Ghana Telecom Awards
Staff MembershipStaff remain an essential part of the bank’s growth and development and a
critical element in achieving our mission and vision. Consequently, for 2015, the permanent staff strength of the bank increased by 40% to 1069 whilst our contract staff members decreased by 26% to 235. The Bank remains committed to the professional growth and development of our people. In line with this, we will ensure the availability of well-structured training courses and modules to aid personal growth and also help staff nurture the right level of skills required to deliver the Bank’s strategy.
2016 OutlookEconomic growth in 2016 will depend largely on Government’s ability to maintain fiscal discipline in an election year, while being able to manage near-term vulnerabilities to energy/power challenges, improved commodity prices, and favourable international business climate. While this could create both opportunities and risks for the banking industry, we at Fidelity will seek to capitalize on opportunities to consolidate our position in the banking industry. Our target in 2016 is to pursue revenue growth through operational excellence, improved customer experience and enhanced technology/electronic delivery channels. This should provide us with the leverage we need to transition into a top 3 bank in Ghana by 2018.
ConclusionIn conclusion, I would like to express my sincere gratitude to all our customers for remaining loyal to us; to our shareholders and strategic business partners for trusting us with their resources, to our Board of Directors for their wise counsel and continued support, and to our staff for their commitment to our mission. I look forward to another year in which we will together achieve strong performance as we inch closer to our mission of becoming a top 3 bank by 2018.
Thank you.
Edward EffahManaging Director
0 100
2010
2011
2012
2013
2014
2015
44
82
195
326
28138
1080
546
148552
200 300 400 500 600
Figures in GH¢ million
Operating Income Profit After Tax
Managing Director’s Report
29

The Directors submit their report together with the audited financial statements of the Bank and its subsidiaries, together called the Group, for the year ended 31 December 2015.
Directors’ responsibility statement
The Bank’s Directors are responsible for the preparation and fair presentation of the financial statements comprising the statements of financial position at 31 December 2015, the statements of comprehensive income, the statements of changes in equity, statements of cash flows for the year then ended, and the notes to the financial statements, which include a summary of significant accounting policies and other explanatory notes in accordance with International Financial Reporting Standards (IFRS), and in the manner required by the Companies Act 1963 (Act 179), the Banking Act, 2004 (Act 673) as amended by the Banking (Amendment) Act, 2007 (Act 738).
The Directors’ responsibilities include: designing, implementing and maintaining internal controls relevant to the preparation and fair presentation of these financial statements that are free from material misstatement, whether due to fraud or error, selecting and applying appropriate accounting policies and making accounting estimates that are reasonable in the circumstances.
The Directors have made an assessment of the Bank’s ability to continue as a going concern and have no reason to believe the business will not be a going concern.
Principal activities
The company operates as a Bank under the Banking Act, 2004 (Act 673) as amended by the Banking (Amendment) Act, 2007 (Act 738).
Nature of business
The Bank is licensed to carry out universal banking business in Ghana, and there was no change in the nature of the Bank’s business during the period.
Holding company
Fidelity Bank Ghana Limited, a company incorporated in Ghana, wholly owns Fidelity Securities Limited and Fidelity Asia Bank Limited.
Fidelity Securities Limited (FSL), a company incorporated in Ghana, is the investment banking arm of the Bank. FSL’s business involves providing advisory services, issuance of securities and publishing analysis and reports concerning securities for clients.
Fidelity Asia Bank Limited (FABL) is a company incorporated in Malaysia and carries on the business of offshore banking.
Directors’ Report All amounts are expressed in thousands of Ghana cedis unless otherwise stated[ ]
2015 Annual Report30
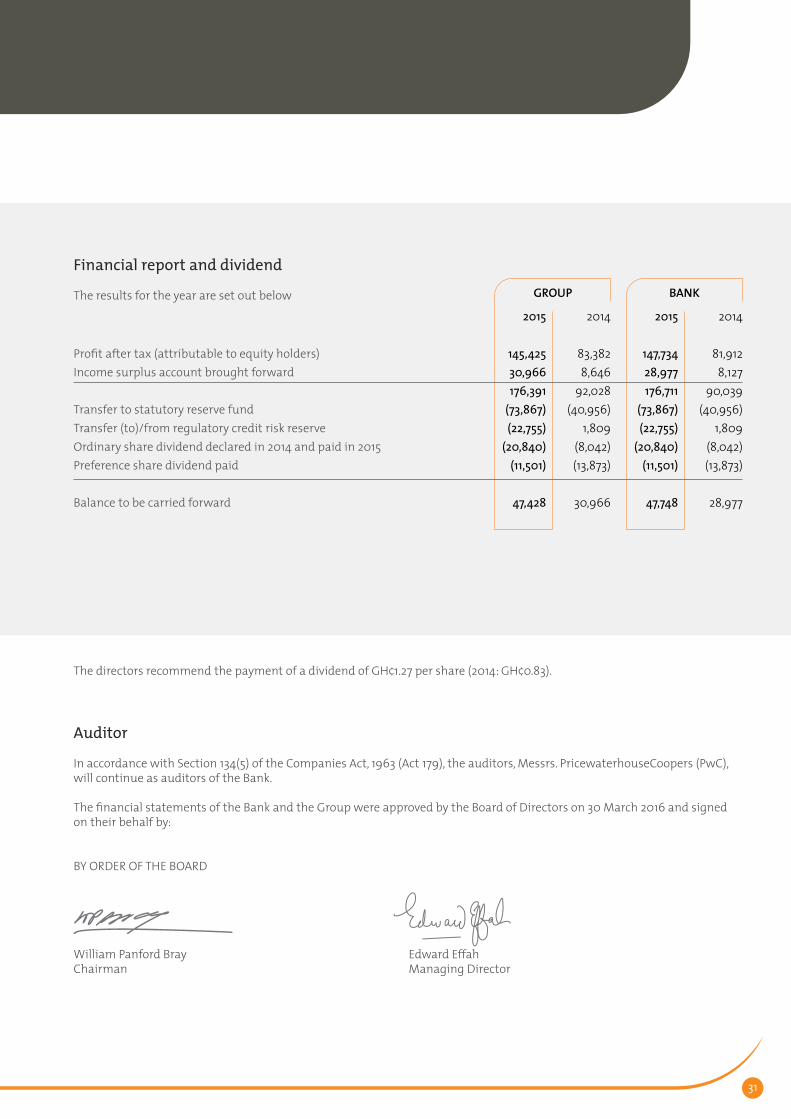
2015
145,42530,966176,391
(73,867)(22,755)
(20,840) (11,501)
47,428
Profit after tax (attributable to equity holders)Income surplus account brought forward
Transfer to statutory reserve fundTransfer (to)/from regulatory credit risk reserveOrdinary share dividend declared in 2014 and paid in 2015Preference share dividend paid
Balance to be carried forward
The directors recommend the payment of a dividend of GH¢1.27 per share (2014: GH¢0.83).
Auditor
In accordance with Section 134(5) of the Companies Act, 1963 (Act 179), the auditors, Messrs. PricewaterhouseCoopers (PwC), will continue as auditors of the Bank.
The financial statements of the Bank and the Group were approved by the Board of Directors on 30 March 2016 and signed on their behalf by:
BY ORDER OF THE BOARD
William Panford Bray Edward EffahChairman Managing Director
Financial report and dividend
The results for the year are set out below GROUP BANK
2014
83,382 8,64692,028
(40,956)1,809
(8,042)(13,873)
30,966
2015
147,73428,977176,711
(73,867)(22,755)
(20,840)(11,501)
47,748
2014
81,912 8,12790,039
(40,956)1,809
(8,042)(13,873)
28,977
31
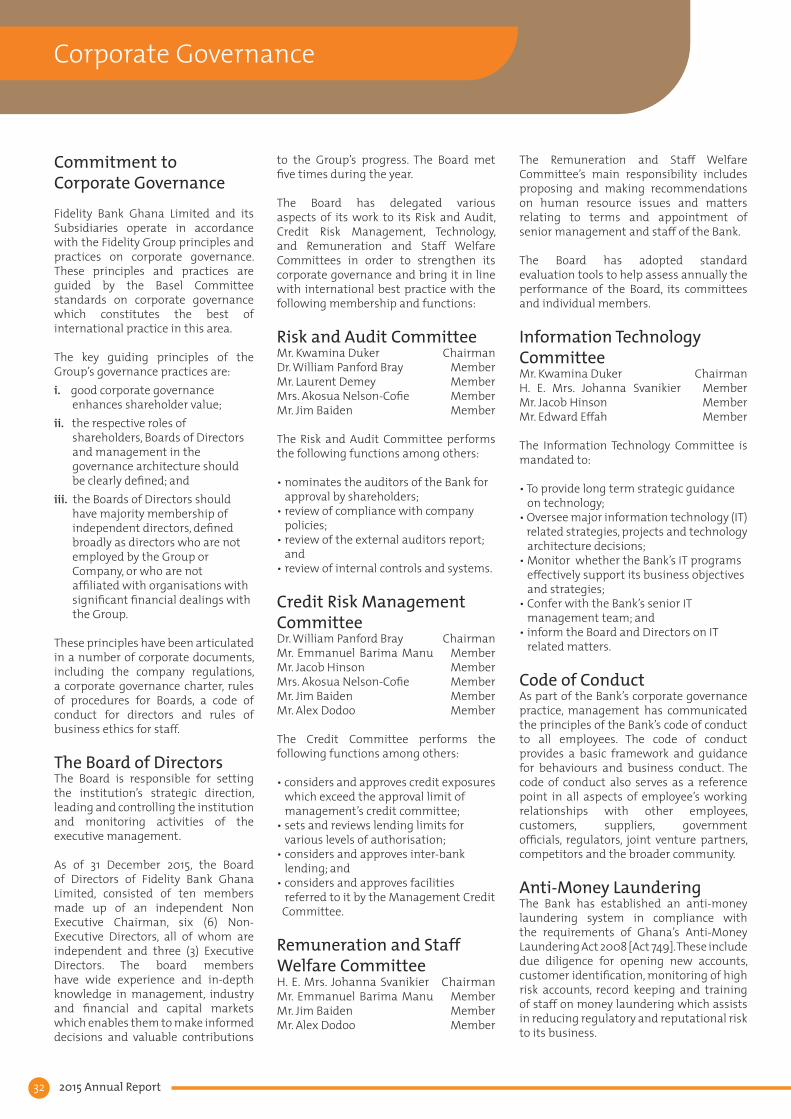
Commitment to Corporate GovernanceFidelity Bank Ghana Limited and its Subsidiaries operate in accordance with the Fidelity Group principles and practices on corporate governance. These principles and practices are guided by the Basel Committee standards on corporate governance which constitutes the best of international practice in this area.
The key guiding principles of the Group’s governance practices are:i. good corporate governance enhances shareholder value;ii. the respective roles of shareholders, Boards of Directors and management in the governance architecture should be clearly defined; andiii. the Boards of Directors should have majority membership of independent directors, defined broadly as directors who are not employed by the Group or Company, or who are not affiliated with organisations with significant financial dealings with the Group.
These principles have been articulated in a number of corporate documents, including the company regulations, a corporate governance charter, rules of procedures for Boards, a code of conduct for directors and rules of business ethics for staff.
The Board of DirectorsThe Board is responsible for setting the institution’s strategic direction, leading and controlling the institution and monitoring activities of the executive management.
As of 31 December 2015, the Board of Directors of Fidelity Bank Ghana Limited, consisted of ten members made up of an independent Non Executive Chairman, six (6) Non-Executive Directors, all of whom are independent and three (3) Executive Directors. The board members have wide experience and in-depth knowledge in management, industry and financial and capital markets which enables them to make informed decisions and valuable contributions
to the Group’s progress. The Board met five times during the year.
The Board has delegated various aspects of its work to its Risk and Audit, Credit Risk Management, Technology, and Remuneration and Staff Welfare Committees in order to strengthen its corporate governance and bring it in line with international best practice with the following membership and functions:
Risk and Audit CommitteeMr. Kwamina Duker ChairmanDr. William Panford Bray Member Mr. Laurent Demey Member Mrs. Akosua Nelson-Cofie MemberMr. Jim Baiden Member The Risk and Audit Committee performs the following functions among others:
• nominates the auditors of the Bank for approval by shareholders;• review of compliance with company policies;• review of the external auditors report; and• review of internal controls and systems.
Credit Risk Management Committee Dr. William Panford Bray ChairmanMr. Emmanuel Barima Manu Member Mr. Jacob Hinson Member Mrs. Akosua Nelson-Cofie MemberMr. Jim Baiden MemberMr. Alex Dodoo Member
The Credit Committee performs the following functions among others:
• considers and approves credit exposures which exceed the approval limit of management’s credit committee;• sets and reviews lending limits for various levels of authorisation; • considers and approves inter-bank lending; and• considers and approves facilities referred to it by the Management Credit Committee.
Remuneration and Staff Welfare CommitteeH. E. Mrs. Johanna Svanikier ChairmanMr. Emmanuel Barima Manu MemberMr. Jim Baiden Member Mr. Alex Dodoo Member
The Remuneration and Staff Welfare Committee’s main responsibility includes proposing and making recommendations on human resource issues and matters relating to terms and appointment of senior management and staff of the Bank.
The Board has adopted standard evaluation tools to help assess annually the performance of the Board, its committees and individual members.
Information Technology Committee Mr. Kwamina Duker ChairmanH. E. Mrs. Johanna Svanikier MemberMr. Jacob Hinson Member Mr. Edward Effah Member
The Information Technology Committee is mandated to:
• To provide long term strategic guidance on technology;• Oversee major information technology (IT) related strategies, projects and technology architecture decisions; • Monitor whether the Bank’s IT programs effectively support its business objectives and strategies;• Confer with the Bank’s senior IT management team; and• inform the Board and Directors on IT related matters.
Code of ConductAs part of the Bank’s corporate governance practice, management has communicated the principles of the Bank’s code of conduct to all employees. The code of conduct provides a basic framework and guidance for behaviours and business conduct. The code of conduct also serves as a reference point in all aspects of employee’s working relationships with other employees, customers, suppliers, government officials, regulators, joint venture partners, competitors and the broader community.
Anti-Money LaunderingThe Bank has established an anti-money laundering system in compliance with the requirements of Ghana’s Anti-Money Laundering Act 2008 [Act 749]. These include due diligence for opening new accounts, customer identification, monitoring of high risk accounts, record keeping and training of staff on money laundering which assists in reducing regulatory and reputational risk to its business.
Corporate Governance
2015 Annual Report32

REPORT ON THE FINANCIAL STATEMENTS
We have audited the accompanying financial statements of Fidelity Bank Ghana Limited (the Bank) and its subsidiaries (together, the Group), as set out on pages 34 to 97. These financial statements comprise the consolidated statement of financial position as at 31 December 2015 and the consolidated statement of comprehensive income, consolidated statement of changes in equity and the consolidated statement of cash flows for the year then ended, together with the statement of financial position of the Bank standing alone as at 31 December 2015 and the statement of comprehensive income, statement of changes in equity and statement of cash flows of the Bank for the year then ended, and a summary of significant accounting policies and other explanatory information.
Directors’ responsibility for the financial statements
The directors are responsible for the preparation of the consolidated financial statements for the financial year, which give a true and fair view of the state of affairs of the group, in accordance with International Financial Reporting Standards and in the manner required by the Companies Act, 1963 (Act 179) and the Banking Act, 2004 (Act 673) as amended by the Banking (Amendment) Act, 2007 (Act 738) and for such internal control, as the directors determine is necessary to enable the preparation of financial statements that are free from material misstatement, whether due to fraud or error.
Auditor’s responsibility
Our responsibility is to express an opinion on the financial statements based on our audit. We conducted
our audit in accordance with International Standards on Auditing. Those standards require that we comply with ethical requirements and plan and perform the audit to obtain reasonable assurance about whether the financial statements are free from material misstatement.
An audit involves performing procedures to obtain audit evidence about the amounts and disclosures in the financial statements. The procedures selected depend on the auditor’s judgement, including the assessment of the risks of material misstatement of the financial statements, whether due to fraud or error. In making those risk assessments, the auditor considers internal control relevant to the entity’s preparation of financial statements that give a true and fair view in order to design audit procedures that are appropriate in the circumstances, but not for the purpose of expressing an opinion on the effectiveness of the entity’s internal control. An audit also includes evaluating the appropriateness of accounting policies used and the reasonableness of accounting estimates made by the directors, as well as evaluating the overall presentation of the financial statements.
We believe that the audit evidence we have obtained is sufficient and appropriate to provide a basis for our audit opinion.
Opinion
In our opinion, the accompanying financial statements give a true and fair view of the financial position of Fidelity Bank Ghana Limited and its subsidiaries as at 31 December 2015 and of the financial performance and cash flows of the Bank and the Group for the year then ended in accordance with International Financial Reporting Standards and in the manner required by the Companies Act, 1963 (Act 179) and the Banking Act, 2004 (Act 673) as amended by the Banking (Amendment) Act, 2007 (Act 738).
REPORT ON OTHER LEGAL REQUIREMENTS
The Companies Act, 1963 (Act 179) requires that in carrying out our audit we consider and report on the following matters. We confirm that:
(i) we have obtained all the information and explanations which to the best of our knowledge and belief were necessary for the purposes of our audit;ii) in our opinion, proper books of account have been kept by the Bank, so far as appears from our examination of those books; andiii) the statement of financial position and statement of comprehensive income of the Group are in agreement with the books of account.
In accordance with section 78(2) of the Banking Act 673, 2004 we hereby confirm that:
i) we were able to obtain all the information and explanations required for the efficient performance of our duties as auditors;ii) in our opinion, the accounts give a true and fair view of the state of the Bank’s affairs and its results for the year under review; iii) in our opinion, the Bank’s transactions were within its powers; and iv) the Bank in all material respects complied with the requirements of the Banking Act, 2004 (Act 673) as amended.
PricewaterhouseCoopers (ICAG/F/2016/028)Chartered AccountantsSigned by: Michael Asiedu-Antwi (ICAG/P/1138)Accra, Ghana31 March 2016
Report of the Independent Auditor To The Members of Fidelity Bank Ghana Limited
33

Statement of Comprehensive Income
2015
614,809(242,168)
372,64175,538
(5,504)70,034114,617
557,292(298,551)(54,066)
204,675(48,904)(10,346)145,425
3,729(4)
2,3916,116
151,541
151,541151,541
5.76
Notes
67
89
10
1112
1313
3131
31
28
Interest incomeInterest expenseNet interest incomeFee and commission incomeFee and commission expenseNet fee and commission incomeOther operating incomeOperating incomeOperating expensesImpairment charge on loans and advancesProfit before income tax and national fiscal stabilisation levyIncome tax expenseNational fiscal stabilisation levyProfit for the year Other comprehensive income:Items that may be subsequently reclassified to profit or lossNet change in value of available for sale investment securitiesLoss on re-measuring to fair value the existing interest in equity investmentCurrency translation differences on foreign subsidiaryTotal other comprehensive incomeTotal comprehensive income for the year
Attributable to owners of the parentTotal comprehensive income for the yearEarnings per shareBasic/diluted earnings per share (GH¢)
Items in the statement above are disclosed net of tax. The income tax relating to each component of other comprehensive income is disclosed in note 14.
The accompanying notes on pages 41 to 97 form an integral part of these financial statements.
Year ended 31 December 2015
GROUP BANK
2014
361,172(167,278)193,89460,245(3,764)56,48186,349
336,724(191,730)(30,707)114,287
(25,188)(5,717)83,382
(10,541)(47)
4,518(6,070)
77,312
77,31277,312
3.57
2015
615,075(245,463)
369,61273,972
(5,497)68,475113,758
551,845(291,980)(54,066)205,799(47,775)
(10,290)147,734
3,728(4)
-3,724
151,458
151,458151,458
5.85
2014
352,566(166,324)
186,24257,442(3,535)53,90785,878
326,027(182,709)
(30,841)112,477
(24,941)(5,624)81,912
(10,540)(47)
-(10,587)
71,325
71,32571,325
3.51
[ ] All amounts are expressed in thousands of Ghana cedis unless otherwise stated
2015 Annual Report34
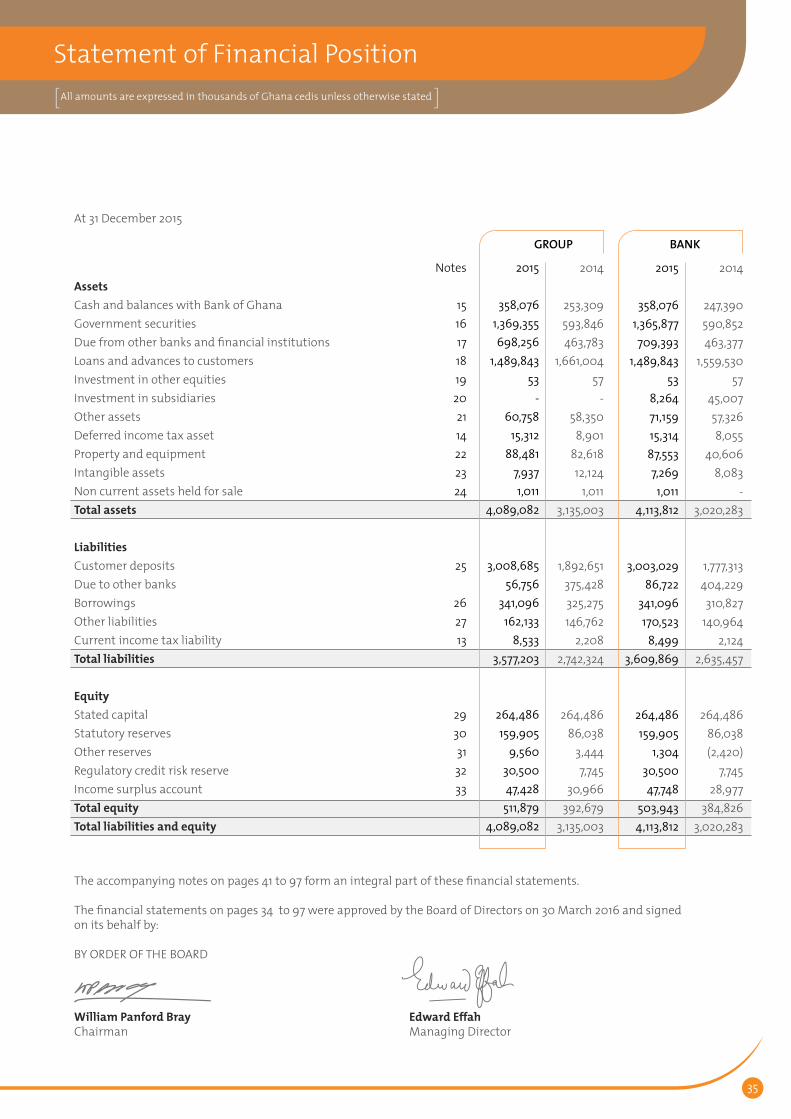
2015
358,0761,369,355698,256
1,489,84353
-60,758
15,31288,481
7,9371,011
4,089,082
3,008,68556,756
341,096162,133
8,5333,577,203
264,486159,905
9,56030,50047,428
511,8794,089,082
Notes
1516171819202114222324
25
262713
2930313233
Assets Cash and balances with Bank of GhanaGovernment securities Due from other banks and financial institutionsLoans and advances to customers Investment in other equities Investment in subsidiaries Other assets Deferred income tax asset Property and equipment Intangible assets Non current assets held for sale Total assets
Liabilities Customer deposits Due to other banks Borrowings Other liabilitiesCurrent income tax liability Total liabilities
Equity Stated capital Statutory reserves Other reserves Regulatory credit risk reserve Income surplus account Total equity Total liabilities and equity
At 31 December 2015
The accompanying notes on pages 41 to 97 form an integral part of these financial statements.
The financial statements on pages 34 to 97 were approved by the Board of Directors on 30 March 2016 and signed on its behalf by:
BY ORDER OF THE BOARD
William Panford Bray Edward Effah Chairman Managing Director
GROUP BANK
2014
253,309593,846463,783
1,661,00457
-58,350
8,90182,61812,124
1,0113,135,003
1,892,651375,428325,275146,762
2,2082,742,324
264,48686,038
3,4447,745
30,966392,679
3,135,003
2015
358,0761,365,877709,393
1,489,84353
8,26471,15915,31487,5537,269
1,0114,113,812
3,003,02986,722
341,096170,523
8,4993,609,869
264,486159,905
1,30430,50047,748
503,9434,113,812
2014
247,390590,852463,377
1,559,53057
45,00757,3268,055
40,6068,083
-3,020,283
1,777,313404,229310,827
140,9642,124
2,635,457
264,48686,038(2,420)
7,74528,977
384,8263,020,283
Statement of Financial Position[ ] All amounts are expressed in thousands of Ghana cedis unless otherwise stated
35
Regulatory credit risk
reserve
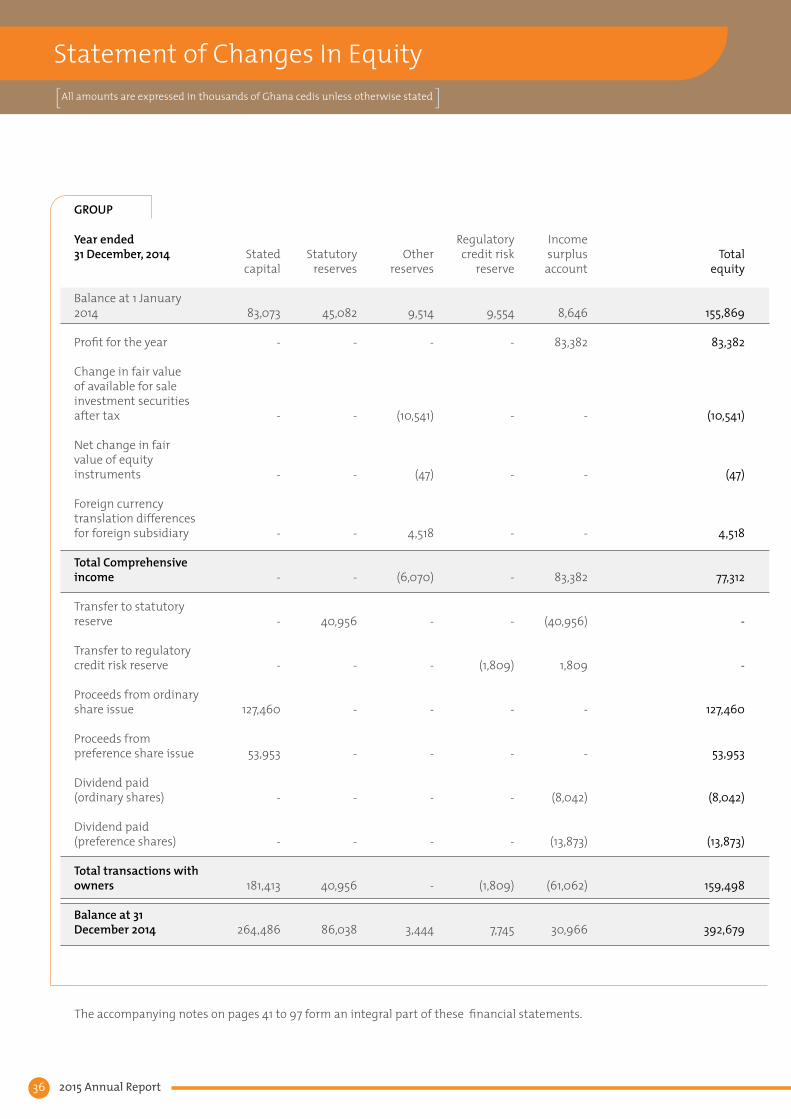
9,554
-
-
-
-
-
-
(1,809)
-
-
-
-
(1,809)
7,745
Other
reserves
9,514
-
(10,541)
(47)
4,518
(6,070)
-
-
-
-
-
-
-
3,444
Statutory reserves
45,082
-
-
-
-
-
40,956
-
-
-
-
-
40,956
86,038
Stated capital
83,073
-
-
-
-
-
-
-
127,460
53,953
-
-
181,413
264,486
Year ended 31 December, 2014
Balance at 1 January 2014
Profit for the year
Change in fair value of available for sale investment securities after tax
Net change in fair value of equity instruments
Foreign currency translation differences for foreign subsidiary
Total Comprehensive income
Transfer to statutory reserve
Transfer to regulatory credit risk reserve
Proceeds from ordinary share issue
Proceeds from preference share issue
Dividend paid (ordinary shares)
Dividend paid (preference shares)
Total transactions with owners
Balance at 31 December 2014
The accompanying notes on pages 41 to 97 form an integral part of these financial statements.
Income surplus
account
8,646
83,382
-
-
-
83,382
(40,956)
1,809
-
-
(8,042)
(13,873)
(61,062)
30,966
Total equity
155,869
83,382
(10,541)
(47)
4,518
77,312
-
-
127,460
53,953
(8,042)
(13,873)
159,498
392,679
GROUP
All amounts are expressed in thousands of Ghana cedis unless otherwise stated[ ]
2015 Annual Report36
Statement of Changes In Equity[ ] All amounts are expressed in thousands of Ghana cedis unless otherwise stated

Regulatory credit risk
reserve
7,745
-
-
-
-
-
-
22,755
-
-
-
-
22,755
30,500
Other reserves
3,444
-
3,729
(4)
2,391
6,116
-
-
-
-
-
-
-
9,560
Statutory reserves
86,038
-
-
-
-
-
73,867
-
-
-
-
-
73,867
159,905
Stated capital
264,486
-
-
-
-
-
-
-
-
-
-
-
-
264,486
The accompanying notes on pages 41 to 97 form an integral part of these financial statements
Income surplus
account
30,966
145,425
-
-
-
145,425
(73,867)
(22,755)
-
-
(20,840)
(11,501)
(128,963)
47,428
Total equity
392,679
145,425
3,729
(4)
2,391
151,541
-
-
-
-
(20,840)
(11,501)
(32,341)
511,879
GROUP
Year ended 31 December, 2015
Balance at 1 January 2015
Profit for the year
Change in fair value of available for sale investment securities after tax
Net change in fair value of equity instruments
Foreign currency translation differences for foreign subsidiary
Total Comprehensive income
Transfer to statutory reserve
Transfer to regulatory credit risk reserve
Proceeds from ordinary share issue
Proceeds from preference share issue
Dividend paid (ordinary shares)
Dividend paid (preference shares)
Total transactions with owners
Balance at 31 December 2015
37

The accompanying notes on pages 41 to 97 form an integral part of these financial statements.
Regulatory credit risk
reserve
9,554
-
-
-
-
-
(1,809)
-
-
-
-
(1,809)
7,745
Other reserves
8,167
-
(10,540)
(47)
(10,587)
-
-
-
-
-
-
-
(2,420)
Statutory reserves
45,082
-
-
-
-
40,956
-
-
-
-
-
40,956
86,038
Stated capital
83,073
-
-
-
-
-
-
53,954
127,459
-
-
181,413
264,486
Year ended 31 December, 2014
Balance at 1 January 2014
Profit for the year
Change in fair value of available for sale investment securities after tax
Net change in fair value of equity instruments
Total comprehensive income
Transfer to statutory reserve
Transfer from regulatory credit risk reserve
Proceeds from preference share issue
Proceeds from ordinary share issue
Dividend paid (ordinary shares)
Dividend paid (preference shares)
Total transactions with owners
Balance at 31 December 2014
Income surplus
account
8,127
81,912
-
-
81,912
(40,956)
1,809
-
-
(8,042)
(13,873)
(61,062)
28,977
Total equity
154,003
81,912
(10,540)
(47)
71,325
-
-
53,954
127,459
(8,042)
(13,873)
159,498
384,826
BANK
2015 Annual Report38
All amounts are expressed in thousands of Ghana cedis unless otherwise stated[ ]
Statement of Changes In Equity[ ] All amounts are expressed in thousands of Ghana cedis unless otherwise stated

The accompanying notes on pages 41 to 97 form an integral part of these financial statements.
Regulatory credit risk
reserve
7,745
-
-
-
-
-
22,755
-
-
22,755
30,500
Other reserves
(2,420)
-
3,728
(4)
3,724
-
-
-
-
-
1,304
Statutory reserves
86,038
-
-
-
-
73,867
-
-
-
73,867
159,905
Stated capital
264,486
-
-
-
-
-
-
-
-
-
264,486
Year ended 31 December, 2015
Balance at 1 January 2015
Profit for the year
Change in fair value of available for sale investment securities after tax
Net change in fair value of equity instruments
Total comprehensive income
Transfer to statutory reserve
Transfer from regulatory credit risk reserve
Dividend paid (ordinary shares)
Dividend paid (preference shares)
Total transactions with owners
Balance at 31 December 2015
Income surplus
account
28,977
147,734
-
-
147,734
(73,867)
(22,755)
(20,840)
(11,501)
(128,963)
47,748
Total equity
384,826
147,734
3,728
(4)
151,458
-
-
(20,840)
(11,501)
(32,341)
503,943
BANK
39

2015
204,675
9,6036,979
54,629(1,181)
-57,439
332,144116,532(2,408)
1,116,034(136,945)
5,025(50,233)
1,048,0051,380,149
(16,327)(2,792)
2,042(699,097)
-(716,174)
--
(32,341)(41,618)
-(73,959)590,016
451,2212,391
590,0161,043,628
Note
22231222
26
182125152713
2223221620
2929
2626
34
Cash flows from operating activitiesProfit before income tax Adjustments: Depreciation Amortisation Impairment charge on loans and advancesProfit on disposal of property and equipmentRepossessed asset of ProCredit GhanaExchange difference on borrowingsOperating cash flow before investment in working capitalChanges in loans and advances to customersChanges in other assets Changes in customer deposits Changes in mandatory reserve deposits Changes in other liabilitiesTax paid Increase in operating assets and liabilitiesNet cash flow generated from /(used in) operating activities
Cash flow from investing activities Purchase of property and equipmentPurchase of intangible assetsProceeds on asset disposal Purchase of government securitiesInvestment in ProCredit Net cash flow (used in)/ generated from investing activities
Cash flow from financing activities Proceeds from ordinary share issued Proceeds from preference share issued Dividends paid Repayment of borrowings Drawdown on borrowings Net cash flow (used in)/generated from financing activitiesIncrease in cash and cash equivalents
Analysis of changes in cash and cash equivalentsCash and cash equivalents at 1 January Gain on currency translation of foreign subsidiaryChange in cash and cash equivalents Cash and cash equivalents at 31 December
The accompanying notes on pages 41 to 97 form an integral part of these financial statements.
GROUP BANK
2014
114,287
8,1685,892
30,835(123)
-38,881
197,940(758,762)(22,620)429,370(71,350)91,864
(25,823)(357,321)(159,381)
(6,820)(2,035)
168114,601(31,703)
74,211
127,46053,953
(21,915)(28,688)232,491363,301278,131
168,5724,518
278,131451,221
2015
205,799
9,5186,711
54,629(1,181)(1,011)
57,439331,904
15,058(13,833)
1,225,716(136,945)
19,268(49,902)
1,059,3621,391,266
(6,134)(5,897)
2,042(698,678) -
(708,667)
--
(32,341)(41,618)
-(73,959)
608,640
415,978-
608,6401,024,618
2014
112,477
7,3855,752
30,969(138)
-38,881
195,326(778,818)
(16,253)421,333(71,350)90,107
(25,418)(380,399)(185,073)
(4,763)(1,929)
138117,004
(36,743)73,707
127,46053,953
(21,915)(28,688)218,043348,853237,487
178,491-
237,487415,978
2015 Annual Report40
Statement of Cash Flow[ ] All amounts are expressed in thousands of Ghana cedis unless otherwise stated

1. GENERAL INFORMATION
Fidelity Bank Ghana Limited (FBGL) is a limited liability company, incorporated and domiciled in Ghana. The registered office is located at Ridge Tower, 10 Ambassadorial Enclave, West Ridge, Accra. FBGL operates under the Banking Act, 2004 (Act 673) as amended by the Banking (Amendment) Act, 2007 (Act 738). The financial statements of FBGL for the year ended 31 December 2015 were authorised for issue in accordance with a resolution of the directors on 30 March 2015.
2. SUMMARY OF SIGNIFICANT ACCOUNTING POLICIES
The principal accounting policies applied in the preparation of these financial statements are set out below. These policies have been consistently applied to all the years presented, unless otherwise stated.
2.1 Basis of preparation
The financial statements have been prepared in accordance with International Financial Reporting Standards (IFRS) as issued by the International Accounting Standards Board. Additional information required by the Companies Act, 1963 (Act 179) and the Banking Act, 2004 (Act 673) as amended by the Banking (Amendment) Act, 2007 (Act 738) have been included, where appropriate. These financial statements have been prepared under the historical cost convention, except as disclosed in the accounting policy.
The financial statements comprise the statement of comprehensive income, the statement of financial position, the statement of changes in equity, the statement of cash flow and related notes. The financial statements of the Bank standing alone comprises the statement of comprehensive income, the statement of financial position, the statement of changes in equity, the statement of cash flow and related notes.
Items included in the financial statements are measured using the currency of the primary economic environment in which the entity operates (“the functional currency”).
The financial statements are presented in Ghana cedis, which is the Bank’s functional and presentation currency. The figures shown in the financial statements are stated in thousands of Ghana cedis.
The disclosures on risks from financial instruments are presented in the financial risk management report contained in Note 3.
The preparation of financial statements in conformity with IFRS requires the use of certain critical accounting estimates. It also requires the directors to exercise judgement in the process of applying the Group’s accounting policies. Changes in assumptions may have a significant impact on the financial statements in the period the assumptions changed. The areas involving a higher degree of judgement or complexity, or areas where assumptions and estimates are significant to the financial statements are disclosed in Note 4.
2.1.1 Changes in accounting policy and disclosures
(i) New and amended standards adopted by the Group:
There were no new IFRS’s and International Financial Reporting Interpretations Committee (IFRIC) interpretations that are effective for the first time for the financial year beginning on or after 1 January 2015 that would be expected to have an impact on the consolidated financial statements.
(ii) New and amended standards not yet adopted by the Group
A number of new standards and amendments to standards and interpretations are available for early adoption for annual periods beginning after 1 January 2015, but
have not been applied in preparing these financial statements. None of these is expected to have a significant effect on the financial statements of the Group, except the following:IFRS 9, ‘Financial instruments’, addresses the classification, measurement and recognition of financial assets and financial liabilities. The complete version of IFRS 9 was issued in July 2015. It replaces the guidance in IAS 39 that relates to the classification and measurement of financial instruments. IFRS 9 retains but simplifies the mixed measurement model and establishes three primary measurement categories for financial assets: amortised cost, fair value through Other Comprehensive Income (OCI) and fair value through Profit or Loss (P&L). The basis of classification depends on the entity’s business model and the contractual cash flow characteristics of the financial asset. Investments in equity instruments are required to be measured at fair value through profit or loss with the irrevocable option at inception to present changes in fair value in OCI not recycling. There is now a new expected credit losses model that replaces the incurred loss impairment model used in IAS 39. For financial liabilities there were no changes to classification and measurement except for the recognition of changes in own credit risk in other comprehensive income, for liabilities designated at fair value through profit or loss. IFRS 9 relaxes the requirements for hedge effectiveness by replacing the bright line hedge effectiveness tests. It requires an economic relationship between the hedged item and hedging instrument and for the ‘hedged ratio’ to be the same as the one management actually use for risk management purposes. Contemporaneous documentation is still required but is different to that currently prepared under IAS 39. The standard is effective for accounting periods beginning on or after 1 January 2018. Early adoption is permitted.
Notes To The Financial Statementsfor the year ended 31 December 2015 All amounts are expressed in thousands
of Ghana cedis unless otherwise stated[ ]
41

All amounts are expressed in thousands of Ghana cedis unless otherwise stated[ ]
Notes To The Financial Statementsfor the year ended 31 December 2015 All amounts are expressed in thousands
of Ghana cedis unless otherwise stated[ ]
2015 Annual Report40
IFRS 15, ‘Revenue from contracts with customers’ deals with revenue recognition and establishes principles for reporting useful information to users of financial statements about the nature, amount, timing and uncertainty of revenue and cash flows arising from an entity’s contracts with customers. Revenue is recognised when a customer obtains control of a good or service and thus has the ability to direct the use and obtain the benefits from the good or service.The standard replaces IAS 18 ‘Revenue’ and IAS 11 ‘Construction contracts’ and related interpretations. The standard is effective for annual periods beginning on or after 1 January 2017 and earlier application is permitted. The Directors are assessing the impact of IFRS 15.
(ii) New and amended standards not yet adopted by the Group (continued)
The amendments to IAS 1 Presentation of Financial Statements are made in the context of the IASB’s Disclosure Initiative, which explores how financial statement disclosures can be improved. The amendments provide clarifications on a number of issues, including:
• Materiality – an entity should not aggregate or disaggregate information in a manner that obscures useful information. Where items are material, sufficient information must be provided to explain the impact on the financial position or performance.
• Disaggregation and subtotals – line items specified in IAS 1 may need to be disaggregated where this is relevant to an understanding of the entity’s financial position or performance. There is also new guidance on the use of subtotals.
• Notes – confirmation that the notes do not need to be presented in a particular order.
• OCI arising from investments accounted for under the equity
method – the share of OCI arising from equity-accounted investments is grouped based on whether the items will or will not subsequently be reclassified to profit or loss. Each group should then be presented as a single line item in the statement of other comprehensive income. According to the transitional provisions, the disclosures in IAS 8 regarding the adoption of new standards/accounting policies are not required for these amendments. The amendments are effective 1 January 2016.There are no other IFRSs or IFRIC interpretations that are not yet effective that would be expected to have a material impact on the Group.
2.2 Basis of consolidation
The consolidated financial statements comprise the financial statements of Fidelity Bank Ghana Limited and its subsidiaries as at 31 December 2015.
(a) Subsidiaries
Subsidiaries are all entities (including structured entities) over which the Bank has control. The Bank controls an entity when the Bank is exposed to, or has rights to, variable returns from its involvement with the entity and has the ability to affect those returns through its power over the entity. Subsidiaries are fully consolidated from the date on which control is transferred to the Bank. They are deconsolidated from the date that control ceases.
The Bank applies the acquisition method to account for business combinations. The consideration transferred for the acquisition of a subsidiary is the fair values of the assets transferred, the liabilities incurred to the former owners of the acquiree and the equity interests issued by the Bank. The consideration transferred includes the fair value of any asset or liability resulting from a contingent consideration arrangement. Identifiable assets
acquired and liabilities and contingent liabilities assumed in a business combination are measured initially at their fair values at the acquisition date. The Bank recognises any non-controlling interest in the acquiree on an acquisition-by-acquisition basis at fair value. However, non-controlling interests that present ownership interests and entitle their holders to a proportionate share of the entity’s net assets in the event of liquidation are recognised at either fair value or proportionate share of the recognised amounts of acquiree’s identifiable net assets.
Acquisition-related costs are expensed as incurred.
The excess of the consideration transferred, the amount of any non-controlling interest in the acquireeand the acquisition-date fair value of any previous equity interest in the acquiree over the fair value of the identifiable net assets acquired is recorded as goodwill. If the total of consideration transferred, non-controlling interest recognised and previously held interest measured is less than the fair value of the net assets of the subsidiary acquired in the case of a bargain purchase, the difference is recognised directly in profit or loss.
Inter-company transactions, balances and unrealised gains on transactions between group companies are eliminated. Unrealised losses are also eliminated. When necessary, amounts reported by subsidiaries have been adjusted to conform with the Bank’s accounting policies.
(b) Changes in ownership interests in subsidiaries without change of control
Transactions with non-controlling interests that do not result in loss of control are accounted for as equity transactions – that is, as transactions with owners in their capacity as owners. The difference between fair value of any consideration paid
All amounts are expressed in thousands of Ghana cedis unless otherwise stated[ ]
Notes To The Financial Statementsfor the year ended 31 December 2015 All amounts are expressed in thousands
of Ghana cedis unless otherwise stated[ ]

41
and the relevant share acquired of the carrying value of net assets of the subsidiary is recorded in equity. Gains or losses on disposals to non-controlling interests are also recorded in equity.
(c) Disposal of subsidiaries
When the Bank ceases to control, any retained interest in the entity is re-measured to its fair value at the date when control is lost, with the change in carrying amount recognised in profit or loss. The fair value is the initial carrying amount for the purposes of subsequently accounting for the retained interest as an associate, joint venture or financial asset. In addition, any amounts previously recognised in other comprehensive income in respect of that entity are accounted for as if the Bank had directly disposed of the related assets or liabilities. This may mean that amounts previously recognised in other comprehensive income are reclassified to profit or loss.
(d) Investment in associate
Associates are all entities over which the Bank has significant influence but not control, generally accompanying a shareholding of between 20% and 50% of the voting rights. Investments in associates are accounted for using the equity method of accounting. Under the equity method, the investment is initially recognised at cost, and the carrying amount is increased or decreased to recognise the investor’s share of profit or loss of the investee after the date of acquisition. The Bank’s investment in associates includes goodwill identified on acquisition.
If the ownership interest in an associate is reduced but significant influence is retained, only a proportionate share of the amounts previously recognised in other comprehensive income is reclassified to profit or loss where appropriate.The Bank’s share of post-acquisition
profit or loss is recognised in profit or loss, and its share of post-acquisition movements in other comprehensive income is recognised in other comprehensive income with a corresponding adjustment to the carrying amount of the investment. When the Bank’s share of losses in an associate equals or exceeds its interest in the associate, including any other unsecured receivables, the Bank does not recognise further losses, unless it has incurred legal or constructive obligations or made payments on behalf of the associate.
The Bank determines at each reporting date whether there is any objective evidence that the investment in the associate is impaired. If this is the case, the Bank calculates the amount of impairment as the difference between the recoverable amount of the associate and its carrying amount.
Profits and losses resulting from upstream and downstream transactions between the Bank and the associates are recognised in the Bank’s financial statements only to the extent of unrelated investor’s interests in the associates. Unrealised losses are eliminated unless the transaction provides evidence of an impairment of the asset transferred.
Dilution gains and losses arising in investments in associates are recognised in profit or loss.
2.3 Foreign currency translation
(a) Functional and presentation currency
Items included in the financial statements of each of the Group’s entities are measured using the currency of the primary economic environment in which the entity operates (`the functional currency’). The financial statements are presented in ‘Ghana cedi’ (GH¢), rounded to the nearest thousand.
(b) Transactions and balances
Foreign currency transactions are translated into the functional currency using the exchange rates prevailing at the dates of the transactions or valuation where items are re-measured. Foreign exchange gains and losses resulting from the settlement of such transactions and from the translation at year-end exchange rates of monetary assets and liabilities denominated in foreign currencies are recognised in profit or loss, except when deferred in other comprehensive income. Foreign exchange gains and losses that relate to borrowings and cash and cash equivalents are presented in profit or loss within `finance income or costs’. All other foreign exchange gains and losses are presented within `Other (losses)/gains – net’.
Changes in the fair value of monetary securities denominated in foreign currency classified as available-for-sale are analysed between translation differences resulting from changes in the amortised cost of the security and other changes in the carrying amount of the security. Translation differences related to changes in amortised cost are recognised in profit or loss, and other changes in carrying amount are recognised in other comprehensive income.
Translation differences on non-monetary financial assets and liabilities such as equities held at fair value through profit or loss are recognised in profit or loss as part of the fair value gain or loss. Translation differences on non-monetary financial assets, such as equities classified as available for sale, are included in other comprehensive income.
(c) Group companies
The results and financial position of all the Group entities (none of which has the currency of a hyper-inflationary economy) that have
All amounts are expressed in thousands of Ghana cedis unless otherwise stated[ ]
Notes To The Financial Statementsfor the year ended 31 December 2015 All amounts are expressed in thousands
of Ghana cedis unless otherwise stated[ ]
2015 Annual Report42
a functional currency different from the presentation currency are translated into the presentation currency as follows:
(i) assets and liabilities for each statement of financial position presented are translated at the closing rate at the reporting date;
(ii) income and expenses are translated at average exchange rates (unless this average is not a reasonable approximation of the cumulative effect of the rates prevailing on the transaction dates, in which case income and expenses are translated at the rate on the dates of the transactions); and
(iii) all resulting exchange differences are recognised in other comprehensive income.
2.4 Revenue recognition
Revenue is derived substantially from banking business and related activities and comprises net interest income and non-interest income. Income is recognised on an accrual basis in the period in which it accrues.
2.4.1 Interest and similar income and expense
For all financial instruments measured at amortised cost and interest bearing financial instruments classified as available-for-sale financial investments, interest income or expense is recorded on an accrual basis using the effective interest method. The effective interest rate is the rate that exactly discounts estimated future cash payments or receipts through the expected life of the financial instrument or a shorter period, where appropriate, to the net carrying amount of the financial asset or financial liability. The calculation takes into account all contractual terms of the financial instrument (for example, prepayment options) and includes any fees or incremental costs that are directly attributable to
the instrument and are an integral part of the effective interest rate, but not future credit losses. The carrying amount of the financial asset or financial liability is adjusted if the Bank revises its estimates of payment or receipts. The adjusted carrying amount is calculated on the original effective interest rate and the change in the carrying amount is recorded as interest income or expense.
2.4.2 Fee and commission income
The Bank earns fees and commission income from services it provides to its customers. Fee income is divided into the following two categories:
(a) Fee income earned from services provided over a certain period of time
Fees earned for the provision of services over a period of time are accrued over that period. These fees include commission income and asset management, custody and other management and advisory fees. Loan commitment fees for loans that are likely to be drawn down and other credit related fees are deferred (together with any incremental costs) and recognised as an adjustment to the effective interest rate on the loan.
(b) Fee income from providing transaction services
Fees arising from negotiating or participating in the negotiation of a transaction for a third party – such as the arrangement of the acquisition of shares or other securities or the purchase or sale of businesses – are recognised on completion of the underlying transaction. Fees or components of fees that are linked to a certain performance are recognised after fulfilling the corresponding criteria.
Fee and commission expense relates mainly to transaction and service fees which are expensed as the services are rendered.
2.4.3 Dividend income
Dividend income is recognised when the Bank’s right to receive the payment is established.
2.4.4 Net trading income
This comprises gains and losses from changes in fair value and related interest income or expense and dividends for financial assets and financial liabilities held for trading.
2.5 Financial assets and liabilities
2.5.1 Date of recognition
Purchases or sales of financial assets that require delivery of assets within the time frame generally established by regulation or convention in the marketplace are recognised on the trade date i.e. the date that the Bank commits to purchase or sell the asset.
2.5.2 Initial recognition of financial instruments
The Bank classifies its financial assets in the following categories: financial assets at fair value through profit or loss, loans and receivables, held-to-maturity and available-for-sale financial assets. The directors determine the classification of its financial assets at initial recognition. The Bank uses trade date accounting for regular way contracts when recording financial asset transactions.
The classification of financial instruments at initial recognition depends on the purpose for which the financial instruments were acquired and their characteristics. All financial instruments are measured initially at their fair value plus, in the case of financial assets and financial liabilities not at fair value through profit or loss, any directly attributable incremental costs of acquisition or issue.
43
(i) Financial assets and liabilities held for trading
Financial assets or financial liabilities held for trading other than derivatives are recorded in the consolidated statement of financial position at fair value. Changes in fair value are recognised in ‘Net trading income’ according to the terms of the contract or when the right to the payment has been established.Included in this classification are debt securities, equities and short position in debt securities which have been acquired principally for the purpose of selling or repurchasing in the future.
(ii) Held to maturity financial instruments
Held to maturity financial instruments are those which carry fixed determinable payments and have fixed maturities and which the Bank has the intention and ability to hold to maturity. After initial measurement, held-to-maturity financial investments are subsequently measured at amortised cost using the effective interest rate method, less allowances for impairment. Amortised cost is calculated by taking into account any discount or premium on acquisition and fees that are an integral part of the effective interest rate. The amortisation is included in ‘interest income’ in the consolidated statement of comprehensive income. The losses arising from impairment of such investments are recognised in the consolidated statement of comprehensive income line ‘Impairment losses on financial investments’. (iii) Loans and advances
Loans and advances are financial assets with fixed or determinable payments and fixed maturities that are not quoted in an active market. These are not entered into with the intention of immediate or short-term resale and are not classified as ‘Financial assets held
for trading’, designated as ‘Financial investments – available-for-sale’ or ‘Financial assets designated at fair value through profit or loss’. After initial measurement, loans and advances are subsequently measured at amortised cost using the effective interest rate method, less allowance for impairment. The amortised cost is calculated by taking into account any discount on acquisition and fees and costs that are integral part of the effective interest rate. The amortisation is included in ‘Interest income’ in the consolidated statement of comprehensive income. The losses arising from impairment are recognised in the consolidated statement of comprehensive income in ‘Impairment charge on loans and advances’.
(iv) Available for sale financial investments
Available-for-sale financial investments are those which are designated as such or do not qualify to be classified as designated at fair value through profit or loss, held-to-maturity or loans and advances. It includes equity investments, investments in mutual funds and money market and other debt instruments.After initial measurement, available-for-sale financial investments are subsequently measured at fair value. Unrealised gains and losses are recognised directly in equity in the ‘Available-for-sale reserve’. When the security is disposed of, the cumulative gain or loss previously recognised in equity is recognised in the consolidated statement of comprehensive income in ‘Other operating income’ or ‘Other operating expenses’.
Where the Bank holds more than one investment in the same security, it is deemed to be disposed off on a first-in first-out basis. Interest earned, whilst holding available-for-sale financial investments, is recognised in the consolidated statement of comprehensive income as ‘Interest income’ when
the right of the payment has been established. The losses arising from impairment of such investments are recognised in the consolidated statement of comprehensive income in ‘Impairment losses on financial investments’ and removed from the available-for-sale reserve.
(v) Financial liabilities
The Bank’s holding in financial liabilities represents mainly deposits from banks and customers, and other liabilities. Such financial liabilities are initially recognised at fair value and subsequently measured at amortised cost.
2.5.3 Determination of fair value
For financial instruments traded in active markets, the determination of fair values of financial instruments is based on quoted market prices or dealer price quotations. This includes listed equity securities and quoted debt instruments on major exchanges.
A financial instrument is regarded as quoted in an active market if quoted prices are readily and regularly available from an exchange, dealer, broker, industry group, pricing service or regulatory agency, and those prices represent actual and regularly occurring market transactions on an arm’s length basis. If the above criteria are not met, the market is regarded as being inactive. Indicators that a market is inactive are when there is a wide bid-offer spread or significant increase in the bid-offer spread or there are few recent transactions.
For all other financial instruments, fair value is determined using valuation techniques. In these techniques, fair values are estimated from observable data in respect of similar financial instruments, using models to estimate the present value of expected future cash flows or other valuation techniques, using inputs

All amounts are expressed in thousands of Ghana cedis unless otherwise stated[ ]
Notes To The Financial Statementsfor the year ended 31 December 2015 All amounts are expressed in thousands
of Ghana cedis unless otherwise stated[ ]
2015 Annual Report44
(for example, LIBOR yield curve, FX rates, volatilities and counterparty spreads) existing at the reporting dates.
The Bank uses widely recognised valuation models for determining fair values of non-standardised financial instruments of lower complexity, such as options or interest rate and currency swaps. For these financial instruments, inputs into models are generally market-observable.
For more complex instruments, the Bank uses internally developed models, which are usually based on valuation methods and techniques generally recognised as standard within the industry. Valuation models such as present value techniques are used primarily to value derivatives transacted in the over-the-counter market, unlisted debt securities (including those with embedded derivatives) and other debt instruments for which markets were or have become illiquid. Some of the inputs to these models may not be market observable and are therefore estimated based on assumptions.
The Bank uses its own credit risk spreads in determining the current value for its derivative liabilities and all other liabilities for which it has elected the fair value option. When the Bank’s credit spreads widen, the Bank recognises a gain on these liabilities because the value of the liabilities has decreased. When the Bank’s credit spreads narrow, the Bank recognises a loss on these liabilities because the value of the liabilities has increased.
The output of a model is always an estimate or approximation of a value that cannot be determined with certainty, and valuation techniques employed may not fully reflect all factors relevant to the positions the Bank holds. Valuations are therefore adjusted, where appropriate, to allow for additional factors including model risks, liquidity risk and counterparty credit risk. Based on the established fair value
model governance policies, related controls and procedures applied, the directors believe that these valuation adjustments are necessary and appropriate to fairly state the values of financial instruments carried at fair value. Price data and parameters used in the measurement procedures applied are generally reviewed carefully and adjusted, if necessary – particularly in view of the current market developments.
In cases when the fair value of unlisted equity instruments cannot be determined reliably, the instruments are carried at cost less impairment.
The fair values of contingent liabilities and irrevocable loan commitments correspond to their carrying amounts.
2.5.4 De-recognition of financial assets and financial liabilities
(i) Financial assets
A financial asset (or, where applicable a part of a financial asset or part of a group of similar financial assets) is derecognised where:
• the rights to receive cash flows from the asset have expired; or
• the Bank has transferred its rights to receive cash flows from the asset or has assumed an obligation to pay the received cash flows in full without material delay to a third party under a ‘pass-through’ arrangement; and
• either (a) the Bank has transferred substantially all the risks and rewards of the asset, or (b) the Bank has neither transferred nor retained substantially all the risks and rewards of the asset, but has transferred control of the asset.
When the Bank has transferred its right to receive cash flows from an asset or has entered into a pass-through arrangement, and has neither transferred nor retained substantially all the risks and rewards
of the asset, nor transferred control of the asset, the asset is recognised to the extent of the Bank’s continuing involvement in the asset. Continuing involvement that takes the form of a guarantee over the transferred asset is measured at the lower of the original carrying amount of the asset and the maximum amount of consideration that the Bank could be required to repay.
(ii) Financial liabilities
A financial liability is derecognised when the obligation under the liability is discharged or cancelled or expires. Where an existing financial liability is replaced by another from the same lender on substantially different terms, or the terms of an existing liability are substantially modified, such an exchange or modification is treated as a de-recognition of the original liability and the recognition of a new liability, and the difference in the respective carrying amounts is recognised in profit or loss. 2.5.5 Reclassification of financial assets
The Bank may choose to reclassify a non-derivative financial asset held for trading out of the held-for-trading category if the financial asset is no longer held for the purpose of selling it in the near-term. Financial assets other than loans and receivables are permitted to be reclassified out of the held for trading category only in rare circumstances arising from a single event that is unusual and highly unlikely to recur in the near-term. In addition, the Bank may choose to reclassify financial assets that would meet the definition of loans and receivables out of the held-for-trading or available-for-sale categories if the Bank has the intention and ability to hold these financial assets for the foreseeable future or until maturity at the date of reclassification.Reclassifications are made at fair

45
value as of the reclassification date. Fair value becomes the new cost or amortised cost as applicable, and no reversals of fair value gains or losses recorded before reclassification date are subsequently made. Effective interest rates for financial assets reclassified to loans and receivables and held-to-maturity categories are determined at the reclassification date. Further increases in estimates of cash flows adjust effective interest rates prospectively.
On reclassification of a financial asset out of the ‘at fair value through profit or loss’ category, all embedded derivatives are re-assessed, and if necessary separately accounted for.
2.5.6 Repurchase and reverse repurchase agreements
Securities may be lent subject to a commitment to repurchase it at a specified date (‘a repo’). Such securities are not derecognised but retained on the statement of financial position when substantially all the risks and rewards of ownership remain with the Bank. Any cash received, including accrued interest, is recognised on the balance sheet reflecting its economic substance as a loan to the Bank.
Conversely, securities borrowed or purchased securities subject to a commitment to resell at a specified date (a ‘reverse repo’) is not recognised on the consolidated statement of financial position as the transactions are treated as collateralised loans. However where the securities borrowed is sold to third parties, the obligation to repurchase the securities is recorded as a trading liability at fair value and any subsequent gain or loss included in net trading income. 2.5.7 Impairment of financial assets
The Bank assesses at each balance sheet date whether objective evidence of impairment exists for any financial asset. A financial assets is deemed to be impaired if there is
objective evidence of impairment as a result of one or more events that has occurred after the initial recognition of the asset (loss event), and the loss event has an impact on the estimated future cash flows of the financial asset that can be reliably estimated. Evidence of impairment may include indications that the borrower is experiencing significant difficulty, default or delinquency in interest or principal payments, the probability that it will enter bankruptcy or other financial reorganisation and where observable data indicate that there is a measurable decrease in the estimated future cash flows, such as changes in arrears or economic conditions that correlate with defaults.
(i) Due from banks and loans and advances to customers
For amounts due from banks and loans and advances to customers carried at amortised cost, the Bank first assesses whether objective evidence of impairment exists individually for financial assets that are individually significant, and individually or collectively for financial assets that are not individually significant (identified impairment). If the Bank determines that no objective evidence of impairment exists for an individually assessed financial asset, whether significant or not, it includes the asset in a group of financial assets with similar credit risk characteristics and collectively assesses them for impairment (unidentified impairment). Assets that are individually assessed for impairment and for which an impairment loss is or continues to be recognised are not included in a collective assessment of impairment.
Where there is objective evidence of impairment, the amount of impairment loss is measured as the difference between the asset’s carrying amount and the present value of estimated future cash flows discounted at the asset’s original effective interest rate. The carrying amount of the asset is reduced
through the use of an allowance account and the amount of the loss is recognised in the consolidated statement of comprehensive income.
If a loan has a variable interest rate, the discount rate for measuring impairment loss is the current effective interest rate. The calculation of the present value of the estimated future cash flows of a collateralised financial asset reflect the cash flows that may result from foreclosure costs for obtaining and selling the collateral, whether or not foreclosure is probable.
For the purposes of a collective evaluation of impairment, financial assets are grouped on the basis of similar risk characteristics, taking into account asset type, industry, geographical location, collateral type, past-due status and other relevant factors. These characteristics are relevant to the estimation of future cash flows for groups of such assets by being indicative of the counterparty’s ability to pay all amounts due according to the contractual terms of the assets being evaluated.
Future cash flows in a group of financial assets that are collectively evaluated for impairment are estimated on the basis of the contractual cash flows of the assets in the Bank and historical loss experience for assets with credit risk characteristics similar to those in the Bank. Historical loss experience is adjusted based on current observable data to reflect the effects of current conditions that did not affect the period on which the historical loss experience is based and to remove the effects of conditions in the historical period that do not currently exist. The methodology and assumptions used for estimating future cash flows are reviewed regularly to reduce any differences between loss estimates and actual loss experience.
Where possible, the Bank seeks to restructure loans rather than to take possession of collateral. This may involve extending the payment
All amounts are expressed in thousands of Ghana cedis unless otherwise stated[ ]
Notes To The Financial Statementsfor the year ended 31 December 2015 All amounts are expressed in thousands
of Ghana cedis unless otherwise stated[ ]
2015 Annual Report46
arrangements and the agreement of new loan conditions. Once the terms have been renegotiated, the loan is no longer considered past due. Management continuously reviews such renegotiated loans to ensure that all criteria are met and that future payments are likely to occur. The loans continue to be subject to an individual or collective assessment, calculated using the loan’s original effective interest rate.
(ii) Held-to-maturity financial instruments
For held-to-maturity instruments the Bank assesses individually whether there is objective evidence of impairment. If there is objective evidence that an impairment loss has been incurred, the amount of the loss is measured as the difference between the asset’s carrying amount and the present value of estimated future cash flows. The carrying amount of the asset is reduced and the amount of the loss is recognised in the consolidated statement of comprehensive income.
If in a subsequent year the amount of the estimated impairment loss decreases because of an event occurring after the impairment was recognised, any amounts formerly charged are credited to the ‘Impairment losses on financial investments’.
(iii) Available-for-sale financial instruments
For avai lable-for-sale financial instruments, the Bank assesses at each balance sheet date whether there is objective evidence that an investment or a group of investments is impaired.
In the case of equity instruments classified as available for sale, a significant or prolonged decline in the fair value of the security below its cost is considered objective evidence in determining whether impairment exists. Where such evidence exists, the cumulative net loss that has
been previously recognised directly in equity is removed from equity and recognised in the consolidated statement of comprehensive income. Reversals of impairment of equity shares are not recognised in the consolidated statement of comprehensive income. Increases in the fair value of equity shares after impairment are recognised directly in equity. In the case of debt instruments classified as available for sale, impairment is assessed based on the same criteria as all other financial assets. Interest continues to be accrued at the original effective interest rate on the reduced carrying amount of the asset and is recorded as part of Interest Income. Reversals of impairment of debt securities are recognised in the consolidated statement of comprehensive income if in a subsequent year, the fair value of the debt instrument increases and the increase can be objectively related to an event occurring after the impairment loss was recognised in the consolidated statement of comprehensive income.
2.5.8 Offsetting financial instruments
Netting, where financial assets and liabilities are offset and the net amount reported in the consolidated statement of financial position, occurs if, and only if, there is a legally enforceable right to set off the recognised amounts and there is an intention to settle on a net basis, or to realise an asset and settle the liability simultaneously. In many cases, even though master netting agreements are in place, the lack of an intention to settle on a net basis results in the related assets and liabilities being presented gross in the consolidated statement of financial position.
2.6 Collateral
The Bank obtains collateral in respect of customer liabilities where this is considered appropriate. The collateral normally takes the form
of cash or securities in respect of other credit instruments or a lien over the customer’s assets and gives the Bank a claim on these assets for both existing and future liabilities. Collateral received in the form of securities is not recorded on the consolidated statement of financial position. Collateral received in the form of cash is recorded on the consolidated statement of financial position with a corresponding liability. These items are assigned to deposits received from bank or other counterparties. Any interest payable or receivable arising is recorded as interest payable or interest income respectively except for funding costs relating to trading activities which are recorded in net trading income.
2.7 Leases
The determination of whether an arrangement is, or contains a lease is based on the substance of the arrangement and requires an assessment of whether the fulfilment of the arrangement is dependent on the use of a specific asset or assets and the arrangement conveys a right to use the asset.
(i) The Bank as a lessor
Finance leases
Assets leased to customers under agreements, which transfer substantially all the risks, and rewards of ownership, with or without ultimate legal title, are classified as finance leases. When assets are held subject to a finance lease, the present value of the lease payments, discounted at the rate of interest implicit in the lease, is recognised as a receivable. The difference between the total payments receivable under the lease and the present value of the receivable is recognised as unearned finance income, which is allocated to accounting periods under the pre-tax net investment method to reflect a constant periodic rate of return.

47
Operating leases
Assets leased to customers under agreements, which do not transfer substantially all the risks and rewards of ownership, are classified as operating leases. The leased assets are included within property, plant and equipment on the Bank’s statement of financial position and depreciation is provided on the depreciable amount of these assets on a systematic basis over their estimated useful lives. Lease income is recognised on a straight line basis over the period of the lease unless another systematic basis is more appropriate.
(ii) The Bank as a Lessee
Finance leases which transfer to the Bank substantially all the risks and benefits incidental to ownership of the leased item, are capitalised at the inception of the lease at the fair value of the leased property or, if lower, at the present value of the minimum lease payments and included in ‘Property and equipment’ with corresponding liability to the lessor included in ‘Other liability’. Lease payments are apportioned between the finance charges and reduction on the lease liability so as to achieve a constant rate of interest on the remaining balance of the liability. Finance charges are charged directly against income in ‘Interest expense’.
Capitalised leased assets are depreciated over the shorter of the estimated useful life of the asset and the lease term, if there is no reasonable certainty that the Bank will obtain ownership by the end of the lease term.
Operating lease payments are not recognised in the consolidated statement of financial position. Rentals payable are recognised as an expense in the consolidated statement of comprehensive income on a straight-line basis over the lease term unless another systematic basis is more appropriate, and included in ‘Other operating expenses’.
2.8 Cash and cash equivalents
Cash and cash equivalents include cash in hand, deposits held at call with banks and other short-term highly liquid investments with original maturities of three months or less. For the purpose of the cash flow statement cash and cash equivalents comprise balances with 91 days or less from the date of acquisition including cash and balances with Bank of Ghana, treasury bills and other eligible bills and amounts due from other banks and dealing securities.
2.9 Property and equipment
Recognition and measurement
Items of property and equipment are measured at cost less accumulated depreciation and impairment losses. Cost includes expenditures that are directly attributable to the acquisition of the asset. The cost of self-constructed assets includes the cost of materials, direct labour and any other costs directly attributable to bringing the asset to a working condition for its intended use. Purchased software that is integral to the functionality of the related equipment is capitalised as part of that equipment.
When parts of an item of property or equipment have different useful lives, they are accounted for as separate items (major components) of property and equipment.
Subsequent costs
The cost of replacing part of an item of property or equipment is recognised in the carrying amount of the item if it is probable that the future economic benefits embodied within the part will flow to the Bank and its cost can be measured reliably. The costs of the day-to-day servicing of property and equipment
are recognised in profit or loss as incurred.
Depreciation
Depreciation is charged to profit or loss on a straight-line basis to write down the cost of each asset, to their residual values over the estimated useful lives of each part of an item of property and equipment. Leased assets are depreciated over the shorter of ten years, the lease term and their useful lives. Depreciation begins when an asset is available for use and ceases at the earlier of the date that the asset is derecognised or classified as held for sale in accordance with IFRS 5.
The estimated useful lives for the current and corresponding periods are as follows:
Depreciation methods, useful lives and residual values are re-assessed at each reporting date.
De-recognition
An item of property and equipment is derecognised on disposal or when no future economic benefits are expected from its use or disposal. Any gain or loss arising on de-recognition of the asset (calculated as the difference between the net disposal proceeds and the carrying amount of the asset) is included in the profit or loss in the year the asset is derecognised.
Leasehold buildings and improvements
Motor vehicles
Computers : hardware
Furniture and equipment
Machinery
shorter of 10 years and the unexpired lease period
4 years
4 years
4 years
4 years

All amounts are expressed in thousands of Ghana cedis unless otherwise stated[ ]
Notes To The Financial Statementsfor the year ended 31 December 2015 All amounts are expressed in thousands
of Ghana cedis unless otherwise stated[ ]
2015 Annual Report48
2.10 Intangible assets
(a) Computer software
Costs associated with maintaining computer software programmes are recognised as an expense as incurred. Development costs that are directly attributable to the design and testing of identifiable and unique software products controlled by the Group are recognised as intangible assets when the following criteria are met:
• it is technically feasible to complete the software product so that it will be available for use;
• management intends to complete the software product and use or sell it;
• there is an ability to use or sell the software product;
• it can be demonstrated how the software product will generate probable future economic benefits;
• adequate technical, financial and other resources to complete the development and to use or sell the software product are available; and
• the expenditure attributable to the software product during its development can be reliably measured.
Directly attributable costs that are capitalised as part of the software product include the software development employee costs and an appropriate portion of relevant overheads.
Other development expenditure that do not meet these criteria are recognised as an expense as incurred. Development costs previously recognised as an expense are not recognised as an asset in a subsequent period.
Computer software development costs recognised as assets are amortised over their estimated useful lives, which does not exceed four years.
(b) Goodwill
Goodwill arises on the acquisition of subsidiaries and represents the excess of theconsideration transferred, the amount of any non-controlling interest in the acquireeand the acquisition-date fair value of any previous equity interest in the acquireeover the fair value of the identifiable net assets acquired. If the total of consideration transferred, non-controlling interest recognised and previously held interestmeasured at fair value is less than the fair value of the net assets of the subsidiaryacquired, in the case of a bargain purchase, the difference is recognised directly inthe income statement.
For the purpose of impairment testing, goodwill acquired in a business combinationis allocated to each of the cash-generating units (CGUs), or groups of CGUs, that is expected to benefitfrom the synergies of the combination. Each unit or group of units to which thegoodwill is allocated represents the lowest level within the entity at which thegoodwill is monitored for internal management purposes. Goodwill is monitored atthe operating segment level.
Goodwill impairment reviews are undertaken annually or more frequently if eventsor changes in circumstances indicate a potential impairment. The carrying value ofthe CGU containing the goodwill is compared to the recoverable amount, which isthe higher of value in use and the fair value less costs of disposal. Any impairment isrecognised immediately as an expense and is not subsequently reversed.
2.11 Non-current assets held for sale
Non-current assets are classified as assets held for sale when their carrying amount is to be recovered principally through a sale transaction and a sale is considered highly probable. They are stated at the lower of carrying amount and fair value less costs to sell.
2.12 Financial guarantees
In the ordinary course of business, the Bank gives financial guarantees consisting of letters of credit, guarantees and acceptances. Such financial guarantees are given to banks, other financial institutions and bodies on behalf of customers to secure loans, overdrafts and other banking facilities, and to other parties in connection with the performance of customers under obligations related to contracts, advance payments made by other parties, tenders, retentions and payment of import duties. These financial guarantees are accounted for as off-balance sheet transactions and disclosed as contingent liabilities.
The fee and commission income receivable on these financial guarantees are initially recognised in the financial statements at fair value on the date that the guarantee was given, in ‘Other liabilities’ and recognised in the consolidated statement of comprehensive income in ‘Fees and commission income’ on a straight line basis over the life of the guarantee.
2.13 Provisions
A provision is recognised if, as a result of a past event, the Bank has a present legal or constructive obligation that can be estimated reliably, and it is probable that an outflow of economic benefits will be required to settle the obligation. Provisions are determined by discounting the expected future cash flows at a pre-tax rate that reflects current market assessments of the time value of money and, where appropriate, the risks specific to the liability.
A provision for onerous contracts is recognised when the expected benefits to be derived by the Bank from a contract are lower than the unavoidable cost of meeting its obligations under the contract. The provision is measured at the present

49
value of the lower of the expected cost of terminating the contract and the expected net cost of continuing with the contract. Before a provision is established, the Bank recognises any impairment loss on the assets associated with that contract.
2.14 Borrowings
Borrowings are recognised initially at fair value, net of transaction costs incurred. Borrowings are subsequently carried at amortised cost; any difference between the proceeds (net of transaction costs) and the redemption value is recognised in profit or loss over the period of the borrowings using the effective interest method. Fees paid on the establishment of loan facilities are recognised as transaction costs of the loan to the extent that it is probable that some or all of the facility will be drawn down. In this case, the fee is deferred until the draw-down occurs. To the extent there is no evidence that it is probable that some or all of the facility will be drawn down, the fee is capitalised as a pre-payment for liquidity services and amortised over the period of the facility to which it relates.
2.15 Employee benefits
i. Defined contribution plans
Obligations for contributions to defined contribution plans are recognised as an expense in profit or loss when they are due.
ii. Termination benefits
Termination benefits are recognised as an expense when the Bank is demonstrably committed, without realistic possibility of withdrawal, to a formal detailed plan to terminate employment before the normal retirement date. Termination benefits for voluntary redundancies are recognised if the Bank has made an offer encouraging voluntary redundancy, it is probable that the offer will be accepted, and the
number of acceptances can be estimated reliably.
iii. Short-term benefits
Short-term employee benefit obligations are measured on an undiscounted basis and are expensed as the related service is provided.
A provision is recognised for the amount expected to be paid under short-term cash bonus or profit-sharing plans if the Bank has a present legal or constructive obligation to pay this amount as a result of past service provided by the employee and the obligation can be estimated reliably. 2.16 Income tax
Current income tax
Income tax payable on taxable profits is recognised as an expense in the period in which the profits arise. Income tax recoverable on tax allowable losses is recognised as an asset only to the extent that it is regarded as recoverable by offset against current or future taxable profits.
Current tax assets and liabilities for the current and prior years are measured at the amount expected to be recovered or paid to the Ghana Revenue Authority. The tax rates and tax laws used to compute the amount are those that are enacted or substantively enacted by the statement of financial position date.
Deferred income tax
Deferred tax is provided on temporary differences at the reporting date between the tax bases of assets and liabilities and their carrying amounts for financial reporting purposes.Deferred tax liabilities are recognised for all taxable temporary differences, except:
• where the deferred tax liability arises from the initial recognition of
goodwill or of an asset or liability in a transaction that is not a business combination and, at the time of the transaction, affects neither the accounting profit nor taxable profit or loss and
• in respect of taxable temporary differences associated with investments in subsidiaries and associates, where the timing of the reversal of the temporary differences can be controlled and it is probable that the differences will not reverse in the foreseeable future.
Deferred tax assets are recognised for all deductible temporary differences, carry forward of unused tax credits and unused tax losses to the extent that it is probable that taxable profits will be available against which the deductible temporary differences and the carry forward of unused tax credits and unused tax losses can be utilised except;
• where deferred tax asset relating to the deductible temporary differences arises from the initial recognition of an asset or liability in a transaction that is not a business combination and, at the time of the transaction, affects neither the accounting profit nor taxable profit or loss; and
• in respect of taxable temporary differences associated with investments in subsidiaries and associates, deferred tax assets are recognised only to the extent that it is probable that the temporary differences will reverse in the foreseeable future and taxable profit will be available against which the temporary differences can be utilised.
The carrying amount of deferred tax assets is reviewed at each reporting date and reduced to the extent that it is no longer probable that sufficient taxable profit will be available to allow all or part of the deferred tax asset to be utilised. Unrecognised deferred tax assets are reassessed at each reporting date and recognised to the extent that it has become

All amounts are expressed in thousands of Ghana cedis unless otherwise stated[ ]
Notes To The Financial Statementsfor the year ended 31 December 2015 All amounts are expressed in thousands
of Ghana cedis unless otherwise stated[ ]
2015 Annual Report50
probable that future taxable profit will allow the deferred tax asset to be recovered.
Deferred tax assets and liabilities are measured at the tax rates that are expected to apply in the year when the asset is realised or the liability is settled, based on the tax rates (and tax laws) that have been enacted or substantively enacted at the reporting date.
Current tax and deferred tax relating to items recognised directly in equity are also recognised in the statement of changes in equity and not in the statement of comprehensive income.
Deferred and current tax assets and liabilities are only offset when they arise in the same tax reporting entity and the same taxation authority, and where there is both the legal right to set off current tax assets against current tax liabilities and the intention to settle on a net basis or to realise the asset and settle the liability simultaneously.
2.17 Stated capital
i. Ordinary shares Ordinary shares are classified as ‘stated capital’ in equity.
ii. Dividend on ordinary shares Dividends on the Bank’s ordinary shares are recognised in equity in the period in which they are paid or, if earlier, approved by the Bank’s shareholders.
2.18 Preference shares
i. Preference shares Preference shares are classified as equity. These are non-voting, irredeemable and non-cumulative. The holders have the option of converting into ordinary shares as stated in the agreement.
ii. Dividend on preference shares Dividends on the Bank’s preference shares are recognised in equity in the period in which they are paid.
3. FINANCIAL RISK MANAGEMENT
(a) Introduction and overview
The Bank’s business involves taking on risks in a targeted manner and managing them professionally. The core functions of the Bank’s risk management are to identify all key risks for the Bank, measure these risks, manage the risk positions and determine capital allocations. The Bank regularly reviews its risk management policies and systems to reflect changes in markets, products and best market practice. The Bank’s aim is to achieve an appropriate balance between risk and return and minimise potential adverse effects on the Bank’s financial performance. The Bank defines risk as the possibility of losses or profits foregone, which may be caused by internal or external factors.
(b) Risk management structure
The Board of Directors has overall responsibility for the establishment and oversight of the Bank’s risk management framework. Under this framework, the Board has established a number of separate independent bodies responsible for managing and monitoring risks. These include, Board sub-committees, Credit Committee of management (CC), Management Risk and Control Committee (MRCC), Asset and Liability Management Committee (ALCO) and Risk Management Department, which are responsible for developing and monitoring the Bank’s risk management policies in their specified areas. All Board committees report regularly to the Board of Directors on their activities.
The Bank’s risk management policies are established to identify and analyse the risks faced by the Bank, to set appropriate risk limits and controls, and to monitor risks and adherence to limits. Risk management policies and systems are reviewed regularly to reflect changes in market conditions, products and services offered. The Bank, through its
training and management standards and procedures, aims to develop a disciplined and constructive control environment, in which all employees understand their roles and obligations.
Through its risk management structure, the Bank seeks to manage efficiently the core risks to which it is exposed: credit, liquidity and market risks, which arise directly through the Bank’s commercial activities; and compliance, regulatory, and operational risks, which are normal consequences of any business undertaking.
3.1 Credit risk management
Credit risk is the risk of suffering financial loss, should any of the Bank’s customers, clients or market counterparties fail to fulfil their contractual obligations to the Bank. Credit risk arises mainly from commercial and consumer loans and advances and loan commitments arising from such lending activities, but can also arise from credit enhancements, financial guarantees, letters of credit, endorsements and acceptances.
The Bank is also exposed to other credit risks arising from investments in debt securities and other exposures arising from its trading activities (‘trading exposures’), including non-equity trading portfolio assets, derivatives and settlement balances with market counterparties and reverse repurchase loans. Credit risk is the single largest risk for the Bank’s business; the directors therefore carefully manage the exposure to credit risk. The credit risk management and control are centralised in a credit risk management team headed by the Chief Risk Officer, which reports to the Board of Directors and head of each business unit regularly.
The Bank has well documented policies and procedures for managing credit risk. The policies
51
are based on the principle of: Management responsibility; Defined credit approval authorities; Set standards for risk management; Consistent approach to origination of credit, documentation and problem recognition; and Portfolio management strategies.
The risk that counterparties might default on their obligations is monitored on an ongoing basis. To manage the level of credit risk, the bank deals with counterparties of good credit standing and for which in its assessment the transactions are appropriate and risks understood by the counterparty.
3.1.1 Risk limit control and mitigation policies
The Bank structures the levels of credit risk it undertakes by placing limits on the amount of risk accepted in relation to one borrower, or groups of borrowers, and to geographical and industry segments. Such risks are monitored on a revolving basis and subject to an annual or more frequent review, when considered necessary. Limits on the level of credit risk by product, industry sector and country are approved annually by the Board of Directors.
The exposure to any one borrower including banks and brokers is further restricted by sub-limits covering on- and off-balance sheet exposures, and daily delivery risk limits in relation to trading items such as forward foreign exchange contracts. Actual exposures against limits are monitored daily.
Lending limits are reviewed in the light of changing market and economic conditions and periodic credit reviews and assessments of probability of default.
Some other specific control and mitigation measures are outlined below:
(a) Collateral
The Bank employs a range of policies and practices to mitigate credit risk. The most traditional of these is the taking of security for funds advanced, which is common practice. The Bank implements guidelines on the acceptability of specific classes of collateral or credit risk mitigation. The principal collateral types for loans and advances are:
• Mortgages over residential properties.
• Charges over business assets such as premises, inventory and accounts receivable.
• Charges over financial instruments such as debt securities and equities.
Collateral held as security for financial assets other than loans and advances depends on the nature of the instrument.
Longer-term finance and lending to corporate entities are generally secured; revolving individual credit facilities are generally unsecured. In addition, in order to minimise the credit loss, the Bank will seek
additional collateral from the counterparty as soon as impairment indicators are identified for the relevant individual loans and advances.
(b) Lending limits (for derivatives and loan books)
The Bank maintains strict control limits on net open derivative positions (that is, the difference between purchase and sale contracts) by both amount and term. The amount subject to credit risk is limited to expected future net cash inflows of instruments, which in relation to derivatives are only a fraction of the contract, or notional values used to express the volume of instruments outstanding. This credit risk exposure is managed as part of the overall lending limits with customers, together with potential exposures from market movements. Collateral or other security is not always obtained for credit risk exposures on these instruments, except where the Bank requires margin deposits from counterparties.
Settlement risk arises in any situation where a payment in cash, securities or equities is made in the expectation of a corresponding receipt in cash, securities or equities. Daily settlement limits are established for each counterparty to cover the aggregate of all settlement risk arising from the Bank’s market transactions on any single day.
All amounts are expressed in thousands of Ghana cedis unless otherwise stated[ ]
Notes To The Financial Statementsfor the year ended 31 December 2015 All amounts are expressed in thousands
of Ghana cedis unless otherwise stated[ ]
2015 Annual Report52
(c) Master netting arrangements
The Bank further restricts its exposure to credit losses by entering into master netting arrangements with counterparties with which it undertakes a significant volume of transactions. Master netting arrangements do not generally result in an offset of assets and liabilities of the statement of financial position, as transactions are either usually settled on a gross basis or under most netting agreements the right of set off is triggered only on default. However, the credit risk associated with favourable contracts is reduced by a master netting arrangement to the extent that if a default occurs, all amounts with the counterparty are terminated and settled on a net basis. The Bank’s overall exposure to credit risk on derivative instruments subject to master netting arrangements can change substantially within a short period, as it is affected by each transaction subject to the arrangement.
(d) Financial covenants (for credit related commitments and loan books)
The primary purpose of these instruments is to ensure that funds are available to a customer as required. Guarantees and standby letters of credit carry the same credit risk as loans. Documentary and commercial letters of credit – which are written undertakings by the Bank on behalf of a customer authorising a third party to draw drafts on the Bank up to a stipulated amount under specific terms and conditions – are collateralised by the underlying shipments of goods to which they
relate and therefore carry less risk than a direct loan.
Commitments to extend credit represent unused portions of authorisations to extend credit in the form of loans, guarantees or letters of credit. With respect to credit risk on commitments to extend credit, the Bank is potentially exposed to loss in an amount equal to the total unused commitments. However, the likely amount of loss is less than the total unused commitments, as most commitments to extend credit are contingent upon customers maintaining specific credit standards (often referred to as financial covenants).
The Bank monitors the term to maturity of credit commitments because longer-term commitments generally have a greater degree of credit risk than shorter-term commitments. (e) Impairment and provisioning policies
Loans are designated as impaired and considered non-performing where recognised weakness indicates that full payment of either interest or principal becomes questionable or as soon as payment of interest or principal is 90 days or more overdue. Where any amount is considered uncollectible, an individual impairment provision is raised, being the difference between the loan carrying amount and the present value of estimated future cash flows. In any decision relating to the raising of provisions, the bank attempts to balance economic conditions, local
knowledge and experience, and the results of independent asset reviews. Where it is considered that there is no realistic prospect of recovering an element of an account against which an impairment provision has been raised, then that amount will be written off.
A portfolio impairment provision is also held to cover the inherent risk of losses, which, although not identified, are known through experience to be present in the loan portfolio. The provision is estimated by using the historical loss rate, the migration or incident rate and the balance of the performing loan portfolio. The portfolio impairment provision is set with reference to past experience using loss rates, and judgmental factors such as the economic environment and the trends in key portfolio indicators.
(f) Write-off policy
The Bank writes off a loan balance (and any related allowances for impairment losses) when the Bank determines that the loans are uncollectible. This determination is reached after considering information such as the occurrence of significant changes in the borrower’s financial position such that the borrower can no longer pay the obligation, or that proceeds from collateral will not be sufficient to pay back the entire exposure.
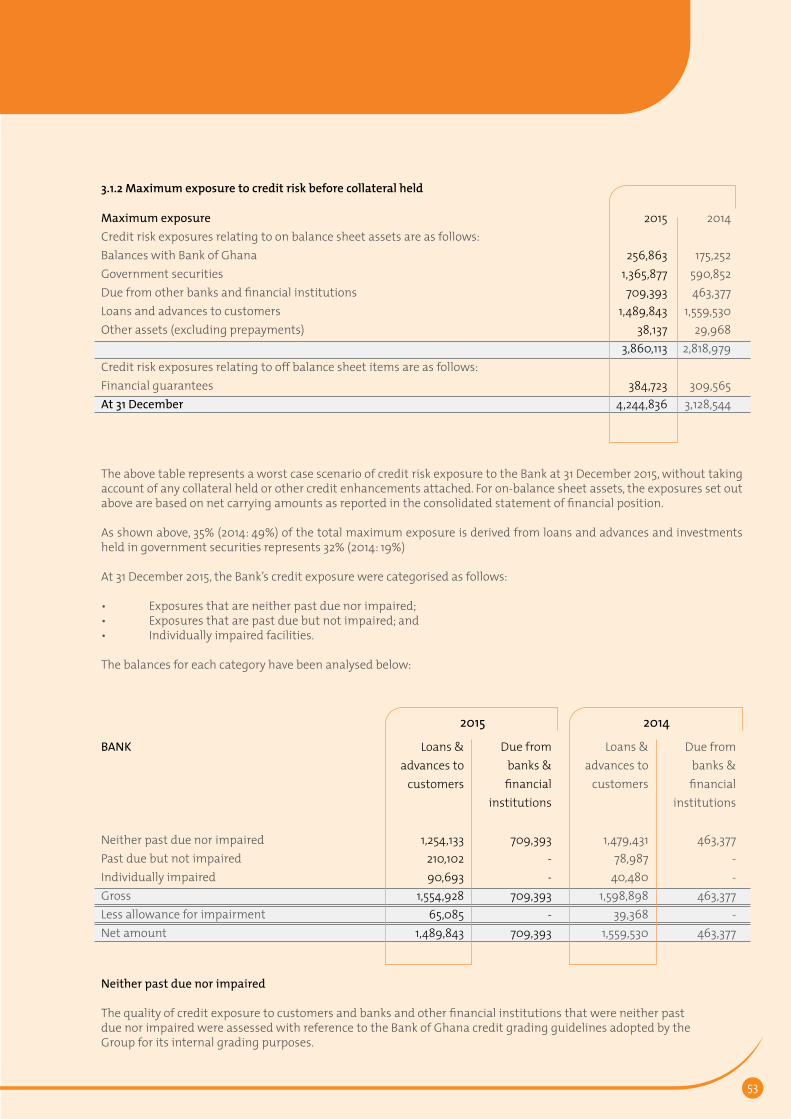
53
3.1.2 Maximum exposure to credit risk before collateral held
The above table represents a worst case scenario of credit risk exposure to the Bank at 31 December 2015, without taking account of any collateral held or other credit enhancements attached. For on-balance sheet assets, the exposures set out above are based on net carrying amounts as reported in the consolidated statement of financial position.
As shown above, 35% (2014: 49%) of the total maximum exposure is derived from loans and advances and investments held in government securities represents 32% (2014: 19%)
At 31 December 2015, the Bank’s credit exposure were categorised as follows:
• Exposures that are neither past due nor impaired;• Exposures that are past due but not impaired; and• Individually impaired facilities.
The balances for each category have been analysed below:
Neither past due nor impaired
The quality of credit exposure to customers and banks and other financial institutions that were neither past due nor impaired were assessed with reference to the Bank of Ghana credit grading guidelines adopted by the Group for its internal grading purposes.
Maximum exposureCredit risk exposures relating to on balance sheet assets are as follows:Balances with Bank of GhanaGovernment securitiesDue from other banks and financial institutionsLoans and advances to customersOther assets (excluding prepayments) Credit risk exposures relating to off balance sheet items are as follows:Financial guaranteesAt 31 December
BANK
Neither past due nor impairedPast due but not impairedIndividually impairedGrossLess allowance for impairmentNet amount
2015
256,8631,365,877709,393
1,489,84338,137
3,860,113
384,7234,244,836
Loans & advances to
customers
1,254,133210,10290,693
1,554,92865,085
1,489,843
2015 2014
Loans & advances to
customers
1,479,43178,987
40,4801,598,898
39,3681,559,530
2014
175,252590,852463,377
1,559,53029,968
2,818,979
309,5653,128,544
Due from banks & financial
institutions
709,393--
709,393-
709,393
Due from banks & financial
institutions
463,377--
463,377-
463,377

All amounts are expressed in thousands of Ghana cedis unless otherwise stated[ ]
Notes To The Financial Statementsfor the year ended 31 December 2015 All amounts are expressed in thousands
of Ghana cedis unless otherwise stated[ ]
2015 Annual Report54
Due from banks and other financial institutionsBased on the Bank’s internal assessment, the credit exposure to banks and other financial institutions are not impaired.
(i) Loans and advances past due but not impairedLoans and advances graded internally as current and OLEM may be past due but are not considered impaired, unless other information is available to indicate the contrary. Gross amount of loans and advances by class to customers that were past due but not impaired were as follows:
(ii) Individually impaired loansThe breakdown of the gross amount of loans and advances individually impaired by class, along with the fair value of related collateral held by the bank as security, are as follows:
Loans and advances to customers in Ghana analysed by industry sector, as well as by customer type are shown in note 18(b) & (c).
Loans and advancesLoans and advances graded current are not considered past due or impaired.This category is made up as follows:
2015Grade:Current
2014Grade:Current
2015 Past due up to 30 daysPast due 30 to 60 daysPast due 60 to 90 daysTotal
2015Individually impaired loansSpecific impairment allowanceNet amount
Fair value of collateral
2014Individually impaired loansSpecific impairment allowanceNet amountFair value of collateral
2014Past due up to 30 daysPast due 30 to 60 daysPast due 60 to 90 daysTotal
Term loans
1,056,105
Term loans
1,211,520
Term loans97,07524,77215,902
137,749
Term loans 66,090(23,651)42,439
6,622
Term loans30,701
(19,107)11,594
44,259
Term loans71,831
1913,685
75,707
Staff loans
16,310
Staff loans
7,270
Staff loans----
Staff loans---
-
Staff loans----
Staff loans 16
--
16
Overdrafts
181,718
Overdrafts
301,121
Overdrafts 71,824
-529
72,353
Overdrafts 24,603(8,135)16,468
71,392
Overdrafts 9,779
(9,552)22745
Overdrafts 2,017
71,2403,264
Total
1,254,133
Total
1,479,431
Total168,899
24,77216,431
210,102
Total90,693(31,786)58,907
78,014
Total40,480
(28,659)11,821
44,304
Total73,864
1984,925
78,987
3.1.3 Maximum exposure to credit risk before collateral held (continued)
55
FINANCIAL RISK MANAGEMENT
3.2 Market risk
The Bank takes on exposure to market risks, which is the risk that the fair value or future cash flows of a financial instrument will fluctuate because of changes in market prices. Market risks arise from open positions in interest rate, currency and equity products, all of which are exposed to general and specific market movements and changes in the level of volatility of market rates or prices such as interest rates, foreign exchange rates and equity prices. The Bank separates exposures to market risk into either trading or non-trading portfolios.
The market risks arising from trading and non-trading activities are concentrated in Bank Treasury and monitored by both Treasury and Risk Management departments separately. Regular reports are submitted to the Board of Directors and heads of each business unit.Trading portfolios include those positions arising from market-making transactions where the Bank acts as principal with clients or with the market.
Non-trading portfolios primarily arise from the interest rate management of the Bank’s retail and wholesale banking assets and liabilities. Non-trading portfolios also consist of foreign exchange and equity risks arising from the Bank’s held-to-maturity and available-for-sale financial assets.
3.2.1 Market risk measurement techniques
The objective of market risk measurement is to manage and control market risk exposures within acceptable limits while optimising the return on risk. The Bank’s Chief Risk Officer is responsible for the development of detailed risk management policies and for day-to-day implementation of those policies.
The Group identifies market risk through daily monitoring of levels and profit and loss balances of trading and non trading positions. The Risk Management department monitors daily trading activities to ensure that risk exposures taken are within the approved price limits and the overall risk tolerance levels set by the Board.
In addition, Assets and Liabilities Committee (ALCO) members, the Treasurer and the Risk Manager monitor market risk factors that affect the value of trading and non trading positions as well as income streams on non trading portfolios on a daily basis. They also track the liquidity indicators to ensure that the Group meets its financial obligations at all times.
3.2.2 Foreign exchange risk
Currency risk is the risk that the value of a financial instrument will fluctuate due to changes in foreign exchange rates. The open positions of currencies held are monitored on a daily basis. The objective of monitoring the open position in foreign currency is to manage foreign exchange risk due to movements in rates as well as changes in liquidity positions. The Bank has adopted the revised Bank of Ghana requirement that banks maintain a total open position which is equal to 10% of their net own funds. Within this limit, banks are also required to maintain single currency open positions equal to 5% of net own funds.
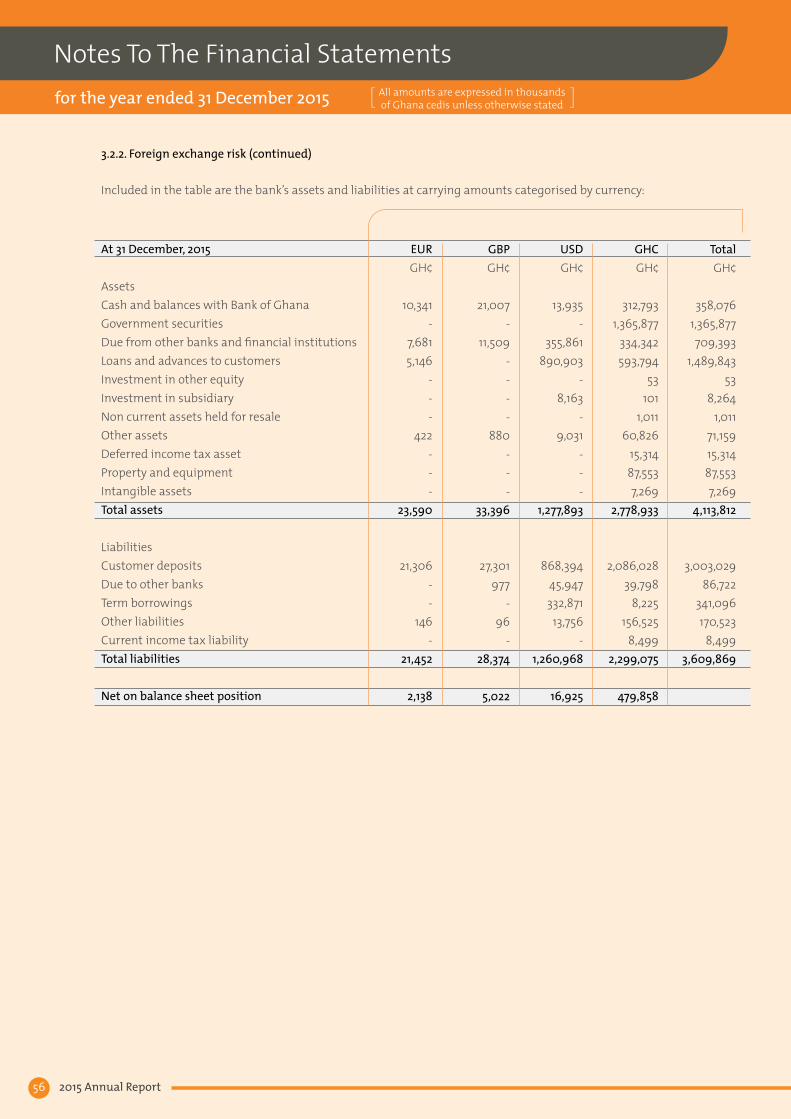
All amounts are expressed in thousands of Ghana cedis unless otherwise stated[ ]
Notes To The Financial Statementsfor the year ended 31 December 2015 All amounts are expressed in thousands
of Ghana cedis unless otherwise stated[ ]
2015 Annual Report56
Included in the table are the bank’s assets and liabilities at carrying amounts categorised by currency:
At 31 December, 2015 Assets Cash and balances with Bank of GhanaGovernment securities Due from other banks and financial institutionsLoans and advances to customersInvestment in other equityInvestment in subsidiaryNon current assets held for resaleOther assets Deferred income tax assetProperty and equipment Intangible assets Total assets
Liabilities Customer deposits Due to other banks Term borrowings Other liabilitiesCurrent income tax liabilityTotal liabilities Net on balance sheet position
EUR GH¢
10,341-
7,6815,146
--
-422
---
23,590
21,306--
146-
21,452
2,138
USD GH¢
13,935-
355,861890,903
-8,163
-9,031
---
1,277,893
868,39445,947332,871
13,756-
1,260,968
16,925
GHC GH¢
312,7931,365,877
334,342593,794
53101
1,01160,826
15,31487,5537,269
2,778,933
2,086,02839,798
8,225156,525
8,4992,299,075
479,858
GBP GH¢
21,007-
11,509----
880---
33,396
27,301977
-96
-28,374
5,022
Total GH¢
358,0761,365,877709,393
1,489,84353
8,2641,011
71,15915,31487,5537,269
4,113,812
3,003,02986,722
341,096170,523
8,4993,609,869
3.2.2. Foreign exchange risk (continued)

57
Included in the table are the bank’s assets and liabilities at carrying amounts categorised by currency:
Foreign currency sensitivity analysisThe Bank’s principal foreign currency exposures are to the US Dollar, the Euro and the Pound Sterling. The table below illustrates the hypothetical sensitivity of the Bank’s reported profit to a 15% (2014: 15%) decrease in the value of the Ghana Cedi against these foreign currencies at the year end, assuming all other variables remain unchanged. The sensitivity rate of 15% represents the directors’ assessment of a reasonably possible change, based on historic volatility.
Year end exchange rates applied in the above analysis are GH¢3.7950 (2014: GH¢3.2001) to the US dollar, GH¢4.1320 (2014: GH¢3.8959) to the Euro, and GH¢5.6165 (2014: GH¢4.9791) to the Pound Sterling. The strengthening of the Ghana Cedi will produce symmetrical results.
At 31 December, 2014 Assets Cash and balances with Bank of GhanaGovernment securities Due from other banks and financial institutionsLoans and advances to customersInvestment in other equityInvestment in subsidiaryOther assets Deferred income tax assetProperty and equipment Intangible assets Total assets
Liabilities Customer deposits Due to other banks Term borrowings Other liabilitiesCurrent income tax liabilityTotal liabilities Net on balance sheet position
Cedi weakens by 15%
US DollarEuroPound Sterling
EUR GH¢
10,846-
7,2866--
390---
18,528
17,452--
507-
17,959
569
USD GH¢
23,378-
303,193531,004
-36,743
2,144---
896,462
365,948212,487310,827
11,154-
900,416
(3,954)
GHC GH¢
198,791590,852151,029
1,026,94557
8,26453,984
8,05540,606
8,0832,086,666
1,375,608191,742
-129,146
2,1241,698,620
388,046
GBP GH¢
14,375-
1,8691,575
--
808---
18,627
18,305--
157-
18,462
165
Total GH¢
247,390590,852463,377
1,559,53057
45,00757,3268,055
40,6068,083
3,020,283
1,777,313404,229310,827
140,9642,124
2,635,457
Impact on statement of comprehensive income 2015 2014
2,539 (593) 321 85
753 25
3.2.2 Foreign exchange risk (continued)

All amounts are expressed in thousands of Ghana cedis unless otherwise stated[ ]
Notes To The Financial Statementsfor the year ended 31 December 2015 All amounts are expressed in thousands
of Ghana cedis unless otherwise stated[ ]
2015 Annual Report58
3.2.3. Interest rate risk
Interest rate risk is the exposure of current and future earnings and capital to adverse changes in the level of interest rates. Exposure to interest rate risk can result from a variety of factors, including:
• differences between the timing of market interest rate changes and the timing of cash flows (re-pricing risk)• changes in the market interest rates producing different effects on yields on similar instruments with different maturities (yield curve risk); and • changes in the level of market interest rates producing different effects on rates received or paid on instruments with similar re-pricing characteristics (basis risk).
The Bank uses gap analysis to measure its exposure to interest rate risk. Through this analysis, it compares the values of interest rate sensitive assets and interest rate sensitive liabilities that mature or re-price at various time periods in the future. The Bank may make judgmental assumptions about the behaviour of assets and liabilities which do not have specific contractual maturity or re-pricing dates.
The table below summarises the re-pricing profiles of the Bank’s financial instruments and other assets and liabilities as at 31 December 2015 and 31 December 2014 respectively. Items are allocated to time periods with reference to the earlier of the next contractual interest rate re-pricing date and the maturity date.
31 December 2015
AssetsCash and balances with Bank of GhanaGovernment securitiesDue from other banks and financial institutionsLoans and advances to customersInvestment in other equityFinancial assetsLiabilitiesCustomer depositsDue to other banksTerm borrowingsOther liabilitiesFinancial liabilitiesTotal interest re-pricing gap
1-3 months
-284,685
-132,615
-417,300
437,84279,784
260,716-
778,342(361,042)
Up to 1 month
-375,544
709,393162,064
-1,247,001
369,9731,734
18,974-
390,681856,320
over 1 year
-68,036
-659,656
-727,692
--
8,225-
8,225719,467
Non interest bearing
358,076
459
--
53358,588
1,325,427--
170,5231,495,950
3-12 months
-637,153
-535,508
-1,172,661
869,7875,20453,181
-928,172
244,489
Total
358,0761,365,877
709,3931,489,843
533,923,242
3,003,02986,722
341,096170,523
3,601,370

59
Interest rate sensitivity analysisThe interest re-pricing gap analysis is supplemented by monitoring the sensitivity of the Bank’s financial assets and liabilities to various standard and non-standard interest rate scenarios. Standard scenarios that are considered on a monthly basis include a 100 basis points (bps) parallel shift in all yield curves. An analysis of the Bank’s sensitivity to an increase or decrease in market interest rates (assuming no symmetrical movement in yield curves and a constant balance sheet position) and its impact on the net interest margin is as follows:
31 December 2014
Assets
Cash and balances with Bank of GhanaGovernment securitiesDue from other banks and financial institutionsLoans and advances to customersInvestment in other equityFinancial assetsLiabilitiesCustomer depositsDue to other banksTerm borrowingsOther liabilitiesFinancial liabilitiesTotal interest re-pricing gap
Up to 1 month 1-3 months3-12 months over 1 year Total
Impact on net interest income (2015)Impact on net interest income (2014)
1-3
months
-254,129
-63,480
-317,609
255,009142,084230,647
-627,740(310,131)
Up to 1 month
-97,568
106,750296,525
-500,843
361,14370,40216,001
-447,546
53,297
over 1
year
-37,769
-374,565
-412,334
--
11,200-
11,200401,134
+100bps
8,211(3,017)
1,5411,801
8,536
4.58%1.82%
Non interest bearing
247,390
712
63,818-
57311,977
794,180--
140,964935,144
+200bps 16,423
(6,034)3,0813,60117,071
9.17%3.63%
3-12
months
-200,674
292,769824,960
-1,318,403
366,981191,74352,979
-611,703
706,700
Total interest re-pricing gap
856,320(361,042)244,489714,410
Total
247,390590,852
463,3371,559,530
572,861,166
1,777,313404,229310,827
140,9642,633,333
+300bps
24,634(9,051)
4,6225,402
25,607
13.75%5.45%
Possible interest rate movements
3.2.3 Interest rate risk (continued)
All amounts are expressed in thousands of Ghana cedis unless otherwise stated[ ]
Notes To The Financial Statementsfor the year ended 31 December 2015 All amounts are expressed in thousands
of Ghana cedis unless otherwise stated[ ]
2015 Annual Report60
3.3. Liquidity risk management
Liquidity risk is the risk that the Bank is unable to meet its obligations when they fall due as a result of customer deposits being withdrawn, cash requirements from contractual commitments, or other cash outflows, such as debt maturities or margin calls for derivatives. Such outflows would deplete available cash resources for client lending, trading activities and investments. In extreme circumstances, lack of liquidity could result in reductions in the statement of financial position and sales of assets, or potentially an inability to fulfil lending commitments. The risk that the Bank will be unable to do so is inherent in all banking operations and can be affected by a range of institution-specific and market-wide events including, but not limited to, credit events, merger and acquisition activity, systemic shocks and natural disasters.
3.3.1 Liquidity risk management process
The Bank’s liquidity management process, as carried out within the Bank and monitored by a separate team in Treasury Department, includes:
• day-to-day funding, managed by monitoring future cash flows to ensure that requirements can be met. This includes replenishment of funds as they mature or are borrowed by customers. The Bank maintains an active presence in the money market to enable this to happen;
• maintaining a portfolio of highly marketable assets that can easily be liquidated as protection against any unforeseen interruption to cash flow;
• monitoring the liquidity ratios of the statement of financial position against internal and regulatory requirements and ;
• managing the concentration and profile of debt maturities.
Finally, the Bank is statutorily required to maintain a reserve of 10% of the local currency equivalent of foreign currency customer deposits held as well as 10% of local currency customer deposits in one account with the Bank of Ghana. These balances are used to support all inter-bank transactions.
3.3.2 Liquidity risk measurement
The Bank prepares and uses liability mismatch reports to manage funding needs. The weekly liquidity mismatch report is used to measure the ability of the Bank to meet maturing liability obligations. This is supplemented by weekly cash flow reports produced to show the projected cash flow on a daily basis incorporating projected customer withdrawals, including credit disbursements, as well as deposits.
The deposit concentration ratio is monitored monthly to ensure that decisions of individual and or groups of depositors do not severely impact on liquidity. Particular attention is given to wholesale borrowing. Due to their size, withdrawals of such funds tend to impact negatively on liquidity. As a rule, wholesale borrowing transactions are entered into as repurchase contracts where each transaction is collateralised with a treasury bill or bond. Alternatively, such transactions are contracted to support specific credits in a back-to-back transaction. The monthly deposit concentration report is examined as part of the Assets and Liabilities Committee (ALCO) process
and the necessary preventive/remedial action taken. (All amounts are expressed in thousands of Ghana cedis unless otherwise stated)
In addition to the above, the Bank observes an internally defined volatile liability dependency ratio which is measured as (volatile funds – liquid assets) / long term investments. This measures the reliance on volatile funds to finance long term investments as well as other non-liquid assets. (Volatile funds are short term wholesale funds e.g. call accounts).
3.3.3 Liquidity crisis management
Liquidity crisis is defined as a condition where the Bank is unable to meet maturing liabilities/or regulatory reserve requirements due to inadequate liquid assets or a condition that arises from a sudden deterioration of the perceived safety and credibility of the Bank resulting in substantial withdrawal of funds by depositors.
This is deemed to have occurred when any of the following conditions exist:
• Liquidity guidelines/ratios have been breached for four consecutive weeks.
• Bank of Ghana (BoG) support facilities have been accessed for three or more consecutive weeks.
Management has put in place a Contingency Action Plan to manage liquidity crisis. The plan includes action points together with responsibilities for ensuring that steps are taken to manage the crisis.
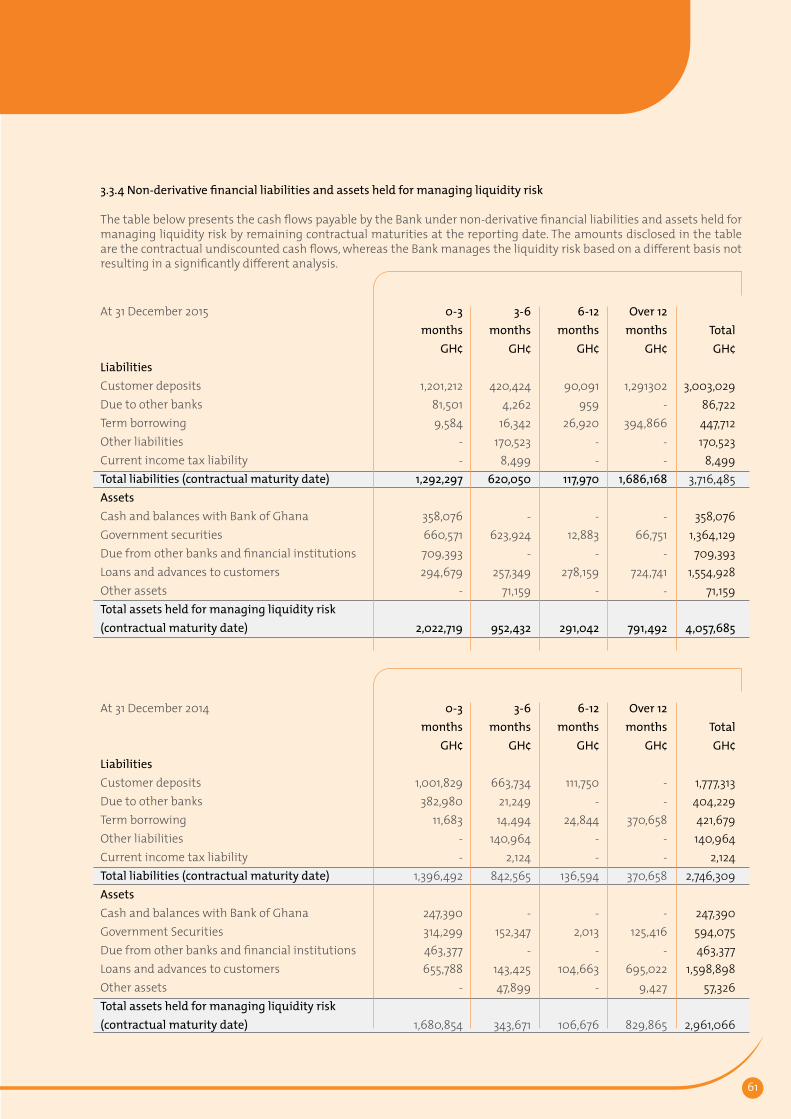
61
3.3.4 Non-derivative financial liabilities and assets held for managing liquidity risk
The table below presents the cash flows payable by the Bank under non-derivative financial liabilities and assets held for managing liquidity risk by remaining contractual maturities at the reporting date. The amounts disclosed in the table are the contractual undiscounted cash flows, whereas the Bank manages the liquidity risk based on a different basis not resulting in a significantly different analysis.
At 31 December 2015 Liabilities Customer depositsDue to other banksTerm borrowing Other liabilitiesCurrent income tax liabilityTotal liabilities (contractual maturity date)Assets Cash and balances with Bank of GhanaGovernment securitiesDue from other banks and financial institutionsLoans and advances to customersOther assets Total assets held for managing liquidity risk (contractual maturity date)
At 31 December 2014 Liabilities Customer depositsDue to other banksTerm borrowing Other liabilitiesCurrent income tax liabilityTotal liabilities (contractual maturity date)Assets Cash and balances with Bank of GhanaGovernment SecuritiesDue from other banks and financial institutionsLoans and advances to customersOther assets Total assets held for managing liquidity risk (contractual maturity date)
0-3 months
GH¢
1,201,21281,5019,584
--
1,292,297
358,076660,571709,393294,679
-
2,022,719
0-3 months
GH¢
1,001,829382,980
11,683--
1,396,492
247,390314,299463,377655,788
-
1,680,854
6-12 months
GH¢
90,091959
26,920--
117,970
-12,883
-278,159
-
291,042
6-12 months
GH¢
111,750-
24,844--
136,594
-2,013
-104,663
-
106,676
Over 12 months
GH¢
1,291302-
394,866--
1,686,168
-66,751
-724,741
-
791,492
Over 12 months
GH¢
--
370,658--
370,658
-125,416
-695,022
9,427
829,865
3-6 months
GH¢
420,4244,262
16,342170,523
8,499620,050
-623,924
-257,349
71,159
952,432
3-6 months
GH¢
663,73421,24914,494
140,9642,124
842,565
-152,347
-143,42547,899
343,671
Total GH¢
3,003,02986,722447,712170,523
8,4993,716,485
358,0761,364,129709,393
1,554,92871,159
4,057,685
Total GH¢
1,777,313404,229421,679140,964
2,1242,746,309
247,390594,075463,377
1,598,89857,326
2,961,066
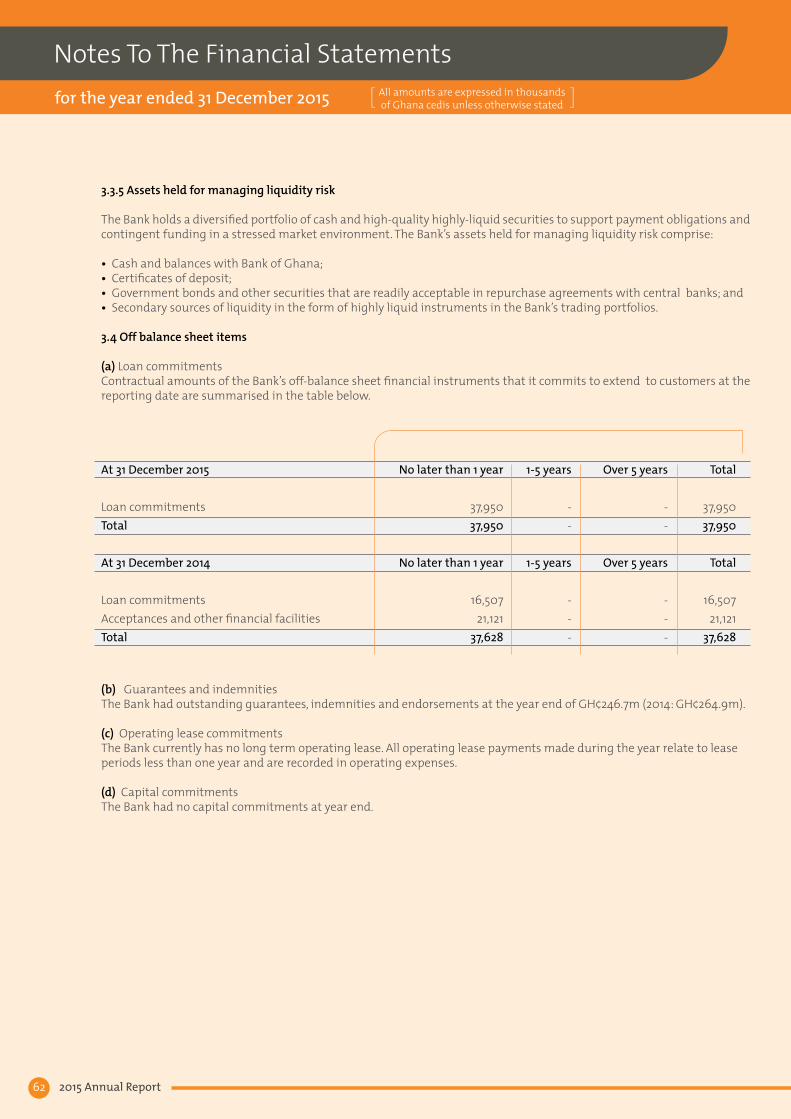
All amounts are expressed in thousands of Ghana cedis unless otherwise stated[ ]
Notes To The Financial Statementsfor the year ended 31 December 2015 All amounts are expressed in thousands
of Ghana cedis unless otherwise stated[ ]
2015 Annual Report62
3.3.5 Assets held for managing liquidity risk
The Bank holds a diversified portfolio of cash and high-quality highly-liquid securities to support payment obligations and contingent funding in a stressed market environment. The Bank’s assets held for managing liquidity risk comprise:
• Cash and balances with Bank of Ghana; • Certificates of deposit;• Government bonds and other securities that are readily acceptable in repurchase agreements with central banks; and• Secondary sources of liquidity in the form of highly liquid instruments in the Bank’s trading portfolios. 3.4 Off balance sheet items
(a) Loan commitmentsContractual amounts of the Bank’s off-balance sheet financial instruments that it commits to extend to customers at the reporting date are summarised in the table below.
(b) Guarantees and indemnitiesThe Bank had outstanding guarantees, indemnities and endorsements at the year end of GH¢246.7m (2014: GH¢264.9m).
(c) Operating lease commitmentsThe Bank currently has no long term operating lease. All operating lease payments made during the year relate to lease periods less than one year and are recorded in operating expenses.
(d) Capital commitmentsThe Bank had no capital commitments at year end.
At 31 December 2015
Loan commitmentsTotal
At 31 December 2014
Loan commitmentsAcceptances and other financial facilitiesTotal
1-5 years
--
1-5 years
---
Over 5 years
--
Over 5 years
---
No later than 1 year
37,95037,950
No later than 1 year
16,50721,121
37,628
Total
37,95037,950
Total
16,50721,121
37,628

63
3.5 Country analysis
An analysis of assets and total liabilities of the Bank held inside and outside Ghana is analysed below:
3.6. Fair value of financial instruments
3.6.1. Financial instruments not measured at fair valueThe following table summarises the carrying amounts and fair values of those financial assets and liabilities not presented on the Bank’s statement of financial position at their fair value:
Financial assetsLoans and advancesInvestment securities Financial liabilitiesCustomer deposits
2015
1,559,966-
3,003,029
2015
1,484,786-
3,003,029
2014
1,598,89810,000
1,777,313
2014
1,523,21711,154
1,777,313
Carrying value Fair value
AssetsCash and balances with Bank of GhanaGovernment SecuritiesDue from other banks and financial institutionsLoans and advances to customersInvestment in other equityInvestment in subsidiariesOther assets Non current assets held for saleDeferred income tax assetProperty and equipmentIntangible assets
Liabilities Customer depositsDue to other banksTerm borrowingsOther liabilitiesCurrent income tax liability
Ghana GH¢
358,0761,365,877589,850
1,489,84353
10171,159
1,01115,31487,5537,269
3,986,106
3,003,02986,722
-170,523
8,4993,268,773
Ghana GH¢
247,390590,852433,135
1,559,53057
36,84457,326
-8,055
40,6068,083
2,981,878
1,777,313404,229
-140,964
2,1242,324,630
Outside GH¢
--
119,543--
8,163
----
127,706
--
341,096--
341,096
Outside GH¢
--
30,242--
8,163-----
38,405
--
310,827--
310,827
2015 2014

All amounts are expressed in thousands of Ghana cedis unless otherwise stated[ ]
Notes To The Financial Statementsfor the year ended 31 December 2015 All amounts are expressed in thousands
of Ghana cedis unless otherwise stated[ ]
2015 Annual Report64
(i) Loans and advancesLoans and advances are net of charges for impairment. The estimated fair value of loans and advances represents the discounted amount of estimated future cash flows expected to be received. Expected cash flows are discounted at current market rates to determine fair value.
(ii) Investment securitiesThe estimated fair value of held to maturity investment securities represents the discounted amount of estimated future cash flows expected to be received.Expected cash flows are discounted at current market rates to determine fair value.
(iii) Customer depositsThe estimated fair value of deposits with no stated maturity, which includes non-interest-bearing deposits, is the amount repayable on demand.
3.6.2 Fair value hierarchyIFRS 7 specifies a hierarchy of valuation techniques based on whether the inputs to those valuation techniques are observable or unobservable. Observable inputs reflect market data obtained from independent sources; unobservable inputs reflect the Bank’s market assumptions. These two types of inputs have created the following fair value hierarchy:
• Level 1 – Quoted prices (unadjusted) in active markets for identical assets or liabilities. This level includes listed equity securities and debt instruments on exchanges (for example, Ghana Stock Exchange) and exchanges traded derivatives like futures (for example, Nasdaq).• Level 2 – Inputs are quoted prices for the asset or liability, (other than those included in Level 1) that are observable either directly (that is, as prices) or indirectly (that is, derived from prices). • Level 3 – Inputs for the asset or liability that are not based on observable market data (unobservable inputs). This level includes equity investments and debt instruments with significant unobservable components.
This hierarchy requires the use of observable market data when available. The Bank considers relevant and observable market prices in its valuations where possible.
3.7 Capital management
The Bank’s objectives when managing capital are:(i) to comply with the capital requirements set by the Bank of Ghana;(ii) to safeguard the Bank’s ability to continue as a going concern and ;(iii) to maintain a sufficient capital base to ensure strong credit ratings and to support its business and maximise shareholder value.
Compliance with capital adequacy ratios set by the Bank of Ghana is monitored monthly with reports outlining their calculation reviewed and signed by the Bank’s Finance Director.Under the current capital requirements set by the Bank of Ghana, banks have to maintain a ratio of regulatory capital to risk weighted assets (“capital adequacy ratio”) above 10%.Regulatory capital as defined by the Bank of Ghana has two (2) components: • Tier 1 capital: this constitutes –i. equity which is made up of (a) issued and fully paid ordinary shares, (b) perpetual non-cumulative preference shares;
2015 Government securities (available for sale)Investment in other equity 2014Government securities (available for sale)Investment in other equity
Level 1- - -
---
Level 21,341,774
-1,341,774
563,406-
563,406
Level 3-
5353
-5757
3.6.3 Assets and liabilities measured at fair value
3.6.1 Financial Investments not measured at fair value (continued)
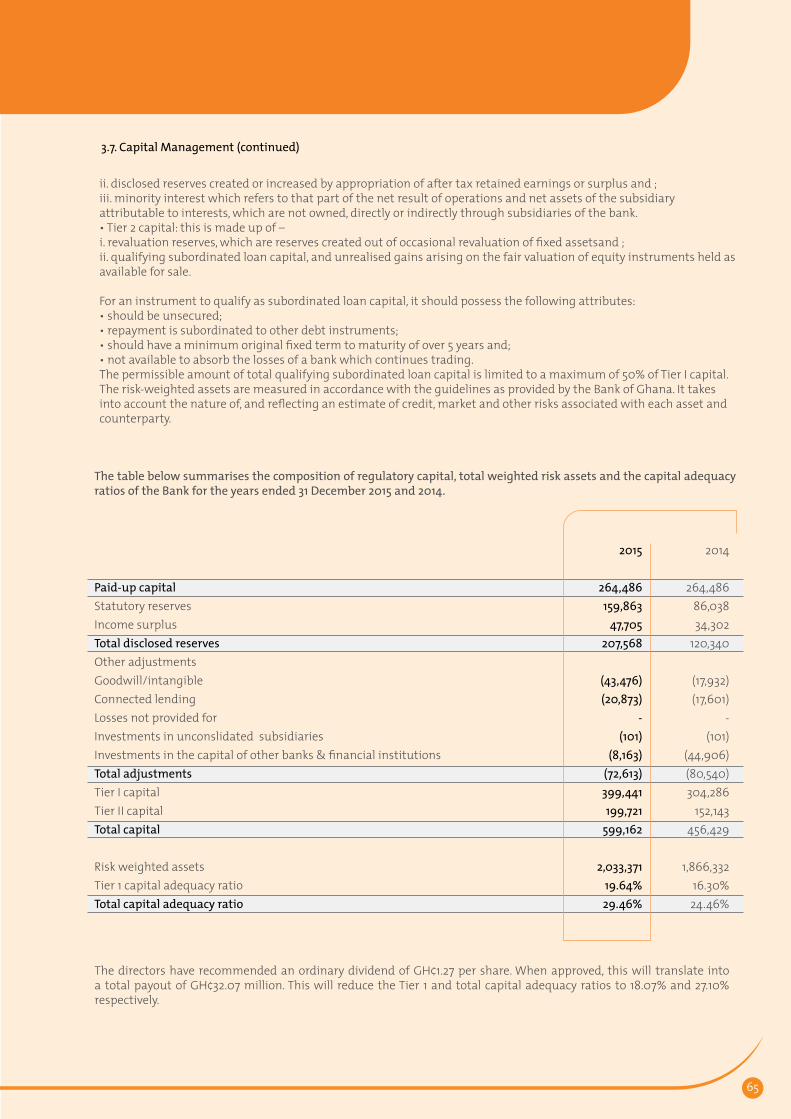
65
The table below summarises the composition of regulatory capital, total weighted risk assets and the capital adequacy ratios of the Bank for the years ended 31 December 2015 and 2014.
Paid-up capitalStatutory reservesIncome surplusTotal disclosed reservesOther adjustmentsGoodwill/intangibleConnected lendingLosses not provided forInvestments in unconslidated subsidiariesInvestments in the capital of other banks & financial institutionsTotal adjustmentsTier I capitalTier II capitalTotal capital
Risk weighted assetsTier 1 capital adequacy ratioTotal capital adequacy ratio
2014
264,48686,03834,302
120,340
(17,932)(17,601)
-(101)
(44,906)(80,540)304,286
152,143456,429
1,866,332
16.30%24.46%
The directors have recommended an ordinary dividend of GH¢1.27 per share. When approved, this will translate into a total payout of GH¢32.07 million. This will reduce the Tier 1 and total capital adequacy ratios to 18.07% and 27.10% respectively.
ii. disclosed reserves created or increased by appropriation of after tax retained earnings or surplus and ;iii. minority interest which refers to that part of the net result of operations and net assets of the subsidiary attributable to interests, which are not owned, directly or indirectly through subsidiaries of the bank.• Tier 2 capital: this is made up of –i. revaluation reserves, which are reserves created out of occasional revaluation of fixed assetsand ;ii. qualifying subordinated loan capital, and unrealised gains arising on the fair valuation of equity instruments held as available for sale.
For an instrument to qualify as subordinated loan capital, it should possess the following attributes:• should be unsecured;• repayment is subordinated to other debt instruments;• should have a minimum original fixed term to maturity of over 5 years and;• not available to absorb the losses of a bank which continues trading.The permissible amount of total qualifying subordinated loan capital is limited to a maximum of 50% of Tier I capital.The risk-weighted assets are measured in accordance with the guidelines as provided by the Bank of Ghana. It takes into account the nature of, and reflecting an estimate of credit, market and other risks associated with each asset and counterparty.
3.7. Capital Management (continued)
2015
264,486159,863
47,705207,568
(43,476)(20,873)
-(101)
(8,163)(72,613)399,441199,721
599,162
2,033,37119.64%29.46%

All amounts are expressed in thousands of Ghana cedis unless otherwise stated[ ]
Notes To The Financial Statementsfor the year ended 31 December 2015 All amounts are expressed in thousands
of Ghana cedis unless otherwise stated[ ]
2015 Annual Report66
4. CRITICAL ACCOUNTING JUDGMENTS, ESTIMATES AND ASSUMPTIONS
The preparation of financial statements in conformity with IFRS requires management to make judgements, estimates and assumptions that affect the application of policies and reported amounts of assets, liabilities, income and expenses. The estimates and associated assumptions are based on historical experience and various factors that are believed to be reasonable under the circumstances, the results of which form the basis for making the judgement about carrying values of assets and liabilities that are not readily apparent from other sources. Actual results may differ from these estimates. The estimates and judgements that have a significant risk of causing a material adjustment to the carrying values of the assets and liabilities within the next financial year are discussed below.
(a) Fair value of financial instrumentsThe fair value of a financial instrument is determined by reference to the quoted bid price or asking price (as appropriate) in an active market. Where the fair value of financial assets and financial liabilities recorded in the statements of financial position cannot be derived from an active market, it is determined using a variety of valuation techniques including the use of prices obtained in recent arms’ length transactions, comparison to similar instruments for which market observable prices exist, net present value techniques and mathematical models. Input to these mathematical models is taken from observable markets where possible, but where this is not feasible, a degree of judgement is required in establishing fair values.
(b) Impairment losses on loans and advancesThe Bank reviews its loan portfolios to assess whether an allowance for impairment should be recorded in
the statements of comprehensive income. In particular, judgement by management is required in the estimation of the amount and timing of future cash flows when determining the level of allowance required. Such estimates are based on assumptions about a number of factors and actual results may differ, resulting in future changes to the allowance.
In addition to specific allowances against individually significant loans and advances, the Bank also makes a collective impairment allowance against exposures which, although not specifically identified as requiring a specific allowance, have a greater risk of default than when originally granted. This takes into consideration factors such as any deterioration in country risk, industry, and technological obsolescence, as well as identified structural weaknesses or deterioration in cash flows.
(c) Held-to-maturity instrumentsIn accordance with IAS 39 guidance, the Bank classifies some non-derivative financial assets with fixed or determinable payments and fixed maturity as held-to-maturity. This classification requires significant judgement. In making this judgement, the Bank evaluates its intention and ability to hold such investments to maturity. If the Bank were to fail to keep these investments to maturity other than for the specific circumstances – for example, selling an insignificant amount close to maturity – the Bank is required to reclassify the entire category as available-for-sale. Accordingly, the investments would be measured at fair value instead of amortised cost.
(d) Impairment of available-for-sale equity investmentsThe Bank treats available-for-sale equity investments as impaired when there has been a significant or prolonged decline in the fair value below its cost or where other objective evidence of impairment exits. The Bank treats ‘significant’ generally as 20% or more and ‘prolonged’ as
greater than 6 months. In addition, The Bank evaluates other factors such as the share price volatility.
(e) Deferred income tax assetsDeferred income tax assets are recognised for all unused tax losses to the extent that it is probable that taxable profit will be available against which the losses can be utilised. Significant management judgement is required to determine the amount of deferred income tax assets that can be recognised, based upon the likely timing and level of future taxable profits together with future tax planning strategies. (f) Estimated impairment of goodwillThe Bank tests annually whether goodwill has suffered any impairment, in accordance with the accounting policy stated in Note 2.10. The recoverable amounts of cash-generating units have been determined based on incremental cash flows and related revenues from the acquired customers base. These calculations require the use of estimates as disclosed in Note 23.
(g) Income taxSignificant estimates are required in determining the provision for income taxes. There are many transactions and calculations for which the ultimate tax determination is uncertain during the ordinary course of business. The Bankrecognises liabilities for anticipated tax audit issues based on estimates of whether additional taxes will be due. Where the final tax outcome of these matters is different from the amounts that were initially recorded, such differences will impact the income tax and deferred income tax provisions in the period in which such determination is made.
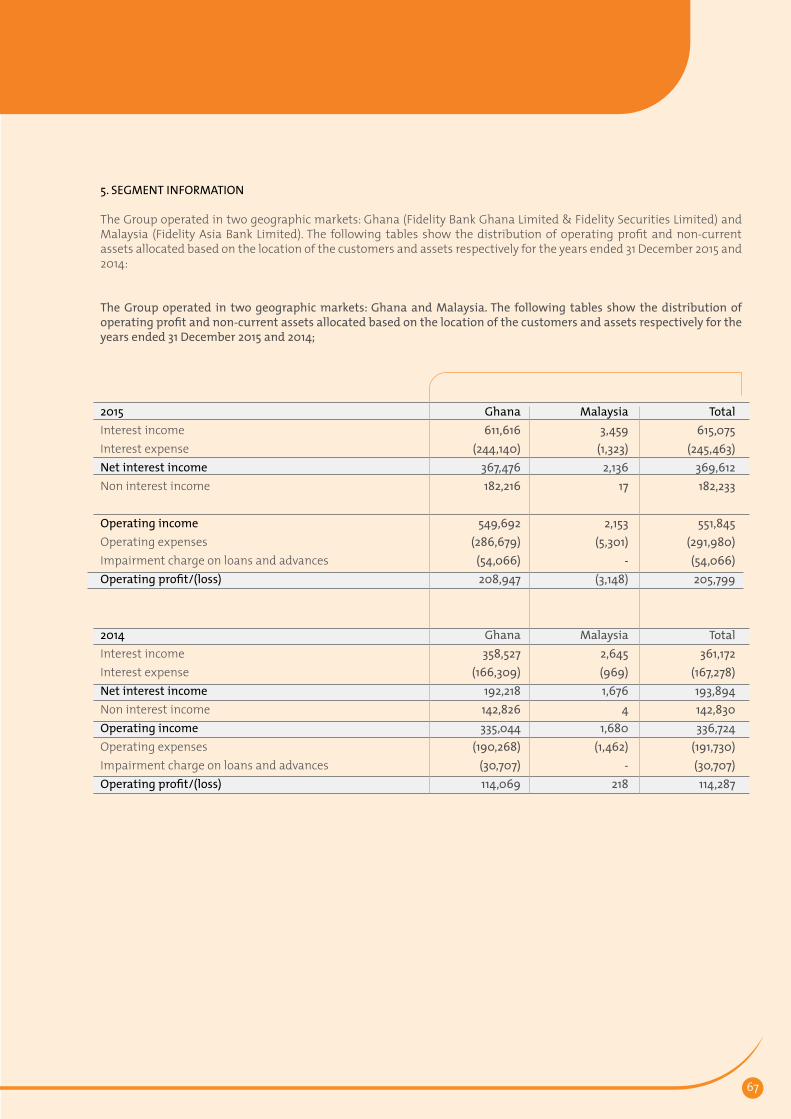
67
5. SEGMENT INFORMATION
The Group operated in two geographic markets: Ghana (Fidelity Bank Ghana Limited & Fidelity Securities Limited) and Malaysia (Fidelity Asia Bank Limited). The following tables show the distribution of operating profit and non-current assets allocated based on the location of the customers and assets respectively for the years ended 31 December 2015 and 2014:
The Group operated in two geographic markets: Ghana and Malaysia. The following tables show the distribution of operating profit and non-current assets allocated based on the location of the customers and assets respectively for the years ended 31 December 2015 and 2014;
2015 Interest income Interest expense Net interest income Non interest income
Operating income Operating expenses Impairment charge on loans and advancesOperating profit/(loss) 2014 Interest income Interest expense Net interest income Non interest incomeOperating income Operating expenses Impairment charge on loans and advancesOperating profit/(loss)
Ghana 611,616
(244,140)367,476182,216
549,692(286,679)(54,066)208,947
Ghana 358,527
(166,309) 192,218142,826335,044
(190,268)(30,707)114,069
Malaysia 3,459
(1,323)2,136
17
2,153(5,301)
-(3,148)
Malaysia 2,645
(969) 1,676
41,680
(1,462) -
218
Total 615,075
(245,463)369,612182,233
551,845(291,980)(54,066)205,799
Total 361,172
(167,278)193,894142,830336,724
(191,730) (30,707)
114,287
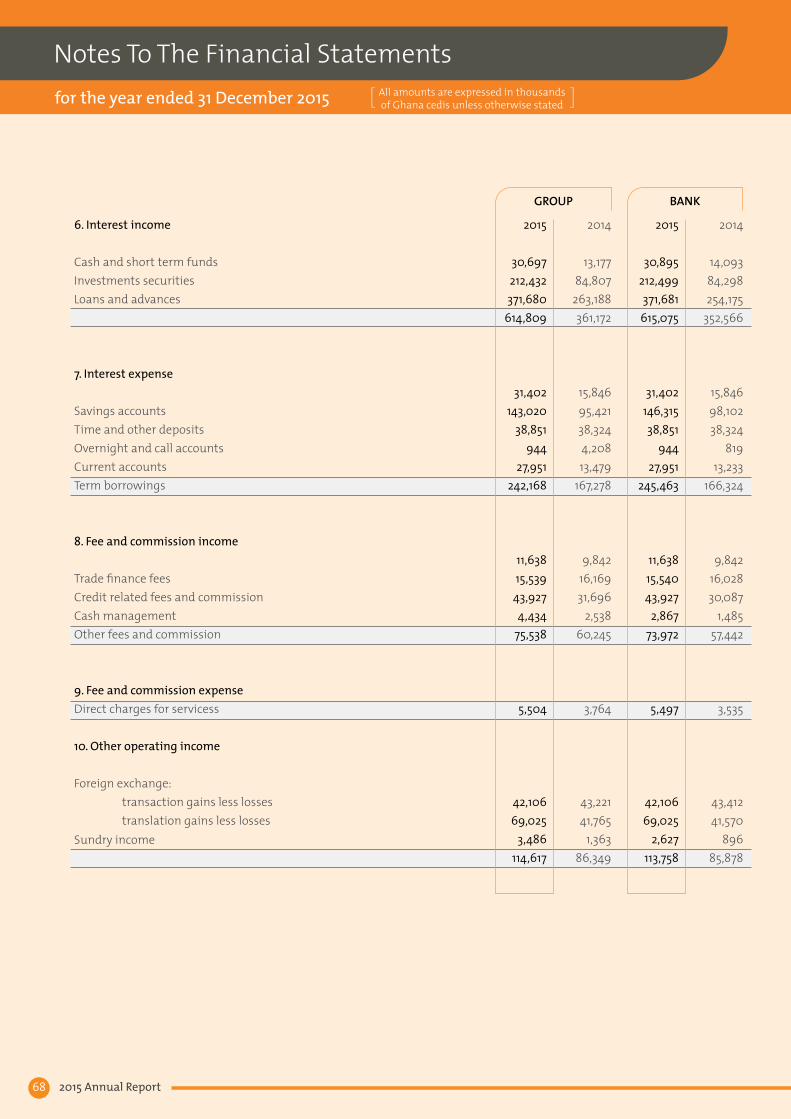
All amounts are expressed in thousands of Ghana cedis unless otherwise stated[ ]
Notes To The Financial Statementsfor the year ended 31 December 2015 All amounts are expressed in thousands
of Ghana cedis unless otherwise stated[ ]
2015 Annual Report68
2015
30,697212,432371,680
614,809
31,402143,020
38,851944
27,951242,168
11,63815,53943,9274,434
75,538
5,504
42,10669,025
3,486114,617
6. Interest income
Cash and short term fundsInvestments securitiesLoans and advances
7. Interest expense
Savings accounts Time and other deposits Overnight and call accountsCurrent accounts Term borrowings
8. Fee and commission income
Trade finance fees Credit related fees and commission Cash management Other fees and commission
9. Fee and commission expenseDirect charges for servicess
10. Other operating income
Foreign exchange: transaction gains less losses translation gains less lossesSundry income
GROUP BANK
2014
13,17784,807
263,188361,172
15,84695,42138,3244,20813,479
167,278
9,84216,16931,696
2,53860,245
3,764
43,22141,765
1,36386,349
2015
30,895212,499371,681615,075
31,402146,31538,851
94427,951
245,463
11,63815,54043,927
2,86773,972
5,497
42,10669,025
2,627113,758
2014
14,09384,298254,175
352,566
15,84698,10238,324
81913,233
166,324
9,84216,02830,087
1,48557,442
3,535
43,41241,570
89685,878
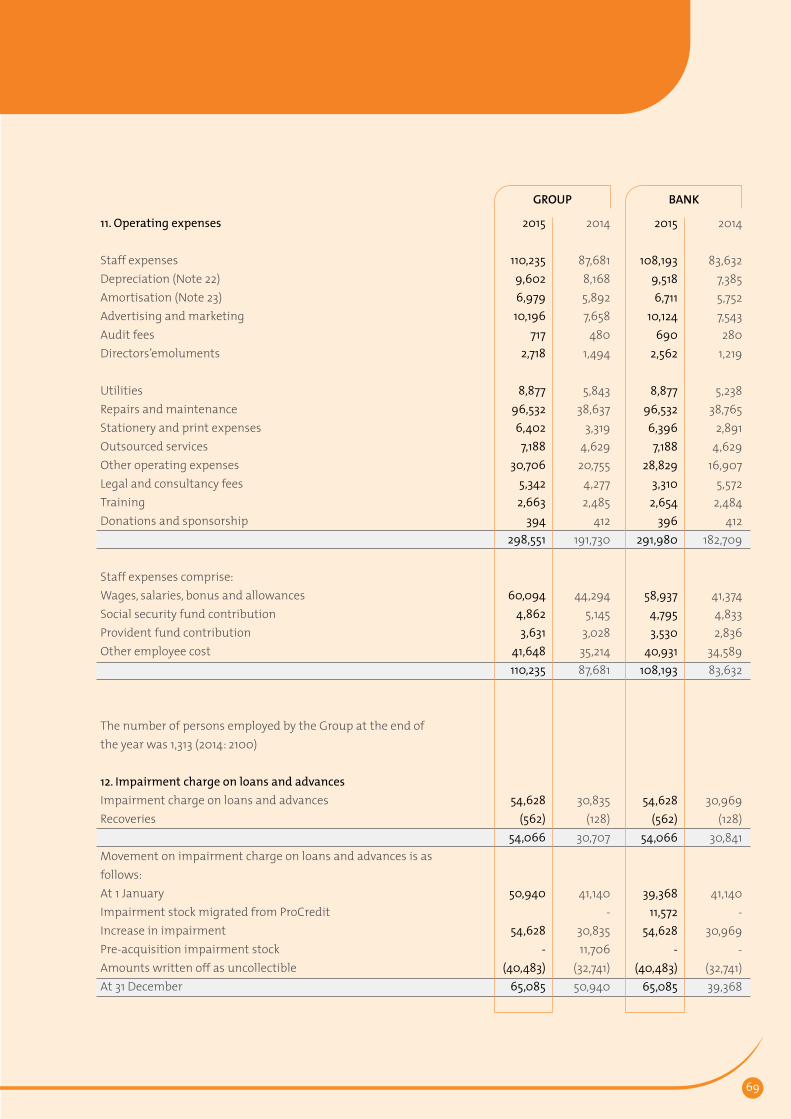
69
2015
110,2359,6026,97910,196
7172,718
8,87796,5326,4027,188
30,7065,3422,663
394298,551
60,0944,8623,631
41,648110,235
54,628(562)
54,066
50,940
54,628-
(40,483)65,085
11. Operating expenses
Staff expensesDepreciation (Note 22)Amortisation (Note 23)Advertising and marketingAudit fees Directors’emoluments
UtilitiesRepairs and maintenanceStationery and print expensesOutsourced servicesOther operating expensesLegal and consultancy feesTraining Donations and sponsorship
Staff expenses comprise:Wages, salaries, bonus and allowancesSocial security fund contributionProvident fund contributionOther employee cost
The number of persons employed by the Group at the end of the year was 1,313 (2014: 2100)
12. Impairment charge on loans and advancesImpairment charge on loans and advancesRecoveries
Movement on impairment charge on loans and advances is as follows:At 1 JanuaryImpairment stock migrated from ProCreditIncrease in impairmentPre-acquisition impairment stockAmounts written off as uncollectibleAt 31 December
GROUP BANK
2014
87,6818,1685,8927,658
4801,494
5,84338,637
3,3194,62920,755
4,2772,485
412191,730
44,2945,145
3,02835,21487,681
30,835(128)
30,707
41,140 -
30,83511,706
(32,741)50,940
2015
108,1939,5186,711
10,124690
2,562
8,87796,5326,3967,188
28,8293,3102,654
396291,980
58,9374,7953,530
40,931108,193
54,628(562)
54,066
39,368 11,57254,628
-(40,483)
65,085
2014
83,6327,3855,7527,543280
1,219
5,23838,765
2,8914,629
16,9075,572
2,484412
182,709
41,3744,8332,836
34,58983,632
30,969(128)
30,841
41,140-
30,969-
(32,741)39,368

All amounts are expressed in thousands of Ghana cedis unless otherwise stated[ ]
Notes To The Financial Statementsfor the year ended 31 December 2015 All amounts are expressed in thousands
of Ghana cedis unless otherwise stated[ ]
2015 Annual Report70
2015
56,558(7,654)
48,90410,34659,250
204,675
51,169(2,265)10,34659,250
13. Income tax expense
Current income tax Deferred income tax (Note 14) Income tax expense National fiscal stabilisation levy
The tax on the Group and Bank’s profit before tax differs from the theoretical amount that would arise using the basic tax rate as follows:
Profit before taxCorporate tax rate at 25% (2014: 25%)Tax calculated at corporate tax rateTax impact on expenses not deductible for tax purposesNational fiscal stabilisation levy at 5% (2014: 5%)Income tax expense
GROUP BANK
2014
25,197(9)
25,1885,717
30,905
114,287
28,572(3,384)
5,71730,905
2015
56,277 (8,502)
47,77510,290
58,065
205,799
51,450(3,675)10,29058,065
2014
24,730211
24,9415,624
30,565
112,477
28,120(3,179)5,624
30,565
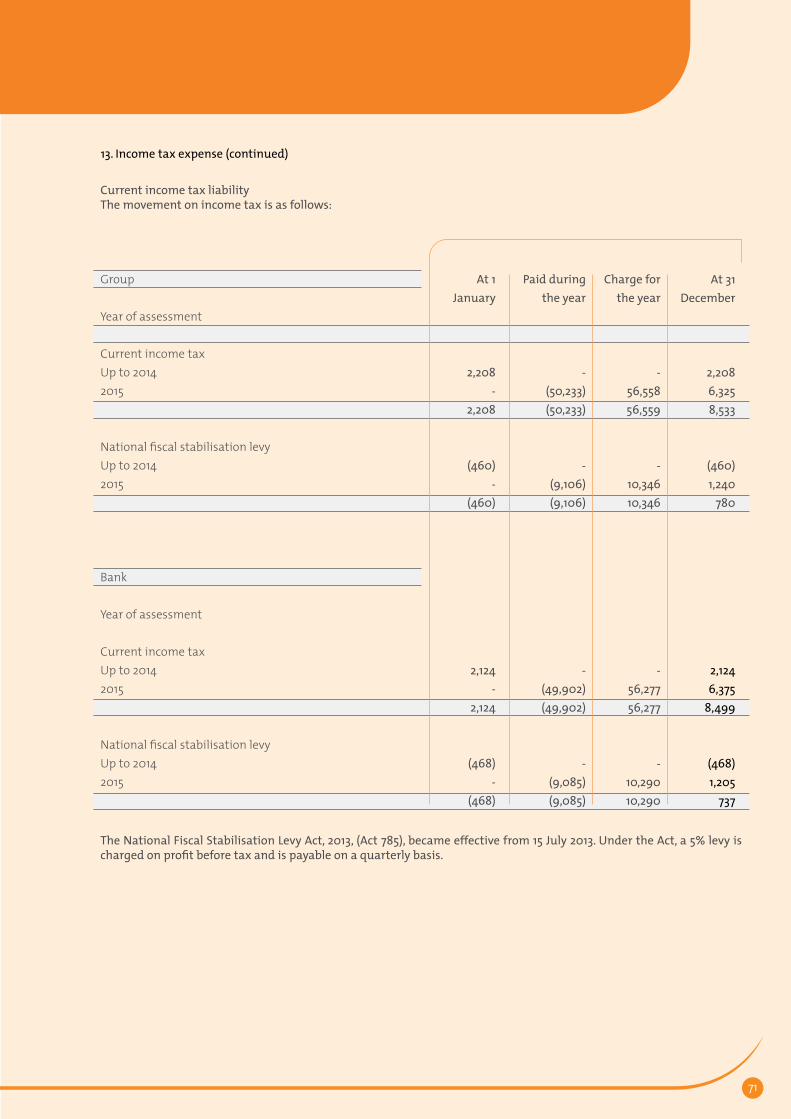
71
Group
Year of assessment
Current income taxUp to 20142015
National fiscal stabilisation levyUp to 20142015
Bank
Year of assessment
Current income taxUp to 20142015
National fiscal stabilisation levyUp to 20142015
At 1 January
2,208-
2,208
(460)-
(460)
2,124-
2,124
(468)-
(468)
Paid during the year
-(50,233)(50,233)
-(9,106)(9,106)
-(49,902)(49,902)
-(9,085)(9,085)
Charge for the year
-56,55856,559
-10,346
10,346
-56,27756,277
-10,29010,290
At 31 December
2,2086,3258,533
(460) 1,240
780
2,1246,375
8,499
(468)1,205
737
Current income tax liabilityThe movement on income tax is as follows:
The National Fiscal Stabilisation Levy Act, 2013, (Act 785), became effective from 15 July 2013. Under the Act, a 5% levy is charged on profit before tax and is payable on a quarterly basis.
13. Income tax expense (continued)

All amounts are expressed in thousands of Ghana cedis unless otherwise stated[ ]
Notes To The Financial Statementsfor the year ended 31 December 2015 All amounts are expressed in thousands
of Ghana cedis unless otherwise stated[ ]
2015 Annual Report72
Net
522(16,271)
-437
(15,312)
520(16,271)
437(15,314)
Assets
-(16,271)
-437
(15,834)
-(16,271)
437(15,834)
GROUP
Property and equipmentImpairment allowances for loan losses Other provisionsGains on available for sale investmentsNet tax (assets)/liabilities
BANK
Property and equipmentImpairment allowances for loan lossesGains on available for sale investmentsNet tax (assets)/liabilities
2015 2014
Assets
-(10,808)
-(806)
(11,614)
-(9,842)
(806)(10,648)
Liabilities
522---
522
520--
520
Liabilities
2,699-
14-
2,713
2,593--
2,593
Net
2,699(10,808)
14(806)
(8,901)
2,593(9,842)
(806)(8,055)
14. Deferred income tax
Deferred income tax is calculated using the enacted income tax rate of 25% (2014: 25%). Deferred income liabilities and deferred income tax charge in the statement of comprehensive income are attributable to the following items:

73
GROUP
2015
Property and equipmentImpairment allowance for loan lossesOther provisionsDeferred tax expense through comprehensive incomeDeferred tax expense through equity (gains on available for sale investments)Total
2014
Property and equipmentImpairment allowance for loan lossesOther provisionsDeferred tax expense through comprehensive incomeDeferred tax expense through equity (gains on available for sale investments)Total
GROUP
2014
Property and equipmentImpairment allowance for loan lossesDeferred tax expense through comprehensive incomeDeferred tax expense through equity (gains on available for sale investments)Total
At 1 January
2,699(10,808)
14(8,095)
(806)(8,901)
1,587(9,047)
-(7,460)
2,708(4,752)
1,587(9,047)(7,460)
2,708(4,752)
movement
(2,177)(5,463)
(14)(7,654)
1,243(6,411)
1,112(1,761)
14(635)
(3,514)(3,523)
1,006(795)
211
(3,514)(3,303)
At 31 December
522(16,271)
-(15,749)
437(15,312)
2,699(10,808)
14(8,095)
(806)(8,901)
2,593(9,842)(7,249)
(806)(8,055)
Deferred income tax is calculated using the enacted income tax rate of 25% (2014: 25%). Deferred income liabilities and deferred income tax charge in the statement of comprehensive income are attributable to the following items:
Mandatory reserve deposits are not available for use in the Bank’s day to day operations.Cash in hand and balances with Bank of Ghana are non-interest-bearing.
2015
101,213256,863358,076
(330,333)27,743
15. Cash and balances with Bank of Ghana
Cash in hand Balances with Bank of Ghana Less mandatory reserveUnrestricted cash and bank balances
GROUP BANK
2014
78,057175,252
253,309(193,388)
59,921
2015
101,213256,863358,076
(330,333)27,743
2014
72,138175,252
247,390(193,388)
54,002
14. Deferred income tax (continued)
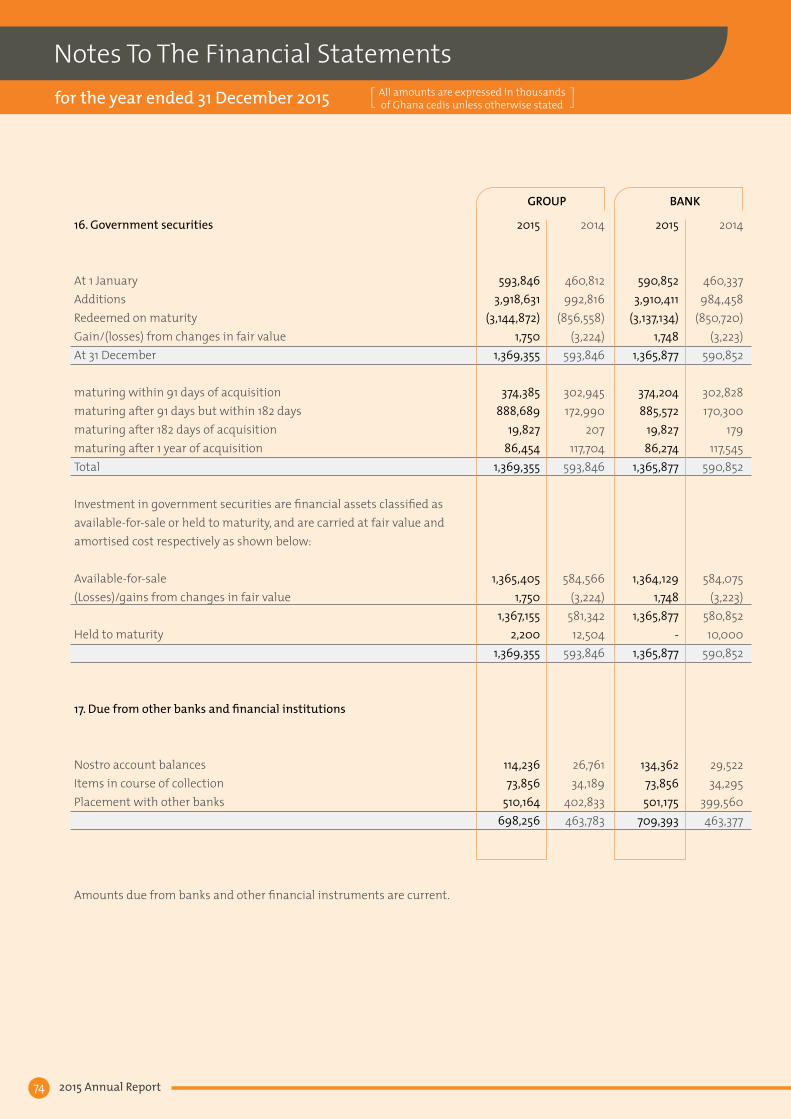
All amounts are expressed in thousands of Ghana cedis unless otherwise stated[ ]
Notes To The Financial Statementsfor the year ended 31 December 2015 All amounts are expressed in thousands
of Ghana cedis unless otherwise stated[ ]
2015 Annual Report74
2015
593,8463,918,631
(3,144,872)1,750
1,369,355
374,385888,689
19,82786,454
1,369,355
1,365,4051,750
1,367,1552,200
1,369,355
114,23673,856
510,164698,256
16. Government securities
At 1 JanuaryAdditionsRedeemed on maturityGain/(losses) from changes in fair valueAt 31 December
maturing within 91 days of acquisitionmaturing after 91 days but within 182 daysmaturing after 182 days of acquisitionmaturing after 1 year of acquisitionTotal
Investment in government securities are financial assets classified as available-for-sale or held to maturity, and are carried at fair value and amortised cost respectively as shown below:
Available-for-sale(Losses)/gains from changes in fair value
Held to maturity
17. Due from other banks and financial institutions
Nostro account balancesItems in course of collectionPlacement with other banks
Amounts due from banks and other financial instruments are current.
GROUP BANK
2014
460,812992,816
(856,558)(3,224)
593,846
302,945172,990
207117,704
593,846
584,566(3,224)
581,34212,504
593,846
26,76134,189
402,833463,783
2015
590,8523,910,411
(3,137,134)1,748
1,365,877
374,204885,572
19,82786,274
1,365,877
1,364,1291,748
1,365,877-
1,365,877
134,36273,856501,175
709,393
2014
460,337
984,458(850,720)
(3,223)590,852
302,828170,300
179117,545
590,852
584,075(3,223)
580,85210,000
590,852
29,52234,295
399,560463,377

75
18. Loans and advances to customers
2015
1,188,054350,564
16,3101,554,928(65,085)
1,489,843
625,625864,218
1,489,843
112,0531,127,545299,020
16,3101,554,928(65,085)
1,489,843
6,767192,912
150,949143,894382,671285,421
55,797336,091
4261,554,928(65,085)
1,489,843
4.19% 81%
(a) Analysis by type:
Term loansOverdraftsStaffGross loans and advances to customersImpairment allowance (Note 12)Net loans and advances to customers
Current Non current
(b) Analysis by type of customer:
IndividualsPrivate enterprisesState enterprise and public institutionsStaff
Impairment allowance (Note 12)Net loans and advances to customers
(c) Analysis by business segment
Agriculture, forestry and fishing Mining Manufacturing Construction Electricity, gas and water Commerce and finance Transport, storage and communication Services Miscellaneous Impairment allowance (Note 12) Net loans and advances to customers
(d) Key ratios on loans and advances
Loan loss provision ratio 50 largest exposures to total exposures
GROUP BANK
2014
1,388,998312,11710,829
1,711,944(50,940)
1,661,004
1,005,350655,654
1,661,004
132,8101,176,697391,608
10,8291,711,944(50,940)
1,661,004
11,509158,501
284,51982,625
401,029270,71593,034
392,28917,723
1,711,944(50,940)
1,661,004
2.98%78.64%
2015
1,188,054350,564
16,3101,554,928(65,085)
1,489,843
625,625864,218
1,489,843
112,0531,127,545299,020
16,3101,554,928(65,085)
1,489,843
6,767192,912
150,949143,894382,671285,421
55,797336,091
4261,554,928(65,085)
1,489,843
4.19% 81%
2014
1,287,243304,385
7,2701,598,898
(39,368)1,559,530
903,876655,654
1,559,530
132,7171,067,303
391,6087,270
1,598,898(39,368)
1,559,530
4,481158,501
266,45077,805
401,029230,64782,664
376,0611,260
1,598,898(39,368)
1,559,530
2.46%84.20%

All amounts are expressed in thousands of Ghana cedis unless otherwise stated[ ]
Notes To The Financial Statementsfor the year ended 31 December 2015 All amounts are expressed in thousands
of Ghana cedis unless otherwise stated[ ]
2015 Annual Report76
The Bank holds an 18.67% stake in Mustard Capital Partners Limited.
20. Investment in subsidiaries
The principal subsidiaries of the Bank are;
Following the acquisition of 100% of the ordinary shares of ProCredit Ghana by the Bank in October 2014, the operations of the two entities were merged in April 2015 in line with the strategic intent of the acquisition.
2015
53
104 (51) 53
Country of incorporation
GhanaMalaysia
Ghana
Type of shares
Ordinary sharesOrdinary shares
Ordinary shares
19. Investment in other equities
Mustard Capital Partners Limited
Movement in investment in other equity
At 1 JanuaryFair value adjustmentAt 31 December
Name Fidelity Securities LimitedFidelity Asia Bank LimitedProCredit Savings and Loans LimitedTotal
Nature of business
Fund managementBanking
Banking
GROUP BANK
2014
57
104 (47) 57
Percentage holding
100100
100
2015
53
104 (51) 53
2015
1018,163
-8,264
2014
57
104 (47) 57
2014
1018,163
36,743`
45,007

77
22. Property and equipment
GROUP
21. Other assets
201533,02211,60816,081
-47
60,758
GROUP BANK
201429,799
16,15711,887
46047
58,350
201533,02216,46415,105
-6,56871,159
2014 27,35819,1439,354
4681,003
57,326
Year ended December 2015
Motor vehiclesComputers – HardwareEquipmentFurniture and fittingsLeasehold improvementBuildingLandCapital work-in-progress
Total
Accumulated depreciation
Motor vehiclesComputers – HardwareEquipment Furniture and fittingsLeasehold improvementBuilding
Total Carrying value:
At 31 December 2015
Additions
-817
1,736390
27--
13,35716,327
Charge for the year
2,0452,9652,326
9481,319
-
9,603
At 1 January
9,33815,5319,7244,451
11,8832,127
18,45438,004109,512
At 1 January
5,012
10,0065,7842,6743,402
16
26,894
82,618
Transfers
-95
395229256
--
(975)-
------
-
Disposals
(3,115)-------
(3,115)
Disposals
(2,254)-----
(2,254)
At 31 December
6,22316,44311,8555,07012,166
2,12718,45450,386122,724
At 31 Dec
4,80312,9718,1103,6224,721
-
34,243
88,481
Prepayments Interest earned not collected Sundry assets National fiscal stabilisation levy (Note 13) Amounts due from associated companies
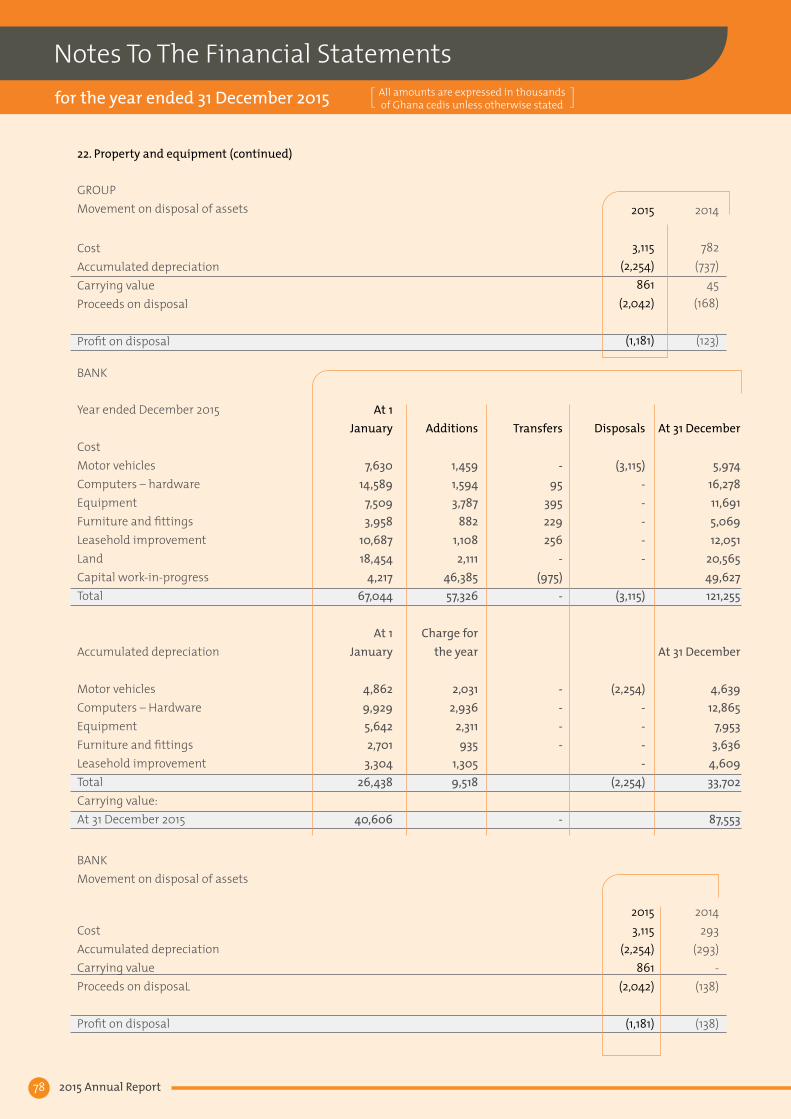
All amounts are expressed in thousands of Ghana cedis unless otherwise stated[ ]
Notes To The Financial Statementsfor the year ended 31 December 2015 All amounts are expressed in thousands
of Ghana cedis unless otherwise stated[ ]
2015 Annual Report78
GROUPMovement on disposal of assets
CostAccumulated depreciationCarrying valueProceeds on disposal
Profit on disposal
2015
3,115 (2,254)
861 (2,042)
(1,181)
2014
782(737)
45(168)
(123)
BANKMovement on disposal of assets
CostAccumulated depreciationCarrying valueProceeds on disposaL
Profit on disposal
20153,115
(2,254)861
(2,042)
(1,181)
2014293
(293)-
(138)
(138)
BANK
Year ended December 2015
CostMotor vehiclesComputers – hardwareEquipmentFurniture and fittingsLeasehold improvementLandCapital work-in-progressTotal
Accumulated depreciation
Motor vehiclesComputers – HardwareEquipment Furniture and fittingsLeasehold improvementTotal Carrying value:At 31 December 2015
Additions
1,4591,5943,787
8821,1082,111
46,38557,326
Charge for the year
2,0312,936
2,311935
1,3059,518
At 1 January
7,63014,589
7,5093,958
10,68718,454
4,21767,044
At 1 January
4,8629,9295,6422,701
3,30426,438
40,606
Transfers
-95
395229256
-(975)
-
----
-
Disposals
(3,115)-----
(3,115)
(2,254)----
(2,254)
At 31 December
5,97416,27811,6915,06912,051
20,56549,627121,255
At 31 December
4,63912,865
7,9533,636
4,60933,702
87,553
22. Property and equipment (continued)

79
22. Property and equipment (continued)
GROUP
Year ended December 2015
Cost Motor vehiclesComputers – HardwareEquipment Furniture and fittingsLeasehold improvementBuilding Land Capital work-in-progress
Total
Accumulated depreciation Motor vehiclesComputers – HardwareEquipment Furniture and fittingsLeasehold improvementBuilding
Total Carrying value:At 31 December 2015
Additions
1,6841,9892,778
6921,3322,127
-36,853
47,455
Charge for the year
1,8892,8161,648
7211,078
16
8,168
At 1 January
8,01213,127 7,0443,631 8,701
-18,454 3,870
62,839
At 1 January
3,4567,2804,3632,040
2,324-
19,463
43,376
Transfers
-506138225
1850--
(2,719)
-
Transfers
------
-
Disposals
(358)(91)
(236)(97)
----
(782)
Disposal
(333)(90)
(227)(87)
--
(737)
At 31 December
9,33815,5319,7244,451
11,8832,127
18,45438,004
109,512
At 31 December
5,01210,006
5,7842,6743,402
16
26,894
82,618

All amounts are expressed in thousands of Ghana cedis unless otherwise stated[ ]
Notes To The Financial Statementsfor the year ended 31 December 2015 All amounts are expressed in thousands
of Ghana cedis unless otherwise stated[ ]
2015 Annual Report80
BANK
Year ended December 2014Cost
Motor vehiclesComputers – hardwareEquipment Furniture and fittingsLeasehold improvementLand Capital work-in-progressTotal Accumulated depreciation Motor vehiclesComputers – HardwareEquipment Furniture and fittingsLeasehold improvement
Total Carrying value:At 31 December 2014
Additions
-1,025
340139193
-3,0664,763
Charge for the year
1,7312,6861,287
6731,0087,385
At 1 January
7,92313,058
7,0313,5948,644
18,4543,870
62,574
At 1 January
3,4247,243
4,355 2,0282,296
19,346
43,228
Transfers
-506138225
1,850-
(2,719)-
Charge for the year
------
-
Disposals
(293)------
(293)
Released on Disposal
(293)----
(293)
-
At 31 December
7,63014,589
7,5093,958
10,68718,454
4,21767,044
At 31 December
4,8629,9295,6422,701
3,30426,438
40,606
22. Property and equipment (continued)

81
23. Intangible assets
GROUP
BANK
Year ended December 2015
Cost Computer softwareCapital work in progressGoodwill (Note 38) Accumulated amortisation Computer software Carrying value: At 31 December 2015
Cost Computer softwareCapital work in progressGoodwill (Note 38)
Accumulated amortisation Computer software Carrying value: At 31 December 2015
Additions
9801,812
-2,792
Charge for the year
6,979
Additions
1,7461,813
2,3385,897
Charge for the year
6,711
At 1 January
20,1792,0182,338
24,535
At 1 January
12,411
12,124
At 1 January
18,3192,018
-20,337
At 1 January
12,254
8,083
Transfers
175(175)
--
Transfers
175(175)
--
At 31 December
21,3343,6552,338
27,327
At 31 December
19,390
7,937
At 31 December
20,2403,6562,338
26,234
At 31 December
18,965
7,269

All amounts are expressed in thousands of Ghana cedis unless otherwise stated[ ]
Notes To The Financial Statementsfor the year ended 31 December 2015 All amounts are expressed in thousands
of Ghana cedis unless otherwise stated[ ]
2015 Annual Report82
GROUP
BANK
Year ended December 2014
CostComputer softwareCapital work in progressGoodwill (Note 38)
Accumulated amortisation Computer software Carrying value: At 31 December 2014
Year ended December 2014
Cost Computer softwareCapital work in progress Accumulated amortisation Computer software Carrying value: At 31 December 2014
Additions
2,890836
2,338 6,064
Charge for the year
5,892
Additions
1,093836
1,929
Charge for the year
5,752
At 1 January
15,6982,773
-18,471
At 1 January
6,519
11,952
At 1 January
15,6332,775
18,408
At 1 January
6,502
11,906
Transfers
1,591(1,591)
--
-
Transfers
1,591(1,591)
-
At 31 December
20,1792,0182,338
24,535
At 31 December
12,411
12,124
At 31 December
18,3172,020
20,337
At 31 December
12,254
8,083
23. Intangible assets (continued)
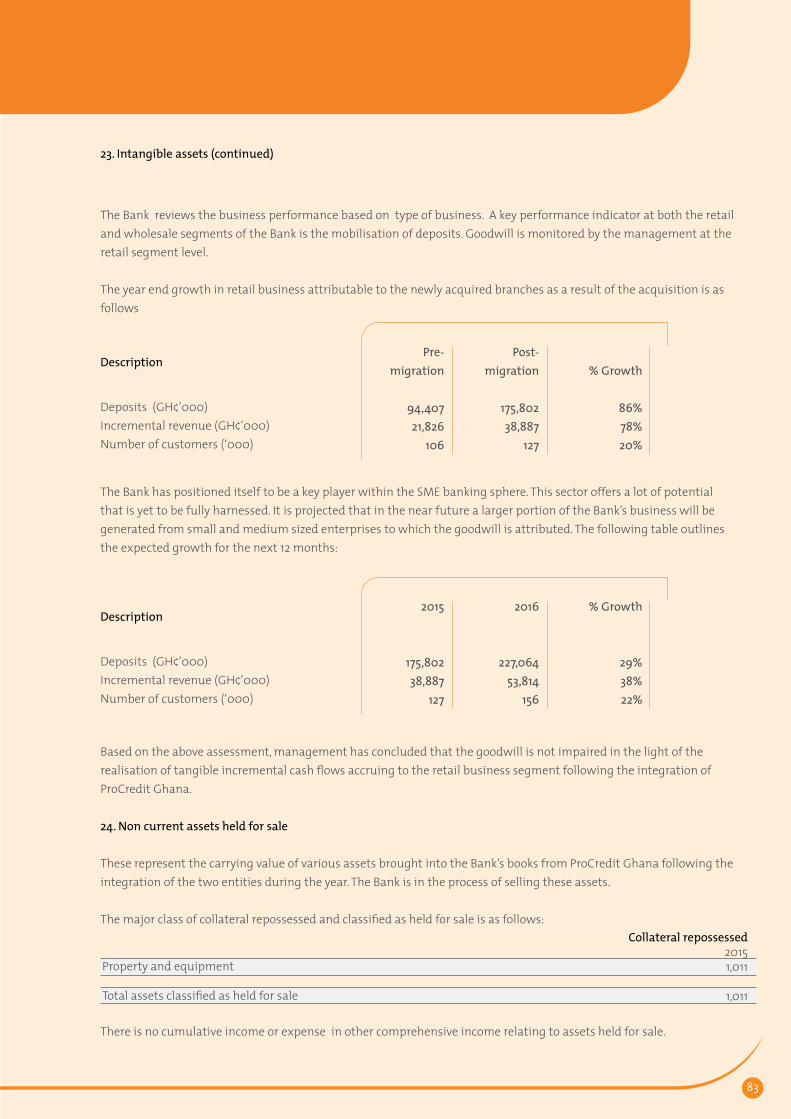
83
Description
Deposits (GH¢’000)Incremental revenue (GH¢’000)Number of customers (‘000)
Post-migration
175,80238,887
127
Pre-migration
94,40721,826
106
% Growth
86%78%20%
Description
Deposits (GH¢’000)Incremental revenue (GH¢’000)Number of customers (‘000)
2016
227,064
53,814156
2015
175,80238,887
127
% Growth
29%38%22%
The Bank reviews the business performance based on type of business. A key performance indicator at both the retail and wholesale segments of the Bank is the mobilisation of deposits. Goodwill is monitored by the management at the retail segment level.
The year end growth in retail business attributable to the newly acquired branches as a result of the acquisition is as follows
The Bank has positioned itself to be a key player within the SME banking sphere. This sector offers a lot of potential that is yet to be fully harnessed. It is projected that in the near future a larger portion of the Bank’s business will be generated from small and medium sized enterprises to which the goodwill is attributed. The following table outlines the expected growth for the next 12 months:
Based on the above assessment, management has concluded that the goodwill is not impaired in the light of the realisation of tangible incremental cash flows accruing to the retail business segment following the integration of ProCredit Ghana.
24. Non current assets held for sale
These represent the carrying value of various assets brought into the Bank’s books from ProCredit Ghana following the integration of the two entities during the year. The Bank is in the process of selling these assets.
The major class of collateral repossessed and classified as held for sale is as follows:
There is no cumulative income or expense in other comprehensive income relating to assets held for sale.
Property and equipment
Total assets classified as held for sale
Collateral repossessed20151,011
1,011
23. Intangible assets (continued)
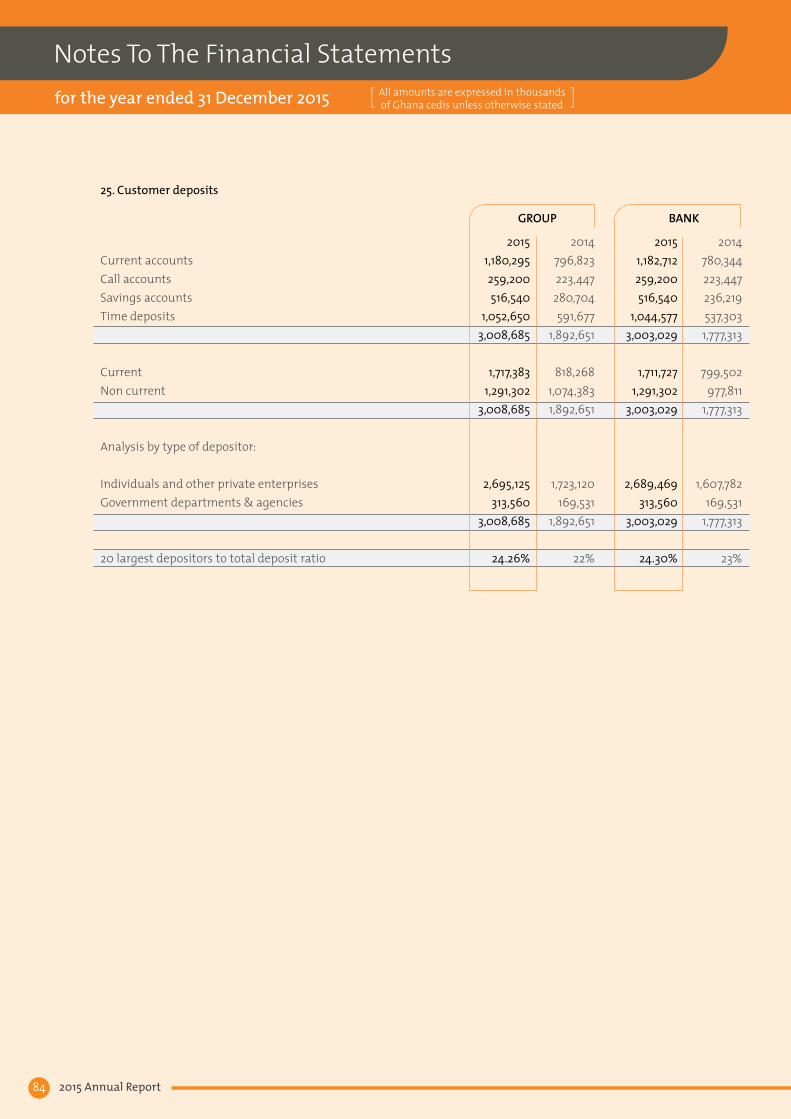
All amounts are expressed in thousands of Ghana cedis unless otherwise stated[ ]
Notes To The Financial Statementsfor the year ended 31 December 2015 All amounts are expressed in thousands
of Ghana cedis unless otherwise stated[ ]
2015 Annual Report84
25. Customer deposits
20151,180,295259,200516,540
1,052,6503,008,685
1,717,3831,291,302
3,008,685
2,695,125313,560
3,008,685
24.26%
Current accountsCall accountsSavings accountsTime deposits
Current Non current
Analysis by type of depositor:
Individuals and other private enterprisesGovernment departments & agencies
20 largest depositors to total deposit ratio
GROUP BANK
2014796,823223,447
280,704591,677
1,892,651
818,2681,074,3831,892,651
1,723,120169,531
1,892,651
22%
20151,182,712259,200516,540
1,044,5773,003,029
1,711,7271,291,302
3,003,029
2,689,469313,560
3,003,029
24.30%
2014780,344223,447236,219537,303
1,777,313
799,502977,811
1,777,313
1,607,782169,531
1,777,313
23%
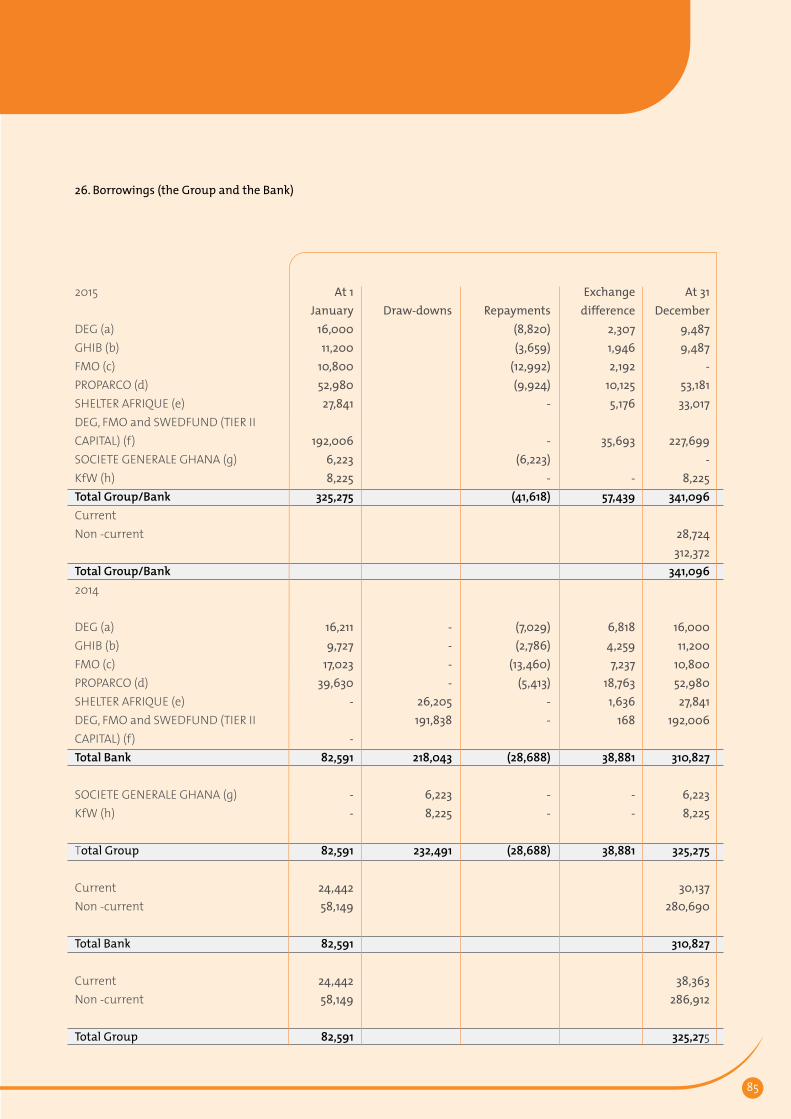
85
2015
DEG (a)GHIB (b)FMO (c)PROPARCO (d)SHELTER AFRIQUE (e)DEG, FMO and SWEDFUND (TIER II CAPITAL) (f)SOCIETE GENERALE GHANA (g)KfW (h)Total Group/BankCurrentNon -current
Total Group/Bank2014
DEG (a)GHIB (b)FMO (c)PROPARCO (d)SHELTER AFRIQUE (e)DEG, FMO and SWEDFUND (TIER II CAPITAL) (f)Total Bank
SOCIETE GENERALE GHANA (g)KfW (h)
Total Group
CurrentNon -current
Total Bank
CurrentNon -current
Total Group
Repayments(8,820)(3,659)
(12,992)(9,924)
-
-(6,223)
-(41,618)
(7,029)(2,786)
(13,460)(5,413)
- -
(28,688)
- -
(28,688)
Draw-downs
----
26,205191,838
218,043
6,223 8,225
232,491
At 1 January
16,00011,200
10,80052,98027,841
192,0066,223
8,225325,275
16,2119,727
17,02339,630
-
-82,591
- -
82,591
24,442 58,149
82,591
24,442 58,149
82,591
Exchange difference
2,3071,9462,192
10,1255,176
35,693
- 57,439
6,8184,2597,237
18,7631,636
168
38,881
- -
38,881
At 31 December
9,4879,487
-53,18133,017
227,699-
8,225341,096
28,724312,372
341,096
16,00011,200
10,80052,98027,841
192,006
310,827
6,223 8,225
325,275
30,137280,690
310,827
38,363286,912
325,275
26. Borrowings (the Group and the Bank)

All amounts are expressed in thousands of Ghana cedis unless otherwise stated[ ]
Notes To The Financial Statementsfor the year ended 31 December 2015 All amounts are expressed in thousands
of Ghana cedis unless otherwise stated[ ]
2015 Annual Report86
(a) Deutsche Investitions- und Entwicklungsgesellschaft (DEG)Deutsche Investitions- und Entwicklungsgesellschaft (DEG) made available to the Bank a loan of US$10 million by an agreement dated 25 November, 2011, to exclusively finance eligible projects by means of sub-loans to local, small and medium scale enterprises over a period of 4 years. Interest on the loan is at an aggregate interest rate of 3 months USD LIBOR rate plus 4.5% p.a.
(b) Ghana International Bank Plc (GHIB)Ghana International Bank Plc (GHIB) made available to the Bank a loan amount of US$5million by an agreement dated 3 April, 2014, for on-lending to the Bank’s customers or for general corporate purposes. Interest rate applicable to the loan is the sum of the applicable US prime rate and the margin of 2.75% per annum over a 5 year period.
(c) NederlandseFinancierings-MaatschappijVoorOntwikkelingslanden N.V (FMO)NederlandseFinancierings-MaatschappijVoorOntwikkelingslanden N.V (FMO) made available to the Bank a USD term facility in an aggregate amount of US$ 15 million,by an agreement dated 8 September 2010, in two phases; Phase 1 to the maximum aggregate amount of US$ 10 million and Phase 2 to the maximum aggregate amount of US$5 million. The purpose of the loan is to finance SMEs in Ghana that generate USD or EUR revenues. The facility is for a period of 5 years at an aggregate interest rate of the 3 months USD LIBOR plus 4.35% p.a.
(d) Societe de Promotion et de Participation Pour la Cooperation Economique (PROPARCO)A loan of US$ 8 million was granted the Bank by Societe de Promotion et de Participation Pour la Cooperation Economique (PROPARCO) by an agreement dated 13 July, 2011. The loan facility is for the purposes of on-lending to the Bank’s customers over a period of 5 years. The interest rate is the sum of 6 months LIBOR USD rate, the basis swap rate on the determination date and the applicable margin of 4.35%. A further US$ 13 million was granted to the Bank on 31 December 2014 for the purposes of on-lending to its customers. The facility is for a period of ten (10) years at an interest rate of the sum of 6 months LIBOR USD rate, the basis swap rate on the determination date of 0.175% p.a. and the applicable margin of 4.475% p.a.
(e) Shelter AfriqueOn 11 March 2014, Shelter Afrique extended a term loan of US$8.7million to the Bank for on-lending to mortgage seekers for home purchase, home completion, home improvement and home extension in Ghana at an interest rate of 6 month LIBOR plus a margin of 5.5% per annum over a period of 10 years, Repayment is on half-yearly basis.
(f) Tier II CapitalOn 1 August 2014, at the Bank’s request, DEG, FMO and SWEDFUND INTERNATIONAL AKTIEBOLAG (“SWEDFUND”), provided a seven-year subordinated term loan facility of US$60 million for the purpose of increasing the Bank’s Tier II Capital under the Banking Act of Ghana, 2004 (Act 673) as amended by the Banking Amendment Act, 2007 (Act 738), and supporting the growth strategy of the Bank. The rate of interest on the loan for each interest period is the percentage rate per annum which is the aggregate of the applicable margin and LIBOR, the current rate being 7.79%. The facility is unsecured and repayment is subordinated to other debt instruments. It is also not available to absorb the losses of the Bank while it continues trading.
26. Borrowings (the Group and the Bank) (continued)

87
(g) Societe Generale Ghana (SG Ghana)On 4 July 2013, ProCredit Ghana, a subsidiary of the Bank, entered into a four year loan agreement with SG Ghana to partly finance the construction of the borrower’s head office building. The total approved amount advanced was GH¢ 7 million with an interest rate of 19% per annum. The Bank paid off the outstanding balance on the loan on 3o April 2015, following the integration of ProCredit Ghana into the Bank’s operations.
(h) KfWOn 29 August 2013, ProCredit Ghana, obtained a six (6) year subordinated loan of GH¢ 8,225,090 from KfW at a rate of 14% per annum to support its rural finance programme. Repayment of principal and interest will be in a bullet at the end of the term. The Bank took over the principal and interest payment obligations on 11 April 2015 following the merger of operations of both entities.
26. Borrowings (the Group and the Bank) (continued)

All amounts are expressed in thousands of Ghana cedis unless otherwise stated[ ]
Notes To The Financial Statementsfor the year ended 31 December 2015 All amounts are expressed in thousands
of Ghana cedis unless otherwise stated[ ]
2015 Annual Report88
27. Other liabilities
28. Earnings per share
The calculation of basic earnings per share as at 31 December 2015 was based on the profit attributable to ordinary shareholders of GH¢147.73 million (2014; GH¢81.91 million) and a weighted average number of ordinary shares outstanding of 25.25 million (2014: 23.357 million), calculated as follows:
There were no potentially dilutive instruments outstanding at the date of the statement of financial position.
2015
33,985127,368
780162,133
2015
145,425
25,250-
25,250 5.76 5.76
Accrued interest payable Other creditors and accruals National fiscal stabilisation levy (note13)
Profit attributable to ordinary shareholdersNet profit for the year Weighted average number of ordinary shares (000’ of shares)Issued ordinary shares at 1 JanuaryEffect of additional issue of sharesWeighted average number of ordinary shares at 31 DecemberBasic earnings per share (GH¢)Diluted earnings per share (GH¢)
GROUP
GROUP
BANK
BANK
2014
23,232
123,530-
146,762
2014
83,382
17,6755,682
23,357 3.57 3.57
2015
33,985135,801
737170,523
2015
147,734
25,250-
25,250 5.85 5.85
2014
21,688
119,276-
140,964
2014
81,912
17,6755,682
23,357 3.51
3.51
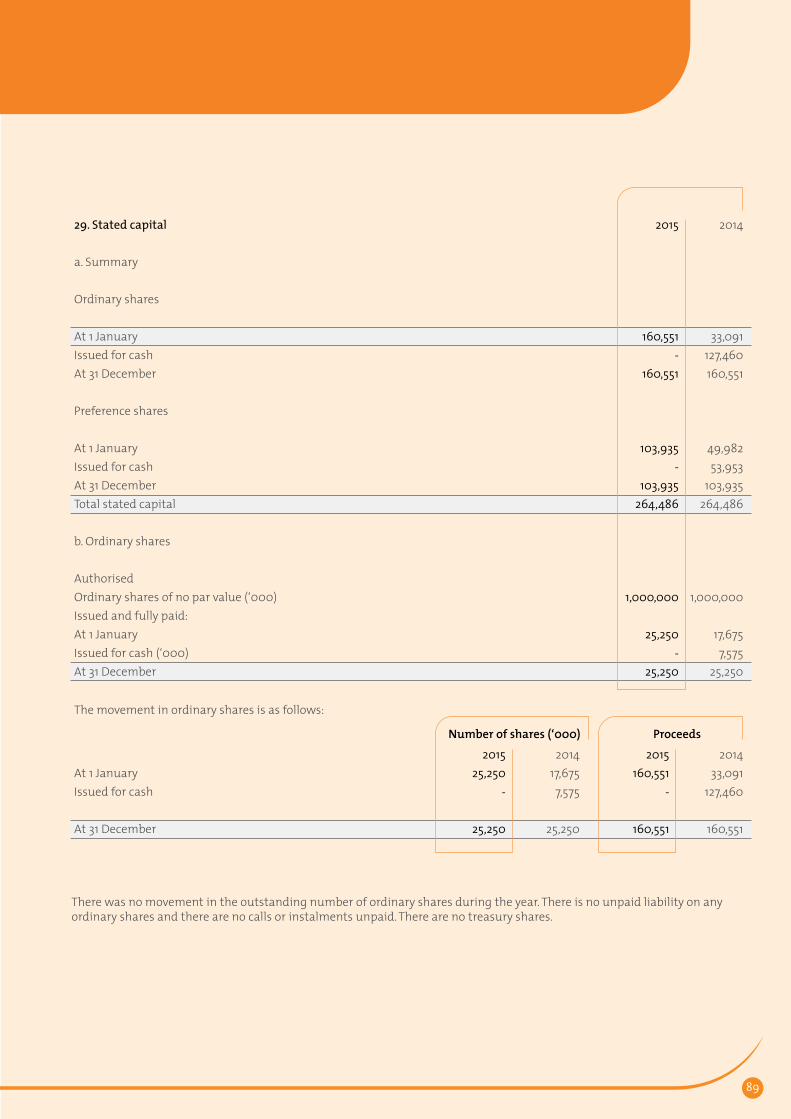
89
There was no movement in the outstanding number of ordinary shares during the year. There is no unpaid liability on any ordinary shares and there are no calls or instalments unpaid. There are no treasury shares.
The movement in ordinary shares is as follows:
Number of shares (‘000) Proceeds
29. Stated capital
a. Summary
Ordinary shares
At 1 JanuaryIssued for cashAt 31 December
Preference shares
At 1 JanuaryIssued for cashAt 31 DecemberTotal stated capital
b. Ordinary shares
Authorised Ordinary shares of no par value (‘000)Issued and fully paid:At 1 JanuaryIssued for cash (‘000)At 31 December
At 1 January Issued for cash
At 31 December
2015
160,551-
160,551
103,935-
103,935264,486
1,000,000
25,250-
25,250
2015160,551
-
160,551
201525,250
-
25,250
2014
33,091127,460160,551
49,98253,953
103,935264,486
1,000,000
17,6757,575
25,250
201433,091
127,460
160,551
201417,675
7,575
25,250

All amounts are expressed in thousands of Ghana cedis unless otherwise stated[ ]
Notes To The Financial Statementsfor the year ended 31 December 2015 All amounts are expressed in thousands
of Ghana cedis unless otherwise stated[ ]
2015 Annual Report90
There was no movement in the outstanding number of preference shares during the year.The preference shares are perpetual securities and have no maturity date. They have the option of converting into ordinary shares as stated in the agreement.
30. Statutory reserveThis is a non-distributable reserve representing transfer of 50% of profit after tax. It is an accumulation of amounts set aside in accordance with Section 29 of The Banking Act, 2004 (Act 673) as amended by the Banking Act, 2007 (Act 738). The movement is included in the statement of changes in equity.
The movement in preference shares is as follows:
Number of shares (‘000) Proceeds
At 1 January Issued for cashAt 31 December
2015103,935
-103,935
201510,400
-10,400
201449,98253,953
103,935
20146,400 4,000
10,400
c. Preference shares
Authorised Preference shares (‘000)Issued and fully paid:At 1 JanuaryIssued for cash (‘000)At 31 December
2015
50,000
10,400-
10,400
2014
50,000
6,4004,000
10,400
29. Stated capital (continued)

91
31. Other reservesThis is a non-distributable reserve representing transfer of 50% of profit after tax. It is an accumulation of amounts set aside in accordance with Section 29 of The Banking Act, 2004 (Act 673) as amended by the Banking Act, 2007 (Act 738). The movement is included in the statement of changes in equity.
GROUP
Year ended 31 December, 2015
At 1 January 2015Change in fair value of available for sale investment securities - grossChange in fair value of available for sale investment securities - taxChange in fair value of equity securityForeign currency translation differences of foreign subsidiary
At 31 December 2015
Year ended 31 December, 2014
At 1 January 2014
Change in fair value of available for sale investment securities - grossChange in fair value of available for sale investment securities - taxChange in fair value of equity securityForeign currency translation differences for foreign subsidiary
At 31 December 2014
Revaluation reserve
(119)
-
-(4)
-(4)
(123)
(72)
-
(47)-
(47)
(119)
Available for sale reserve
(2,418)
4,972
(1,243)
-3,729
1,311
8,123
(14,055)
3,514-
- (10,541)(2,418)
Translation reserve 5,981
-
-
2,3912,3918,372
1,463
-
4,5184,5185,981
Total
3,444
4,972
(1,243)(4)
2,3916,116
9,560
9,514
(14,055)
3,514(47)
4,518(6,070)
3,444

All amounts are expressed in thousands of Ghana cedis unless otherwise stated[ ]
Notes To The Financial Statementsfor the year ended 31 December 2015 All amounts are expressed in thousands
of Ghana cedis unless otherwise stated[ ]
2015 Annual Report92
32. Regulatory credit risk reserveThis is an accumulation of transfers from the income surplus account to meet the minimum regulatory requirements in respect of allowance for credit losses for non-performing loans and advances. The movement is included in the statement of changes in equity.
33. Income surplus accountThis represents the accumulated profits over the years after appropriations. The balance is available for distribution to shareholders.
BANK
Year ended December 2015
At 1 January 2015Change in fair value of available for sale investment securities - grossChange in fair value of available for sale investment securities - taxChange in fair value of equity security
At 31 December 2015
Year ended 31 December, 2014
At 1 January 2014Change in fair value of available for sale investment securities - grossChange in fair value of available for sale investment securities - taxChange in fair value of equity security
At 31 December 2014
Revaluation reserve
(3)
-
-(4)(4)(7)
44
-
(47)(47)
(3)
Available for sale reserve
(2,417)
4,971
(1,243)-
3,7281,311
8,123
(14,054)
3,514-
(10,540)(2,417)
Total
(2,420)
4,971
(1,243)(4)
3,7241,304
8,167
(14,054)
3,514(47)
(10,587)(2,420)
31. Other reserves (continued)

93
35. Related party disclosures
A number of banking transactions are entered into with related parties in the normal course of business. These include loans, deposits and foreign currency transactions with subsidiaries, key management personnel and officers and other employees.
(i) Transactions with subsidiaries
Transactions between Fidelity Bank Ghana Limited and its subsidiaries meet the definition of related party transactions.
The following transactions were carried out with subsidiaries:
Interest incomeInterest expenseFee and commission incomeOther expenses
(ii) Year end balances resulting from transactions with subsidiaries
Placement with subsidiaries Deposits from subsidiariesAmount due from subsidiaries
2015
1,2893,330
111 9
20,8734,501
921
2014
9692,682
61,689
17,6019,944 958
34. Cash and cash equivalentsFor the purposes of the statement of cash flow, cash and cash equivalents comprise the following:
2015
27,743698,256374,385
1,100,384(56,756)
1,043,628
Unrestricted cash and balances with Bank of Ghana (Note15)Due from banks and other financial institutions (Note 17)Government securities maturing within 91 days (Note 16)
Less due to other banks and financial institutions
Cash and cash equivalents
GROUP BANK
2014
59,921463,783302,945826,649
(375,428)
451,221
2015
27,743709,393374,2041,111,340 (86,722)
1,024,618
2014
54,002463,377302,828820,207
(404,229)
415,978

All amounts are expressed in thousands of Ghana cedis unless otherwise stated[ ]
Notes To The Financial Statementsfor the year ended 31 December 2015 All amounts are expressed in thousands
of Ghana cedis unless otherwise stated[ ]
2015 Annual Report94
Interest rates charged on balances outstanding on staff loans are based on agreed terms and conditions. Secured loans granted are secured over property of the respective borrowers. No impairment losses have been recorded against balances outstanding during the period with key management and therefore no specific allowances have been made for impairment losses on balances with key management.
Remuneration paid to non executive directors in the form of fees, allowances and related expenses are disclosed in Note 11.
Key management personnel compensation;
36. Contingencies and commitments
(a) Guarantees and indemnitiesThe Bank had outstanding guarantees, indemnities and endorsements at the year end of GH¢246.7million (2014: GH¢220.17million).
(b) Documentary creditThe Bank had established documentary credits at year end of GH¢138million (2014: GH¢89.4million).
(c) CommitmentsThe Bank had loan commitments amounting to GH¢37.95million at the end of the year (2014: nil ).
(iii) Transactions with key management personnel
Key management personnel are defined as persons having authority and responsibility for planning, directing and controlling the activities of Fidelity Bank Ghana Limited and comprise the Directors and officers of Fidelity Bank Ghana Limited.
Loan balances due from key management personnel are as follows:
Executive directorsNon executive directorsOfficers and other employeesTotal
Salaries and short-term employee benefitsSocial security fund contributionProvident fund contribution
2015
1,9071,541
23,57027,018
2015
4,044417331
4,792
2014
2,0782,429
16,72021,227
2014
3,795381
2964,472
35. Related party disclosures (continued)
95
38. Business combination
(i) Acquisition of ProCredit Savings and Loans Company Limited
On 1 October 2014, the Bank acquired 100% of the voting shares of ProCredit Savings and Loans Company Limited (“ProCredit Ghana”) from ProCredit Holding Germany (PCH) and the DOEN Foundation of the Netherlands. The Bank acquired ProCredit Ghana to accelerate its growth strategy and to support the SME sector, which is the engine of growth of the economy. The Bank has a strategic focus to provide services to all sectors of the market; from high-end to the unbanked, and the SME sector forms a vital part of its target market.
(ii) Integration of ProCredit Ghana
At an extraordinary general meeting of the Company held on 23 September 2014, a special resolution was passed to merge and integrate the operations of ProCredit Ghana with Fidelity Bank within 12 months of completion of the acquisition. On 11 April 2015, the Company completed the merger and integration of the two entities and in November 2015 commenced the official liquidation of ProCredit Ghana after obtaining a “no objection” approval from the Bank of Ghana.
(iii) Goodwill
The Bank recognised goodwill of GH¢2,338,000 on the acquisition and attributed it to the expected growth and synergies arising from the acquisition, and the acquired customer base which could not be separately recognised as an intangible asset.
37. Regulatory disclosures
(i) Non-performing loans ratioPercentage of gross non-performing loans (“sub standard to loss”) to total credit/advances portfolio (gross) was 2.27% (2014: 2.52%).
(ii) Amount of loans written-offThe Bank wrote off a total amount of GH¢54 million (in principal and unpaid interest) on loans and advances assessed and found to be uncollectible.
(iii) Breaches in statutory liquidityThe Bank complied with all requirements with respect to statutory liquidity.

1
2
3
4
5
6
7
8
9
10
11
12
13
14
15
16
17
18
19
20
Africa Capital LLC
KTH Africa Investments
Social Security & National Insurance Trust
Amethis Finance Netherlands B. V.
ERES Invest Coöperatief U. A.
ENO International LLC
SIC Life Company Limited
Lifeforms Limited
Mr. Kwamina Duker
Mr. Edward Effah
H.E. Mrs. Johanna Svanikier
Mr. Bernard Lind
Fidelity Trust
Mr. Philip Addison
Mr. Jonathan Adjetey
Ghana Commercial Bank
Business Development Consultancy
Mr. Jim Baiden
Mr. Alex Dodoo
Prof. John & Dr. (Mrs.) Margaret Gyapong
Total
Others
Grand Total
No. of Shares
8,570,250
4,147,500
2,400,000
1,893,750
1,893,750
1,515,000
1,065,818
690,000
511,250
395,000
258,970
200,000
194,394
150,000
125,000
125,000
125,000
85,000
82,424
60,000
24,525,606
724,394
25,250,000
Percentage
33.94%
16.43%
9.50%
7.50%
7.50%
6.00%
4.22%
2.73%
2.02%
1.56%
1.03%
0.79%
0.77%
0.59%
0.50%
0.50%
0.50%
0.34%
0.33%
0.24%
97.13%
2.87%
100%
Top 20 Ordinary Shareholders as at 31 December 2015
2015 ShareholdingName of shareholder
All amounts are expressed in thousands of Ghana cedis unless otherwise stated[ ]
Shareholder Information
2015 Annual Report98

Category1 - 50,00050,001 - 500,000500,001 - 1,000,000Over 1,000,000Total
DirectorsWilliam Panford BrayEdward EffahKwamina DukerH. E. Mrs Johanna SvanikierJim BaidenAlex DodooTotal
Shareholder
AIAKKTH Africa InvestmentsSSNITSIC Life Amethis Finance Netherlands B.V.ERES Invest Coöperatief U. A.Total
Number of Shareholders251327
47
Number of Shares 52,424
395,000511,250
258,970 85,000
82,424 1,385,068
No. of Pref shares
4,000,000 2,000,000 1,400,000 1,000,000 1,000,000 1,000,000
10,400,000
Number of Shares471,970
2,090,7121,201,250
21,486,06825,250,000
% Holding1.87%8.28%4.76%
85.09% 100.00%
% Holding0.21%1.56%2.02%1.03%0.34%0.33%5.49%
% Holding
38.46%19.23%13.45%9.62%9.62%9.62%
100.00%
Analysis of shareholding as at 31 December 2015
Directors’ holding
Preference Shareholders as at 31 December, 2015
99


Believe with us.
Contact Centre: 3355 | www.fidelitybank.com.gh