corporate profit shifting and the role of tax havens
TRANSCRIPT
88382021
January 2021
Corporate Profit Shifting and the Role of Tax Havens: Evidence from German Country-By-Country Reporting Data Clemens Fuest, Felix Hugger, Florian Neumeier

Impressum:
CESifo Working Papers ISSN 2364-1428 (electronic version) Publisher and distributor: Munich Society for the Promotion of Economic Research - CESifo GmbH The international platform of Ludwigs-Maximilians University’s Center for Economic Studies and the ifo Institute Poschingerstr. 5, 81679 Munich, Germany Telephone +49 (0)89 2180-2740, Telefax +49 (0)89 2180-17845, email [email protected] Editor: Clemens Fuest https://www.cesifo.org/en/wp An electronic version of the paper may be downloaded · from the SSRN website: www.SSRN.com · from the RePEc website: www.RePEc.org · from the CESifo website: https://www.cesifo.org/en/wp
CESifo Working Paper No. 8838
Corporate Profit Shifting and the Role of Tax Havens: Evidence from German
Country-By-Country Reporting Data
Abstract
This paper is the first to use information from individual country-by-country (CbC) re-ports to assess the extent of profit shifting by multinational enterprises. Unlike other data often used to evaluate the extent of profit shifting and tax avoidance, CbC reports pro-vide a complete coverage of the global distribution of profits and indicators of economic activity for multinationals exceeding a certain revenue threshold. We show that 82% of the German multinationals subject to CbC reporting have tax haven subsidiaries and that these subsidiaries are notably more profitable than those in non-havens. However, only 9% of the global profits of German multinationals are reported in tax havens. Results from regression analysis suggest that approximately 40% of the profits reported in tax havens are a result of tax-induced profit shifting. The associated annual tax base loss for Germany amounts to EUR 5.4 billion. Adding estimates of profit shifting by multinationals not covered by the CbC data yields an overall estimate for profits shifted out of Germany to tax havens of EUR 19.1 billion per year, corresponding to 4.3% of the profits reported by these firms in Germany. This implies a tax revenue loss due to corporate profit shifting to tax havens of EUR 5.7 billion per year. JEL-Codes: F230, H250, H260. Keywords: corporate taxation, tax avoidance, profit shifting, multinational enterprises, country-by-country reporting.
Clemens Fuest ifo Institute – Leibniz Institute for Economic
Research at the University of Munich / Germany [email protected]
Felix Hugger University of Munich / Germany
Florian Neumeier ifo Institute – Leibniz Institute for Economic Research
at the University of Munich / Germany [email protected]
January 8, 2021 This research includes work undertaken on behalf of and financed by the German Federal Ministry of Finance. However, this work should not be construed to represent the Ministry’s position or that of any of its staff members. The work was done independently by the authors and on their own responsibility. The views expressed in this paper are thus those of the authors. We thank Michelle Hanlon, James Hines, Rebecca Lester, Andreas Peichl, Dominik Sachs, Juan Carlos Suárez Serrato, participants of the NBER workshop on ‘Business Taxation in a Federal System’ and a workshop organized by the Center for Economic Studies in Munich for helpful comments on earlier versions of this paper. The usual disclaimer applies.
1 Introduction
Tax avoidance and profit shifting activities by multinational enterprises (MNEs) trigger heatedpublic debates. There is a widespread view that MNEs shift a large proportion of their profits tolow-tax countries or ‘tax havens’ so that they do not pay their fair share in high-tax countrieswhere they produce and sell most of their products. There is a growing body of academicresearch supporting this view by showing that MNEs’ activities in low-tax countries are farmore profitable than their activities in high-tax countries or than those of local firms. However,empirical work on international corporate tax avoidance suffers from severe data limitations,mostly due to a lack of information about MNEs’ activities in tax havens.
This paper investigates profit shifting using new data from country-by-country (CbC) re-ports filed by large German MNEs. These reports provide complete coverage of the global dis-tribution of their profits, sales, employees, fixed assets, and other variables. They also includedata on cross-border transactions within multinational groups, which are important instru-ments for profit shifting. CbC reporting has been introduced in the context of the OECD/G20Base Erosion and Profit Shifting (BEPS) project.1 In Germany, a CbC reporting obligationwas introduced in 2016.
The main results of our analysis are as follows. First, we find that 82% of the German MNEsin our sample have subsidiaries in tax havens.2 These subsidiaries are much more profitablethan those in non-haven countries. The share of profits reported in tax havens is not very largethough – just 9% of global profits. At the same time, only 4% of German MNEs’ tangibleassets and 3% of their employees are located in tax havens. Of the tax haven profits, 87% arereported in European tax havens like Switzerland, Ireland, and the Netherlands. Tax havensoutside Europe such as Bermuda, the British Virgin Islands, or the Cayman Islands only playa minor role. Second, we estimate that tax-induced profit shifting by large German MNEsincreases the profits they report in tax havens by EUR 9 billion per year. This is roughly equalto 3% of their worldwide profits, and less than the amount of profit shifting found in otherrecent studies. For instance, Zucman (2014) estimates that US MNEs shift almost 20% of theirprofits to tax havens; Tørsløv et al. (2018) estimate that globally, 40% of the profits MNEsreport outside their country of residence are shifted to tax havens.
1 CbC reporting is mandatory for MNEs with consolidated revenues of at least EUR 750 million and whoseheadquarters are located in one of the 90 member countries of the Inclusive Framework on BEPS that introduceda corresponding filing obligation into national legislation (see Section 2 for details).
2 Gumpert et al. (2016) use data from the German Bundesbank on foreign subsidiaries of German MNEs andfind that only 20% of all German MNEs have a tax haven presence. This discrepancy is most likely due todifferences in the samples. The data of Gumpert et al. (2016) covers a much larger fraction of German MNEsas the size threshold for inclusion in the Bundesbank sample is much lower. Moreover, their sample covers theyears from 2002 to 2008, while our data is for 2016 and 2017. For the US, Desai et al. (2006) report that 59%of US MNEs have tax haven subsidiaries.
2
Third, findings from regression analyses show that profits as well as intra-firm revenuesreported by large German MNEs in a country are sensitive to effective average tax rates. Inour baseline specification, we identify a semi-elasticity of profits with respect to differences inthe effective average tax rate of -0.5 and a tax semi-elasticity of intra-firm revenues of -1.3. Incontrast, differences in standard (‘headline’) statutory tax rates do not seem to play a role.We attribute this finding to the fact that nowadays, tax competition between countries mainlytakes place through instruments other than statutory tax rates, such as R&D tax subsidies,patent boxes, and tax exemptions. As a result, statutory tax rates are an imperfect measureof the actual tax burden. Moreover, our regression results confirm that profit shifting by largeGerman MNEs mainly takes place through tax havens, whereby European tax havens are farmore important for German MNEs than tax havens outside Europe. Fourth, the larger they are(in terms of consolidated revenues), the more profits German MNEs shift to tax havens. Fifth,we demonstrate that using Orbis data in profit shifting regressions leads to biased estimates,as they contain a systematic measurement error.
This paper contributes to a growing body of research on tax avoidance by MNEs. Theextent of tax avoidance by MNEs is typically assessed based on estimates of the tax-sensitivityof pre-tax profits. In a recent survey of the literature, Beer et al. (2020) review 37 studies thatempirically evaluate the tax elasticity of MNE profits. These studies can be broadly dividedinto two groups. The first group uses micro data to assess the extent of tax avoidance and profitshifting at the firm level. The second group relies on macro data, that is, data aggregated atthe country level. However, studies in both groups suffer from certain drawbacks.
Firm-level studies often rely on data from the Orbis or Amadeus database, provided byBureau van Dijk and collected from public business registries. One problem with this data isthat there is no information about the activities of MNEs in many countries, especially taxhavens. A series of recent leaks as well as national accounts data suggest that MNEs book asignificant share of their profits in tax havens (Zucman 2014; Tørsløv et al. 2018). Estimates ofthe total extent of profit shifting and tax avoidance by MNEs based on business registry dataare thus likely to be biased downwards. To the best of our knowledge, micro evidence usingdata with complete coverage of MNEs’ residence countries is restricted to US MNEs (Dowdet al., 2017).3
Macroeconometric analyses, on the other hand, have faced criticism for failing to controlfor MNEs’ scale of real economic activity. This potentially results in biased estimates of thetax-sensitivity of corporate profits and an overstatement of the extent of profit shifting (Beeret al. 2020; Dharmapala 2014; Heckemeyer and Overesch 2017). Using financial accounting data
3 Gumpert et al. (2016) focus on whether or not German MNEs have a tax haven presence, but do not estimatethe amount of profit shifting.
3

for US MNEs, Dyreng and Hanlon (2020) show that existing profit shifting estimates based onmacro data tend to be implausibly large.
The CbC data we use avoids these problems. To the best of our knowledge, the onlycountry that has made information from CbC reports publicly available so far is the US (Garcia-Bernardo et al., 2019). However, the US does not publish information at the MNE level.Instead, the information is aggregated across all US MNEs that are obliged to file a CbC reportat the level of the countries where these MNEs have affiliates. Studies using this data thussuffer from similar problems to other macro approaches. Our data, in contrast, encompassesinformation from individual CbC reports, allowing us to assess the extent of profit shifting atthe MNE level while controlling for real economic activity.
This new data allows us to contribute to the existing literature in several ways. First, thefull coverage of large German MNEs’ global activities enables us to provide a complete pictureof the global distribution of their profits – including profits reported in tax havens – and tocompare it to the global distribution of (tangible) assets, employment, and sales. Studies relyingon Orbis or Amadeus data are not able to do so. Second, the completeness of the CbC data alsoallows us to provide a more credible estimate of the tax-sensitivity of corporate profits and thetotal amount of profits shifted to tax havens. Third, as the CbC reports contain informationabout revenues generated through transactions with other affiliates of the same MNE group, weare able to assess whether the location of subsidiaries that mainly provide inputs and servicesfor associated firms is sensitive to the level of taxation. Intra-company trade, loans, and thestrategic location of intellectual property (IP) are considered particularly important channelsthrough which MNEs shift profits to low-tax jurisdictions (e.g., Buettner and Wamser 2013;Dischinger and Riedel 2011; Dyreng and Hanlon 2020; Fuest et al. 2011; Griffith et al. 2014).Because revenues from intra-firm transactions reported in the CbC reports include royaltiesand interest payments, it is possible to assess the relevance of these channels. Other financialdata sources do not include this information.
The rest of the paper is organized as follows. Section 2 describes the CbC data and oursample of German MNEs. In Section 3, we investigate the global distribution of German MNEs’profits and factors of production. In addition, we analyze the profitability of German MNEsacross tax havens and non-haven countries. Section 4 compares the CbC data to data fromBureau van Dijk’s Orbis database. We introduce our regression model and show the results ofour profit shifting regressions based on CbC data in Section 5. Section 6 presents estimates ofthe total amount of profits shifted to tax havens and the associated loss in corporate tax revenue.In Section 7, we re-estimate our regression model using Orbis data. Section 8 concludes.
4

2 CbC Data and Sample
The data used for our analysis is taken from CbC reports filed by German MNEs. CbCreporting was initiated by the OECD and G20 in the context of the BEPS project. The CbCreports include information on the global activities of MNEs. They are prepared by the MNEs,and submitted to the tax authority of the country of the MNEs’ headquarters. An MNEis legally obliged to submit a CbC report if its consolidated global group revenue exceeds athreshold of EUR 750 million (or an equivalent amount in a different currency), and if thecountry where its headquarters are based takes part in the OECD/G20 Inclusive Frameworkon BEPS, provided that the country has introduced a corresponding reporting obligation intonational legislation.4 In general, membership in the Inclusive Framework on BEPS is opento all interested countries. However, membership requires commitment to certain minimumstandards, the introduction of CbC reporting being one of them. As of December 2019, 137countries joined the Inclusive Framework on BEPS, 90 of which already introduced a CbCreporting obligation into national legislation.5 In Germany, a CbC reporting obligation wasintroduced in 2016. The tax authority of the MNE’s headquarters country shares the CbCreport with the tax authorities of other Inclusive Framework members where subsidiaries ofthat MNE are located. However, the reports are not disclosed to the public. The goal of CbCreporting is to “ [...] provide tax administrations with a high level overview of the operations andtax risk profile of the largest multinational enterprise groups” (OECD 2017, p. 11), allowingtax authorities to use their auditing capacities more efficiently.6
The CbC reports contain basic financial information about the global activities of an MNE.More precisely, they include the following information:
• Profit/loss before taxation• Taxes paid• Taxes accrued (year of reporting)• Stated capital• Accumulated earnings• Number of employees (full-time equivalents)• Net book value of tangible assets• Revenues generated from transactions with independent parties (revenues unrelated),
including revenues from sales of inventory and properties, services, royalties, interest, andpremiums
4 Note that a country may also require constituent entities of an MNE that are resident in that country fortax purposes to file a CbC report if the MNE is not obliged to do so in the country where it is headquarteredand its consolidated group revenues exceed EUR 750 million (‘local filing’).
5 A regularly updated list of Inclusive Framework member countries can be found here:https://www.oecd.org/tax/beps/beps-actions/action13/ (last accessed on 12 September 2020).
6 Hugger (2020) provides more details on CbC reporting.
5
• Revenues generated from transactions with associated enterprises (revenues related), in-cluding revenues from sales of inventory and properties, services, royalties, interest, andpremiums• Total revenues (revenues unrelated plus revenues related)
Note that the CbC reports do not contain information at the subsidiary level. Instead, the in-formation is aggregated at the level of the tax jurisdictions where MNEs operate. Nevertheless,the information we use refers to activities of individual MNEs. Our analysis therefore uses adifferent level of aggregation than (most) existing micro- and macro-analyses. Micro-analysestypically use information at the subsidiary level and thus more disaggregated data than ours.Exceptions are the studies by Dowd et al. (2017) and Huizinga and Laeven (2008), who usedata at the same level of aggregation. Macro-analyses (including those that use US CbC data,like Garcia-Bernardo et al. (2019)) typically use data aggregated by tax jurisdiction, whichimplies a higher level of aggregation.
Our data set covers the information from CbC reports filed by German MNEs for theyears 2016 and 2017. The original data covers 386 German MNEs. However, we excludesome companies from our sample for different reasons. First, we exclude all non-corporateand public MNEs since they are subject to different tax regulations than corporate MNEs inGermany. Profits of incorporated enterprises are subject to the corporate income tax plus thelocal business tax, the latter being levied by the municipalities. Non-corporate enterprises haveto pay the local business tax as well, but are not subject to the corporate income tax. Rather,their income is taxed at the level of the owner and, therefore, subject to the personal incometax.7 Second, we exclude corporate groups that reported information for the financial years2015 or 2018 in lieu of 2016 and/or 2017. Our final sample comprises 333 corporate MNEs. Bydefinition, these companies all exceed the revenue threshold of EUR 750 million. Table A1 ofthe Appendix provides summary statistics for the CbC sample.
In a recent paper, Blouin and Robinson (2020) point out that certain types of income ofMNEs may be double counted in financial accounting data. They identify three potentialsources of double counting: (i) the income reported by a subsidiary may also be included inthe financial statement of its parent company as equity income; (ii) the income reported bythe parent company may include dividends received from its subsidiaries; (iii) the income of aconduit entity (such as a partnership) may be reported in both the conduit entity’s financialstatement and the financial statement of its owner(s). Using financial data from the Bureau ofEconomic Analysis (BEA) as an example, Blouin and Robinson (2020) demonstrate that failingto account for the double counting of certain income can lead to a severe overstatement of MNEs’
7 The corporate income tax rate in Germany is 15%. The local business tax varies across municipalities, withan average of also 15%, so that the overall statutory tax rate on corporate profits is, on average, equal to 30%.The personal income tax is characterized by a progressive tax schedule, with an initial tax rate of 14% and amaximum tax rate of 45%.
6

profits, especially those reported in tax havens. The authors show that using unadjusted BEAdata leads to estimates of the tax revenue loss for the US due to profit shifting in the range of30%-45% of corporate tax revenues. Their correction for double counting reduce the estimatedrevenue losses to 4%-8%, which is not far from our results for Germany, as will be explainedfurther below.
The CbC reporting guidelines require MNEs to report their activities in a way that preventsa double counting of subsidiaries’ income at the level of their parent company either as equityincome or dividend income. Income stemming from partnerships, in contrast, might in fact bedouble counted (cf. Hanlon 2018). However, the CbC reporting guidelines provide that MNEsreport the income from partnerships that is passed through to them in a separate row. We findthat only six out of the 333 German MNEs in our sample report such income. It thus appearsthat this problem is only of minor relevance for our analysis.8
3 Where do German MNEs report their profits?
To gain an initial impression of the role tax havens play for the global activities of GermanMNEs, we compute two common profitability measures. These are the ratio of profits totangible assets and the ratio of profits to the number of employees. We compare these measuresacross three country groups: (i) countries not considered tax havens (including Germany), (ii)European tax havens, and (iii) tax havens located outside of Europe.9 Note that there isdisagreement in the literature concerning the countries which qualify as tax havens. Menkhoffand Miethe (2019) provide a summary of the classifications used in six different publications.For our analysis, we decided to include only those countries that are labeled accordingly in allof the six publications reviewed by Menkhoff and Miethe (2019) to our list of tax havens. Webelieve that this procedure yields the least arbitrary classification.10 The profitability measuresare computed by dividing the sum of positive profits reported by all subsidiaries of GermanMNEs in each of these country groups by the value of tangible assets and the number ofemployees, respectively.
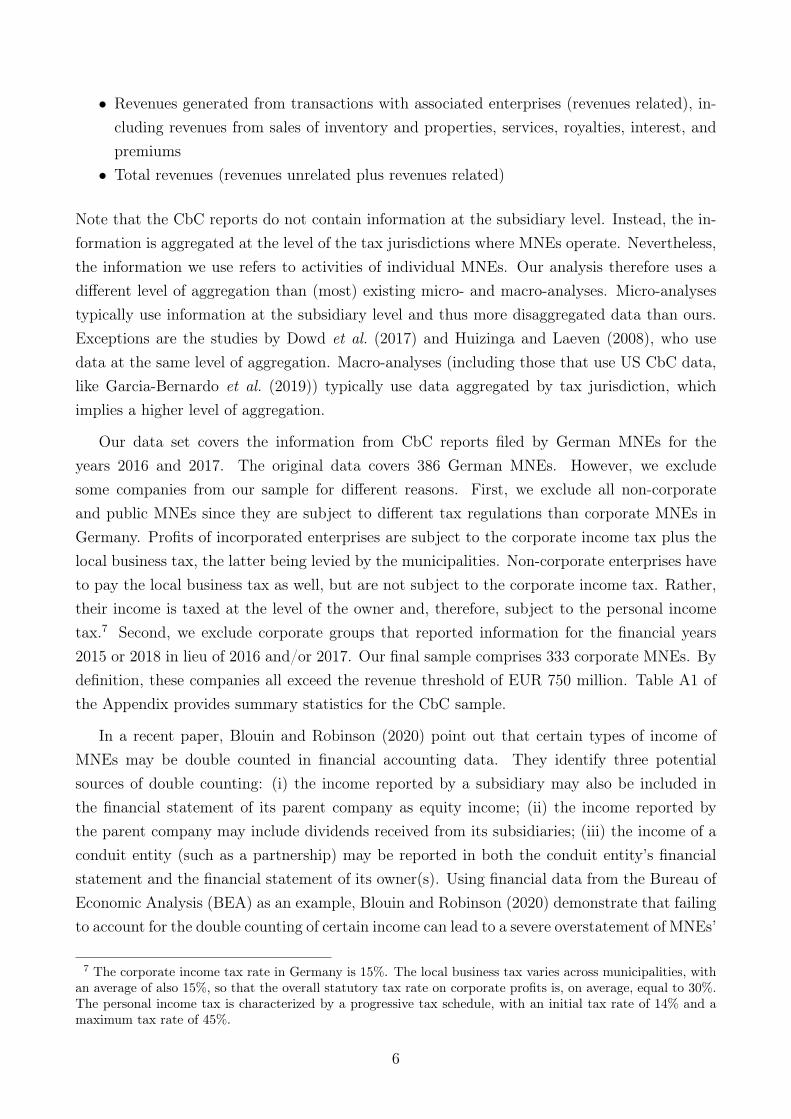
The results are illustrated in Figures 1 and 2. Subsidiaries located in European tax havensare far more profitable than subsidiaries located in non-havens. In European tax havens, thereturn to tangible assets is roughly 39%, which is more than two times larger than the valuefor subsidiaries located in non-havens (Figure 2). Profits per employee reported in Europeantax havens are even three time larger than in non-havens (Figure 2). In tax havens outside of
8 Note that eliminating those six MNEs from our sample has virtually no effect on the results of our analyses.Results are available upon request.
9 The numbers for non-havens also include the information of the parent companies located in Germany.10 Table A2 in the Appendix provides the corresponding lists of European and non-European tax havens.
7
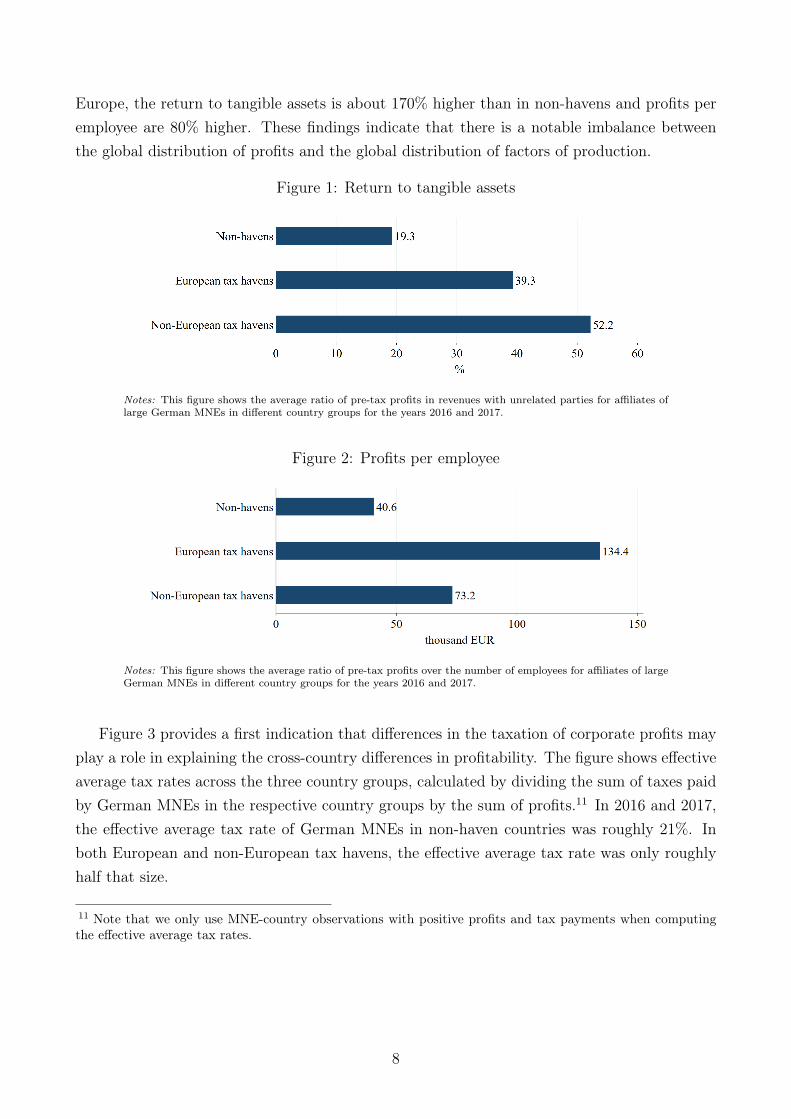
Europe, the return to tangible assets is about 170% higher than in non-havens and profits peremployee are 80% higher. These findings indicate that there is a notable imbalance betweenthe global distribution of profits and the global distribution of factors of production.
Figure 1: Return to tangible assets
Notes: This figure shows the average ratio of pre-tax profits in revenues with unrelated parties for affiliates oflarge German MNEs in different country groups for the years 2016 and 2017.
Figure 2: Profits per employee
Notes: This figure shows the average ratio of pre-tax profits over the number of employees for affiliates of largeGerman MNEs in different country groups for the years 2016 and 2017.
Figure 3 provides a first indication that differences in the taxation of corporate profits mayplay a role in explaining the cross-country differences in profitability. The figure shows effectiveaverage tax rates across the three country groups, calculated by dividing the sum of taxes paidby German MNEs in the respective country groups by the sum of profits.11 In 2016 and 2017,the effective average tax rate of German MNEs in non-haven countries was roughly 21%. Inboth European and non-European tax havens, the effective average tax rate was only roughlyhalf that size.
11 Note that we only use MNE-country observations with positive profits and tax payments when computingthe effective average tax rates.
8

Figure 3: Effective average tax rates (taxes over profits)
Notes: This figure shows the average ratio of taxes paid in pre-tax profits for affiliates of large German MNEsin different country groups for the years 2016 and 2017.
Figure 4: Intra-firm revenues over total revenues
Notes: This figure shows the average share of intra-firm revenues in total revenues for affiliates of large GermanMNEs in different country groups for the years 2016 and 2017.
In a summary of the literature, Heckemeyer and Overesch (2017) identify three main chan-nels through which MNEs may shift profits to low-tax jurisdictions. The first one is the transferprice channel. MNEs may locate subsidiaries that provide inputs for affiliate companies in low-tax jurisdictions, which then charge high transfer prices for these inputs. The second channelis the interest rate channel. Subsidiaries in low-tax jurisdictions may extend loans to affiliateslocated in high-tax jurisdictions and receive interest payments in return. Third, MNEs maystrategically locate intangible assets such as patents, licenses, or trademarks in low-tax juris-dictions. Affiliates located in high-tax jurisdictions then pay fees or royalties for using theseintangibles. The use of any one of these channels implies that subsidiaries located in low-taxjurisdictions generate revenues through intra-firm transactions. Figure 4 shows the share ofintra-firm revenues in total revenues for the three country groups. The figure suggests thatsubsidiaries of German MNEs located in European and – even more so – non-European taxhavens are particularly important for the provision of inputs and services for affiliated firms.Subsidiaries located in non-European tax havens (European tax havens) generate roughly 42%(36%) of their revenues through transactions with affiliated firms. For subsidiaries in non-havens, the share of intra-firm revenues is almost 11 percentage points (five percentage points)lower. Against the background of the higher profitability in tax havens, this finding may be
9

interpreted as a first indication of a strategic location of inputs with the aim of shifting profitsto low-tax jurisdictions.
The evidence presented thus far suggests that German MNEs in fact shift profits to reducetheir tax burden. But how important are tax havens altogether? In other words, how large isthe profit share German MNEs report in tax haven countries? Figure 5 provides the answer.In 2016 and 2017, just 9% of German MNEs’ global profits were booked in tax havens, while91% were booked in non-havens. Considering that the political and public debate on profitshifting and tax avoidance by MNEs mainly focuses on the role of tax havens, this finding maycome as a surprise. Another interesting insight provided by Figure 5 is that European taxhavens appear to be far more important for German MNEs than tax havens outside of Europe.Approximately 87% of all tax-haven profits are booked in European tax havens, and only 13%in non-European tax havens.
As the profitability measures already indicated, the share of tangible assets and employeeslocated in tax havens is disproportionately low compared to profits. Just 4% of German MNEs’assets and 3% of employees (Figures A1 and A2 in the Appendix) are located in tax havens.Again, the shares for European tax havens are much larger than for non-European tax havens.
Figure 5: Global distribution of German MNEs’ profits
Notes: This figure shows the average distribution of large German MNE’s pre-tax profits, assets, andemployees across country groups for the years 2016 and 2017.
10
4 Comparing CbC to Orbis data
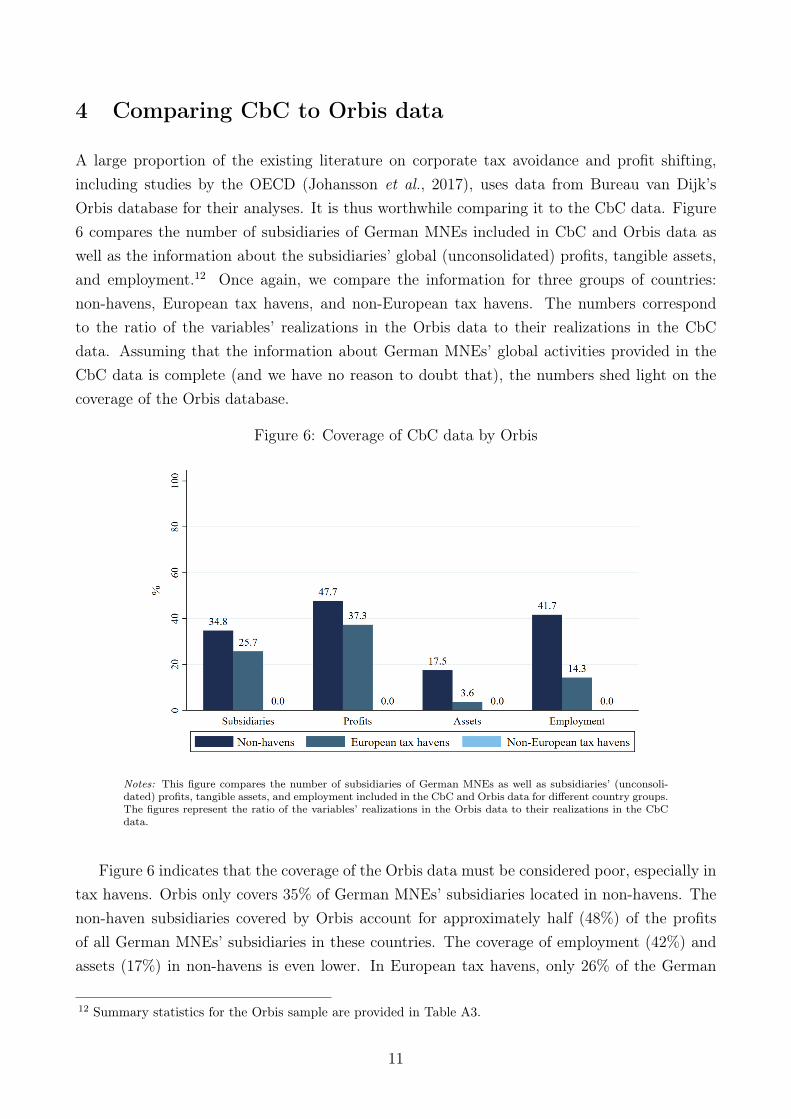
A large proportion of the existing literature on corporate tax avoidance and profit shifting,including studies by the OECD (Johansson et al., 2017), uses data from Bureau van Dijk’sOrbis database for their analyses. It is thus worthwhile comparing it to the CbC data. Figure6 compares the number of subsidiaries of German MNEs included in CbC and Orbis data aswell as the information about the subsidiaries’ global (unconsolidated) profits, tangible assets,and employment.12 Once again, we compare the information for three groups of countries:non-havens, European tax havens, and non-European tax havens. The numbers correspondto the ratio of the variables’ realizations in the Orbis data to their realizations in the CbCdata. Assuming that the information about German MNEs’ global activities provided in theCbC data is complete (and we have no reason to doubt that), the numbers shed light on thecoverage of the Orbis database.
Figure 6: Coverage of CbC data by Orbis
Notes: This figure compares the number of subsidiaries of German MNEs as well as subsidiaries’ (unconsoli-dated) profits, tangible assets, and employment included in the CbC and Orbis data for different country groups.The figures represent the ratio of the variables’ realizations in the Orbis data to their realizations in the CbCdata.
Figure 6 indicates that the coverage of the Orbis data must be considered poor, especially intax havens. Orbis only covers 35% of German MNEs’ subsidiaries located in non-havens. Thenon-haven subsidiaries covered by Orbis account for approximately half (48%) of the profitsof all German MNEs’ subsidiaries in these countries. The coverage of employment (42%) andassets (17%) in non-havens is even lower. In European tax havens, only 26% of the German
12 Summary statistics for the Orbis sample are provided in Table A3.
11
MNEs’ subsidiaries and 37% of the profits are accounted for in Orbis. Information about theactivities in Cyprus, Liechtenstein, Malta, and Switzerland, which are all included in the list ofEuropean tax havens, are completely missing. What is more, Orbis does not cover any activitiesof the German MNEs included in our sample in tax havens outside of Europe.
The reasons for the incomplete coverage of the Orbis data are manifold. First, Orbis does notcover some countries since they do not keep business registries or do not publish the informationtherein. This is true for a large number of tax haven countries. Second, in some countries, theobligation to report financial information is limited to certain firm types. For example, it isquite common that reporting obligations only apply to large firms or firms of certain legalforms (cf. Kalemli-Ozcan et al. 2015. Third, some countries, despite being covered by Orbisas they keep public business registries, either do not require firms to report their profits, valueof assets, and/or number of employees, or do not publish this particular information. Hence,the corresponding information is missing in Orbis. Fourth, the information about ownershipstructures and, hence, the list of subsidiaries in Orbis is incomplete.
Table A4 of the Appendix documents the coverage at the country level. According to theCbC reports, the 333 German MNEs included in our sample have subsidiaries in 193 countries.79% (52%) have at least one subsidiary in a European (non-European) tax haven country.13
The Orbis data only covers subsidiaries in 46 of these countries.14 This means that Orbislacks information for more than three quarters of the countries in which German MNEs havesubsidiaries. What is more, in 21 of these 46 countries, less than half of the profits made byGerman MNEs are accounted for in Orbis. In contrast, the coverage of profits by Orbis is above80% in only nine countries. Interestingly, there are four countries in our data set for whichthe ratio of profits reported in Orbis to profits reported in the CbC data exceeds 100%. Onepotential explanation for this is the different treatment of profits made by legally dependentpermanent establishments (PEs) between Orbis and CbC data. In Orbis, profits made by alegally dependent PE are reported at the level of its direct parent company. Hence, if thedirect parent is located in country A, but the PE is located in country B, the profit of the PEis reported in A. In the CbC data, on the other hand, the profit of a PE is reported in thecountry it is situated in, irrespective of the direct parent company’s location. Note that thetreatment of profits made by foreign PEs constitutes another important advantage of the CbCdata over Orbis. When estimating the extent of tax avoidance and profit shifting, researchers
13 Note that in our sample, the share of German MNEs with tax haven affiliates is notably larger than theshare reported by Gumpert et al. (2016). Based on information from the German Bundesbank’s MicrodatabaseDirect Investment (MiDi), the authors report that between 1996 and 2008, only about 20% of German MNEshad tax haven affiliates. The authors also find that the likelihood that a German MNE has tax haven affiliatesis positively related to firm size. Since our sample covers only the largest German MNEs, it seems likely thatthis positive relationship explains the different shares.14 Note that a large fraction of the 157 countries for which information is lacking are in fact covered in Orbis,but the realizations of the variables included in our empirical model are missing.
12
are interested in where profits are actually booked, as opposed to where reporting takes placedue to accounting conventions.
The incomplete coverage of the Orbis data is also documented by Tørsløv et al. (2018). Theauthors compare the consolidated global profits of MNEs to the sum of unconsolidated profitsreported by those MNEs’ subsidiaries that are covered by Orbis. They find that on average, itis only possible to trace 17% of MNEs’ global profits in unconsolidated Orbis information.
5 Profit shifting regressions based on CbC data
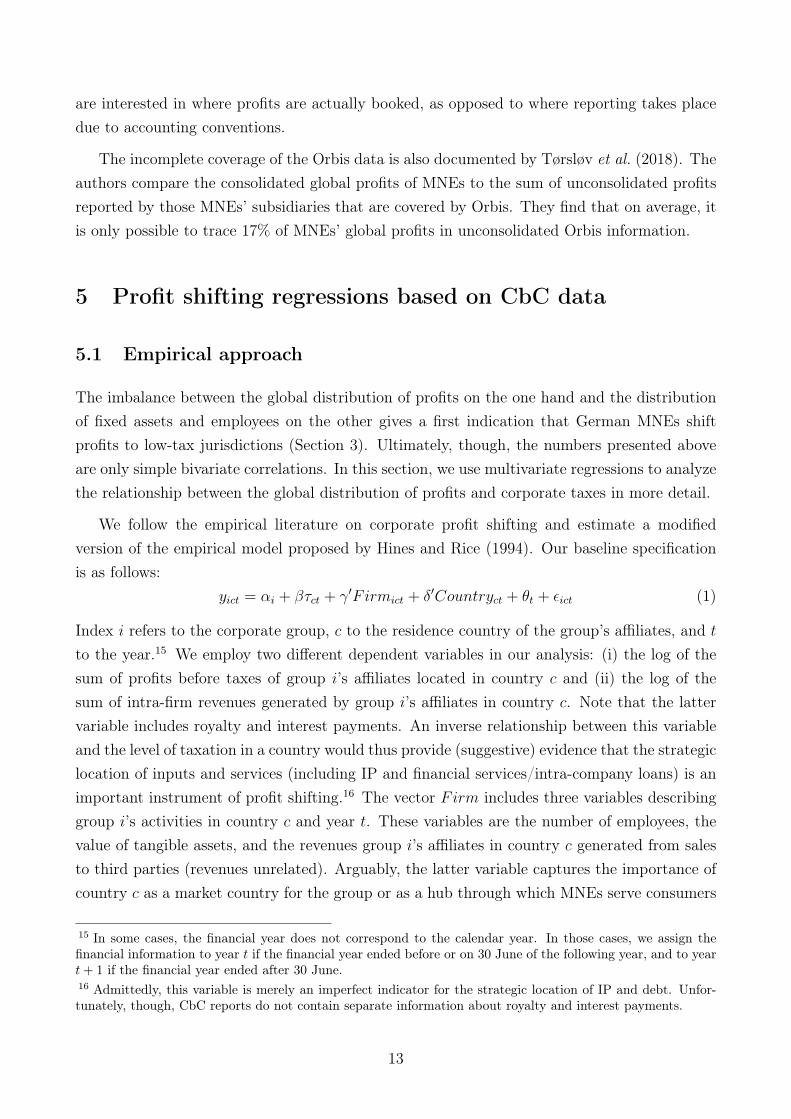
5.1 Empirical approach
The imbalance between the global distribution of profits on the one hand and the distributionof fixed assets and employees on the other gives a first indication that German MNEs shiftprofits to low-tax jurisdictions (Section 3). Ultimately, though, the numbers presented aboveare only simple bivariate correlations. In this section, we use multivariate regressions to analyzethe relationship between the global distribution of profits and corporate taxes in more detail.
We follow the empirical literature on corporate profit shifting and estimate a modifiedversion of the empirical model proposed by Hines and Rice (1994). Our baseline specificationis as follows:
yict = αi + βτct + γ′Firmict + δ′Countryct + θt + εict (1)
Index i refers to the corporate group, c to the residence country of the group’s affiliates, and tto the year.15 We employ two different dependent variables in our analysis: (i) the log of thesum of profits before taxes of group i’s affiliates located in country c and (ii) the log of thesum of intra-firm revenues generated by group i’s affiliates in country c. Note that the lattervariable includes royalty and interest payments. An inverse relationship between this variableand the level of taxation in a country would thus provide (suggestive) evidence that the strategiclocation of inputs and services (including IP and financial services/intra-company loans) is animportant instrument of profit shifting.16 The vector Firm includes three variables describinggroup i’s activities in country c and year t. These variables are the number of employees, thevalue of tangible assets, and the revenues group i’s affiliates in country c generated from salesto third parties (revenues unrelated). Arguably, the latter variable captures the importance ofcountry c as a market country for the group or as a hub through which MNEs serve consumers
15 In some cases, the financial year does not correspond to the calendar year. In those cases, we assign thefinancial information to year t if the financial year ended before or on 30 June of the following year, and to yeart+ 1 if the financial year ended after 30 June.16 Admittedly, this variable is merely an imperfect indicator for the strategic location of IP and debt. Unfor-tunately, though, CbC reports do not contain separate information about royalty and interest payments.
13

residing in other countries.17 The vector Country includes the log of PPP adjusted GDP percapita, log population (both taken from the Penn World Table 9.1; cf. Feenstra et al. 2015),as well as Amnesty International’s Corruption Perception Index. αi is a corporate group fixedeffect, θt is a year fixed effect. Standard errors are clustered at the corporate group level.18
The variable of main interest is the tax variable τ . In our empirical analysis, we use twodifferent tax variables: (i) the statutory tax rate of country c and (ii) the effective averagetax rate. Existing studies either use the statutory tax rate (e.g., Huizinga and Laeven 2008;Dischinger and Riedel 2011) or effective average tax rates (e.g., Clausing 2016), but rarely both(an exception is Dowd et al. 2017). Statutory tax rates are taken from KPMG’s CorporateTax Surveys and EY’s Annual Worldwide Corporate Tax Guides. Effective average tax ratesare determined by dividing the sum of taxes MNEs in our sample pay in country c by the sumof profits they report in this country. To circumvent endogeneity problems, we follow Dowdet al. (2017) and determine the effective average tax rate for group i in country c only basedon the information about taxes paid and profits made by other MNEs in that country. Also,we compute effective average tax rates only for countries in which at least ten of the MNEs inour sample have affiliates. Due to that, our sample size is slightly smaller when using effectiveaverage tax rates instead of statutory tax rates. Note that since all MNEs in our sample havetheir headquarters in Germany, using the level of the tax rate in country c as an explanatoryvariable is equivalent to using the difference between the tax rate in country c and the tax ratein an MNE’s base country.
To gain further insights, we modify our baseline specification in several ways. In a firstmodification, we follow Dowd et al. (2017) and add the squared realization of the tax variableto our baseline specification. This allows us to test whether the tax-sensitivity of profits andrevenues varies across high and low-tax jurisdictions. The resulting regression equation is:
yict = α̇i + β̇1τct + β̇2τ2ct + γ̇′Firmict + δ̇′Countryct + θ̇t + ε̇ict (2)
In a second modification, we add two dummy variables to our baseline specification. The firstdummy variable takes on the value of 1 if country c is a European tax haven, the second dummytakes on the value of 1 if country c is a tax haven outside of Europe. The resulting regressionequation is:
yict = α̃i+β̃1τct+β̃2HavenEuropeanc +β̃3Haven
Non−Europeanc +γ̃′Firmict+δ̃
′Countryct+θ̃t+ε̃ict (3)
17 Note that this variable also includes revenues affiliates located in country c generate from sales to third-partiesresiding in other countries.18 Note that we do not include country fixed effects to our specification since there is virtually no variation inour tax variables and controls across the two sample years. However, even studies that cover longer time spansrarely control for country fixed effects.
14

In a third modification, we test whether the tax-sensitivity of profits and intra-firm revenuesvaries across MNEs by re-estimating Equation (3) for different sub-samples. First, we createsub-samples based on information about the importance of intangible assets. To this end, wedetermine the ratio of the value of intangible assets to total assets and split our sample intofour sub-samples based on the quartiles of that ratio. The information about the value ofintangible assets comes from Orbis since it is not included in the CbC reports.19 Second, wetest whether the tax-sensitivities vary depending on the size of the corporate group by creatingfour sub-samples based on the quartiles of total consolidated revenues.
Finally, we apply two additional modifications to test the robustness of our results. First,we replace the tax variable τ with the absolute difference between the tax rate in country c,and the weighted average of the tax rates of all other countries in which the corporate grouphas affiliates. Following Huizinga and Laeven (2008), we use the revenues generated by thecorporate group’s affiliates in a country as weights in the corresponding calculation. Second,we use a different approach to calculate effective average tax rates. We randomly draw a10% (20%) sample of MNEs and only use information about their profits and tax payments indifferent jurisdictions to calculate effective average tax rates. We repeat this procedure 10,000times, each time estimating Equations (1) to (3) excluding the 10% (20%) of MNEs used tocalculate the effective average tax rates. Then, we compute the average realizations of thecoefficient estimates and their standard errors. However, the results of all specifications thatwe estimate remain robust to these two modifications.20
5.2 Results
5.2.1 Baseline specification
The results of our baseline specification are presented in Table 1. Columns (1) and (2) show theresults when using profits as a dependent variable, Columns (3) and (4) when using intra-firmrevenues.
Our results indicate a statistically significant association between the effective average taxrate on the one hand, and profits as well as intra-firm revenues on the other. Holding otherfactors such as the value of tangible assets, employment, and revenues fixed, a one percentagepoint (pp) increase in the effective average tax rate is associated with a decrease in profits byroughly 0.5% and a decrease in intra-firm revenues by 1.3%. Thus, tax rate differentials betweencountries evidently play a role in the profit allocation of large German MNEs. However, despitetheir relevant magnitude, our estimates are notably smaller than the average semi-elasticities
19 We use the consolidated information from Orbis, which is typically considered to be much more reliable thanthe unconsolidated information.20 We do not report the results here for reasons of space, but they are available from the authors upon request.
15

reported in the meta-analyses by Beer et al. (2020) as well as Heckemeyer and Overesch (2017).Beer et al. (2020) find an average tax semi-elasticity of corporate profits of -1, Heckemeyerand Overesch (2017) of -0.8. The differences between those estimates and ours may be dueto differences in the data used, or they may reflect the fact that German MNEs react lesssensitively to tax rate differentials. This could be either because their asset structures or othercharacteristics make profit shifting more difficult, or because anti-tax avoidance legislation inGermany is more stringent than elsewhere.
Table 1: Results for the baseline specification
Dependent Variable log(profits) log(intra-firm revenues)(1) (2) (3) (4)
Statutory tax rate 0.104 0.380(0.266) (0.421)
Effective tax rate -0.517∗∗ -1.262∗∗∗
(0.183) (0.318)Log(Assets) 0.153∗∗∗ 0.156∗∗∗ 0.262∗∗∗ 0.269∗∗∗
(0.040) (0.041) (0.069) (0.070)Log(Employment) 0.369∗∗∗ 0.373∗∗∗ 0.930∗∗∗ 0.925∗∗∗
(0.056) (0.058) (0.095) (0.097)Log(Revenues unrelated) 0.324∗∗∗ 0.315∗∗∗ -0.128∗∗∗ -0.133∗∗∗
(0.030) (0.030) (0.038) (0.038)Corruption perception index 0.461∗∗ 0.384∗ 1.047∗∗∗ 0.935∗∗∗
(0.148) (0.155) (0.242) (0.245)Log(GDP pc) 0.258∗∗∗ 0.279∗∗∗ 0.663∗∗∗ 0.644∗∗∗
(0.050) (0.054) (0.094) (0.104)Log(Population) 0.051∗∗ 0.062∗∗∗ 0.058 0.081∗∗
(0.019) (0.018) (0.033) (0.031)Dummy year 2017 -0.058 -0.064 -0.036 -0.036
(0.052) (0.052) (0.086) (0.087)Constant 1.910∗∗∗ 1.912∗∗∗ 0.698 0.990
(0.514) (0.457) (0.890) (0.899)Observations 9410 9275 8338 8246Adjusted R2 0.797 0.798 0.718 0.721
Notes: Results are based on OLS regression. All specifications include corporate group fixed effects. Standarderrors shown in parentheses are clustered at the corporate group level. ∗/∗∗/∗∗∗ indicate significance at the5%/1%/0.1% level.
In contrast, the relationships between statutory tax rates and profits as well as betweenstatutory tax rates and intra-firm revenues are insignificant (Columns (1) and (3) of Table1). One explanation for this finding is that the standard statutory tax rate is an inaccuratemeasure for the actual tax burden in a country. In fact, the coefficient of correlation betweenthe effective average tax rate and the statutory tax rate in our data is only 0.24, indicating aweak correlation between these two variables. Moreover, many countries consistently labeled
16

as tax havens are in fact characterized by comparably high standard statutory tax rates. Forexample, Luxembourg has a statutory corporate income tax rate of 26%, while Malta’s is ashigh as 35%. Discrepancies between effective average tax rates and statutory tax rates may bedue to tax exemptions, tax credits for certain activities (such as R&D), and/or patent boxes.
5.2.2 Quadratic specification
Dowd et al. (2017) argue that MNE affiliates located in low-tax jurisdictions may react moresensitively to tax rate differences than those in high-tax jurisdictions. This implies that thesemi-elasticity of profits with respect to tax rates may be larger (in absolute terms) when thelevel of taxation in a country is low. To test this conjecture, Dowd et al. (2017) include thesquared realization of the tax variable in their empirical model. We follow their approachand report the results for this modification in Table 2. To facilitate the interpretation of thecoefficients, we also graphically illustrate the average marginal effects of a tax rate change fordifferent tax rate levels. Figure 7 illustrates the marginal effects of a tax rate change on profits;Figure 8 shows the marginal effects of a tax rate change on intra-firm revenues.
Table 2: Results for the quadratic specification
Dependent Variable log(profits) log(intra-firm revenues)(1) (2) (3) (4)
Statutory tax rate 1.410 1.597(0.914) (1.613)
Statutory tax rate squared -2.311 -2.140(1.499) (2.614)
Effective tax rate -1.216∗ -2.872∗∗∗
(0.515) (0.806)Effective tax rate squared 1.393 3.306∗
(0.942) (1.465)Observations 9410 9275 8338 8246F statistic (joint sign. tax variables) 1.22 5.04∗∗ 0.63 9.67∗∗∗
Adjusted R2 0.797 0.798 0.718 0.721
Notes: Results are based on OLS regression. Coefficients of control variables are omitted to conserve space. Allspecifications include corporate group fixed effects. Standard errors shown in parentheses are clustered at the corporategroup level. ∗/∗∗/∗∗∗ indicate significance at the 5%/1%/0.1% level.
The results we obtain when using the effective average tax rate as an explanatory variablelargely correspond with those reported by Dowd et al. (2017). The lower the level of taxation,the more sensitive profits are to tax rate differences. For instance, if the average tax rateis 10%, a 1 pp increase in the tax rate is associated with a decrease in profits by about 1%(cf. Figure 7). For an effective average tax rate of 25%, the resulting marginal effect of atax rate change is only half that size. Moreover, once the effective average tax rate exceeds
17
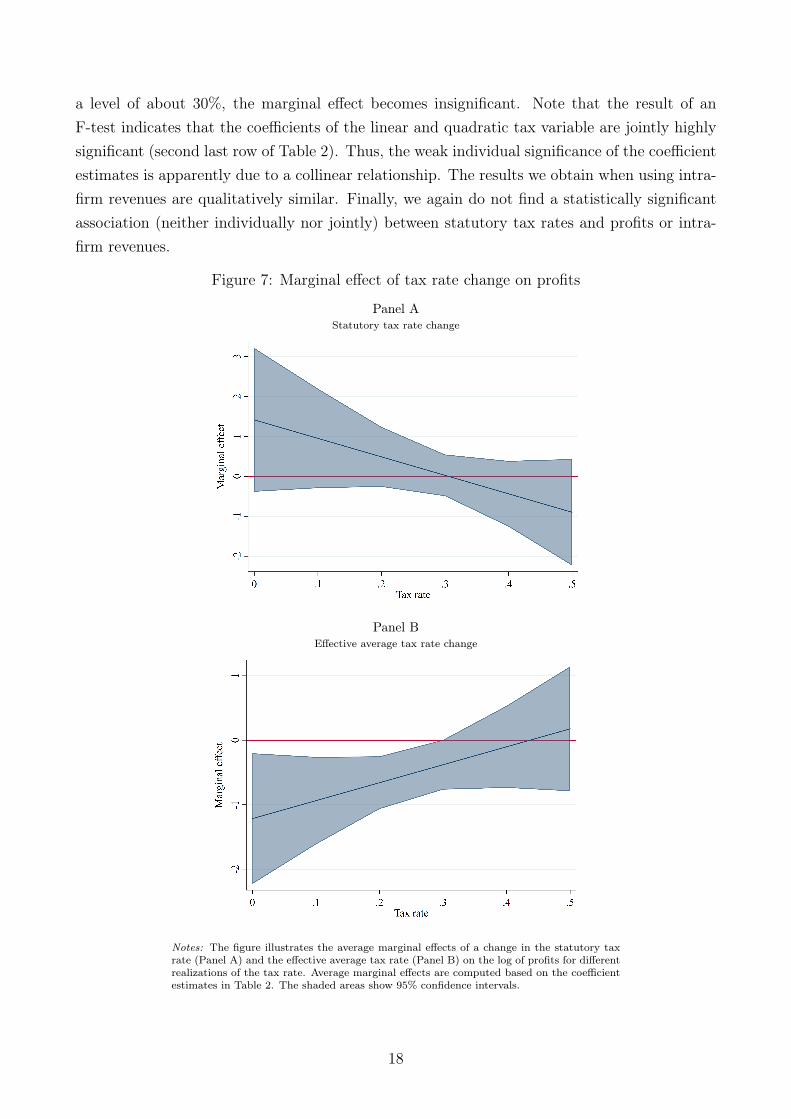
a level of about 30%, the marginal effect becomes insignificant. Note that the result of anF-test indicates that the coefficients of the linear and quadratic tax variable are jointly highlysignificant (second last row of Table 2). Thus, the weak individual significance of the coefficientestimates is apparently due to a collinear relationship. The results we obtain when using intra-firm revenues are qualitatively similar. Finally, we again do not find a statistically significantassociation (neither individually nor jointly) between statutory tax rates and profits or intra-firm revenues.
Figure 7: Marginal effect of tax rate change on profits
Panel AStatutory tax rate change
Panel BEffective average tax rate change
Notes: The figure illustrates the average marginal effects of a change in the statutory taxrate (Panel A) and the effective average tax rate (Panel B) on the log of profits for differentrealizations of the tax rate. Average marginal effects are computed based on the coefficientestimates in Table 2. The shaded areas show 95% confidence intervals.
18
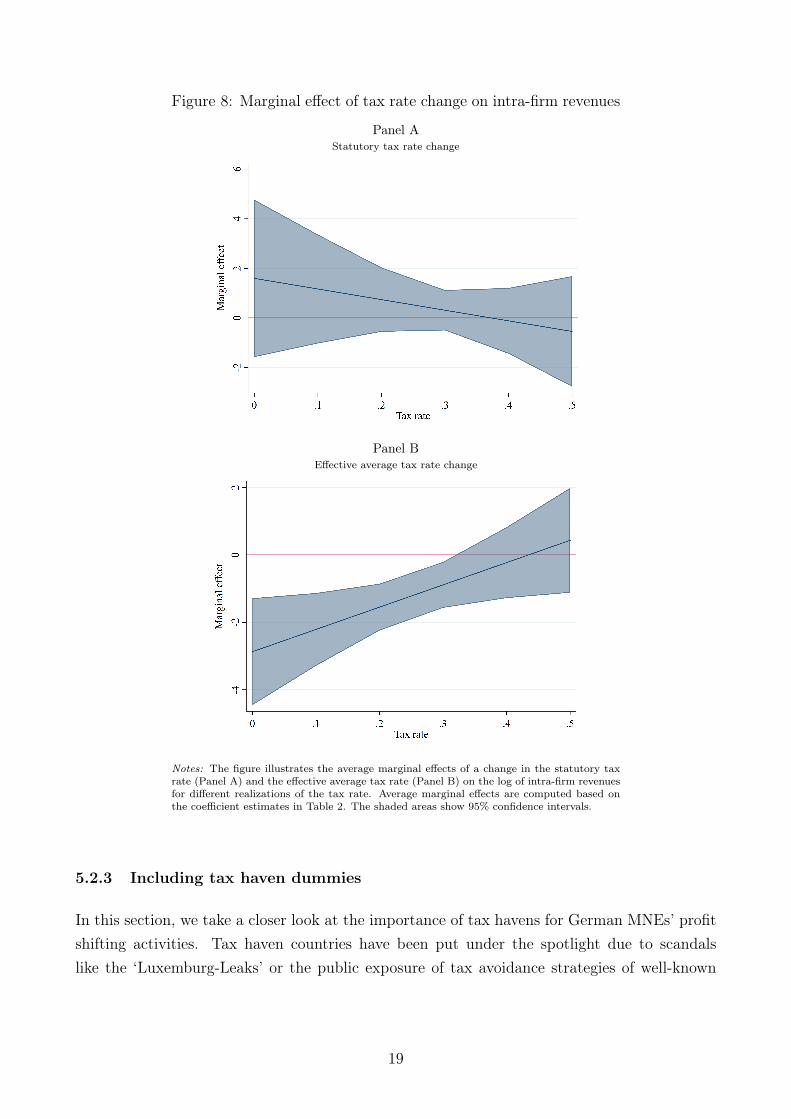
Figure 8: Marginal effect of tax rate change on intra-firm revenues
Panel AStatutory tax rate change
Panel BEffective average tax rate change
Notes: The figure illustrates the average marginal effects of a change in the statutory taxrate (Panel A) and the effective average tax rate (Panel B) on the log of intra-firm revenuesfor different realizations of the tax rate. Average marginal effects are computed based onthe coefficient estimates in Table 2. The shaded areas show 95% confidence intervals.
5.2.3 Including tax haven dummies
In this section, we take a closer look at the importance of tax havens for German MNEs’ profitshifting activities. Tax haven countries have been put under the spotlight due to scandalslike the ‘Luxemburg-Leaks’ or the public exposure of tax avoidance strategies of well-known
19
firms, including US companies like Apple or Amazon, but also German MNEs like Fresenius orBASF.21
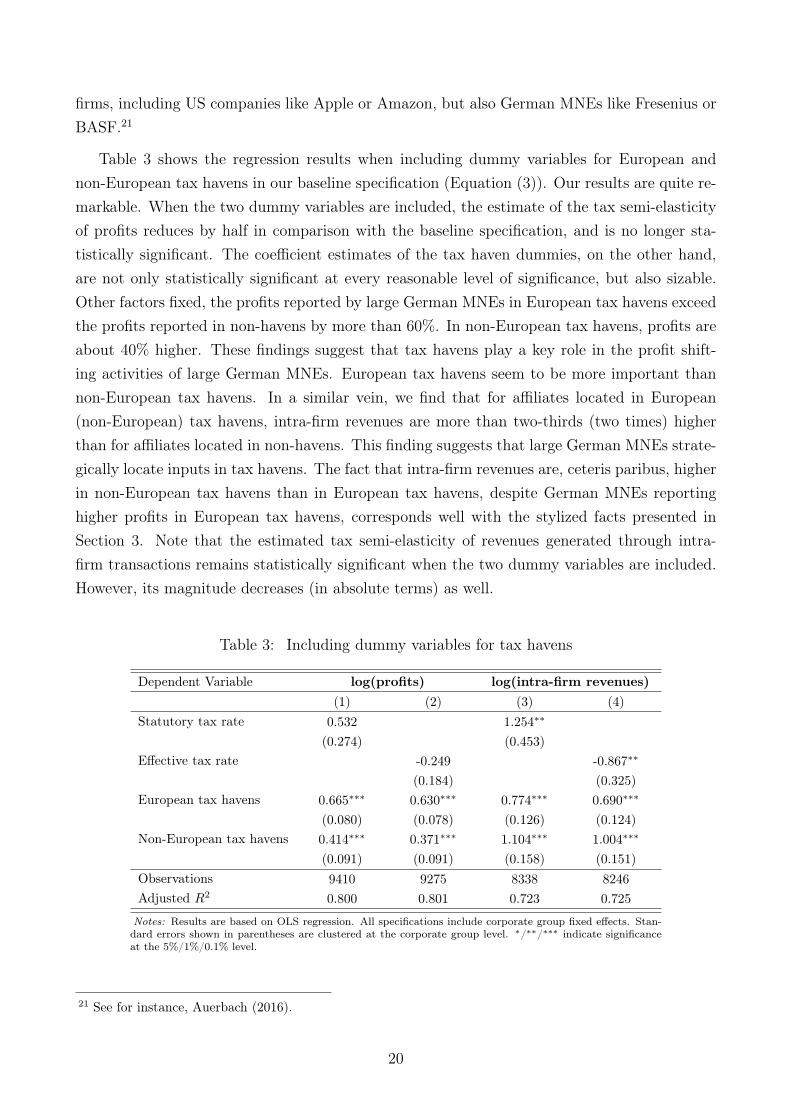
Table 3 shows the regression results when including dummy variables for European andnon-European tax havens in our baseline specification (Equation (3)). Our results are quite re-markable. When the two dummy variables are included, the estimate of the tax semi-elasticityof profits reduces by half in comparison with the baseline specification, and is no longer sta-tistically significant. The coefficient estimates of the tax haven dummies, on the other hand,are not only statistically significant at every reasonable level of significance, but also sizable.Other factors fixed, the profits reported by large German MNEs in European tax havens exceedthe profits reported in non-havens by more than 60%. In non-European tax havens, profits areabout 40% higher. These findings suggest that tax havens play a key role in the profit shift-ing activities of large German MNEs. European tax havens seem to be more important thannon-European tax havens. In a similar vein, we find that for affiliates located in European(non-European) tax havens, intra-firm revenues are more than two-thirds (two times) higherthan for affiliates located in non-havens. This finding suggests that large German MNEs strate-gically locate inputs in tax havens. The fact that intra-firm revenues are, ceteris paribus, higherin non-European tax havens than in European tax havens, despite German MNEs reportinghigher profits in European tax havens, corresponds well with the stylized facts presented inSection 3. Note that the estimated tax semi-elasticity of revenues generated through intra-firm transactions remains statistically significant when the two dummy variables are included.However, its magnitude decreases (in absolute terms) as well.
Table 3: Including dummy variables for tax havens
Dependent Variable log(profits) log(intra-firm revenues)(1) (2) (3) (4)
Statutory tax rate 0.532 1.254∗∗
(0.274) (0.453)Effective tax rate -0.249 -0.867∗∗
(0.184) (0.325)European tax havens 0.665∗∗∗ 0.630∗∗∗ 0.774∗∗∗ 0.690∗∗∗
(0.080) (0.078) (0.126) (0.124)Non-European tax havens 0.414∗∗∗ 0.371∗∗∗ 1.104∗∗∗ 1.004∗∗∗
(0.091) (0.091) (0.158) (0.151)Observations 9410 9275 8338 8246Adjusted R2 0.800 0.801 0.723 0.725
Notes: Results are based on OLS regression. All specifications include corporate group fixed effects. Stan-dard errors shown in parentheses are clustered at the corporate group level. ∗/∗∗/∗∗∗ indicate significanceat the 5%/1%/0.1% level.
21 See for instance, Auerbach (2016).
20

5.2.4 Effect heterogeneity
It is often argued that a high reliance on intangible assets facilitates profit shifting. In the BEPSproject, for instance, the OECD highlights the importance of intangible assets for MNEs’ taxavoidance activities (OECD, 2017). Also, Griffith et al. (2014) as well as Dischinger and Riedel(2011) provide evidence that the location of MNEs’ intellectual property depends on the levelof taxation. For that reason, we examine whether the estimated tax semi-elasticities of profitsand intra-firm revenues vary with the share of intangible assets in total assets. To this end,we split our sample into four sub-samples based on the quartiles of this share and re-estimateEquation (3) for each sub-sample. Since the CbC reports do not contain information aboutintangible assets, we determine the ratio based on Orbis data and merge this information withthe CbC data.22 The results are presented in Table 4. Overall, the findings do not indicate thatthe extent of profit shifting by German MNEs is related to the share of intangible assets. Thecoefficient estimates of the dummy variables for both European and non-European tax havensvary only slightly across the sub-samples. The only exception is the third quartile, where thecoefficient estimate of the dummy for non-European tax havens is not statistically significant.
Another common claim is that larger firms are more likely to engage in profit shifting thansmaller firms. The reason is that tax planning and profit shifting activities are associated withsignificant fixed costs, which large firms can bear more easily. These costs may include costslinked to staffing, legal advice, and to setting up companies abroad. Davies et al. (2018), Desaiet al. (2006), Langenmayr and Liu (2020), as well as Wier and Reynolds (2018) provide evidenceof a positive relationship between firm size and profit shifting activities. In addition, Gumpertet al. (2016) find that the likelihood for a German MNE to have tax haven affiliates increaseswith firm size. Taking up on this, we check whether the estimates of the tax semi-elasticity ofprofits vary with firm size. As a proxy for firm size, we use the consolidated revenues of theMNE groups. As was the case before, we split our sample into four sub-samples based on thequartiles of the firm size indicator, and re-estimate our empirical model for each sub-sample.Table 5 reports the results. The findings we obtain corroborate the view that large firms shiftmore profits. The profits reported in European tax havens by the smallest 25% of MNEs in oursample exceed the profits reported in non-havens by approximately 45%. For the largest 25%of German MNEs in our sample, this effect grows to over 80%. Moreover, we find that only thelargest 50% of MNEs in our sample appear to use non-European tax havens to shift profits.For the smaller half, the coefficient estimate for the dummy for non-European tax havens isstatistically insignificant. There is no clear pattern for intra-firm revenues, though.
22 Note that information about the share of intangible assets is missing for 133 of the 333 MNEs included inour sample. The total number of observations therefore decreases to 9830.
21
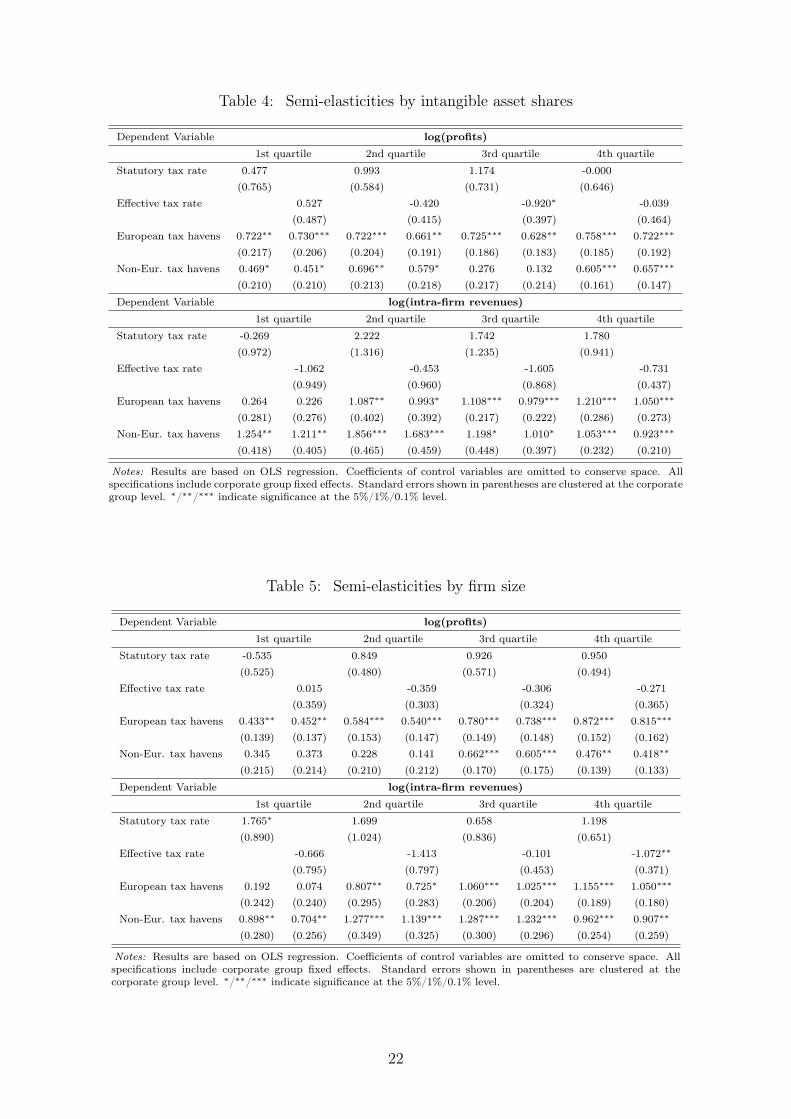
Table 4: Semi-elasticities by intangible asset shares
Dependent Variable log(profits)1st quartile 2nd quartile 3rd quartile 4th quartile
Statutory tax rate 0.477 0.993 1.174 -0.000(0.765) (0.584) (0.731) (0.646)
Effective tax rate 0.527 -0.420 -0.920∗ -0.039(0.487) (0.415) (0.397) (0.464)
European tax havens 0.722∗∗ 0.730∗∗∗ 0.722∗∗∗ 0.661∗∗ 0.725∗∗∗ 0.628∗∗ 0.758∗∗∗ 0.722∗∗∗
(0.217) (0.206) (0.204) (0.191) (0.186) (0.183) (0.185) (0.192)Non-Eur. tax havens 0.469∗ 0.451∗ 0.696∗∗ 0.579∗ 0.276 0.132 0.605∗∗∗ 0.657∗∗∗
(0.210) (0.210) (0.213) (0.218) (0.217) (0.214) (0.161) (0.147)
Dependent Variable log(intra-firm revenues)1st quartile 2nd quartile 3rd quartile 4th quartile
Statutory tax rate -0.269 2.222 1.742 1.780(0.972) (1.316) (1.235) (0.941)
Effective tax rate -1.062 -0.453 -1.605 -0.731(0.949) (0.960) (0.868) (0.437)
European tax havens 0.264 0.226 1.087∗∗ 0.993∗ 1.108∗∗∗ 0.979∗∗∗ 1.210∗∗∗ 1.050∗∗∗
(0.281) (0.276) (0.402) (0.392) (0.217) (0.222) (0.286) (0.273)Non-Eur. tax havens 1.254∗∗ 1.211∗∗ 1.856∗∗∗ 1.683∗∗∗ 1.198∗ 1.010∗ 1.053∗∗∗ 0.923∗∗∗
(0.418) (0.405) (0.465) (0.459) (0.448) (0.397) (0.232) (0.210)
Notes: Results are based on OLS regression. Coefficients of control variables are omitted to conserve space. Allspecifications include corporate group fixed effects. Standard errors shown in parentheses are clustered at the corporategroup level. ∗/∗∗/∗∗∗ indicate significance at the 5%/1%/0.1% level.
Table 5: Semi-elasticities by firm size
Dependent Variable log(profits)1st quartile 2nd quartile 3rd quartile 4th quartile
Statutory tax rate -0.535 0.849 0.926 0.950(0.525) (0.480) (0.571) (0.494)
Effective tax rate 0.015 -0.359 -0.306 -0.271(0.359) (0.303) (0.324) (0.365)
European tax havens 0.433∗∗ 0.452∗∗ 0.584∗∗∗ 0.540∗∗∗ 0.780∗∗∗ 0.738∗∗∗ 0.872∗∗∗ 0.815∗∗∗
(0.139) (0.137) (0.153) (0.147) (0.149) (0.148) (0.152) (0.162)Non-Eur. tax havens 0.345 0.373 0.228 0.141 0.662∗∗∗ 0.605∗∗∗ 0.476∗∗ 0.418∗∗
(0.215) (0.214) (0.210) (0.212) (0.170) (0.175) (0.139) (0.133)
Dependent Variable log(intra-firm revenues)1st quartile 2nd quartile 3rd quartile 4th quartile
Statutory tax rate 1.765∗ 1.699 0.658 1.198(0.890) (1.024) (0.836) (0.651)
Effective tax rate -0.666 -1.413 -0.101 -1.072∗∗
(0.795) (0.797) (0.453) (0.371)European tax havens 0.192 0.074 0.807∗∗ 0.725∗ 1.060∗∗∗ 1.025∗∗∗ 1.155∗∗∗ 1.050∗∗∗
(0.242) (0.240) (0.295) (0.283) (0.206) (0.204) (0.189) (0.180)Non-Eur. tax havens 0.898∗∗ 0.704∗∗ 1.277∗∗∗ 1.139∗∗∗ 1.287∗∗∗ 1.232∗∗∗ 0.962∗∗∗ 0.907∗∗
(0.280) (0.256) (0.349) (0.325) (0.300) (0.296) (0.254) (0.259)
Notes: Results are based on OLS regression. Coefficients of control variables are omitted to conserve space. Allspecifications include corporate group fixed effects. Standard errors shown in parentheses are clustered at thecorporate group level. ∗/∗∗/∗∗∗ indicate significance at the 5%/1%/0.1% level.
22

6 Calculating the amount of shifted profits
Based on the results of the specification including tax haven dummies (cf. Column (1) of Table3), we derive a rough estimate of the total amount of profits shifted to tax havens by largeGerman MNEs. Our estimates suggest that in 2016 and 2017 combined, large German MNEsshifted approximately EUR 18.3 billion to tax havens. This equals almost 40% of the totalprofits the MNEs in our sample reported in tax havens, which was EUR 47.3 billion (firstcolumn of Table 6).
To estimate how much profit was shifted out of Germany vis-à-vis other non-haven countries,we re-allocate the shifted profits to Germany and other non-haven countries based on thedistribution of tangible assets. Our estimates suggest that in 2016 and 2017, EUR 10.7 billionof profits were shifted out of Germany, corresponding to 4.3% of profits actually reported inGermany (second and third column of Table 6). The amount of profits shifted out of othernon-haven countries was somewhat smaller; it was equal to EUR 7.6 billion or 3% of the profitsreported in those countries. Note that these numbers are combined for the years 2016 and 2017.Translated into yearly averages, large domestic MNEs shift EUR 5.4 billion in profits out ofGermany each year. Multiplied with a statutory tax rate of 30%, this implies annual revenuelosses for Germany amounting to EUR 1.6 billion.
Table 6: Profit shifting by large German MNEs in 2016 and 2017 combined
Reported profits Shifted profits Shifted profits /
(bn. EUR) (bn. EUR) Reported profits
Germany 247.6 -10.7 -4.3%
Other non-havens 250.4 -7.6 -3.0%
European tax havens 41.4 +16.6 +40.1%
Non-European tax havens 5.9 +1.7 +28.8%
Sum 545.3 0 —
We should bear in mind that the estimates presented in Table 6 exclude profits shifted byGerman subsidiaries of foreign MNEs, and by domestic MNEs with revenues below EUR 750million. In order to obtain a rough estimate of the total amount of profits shifted to tax havensout of Germany, we make some simple extrapolations.
In 2016 and 2017 combined, the total amount of corporate profits reported in Germanywas approximately EUR 1,044.4 billion.23 This figure includes the profits reported by domestic
23 Source: German Federal Statistical Office, Sector Accounts.
23
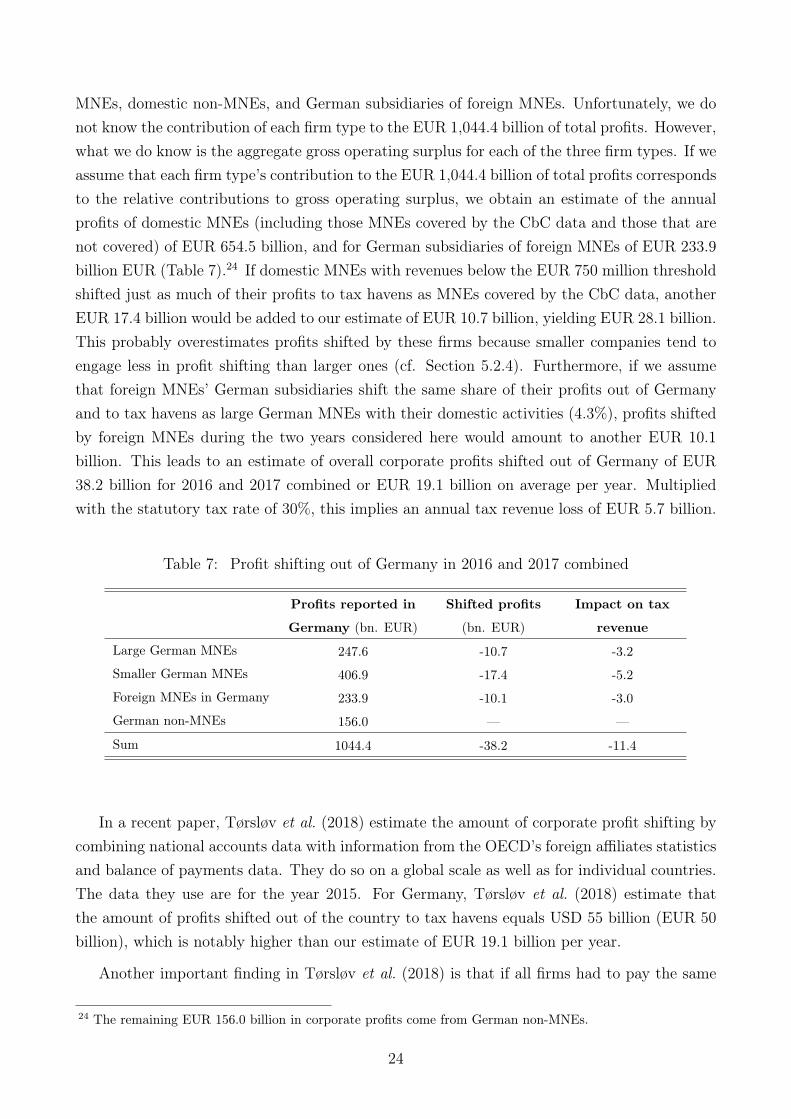
MNEs, domestic non-MNEs, and German subsidiaries of foreign MNEs. Unfortunately, we donot know the contribution of each firm type to the EUR 1,044.4 billion of total profits. However,what we do know is the aggregate gross operating surplus for each of the three firm types. If weassume that each firm type’s contribution to the EUR 1,044.4 billion of total profits correspondsto the relative contributions to gross operating surplus, we obtain an estimate of the annualprofits of domestic MNEs (including those MNEs covered by the CbC data and those that arenot covered) of EUR 654.5 billion, and for German subsidiaries of foreign MNEs of EUR 233.9billion EUR (Table 7).24 If domestic MNEs with revenues below the EUR 750 million thresholdshifted just as much of their profits to tax havens as MNEs covered by the CbC data, anotherEUR 17.4 billion would be added to our estimate of EUR 10.7 billion, yielding EUR 28.1 billion.This probably overestimates profits shifted by these firms because smaller companies tend toengage less in profit shifting than larger ones (cf. Section 5.2.4). Furthermore, if we assumethat foreign MNEs’ German subsidiaries shift the same share of their profits out of Germanyand to tax havens as large German MNEs with their domestic activities (4.3%), profits shiftedby foreign MNEs during the two years considered here would amount to another EUR 10.1billion. This leads to an estimate of overall corporate profits shifted out of Germany of EUR38.2 billion for 2016 and 2017 combined or EUR 19.1 billion on average per year. Multipliedwith the statutory tax rate of 30%, this implies an annual tax revenue loss of EUR 5.7 billion.
Table 7: Profit shifting out of Germany in 2016 and 2017 combined
Profits reported in Shifted profits Impact on tax
Germany (bn. EUR) (bn. EUR) revenue
Large German MNEs 247.6 -10.7 -3.2
Smaller German MNEs 406.9 -17.4 -5.2
Foreign MNEs in Germany 233.9 -10.1 -3.0
German non-MNEs 156.0 — —
Sum 1044.4 -38.2 -11.4
In a recent paper, Tørsløv et al. (2018) estimate the amount of corporate profit shifting bycombining national accounts data with information from the OECD’s foreign affiliates statisticsand balance of payments data. They do so on a global scale as well as for individual countries.The data they use are for the year 2015. For Germany, Tørsløv et al. (2018) estimate thatthe amount of profits shifted out of the country to tax havens equals USD 55 billion (EUR 50billion), which is notably higher than our estimate of EUR 19.1 billion per year.
Another important finding in Tørsløv et al. (2018) is that if all firms had to pay the same
24 The remaining EUR 156.0 billion in corporate profits come from German non-MNEs.
24

effective corporate tax rate in all countries, profit shifting would disappear and profits reportedin tax havens would fall by 60%. If we divide our estimate of EUR 18.3 billion of profits thatlarge German MNEs shifted to tax havens by the EUR 47.3 billion of total profits they reportin tax havens, we obtain approximately 40%, which is notably smaller, too.
It is important to interpret profit shifting estimates with respect to the counterfactualsimplied by the estimation methods used. These counterfactuals tell us how profits would bedistributed globally in the absence of profit shifting.25 In our estimates documented in Table7, the counterfactual is a world where the global distribution of profits is determined by thecontrol variables in our regressions; these include firm-level indicators of ‘real’ economic activity– employment, tangible assets, sales to third parties – and host country variables like GDP andpopulation.
To illustrate the importance of the assumed counterfactual, consider a similar, but simplerapproach: a world where profits are distributed in the same way as factors of production, thatis, employment and tangible assets. If the counterfactual distribution of the large GermanMNEs’ profits covered by the CbC data corresponded to the distribution of employment andtangible assets (with equal weights on both indicators), we would find that profit shifting outof Germany to tax havens would be roughly EUR 10 billion per year. That is almost twice asmuch as the estimate reported in Table 7. Profit shifting of German MNEs’ foreign subsidiariesout of other non-haven countries would equal EUR 3.4 billion, which is close to our estimate(Table 6). In Tørsløv et al. (2018), the counterfactual is that the profit-to-payroll ratio offoreign MNEs’ tax haven subsidiaries is the same as that of local firms. This assumption is notwithout problems because MNEs are generally more profitable than smaller firms operatingonly locally. Assuming that all tax haven profits exceeding a threshold that is determinedbased on the profitability of local firms are shifted may thus lead to an overstatement of shiftedprofits.
7 Profit shifting regressions based on Orbis data
To check whether using (incomplete) Orbis data yields different results for the tax semi-elasticityof corporate profits than the CbC data, we re-estimate the linear specification, the quadraticspecification, and the specification including tax haven dummies based on Orbis data. Tothis end, we collect information on unconsolidated profits, taxes paid, tangible assets, employ-ment, and revenues of the entities of German MNEs covered in the CbC data from the Orbis
25 See Dyreng and Hanlon (2020) for a more thorough discussion of the relevance of counterfactuals for theestimation of profit shifting.
25

database.26 We then aggregate this information at the level of the subsidiaries’ residence coun-tries for each MNE so that the data are at the same level of aggregation as the CbC data.27
Thus, our empirical approach is the same as the one outlined in Section 5.1. Table 8 shows theresults.
Table 8: Results based on Orbis data
Dependent Variable log(profits)(1) (2) (3) (4) (5) (6)
Statutory tax rate -1.165 -1.692 -0.667(0.600) (2.402) (0.610)
Statutory tax rate squared 1.124(4.993)
Effective tax rate 0.034 -10.623∗∗∗ 1.419∗∗
(0.467) (2.164) (0.459)Effective tax rate squared 25.690∗∗∗
(4.876)European tax havens 0.772∗∗∗ 1.069∗∗∗
(0.163) (0.162)Non-European tax havens — —
(—) (—)Observations 3349 3349 3316 3316 3349 3316F statistic (joint sign. tax variables) — 1.93 — 14.59∗∗∗ — —Adjusted R2 0.791 0.791 0.791 0.795 0.794 0.796
Notes: Results are based on OLS regression. Coefficients of control variables are omitted to conserve space. Allspecifications include corporate group fixed effects. Standard errors shown in parentheses are clustered at the corporategroup level. ∗/∗∗/∗∗∗ indicate significance at the 5%/1%/0.1% level.
What is striking is that we lose almost two-thirds of our observations when using Orbisdata. The reason is a drastic reduction in the number of countries included in the sample.While the CbC data document activities of German MNEs in 193 countries, our Orbis samplecovers only 46 countries (see Section 4).
The estimates we obtain based on Orbis data present a very different picture compared tothe results based on CbC data. The linear specification yields an estimate of notable size forthe coefficient of the statutory tax rate, and with a p-value just above the 5% level of signif-icance (p = 0.053). According to this estimate, a one pp increase in the statutory tax rate isassociated with a 1.2% decrease in profits. However, the quadratic specification yields coeffi-cient estimates for the statutory tax rate that are statistically insignificant both individually
26 Note that Orbis data do not contain information about intra-firm revenues, which is why we use the logof total revenues as a control variable instead. However, the estimates we obtain based on CbC data remainunaffected when replacing the revenues generated through sales to third parties by total revenues.27 Note that Huizinga and Laeven (2008) use the same approach to estimate the extent of profit shifting byMNEs.
26

and jointly. For the effective average tax rate, we obtain an insignificant coefficient estimatein the linear specification, but individually and jointly significant estimates in the quadraticspecification. The resulting marginal effects demonstrate an odd pattern, though (cf. Figure9). For low-tax jurisdictions, we observe an unreasonably large reaction to an increase in theeffective average tax rate. In countries with an effective average tax rate of 10% (which roughlycorresponds to the 10th percentile), a one pp hike in the tax rate is associated with a reductionin profits by about 5%. Once the effective average tax rate exceeds a level of roughly 20%(which is close to the sample median), the tax semi-elasticity becomes significantly positive.Only the coefficient estimate of the dummy variable for European tax havens remains relativelystable.28
But why is it that in the baseline specification, the coefficient estimate of the statutorytax rate proves to be (almost) statistically significant and of notable size when using Orbisdata, while it is insignificant and close to zero when using CbC data? It is likely that this isrelated to the poor coverage of the Orbis data. In Section 4, we discussed different reasonsfor the poor coverage, including (i) an incomplete coverage of countries, (ii) an incomplete listof subsidiaries, and (iii) missing values in the variables of interest. The first reason impliesthat the results based on Orbis data may be subject to a sample selection bias. The othertwo reasons imply that the dependent (and some of the independent) variables included in ourempirical model are measured with an error when using Orbis data, which may lead to biasedestimates as well.
To check the relevance of these two explanations, we perform two tests. First, we re-estimate our baseline specification using the CbC data, but only include those 46 countriesin our sample that are also covered in the Orbis data. If the differences in results are dueto a sample selection bias, then restricting our CbC sample to these countries should producesimilar coefficient estimates to those Table 9. However, when doing so, we obtain a coefficientestimate for the statutory tax rate that is statistically insignificant at every reasonable level ofsignificance. In contrast, the coefficient estimate of the effective average tax rate grows to -1.3(in absolute terms) and is significant even at the 0.1% level. These findings indicate that theomission of countries not covered by the Orbis data is not sufficient for explaining the differentresults based on the two data sets.
In the second test, we try to assess whether the measurement error in the dependent variable,that is, the sum of profits made by an MNE in a country, may explain the different results.The existence of a measurement error implies that the error term of Equation (1) comprises
28 We do not obtain a coefficient estimate for the dummy for non-European tax havens since the countrieslabeled as such are not covered by the Orbis data.
27

two components when using Orbis data:
εict = ϑict + eict (4)
where εict is the measurement error and ϑict is the idiosyncratic component of the compositeerror term. Under the standard assumption that E(e|X) = E(e) = 0, OLS will yield unbiasedcoefficient estimates. In our application, though, this assumption is violated for two reasons.First, apart from a few exceptions (see Section 4), the measurement error is strictly negativeas Orbis underreports aggregate MNE profits in the host countries. This violation impliesthat E(e) 6= 0; however, it does not necessarily lead to biased coefficient estimates for theexplanatory variables.29 Second, we find that coverage of the Orbis data is inversely related tothe statutory tax rate, implying that E(e|X) 6= E(e). The coefficient of correlation between thestatutory tax rate on the one hand, and the ratio of profits reported in Orbis to profits reportedin the CbC data on the other hand, is -0.54, which is considerable. The negative relationshipimplies that the extent of underreporting tends to be larger in countries with high statutory taxrates, which, in turn, leads to a downward bias in the OLS estimate of the statutory tax rate’s(negative) coefficient. Given the large size of the correlation coefficient, it is not surprising thatthe bias is so severe. Our findings thus clearly indicate that it is necessary to exercise greatcaution when interpreting the results of profit shifting regressions based on unconsolidatedOrbis data.
One reason for the fact that the extent of underreporting of profits in Orbis tends to belarger in high-tax countries could be the different treatment of profits by PEs in the two datasets. In the CbC data, profits of PEs are reported in the country where the PE is situated,while in Orbis, they are reported in the residence country of its direct parent company (cf.Section 4). Consequently, if German MNEs largely rely on legally dependent PEs to run theiroperations in high-tax jurisdictions, while their legally independent subsidiaries are situated inlow-tax jurisdictions, the ratio of profits reported in Orbis to the profits reported in CbC wouldindeed be inversely related to the statutory tax rate.
29 Using Monte Carlo simulations, Millimet and Parmeter (2019) show that strictly negative or positive mea-surement errors (which the authors refers to as ‘one-sided measurement errors’) mainly affect the estimate ofthe intercept, but not the estimates of the control variables’ coefficients, provided that the measurement erroris not correlated with the explanatory variables.
28

Figure 9: Marginal effect of tax rate change on profits – Orbisdata
Panel AStatutory tax rate change
Panel BEffective average tax rate change
Notes: The figure illustrates the average marginal effects of a change in the statutory taxrate (Panel A) and the effective average tax rate (Panel B) on the log of profits for differentrealizations of the tax rate. Average marginal effects are computed based on the coefficientestimates in Table 8. The shaded areas show 95% confidence intervals.
29

8 Conclusions
This paper studies profit shifting of German MNEs using newly available data from country-by-country reports for the years 2016 and 2017. We show that economic activities of GermanMNEs in tax havens are much more profitable than in non-havens. In addition, there is a strongnegative correlation between effective average tax rates and revenues from intra-firm trade ofgoods and services. These findings support the view that German MNEs exploit opportunitiesto shift profits to tax havens. However, compared to the profits in non-haven countries, profitsreported in tax havens are small – only accounting for 9% of global profits. According to ourestimates, roughly 40% of the profits reported in tax havens are a result of tax-induced profitshifting. Large MNEs are more tax sensitive and therefore responsible for most of the profitshifting. In total, profit shifting by large German MNEs gives rise to an annual loss in taxrevenue for German tax authorities of EUR 1.6 billion. Note that this excludes losses fromprofit shifting by German MNEs with revenues below EUR 750 million, and by the Germansubsidiaries of foreign MNEs. Adding estimates of profit shifting by firms not covered by theCbC data leads to an overall estimate of EUR 5.7 billion per year in German tax revenue lossdue to corporate profit shifting to tax havens.
In a recent paper, Tørsløv et al. (2018) report that globally, MNEs shift 40% of their foreignprofits to tax haven countries. While we do find evidence for profit shifting, the volume weestimate based on our sample of large German MNEs is much smaller than the figure reportedby Tørsløv et al. (2018). Our findings suggest that annually, EUR 3.8 billion of EUR 125billion of total foreign profits of German MNEs are shifted to tax havens, yielding a share ofapproximately 3%.
In general, estimates of the extent of profit shifting in the literature tend to be higher,although some studies, in particular Blouin and Robinson (2020), find similar magnitudes. Thedifferences in the results may result from different methods or data sources, but they may alsoreveal that German MNEs are less prone to shift profits than MNEs from other countries.That in turn could reflect tighter anti-tax avoidance policies in Germany and in important hostcountries of German foreign investment. Another reason could be differences in profit shiftingopportunities due to firm characteristics such as the importance of intangible assets.
30
References
Auerbach, M. (2016). Toxic tax deals: When BASF’s tax structure is more about style thansubstance. Study commissioned by the Greens/EFA Group in the European Parliament.
Beer, S., De Mooij, R. and Liu, L. (2020). International corporate tax avoidance: A reviewof the channels, magnitudes, and blind spots. Journal of Economic Surveys, 34 (3), 660–688.
Blouin, J. and Robinson, L. A. (2020). Double counting accounting: How much profit ofmultinational enterprises is really in tax havens? mimeo.
Buettner, T. and Wamser, G. (2013). Internal debt and multinational profit shifting: Em-pirical evidence from firm-level panel data. National Tax Journal, 66 (1), 63–96.
Clausing, K. (2016). The effect of profit shifting on the corporate tax base in the UnitedStates and beyond. National Tax Journal, 69 (4), 905–934.
Davies, R. B., Martin, J., Parenti, M. and Toubal, F. (2018). Knocking on tax haven’sdoor: Multinational firms and transfer pricing. Review of Economics and Statistics, 100 (1),120–134.
Desai, M. A., Foley, C. F. and Hines, J. R. (2006). The demand for tax haven operations.Journal of Public Economics, 90 (3), 513–531.
Dharmapala, D. (2014). What do we know about base erosion and profit shifting? A reviewof the empirical literature. Fiscal Studies, 35 (4), 421–448.
Dischinger, M. and Riedel, N. (2011). Corporate taxes and the location of intangible assetswithin multinational firms. Journal of Public Economics, 95 (7-8), 691–707.
Dowd, T., Landefeld, P. and Moore, A. (2017). Profit shifting of US multinationals.Journal of Public Economics, 148, 1–13.
Dyreng, S. and Hanlon, M. (2020). Tax avoidance and multinational firm behavior. Forth-coming in: Multinational corporations in a changing global economy. International Tax PolicyForum, Washington, DC.
Feenstra, R. C., Inklaar, R. and Timmer, M. P. (2015). The next generation of the PennWorld Table. American Economic Review, 105 (10), 3150–3182.
Fuest, C., Hebous, S. and Riedel, N. (2011). International debt shifting and multinationalfirms in developing economies. Economics Letters, 113 (2), 135–138.
Garcia-Bernardo, J., Jansky, P. et al. (2019). Multinational corporations and tax havens:Evidence from country-by-country reporting. IES Working Paper, 31.
i

Griffith, R., Miller, H. and O’Connell, M. (2014). Ownership of intellectual propertyand corporate taxation. Journal of Public Economics, 112, 12–23.
Gumpert, A., Hines, J. R. and Schnitzer, M. (2016). Multinational firms and tax havens.Review of Economics and Statistics, 98 (4), 713–727.
Hanlon, M. (2018). Country-by-country reporting and the international allocation of taxingrights. Bulletin for International Taxation, 74 (4/5).
Heckemeyer, J. H. and Overesch, M. (2017). Multinationals’ profit response to tax differ-entials: Effect size and shifting channels. Canadian Journal of Economics, 50 (4), 965–994.
Hines, J. R. and Rice, E. M. (1994). Fiscal paradise: Foreign tax havens and Americanbusiness. The Quarterly Journal of Economics, 109 (1), 149–182.
Hugger, F. (2020). The impact of country-by-country reporting on corporate tax avoidance.ifo Working Paper, 304.
Huizinga, H. and Laeven, L. (2008). International profit shifting within multinationals: Amulti-country perspective. Journal of Public Economics, 92 (5-6), 1164–1182.
IMF (2016). Corporate taxation in the global economy. . IMF Policy Paper 19/007.
Johansson, Å., Skeie, Ø. B., Sorbe, S. and Menon, C. (2017). Tax planning by multina-tional firms: Firm-level evidence from a cross-country database. OECD Economics Depart-ment Working Paper, 1355.
Kalemli-Ozcan, S., Sorensen, B., Villegas-Sanchez, C., Volosovych, V. and Yesil-
tas, S. (2015). How to construct nationally representative firm level data from the Orbisglobal database: New facts and aggregate implications. NBER Working Paper, 21558.
Langenmayr, D. and Liu, L. (2020). Where does multinational profit go with territorialtaxation? Evidence from the UK. CESifo Working Paper, 8047.
Menkhoff, L. and Miethe, J. (2019). Tax evasion in new disguise? Examining tax havens’international bank deposits. Journal of Public Economics, 176, 53–78.
Millimet, D. and Parmeter, C. (2019). Accounting for skewed or one-sided measurementerror in the dependent variable. IZA Discussion Paper, 12576.
OECD (2017). BEPS Action 13 on country-by-country reporting. OECD Publishing, Paris.
Tørsløv, T. R., Wier, L. S. and Zucman, G. (2018). The missing profits of nations. NBERWorking Paper, 24701.
ii

Wier, L. and Reynolds, H. (2018). Big and ‘unprofitable’: How 10% of multinational firmsdo 98% of profit shifting. WIDER Working Paper, 111.
Zucman, G. (2014). Taxing across borders: Tracking personal wealth and corporate profits.Journal of Economic Perspectives, 28 (4), 121–48.
iii

Appendix
Figure A1: Global distribution of German MNEs’ assets
Notes: This figure shows the average distribution of large German MNEs’ totalassets across country groups for the years 2016 and 2017.
Figure A2: Global distribution of German MNEs’employees
Notes: This figure shows the average distribution of large German MNEs’employees across country groups for the years 2016 and 2017.
iv

Table A1: Descriptive statistics for the CbC sample
Completesample
Europeantax havens
Non-Europeantax havens
Variable Obs Mean SD Obs Mean SD Obs Mean SD
Log(Profits) 9,465 14.69 2.668 717 15.24 2.653 362 14.53 2.465Profits (in mio. EUR) 9,465 57.61 474.7 717 57.71 225.6 362 16.37 40.05Log(Intra-firm revenues) 8,375 15.06 3.463 647 15.50 3.505 338 15.30 3.232Revenues related 9,465 203.3 2,386.0 717 128.8 483.4 362 123.2 759.5(in mio. EUR)Statutory tax rate 9,410 0.245 0.075 717 0.214 0.057 358 0.163 0.050Effective avg. tax rate 9,275 0.194 0.095 717 0.104 0.020 345 0.110 0.053Statutory tax rate 9,397 -0.044 0.081 717 -0.075 0.061 358 -0.133 0.063(differential)Effective avg. tax rate 9,262 0.033 0.098 717 -0.054 0.029 345 -0.050 0.059(differential)Log(Assets) 9,465 15.37 3.187 717 15.22 3.347 362 14.51 2.794Assets (in mio. EUR) 9,465 284.3 3,406.0 717 146.80 1,152.1 362 31.38 133.3Log(Employment) 9,465 4.933 2.076 717 4.518 1.870 362 4.028 1.706Employment 9,465 1338.2 7,618.0 717 429.3 1,042.5 362 223.6 515.1Log(Revenues unrelated) 9,465 17.05 2.894 717 17.24 2.790 362 16.58 2.728Revenues unrelated 9,465 444.48 3,004.1 717 234.5 538.3 362 170.7 727.9(in mio. EUR)Corruption perception index 9,465 0.598 0.192 717 0.807 0.072 362 0.764 0.136Log(GDP per capita) 9,465 10.27 0.706 717 10.99 0.252 362 10.94 0.586Log(Population) 9,465 3.314 1.597 717 1.859 1.180 362 1.519 1.012
v

Table A2: List of tax havens
Category Countries
European tax havens Cyprus, Gibraltar, Ireland, Liechtenstein, Luxembourg,
Malta, Netherlands, Switzerland
Non-European tax havens Antigua and Barbuda, Bahamas, Bahrain, Barbados, Belize, Bermuda,
British Virgin Islands, Cayman Islands, Cook Islands, Curacao,
Gibraltar, Grenada, Guernsey, Hong Kong, Isle of Man, Jersey, Liberia,
Montserrat, Panama, Saint Kitts and Nevis, Saint Vincent and the
Grenadines, Singapore, Sint Maarten, Turks and Caicos Islands, Vanuatu
Notes: The classification is based on IMF (2016) and Menkhoff and Miethe (2019).
Table A3: Descriptive statistics for the Orbis sample
Completesample
Europeantax havens
Non-Europeantax havens
Variable Obs. Mean SD Obs Mean SD Obs Mean SD
Log(Profits) 3,751 15.02 2.430 165 15.73 2.155 0 — —Profits (in mio. EUR) 3,751 67.42 387.6 165 93.48 357.1 0 — —Statutory tax rate 3,751 0.227 0.062 165 0.216 0.065 0 — —Effective avg. tax rate 3,713 0.198 0.073 164 0.067 0.048 0 — —Statutory tax rate 3,702 -0.032 0.069 162 -0.049 0.069 0 — —(differential)Effective avg. tax rate 3,664 -0.034 0.094 161 -0.168 0.068 0 — —(differential)Log(Assets) 3,751 14.73 3.159 165 14.02 3.220 0 — —Assets (in mio. EUR) 3,751 121.0 839.1 165 22.91 162.8 0 — —Log(Employment) 3,751 5.146 2.018 165 4.612 1.522 0 — —Employment 3,751 1,377.3 7,032.8 165 265.9 407.3 0 — —Log(Revenues) 3,751 17.90 2.158 165 18.00 1.928 0 — —Revenues (in mio. EUR) 3,751 3,902.6 198,749.2 165 283.7 708.0 0 — —Corruption perception index 3,751 0.620 0.169 165 0.793 0.046 0 — —Log(GDP per capita) 3,751 10.42 0.421 165 11.06 0.281 0 — —Log(Population) 3,751 3.103 1.432 165 1.766 1.273 0 — —
vi

Table A4: Complete list of countries covered by CbC reports vs. Orbis
Country Coverage of Country Coverage of
(ISO code) profits assets employment entities (ISO Code) profits assets employment entitiesAD 0 — — 0 KZ 0 0 0 0AE 0 0 0 0 LA 0 0 0 0AF 0 — 0 0 LB 0 0 0 0AG — — — 0 LI 0 0 0 0AL 0 0 0 0 LK 0 0 0 0AM 0 0 0 0 LR 0 0 0 0AO 0 0 0 0 LS 0 0 0 0AR 0 0 0 0 LT 77.7 29.4 48.6 27.3AT 45.4 27.8 63.0 67.3 LU 37.6 2.7 33.4 17.3AU 28.6 19.4 77.3 18.6 LV 108.5 23.9 61.9 47.5AW 0 0 0 0 LY — 0 0 0AZ 0 0 0 0 MA 0 0 0 0BA 53.9 37.9 59.0 69.7 MC 0 0 0 0BB 0 0 0 0 MD 0 0 0 0BD 0 0 0 0 ME 101.6 94.5 57.2 66.7BE 64.0 43.0 71.9 56.6 MG 0 0 0 0BF 0 0 0 0 MH 0 0 — 0BG 65.9 55.3 96.4 59.6 MK 83.9 87.2 107.2 37.5BH 0 0 0 0 ML 0 0 0 0BI 0 0 0 0 MM 0 0 0 0BJ 0 0 0 0 MN 0 0 0 0BM 0 0 0 0 MO 0 0 0 0BN 0 0 0 0 MQ 0 0 0 0BO 0 0 0 0 MR 0 0 0 0BR 26.5 4.3 2.6 5.7 MT 0.0 0.0 0.8 2.7BS 0 0 0 0 MU 0 0 0 0BW 0 0 0 0 MW — 0 0 0BY 0 0 0 0 MX 0.5 0.2 0.3 0.3BZ 0 0 0 0 MY 0 0 0 0CA 0 0 0 0 MZ — 0 0 0CD 0 0 0 0 NA 0 0 0 0CF 0 0 0 0 NC 0 0 0 0CG 0 0 0 0 NE 0 0 0 0CH 0 0 0 0 NG 0 0 0 0CI 0 0 0 0 NI 0 0 0 0CL 0 0 0 0 NL 47.9 7.9 16.4 29.3CM 0 0 0 0 NO 96.8 134.7 106.2 75.9CN 51.5 18.9 44.1 21.6 NP 0 0 0 0CO 0 0.002 0.01 1.1 NZ 0 0 0 0CR 0 0 0 0 OM 0 0 0 0CU — 0 0 0 PA 0 0 0 0CV 0 0 0 0 PE 10.2 0.6 4.7 1.6CW 0 0 0 0 PF 0 0 0 0CY 0 0 0 0 PG 0 0 0 0CZ 51.5 46.6 64.2 76.0 PH 0 0 0 0DE 62.0 19.6 43.7 39.5 PK 0 0 0 0DK 59.5 31.0 56.0 44.1 PL 42.8 24.1 45.8 50.0DO 0 0 0 0 PR 0 0 0 0DZ 0 0 0 0 PS — 0 0 0EC 0 0 0 0 PT 68.4 26.4 57.4 70.7EE 43.6 34.6 42.9 46.7 PY 0 0 0 0EG 0 0 0 0 QA 0 0 0 0ES 44.4 45.1 67.5 62.9 RE 0 0 0 0ET 0 0 0 0 RO 77.9 64.0 66.5 61.4FI 99.1 18.7 57.3 44.4 RS 105.3 55.6 80.1 73.4
vii

Table A2.4 continued
Country Coverage of Country Coverage of
(ISO code) profits assets employment entities (ISO Code) profits assets employment entitiesFJ 0 0 0 0 RU 101.0 36.5 67.0 64.1FM 0 0 0 0 RW 0 0 0 0FR 91.2 20.3 72.2 54.9 SA 0 0 0 0GA — 0 0 0 SB 0 0 0 0UK 73.0 49.7 103.3 74.2 SE 10.1 56.3 54.5 52.5GE 0 0 0 0 SG 0 0 0 0GF — — 0 0 SI 79.1 39.5 70.4 65.9GG 0 0 0 0 SK 47.1 34.9 36.8 47.5GH 0 0 0 0 SL 0 0 0 0GI 0 — — 0 SM 0 0 0 0GM 0 0 0 0 SN 0 0 0 0GN 0 0 0 0 SV 0 0 0 0GP 0 0 0 0 SX — 0 0 0GQ 0 0 0 0 SY 0 0 0 0GR 14.3 4.3 17.8 34.2 SZ 0 0 0 0GT 0 0 0 0 TD 0 0 0 0GW 0 0 0 0 TG 0 0 0 0HK 0 0 0 0 TH 0 0 0 0HN 0 0 0 0 TJ — 0 0 0HR 84.5 64.8 85.6 64.9 TL 0 0 — 0HT — 0 0 0 TM — 0 0 0HU 36.0 45.8 53.1 39.8 TN 0 0 0 0ID 0 0 0 0 TO — — — 0IE 65.8 2.1 67.6 111.4 TR 0.6 0.2 0.9 0.8IL 0 0 0 0 TT 0 0 0 0IM 0 — — 0 TW 38.0 6.7 48.7 1.4IN 0.1 0.9 1.0 4.7 TZ 0 0 0 0IQ 0 0 0 0 UA 77.1 37.9 77.0 35.3IR 0 0 0 0 UG 0 0 0 0IS 56.5 51.5 86.9 75.0 US 0 0 0 0IT 41.0 23.3 51.9 72.3 UY 0 0 0 0JE 0 0 0 0 UZ 0 0 0 0JM — 0 0 0 VE 0 0 0 0JO 0 0 0 0 VG 0 0 0 0JP 1.5 0.6 1.8 3.5 VI 0 0 0 0KE 0 0 0 0 VN 0 0 0 0KG — — — 0 WS 0 — — 0KH 0 0 0 0 XK 0 0 0 0KP 0 0 0 0 ZA 0 0 0 0KR 48.8 7.8 52.9 30.3 ZM 0 0 0 0KW 0 0 0 0 ZW 0 0 0 0KY 0 0 0 0
Notes: This table shows the coverage of CbC data by Orbis (in %). The figures represent the ratio of the respectivevariable’s realization in Orbis to its realization in the CbC data. “—” indicates that the variable is zero in the CbCdata.
viii