corporate tax avoidance and public debt costs
TRANSCRIPT

1
Corporate Tax Avoidance and Public Debt Costs *
Terry Shevlin University of California – Irvine
Oktay Urcan London Business School
Florin Vasvari London Business School
August 2013
Abstract We investigate the impact of corporate tax avoidance on the cost of public debt and provide evidence on the channels through which it affects the cost of debt. Although corporate tax avoidance increases current after-tax cash flows thus lowering default risk, it amplifies the uncertainty by negatively affecting future cash flows and it facilitates more opaque reporting. Using a large sample of US corporate bonds, we document that corporate tax avoidance is associated with higher bond offering yields. We also find that tax avoidance predicts lower and more volatile future cash flows and that approximately one third of the total effect of tax avoidance on the cost of public debt is explained through the negative effect of tax avoidance on future cash flows levels. Consistent with the lasting negative impact of tax avoidance activities on bondholders' wealth, we find that insurance companies, who are long term buy-and-hold bond investors, are less likely to own the bonds of the firms engaging in these activities. Additional cross sectional analyses indicate that corporate tax avoidance increases the cost of public debt especially when equityholders and the management have incentives to expropriate bondholders’ wealth and when the probability of an IRS audit is high. JEL Classifications: G31, G32, M10, O16 Keywords: Corporate Tax Avoidance, Cost of Public Debt, Bond Ownership, Governance * We appreciate helpful comments from Atif Ellahie, Scott Richardson, Texas Tax Readings Group, and seminar participants at London Business School. We gratefully acknowledge the support of London Business School RAMD Fund. We thank Michelle Hanlon for generously supplying the names of their tax shelter firms.
2
1. Introduction
An expanding literature has analyzed the consequences of corporate tax avoidance in
capital markets focusing mainly on equity pricing (e.g., Hanlon and Slemrod, 2009; Wilson,
2009; Koester, 2011; Hutchens and Rego, 2012; Goh et al., 2013). We add to this literature
by examining the association between corporate tax avoidance and offering yields of public
bond issues and investigating the determinants of this association. The analysis of the effect
of tax avoidance on the cost of debt is relevant given the inconclusive findings of its effect on
the cost of equity, the conflicts of interest between equityholders and debtholders and the fact
that, in contrast to the cost of equity, the cost of debt is affected by idiosyncratic risk factors.1
In addition, corporate tax avoidance is potentially another determining factor of the cost of
public debt financing which affects the use of public bonds in the capital structure of the
firm.2 Understanding the drivers of the cost of public debt is important given that the U.S.
corporate bond market provides one of the largest sources of capital to public corporations:
the average annual corporate bond issuance in the U.S. over the last six years exceeded $950
billion, compared to an average of about $200 billion raised through common equity
issuances (SIFMA, 2012).
Prima facie, corporate tax avoidance reduces cash taxes, increasing current after-tax
cash flows available to service the debt, and thus reducing the risk of default. This argument
suggests that we should observe an inverse relation between debt offering yields and tax
avoidance: firms exhibiting more corporate tax avoidance should receive lower bond offering
yields. However, two main countervailing forces lead to the opposite prediction suggesting
that it is an empirical issue as to whether increased corporate tax avoidance is associated with
lower or higher bond yields. First, corporate tax avoidance activities could induce higher
1 The classical Merton (1974) model suggests that debt investors demand compensation for exposure to total asset volatility risk which is affected by both systematic and unsystematic risk factors. Corporate tax avoidance is likely to affect asset volatility through its impact on the firm’s cash flows. 2 In a recent paper, Rauh and Sufi (2010) document that bond debt represents approximately 20% of total assets for a random sample of U.S. non-financial corporations.

3
uncertainty about the magnitude and volatility of the firms' future profits and cash flows.
Lower and more volatile future cash flows are viewed negatively by debt holders. This future
cash flow uncertainty can be due to elevated tax risk which comes about because of an
increased probability of IRS audits, penalties and interest charges but also due to managerial
rent extraction. Complex tax structures can be used by firm managers to enable and obscure
the expropriation of firm resources (e.g., Desai et al., 2007; Dhaliwal et al. 2011; Hanlon et
al., 2012).
Second, in the spirit of Scholes et al. (2008), corporate tax avoidance activities may
decrease the quality and transparency of the financial statements. Desai and Dharmapala
(2006) and Desai et al. (2007) argue that tax avoidance, especially that involving more
aggressive positions, often involves opaque reporting. Consistent with this argument,
Balakrishnan et al. (2012) find that firms with tax planning activities are characterized by a
less transparent information environment due to these activities' role in increasing the
complexity of the firm.3
We test these arguments using a sample of approximately 7,000 individual bond
issues from 962 U.S. domiciled non-financial firms over the period 1990-2007. We employ a
number of proxies to capture corporate tax avoidance. Our first measure, ETR5, is the ratio of
total tax expense scaled by total pre-tax income net of total special items averaged over a five
year period just prior to the bond issue (Dyreng et al., 2008). This measure captures the
average GAAP effective tax rate (ETR) and reflects tax planning activities that lower taxable
income but have no effect on past, current or future book income thus giving rise to
permanent differences between the two incomes.4 Our second measure is the ratio of taxes
3 On the other hand, Wang (2010) documents that more transparent firms engage in more tax avoidance, suggesting that tax avoidance enhances shareholders' wealth. 4 Shevlin (2002) argues that tax activities that give rise to permanent differences represent the ideal tax shelter because the lowering of taxable income but not book income avoids the book-tax trade-off when firms undertake conforming tax activities (meaning both taxable and book income are lowered). In contrast, tax

4
paid in cash to pre-tax income net of total special items averaged over the same five year
period (CETR5). This measure captures the effect of all cash tax savings, whether they are
temporary or permanent.5 Our third corporate tax avoidance proxy is a composite tax
avoidance measure, CTA, computed as the average of the annual decile ranks of ETR5 and
CETR5. We standardize the average to be between zero (high tax avoidance) and one (low
tax avoidance).
We find that offering bond yields are higher for firms avoiding more taxes.
Specifically, we document a significant negative relation between bond offering yields and
the three corporate tax avoidance measures (higher values indicate less tax avoidance).
Although the economic magnitudes of these average effects seem small, we investigate the
impact of factors that are potentially associated with a larger economic impact in additional
analyses. To better isolate the effect of corporate tax avoidance on bond offering yields, we
control for an aggregate measure that captures several accepted proxies of information quality
throughout all multivariate analyses in our study. Therefore, the effect of corporate tax
avoidance on bond offering yields is incremental to the effect of information quality.
We run three additional robustness analyses. First, we address the issue that corporate
tax avoidance measures, despite being lagged for up to five years, are potentially endogenous.
Following the approach of Dittmar and Mahrt-Smith (2007), we use tax avoidance measures
computed in the first year they are available in our sample period, thus removing the time
variation in these measures, and find similar results. Second, we replace the bond yields with
a measure of the distance to default, expected default frequencies (EDFs), provided by
Moody’s/KMV. In contrast to bond offering yields, EDFs are not affected by bond illiquidity
or the tax position of the bond investors in the secondary bond market that are difficult to
control for in the bond analyses. As a certified rating agency, Moody’s has preferential access activities giving rise to temporary differences lower taxable income in the current period relative to book income but lower book income in some future period. 5 We have replicated our results using yearly effective tax rate measures and our inferences are similar.

5
to private information about borrowers when issuing ratings and uses sophisticated
information processing methodologies, relative to the marginal bond investor. Therefore, the
EDFs are less likely to reflect issues with the information quality of firm’s public reports. We
continue to find that tax avoidance measures are negatively and significantly associated with
EDFs suggesting that Moody's is concerned about the uncertainty of future cash flows
triggered by tax avoidance.
Third, we examine changes in the five year credit default swap (CDS) spreads to the
public announcement of a firm’s participation in a corporate tax shelter using the sample of
tax shelters identified by Hanlon and Slemrod (2009). CDS spreads provide a market
assessment of the probability of default and have the advantage of trading far more frequently
than the underlying bond securities (e.g., Hull et al., 2004).6 CDS spreads are also much less
affected by liquidity problems, changes in interest rates, tax issues and contract design
features that are specific to bond securities. Most importantly, prior research suggests that
CDS spreads incorporate information faster than equity markets because dealers in this
market enjoy lower information asymmetry due their access to private information (Acharya
and Johnson, 2007; Norden and Weber, 2004). We compute market adjusted changes in the
CDS spreads over a five day period centered on the tax shelter announcement dates. We find
a positive and statistically significant change in the CDS spreads of the announcing firms
suggesting that credit market participants react negatively to tax shelter announcement
events. This result provides further evidence that credit markets view corporate tax avoidance
activities negatively, likely to be due to the uncertainty generated by tax avoidance with
respect to future cash flows.
Supporting our interpretations above, we document that firms engaging in corporate
tax avoidance activities experience significant cash flow shortfalls and greater cash flow
6 The low frequency of bond trade data makes it difficult to conduct short-window tests in bond markets (e.g., Goodhart and O’Hara, 1997; Hotchkiss and Ronen, 2002).

6
volatility five years ahead. For instance, a decrease in the composite tax avoidance (CTA)
measure from the 90th percentile to the 10th percentile of its sample distribution decreases the
average cash flow from operations scaled by total assets by 0.7%, an economically
meaningful effect given that the average cash flow ratio is about 11% in our sample. The
ability of the tax avoidance measures to predict lower cash flow levels and higher cash flow
volatility suggests that bond investors view corporate tax avoidance as an early indicator of
lower and more volatile future cash flows instead of an indicator of future information
opacity that impairs monitoring efforts. We test this statement directly by implementing a
path analysis methodology. We examine three mechanisms, future cash flow levels, future
cash flow volatility and information quality, through which corporate tax avoidance
potentially increases the cost of debt. We document that corporate tax avoidance has both
direct and indirect effects on bond offering yields, with the main indirect effect arising
through lower future cash flows. This effect explains approximately one third of the total
effect of tax avoidance on the cost of public debt. Information quality is not a very important
mediating factor; the indirect effect on bond offering yields through information quality is
very small relative to the total effect.
Given that the negative impact of corporate tax avoidance on future cash flows takes a
few years to materialize, we test whether long term bond investors indeed consider this effect.
Specifically, we test whether insurance companies, the largest and most important bond
investors, are less likely to own bonds issued by firms engaging in tax avoidance activities.7
Because regulators impose strict capital requirements that increase with the portfolio's credit
riskiness, insurance companies are expected to avoid bonds issued by firms engaging in tax
avoidance activities that potentially generate future drops in credit quality due to lower and
more volatile cash flows. Consistent with our expectation, we find that greater tax avoidance 7 Because these investors have access to a stable supply of capital, relative to other investors such as mutual funds or hedge funds, they are typically long term holders of bonds. The average bond in our sample has a mean insurance company ownership (number) of 20% (10).

7
lowers the bond ownership of insurance companies. This finding reinforces our results that
corporate tax avoidance activities are viewed negatively by the bond market, and suggests
that the lasting impact of corporate tax avoidance on credit risk affects the investment
decisions of long term buy and hold investors.
In the last set of analyses, we further investigate the role of two sets of factors that
affect the positive association between corporate tax avoidance and bond yields through their
effect on future cash flows available to service the debt: debtholder wealth expropriation
incentives, which reflect the conflicts of interest between equityholders and debtholders, and
the probability of an IRS audit, which reflects tax risk. We find that proxies that capture
incentives to expropriate debtholders' wealth such as poor corporate governance, more
concentrated equity ownership, high risk-taking incentives of management and high credit
risk result in stronger associations between corporate tax avoidance and bond offering yields.
The impact of these variables is economically large. For instance, the coefficient estimates
for poorly governed firms indicate that a drop in the composite tax avoidance measure from
the 90th percentile to the 10th percentile of its distribution increases the bond offering yields
by 37 basis points, a 5.3% reduction in the average bond yields. We similarly find a stronger
relation between tax avoidance and bond yields when the probability of an IRS audit is high,
suggesting that bondholders are concerned about increased tax payouts resulting from IRS
audits.
Our paper makes a number of contributions. First, we contribute to the emerging
literature that examines how capital suppliers view corporate tax avoidance activities. The
current research provides mixed results with respect to how equityholders view tax avoidance
activities. On the one hand, Hanlon and Slemrod (2009) find that a company’s stock price
drops around news of the firm involvement in tax shelters and Hutchens and Rego (2012)
find that higher tax reserves are associated with a higher cost of capital. On the other hand,

8
Goh et al. (2013) find that less aggressive forms of corporate tax avoidance are associated
with a significantly lower cost of equity while Koester (2011) finds that shareholders value
uncertain tax avoidance positively. We add to this literature by documenting how corporate
tax avoidance is viewed by public bondholders, another set of stakeholders with often
conflicting incentives from shareholders and with a focus on downside risk protection given
their capped payoffs. Similar mixed results have been found in debt settings. Kim et al.
(2010) and Lisowsky et al. (2011) find that corporate tax avoidance and tax aggressiveness
respectively are associated with lower interest costs while Crabtree and Maher (2009) and
Ayers et al. (2010) find that book-tax differences, a proxy for higher tax avoidance, are
associated with lower ratings. While these papers focus on a different set of debt market
participants, bank lenders or rating agencies, that have preferential access to private
information, we examine the effect on the pricing of public debt where individual investors
have less ability and incentives to monitor and have access only to public information. We
contribute to this literature not only by showing the impact of corporate tax avoidance on the
actual cost of public debt but also by documenting that its indirect effect on the cost of public
debt is through lower future cash flows not information quality. Most importantly, we
provide novel insights into how corporate tax avoidance affects the investment decisions of
long term investors in public debt securities.
Second, we add to the rapidly developing literature that investigates the impact of the
reported financial information and its quality on the cost of debt securities (e.g., Yu, 2005;
Francis et al., 2005; Sengupta, 1998; Bharat et al., 2008; Easton et al., 2009; Ghosh and
Moon, 2010; Shivakumar et al., 2011; DeFond and Zhang, 2011). We show that measures of
corporate tax activities inferred from the firm's reported income statement, are relevant
variables that are also priced in the public debt market not because of their impact on the
quality of the accounting information but because they are a lead indicator of future cash

9
flows problems.
Third, our results provide an explanation on why more firms do not engage in tax
shelters and corporate tax avoidance given the possibility of substantial tax savings (e.g.,
Weisbach, 2002). Our evidence suggests that a major provider of capital, public debtholders,
view corporate tax avoidance in a negative light especially when incentives to expropriate
their wealth are in place and the probability of an IRS audit is high.
Fourth, the evidence we provide is consistent with Graham and Tucker (2006) and
Wilson (2009) who document a strong negative relation between leverage and the incidence
of tax shelter activity concluding that the two are substitutes. The findings of prior work by
Kim et al. (2010) and Lisowky et al. (2011) that tax avoidance reduces the cost of private
debt and interest expenses suggest that firms should issue more debt, increasing leverage,
thus contradicting the substitutability result. In contrast, our findings support the substitution
between leverage and corporate tax avoidance by showing that one potential explanation is
that tax avoidance makes borrowing more expensive thus incentivizing the firms to have
lower leverage.
The remainder of the paper is organized as follows. Section 2 develops our
hypotheses and summarizes the prior literature. Section 3 discusses the sample selection,
variables and the research design. Section 4 presents our findings and Section 5 concludes.
2. Hypothesis development and prior literature
2.1. Hypotheses development
Corporate tax avoidance activities significantly reduce taxes thus saving cash flows
that can be used to service the firm’s debt. For our sample firms (described more fully
below), the mean one year cash ETR (CETR) is 25.0%, a rate that is 10% below the U.S.
corporate statutory rate of 35%. Given that the mean pre-tax book income is approximately
$1,160 million, the lower rate implies average annual cash savings of $116 million ($1,160

10
million × (0.35 − 0.25)) for the average firm in our sample.8 Such relatively large annual cash
savings from tax avoidance potentially improve the solvency of the firm and reduce its
default risk. Thus, firms pursuing more corporate tax avoidance should receive lower yields
on debt issues.
However, corporate tax avoidance activities, particularly the more aggressive ones,
could reduce future cash flows and increase cash flow volatility due to tax risks or escalated
managerial rent extraction. Tax risks come about because of higher probability of IRS audits,
interest and penalties. For example, Wilson (2009) reports that, among his sample of tax
shelter participants, the median savings from the tax shelters is $66.5 million with the IRS
assessing interest and penalties on the tax shelters of $58 million. Also, complex tax
structures allow firm managers (and others) to expropriate firm resources which may or may
not include the cash tax savings from the tax avoidance activity. For instance, Dhaliwal et al.
(2011) argue that tax avoidance allows managerial rent extraction that contributes to lower
cash holdings. Such wealth expropriation reduces the after-tax cash flows to debtholders and
increases the volatility of the cash flows. Both effects (reduced level and more volatile cash
flows) will lead debtholders to require ex ante price protection via higher yields.
Second, in the spirit of Scholes et al. (2008), there are non-tax costs associated with
corporate tax avoidance activities such as lower quality and transparency of the financial
statement numbers that potentially impair bondholders’ ability to monitor the borrowers.
Desai and Dharmapala (2006), Desai, Dyck and Zingales (2007), Balakrishnan, Blouin and
Guay (2012) argue that aggressive tax avoidance often involves opaque reporting so as to
conceal either the purpose of the underlying transaction or the very existence of the
transaction to escape detection by tax authorities.9 In the same spirit, Frank, Lynch and Rego
(2009) document that tax aggressiveness is associated with the reporting of more 8 A similar calculation using the sample median indicates annual cash savings of $39.5 million. 9 Balakrishnan et al (2012) also show that firms increase other disclosures to reduce the opacity problem with shareholders. IRS could use these disclosures to go after tax avoiding firms.

11
discretionary accruals while Kim, Li and Zhang (2011) find that corporate tax avoidance
activities are strongly associated with firm-specific stock price crash risk, consistent with tax
avoidance introducing opacity by facilitating the hoarding and accumulation of bad news for
extended periods.10 Given the higher sensitivity of bond prices to negative news, tax avoiding
firms are likely to experience negative bond returns in the future, when bad news is
released.11 Therefore, if corporate tax avoidance increases the opacity of the financial
information, bondholders will face higher adverse selection and moral hazard problems that
should be reflected in higher bond offering yields.
In summary, there are arguments suggesting that public debtholders view corporate
tax avoidance either favourably or negatively. Thus it is an empirical issue as to whether
increased corporate tax avoidance is associated with lower or higher debt yields at the time
when public debt is issued. In addition, it is unclear which factors are likely to influence the
relation between the bond yields and the corporate tax avoidance. The possible agency costs
associated with tax avoidance activities discussed above are more likely to arise among firms
whose equityholders and managers have incentives to expropriate debtholders' wealth or
firms that face high IRS audit risk. We investigate the role of several mechanisms that likely
facilitate debtholders' wealth expropriation: (1) Corporate takeover markets, (2) Large
blockholders, (3) CEO's high equity risk-taking incentives and (4) High credit risk. We
discuss below the impact of these factors on debtholder wealth expropriation activities that
potentially affect the association between corporate tax avoidance activities and bond yields
at issuance.
We expect that strong antitakeover provisions, coded using the methodology of
Gompers, Ishii and Metrick (2003), are an indication of poor governance, since they shield
10 A recent line of research argues that firms with aggressive financial reporting are less likely to be tax aggressive to avoid the suspicion of investors, SEC, or IRS (e.g., Erickson et al., 2004; Lennox et al., 2013). 11 Easton, Monahan, and Vasvari (2009) document that bad earnings news are the main drivers of bond returns in the secondary bond market.
12
the firm from the market for corporate control which is viewed as a strong external
disciplining mechanism.12 Ineffective monitoring by the corporate takeover market could
allow entrenched managers to exploit tax avoidance activities for personal gains (Desai and
Dharmapala, 2006). However, the adoption of antitakeover amendments is not necessarily a
sign of debtholder wealth expropriation. Avoiding takeovers that are motivated by wealth
transfers from bondholders to stockholders (Shleifer and Summers, 1988) or increasing the
credit risk of the firm by adding debt (Warga and Welch, 1993) while preserving cash
through corporate tax avoidance schemes can be beneficial to bondholders.
Lisowsky et al. (2011) argue that debtholders view large blockholders negatively
since these shareholders have both the incentive and ability to expropriate resources and tax
avoidance activities, particularly the more aggressive ones, offer them an opportunity for
expropriation (e.g., Desai and Dharmapala, 2006; Desai et al., 2007). If this is the case, then
we expect any positive association between debt yields and tax avoidance to be stronger for
firms with large blockholders. An alternative argument can be made for the role of
blockholders as outside monitors of the management of the firm (Jensen, 1993; Shleifer and
Vishny, 1997). These shareholders have the incentives (due to the large size of their
investment) and resources to uncover managerial opportunism that also negatively impact
debtholders.
Coles, Daniel and Naveen (2006) document that a higher sensitivity of CEO's wealth
to stock volatility (vega) is associated with riskier policy choices, including relatively more
investment in R&D, less investment in property, plant and equipment, more focus on fewer
lines of business, and higher leverage. All these activities are detrimental to bondholders'
wealth because they increase the riskiness of the underlying assets and facilitate wealth
expropriation. However, another effect of increased vega is to expose managers to more risk. 12 We acknowledge the likely endogeneity of the corporate takeover index. For example, a growing firm with large needs for outside debt financing has more incentives to adopt better governance practices in order to lower its cost of debt.

13
If CEOs are undiversified with respect to firm-specific wealth, they are exposed to more risk
than diversified shareholders. Accordingly, CEOs will engage in less risky activities, which
benefit bondholders, to preserve their wealth.
Easton et al. (2009) argue that if firms are credit risky (i.e., have speculative grade
debt) then equityholders have strong incentives to engage in risky activities that expropriate
bondholders' wealth. This is because they hold a call option that is relatively close to being
out-of-the-money vis-à-vis the call option embedded in an investment grade bond. As a
result, we expect the relation between corporate tax avoidance and bond yields to be stronger
when firms are credit riskier.
Finally, several recent papers propose and test the role of the IRS as a monitor of
firm’s tax avoidance behaviour. As a monitor, the IRS reduces the ability of managers to act
opportunistically via their tax planning activities, thus protecting debtholders’ wealth.
Guedhami and Pittman (2008) examine the role of the IRS as a monitor in the pricing of
public debt (nonconvertible 144A bond issues) for private firms and find that the probability
of an IRS audit decreases bond yields among private firms. They conclude that IRS
monitoring plays a valuable corporate governance role by reducing information asymmetry
embedded in borrowing costs. Further, Hoopes et al. (2012) find that IRS audits deter
corporate tax avoidance. These arguments suggest a weaker association between tax
avoidance and bond yields when the probability of an IRS audit is higher. However,
bondholders could be concerned about the risks associated with an IRS audit of a firm’s tax
avoidance activities since such an audit can trigger large payouts introducing uncertainty
about firms’ future cash flows (Wilson, 2009).
2.2 Prior literature
Prior literature has investigated extensively how the quality of accounting numbers
(Francis et al., 2005; Bharath et al., 2008; Zhang, 2008; Bhojraj and Swaminathan, 2009;

14
Ghosh and Moon, 2010) and corporate disclosures (Sengupta, 1998; Shivakumar et al., 2011)
affect credit spreads. Another stream of literature has documented a strong relation between
accounting earnings and credit spreads (Datta and Dhillon, 1993; Hotchkiss and Ronen, 2002;
Easton et al., 2009; DeFond and Zhang, 2012). We extend this work by examining how
corporate tax avoidance, as reflected in the reported accounting numbers, affects bond yields
in the primary bond market. We show that it is the impact of corporate tax avoidance on
future cash flows rather than on information quality that is driving the association between
tax avoidance and bond offering yields.
While there have been a number of studies investigating the relation between
corporate tax avoidance and the pricing of equity, we could identify only a few studies
examining the relation between corporate tax avoidance and debt pricing that provide mixed
results. We briefly summarize these studies and highlight our incremental contribution.
Kim et al. (2010) predict and find evidence that firms exhibiting greater tax avoidance
obtain bank loans with lower interest rates and fewer covenant restrictions.13 They argue that
the cash tax savings arising from tax avoidance is likely to be viewed favorably by banks
because they have privileged access to private information and greater abilities and incentives
to monitor borrower’s activities compared to other outside capital providers. In contrast to
Kim et al. (2010), we investigate the effect of corporate tax avoidance on the cost of a
different set of contracts which are long term debt securities (average maturity is almost 12
years for bonds versus only 3-4 years for loans). Also, investors in the bond market, in
contrast to syndicate banks, rely only on publicly available information including the firm’s
financial statements, have limited monitoring incentives and cannot renegotiate their claims.
This choice also motivates our use of public financial statement based measures of corporate
tax avoidance.
13 Kim et al. (2010) proxy for corporate tax avoidance using a factor analysis of various book-tax difference measures, the 5-year cash ETR, and a tax shelter probability score based on Wilson (2009).

15
Lisowsky et al. (2011) examine the relation between measures purported to capture
the more extreme end of corporate tax avoidance (referred to as corporate tax aggressiveness)
and the interest expense of outstanding debt.14 They document that more tax aggressive firms
have lower interest rates. Lisowsky et al. (2011) examine interest expense reported in firms’
financial statements which reflects interest on both private (e.g., bank loans) and public debt
as well as other contracts such as leasing contracts and commercial paper. Thus for much of
this debt, the lenders are likely to be banks and finance companies that have incentives to
closely monitor the borrower. Additionally, there is a likely timing mismatch between the
actual cost of debt paid by the firm and the interest expense reported in the current period.
The interest expense is affected by changes in both benchmark rates (e.g. LIBOR rates) and
borrower’s credit quality since debt was issued. It is thus difficult to make inferences about
the extent to which debtholders price corporate tax avoidance in the credit risk premium at
the time of issuance.15 Finally, the use of interest expense does not allow controlling for other
debt security specific characteristics that lenders trade off at the time of issuance. We use the
bond yields on the date of issuance of the public debt and a slew of bond specific
characteristics which are known to affect bond yields to overcome these problems.16
Two papers examine the relation between book-tax differences (BTDs, both
temporary and total) and corporate bond ratings. Crabtree and Maher (2009) find that firms in
the extreme quintiles of BTDs (defined on an industry-year basis) are rated as riskier by 14 Lisowsky et al. (2011) use confidential reportable transaction tax shelter data from the IRS Office of Shelter Analysis, firms’ unrecognized tax benefits as disclosed in their financial statements, the 5-year cash effective tax rate (from Dyreng et al., 2008) and the discretionary portion of annual permanent book-tax differences (from Frank et al., 2009) to develop proxies for corporate tax aggressiveness. Because we do not have access to confidential tax return data and unrecognized tax benefits are only available since 2007, we limit ourselves to measures that can be constructed from publicly available sources such as cash and GAAP effective tax rates. Both measures capture general tax avoidance including aggressive tax positions. 15 A large portion of the debt, especially bank loans, is priced as floating rate thus the interest expense reflects current market conditions (e.g., current LIBOR rates above which loan spreads are typically set). However, these debt spreads are based on the firm’s characteristics, including tax avoidance behavior, at the borrowing date, not at the current financial statement date. 16 If these other bond-specific characteristics are in part determined by the firm’s tax avoidance activities, our results will understate the effect of corporate tax avoidance on bond yields. However, observing a significant association between corporate tax avoidance and bond yields will indicate the incremental (and direct) role of corporate tax avoidance on bond yields.

16
rating agencies. In particular, they find that firms classified as tax planners (those in the
lowest quintile ranked on 5-year ETR) have lower ratings and argue that these firms are
viewed negatively by rating agencies due to concerns about transparency and earnings
persistence. Ayers et al. (2010) also examine the same general research question by looking
at changes in corporate bond ratings as a function of changes in book-tax differences. Their
results are consistent with Crabtree and Maher (2009). We add to these papers by
investigating the impact of corporate tax avoidance on the actual cost of debt. Most
importantly, we examine the mechanisms (uncertainty of future cash flows versus
information quality) through which corporate tax avoidance activities affect bond yields. We
also investigate how insurance companies, the most important investors in the bond market
that are long term investors by typically following buy and hold investment strategies, invest
as a function of corporate tax avoidance.
3. Sample selection and variable definitions
In this section, we first present our bond sample selection process and provide
background information on the data sources to build our sample. We then describe our main
variables of interest: the cost of public debt (bond) financing, and the tax avoidance
measures. Finally, we discuss the research design and the set of bond attributes and firm-
specific characteristics used as controls in the multivariate tests.
3.1 Sample selection
We start our sample selection process with the universe of bonds in the Mergent Fixed
Income Securities Database (FISD) issued between 1990 and 2007. FISD provides bond-
specific information such as bond size, issue date, rating, coupon rate and frequency, and
other features as well as borrower-specific information. We eliminate bond issues that have
missing ratings and bond-specific information, pay variable coupon payments (a minority in
the database), are convertible into common stock, are not issued by firms incorporated in the

17
United States, or are privately placed under Rule 144A.17
We apply several additional filters to this initial dataset to obtain our final bond sample.
First, we select all bonds for which the U.S. borrower could be manually matched to
Compustat based on company name and industry membership. Second, we exclude financial
companies (i.e., those whose SIC code is between 6000 and 6999). These companies tend to
issue a large number of bonds to finance their operations or off-balance sheet trusts they
sponsor, and are highly regulated. Finally, we require bond issuers to have available data in
Compustat for relevant firm-specific variables and the tax avoidance measures. Our final
sample contains 6,905 individual bonds issued that cover 2,612 firm-years (962 firms)
between 1990 and 2007.
Table 1 provides an overview of the composition of our bond sample by year and
industry. Panel A presents the total number of bond and firm-year observations, and Panel B
presents similar statistics by Fama–French industries. We note some clustering in our bond
sample over time and across industries. In particular, most public bonds in our sample were
issued during the mid-1990s, with a decline in issues starting in year 1999. Finally, most
bonds were issued by firms in the utilities (24%), transportation (10%), petroleum and natural
gas (6%), business services (6%) and retail (6%) industries.
3.2. Measures of tax avoidance
We use three measures of tax avoidance. Our first measure is the effective tax rate
computed as the ratio of total tax expense over the last five years scaled by total pre-tax
income net of total special items over the same period prior to the bond issuance date
(ETR5).18 This measure reflects aggressive tax planning through permanent book-
tax differences. Examples of such tax planning are investments in tax havens with lower
17 Rule 144A does not require bonds to be registered with the SEC. Thus, borrowers under Rule 144A might not provide U.S. GAAP financial statements. Further, these bonds are less liquid than public bond issues because they can be purchased by only a limited set of qualified financial institutions. 18 Dyreng et al. (2008) argue that single-year ETR suffers from significant year-to-year variation and is a poor proxy of long-run tax avoidance.

18
foreign tax rates (provided that foreign source earnings are classified as permanently
reinvested), investments in tax exempt or tax-favored assets, and participation in tax shelters
that give rise to losses for tax purposes but not for book purposes (e.g., Wilson, 2009).
Our second measure is the cash effective tax rate computed as the ratio of total taxes
paid in cash scaled by total pre-tax income net of total special items over the last five years
prior to the bond issuance date (CETR5). This measure reflects both permanent and
temporary book-tax differences. By focusing on cash taxes paid, this measure avoids the
overstatement of current tax expense due to the accounting for the income tax benefits of
employee stock options during our pre-SFAS 123R sample period (see Hanlon and Shevlin,
2003). For both tax measures, we remove observations with negative total pre-tax income net
of total special items over the last five years and truncate the measures to the range [0, 1].
We also calculate a composite tax avoidance measure to reduce the potential effects of
noise and errors in ETR5 and CETR5. We first rank both measures into deciles in every year.
We then compute an average rank across the two measures and standardize the averages to be
between zero (high tax avoidance) and one (low tax avoidance). We label this composite tax
avoidance measure as CTA.
Panel A of Table 2 reports descriptive statistics for the tax avoidance measures. The
mean long-run effective tax rate is 32% while the mean cash effective tax rate over the last
five years preceding the bond issuance is 25%. This evidence suggests that firms pay 7%
lower taxes than their effective tax rates imply. In unreported analyses, we find that the two
effective tax rate measures are positively correlated with a Pearson correlation of 45%. The
relatively low magnitude of the correlation coefficient indicates that these measures capture
different aspects of tax avoidance and/or may be affected by measurement errors.
3.3 Research Design
We estimate the following OLS regression model, which relates offering bond yields to

19
our proxies for tax avoidance as well as bond- and firm-specific control variables:
,
∝ ∝ , ∝ ,
∝ , ∝
∝ ,
(1)
Offering bond yield is the yield to maturity of bonds computed at the time of issuance. We
include U.S. Treasury bill rates (Tbill Rate) to control for shifts in benchmark interest rates
and the time preference for money. We choose the contemporaneous yield of a U.S. Treasury
bill that has the same maturity and is the closest (in absolute value) with respect to the stated
coupon rate. In Table 2, we report descriptive statistics on the bond’s offering yield, and its
corresponding matched Treasury bill rate. The average offering yield for sample bonds is
7.03%, whereas the average matched Treasury bill rate yield is 5.73%.
Tax avoidance is a proxy for a firm's tax avoidance prior to the bond issuance (defined
above).
We control for a number of bond-specific characteristics in our empirical models. Rating
measures the credit quality of the bond issue as assessed by one of the three main certified
rating agencies (i.e., Standard and Poors, Fitch or Moody’s). Prior research has shown that
credit ratings provide information on the bonds’ default risk additional to what is available in
the public information set (e.g., Ederington, Yawitz, and Roberts, 1987; Ziebart and Reiter,
1992). We convert the letter ratings retrieved from FISD into numbers, so that a “AAA”
rating is coded as 1, a “AA+” rating is coded as 2, and so on. Hence we expect a positive
association between Rating and the bond offering yield.19 Life of the Bond is the maturity of
the bond in years. Bonds with longer maturities are usually exposed to greater interest
19 As discussed earlier, Crabtree and Maher (2009) and Ayers et al. (2010) show that credit ratings are a function of book-tax differences. Thus, by including credit ratings, we are documenting that the association between bond issuance yields and tax avoidance is incremental to the effect of tax avoidance effects on bold yields via credit ratings.

20
fluctuations and credit risks, and therefore are expected to be priced at higher yields (e.g.,
Ziebart and Reiter, 1992). Amount of issue is the total dollar face value of the bond issue.
Larger issues are usually more liquid and marketable, thus these issues might receive lower
yields (e.g., Sengupta, 1998). On the other hand, a larger issue implies a higher debt burden
for the borrower, and therefore a higher probability of default (e.g., Shi, 2003). Hence the
impact of issue size on the bond offering yield is ambiguous. Subordinated is an indicator
variable that takes the value 1 if the bond is subordinated to other debt securities, and 0
otherwise. Subordinated bonds are junior debt, and relatively riskier (Ziebart and Reiter,
1992). We therefore expect a positive association between Subordinated and bond offering
yields. Callable is an indicator variable that takes the value 1 if the bond is callable, and 0
otherwise. Callable bonds have prepayment risk, thus bondholders are likely to demand
higher yields for bonds with a call provision (Datta, Datta, and Patel, 1999). Putable is an
indicator variable that takes the value 1 if the bond is putable, and 0 otherwise. Putable bonds
minimize the downside risk to bondholders by allowing them to sell the issue back to the
company at a predetermined price. We therefore expect a negative association between bond
yields and Putable. Sinkingfund is an indicator variable that takes the value 1 if a sinking
fund exists, and 0 otherwise. Dyl and Joehnk (1979) and Boardman and McEnally (1981)
have shown that yields on bonds with sinking fund provisions are significantly lower.
However, the establishment of complex sinking fund agreements has been shown to be an
indicator of issuers’ high level of riskiness (Smith and Warner, 1979; Ziebart and Reiter,
1992).
Table 2 provides descriptive statistics for the bond-specific characteristics. The average
rating of the bonds in our sample is 8.2, which is equivalent to a Standard and Poor’s “BBB”
rating. Sample bonds have, on average, a time until maturity of about 12 years, and a face
value of US$192 million. About 4% of the sample bonds are subordinated, 53% of bonds are

21
callable, 2% are putable, and 3% have a sinking fund provision in place. These averages are
similar to the characteristics of the average bond in Mergent suggesting that our filters pick a
relatively representative sample of bonds.
We further control for several firm-specific characteristics that are measured in the fiscal
year immediately prior to a given bond’s issuance. We use Market to book, as measured by
the firm’s market-to-book ratio at the end of the fiscal year prior to the bond issuance, to
capture firm growth opportunities. If high-growth firms pursue high risk activities (e.g.,
Bhojraj and Sengupta, 2003), the firm’s market-to-book ratio should be positively associated
with its cost of debt. On the other hand, Fama and French (1995) argue that high market-to-
book ratios can signal sustained earnings performance, thus the association with the bond
spreads could be negative. Return on asset is pretax income before extraordinary items,
scaled by total assets at the end of the fiscal year prior to the bond issuance; it is included in
our models to control for profitability, and is expected to be negatively associated with the
cost of debt financing, since profitable firms are less likely to default. Leverage is the sum of
the firm’s debt in current liabilities and long-term liabilities, scaled by total assets at the end
of the fiscal year prior to bond issuance. The higher the leverage ratio is, the heavier the
firm’s financial burden is suggesting that firm leverage is positively related to the firm’s cost
of debt. Log(Assets) is the natural logarithm of firm’s total assets at the end of the fiscal year
prior to the bond issuance. Larger firms should obtain more favorable debt terms, given their
stable cash flows and larger tangible asset base. We therefore expect a negative association
between Log(Assets) and the cost of debt financing. Finally, we include the coefficient of
variation of the firm’s net operating cash flows (scaled by total assets) calculated over the
five years prior to the bond issuance, CV(Cash Flows). Since high cash flow volatility is
associated with a higher risk of default (e.g., Minton and Schrand, 1999), we expect a
positive association between CV(Cash Flows) and the cost of debt financing.

22
Finally, we also control for firm characteristics that prior literature suggests are
correlated with our tax avoidance measures to make sure that our results are incremental to
these factors that might drive fundamental differences in our sample firms (e.g., Mills, 1998;
Manzon and Plesko, 2002; Rego, 2003; Dyreng et al., 2008, Frank et al., 2009). Loss carry
forward is an indicator variable taking the value of 1 if loss carry forward is positive and 0
otherwise while Change in loss carry forward is change in the loss carry forward scaled by
lagged assets. Loss carry forwards could be used to reduce future tax payments and can be
positively viewed by debtholders. Foreign income is foreign income scaled by lagged assets.
We expect firms with sizable foreign operations to be more geographically diversified and
pay lower bond offering yields (Franco et al., 2012). PPE is property, plant, and equipment
scaled by lagged assets. PPE could be used as collateral in borrowing agreements reducing
yields, and hence we expect a negative coefficient on PPE. Intangible assets is intangible
assets scaled by lagged assets. Similarly, intangible assets could also be used as collateral in
borrowing agreements (e.g., Loumioti, 2012) resulting in a negative relationship with bond
offering yields. Equity income is income in earnings from investments accounted for under
the equity method scaled by lagged assets. Firms with high equity income are more likely to
be diversified and thus likely pay lower yields at the time of bond issuance.
Information quality is our composite measure of information quality. Prior research
(Frank et al., 2009; Balakrishnan et al., 2012) documents that tax planning results in less
transparent financial reporting and information environments. We construct a composite
measure of Information quality using the following seven financial reporting / information
quality proxies: 20 a) the ratio of annual research and development expense (coded as 0 if
missing) to sales averaged over the last five years. R&D expense is used by prior research to
proxy for the presence of intangible assets, which are associated with higher information 20 We obtain qualitatively similar results when we control for information quality proxies individually in separate regressions. Also, our results are similar if we control for different combinations of information quality proxies rather than combining all seven of them.

23
asymmetry (Barth and Kasznik, 1999; Barth, Kasznik, and McNichols, 2001). b) the accrual
quality measure calculated as the standard deviation of residuals over the last five years from
an industry-year level Dechow and Dichev (2002) model augmented with fundamental
variables from the Jones model (McNichols, 2002). c) the performance adjusted discretionary
accruals calculated from the Jones Model averaged over the last five years (Kothari et al.,
2005). d) the absolute analyst forecast error calculated as the absolute value of the difference
between actual reported earnings and the latest IBES median consensus analyst forecast
(reported immediately before the earnings announcement) scaled by the absolute value of the
latest IBES median consensus analyst forecast. To be consistent with other information
quality proxies we average AFE over the last five years. e) the analyst forecast dispersion
calculated as standard deviation of the forecasts included in the latest IBES consensus
forecast scaled by the absolute value of the latest IBES median consensus forecast and
averaged over the last five years. f) the number of forecasts included in the latest IBES
consensus analyst forecast and averaged over the last five years. We multiply this measure
with -1 so that it captures a less transparent information environment. g) the average monthly
bid – ask spread scaled by the average of the absolute value of bid and ask prices and
calculated over the last 60 months (five years). We rank each of the seven information quality
proxies into deciles annually and standardize these deciles to be between 0 (high information
quality) and 1 (low information quality). Information quality is the average of these seven
standardized ranks. We expect Information quality to result in higher borrowing costs.21
Including the information quality measure reduces the ability of tax avoidance to influence
bond yields through the information opacity channel.
All models include year fixed-effects to capture structural changes in the bond market’s
21 Our sample consists of bonds issued by large firms (average firm size is about $11.5 billion). On the other hand, previous research examining the impact of tax avoidance on bank loans (Kim et al., 2010) and interest expense (Lisowsky et al., 2011) deal with smaller firms. Average firm size in Kim et al. (Lisowsky et al., 2011) is $915 million ($111 million). Therefore, compared to these studies, we expect that the impact of Information quality in our tests to be less pronounced.

24
liquidity as well as general debt market conditions over time. We also include industry fixed
effects (defined per Fama and French 48 industry definitions) to mitigate industry related
time-invariant factors which might drive our results.
The bottom part of Table 2 presents descriptive statistics on the firm-specific
characteristics for our sample. The average bond issuer in our sample has a market-to-book
ratio of 3.18, a return on assets of 10.3%, and leverage of about 41%.
4. Empirical findings
4.1. Main results
In Table 3, we present our empirical analyses of the net effects of tax avoidance on the
cost of public debt financing. The table reports coefficient estimates from OLS regression
models together with t-statistics (in parentheses). To control for autocorrelation in the errors,
we compute standard errors clustered at the firm level. The explanatory power of our model
(adjusted R2) is relatively high at 78% suggesting that the variables included are important
drivers of the bond offering yields. We find a significant and negative association between
our proxies of effective tax rates and the bond offering yields, with a coefficient varying from
−0.435 (t-statistic = −2.67) to −0.247 (t-statistic = −2.99). In terms of economic significance,
going from the 90th percentile to the 10th percentile of CTA's distribution increases the bond
offering yields by 15 basis points. Although the economic magnitude this effect seems small,
we investigate the impact of factors that are potentially associated with a larger economic
impact in additional analyses. Overall, these results are consistent with the hypothesis that
corporate bondholders view corporate tax avoidance activities negatively and, as a result,
they increase the offering bond yields.
Results on our control variables are consistent with our expectations. We find that the
coefficient on the sinking fund provision indicator is negative suggesting that the
establishment of a sinking fund lowers the lenders' risk. We also document that the

25
coefficient on market-to-book ratio is negative supporting Fama and French (1995)’s
argument that high market-to-book ratios can signal sustained earnings performance. Lastly,
we find that, consistent with prior findings (e.g., Francis et al., 2005; Bharath et al., 2008),
the coefficient on the composite information quality proxy is positive and significant.
4.2. Robustness tests
In this section, we investigate the robustness of our main results to the endogeneity of
tax avoidance activities and to an alternative dependent variable that captures the probability
of default. We also run an event study methodology which allows us to make causal
inferences.
4.2.1. Endogeneity
One might argue that corporate tax avoidance is endogenous because of a correlated
omitted variable which influences both tax avoidance and the cost of debt. Thus, as a
robustness test, we use tax avoidance proxies that are measured in the first year when this
computation is possible. For example we calculate CTA in year 1987 for a particular firm and
use it for all bonds issued in any year after 1987 by the same firm. Thus there is no time
variation in tax avoidance proxies within the same firm. Dittmar and Mahrt-Smith (2007)
adopt a similar approach when testing the impact of corporate governance on firm value and
argue that it is appropriate when the potentially endogenous variable of interest changes over
time very slowly. Over our sample period, the autocorrelation in the tax avoidance measures
is between 82% and 88% suggesting that indeed the tax avoidance measures are quite sticky.
The results reported in Panel A of Table 4 show that our main result is robust to endogeneity:
when we use tax avoidance proxies calculated many years before the bond issuance, we
continue to find that tax avoidance results in higher bond offering yields.
4.2.2. The impact of tax avoidance on expected default frequency

26
As an alternative to bond offering yields, we use monthly expected default
frequencies (EDFs) provided by Moody’s/KMV.22 Moody’s has preferential access to private
information about borrowers when issuing ratings and uses sophisticated information
processing methodologies, relative to the marginal bond investor. Therefore, the EDFs are
less likely to reflect issues with the information quality of firm’s public reports. We estimate
the following model to check robustness of our main results:
, ∝ ∝ , ∝ ,
∝ ∝ , (2)
where EDF is the expected default frequency calculated on the month earnings are
announced. Our results are reported in Panel B of Table 4. Consistent with Table 3, we find
that the coefficients on all tax avoidance proxies are negative and significant; more tax
avoidance is associated with a greater expected probability of default. An increase in tax
avoidance as measured by CTA measure from the 90th percentile to the 10th percentile of its
sample distribution increases EDF by 0.11%. This number is economically large given that
average EDF in our sample is 0.58%. The strong association suggests that Moody's is likely
to be concerned about the long term implications of corporate tax avoidance activities on the
uncertainty of future cash flows. This concern is reflected through assigning a higher
estimated expected default frequency.
4.2.3. CDS spread changes around tax shelter announcements
In this sub-section, we test the effect of tax avoidance on the cost of public debt by
looking at Credit Default Swap (CDS) market reactions to announcements of tax shelters (see
22 Moody’s estimates the asset values and volatilities using information from stock prices and financial statements. This measure of the distance to default is empirically mapped to a large set of corporate default data (e.g., Crosbie and Bohn, 2003). The main advantage of using EDFs, as opposed to bond spreads, is that they are not affected by illiquidity and we do not have to control for bond contractual features (e.g., covenants, seniority, etc).

27
Hanlon and Slemrod, 2009).23 We use CDS data from Markit because these default spreads
are theoretically linked to bond spreads and form the basis of pricing bonds in the secondary
market. Moreover, CDS data is available daily allowing us to perform an event study. CDS
spreads are less affected by liquidity problems, changes in interest rates, tax issues and
contract design features that are specific to bond securities. Most importantly, prior research
suggests that CDS spreads incorporate information faster than equity markets because dealers
in this market enjoy lower information asymmetry due their access to private information
(Acharya and Johnson, 2007; Norden and Weber, 2004). Thus we expect changes in CDS
spreads to reflect updates in the expectations about future cash flows as opposed to changes
in the information quality triggered by corporate tax avoidance activities.
We compute ∆Raw CDS Spread as the percentage change in 5-year CDS spread
around the tax shelter announcement date over a five-day window ([−2, 2]). We then compute
∆Abnormal CDS Spread which is the difference between raw and market CDS spread
changes (the change in spreads of the same credit rating group during the same five-day
window). The sample of Hanlon and Slemrod (2009) has 112 tax shelter announcements
between 1990 and 2004. However, because the Markit CDS database coverage starts in year
2001, we end up with only 20 announcements between 2002 and 2004. Although this sample
size is small, the event study provides clean evidence on how creditors view announcements
of serious tax avoidance activities.
We present results of this event study analysis in Panel C of Table 4. We find that the
average (median) market-adjusted CDS spreads increase by 3.84% (2.19%) around tax
shelter announcements. These changes are economically significant given that average
(median) 5-year CDS spread in our sample is 1.94% (0.74%). The positive and statistically
significant changes in market-adjusted CDS spreads suggest that debtholders respond 23 CDSs are in essence insurance contracts that provide buyer protection against losses arising from borrower-defaults. In a typical CDS contract the buyer pays to the seller a periodic fee (i.e., the CDS spread) to insure against default of any debt security issued by a third party, called the reference entity.

28
negatively to tax shelter announcements. Moreover, the evidence highlights that tax
avoidance activities cause greater credit spreads and the reaction is triggered by updated
expectations about lower and more uncertain future cash flows.
4.3. The impact of tax avoidance on future cash flow level and volatility
We further examine the potential reason for why tax avoidance increases cost of public
debt. As we have discussed earlier, corporate tax avoidance activities could make future cash
flows more uncertain due to tax risk or by facilitating managerial rent extraction. We test
directly the impact of corporate tax avoidance on future cash flows by estimating the
following regression:
, ,
∝ ∝ , ∝ ,
∝ ∝ ,
(3)
The dependent variable in equation (3) is either Cash flow level, defined as the average
of cash flow from operations scaled by total assets over the next five years, or Cash flow
volatility, defined as the coefficient of variation of cash flow from operations scaled by total
assets over the next five years.
We report the results of estimating equation (3) in Table 5. The dependent variable in
columns 1-3 is Cash flow level. Consistent with the conjecture that tax avoidance increases
uncertainty in future cash flow levels, we find that tax avoidance is negatively and
significantly related to the level of future cash flows from operations. An increase in tax
avoidance, as measured by CTA measure, from the 90th percentile to the 10th percentile of its
sample distribution decreases future cash flow levels by 0.7%; an economically large effect
given that the average cash flow level in our sample is 11.1%. The dependent variable in
columns 4-6 is Cash flow volatility. We find significant and positive coefficients on our tax
avoidance proxies suggesting that tax avoidance increases also the future cash flow volatility.

29
Moreover, an increase in tax avoidance as measured by CTA from the 90th percentile to the
10th percentile of its sample distribution increases Cash flow volatility by 0.218. This number
is economically significant given that the average Cash flow volatility in our sample is 1.019.
The ability of the tax avoidance measures to predict future lower cash flow levels and higher
volatility indicates that corporate tax avoidance activities are associated with significant tax
risks and managerial rent extraction that are detrimental to bondholders' wealth. These results
suggest that bond investors see tax avoidance behaviour as an early indicator of problems in
the future cash flow level and volatility, two variables that are first order determinants of a
firm's cost of debt financing.
4.4. Path Analysis
In the prior section we document that corporate tax avoidance activities potentially
increase the uncertainty about the magnitude and volatility of the firms' future cash flows.
This analysis suggests a relationship between tax avoidance and cost of public debt through
future cash flows levels and volatility channels but it is silent on the importance of these
channels. In particular, we cannot conclude whether the relationship between tax avoidance
and the cost of bond debt is completely explained by the impact on future cash flow levels
and volatility given that tax avoidance could also affect bond yields through its impact on
future information quality. We perform a path analysis in this section to shed more light on
this issue. 24
Path analysis is a structural equation model used to decompose the correlation between
two variables into a direct path and an indirect path through a mediating variable. In our
paper, the path analysis decomposes the relationship between tax avoidance and the cost of
public debt into a direct path between these two variables and an indirect path through the
24 A path analysis is used to answer how a variable (corporate tax avoidance in our case) affects another variable (i.e., bond yields). The impact is through a third mediating variable. In contrast, an interaction analysis is used to answer when a variable impacts another variable. This is usually the case when a third variable, the moderating variable, is high or low. Baron and Kenny (1986) provide a discussion on mediation versus moderation.

30
cash flows level or volatility. We employ a recursive (all paths flow in only one direction)
path model with observable variables. A direct path includes only one path coefficient while
an indirect path includes a path coefficient between the source variable and the mediating
variable (in our paper, it is the path between tax avoidance and the cash flows level or
volatility) and a path between the mediating variable and the outcome variable (in our paper,
it is the path between the cash flows level or volatility and the cost of public debt). The total
magnitude of the indirect path is the product of these two path coefficients. The analysis
automatically standardizes all variables in the model with a mean of zero and a standard
deviation of one allowing a comparison between direct and indirect path coefficients. We
estimate the following model:
,
∝ ∝ ,
∝ , ,
∝ , ∝ ,
∝ ∝ ,
(4)
, ,
, , (5)
In this model, the path coefficient ∝ is the magnitude of the direct path from tax
avoidance to the cost of public debt. On the other hand, the path coefficient ∝ * is the
magnitude of the indirect path from tax avoidance to the cost of debt mediated through the
cash flow level or volatility. We report the path coefficients of interest in Table 6.25 Panel A
(Panel B) of Table 6 reports path coefficients when we use the cash flow level (cash flow
volatility) as the mediating factor. Panel A shows that the direct path between tax avoidance 25 All models have a Bentler’s comparative fit index (CFI) greater than 0.9 suggesting that they have a good fit.

31
and cost of debt is negative and statistically significant for all three measures of tax
avoidance. A path coefficient of -0.039 on CTA indicates that a one standard deviation
decrease in CTA increases the bond offering yield by 0.039 times the standard deviation of
the bond offering yield. The path coefficient between tax avoidance and the cash flow level is
positive and significant suggesting that higher tax avoidance results in a lower future cash
flow level (consistent with Table 5). Moreover the path coefficient between the cash flow
level and the offering yield is negative and significant. The total mediated path (product of
the path coefficient between tax avoidance and cash flow level and the path coefficient
between cash flow level and offering yield) is negative for all three proxies of tax avoidance.
In terms of economic magnitude, a one standard deviation decrease in CTA increases bond
offering yields by 0.019 times the standard deviation of bond offering yields through CTA’s
impact on the future cash flows level. This economic magnitude is about half of the direct
impact of CTA on the bond offering yields and about a third of the total impact of CTA on the
bond offering yields (the total effect is the sum of the direct and the indirect effect).26
We also examine the role of future cash flow volatility as a mediating factor on the
relationship between tax avoidance and bond offering yields in Panel B of Table 6.
Consistent with Panel A, the direct path between tax avoidance and bond offering yields is
negative and significant for all three proxies of tax avoidance. When we look at components
of the indirect path, the path between tax avoidance proxies and cash flow volatility is
negative and statistically significant (except for ETR5) while the path between cash flow
volatility and the bond offering yield is positive and significant. However the total magnitude
of the mediated path when we use cash flow volatility as a mediating factor is quite small.
For example, the magnitude of the total mediated path coefficient is -0.005 when we use CTA
as our tax avoidance measure. This result suggests that a one standard deviation decrease in
26 The total effect is not comparable with the effect we show in Table 3 because the variables used in the path analysis are standardized.
32
CTA increases bond offering yields only 0.005 times the standard deviation of bond offering
yield.27 In unreported analyses, we also employed information quality separately as a
mediating factor. We find that the maximum magnitude of mediated path for Information
Quality is 0.005 suggesting that it is not a very important mediating factor.
Overall, the path analysis results indicate that there is a statistically significant direct
path between tax avoidance and bond offering yields regardless of the mediating factor we
employ. We also find that future cash flow uncertainty is a more economically important
mediating factor than the information quality in explaining the relationship between tax
avoidance and bond offering yields.
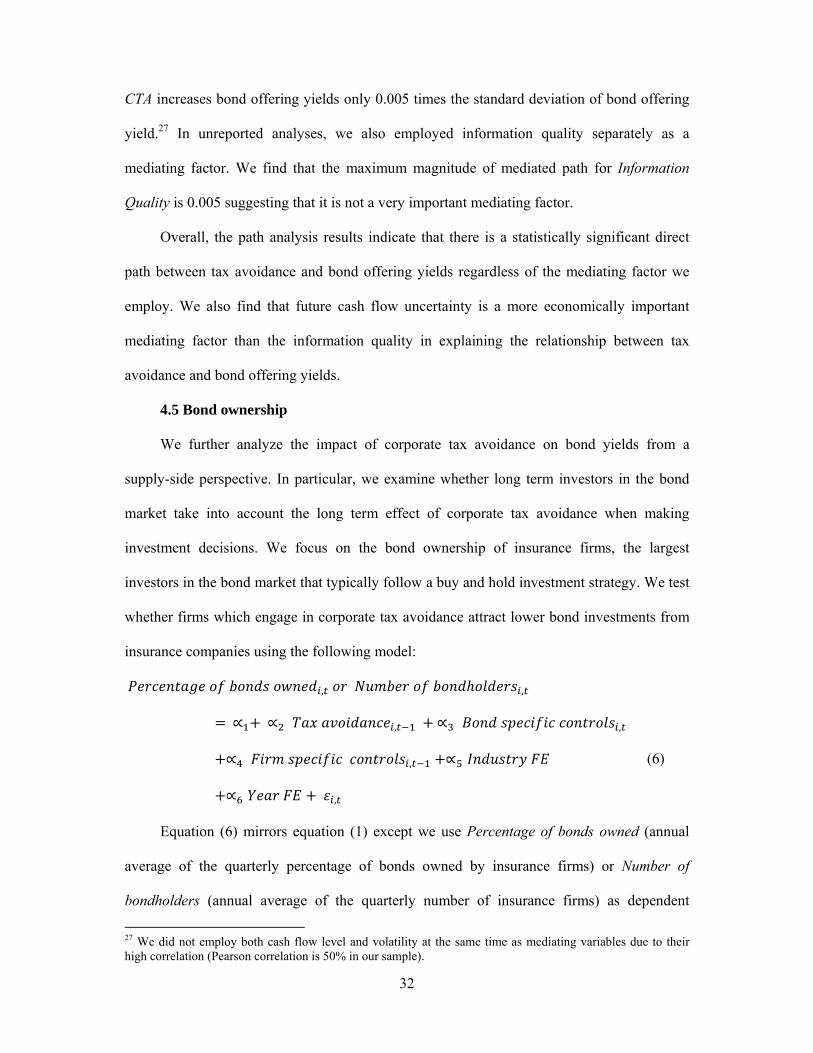
4.5 Bond ownership
We further analyze the impact of corporate tax avoidance on bond yields from a
supply-side perspective. In particular, we examine whether long term investors in the bond
market take into account the long term effect of corporate tax avoidance when making
investment decisions. We focus on the bond ownership of insurance firms, the largest
investors in the bond market that typically follow a buy and hold investment strategy. We test
whether firms which engage in corporate tax avoidance attract lower bond investments from
insurance companies using the following model:
, ,
∝ ∝ , ∝ ,
∝ , ∝
∝ ,
(6)
Equation (6) mirrors equation (1) except we use Percentage of bonds owned (annual
average of the quarterly percentage of bonds owned by insurance firms) or Number of
bondholders (annual average of the quarterly number of insurance firms) as dependent
27 We did not employ both cash flow level and volatility at the same time as mediating variables due to their high correlation (Pearson correlation is 50% in our sample).

33
variables. We obtain bonds holdings information from the National Association of Insurance
Commissioners (NAIC) starting with year 2001 and match this data with bond specific data
in the Mergent Fixed Income Securities Database (FISD). This dataset allows us to compute
the percentage of ownership and number of bondholders by insurance firms in a particular
bond throughout its life. In our sample, this group of investors holds, on average, 20% of the
par value. The remaining variables in equation (6) are defined in Section 3.3.
We report the results of estimating equation (6) in Table 7. We find that bond
ownership of insurance firms is negatively associated with corporate tax avoidance
suggesting that they are less likely to invest in bonds of firms which avoid paying taxes. The
coefficient estimates indicate that going from the 90th percentile to the 10th percentile of the
CTA distribution decreases the average bond ownership by insurance firms by 4%. This effect
is economically meaningful given that the average bond ownership in our sample is 20%. We
also document a significant reduction in the number of insurance firm bondholders as tax
avoidance increases. In terms of economic significance, going from the 90th percentile to the
10th percentile of CTA distribution decreases the number of bondholders by 1.3. This effect is
large given that the average number of insurance firm bondholders in our sample is 10.
This evidence indicates that long term investors such as insurance firms are reluctant to
own bond of firms with high tax avoidance, potentially due the long term impact on future
cash flows of tax activities. Thus insurance companies view tax avoidance activities as an
early signal of decreases in future credit performance that can trigger an expensive portfolio
rebalancing due to capital regulation requirements.
4.6. Cross-sectional analyses
In the previous set of analyses, we have shown that corporate tax avoidance activities
are negatively associated with bond offering yields mainly due to the negative consequences
of these activities on future cash flows. In this section, we investigate directly whether the

34
negative association is a function of ex ante proxies for rent extraction and tax risk.
Specifically, we partition our sample based on several variables that capture incentives for
debtholder wealth expropriation (poor corporate governance, more concentrated equity
ownership, high risk-taking incentives for management and high credit risk) and tax risk (the
probability of an IRS audit).
4.6.1. Corporate takeover market
We use Gompers, Ishii and Metrick’s (2003) G-Index as our proxy for poor corporate
governance since it provides an indication of the extent to which the management of the
company is protected from the corporate takeover market. We split the sample into two
groups according to the median G-Index every year. Observations which have higher (lower)
than median G-Index scores are characterized by lower (greater) management monitoring by
the takeover market. We estimate the empirical specification in Equation (1) separately for
high and low G-Index sub-samples.28 Panel A of Table 8 reports regression results for the
high and low governance quality sub-samples. We find no evidence of an association
between our proxies of tax avoidance and bond offering yields in the high monitoring (high
governance) group. However, we note that our results in Table 3 are generally driven by the
low monitoring group. The coefficient estimates indicate that going from the 90th percentile
to the 10th percentile of the CTA distribution increases the bond offering yields by 37 basis
points. We conclude that tax avoidance negatively impacts the cost of public debt for firms
characterized by poor management monitoring; these firms are more likely to expropriate
wealth from bondholders and report lower future cash flows.
4.6.2. Ownership concentration
We investigate the impact of ownership concentration on our results by splitting the
28 We follow this empirical strategy instead of interacting tax avoidance proxies with the indicator for greater management monitoring captured by a low G-Index to ensure that all control variables vary with this indicator. We could interact all control variables with the G-Index dummy but this is likely to result in multicollinearity.

35
sample into two groups based on the ownership of the largest institutional shareholder.29
Observations with a higher (lower) than the median ownership of the largest shareholder are
classified as having high (low) ownership concentration. The mean investment of the largest
shareholder in our sample for the high (low) ownership concentration group is 11.1% (4.7%).
We expect that corporate bond yields are increasing (decreasing) in tax avoidance of firms
with large institutional shareholders due to the opportunistic behavior of the blockholders.
Table 8, Panel B documents that our results in Table 3 are generally driven by firms
with high ownership concentration. In the case of the high ownership concentration sample,
the coefficient estimates indicate that going from the 90th percentile to the 10th percentile of
the CTA distribution increases the bond offering yields by 27 basis points. Therefore,
bondholders react to corporate tax avoidance activities negatively only when the firm has
concentrated ownership presumably because they think that money saved through tax
avoidance activities will be expropriated by the shareholders with large ownership. This
result is consistent with Lisowksy et al. (2011) who find that negative relation between
interest costs and tax aggressiveness is somewhat attenuated when the firm has large
ownership concentration; they attribute this result to these firms facing larger agency costs.
4.6.3. Equity risk incentives
We also examine the relationship between tax avoidance and cost of bond debt as a
function of managerial equity risk incentives. As we discussed in Section 2.1, equity risk
incentives motivate managers to make risky investing and financing decisions to increase the
stock return volatility and hence the value of their stock option portfolios. However payoffs to
bondholders are asymmetric (i.e., the upside potential is limited whereas the downside risk is
nontrivial) suggesting that bondholders will view risky investment and financing activities
negatively. Accordingly, we expect our results to be more pronounced for firms with high
29 We obtain institutional investment data from Thomson Reuters 13f files.

36
managerial equity incentives. Our proxy for managerial equity incentives is CEO vega
measured as sensitivity of CEOs stock option portfolio to a given change in stock return
volatility (Guay, 1999). We obtain CEO vega data for the period 1993 - 2007. We partition
the sample into firms with low versus high equity risk incentives at the median of CEO vega
in every year; those above the median are referred to as high equity risk incentives. The mean
CEO vega in our sample for the high (low) equity risk incentives group is $401k ($44k).
Our results are reported in Panel C of Table 8. We find that tax avoidance negatively
impacts the cost of bond debt in both low and high equity risk incentives groups. However,
the results are significantly more pronounced in the high equity risk incentives group. In
firms with high equity risk incentives, the coefficient estimates indicate that going from the
90th percentile to the 10th percentile of the CTA distribution increases the bond offering
yields by 33 basis points. These results suggest that bondholders demand price-protection for
firms with high equity incentives that are more likely to expropriate their wealth.
4.6.4. Credit quality
In this section, we investigate how the credit quality of the firm, proxied by the
magnitude of its bond rating, impacts the relationship between tax avoidance and the cost of
public debt. Speculative grade bonds are more likely to go into default causing large losses
for bondholders; their equityholders have greater incentives to engage in asset substitution
and wealth expropriation to increase the value of their claims. Therefore, we expect our
results to be stronger for firms with speculative grade bonds. A bond is deemed to be
investment grade (speculative grade) bond if its rating is BBB+ or better (lower than BBB+).
Our results are reported in Panel D of Table 8. Consistent with our expectation, we find
that tax avoidance negatively impacts cost of bond debt in both investment and speculative
grade bond groups. However results are significantly stronger in the speculative grade bond
group. In bonds with speculative grade rating, the coefficient estimates indicate that going

37
from the 90th percentile to the 10th percentile of the CTA distribution increases the bond
offering yields by 39 basis points.
4.6.5. IRS audit probability
Finally, we investigate the relationship between tax avoidance and the cost of bond debt
as a function of the IRS face-to-face audit probability. Bondholders may perceive IRS as a
monitor that reduces agency costs or as increasing the tax risk due to penalties. We utilize
information from Syracuse University’s Transactional Records Access Clearinghouse
(TRAC) system to test the impact of the audit probability. This database provides the
percentage of audited tax returns as a function of firm size in the period 1992 - 2007. We
partition the sample into firms with low versus high ex ante audit probability at the median of
IRS audit probability - those above the median are referred to as high IRS audit probability.
The average audit probability in our sample for the high (low) IRS audit probability group is
50% (33%).
In Table 8, Panel E we find that corporate tax avoidance negatively impacts the cost of
bond yields only in the sub-sample of bonds with high IRS audit probability. In the case of
firms with high IRS audit probability, the coefficient estimates indicate that going from the
90th percentile to the 10th percentile of the CTA distribution increases the bond offering
yields by 20 basis points. This result supports the notion that bondholders perceive IRS as an
institution which increases tax risk presumably by penalizing firms which avoid paying taxes.
5. Conclusion
Public debt has significant prominence in the capital structure of the firm; issuances in
the debt market are significantly higher than in the equity market. Therefore, investigating the
determinants of the cost of public debt is critical in enhancing our understanding of the firm’s
capital structure and overall cost of capital.

38
We examine the association between corporate tax avoidance and the offering yields
of public bond issues using a comprehensive sample of bonds issued by U.S. borrowers. We
document that corporate tax avoidance is associated with higher bond offering yields. We
also find that our results are robust to endogeneity and an alternative dependent variable
(EDFs) which is less likely to suffer from bond illiquidity and bond investors’ tax position.
An additional event study analysis finds a positive and statistically significant change in the
market adjusted CDS spreads around tax shelter announcement events further suggesting that
credit markets view corporate tax avoidance activities negatively.
We also document that firms engaging in corporate tax avoidance activities
experience significantly lower future cash flow levels and greater future cash flow volatility.
We examine the channel(s) through which tax avoidance impacts bond offering yields with a
path analysis and find that corporate tax avoidance has both direct and indirect effects on
bond offering yields, with the main indirect effect arising through lower future cash flows. In
additional analyses, we find that insurance companies, which are large and long term
investors in the bond market, are less likely to invest in the bonds of firms with higher
corporate tax avoidance suggesting that these investors consider the long term negative
impact of tax avoidance in future cash flows in their investment decisions. In cross sectional
tests, we document that our results are more pronounced when conflicts of interest between
equityholders and debtholders are more severe and the probability of Internal Revenue
Service (IRS) audits is high.
Our research contributes to the emerging stream of literature that examines how debt
holders view corporate tax avoidance activities. We extend this literature by focusing on
providers of debt capital that only have access to publicly available information. More
importantly, our results suggest that the impact of tax avoidance on bond offering yields is
mediated by future cash flows issues as opposed to information quality. Our evidence of a

39
higher cost of debt for tax avoiding firms partially explains why more firms do not always
engage in tax shelters and corporate tax avoidance given the possibility of substantial tax
savings.

40
References Acharya, V., Johnson, T., 2007. Insider trading in credit derivatives. Journal of Financial Economics 84, 110–141. Ayers, B., Laplante, S., McGuire, S., 2010. Credit ratings and taxes: The effect of book/tax differences on ratings changes. Contemporary Accounting Research 27, 359–402. Balakrishnan, K., Blouin, J., Guay, W., 2012. Does tax aggressiveness reduce corporate transparency? Working paper, University of Pennsylvania. Baron, R., Kenny, D., 1986. The moderator-mediator distinction in social psychological research: Conceptual, strategic, and statistical considerations. Journal of Personality and Social Psychology, 51, 1173–1182. Barth, M., Kasznik, R., 1999. Share repurchases and intangible assets. Journal of Accounting and Economics 28, 211–241. Barth, M., Kasznik, R., McNichols, M., 2001. Analyst coverage and intangible assets. Journal of Accounting Research 39, 1–34. Bharat, S., Sunder, J., Sunder, S., 2008. Accounting quality and debt contracting. The Accounting Review 83, 1–28. Bhojraj, S., Sengupta, P., 2003. Effect of corporate governance on bond ratings and yields: The role of institutional investors and outside directors. Journal of Business 76, 455–475. Bhojraj, S., Swaminathan, B., 2009. How does corporate bond market value capital investments and accruals? Review of Accounting Studies 14, 31–62. Boardman, C.M., McEnally, R.W., 1981. Factors affecting seasoned corporate bond prices. Journal of Financial and Quantitative Analysis 16, 207–226. Coles, J., Daniel, N., Naveen, L., 2006. Managerial incentives and risk-taking. Journal of Financial Economics 79, 431–468. Crabtree, A., Maher, J., 2009. The influence of differences in taxable income and book income on the bond credit market. The Journal of the American Taxation Association 31, 75–99. Crosbie, P., Bohn, J., 2003. Modelling default risk. Moody’s KMV. Datta, S., Datta, M.I., Patel, A., 1999. Bank monitoring and the pricing of corporate public debt. Journal of Financial Economics 51, 435–449. Datta, S., Dhillon, U., 1993. Bond and stock market response to unexpected earnings announcement. Journal of Financial and Quantative Analysis 28, 565–577. Dechow, P., Dichev, I., 2002. The quality of accruals and earnings: the role of accrual estimation errors. The Accounting Review 77, 35–59.

41
DeFond, M., Zhang, J., 2011. The timeliness of the bond market reaction to bad news earnings surprises. Working paper, University of Southern California. Desai, M., Dharmapala, D., 2006. Corporate tax avoidance and high– powered incentives. Journal of Financial Economics 79, 145–179. Desai, M., Dyck, A., Zingales, L. 2007. Theft and taxes. Journal of Financial Economics 84, 591–623. Dhaliwal, D., Huang, S., Moser, W., Pereira, R., 2011. Corporate tax avoidance and the level and valuation of firm cash holdings. Working paper, University of Arizona. Dittmar, A., Mahrt–Smith, J., 2007. Corporate governance and the value of cash holdings. Journal of Financial Economics 83, 599–634. Dyl, E.A., Joehnk, M.D., 1979. Sinking funds and the cost of corporate debt. Journal of Finance 34, 887–893: Dyreng, S., Hanlon, M., Maydew, E., 2008. Long–run corporate tax avoidance. The Accounting Review 83, 61–82. Easton, P.D., Monahan S.J., Vasvari, F.P., 2009. Some initial evidence on the role of accounting earnings in the bond market. Journal of Accounting Research 47, 721–766. Ederington, L.H., Yawitz, J.B., Roberts, B.E., 1987. The informational content of bond ratings. Journal of Financial Research 10, 211. Erickson, M., Hanlon, M., Maydew, E., 2004. How much will firms pay for earnings that do not exist? Evidence of taxes paid on allegedly fraudulent earnings. The Accounting Review 79, 387–408. Fama, E., French, K., 1995. Size and book–to–market factors in earnings and returns. Journal of Finance 50, 131−155. Francis, J., LaFond, R., Olsson, P., Schipper, K., 2005. The market pricing of accrual quality. Journal of Accounting and Economics 39, 295–327. Frank, M., Lynch, L., Rego, S., 2009. Tax reporting aggressiveness and its relation to aggressive financial reporting. The Accounting Review 84, 467–496. Franco, F., Urcan, O., Vasvari, F., 2012. The value of corporate diversification: A debt market perspective. Working paper, London Business School. Ghosh, A., Moon, D., 2010. Corporate debt financing and earnings quality. Journal of Business Finance and Accounting 37, 538–559. Goh, B., Lee, J., Lim, C., Shevlin, T., 2013. The effect of corporate tax avoidance on cost of equity. Working paper, Singapore Management University.

42
Goodhart, C., O’Hara, M., 1997. High frequency data in financial markets: Issues and applications. Journal of Empirical Finance 4, 73–114. Gompers, P., J. Ishii, and A. Metrick, 2003. Corporate governance and equity prices. Quarterly Journal of Economics, 118, 107–155. Graham, J., Hanlon, M., Shevlin, T., 2012. Inside the corporate tax department: Insights on corporate decision making and tax planning. Working Paper, Duke University. Graham, J., Tucker, A., 2006. Tax shelters and corporate debt policy. Journal of Financial Economics 81, 563–594. Guay W., 1999. The sensitivity of CEO wealth to equity risk: An analysis of the magnitude and determinants. Journal of Financial Economics, 53, 43–78. Guedhami, O., Pittman, J., 2008. The importance of IRS monitoring to debt pricing in private firms, Journal of Financial Economics 90, 38–58. Hanlon, M., 2005. The persistence and pricing of earnings, accruals and cash flows when firms have large book–tax differences. The Accounting Review 80, 137–166.
Hanlon, M., Hoopes, J., Shroff, N., 2012. The effect of tax authority monitoring and enforcement on financial reporting quality. Working paper, MIT.
Hanlon, M., Shevlin, T., 2003. The tax benefits of employee stock options: the accounting and implications. Accounting Horizons 16, 1–16. Hanlon, M., Slemrod, J., 2009. What does tax aggressiveness signal? Evidence from stock price reactions to news about tax shelter involvement. Journal of Public Economics 93, 126–141. Hoopes, J., Mescall, D., Pittman, J., 2012. Do IRS audits deter corporate tax avoidance? The Accounting Review 87, 1603–1639. Hotchkiss, E., Ronen, T., 2002. The informational efficiency of the corporate bond market: An intraday analysis, Review of Financial Studies 15, 1325–1354. Hull, J., Predescu, M., White, A., 2004. The relationship between credit default swap spreads, bond yields, and credit rating announcements. Journal of Banking and Finance 28, 2789–2811. Hutchens, M., Rego, S., 2012. Tax risk and cost of equity capital. Working paper, Indiana University. Jensen, M., 1993. The modern industrial revolution, exit, and the failure of internal control systems. Journal of Finance, 48, 831–880. Kim, J–B., Li, O., Li, Y., 2010. Corporate tax avoidance and bank loan contracting. Working paper, University of Arizona.

43
Kim, J–B., Li, Y., Zhang, L., 2011. Corporate tax avoidance and stock price crash risk: firm–level analysis. Journal of Financial Economics 100, 639–662.
Koester, A., 2011. Investor valuation of tax qvoidance through uncertain tax positions. Working paper, Georgetown University.
Kothari, S., Leone, A., Wasley, C., 2005. Performance matched discretionary accrual measures. Journal of Accounting and Economics 39, 163–197. Lennox, C., Lisowsky, P., Pittman, J., 2013. Tax aggressiveness and accounting fraud. Journal of Accounting Research 51, 739–778. Lisowsky, P., Mescall, D., Novack, G., Pittman, J., 2011. The importance of tax aggressiveness to corporate borrowing costs. Working paper, University of Illinois at Urbana– Champaign. Loumioti, M., 2012. The use of intangible assets as loan collateral. Working paper, Harvard Business School. Manzon, G., Plesko, G., 2002. The relation between financial and tax reporting measures of income. Tax Law Review 55, 175–214. McNichols, M., 2002. Discussion of the quality of accruals and earnings: the role of accrual estimation errors. The Accounting Review 77, 61–69. Merton, R., 1974. On the pricing of corporate debt: The risk structure of interest rates. Journal of Finance 29, 449–470. Mills, L., 1998. Book–tax differences and internal revenue service adjustments. Journal of Accounting Research 36, 343–356. Minton, B., Schrand, C., 1999. The impact of cash flow volatility on discretionary investment and the costs of debt and equity financing. Journal of Financial Economics 54, 423–460. Nissim, D., 2010, Analysis and Valuation of Insurance Companies, Working Paper, Center for Excellence in Accounting and Security Analysis, Columbia University. Norden, L., Weber, M., 2004. Informational efficiency of credit default swap and stock markets: the impact of credit rating announcements. Journal of Banking and Finance, 28, 2813–2843. Rauh, J., Sufi, A., 2010. Capital structure and debt structure. Review of Financial Studies 23, 4242–4280. Rego, S., 2003. Tax avoidance activities of U.S. multinational corporations. Contemporary Accounting Research 20, 805–833. Scholes, M., M. Wolfson, M. Erikson, E. Maydew, and T. Shevlin. 2008. Taxes and Business Strategy: A Planning Approach. 4th ed. Upper Saddle River, NJ: Pearson Prentice Hall.

44
Sengupta, P., 1998. Corporate disclosure quality and the cost of debt. The Accounting Review 73, 459–474. Shevlin, T., 2002. Commentary: Corporate tax shelters and book–tax differences. Tax Law Review 55, 427–443. Shi, C., 2003. On the trade–off between the future benefits and riskiness of R&D: A bondholders' perspective. Journal of Accounting and Economics 35, 227–254. Shivakumar, L., Urcan, O., Vasvari, F., Zhang, L., 2011. The debt market relevance of management earnings forecasts: Evidence from before and during the credit crisis. Review of Accounting Studies, 16, 464–486. Shleifer, A., Summers, L., 1988. Breach of trust in hostile takeovers. Corporate Takeovers: Causes and Consequences.” University of Chicago Press (1988), Chicago, IL. Shleifer, A., Vishny, R., 1997. A survey of corporate governance. Journal of Finance 52, 737–783. Smith, C.W., Warner, J.B., 1979. On financial contracting: Analysis of bond covenants. Journal of Financial Economics 7, 117–171. Wang, X., 2010. Tax avoidance, corporate transparency, and firm value. Working paper, University of Texas at Austin. Warga, A., Welch, I., 1993. Bondholder losses in leveraged buyouts. Review of Financial Studies 6, 959–982. Weisbach, D., 2002. Ten truths about tax shelters. Tax Law Review 55, 325–384 Wilson, R., 2009. An examination of corporate tax shelter participants. The Accounting Review 84, 969–1000. Yu, F., 2005. Accounting transparency and the term structure of credit spreads. Journal of Financial Economics, 75, 53–84. Zhang, J., 2008. The contracting benefits of accounting conservatism to lenders and borrowers. Journal of Accounting and Economics 45, 27–54. Ziebart, D.A., Eiter, S.A.. 1992. Bond ratings, bond yields and financial information. Contemporary Accounting Research 9, 252–282.
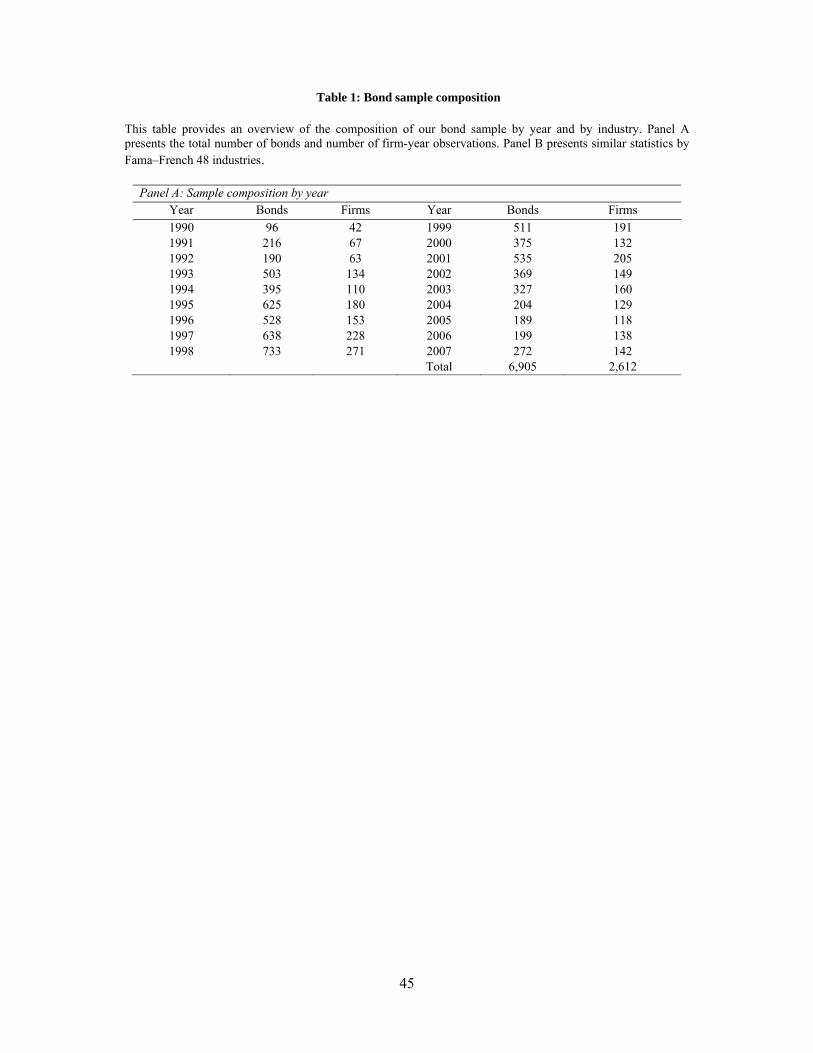
45
Table 1: Bond sample composition
This table provides an overview of the composition of our bond sample by year and by industry. Panel A presents the total number of bonds and number of firm-year observations. Panel B presents similar statistics by Fama–French 48 industries.
Panel A: Sample composition by year
Year Bonds Firms Year Bonds Firms
1990 96 42 1999 511 191 1991 216 67 2000 375 132 1992 190 63 2001 535 205 1993 503 134 2002 369 149 1994 395 110 2003 327 160 1995 625 180 2004 204 129 1996 528 153 2005 189 118 1997 638 228 2006 199 138 1998 733 271 2007 272 142
Total 6,905 2,612

46
Panel B: Sample composition by Fama–French (FF) 48 industry description FF Industry description Bonds Firms 1 Agriculture 16 5 2 Food products 331 27 3 Candy & Soda 12 2 4 Beer & Liquor 61 6
6 Recreation 47 7
7 Entertainment 97 31
8 Printing and publishing 83 15
9 Consumer goods 135 22
10 Apparel 58 14
11 Healthcare 115 32
12 Medical equipment 45 14
13 Pharmaceutical products 133 22
14 Chemicals 219 38
15 Rubber and plastic products 21 11
16 Textiles 14 10
17 Construction materials 119 22
18 Construction 103 21
19 Steel works 101 28
20 Fabricated products 4 3
21 Machinery 133 33
22 Electrical equipment 54 13
23 Automobiles and trucks 137 24
24 Aircraft 88 9
27 Precious materials 9 2
28 Non-metallic and industrial metal mining 19 6
30 Petroleum and Natural Gas 431 77
31 Utilities 1,679 94
32 Communication 281 40
33 Personal services 20 6
34 Business services 445 50
35 Computers 46 18
36 Electronic equipment 86 20
37 Measuring and control equipment 18 11
38 Business supplies 251 28
39 Shipping containers 16 6
40 Transportation 681 44
41 Wholesale 147 41
42 Retail 422 71
43 Restaurants, hotels, motels 114 19
48 Others 114 20
Total 6,905 962

47
Table 2: Descriptive statistics the dependent and control variables
ETR5 is effective tax rate averaged over the last five years (Dyreng et al., 2008). CETR5 is cash effective tax rate averaged over the last five years (Dyreng et al., 2008). CTA is a composite tax avoidance measure. Offering Yield is the bond’s percentage yield to maturity at issuance. T-bill Rate is the percentage matched T-bill rate. Rating is the numerical credit rating of the bond issue where lower values mean higher credit quality. We use Rating orthogonolized to all other variables in the empirical analyses. The Life of the Bond is the bond’s maturity in years. The Amount of issue is the total dollar face value of the bond issue. Subordinated is an indicator variable equal to one if the bond is subordinated to other debt securities and zero otherwise. Callable is an indicator variable equal to one if the bond is callable and zero otherwise. Putable is an indicator variable equal to one if the bond is putable and zero otherwise. Sinkingfund is an indicator variable equal to one if the bond has a sinking fund feature and zero otherwise. Market-to-book is firm’s market-to-book ratio at the end of the fiscal year prior to bond issuance. Return on asset is pretax income before special items, scaled by total assets at the end of the fiscal year prior to bond issuance. Leverage is the sum of the firm’s debt in current liabilities and long-term liabilities, scaled by total assets at the end of the fiscal year prior to bond issuance. Assets is the firm’s total assets at the end of the fiscal year prior to bond issuance. The CV(Cash Flows) is the coefficient of variation of net operating cash flows (obtained from the cash flow statement), scaled by total assets and calculated over the five fiscal years immediately prior to bond issuance. Loss carry forward is an indicator variable taking the value of 1 if loss carry forward is positive and 0 otherwise. Change in loss carry forward is change in loss carry forward scaled by lagged assets. Foreign income is foreign income scaled by lagged assets. PPE is property, plant, and equipment scaled by lagged assets. Intangible assets is intangible assets scaled by lagged assets. Equity income is equity income in earnings scaled by lagged assets. Information quality is the composite measure of information quality. The sample period is between 1990 and 2007. All non-indicator variables are winsorized at the top and bottom one-percentiles.
Variable N Mean SD P10 P50 P90 Tax avoidance proxies ETR5 6,905 0.321 0.097 0.209 0.333 0.409 CETR5 6,905 0.247 0.115 0.114 0.253 0.380 CTA 6,905 0.485 0.234 0.167 0.500 0.778 Bond characteristics Offering Yield 6,905 7.026 1.377 5.302 7.000 8.750 T-bill Rate 6,905 5.733 1.279 4.034 5.850 7.206 Rating 6,905 8.188 3.650 4.000 8.000 13.000 Life of the Bond 6,905 11.743 10.167 3.000 10.000 30.000 Amount of issue (in millions) 6,905 192 266 1 100 500 Subordinated 6,905 0.039 0.193 0.000 0.000 0.000 Callable 6,905 0.529 0.499 0.000 1.000 1.000 Putable 6,905 0.020 0.141 0.000 0.000 0.000 Sinkingfund 6,905 0.027 0.163 0.000 0.000 0.000
Firm characteristics Market-to-book 6,905 3.177 2.641 1.368 2.251 5.959 Return on asset 6,905 0.103 0.066 0.037 0.085 0.192 Leverage 6,905 0.412 0.239 0.182 0.371 0.649 Assets (in millions) 6,905 11,622 16,913 858 6,747 24,636 CV(Cash Flows) 6,905 0.375 0.515 0.104 0.231 0.695 Loss carry forward 6,905 0.172 0.377 0.000 0.000 1.000 Change in loss carry forward 6,905 0.001 0.011 0.000 0.000 0.001 Foreign income 6,905 0.015 0.029 0.000 0.000 0.059 PPE 6,905 0.570 0.295 0.195 0.582 0.876 Intangible assets 6,905 0.118 0.204 0.000 0.036 0.342 Equity income 6,905 0.002 0.005 0.000 0.000 0.008 Information quality 6,905 0.292 0.108 0.175 0.270 0.444

48
Table 3: Multivariate analyses for the bonds sample
This table reports the results from OLS estimation models that examine the effect of corporate tax avoidance on bond-offering yields. The sample period is between 1990 and 2007. All non-indicator variables are winsorized at the top and bottom one-percentiles. The t-values, reported in parentheses, are based on standard errors clustered at the firm level. Industry fixed effects are defined according to Fama and French 48 industry definitions. Variables are defined in Table 2.
1 2 3
Tax avoidance measures ETR5 −0.435
(−2.67)
CETR5 −0.386 (−2.23)
CTA −0.247 (−2.99)
Bond-specific controls T-bill Rate 0.531
(14.79) 0.530
(14.84) 0.533
(14.92)
Rating 0.178 (15.92)
0.182 (16.34)
0.180 (16.09)
Log(1 + Life of the Bond) 0.256 (9.17)
0.259 (9.26)
0.260 (9.31)
Log(Amount of issue) 0.008 (0.58)
0.008 (0.58)
0.008 (0.62)
Subordinated 0.251 (2.10)
0.228 (1.92)
0.221 (1.89)
Callable 0.576 (16.90)
0.577 (17.16)
0.574 (16.91)
Putable −0.477 (−2.86)
−0.489 (−2.86)
−0.489 (−2.88)
Sinkingfund −0.392 (−4.54)
−0.409 (−4.58)
−0.392 (−4.45)
Firm-specific controls Log(Market-to-book) −0.351
(−8.50) −0.350 (−8.54)
−0.353 (−8.57)
Return on asset −1.688 (−4.36)
−1.667 (−4.30)
−1.599 (−4.11)
Leverage 0.970 (7.04)
0.960 (6.84)
0.944 (6.90)
Log(Assets) −0.258 (−15.66)
−0.255 (−15.24)
−0.258 (−15.61)
CV(Cash Flows) 0.145 (3.46)
0.145 (3.48)
0.144 (3.45)
Loss carry forward 0.011 (0.22)
0.012 (0.24)
0.011 (0.22)
Change in loss carry forward 0.895 (0.65)
1.142 (0.83)
0.891 (0.65)
Foreign income −2.123 (−3.42)
−2.070 (−3.28)
−2.254 (−3.62)

49
PPE −0.607 (−5.66)
−0.621 (−5.92)
−0.618 (−5.82)
Intangible assets −0.589 (−4.16)
−0.594 (−4.20)
−0.579 (−4.11)
Equity income −3.435 (−0.83)
−2.450 (−0.60)
−2.911 (−0.70)
Information quality 1.003 (4.96)
1.049 (5.24)
1.015 (5.08)
Year fixed effects Yes Yes Yes Industry fixed effects Yes Yes Yes N 6,905 6,905 6,905 Adj. R2 0.778 0.779 0.778

50
Table 4: Robustness analyses
Panel A: Multivariate analyses for the bonds sample: Endogeneity This panel reports the results from OLS estimation models that examine the effect of corporate tax avoidance on bond-offering yields. Corporate tax avoidance proxies are firm-specific (so there is no time variation within the same firm) and they are calculated the first year they could be calculated in our sample. The sample period is between 1990 and 2007. All non-indicator variables are winsorized at the top and bottom one-percentiles. The t-values, reported in parentheses, are based on standard errors clustered at the firm level. Industry fixed effects are defined according to Fama and French 48 industry definitions. Variables are defined in Table 2.
1 2 3
Tax avoidance measures ETR5 −0.233
(−1.72)
CETR5 −0.426 (−3.17)
CTA −0.256 (−2.89)
Bond-specific controls Yes Yes Yes Firm-specific controls Yes Yes Yes Year fixed effects Yes Yes Yes Industry fixed effects Yes Yes Yes N 6,905 6,905 6,905 Adj. R2 0.778 0.778 0.778

51
Panel B: The impact of tax avoidance on expected default frequency This table reports the results from OLS estimation models that examine the effect of corporate tax avoidance on expected default frequency (EDF). EDFs are measured at the month earnings are announced. Monthly EDFs are obtained from Moody’s / KMV. The sample period is between 1990 and 2007. All non-indicator variables are winsorized at the top and bottom one-percentiles. The t-values, reported in parentheses, are based on standard errors clustered at the firm level. Industry fixed effects are defined according to Fama and French 48 industry definitions. Variables are defined in Table 2.
1 2 3
Tax avoidance measures ETR5 −0.184
(−2.51)
CETR5 −0.246 (−4.15)
CTA −0.157 (−5.30)
Firm-specific controls Log(Market-to-book) −0.377
(−26.35) −0.382
(−26.72) −0.383
(−26.84)
Return on asset −0.309 (−4.11)
−0.303 (−4.04)
−0.285 (−3.80)
Leverage 1.209 (28.86)
1.204 (28.74)
1.203 (28.72)
Log(Assets) −0.108 (−18.81)
−0.107 (−18.62)
−0.108 (−18.84)
CV(Cash Flows) 0.042 (10.02)
0.042 (10.02)
0.042 (9.92)
Loss carry forward 0.077 (4.57)
0.070 (4.19)
0.069 (4.11)
Change in loss carry forward 0.367 (1.91)
0.385 (2.01)
0.388 (2.02)
Foreign income 1.274 (5.99)
1.273 (6.01)
1.210 (5.69)
PPE −0.505 (−13.41)
−0.523 (−13.83)
−0.518 (−13.78)
Intangible assets −0.393 (−10.01)
−0.400 (−10.19)
−0.391 (−9.98)
Equity income −4.088 (−2.44)
−3.911 (−2.32)
−4.106 (−2.43)
Information quality 0.475 (7.89)
0.481 (7.99)
0.462 (7.68)
Year fixed effects Yes Yes Yes Industry fixed effects Yes Yes Yes N 28,126 28,126 28,126 Adj. R2 0.406 0.407 0.407

52
Panel C: Changes in CDS spreads around tax shelter announcements This panel reports changes in 5-year CDS spreads around firm tax shelter announcements. Tax shelter announcements are obtained from Hanlon and Slemrod (2009). ∆Raw CDS Spread is the percentage change in CDS spread around shelter announcement date over a five-day window ([−2, 2]). ∆Market CDS Spread is average CDS spread of the market within the same credit rating group during the same five-day window. ∆Abnormal CDS Spread is the difference between raw and market CDS spread changes. There are 20 announcements in the sample. The sample period is between 2002 and 2004. All non-indicator variables are winsorized at the top and bottom one-percentiles.
Mean (p-value)
Median (p-value)
∆Raw CDS Spread (%) 4.52
(0.006) 2.25
(0.001) ∆Market CDS Spread (%) 0.68
(0.007)0.29
(0.006) ∆Abnormal CDS Spread (%) 3.84
(0.009) 2.19
(0.008)

53
Table 5: The impact of tax avoidance on future cash flows level and volatility
This table reports the results from OLS estimation models that examine the effect of corporate tax avoidance on future cash flows level and volatility. The dependent variable in columns 1-3 (columns 4-6) is the average (coefficient of variation) of cash flows from operations scaled total assets over the next 5 years. The sample period is between 1990 and 2007. All non-indicator variables are winsorized at the top and bottom one-percentiles. The t-values, reported in parentheses, are based on standard errors clustered at the firm level. Industry fixed effects are defined according to Fama and French 48 industry definitions. Variables are defined in Table 2.
1 2 3 4 5 6 Cash flows level Cash flows volatility
Tax avoidance measures ETR5 0.013
(1.80) −0.472
(−2.33)
CETR5 0.017 (3.09)
−0.621 (−3.70)
CTA 0.011 (3.53)
−0.327 (−3.76)
Firm-specific controls
Log(Market-to-book) 0.022 (16.26)
0.023 (16.47)
0.023 (16.54)
−0.263 (−6.98)
−0.276 (−7.26)
−0.275 (−7.28)
Return on asset 0.128 (11.92)
0.127 (11.86)
0.126 (11.75)
0.159 (0.70)
0.174 (0.77)
0.202 (0.89)
Leverage −0.056 (−15.07)
−0.056 (−14.98)
−0.056 (−14.96)
0.715 (5.95)
0.701 (5.85)
0.704 (5.86)
Log(Assets) −0.000 (−0.50)
−0.000 (−0.58)
−0.000 (−0.47)
−0.142 (−8.64)
−0.140 (−8.51)
−0.142 (−8.68)
CV(Cash Flows) −0.004 (−12.63)
−0.004 (−12.66)
−0.004 (−12.59)
0.126 (8.42)
0.126 (8.42)
0.125 (8.36)
Loss carry forward −0.003 (−1.82)
−0.003 (−1.55)
−0.003 (−1.51)
0.065 (1.35)
0.049 (1.02)
0.050 (1.04)
Change in loss carry forward −0.029 (−1.56)
−0.030 (−1.62)
−0.030 (−1.63)
−0.442 (−0.67)
−0.403 (−0.61)
−0.410 (−0.62)
Foreign income 0.075 (2.80)
0.075 (2.81)
0.080 (2.95)
−0.906 (−1.71)
−0.911 (−1.74)
−1.028 (−1.95)
PPE 0.065 (14.99)
0.066 (15.10)
0.066 (15.13)
−1.078 (−9.69)
−1.123 (−10.00)
−1.106 (−9.95)
Intangible assets −0.007 (−1.71)
−0.006 (−1.61)
−0.007 (−1.75)
−0.703 (−5.96)
−0.719 (−6.14)
−0.702 (−5.98)
Equity income −0.219 (−0.99)
−0.232 (−1.05)
−0.219 (−0.99)
2.749 (0.63)
3.231 (0.74)
2.786 (0.64)
Information quality −0.058 (−9.13)
−0.058 (−9.21)
−0.057 (−8.97)
0.646 (3.46)
0.663 (3.56)
0.624 (3.35)
Year fixed effects Yes Yes Yes Yes Yes Yes Industry fixed effects Yes Yes Yes Yes Yes Yes N 26,874 26,874 26,874 26,874 26,874 26,874Adj. R2 0.332 0.332 0.332 0.095 0.095 0.095

54
Table 6: Path analysis
This panel reports the results from path analyses that examine the effect of corporate tax avoidance on bond-offering yields directly and through cash flows level (Panel A) or cash flows volatility (Panel B). p(X1,X2) stands for standardized path coefficient. The sample period is between 1990 and 2007. All non-indicator variables are winsorized at the top and bottom one-percentiles. The t-values are reported in parentheses. Industry fixed effects are defined according to Fama and French 48 industry definitions. Variables are defined in Table 2.
Panel A: Cash flows level as the mediating variable
Tax Avoidance Proxy ETR5 CETR5 CTA
Direct Path
p(Tax avoidance, Offering yield) −0.029 (−4.07)
−0.031 (−4.32)
−0.039 (−5.39)
Mediated Path
p(Tax avoidance, Cash flows level) 0.164 (13.80)
0.144 (12.06)
0.220 (19.00)
p(Cash flows level, Offering yield)
−0.090 (−14.96)
−0.088 (−14.72)
−0.087 (−14.43)
Total mediated path −0.015
−0.013
−0.019
Bond-specific controls Yes Yes Yes Firm-specific controls Yes Yes Yes Year fixed effects Yes Yes Yes Industry fixed effects Yes Yes Yes N 6,737 6,737 6,737 R2 0.769 0.771 0.770
Panel B: Cash flows volatility as the mediating variable Tax Avoidance Proxy ETR5 CETR5 CTA
Direct Path
p(Tax avoidance, Offering yield) −0.030 (−4.29)
−0.031 (−4.49)
−0.040 (−5.59)
Mediated Path
p(Tax avoidance, Cash flows volatility) −0.018 (−1.48)
−0.041 (−3.34)
−0.042 (−3.49)
p(Cash flows volatility, Offering yield)
0.108 (18.38)
0.107 (18.22)
0.106 (18.13)
Total mediated path −0.002
−0.004
−0.005
Bond-specific controls Yes Yes Yes Firm-specific controls Yes Yes Yes Year fixed effects Yes Yes Yes Industry fixed effects Yes Yes Yes N 6,737 6,737 6,737 R2 0.775 0.776 0.776

55
Table 7: The impact of tax avoidance on bond ownership
This table reports the results from OLS estimation models that examine the effect of corporate tax avoidance on bond ownership of insurance firms. The dependent variable in columns 1-3 (columns 4-6) is the percentage of bonds owned by insurance firms (number of bondholders). The sample period is between 2001 and 2007. All non-indicator variables are winsorized at the top and bottom one-percentiles. The t-values, reported in parentheses, are based on standard errors clustered at the firm level. Industry fixed effects are defined according to Fama and French 48 industry definitions. Variables are defined in Table 2.
1 2 3 4 5 6 Percentage of bonds owned Number of bondholders
Tax avoidance measures ETR5 0.264
(2.00) 4.278
(1.65)
CETR5 0.102 (1.61)
4.848 (1.83)
CTA 0.065 (2.25)
2.256 (1.88)
Bond-specific controls T-bill Rate −0.016
(−3.71) −0.016 (−3.66)
−0.016 (−3.67)
−0.851 (−4.65)
−0.853 (−4.66)
−0.852 (−4.66)
Rating −0.012 (−3.79)
−0.011 (−3.36)
−0.011 (−3.43)
−0.494 (−3.12)
−0.466 (−2.98)
−0.466 (−2.98)
Log(1 + Life of the Bond) 0.184 (18.08)
0.183 (18.12)
0.184 (18.06)
3.100 (8.47)
3.084 (8.42)
3.089 (8.42)
Log(Amount of issue) 0.013 (3.47)
0.013 (3.25)
0.013 (3.34)
3.652 (13.78)
3.631 (13.91)
3.640 (13.73)
Subordinated 0.197 (3.21)
0.209 (3.50)
0.207 (3.45)
0.669 (0.39)
1.187 (0.68)
1.019 (0.59)
Callable −0.120 (−7.80)
−0.119 (−7.70)
−0.119 (−7.72)
2.217 (3.34)
2.272 (3.42)
2.256 (3.41)
Putable −0.040 (−0.83)
−0.039 (−0.81)
−0.038 (−0.81)
−2.607 (−2.12)
−2.565 (−2.09)
−2.563 (−2.09)
Sinkingfund 0.018 (0.38)
0.014 (0.31)
0.014 (0.30)
−2.072 (−1.05)
−2.273 (−1.18)
−2.239 (−1.15)
Firm-specific controls Log(Market-to-book) −0.019
(−1.40) −0.019 (−1.41)
−0.018 (−1.33)
−0.452 (−0.82)
−0.410 (−0.74)
−0.392 (−0.71)
Return on asset −0.269 (−2.28)
−0.270 (−2.22)
−0.289 (−2.40)
−20.367 (−3.63)
−21.227 (−3.89)
−21.620 (−4.01)
Leverage 0.005 (0.08)
−0.003 (−0.05)
0.005 (0.09)
0.693 (0.45)
0.608 (0.39)
0.850 (0.54)
Log(Assets) −0.035 (−5.26)
−0.035 (−5.25)
−0.034 (−5.13)
1.727 (6.50)
1.733 (6.51)
1.755 (6.67)
CV(Cash Flows) −0.002 (−0.12)
−0.003 (−0.20)
−0.003 (−0.17)
0.194 (0.43)
0.161 (0.34)
0.178 (0.39)
Loss carry forward −0.024 (−1.77)
−0.023 (−1.73)
−0.023 (−1.73)
−1.081 (−2.02)
−1.056 (−1.96)
−1.066 (−1.98)
Change in loss carry forward −0.065 (−0.44)
−0.107 (−0.72)
−0.082 (−0.55)
−3.094 (−0.08)
−4.225 (−0.66)
−3.242 (−0.51)
Foreign income 0.320 0.289 0.319 14.492 13.673 14.833

56
(1.98) (1.77) (1.96) (1.74) (1.68) (1.82)
PPE −0.017 (−0.38)
−0.009 (−0.20)
−0.011 (−0.24)
1.287 (0.81)
1.680 (1.08)
1.527 (0.98)
Intangible assets −0.007 (−0.18)
0.000 (0.00)
−0.004 (−0.09)
0.691 (0.37)
0.948 (0.52)
0.780 (0.42)
Equity income 1.868 (1.14)
1.823 (1.09)
1.809 (1.09)
11.734 (0.34)
10.604 (0.30)
10.048 (0.29)
Information quality −0.248 (−4.06)
−0.248 (−4.17)
−0.244 (−4.05)
−8.967 (−3.52)
−8.795 (−3.46)
−8.750 (−3.43)
Year fixed effects Yes Yes Yes Yes Yes Yes Industry fixed effects Yes Yes Yes Yes Yes Yes N 35,231 35,231 35,231 35,231 35,231 35,231Adj. R2 0.237 0.236 0.236 0.251 0.251 0.251

57
Table 8: Cross-sectional analyses
Panel A: Multivariate analyses for the bonds sample conditioned on governance quality This panel reports the results from OLS estimation models that examine the effect of corporate tax avoidance on bond-offering yields. Sample is divided into high and low corporate governance quality by splitting the sample according to median Gompers, Ishii and Metrick (G-Index) Index per year. Observations which have higher than median G-Index scores are classified as low corporate governance quality. The sample period is between 1990 and 2007. All non-indicator variables are winsorized at the top and bottom one-percentiles. The t-values, reported in parentheses, are based on standard errors clustered at the firm level. Industry fixed effects are defined according to Fama and French 48 industry definitions. Variables are defined in Table 2. +++, ++, and + indicate that the coefficients between high and low governance quality groups are significantly different at the 1%, 5%, and 10% levels, respectively, in two-tailed tests.
High Governance Quality Low Governance Quality
Tax avoidance measures ETR5 0.043
(0.16) −1.446+++
(−4.48)
CETR5 −0.012 (−0.04)
−1.242++
(−5.87)
CTA −0.028 (−0.20)
−0.661+++
(−5.81)
Bond-specific controls Yes Yes Yes Yes Yes Yes Firm-specific controls Yes Yes Yes Yes Yes Yes Year fixed effects Yes Yes Yes Yes Yes Yes Industry fixed effects Yes Yes Yes Yes Yes Yes N 2,478 2,478 2,478 2,398 2,398 2,398 Adj. R2 0.834 0.835 0.834 0.735 0.733 0.733
Panel B: Multivariate analyses for the bonds sample conditioned on ownership concentration This panel reports the results from OLS estimation models that examine the effect of corporate tax avoidance on bond-offering yields. Sample is divided into high and low ownership concentration by splitting the sample according to median ownership of largest shareholder. The sample period is between 1990 and 2007. All non-indicator variables are winsorized at the top and bottom one-percentiles. The t-values, reported in parentheses, are based on standard errors clustered at the firm level. Industry fixed effects are defined according to Fama and French 48 industry definitions. Variables are defined in Table 2. +++, ++, and + indicate that the coefficients between high and low ownership concentration groups are significantly different at the 1%, 5%, and 10% levels, respectively, in two-tailed tests.
Low Ownership Concentration High Ownership Concentration Tax avoidance measures ETR5 −0.239
(−0.92) −0.669+
(−2.49)
CETR5 −0.083 (−0.39)
−1.012+++
(−3.43)
CTA −0.107 (−1.03)
−0.433+++
(−3.04)
Bond-specific controls Yes Yes Yes Yes Yes Yes Firm-specific controls Yes Yes Yes Yes Yes Yes Year fixed effects Yes Yes Yes Yes Yes Yes Industry fixed effects Yes Yes Yes Yes Yes Yes N 2,820 2,820 2,820 2,832 2,832 2,832Adj. R2 0.829 0.833 0.831 0.778 0.778 0.778
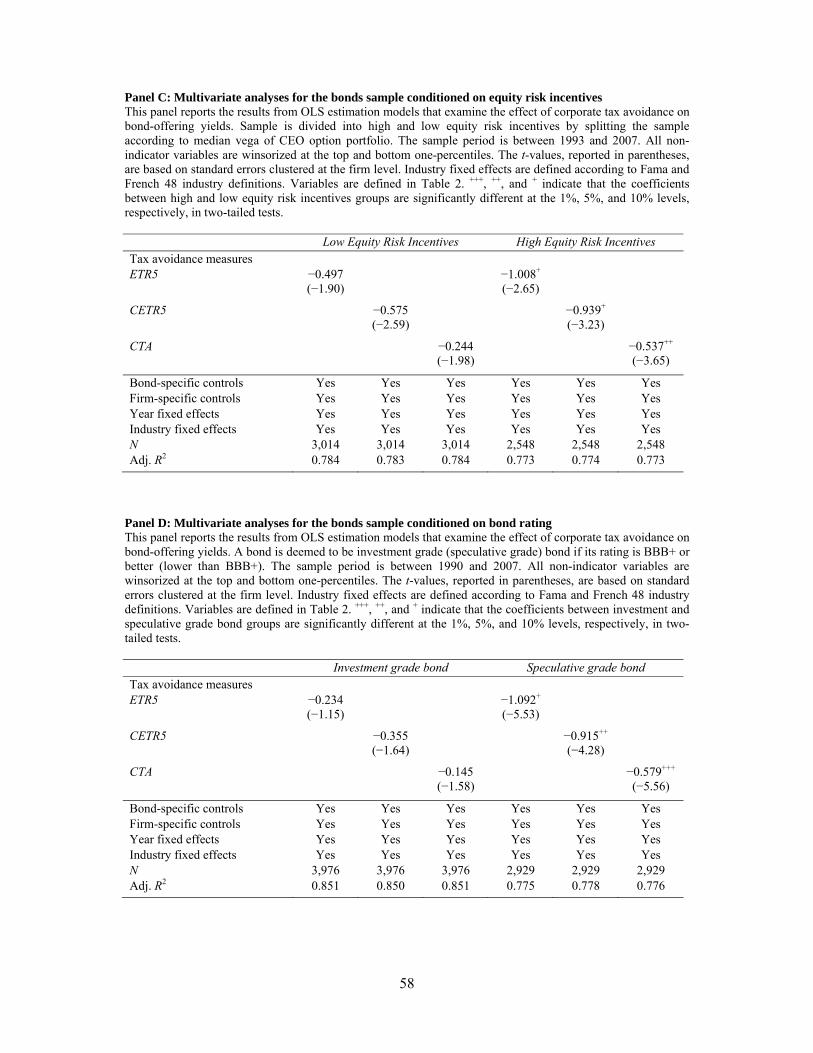
58
Panel C: Multivariate analyses for the bonds sample conditioned on equity risk incentives This panel reports the results from OLS estimation models that examine the effect of corporate tax avoidance on bond-offering yields. Sample is divided into high and low equity risk incentives by splitting the sample according to median vega of CEO option portfolio. The sample period is between 1993 and 2007. All non-indicator variables are winsorized at the top and bottom one-percentiles. The t-values, reported in parentheses, are based on standard errors clustered at the firm level. Industry fixed effects are defined according to Fama and French 48 industry definitions. Variables are defined in Table 2. +++, ++, and + indicate that the coefficients between high and low equity risk incentives groups are significantly different at the 1%, 5%, and 10% levels, respectively, in two-tailed tests.
Low Equity Risk Incentives High Equity Risk Incentives Tax avoidance measures ETR5 −0.497
(−1.90) −1.008+
(−2.65)
CETR5 −0.575 (−2.59)
−0.939+
(−3.23)
CTA −0.244 (−1.98)
−0.537++
(−3.65)
Bond-specific controls Yes Yes Yes Yes Yes Yes Firm-specific controls Yes Yes Yes Yes Yes Yes Year fixed effects Yes Yes Yes Yes Yes Yes Industry fixed effects Yes Yes Yes Yes Yes Yes N 3,014 3,014 3,014 2,548 2,548 2,548Adj. R2 0.784 0.783 0.784 0.773 0.774 0.773
Panel D: Multivariate analyses for the bonds sample conditioned on bond rating This panel reports the results from OLS estimation models that examine the effect of corporate tax avoidance on bond-offering yields. A bond is deemed to be investment grade (speculative grade) bond if its rating is BBB+ or better (lower than BBB+). The sample period is between 1990 and 2007. All non-indicator variables are winsorized at the top and bottom one-percentiles. The t-values, reported in parentheses, are based on standard errors clustered at the firm level. Industry fixed effects are defined according to Fama and French 48 industry definitions. Variables are defined in Table 2. +++, ++, and + indicate that the coefficients between investment and speculative grade bond groups are significantly different at the 1%, 5%, and 10% levels, respectively, in two-tailed tests.
Investment grade bond Speculative grade bond Tax avoidance measures ETR5 −0.234
(−1.15) −1.092+
(−5.53)
CETR5 −0.355 (−1.64)
−0.915++
(−4.28)
CTA −0.145 (−1.58)
−0.579+++
(−5.56)
Bond-specific controls Yes Yes Yes Yes Yes Yes Firm-specific controls Yes Yes Yes Yes Yes Yes Year fixed effects Yes Yes Yes Yes Yes Yes Industry fixed effects Yes Yes Yes Yes Yes Yes N 3,976 3,976 3,976 2,929 2,929 2,929Adj. R2 0.851 0.850 0.851 0.775 0.778 0.776

59
Panel E: Multivariate analyses for the bonds sample conditioned on IRS audit probability This panel reports the results from OLS estimation models that examine the effect of corporate tax avoidance on bond-offering yields. Sample is divided into high and low IRS audit probability by splitting the sample according to median IRS audit probability. IRS audit probability is obtained from Transactional Records Access Clearinghouse (TRAC) website. The sample period is between 1992 and 2007. All non-indicator variables are winsorized at the top and bottom one-percentiles. The t-values, reported in parentheses, are based on standard errors clustered at the firm level. Industry fixed effects are defined according to Fama and French 48 industry definitions. Variables are defined in Table 2. +++, ++, and + indicate that the coefficients between high and low IRS audit probability groups are significantly different at the 1%, 5%, and 10% levels, respectively, in two-tailed tests.
Low IRS Audit Probability High IRS Audit Probability Tax avoidance measures ETR5 −0.172
(−0.86) −0.502+
(−2.05)
CETR5 −0.155 (−0.64)
−0.612+
(−2.85)
CTA −0.141 (−1.28)
−0.333+
(−3.22)
Bond-specific controls Yes Yes Yes Yes Yes Yes Firm-specific controls Yes Yes Yes Yes Yes Yes Year fixed effects Yes Yes Yes Yes Yes Yes Industry fixed effects Yes Yes Yes Yes Yes Yes N 3,374 3,374 3,374 3,219 3,219 3,219Adj. R2 0.778 0.781 0.780 0.769 0.768 0.768