corporate venture capital and incumbent firm innovation rates
TRANSCRIPT
Corporate Venture Capital and Incumbent Firm Innovation Rates
Gary Dushnitsky Stern School of Business
New York University 44 West 4th St. Suite 750
New York, NY 10012 Tel: (212) 998-0283 Fax: (212) 995-4235
Michael J. Lenox Stern School of Business
New York University 40 West 4th St. Suite 717
New York, NY 10012 Tel: (212) 998-0261 Fax: (212) 995-4235
Draft: March 1st, 2002
Working Paper. Please do not quote or cite without authors’ permission.
2002 G. Dushnitsky & M. Lenox
2002 G. Dushnitsky & M. Lenox 1
Corporate Venture Capital and Incumbent Firm Innovation Rates
Abstract
In this paper, we focus on the potential strategic benefits to corporate venture capital, i.e.
equity investments in entrepreneurial ventures by incumbent firms. In particular, we ask do
firms that invest corporate venture capital learn about and appropriate new technologies and
practices from those ventures they invest? Our investigation builds on two theoretical pillars.
First, that incumbent firms operating in competitive markets are inclined towards introducing
innovations. Second, that the knowledge necessary to generate innovation may likely reside
outside the boundary of the incumbent firm and in entrepreneurial ventures. Thus, we propose
that corporate venture capital programs may be instrumental in harvesting innovations from
entrepreneurial ventures and thus an important part of a firm’s overall innovation strategy. To
this end, we directly explore the relationship between corporate venture capital and incumbent
firm innovation by analyzing a large panel of public firms that pursued venturing activity or
patented over a thirty-year period. We find that increases in corporate venture capital
investments are associated with subsequent increases in firm quality patenting. The findings of
this study have important implications for the functioning of corporate venture capital programs
and the ability of firms to innovate in general.
Keywords: corporate venture capital, innovation, knowledge, entrepreneurship
Short Title: Corporate Ventures & Innovation

2002 G. Dushnitsky & M. Lenox 2
Corporate Venture Capital and Incumbent Firm Innovation Rates
At the beginning of this new century, established corporations have become important
players in the venture capital industry. In 2000, more than 400 firms sponsored corporate
venture capital programs that invested close to $16 billion. These investments represent
approximately 15% of all venture capital investments -- a sharp increase from the relatively
meager $20 million invested by corporations in new ventures in 1993 (Venture Economics,
2001). Why are established firms investing in new ventures? Do these firms simply hope to
reap the high financial returns that venture capitalists experienced in the late 1990’s? Or, do
these firms have other strategic reasons for investing in new ventures?
In this paper, we focus on the potential strategic benefits to incumbent firms by investing
corporate venture capital (CVC). We define “corporate venture capital” as any equity investment
in an entrepreneurial venture by an incumbent firm (Gompers & Lerner, 1998). We consider
both investments in independent ventures (Gompers and Lerner, 1998) and investments in
ventures that consist of former employees (Burgelman, 1983; Garud and Van de Ven, 1992). In
particular, we are interested in whether CVC investments result in knowledge spillovers to
incumbent firms. Do firms that invest corporate venture capital learn about and appropriate new
technologies and practices from those ventures they invest? For example, do increases in CVC
investments lead to increases in incumbent firm patenting levels?
Our investigation builds on two theoretical pillars. First, that incumbent firms operating
in competitive markets are inclined towards introducing innovations (Schumpeter, 1942; Arrow,
1962). This is in part because incumbent firms need to innovate constantly in order to sustain
profitability (Roberts, 1999; Hamel, 2000). Second, that the knowledge necessary to generate
innovation may likely reside outside the boundary of the incumbent firm (Arrow, 1974; Cohen &

2002 G. Dushnitsky & M. Lenox 3
Levinthal, 1990). In particular, increases in the relative significance of human-capital (Zingales,
2000) imply that entrepreneurial startups may be a valuable source of such knowledge (Kortum
and Lerner, 2000; Shane, 2001a). Placed together, these two pillars suggest that incumbents may
seek innovation outside their organization and within competent entrepreneurial ventures. We
propose that corporate venture capital programs may be instrumental in harvesting innovations
from entrepreneurial ventures and thus an important part of a firm’s overall innovation strategy.
Previous empirical research on venture capital investments by corporations has focused
primarily on the narrow, financial returns to investing in new ventures. A number of studies
have found that investments in general in related ventures by incumbent firms had a significantly
lower return than investments by venture capitalists (Gompers & Lerner , 1998; Siegel, Siegel &
MacMillan, 1988). The ventures themselves, however, performed equally well when funded by
related incumbent firms or by venture capitalists (Gompers & Lerner , 1998; Sykes, 1990;
Shrader & Simon, 1991; Thornhill & Amit, 2000).
A handful of empirical studies do provide some evidence that corporate venturing activity
results in important strategic benefits to firms (Rind, 1981; Sykes, 1990; Block & MacMillan,
1993; Sorrentino & Williams, 1995; Shrader & Simon, 1997). Unfortunately, these studies rely
on case studies or small sample surveys and focus on either overall firm financial performance or
project-progress measures. None of these studies evaluate the effect of corporate venture capital
on incumbent firm innovation.
In this paper, we directly explore the relationship between corporate venture capital and
incumbent firm innovation. We analyze a large, unbalanced panel of U.S. public firms during
the time period 1969-1999. Of those firms in our dataset, approximately two hundred and fifty
firms engaged at least in some level of CVC investing during the time period. Data is pulled

2002 G. Dushnitsky & M. Lenox 4
from VenturExpert, Compustat, and the U.S. Patent databases. Discrete choice, fixed-effect and
random-effect models are adopted to establish a relationship between CVC investment intensity
and patenting.
Our contribution is in exploring whether increases in CVC investments lead to increases
in incumbent firm patenting levels. We find that increases in CVC investment are associated
with subsequent increases in citation-weighted, firm patenting rates. The findings of this study
have important implications for the functioning of corporate venture capital programs and the
ability of firms to innovate in general. While alternative inter-organizational forms such as
technology alliances have been extensively studied (e.g., Ahuja, 2000; Powell, Koput & Smith-
Doerr 1996), corporate venture capital has been the subject of less formal, empirical analysis.
Moreover, if knowledge spills over to incumbent firms, there are incentives for new ventures to
seek alternative sources of funding such as venture capital. The likely impacts of this on
governance will be the subject of future studies.
Theoretical Background
In his later years (and in contradiction to his earlier writings), Schumpeter (1942)
introduced the view that established firms are most likely to be innovative. According to
Schumpeter, incumbent firms possess the capital and skilled personnel necessary to produce
innovations as well as the complementary assets necessary to appropriate the resultant rents.
Subsequent research postulated that incumbent firms operating in competitive markets are
inclined towards innovating in part because of the need to continuously innovate in order to
sustain profitability (Arrow, 1962; Roberts, 1999; Hamel, 2000). A rich game theoretic literature
2002 G. Dushnitsky & M. Lenox 5
also provides evidence that, under some conditions, incumbent firms are more likely than
potential new entrants to invest in innovation (see Reinganum, 1989 for a review).
Despite this economic inclination to seek innovation by established firms, numerous
researchers have highlighted the organizational limitations of incumbents to generate innovations
internally (Henderson, 1993). The view that incumbent firms face difficulties in generating
ground breaking, radical innovations is well established (Tushman and Anderson, 1986;
Henderson, 1993). Innovation in large part requires the integration of diverse knowledge sets.
To the extent there are constraints on the creation and sharing of knowledge within a single
organization, incumbent firms may find that they lack the knowledge necessary to innovate.
Numerous remedies have been suggested. Incumbent firms may, for example, be able to
overcome their inability to internally generate innovations by exploiting knowledge external to
the firm (Cohen and Levinthal, 1990). This has been the focus of many studies that investigate
the ability to create new knowledge through the recombination of knowledge across
organizational boundaries (Henderson and Cockburn, 1994; Rosenkopf and Nerkar, 2001;
Almeida, Dokko and Rosenkopf, 2001). External knowledge can be accessed and assimilated
through different avenues including regional learning (Saxenian, 1990), recruitment of high-
human capital personnel (Almeida and Kogut, 1999), and strategic alliances (Hagedoorn &
Schakenraad, 1994; Powell, Koput & Smith-Doerr 1996).
In addition to these vehicles, we propose that corporate venture capital may be an
important component of a firm’s innovation strategy. We advance the idea that a transformation
has transpired that has induced incumbents to seek innovation outside their organization and
within competent entrepreneurial ventures. In the later half of the twentieth century, highly
skilled human capital (labor) has become more important in generating innovation than physical

2002 G. Dushnitsky & M. Lenox 6
capital (Zingales, 2000). In this new setting, the property rights literature (Grossman and Hart,
1986) predicts that skilled workers will disassociate themselves from incumbents and form
independent firms. Such disposition towards non-integration explains the proliferation of
ventures headed by independent entrepreneurs. Indeed, Shane (2001a) provides direct empirical
evidence that new venture formation is associated with underlying entrepreneurial inventions
that are technologically radical or that have high economic value. Kortum and Lerner (2000)
support these findings, observing that entrepreneurial, human-capital intensive ventures generate
high levels of patenting output.
Thus, the knowledge necessary to generate innovations may likely reside outside the
boundary of the incumbent firm and within innovative new ventures. Corporate venture capital
may provide a robust avenue to access this knowledge. Indeed, the declared goal of Nokia
Ventures, the CVC program of Nokia, is to “fuel future growth and to boost new product and
long-term business development (Business Wire, 1998).” By investing in a new venture,
incumbent firms may be able to learn about new technologies or practices. With this knowledge,
they may be able to innovate existing products or services or diversify into new lines of business.
CVC investment may allow incumbents to manage threats from potential entrants within their
core businesses especially in the crucial early stages of new technological regimes (Shane,
2001b). Additionally, learning about novel technologies before their rivals increases the
likelihood of identifying future alliance partners or acquisition targets (Ahuja, 2000).
A similar point has been made in the related technology alliances literature. To the extent
that entrepreneurial startups possess valuable knowledge, corporate venture capital may provide
a firm a window onto the operations of portfolio companies that can generate similar advantages
to those associated with having innovative alliance partners. Hagedoorn & Schakenraad (1994)

2002 G. Dushnitsky & M. Lenox 7
and Ahuja (2000) indicate that knowledge from innovative alliance partners may spillover and
positively affect the innovativeness of a firm. Stuart (2000) shows that firms patenting rates
increase the more technologically advanced are its alliance partners. Rothaermal (2001) argues
that incumbent firms that pursue alliance formation with new ventures improve their new
product development when faced with radical technological changes.
CVC investing firms may learn from new ventures in a number of ways. Anecdotal
evidence suggests that incumbent firms institute specific organizational routines to encourage
and funnel learning from the ventures they invest. Sony Corporation created two parallel and
distinct functions responsible for knowledge transfer between its portfolio companies and the
corporation (Venture Capital Investment in Israeli Companies, International Business Forum,
March 27-28, 2001). Sony’s CVC group, Sony Strategic Venture Investments, played the role of
venture-capitalist -- sitting on the venture’s board and helping manage the portfolio company. In
this role, they were exposed to the technologies and practices of the venture. In addition, Sony’s
business divisions established liaisons with the ventures. These liaisons specific goal was to
learn about and source the portfolio company’s technology.
Such organizational practices need not lead to expropriation by the incumbent and harm
to the new venture. The venture may secure entrepreneurial rents from its technology due to a
strong appropriability regime (perhaps because of tight patent protection). Any learning that
takes by the incumbent firm merely opens a window onto new technologies that leads to further
innovation. For example, Ahuja and Lampert (2001) find that experimenting by established
firms with novel, pioneering technologies increases the likelihood that they will create
subsequent breakthrough inventions. By tapping an external source of knowledge – in this case,
2002 G. Dushnitsky & M. Lenox 8
an entrepreneurial venture – a firm will become more innovative. Investments in innovative new
ventures may increase a firm’s absorptive capacity (Cohen & Levinthal, 1990).
Evidence to Date
The empirical evidence of learning from CVC investment is sparse. Previous economic
research on corporate venture capital has focused on the narrow, financial benefits to investing in
new ventures. Gompers & Lerner (1998) in a study of over thirty thousand investments rounds
found that investments in related ventures by incumbent firms had a significantly lower return
than investments by venture capitalists. However, the ventures themselves performed equally
well when funded by related incumbent firms or by venture capitalists. These results did not
hold for incumbent firms who invested in new ventures that were in unrelated businesses. The
findings of the Gompers & Lerner study are consistent with a number of other studies in the
entrepreneurship literature (Siegel et. al., 1988; Sykes, 1990; Block & MacMillan, 1993;
Sorrentino & Williams, 1995; Shrader & Simon, 1997; Thornhill & Amit, 2000).
Other researchers have looked more directly at the strategic benefits of venturing activity.
These studies attempt to explain variation in performance as a function of various corporate
venturing attributes such as the program’s objectives (Block and MacMillan, 1993; Gompers and
Lerner, 1998; Siegel et. al., 1988; Winters and Murfin, 1988); its organizational design (Maula
and Murray, 2000; Winters and Murfin, 1988) and specific characteristics of its relationships
with ventures (Thornhill and Amit, 2000; Siegel et al, 1988; Sorrentino and Williams, 1995;
Sykes, 1990).
Siegel, Siegel, and MacMillan (1988) survey 52 corporate venture programs about their
goals and conduct. They report that corporations rank “exposure to new technologies and
2002 G. Dushnitsky & M. Lenox 9
markets” as the leading objective for engaging in corporate venture capital programs. In a study
of 88 corporate sponsored ventures in the PIMS database, Sorrentino and Williams (1995) report
that relatedness between incumbent firm and the new venture does not explain the latter’s
success. However, they do find that relatedness is increasingly associated with a venture’s
success, the higher the stock of corporate intangible assets. Based on a survey of 97 Canadian
corporate ventures, Thornhill and Amit (2000) identify two distinct dimensions of relatedness:
economic fit and relational fit. They find that while a venture’s success is decreasingly
associated with the level of economic fit, relational fit remains a significant factor throughout a
venture’s life. Consistent with the notion of knowledge spillovers we advance above, relational
fit pertains not only to the contribution made by the corporation to the venture but also to
interdependence and feedback from the venture to the sponsoring corporation.
The research presented in this paper, improves on this literature in a number of ways.
Much of the existing literature relies on case studies or descriptive surveys that cannot control
for a number of competing causal factors such as firm size or industry choice. The few
multivariate analyses conducted have been cross sectional and thus have not been able to address
issues of unobserved heterogeneity and temporal precedence. We make use of extensive archival
data to build a longitudinal dataset that can allow for more sophisticated econometric models.
Finally, existing studies focus on either overall firm financial performance or project-progress
measures of CVC success. None of these studies directly evaluate the effect of corporate
venturing on incumbent firm innovation. We use patenting data to capture the innovative output
of investing firms.

2002 G. Dushnitsky & M. Lenox 10
Data & Method
In our analysis, we explore the relationship between corporate venture capital and
incumbent firm innovation rates. Specifically, we investigate whether increases in CVC
investments lead to increases in firm patenting levels. We adopt patent data as a measure of
innovation to be consistent with the latest studies on technology alliances (Baum, Calabrese and
Silverman, 2000; Stuart, 2000) and entrepreneurship (Ahuja and Lampert, 2001; Almeida,
Dokko and Rosenkopf, 2001).
Sample
To this end, we constructed a large, unbalanced panel of U.S. public firms during the
period 1969-1999. The panel includes all public firms that invested corporate venture capital or
patented during this period. The resulting dataset includes 1,240 firms and 22,496 firm-year
observations. The database contains information on firms’ venturing activity collected from
Venture Economic’s VentureXpert database, patenting activity from the Hall, Jaffe, and
Tratjenberg (2001) dataset derived from the U.S. Patent Office, and financial data from Standard
& Poor’s Compustat database.
To construct our database, we first identified the population of firms engaging in
corporate venturing activity through the VentureXpert database.1 The database contains a
comprehensive coverage of investment, exit, and performance activity in the private equity
industry from 1969 to 1999. We searched the population of all private equity investments for
1 The database is offered by Venture Economics, a division of Thomson Financial. The data are collected
through industry associations (European Venture Capital Association, the National Venture Capital Association, and other key associations in Asia and Australia) and the investment banking community. These data have been used in several academic studies on the venture capital industry (Bygrave 1989; Gompers 1995).

2002 G. Dushnitsky & M. Lenox 11
any investments by firms or their funds.2 This process yielded 1,417 distinct firms that pursued
venturing activity during that time period.3 For these firms, we collected data on the annual
amount of venturing investments (disbursements). Note, these amounts represent the actual
dollar value invested during a given year, and should not be confused with dollars committed to
venturing activity (usually reported in the professional media), which represent the total dollar
amount a fund has committed to invest over the fund’s life. We believe the former measure is
more appropriate given the focus of our study on the benefits of having a viable window onto
innovative ventures.
We augmented our CVC data with patenting data constructed by Hall, Jaffe, and
Tratjenberg (2001) (hereafter HJT) that are based on the U.S Patent Office database.4 We added
to our sample all U.S. firms within the same industries as those firms in our CVC dataset who
also patented over the time period 1969-1999.5 The HJT datasets contain detailed information
on almost 3 million U.S. patents granted between 1963 and 1999, all citations made to these
patents since 1974 (over 16 million), and a match of patents to Compustat. Standard & Poor’s
Compustat database was used to provide annual firm-level accounting and financial data thus
2 Some firms sponsor more than one venture fund. For multiple fund firms, fund-level data were simply
aggregated to the firm-level. We included the following VentureXpert categories: Non-Financial Corp Affiliate or Subsidiary Partnership, Venture/PE Subsidiary of Non-Financial Corp., Venture/PE Subsidiary of Other Companies NEC, Venture/PE Subsidiary of Service Providers, Direct Investor/Non-Financial Corp, Direct Investor/Service Provider, SBIC Affiliate with non-financial Corp. and Non-Financial Corp. Affiliate or Subsidiary.
3 We excluded programs that are associated with corporate pension funds. The amendment to the Employee
Retirement Income Security Act of 1979 allowed pension funds to invest into venture capital markets. Many corporate pension funds allocate a portion of their assets to venture capital investment as a result. However, this activity is distinct from other corporate venturing investments and is unlikely to result in strategic benefits such as knowledge spillovers.
4 Studies based on the HJT datasets have been published in economic journals including Quarterly Journal of
Economics, Review of Economics and Statistics, Economics of Innovation and New Technology and others. See Hall, Jaffe and Trajtenberg (2001).
5 Four-digit SIC classification was used to identify industry affiliation.

2002 G. Dushnitsky & M. Lenox 12
limiting our sample to publicly traded firms. An automated, matching algorithm and hand-
checking were used to link the VentureXpert data with the HJT patenting dataset and
Compustat.6
The resulting sample included 1,240 firms and 22,496 observations. 262 firms of these
firms invested corporate venture capital some time during the period 1969-1999. For each of
these firms, we collected annual financial data such as research expenditures and book value of
assets for the years 1969 to 1999 from Compustat. We established the annual patent output for
each firm using the HJT dataset. Approximately 116 firms of the 262 public firms from the
VentureXpert database were issued a patent over the 1969 to 1999 time frame.
Measures
We capture the rate of innovation within firms in two ways. Our first dependent variable
is simply the count of patents that a firm applied for in a given year (Patents). This is a common
measured utilized in innovation studies (Griliches, Pakes & Hall, 1987; Cockburn & Henderson,
1998; Stuart, 2000). For each firm, we recorded the annual number of patents for which it
applied between 1969 and 1999. Only patent applications that were later granted are included in
our count. We chose to use application year rather than grant year, because our main interest is to
record changes to the focal firm’s knowledge base rather than its ability and timing of
appropriating rents. There is a lag, commonly ranging from one to four years, between when a
patent is applied and when a patent is granted (Hall et al, 2001). As a result, the number of
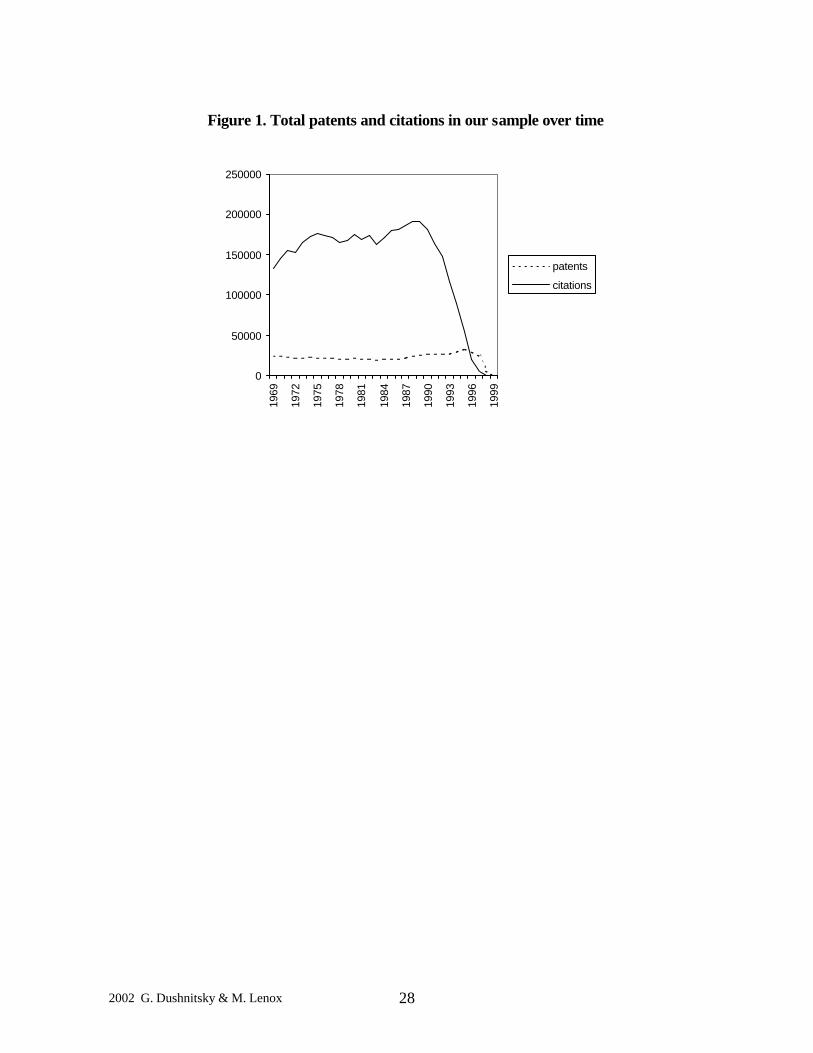
patents applied for are lower for more recent years (see Figure 1). To address any potential bias,
6 The HJT database provides not only the name of the company to which the patent was assigned but also the
ultimate (parent) firm name. Therefore, a firm with a single entry in Compustat can have multiple assignee-names on the HJT database. Since the knowledge gained through a venturing activity can be put to use in different divisions and subsidiaries of the corporation, we consider every assignee-name associated with a corporation, as long as it holds more than 50% of the original assignee.
2002 G. Dushnitsky & M. Lenox 13
year dummies are included in our models for each year in our sample, 1969-1999.
Patents counts are limited as a measure of innovation in that they fail to reflect the quality
of the patents a firm receives. Some patents are far more valuable than others. To capture patent
quality, we measure the count of forward (future) citations to patents applied for in a given year
by a firm (Citations). In doing so, we build on previous studies that have found patent citations
is a good indicator of the value of the invention (Trajtenberg, 1990; Harhoff, 1999). Hall, Jaffe
and Tratjenberg (2001) report that the distribution of forward lag in citation (i.e., the number of
years between patent’s application date and later citing-patents application date) is about 3 to 4
years. Thus our citation-weighted patents variable is truncated on the right. Patents granted in
recent years have not been available long enough to be cited by future patents (See Figure 1).
Variation in citing behavior across technological fields and along years may also bias our
citation-weighted patents variable (Hall et. al., 2001). Once again, year and firm dummies are
included in our sample to address these potential biases.7
---------------------------------------------------------
Insert Figure 1 about here
---------------------------------------------------------
Our primary independent variable is annual CVC investments in millions of dollars per
million dollar of firm assets (CVC Intensity). The numerated is calculated as the sum of all
investments via all venturing funds by a firm in a year. Control variables include annual firm
research expenditures in millions of dollars per million dollar of firm assets (R&D Intensity) and
firm size measured as total firm assets in millions of dollars (Assets). We scale both CVC
7 We also followed the ‘citation-fixed-effects’ approach of Hall et. al. (2001) and rescaled our dependent variable
by dividing the absolute number of citations made to a given patent, by the average number of citations made to all patents in the same technological group and application year. Our results are robust to this specification. See Hall et. al. (2001) for a complete discussion.

2002 G. Dushnitsky & M. Lenox 14
investments and R&D expenditures to avoid confounding these effects with firm size (Hall &
Ziedonis, 2001). We would expect that larger in-house research expenditures would lead to
greater patenting output (Henderson & Cockburn, 1996). Similarly, larger firms possess greater
resources for investing in research and thus are more likely to patent more (Schumpeter, 1942;
Cohen & Levinthal, 1989). All three variables are adjusted to 1999 dollars.
In some models, we also include a measure of the stock of patents a firm has been
granted (Patent Stock). Following Blundell, Griffith and Reene (1995), we calculate this
measure by calculating the depreciated sum of all patents applied from 1963 to the current year.8
Patent Stock it = Patents it + (1-δ) Patent Stock it-1
We include this measure to partially control for possible firm-level unobserved heterogeneity
that is not fixed throughout time. Previous studies examining patenting rates have used similar
measures (Cockburn & Henderson, 1998; Stuart, 2000).
Method
Our dependent variables (Patents and Citations) are a count of the number of patents and
citation-weighted patents applied for by a firm in a given year and as such are bound at zero and
assume only integer values. We address the discrete nature of Patents and Citations by adopting
a negative binomial model. The negative binomial model is commonly used in the patenting
literature for over dispersed count data like ours (Griliches et al, 1987). The negative binomial
model is a generalized form of a Poisson model where an individual, unobserved effect is
introduced in the conditional mean (Greene, 2000). We do not adopt a Poisson model because
8 We adopted a depreciation rate of 30% as in Blundell et. al. (1995). We experimented with other values (e.g.,
0%) and received consistent results. At a depreciating rate of 30%, patents granted prior to 1963 have little impact on 1969 Patent Stock especially given the one to four year lag between patent application and granting.
2002 G. Dushnitsky & M. Lenox 15
the assumption of constant dispersion appears violated, i.e. the mean and variance of the event
count are not proportional.9 A Lagrange multiplier test of overdispersion proposed by Cameron
& Trivedi (1998) was used to test this assumption.10
In our model, we include both firm and year fixed-effects to address possible unobserved
heterogeneity. Firm fixed-effects were adopted to control for unobserved, time-invariant firm-
level characteristics that may in part be driving patent activity within the firm. Year fixed-effects
are included to control for macroeconomic trends such as economic downturns that may
ultimately affect overall patenting levels. Year fixed-effects also control for yearly variations in
patent and patent citation rates as a result of right truncation of the data.11
We assume a one-year lag between our regressors and dependent variables. In other
words, we examine the association between last year’s corporate venture capital investments and
this year’s patenting levels. This is done to provide evidence of temporal precedence between
CVC activity and firm innovation levels. We do not include lags of greater than one year
because previous research looking at the relationship between research expenditures and firm
patenting have found high within firm correlation of R&D over time (Hall & Zedonis, 2001).
Experimentation with lagged values of CVC investments for our data generated results consistent
with this finding.
In summary, we adopt a negative binomial specification with firm and year fixed-effects
and one-year lagged independent variables. The expected number of patents given a set of
9 To increase confidence in our results, we also ran our various models using a Poisson specification and found
consistent results. The Poisson models may be provided by the authors upon request. 10 The LM test was operationalized using a likelihood ratio test in Stata version 7.0. A significant χ2 statistic is
interpreted as a rejection of the base hypothesis of constant dispersion. 11 We also experimented with limiting our sample to prior to 1995 as a way to address the truncation issue and
found consistent results.

2002 G. Dushnitsky & M. Lenox 16
independent variables may be given by,
E[ Patentsit | Xit-1] = λit = exp(β’Xit-1 + αi + γt + νi + ε it)
where Xit-1 represents our set of time-variant firm characteristics including CVC Intensity, αi is a
set of firm dummies, γt is a set of year dummies, and νi is the individual, unobserved effect of the
negative binomial model.
Analysis & Results
Figure 2 presents a summary of total annual investment in new ventures by corporations
during the period 1969 to 1999. We observe that corporate venturing activity has gone through
three waves in the last thirty years. The first wave peaked in the early seventies. Activity
declined until approximately 1978, when changes in legislation led to an increase in venturing
investments by firms. This second wave peaked around 1986 with total annual investment at
approximately $250 million per year. Investments declined sharply after the stock crash of 1987
to a level of $25 million in 1993. The third wave began with the rise of the Internet in the mid-
nineteen nineties. By 1999, the last year in our sample, investments by established firms in new
ventures reached a record level of nearly $4 billion.
---------------------------------------------------------
Insert Figure 2 about here
---------------------------------------------------------
Table 1 presents a summary of the investment activity of the twenty largest venturing
firms in our sample in terms of total cumulative dollars invested. Intel leads the list with total
investments approaching $1.5 billion since 1992. The top twenty is dominated by the largest
electronics and computer concerns such as Microsoft, Sony, Motorola, AOL, and Dell. Johnson

2002 G. Dushnitsky & M. Lenox 17
& Johnson is the first pharmaceutical firm to appear in the top twenty at the thirteenth position
with cumulative investments approximating $196 million. The relatively lower investment
levels by pharmaceutical firms may simply capture the inclination of these firms towards non-
equity inter-organizational arrangements (Pisano, 1991; Baum et al, 2000; Rothaermel, 2001). A
majority of the top twenty firms have started their corporate venturing funds after 1993. A few
have been engaged in corporate venturing since the sixties including Xerox, Johnson & Johnson,
and Motorola. A handful of firms including Intel, Sony and Xerox have numerous funds with
which to distribute funds.
---------------------------------------------------------
Insert Table 1 about here
---------------------------------------------------------
Table 2 presents definitions, descriptive statistics, and the correlation matrix for the
variables in our patent count model. To make full use of our data, we examine patenting activity
over the entire panel, 1969-1999. For each of our independent variables, we use the natural log
of each of these variables. We observe that firms, on average, are granted 17.3 patents per year
and receive approximately 6 citations per patent. However, these numbers are skewed by the
relatively few firms who patent in great numbers. In general, CVC Intensity varies from 0% to
28% in absolute terms. The correlations between independents variables were not deemed high
enough to warrant concern of multicollinearity.
---------------------------------------------------------
Insert Table 2 about here
---------------------------------------------------------
2002 G. Dushnitsky & M. Lenox 18
Table 3 presents estimates from various specifications of our model. In Model 1, we
estimate a fixed-effect, negative binomial specification using Patents as our dependent variable.
For simplicity, we do not present the coefficient estimates for the firm and year dummies. We
find not surprisingly that larger firms, ln(Assets), who engage in more research, ln(RD Intensity),
have higher patenting rates in the next year. While we estimate a positive coefficient for the log
of CVC Intensity, we are not confident in this estimate at even a 90% level. Thus, we do not find
evidence that CVC investments have a significant impact on future absolute patenting levels
within firms.12
---------------------------------------------------------
Insert Table 3 about here
---------------------------------------------------------
Perhaps CVC investment does not impact the quantity of patents but rather the quality of
patents. In Model 2, we estimate a fixed-effect, negative binomial specification using Citations
as our dependent variable. We find once again that the coefficient estimates of Assets and RD
Intensity are positive and highly significant (p < 0.001). We also find, in contrast to our previous
model, that CVC Intensity has a positive, significant coefficient estimate. Interestingly, the
magnitude of the coefficient estimates suggests that CVC investments have a greater return in
term of quality patents than R&D expenditures. This provides evidence that not only do CVC
investments have a positive spillover to firm innovation but that the impact of such investment is
similar to research spending.
One of the tradeoffs in using the conditional fixed-effects, negative binomial
specification is that firms who never patented over the time period are removed from the sample.
12 We do find that the absolute level of CVC has a positive, significant coefficient on Patents. This is likely due,
however, to the correlation between CVC and Firm Assets.
2002 G. Dushnitsky & M. Lenox 19
Out of the 214 firms removed from the sample for this reason, 146 firms (68%) had conducted
some level of CVC investment during the thirty-year period. The exclusion of firms who engage
in CVC but never patent may seriously bias our results. To address this potential bias, we adopt
a random-effects specification of our negative binomial model. The random-effects specification
has the advantage that we may use the full sample in our estimation. By adopting a random-
effects specification, we assume that the regressors and the firm-specific effects are uncorrelated.
The literature exhibits no strong preference for random-effects or fixed-effects in limited,
dependent variable models such as the negative binomial (Green, 2000).
In Model 3, we estimate our model using Citations as the dependent variable and a
random-effects specification.13 Our results are consistent with the fixed-effects specification.
We find positive, significant coefficients for the log of CVC Intensity, RD Intensity, and Assets.
Once again, the coefficient estimate for CVC Intensity is greater than RD Intensity. Thus, our
estimates for the larger sample are consistent with our estimates for the reduced sample.
In Model 4, we include Patent Stock as an additional control for unobserved
heterogeneity. Previous work has proposed that the stock of previous firm patents is a good
proxy of underlying firm innovation (Blundell et. al. 1995; Henderson & Cockburn, 1996; Stuart,
2000). While our fixed and random effect specifications will pick up time-invariant firm
characteristics, there may still exist firm specific effects that vary over time. We include Patent
Stock as an additional control for these effects. Our estimates are consistent with Models 2 and
3. We once again find a significant, positive effect of CVC investments on the quality of firm
13 Our overdispersion test statistic is presented in Models 3 through 6 of Table 3. The significance of these
estimates indicate a rejection of the hypothesis of constant dispersion and a preference for negative binomial over Poisson. For comparison, Table A1 of the Appendix, presents model estimates for the Poisson model. Note that our results are strengthened with such a specification.

2002 G. Dushnitsky & M. Lenox 20
patenting. In addition, we also find once again that large firms who invest in research, patent
more. Finally, we find that Patent Stock has a significant, positive effect on future patent levels.
One potential factor that may bias our results is the possibility that firms self-select to
invest in new ventures. In the presence of self-selection, our coefficient estimates may be
overstating the direct impact of CVC investment and reflecting underlying differences between
firms who invest and those who do not. Once again, while our fixed effect specification will
control for stable firm differences, they will not control for time-variant factors that affect the
desire to pursue CVC investment and the desire to increase patenting. To directly address the
self-selection issue, in Models 5, we limit our sample only to those firms that invest corporate
venture capital during our thirty-year time period. Thus, our estimates reflect the impact greater
CVC investment has on quality patenting given that a firm chose to make CVC investments. We
once again control for firm size and R&D intensity.
In Model 5, we estimate a random-effect, negative binomial specification using Citations
as our dependent variable. We find once again a positive, significant coefficient estimate for
Citations. Thus, we first find that firms who purse corporate venture capital exhibit more quality
patenting, compared to firm’s who do not (models 2-4), and second that among those firms who
invest corporate venture capital, we find that greater CVC investment increases the future output
of quality patents (model 5). That is, a firm’s output of quality patenting is associated not only
with the existence of CVC investment effort, but also with the magnitude of the investments.
In summary, we find consistent evidence that increased corporate venture capital
investment is associated with higher future citation-weighted patenting levels. Interestingly, the
magnitudes of the coefficient estimates suggest that CVC investments may have a greater return
in terms of quality patents than R&D expenditures. This is perhaps not surprising. By investing
2002 G. Dushnitsky & M. Lenox 21
in entrepreneurial ventures, the corporation encounters novel and pioneering technologies that
they may not be exposed to from internal R&D. If firms’ experience with pioneering
technologies is associated with increases in the likelihood of creating subsequent inventions
(Ahuja et al, 2001), externally-focused CVC investment may be considered at least as effective
as firm’s internal R&D efforts in advancing the firm’s absorptive capacity.
As with all analysis, we should be cautious in interpreting our results. We cannot
guarantee that the causality does not run the other way or perhaps that patenting and corporate
venture capital are jointly determined by some unobserved, time-variant factor. We adopt
lagged independent variables and include the stock of past patents in an attempt to address these
concerns. We also examine the sub-sample of firms who pursue CVC investments as a way to
address self-selection issues.
We should be cautious in the generalizability of our findings. We must recognize, once
again, that firms self-selected to pursue CVC investments. While these firms may (as our results
suggest) see increases in their citation levels as they increase CVC investment, this does not
necessarily mean that other firms would experience similar increases if they also choose to invest
in new ventures. Firms may require certain resources or capabilities to realize the innovation
benefits from corporate venture capital.
Finally, a number of authors have proposed that the performance of corporate venture
capital programs may in part be determined by the structure of the programs themselves (Block
& MacMillan, 1993; Siegel et al, 1988; Thornhill & Amit, 2000). Firms may espouse different
goals when they establish corporate venture capital programs. For example, firms that pursue
new ventures so as to increase existing product sales (as opposed to creating a window on new
technology) have been found to elicit negative reactions from equity markets (Dushnitsky, 2001).

2002 G. Dushnitsky & M. Lenox 22
Firms may also vary in the governance structures they adopt for corporate venturing programs.
CVC investment may either be direct or indirect (e.g., as a limited partner with a venture capital
fund). In some instance, corporate venture capital programs may take the form of a wholly-
owned subsidiary, dedicated solely to new venture investments (Maula and Murray, 2000).
While we do not have data on program goals or structures, to the extent that the
governance of corporate venture capital programs is relatively constant within individual firms
across time, our fixed-effect specification should control for this unobserved heterogeneity. On
the other hand, if firms change the goals and structures of their programs over time we may fail
to observe some interesting variance in patenting outcomes as a result. We leave the exploration
of changing program structures to future study.
Conclusion
Does participation in venture capital markets allow firms to access knowledge from
entrepreneurial ventures that lead to innovation? To address this question, we explored the
relationship between corporate venture capital investment and incumbent firm innovation by
analyzing whether investments by approximately twelve hundred public firms over a thirty-year
period led to increases in firm patenting rates. Our findings suggest that the level of citation-
weighted patenting-output is positively related to the intensity of CVC investment during the
preceding year. This finding is robust to different specifications and the inclusion of firm R&D
expenditures and size. In addition, we have some evidence that the return to CVC investments in
terms of patenting is greater than for R&D. Based on these results, we posit that corporate
venture capital investment might have a greater impact on a firm’s absorptive capacity than
research and development.

2002 G. Dushnitsky & M. Lenox 23
The findings of this study raise some interesting questions about the governance of
corporate venture capital programs. If established firms are able to appropriate knowledge from
new ventures through equity investment, there are incentives for new ventures to seek alternative
sources of funding such as traditional venture capital. As a consequence, firms may have to pay
a premium to gain access to new ventures relative to other capital sources. To avoid these
premiums, firms may institute various structural mechanisms to allay fears of opportunism. The
likely impacts on governance will be the subject of future studies.
Finally, the findings of this study have important implications for the role of corporate
venture capital programs in firms’ overall innovation strategies. While alternative inter-
organizational forms such as technology alliances have been found to be important sources of
external knowledge (Powell, Koput & Smith-Doerr 1996; Stuart, 2000), corporate venture capital
programs have been the subject of little formal, empirical analysis. We conjecture that venturing
activity might serve to satisfy incumbent firms’ inclination towards introducing innovations by
accessing an increasingly important source of knowledge -- competent entrepreneurial startups.
The transformation that have transpired at the outset of the 21st century favoring human capital in
the process of knowledge generation has lead to an increasing role for entrepreneurial startups in
innovation. Corporate venture capital programs may be instrumental in harvesting innovations
from entrepreneurial ventures and thus constitute a significant part of a firm’s overall innovation
strategy. Placing our finding into the context of the greater strategy literature on established
firms’ entrepreneurial behavior (e.g., Guth and Ginsberg, 1990), corporate venturing activity has
become a vital part of a firm’s entrepreneurial toolbox.

2002 G. Dushnitsky & M. Lenox 24
References
Ahuja, G. 2000. The duality of collaboration: inducements and opportunities in the formation of interfirm linkages. Strategic Management Journal 21(3) 317-343.
Ahuja, G, C. Lampert. 2001. Entrepreneurship in the large corporation: a longitudinal study of
how established firms create breakthrough inventions. Strategic Management Journal 21 267-294.
Almeida, P., G. Dokko, L. Rosenkopf. 2002. Startup size and the mechanisms of external
learning: increasing opportunity and decreasing ability? Research Policy (Forthcoming). Almeida, P., B. Kogut. 1999. Localization of knowledge and the mobility of engineers in
regional networks. Management Science 45(7) 905-917. Arrow, K. 1962. Economic welfare and the allocation of resources for innovations. Nelson ed.,
The Rate and Direction of Incentive Activity: Economic and Social Factors. Princeton University Press: Princeton, NJ.
Arrow, K. 1974. The limits of organization. New York: Norton. Baum, J., T. Calabrese, B. Silverman. 2000. Don't go it alone: Alliance network composition
and startups' performance in Canadian biotechnology. Strategic Management Journal 21 267-294.
Block, Z., I. MacMillan. 1993. Corporate Venturing: Creating New Business Within the Firm.
Harvard Business School Press: Boston, MA. Blundell R., R. Griffith, J. Reene. 1995. Dynamic count data models of technological
innovation. Economic Journal 105 333-344. Burgelman, R. 1983. A process model of internal corporate venturing in the diversified major
firm. Administrative Science Quarterly 28 223-245. Business Wire. Nokia launches Nokia Ventures. 4/24/1998. Cameron, C., P. Trivedi. 1998. The Analysis of Count Data. New York: Cambridge University
Press, 1998. Cockburn I., R. Henderson. 1998. Absorptive capacity, coauthoring behavior, and the
organization of research in drug discovery. The Journal of Industrial Economics 46(2) 157-183
Cohen, W., D. Levinthal. 1990. Absorptive capacity: a new perspective on learning and
innovation. Administrative Science Quarterly 35(1) 128-152.

2002 G. Dushnitsky & M. Lenox 25
Dushnitsky, G. 2002. Does it pay to have a window? Corporate venturing objectives and organizational wealth creation. Mimeo.
Garud, R., A. Van de Ven. 1992. An empirical evaluation of the internal corporate venturing
process. Strategic Management Journal 13(special issue) 93-109. Gompers, P., J. Lerner. 1998. The determinants of corporate venture capital success:
organizational structure, incentives and complementarities. NBER #6725: Cambridge, MA. Greene, W. 2000. Econometric Analysis. Prentice-Hall Inc.: Upper Saddle River, NJ. Griliches, Z, A. Pakes, B. Hall. 1987. The value of patents as indicators of inventive activity.
Dasgupta, Stoneman, eds. Economic Policy and Technological Performance. Cambridge University Press: New York, NY.
Grossman, R., O. Hart. 1986. The costs and benefits of ownership: A theory of vertical and lateral integration. Journal of Political Economy 94(4) 691-719.
Guth, W., A. Ginsberg. 1990. Guest editor’s introduction: Corporate entrepreneurship. Strategic
Management Journal 11(special issue) 5-15. Hagedoorn, J., J. Schakenraad. 1994. The effect of strategic technology alliances on company
performance. Strategic Management Journal 15(4) 291-309. Hall, B., A. Jaffe, M. Tratjenberg. 2001. The NBER patent citation data file: Lessons, insights
and methodological tools. NBER Working Paper #8498. Cambridge, MA. Hall, B., R. Zedonis. 2001. The patent paradox revisited: An empirical study of patenting in the
US semiconductor industry 1979-1995. RAND Journal of Economics 32(1) 101-128. Hamel, G. 2000. Leading the Revolution. Harvard Business School Press: Boston, MA. Henderson, R. 1993. Underinvestment and incompetence as responses to radical innovation:
Evidence from the photolithographic alignment equipment industry. The Rand Journal of Economics 24(2) 248-271.
Henderson, R., I. Cockburn. 1994. Measuring competence? Exploring firm effects in
pharmaceutical research. Strategic Management Journal 15 63-84. Henderson, R., I. Cockburn. 1996. Scale, scope and spillovers: The determinants of research
productivity in drug industry. The Rand Journal of Economics 27(1) 32-59. Harhoff, D., F. Narin, F. Scherer, K. Vopel. 1999. Citation frequency and the value of patented
inventions. Review of Economics and Statistics 81(3) 511-515. Kortum, S., J. Lerner. 2000. Assessing the contribution of venture capital to innovation? The
Rand Journal of Economics 31(4) 674-692.
2002 G. Dushnitsky & M. Lenox 26
Maula, M., G. Murray. 2000. Corporate venture capital and the creation of US public companies.
Presented at the 20th Annual International Conference of The Strategic Management Society.
McGrath, R. 1999. Falling forward: Real options reasoning and entrepreneurial failure. Academy
of Management Review 24(1) 13-30. Pisano, G. 1991. The governance of innovation: Vertical integration and collaborative
arrangements in the biotechnology industry. Research Policy 20 237-249. Powell, W., K. Koput, D. Smith-Doerr. 1996. Interorganizational collaboration and the locus of
innovation: Networks of learning in biotechnology. Administrative Science Quarterly 41 116-145.
Reinganum, J. 1989. The timing of innovation: Research, development and diffusion. In R.
Schmalensee, R. Willig, eds. The Handbook of Industrial Organization. North-Holland: New York, NY.
Rind, K. W. 1981. The role of venture capital in corporate development. Strategic Management
Journal 2 169-180. Roberts, P. 1999. Product innovation, product-market competition and persistent profitability in
the US pharmaceutical industry. Strategic Management Journal 20(7) 655-670. Rosenkopf, L., A. Nerkar. 2001. Beyond local search: Boundary-spanning, exploration, and
impact in the optical disc industry. Strategic Management Journal 22 287-306. Rothaermal, F. 2001. Incumbent's advantage through exploiting complementary assets via
interfirm cooperation. Strategic Management Journal 22 687-699. Saxenian, A. 1990. Regional networks and the resurgence of silicon valley. California
Management Review 33 89-113. Schumpeter, J. 1942. Capitalism, Socialism and Democracy. Harper & Row: New York, NY. Shane, S. 2001a. Technological opportunities and new firm creation. Management Science 47(2)
205-220. Shane, S. 2001b. Technology regime and new firm formation. Management Science 47(9) 1173-
1190. Shrader, S. 1997. Corporate vs. independent new ventures: Resources, strategy and performance
differences. Journal of Business Venturing 12(1) 47-66.

2002 G. Dushnitsky & M. Lenox 27
Siegel, R., E. Siegel, I. MacMillan. 1988. Corporate venture capitalists: Autonomy, obstacles and performance. Journal of Business Venturing 3 233-247.
Sorrentino, W. 1995. Relatedness and corporate venturing: Does it really matter? Journal of
Business Venturing 10(1) 59-73. Stuart, T. 2000. Interorganizational alliances and the performance of firms: A study of growth
and innovation rates in a hi-technology industry. Strategic Management Journal 21(8) 791-811.
Stuart, T., Hoang , Hybels 1999. Interorganizational endorsements and the performance of
entrepreneurial ventures. Administrative Science Quarterly 44 315-349. Sykes, H. 1990. Corporate venture capital: Strategies for success. Journal of Business Venturing
5(1) 37-47. Teece, D. 1986. Profiting from technological innovation: Implication for integration,
collaboration, licensing and public policy. Research Policy 15 285-305. Thornhill, S., R. Amit. 2000. A dynamic perspective of internal fit in corporate venturing.
Journal of Business Venturing 16 25-50. Trajtenberg M. 1990. A penny for your quotes: Patent citations and the value of information.
RAND Journal of Economics 21 325-342. Tushman, M., P. Anderson. 1986. Technological discontinuities and organizational
environments. Administrative Science Quarterly 31(3) 439-365. Venture Capital Investment in Israeli Companies. International Business Forum. March 27-28,
2001. Venture Economics. 2001. http://www.ventureeconomics.com/. Zingales, L. 2000. In search of new foundations. Journal of Finance 55(4) 1623-53.
2002 G. Dushnitsky & M. Lenox 28
Figure 1. Total patents and citations in our sample over time
0
50000
100000
150000
200000
250000
1969
1972
1975
1978
1981
1984
1987
1990
1993
1996
1999
patents
citations

2002 G. Dushnitsky & M. Lenox 29
Figure 2. Annual corporate venture capital investments (1969-1999)
0
100
200
300
400
500
600
700
800
900
1000
1969
1971
1973
1975
1977
1979
1981
1983
1985
1987
1989
1991
1993
1995
1997
1999
Year
Con
stan
t 19
99 $
Má 3984

2002 G. Dushnitsky & M. Lenox 30
Table 1. Activity summary of twenty largest venturing firms (1969-1999)
Firm Year Began
Investing
Maximum Annual
Ventures
Total Dollars
Investeda
Maximum Annual
Investeda
Average Annual Rounds
Total Venture
Funds Intel 1992 179 1486 771 57 5
Cisco 1995 55 1056 730 19 1 Microsoft 1983 29 713 436 7 1 Comdisco 1992 70 554 334 24 2
Dell 1995 48 502 395 26 1 MCI Worldcom 1996 11 495 410 8 1
AOL 1993 39 333 169 10 2 Motorola 1963 33 315 177 11 1
Sony 1984 30 313 169 7 6 Qualcomm 1999 5 262 207 5 1 Safeguard 1983 21 231 118 6 3 Sun Micro 1999 31 204 180 19 1
J & J 1961 21 196 80 5 2 Global-Tech 1999 13 188 122 11 1
Yahoo 1997 5 186 163 3 1 Xerox 1960 30 184 24 13 6
Compaq 1992 21 182 113 5 3 Citigroup 1999 11 156 93 9 1
Ford Motor 1951 22 146 125 8 4 Comcast 1996 16 144 84 11 1
a In millions of dollars.

2002 G. Dushnitsky & M. Lenox 31
Table 2. Descriptive statistics for patent rate models
Variable Description Mean Std. Dev. Min Max 1 2 3 4 5 6 1. Patents Count of new patents applied for by a
firm in each year 16.752 68.953 0 2405 1.00
2. Citations Citation-weighted new patents applied for by a firm in each year
107.549 464.360 0 12795 0.80 * 1.00
3. ln(CVC Intensity) Natural log of total annual investment in new ventures divided by total assets
0.001 0.003 0 0.24 0.01 0.00 1.00
4. ln(RD Intensity) Natural log of total annual research expenditures divided by total assets
0.047 0.065 0 0.69 0.04 * 0.05 * 0.00 1.00
5. ln(Assets) Natural log of total assets of firm ($M)
5.953 2.233 0.47 13.47 0.33 * 0.31 * -0.02 -0.23 * 1.00
6. Patent Stock Depreciated count of patents issued to a firm from 1963 till year t
50.929 199.137 0 6142 0.96 * 0.77 * -0.01 0.03 * 0.35 * 1.00
n = 22496 * p < 0.01

32
Table 3. Firm patenting levels (1969-1999)
Specification Fixed-Effects Negative Binomial
Random-Effects Negative Binomial
Dependent Variable Patents t Citations t Citations t Citations t Citations t
Model 1 2 3 4 5
ln(CVC Intensity) t-1 10.550 * (5.095)
13.312 * (5.344)
9.394 * (5.003)
9.236 * (4.969)
9.851 * (5.539)
ln(RD Intensity) t-1 0.123 (0.164)
2.118 *** (0.147)
2.155 *** (0.145)
2.059 *** (0.144)
0.283 (0.187)
ln(Assets) t-1 0.195 *** (0.008)
0.293 *** (0.006)
0.286 *** (0.006)
0.266 *** (0.006)
0.268 *** (0.015)
Patent Stock t-1 0.001 *** (0.000)
Year dummies Included included Included included included
Observations 18503 a 18503 a 22496 22496 6403 b Firms 1026 1026 1240 1240 262 Wald χ2 2022 *** 3160 *** 3122 *** 3795 *** 849 *** Overdispersion test 18000 *** 16000 *** 6998 *** All independent variables are lagged one year. Standard errors in parentheses. * p < 0.10, ** p < 0.01, *** p < 0.001 a Sample is reduced due to the removal of firms who never patented over the time period b Sample is reduced to only those firms who make CVC investments