corrected final report 2006
TRANSCRIPT

Freeze-Flame Nano
Capstone Design Project
Spring 2006
5/5/06
University of Oklahoma Chemical Engineering
KVTV Inc. Keshan Velasquez
Tyler Viani

1
Executive Summary
KVTV has developed a new phosphorus based flame retardant thermoplastic named Freeze Flame Nano. This flame retardant has been developed to revolutionize the building construction industry. Great Lakes Chemical, the former producer of pent-bromodiphenyl ether and octa-bromodiphenyl ether has recently stopped production of these two leading flame retardants. These brominated flame retardants have shown increased signs of bioaccumulation. Likewise, these retardants have banned because of their toxic byproducts: dioxins and furans. Freeze Flame Nano has none of the functional groups that cause toxins to exist in the environment. KVTV’s product is a coating that can be applied on the surface of a multitude of different woods, plastics and home furnishings. The thermoplastic product acts in the solid phase as a protective barrier that can withstand intense heat inputs. The barrier slows the release of potentially toxic and combustible vapors normally released from burning materials. Also, the phosphoric acid existing in the polymer blend serves to induce an added char barrier that further inhibits vapor release. KVTV created Freeze Flame Nano through researching modern flame retarding techniques. NASA has been studying the effects of thermosets and thermoplastic coatings on their re-entry vessels. Thermoplastics easily adhere to numerous surfaces and resist high heat inputs. Unlike thermosets, thermoplastics can be melted and remolded. Similarly, they have increased moduli of elasticity and lowered glass transition temperatures. Although the values have not been experimentally determined, it is expected that Freeze Flame Nano will have extremely low vapor pressures at high temperatures as well as have high enthalpies of vaporization, resulting in better flame retardancy. The flame retardant coating that KVTV is proposing consists of 50% polyvinyl alcohol, 15% phosphate, 3% Cloisite, and 32% water. A market analysis was performed to determine the demand that KVTV can capture. It was determined that the maximum demand that Freeze Flame Nano could capture would be 6.7 million pound per year. KVTV recommends that the production plant for Freeze Flame Nano be built in Corpus Christi, Texas. The total capital investment for this process is $1.7 million. The net present worth of this ten year venture is $15.3 million.

2
Table of Contents 1.0 Introduction................................................................................................................... 6
1.1 Background............................................................................................................... 6 1.2 How Flame Retardants Work.................................................................................... 6 1.3 The Combustion Process........................................................................................... 7
1.3.1 Combustion of Hydrocarbons ............................................................................ 7 1.3.2 Combustion of Wood......................................................................................... 8 1.3.3 Combustion of Polymers.................................................................................. 10
1.4 Flame Retarding Pathways ..................................................................................... 11 2.0 Flame Retardant Families ........................................................................................... 14
2.1 Halogenated Flame Retardants ............................................................................... 14 2.2 Phosphorus Flame Retardants................................................................................. 15 2.3 Nitrogen Flame Retardants ..................................................................................... 17 2.4 Inorganic Flame Retardants .................................................................................... 17
3.0 The Flame Retardant Market ...................................................................................... 19 3.1 Global Market ......................................................................................................... 19 3.2 United States Market............................................................................................... 19 3.3 Flame Retardant Coatings....................................................................................... 19 3.4 Market Projections .................................................................................................. 20
4.0 Problem Statement ...................................................................................................... 21 5.0 Our Product................................................................................................................. 23
5.1 Pathway to Discovery ............................................................................................. 23 5.1.1 Statistical Method ............................................................................................ 23 5.1.2 Use of Thermoplastics ..................................................................................... 24
5.2 Synthesis Path ......................................................................................................... 25 5.3 Retarding Mechanism ............................................................................................. 28 5.4 Happiness................................................................................................................ 29
6.0 Business Model........................................................................................................... 36 6.1 Calculating Demand................................................................................................ 36
7.0 Business Plan .............................................................................................................. 41 7.1 Organizational Plan................................................................................................. 41
7.1.1 Company Description ...................................................................................... 41 7.1.2 Our Product...................................................................................................... 41 7.1.3 Plant Location .................................................................................................. 42 7.1.4 Management..................................................................................................... 42 7.1.5 Personnel.......................................................................................................... 42 7.1.6 Insurance .......................................................................................................... 43 7.1.7 Security ............................................................................................................ 43
7.2 Marketing Plan........................................................................................................ 43 7.2.1 Market Analysis ............................................................................................... 43 7.2.2 Market Trends.................................................................................................. 44 7.2.3 Marketing Strategy........................................................................................... 44
7.3 Financial Plan.......................................................................................................... 45 7.3.1 Financial Need ................................................................................................. 45 7.3.2 Cash Flow Statement ....................................................................................... 45 7.3.3 Projected Balance Sheet................................................................................... 46

3
7.3.4 Break-Even Analysis ....................................................................................... 46 7.3.5 Risk Associated with Investing........................................................................ 47 7.3.6 Supporting Financial Documents..................................................................... 48
8.0 Conclusions and Recommendations ........................................................................... 51 8.1 Conclusions............................................................................................................. 51 8.2 Recommendations................................................................................................... 51
9.0 References................................................................................................................... 52 Appendix........................................................................................................................... 54

4
List of Tables Table Number Page Number Table 1: Zonal Analysis of Pyrolysis in Wood ………………………………………….9 Table 2: Zonal Analysis of Combustion in Wood ………………………………………9 Table 3: Lydersen Predicted Critical Constants ..............................................................23 Table 4: Relative weights assigned …………………………………………………….35 Table 5: Calculated demand over 10-year life cycle …………………………………...37 Table 6: Comparison of design scenarios and their effective NPW ……………………38 Table 7: Regret analysis results ………………………………………………………...39 Table 8: Equipment Specifications ……………………………………………………..39 Table 9: Target Consumers ……………………………………………………………..42 Table 10: Balance Sheet ………………………………………………………………...45 Table 11: Variability in Profit …………………………………………………………..47 Table 12: Total Capital Investment ..................................................................................47 Table 13: Total Annualized Cost ………………………………………………………..48
5
List of Figures Figure Number Page Number Figure 1: General combustion reaction stoichiometry …………………………………7 Figure 2: Combustion of Isobutanol …………………………………………………...8 Figure 3: Pyrolysis and Combustion Pathway of Plastics …………………………….11 Figure 4: General Life-Cycle of a Fire ………………………………………………..12 Figure 5: Life Cycle of a Fire with Flame Retardant ………………………………….13 Figure 6: Initiation step for phosphate based flame retardants ………………………..15 Figure 7: Formation of polyphosphate barrier…………………………………………16 Figure 8: Esterification stage ………………………………………………………….16 Figure 9: Charring stage ……………………………………………………………….16 Figure 10: Global Market Breakdown …………………………………………………19 Figure 11: Chemical Structures of A) PBBs, B) PBDEs, C) HBCD, D) TBBPA …….21 Figure 12: Chemical Structure of A) Dioxin B) Furan ………………………………..22 Figure 13: Saponification of PVAc with NaOH to form PVOH ……………………...26 Figure 14: Polar mixing of PVOH and cloisite. ……………………………………….26 Figure 15: A) Polymer blend B) Legend ……………………………………………….27 Figure 16: Proposed process flow diagram …………………………………………….28 Figure 17: Flame retardant protection pathway ………………………………………...29 Figure 18: Overall happiness relative to changes in consumer attributes ………………31 Figure 19: Cash Balance for KVTV, Inc. ………………………………………………44 Figure 20: Break-Even Analysis ………………………………………………………..46 Figure 21: Risk Distribution ……………………………………………………………47
6
1.0 Introduction
1.1 Background
Fire-related disasters have affected many and are a potential threat to any member in
society. According to the United States Fire Administration1, approximately 150,000 fires
were reported in 2004, and at least 2.5% of those fires resulted in civilian casualties.
Likewise, 76%2 of structural fires in 2001 resulted in varying residential property
damage. Over the past ten years, there has been an overall decrease in number of fires
reported per year, and an even greater decreasing trend in the amount of deaths resulting
from fire; therefore, the development and implementation of flame retardants can, on the
whole, help to maintain this decreasing trend. Since surveys show that most people claim
to feel safest from fire danger in their home, it seems only wise to develop better means
to protect them. Many products currently existing on the market have lessened the
impacts of fire damage, but with increasing need for fire prevention and safety at the job
and home has come an increased search for fire preventing/flame retarding
methods/products that are both extremely effective and environmentally friendly. The
ultimate driving force in the flame retardant industry is to save lives.
1.2 How Flame Retardants Work
Flame retardants work through a number of different mechanisms. The ultimate goal
is to decrease the potential of ignition or to delay the spread of a flame over the body of
material the retardant is protecting. This is accomplished by increasing the combusting
resistance of the materials to continue burning. Flame retardants are applied in a number
of different methods. They can be impregnated into plastics during processing, blended
with insulation materials during application, used as treatments on shingles and decks and
applied on the surface of materials as coatings or paints.
There are four major families of flame retardants currently existing on the market,
and each of the four categories retards the flame through a different mechanism. The
molecular structure of a flame retardant, the functional group arrangement and the

7
thermodynamic properties determine whether it will resist higher temperatures, lessen the
release of combustible vapors, increase the level of char, or generically decrease the
spread of the flame.
1.3 The Combustion Process
A combustion reaction takes place when a combustible material in an oxygen rich
environment encounters a heat source. If the heat source’s intensity is large, the material
reaches an auto-ignition temperature and combusts. Since combustion reactions are
largely exothermic, both heat and combustible vapors are released at a high rate during
the process. If reaction conditions and the molecular energetics are conducive to
combustion, a material continues to degrade at elevated temperatures and release heat
until the material is consumed. One major feature of combustion is the occurrence of
pyrolysis, or the decomposition of organic material in the absence of oxygen. As a result
of pyrolysis, a combusting material can continue to burn in environments with relatively
low oxygen concentrations.
1.3.1 Combustion of Hydrocarbons
The combustion of hydrocarbons occurs predominately in the vapor phase. A vast
majority of unsubstituted alkanes, alkenes and alkynes readily exist as vapors at room
temperature, and they are often volatile species. In the presence of a significant amount of
oxygen and with substantial heat input, hydrocarbons ignite and propagate to other
molecules. The general form of a combustion reaction is shown in figure 1. A combustion
reaction results in a flame which propagates throughout the material and spurns further
burning of the material.
Figure 1: General combustion reaction stoichiometry
Longer and more substituted hydrocarbon molecules are not as volatile simple
hydrocarbons; therefore, they are less likely to move into the vapor phase and combust.
( ) )(2)(2)(2)( 224)( vapgggnm OHnCOmOnmHC ⎟
⎠⎞
⎜⎝⎛+→⎟
⎠⎞
⎜⎝⎛ +
+−−

8
Similarly, as hydrocarbon chains increase in size, dipoles are induced resulting in larger
Van der Waals interactions3 in the hydrocarbon mixture. Increased interactions further
stabilize the reactive system and decrease the probability that a combustion reaction
reaches completion.
Complete combustion occurs when an unsubstituted hydrocarbon is reacted to form
only CO2 and H2O vapors. When combusting substituted hydrocarbons, the products of
the reaction are stoichiometrically equivalent to that found in the original molecule. Take
for instance the combustion of isobutanol:
Figure 2: Combustion of Isobutanol
Sometimes when molecules induced dipole-dipole interactions are large enough and
there is insufficient energy to lead to complete combustion, a molecule may undergo
partial (incomplete) combustion. Incomplete combustion often results in toxic side
products, namely carbon monoxide.
1.3.2 Combustion of Wood
The combustion of wood is slightly more complex than that of hydrocarbon
combustion. Wood, in general, has much higher thermal resistances than many other
combustible materials. As a result, the burning of wood exhibits dynamic behavior. The
precursor to the ultimate combustion of wood is pyrolysis. Experiments performed reveal
that the pyrolysis pathway occurs via different temperature zones. Table 1 analyzes the
different zones that occur during pyrolysis and summarizes the behavior of wood within
each of the zones.
)(2)(2)(2)(104 546 vapggg OHCOOOHC +→+

9
Table 1: Zonal Analysis of Pyrolysis in Wood
Zone Temperature Range, T(oC) Description A T < 200 1) Surface Dehydration
2) Release trace H2O/CO2 vapors
B 200 < T < 280 1) Pyrolysis continues, more H2O/CO2 emitted
2) Rxn remains endothermic
C 280 < T < 500 1) Rxn becomes exothermic, temperature rises sharply
2) Tars evolved, secondary rxns, pyrolysis continues
D T > 500 1) Carbonization ceases & char layer fully developes
2) H2O/CO2 vapors react with charcoal layer
Portions of the combustion and pyrolysis cycles overlap even though pyrolysis must
initiate the combustion cycle. The result of pyrolysis and combustion of wood is a
smoldering, charred ember existing at high temperatures. Table 2 illustrates the general
behavior of wood at different temperatures via zone analysis.
Table 2: Zonal Analysis of Combustion in Wood
Zone Temperature Range, T(oC) Description A T < 200 1) Steady loss of weight of material (char)
2) Exothermic oxidation reactions increase temp.
B 200 < T < 280 1) More gasses evolve, exothermic conditions reached
2) Heat re-radiated from vapors back to wood
C 280 < T < 500 1) Gas rate release increases sharply
2) Inhibiting char layer develops
D T > 500 1) Oxygen environment somewhat depleted
2) Glowing char embers
The physical properties of wood vary based upon their composition. For instance, balsa is
a porous, light-weight wood that has high surface area. Pine is much less porous, denser
wood that has low surface area. Balsa wood will be more reactive when subjected to

10
elevated temperatures for shorter times, and pine wood can withstand elevated
temperatures for longer times. This results from the varying thermal resistances of the
respective materials.
1.3.3 Combustion of Polymers
The majority of polymers existing on the market consist of substituted hydrocarbons.
Much like the behavior of wood at elevated temperatures, plastics begin combusting
through pyrolysis. The behavior of polymers over broad temperature ranges is determined
in part by the connectivity of the polymer. During polymeric plastic formation, monomer
units are initially energized into radicals that propagate with other monomer units to
create the final polymer chain. The highly energetic monomer units add in a head-to-head
or head-to-tail fashion. Depending on the ratio of head-to-head to head-to-tail linkages
helps predict the behavior of the polymer at higher temperatures: more head-to-head
linkages result in more stable polymer slurries.
Polymeric plastic combustion occurs in the vapor phase. When a plastic is exposed to
increased temperatures, the plastic undergoes pyrolysis. Potentially combustible vapors
are slowly released at first. Since many polymers are substituted, the increase in
surrounding temperatures can cause variations in connectivity among the monomer units.
Often, these variations in connectivity result in an overall weakening of the polymer
structure and can encourage the release of more vapors and liquids, both flammable and
non-flammable. As the heat source persists, the temperature of the polymer increases
steadily. Volatile vapor release rates increase and hydrogen and hydroxide radicals
diffuse out of the material. The radicals can combine to propagate the flame spread. Re-
radiation from combusting vapors effectively increases the polymers’ temperature.
During this process a char layer forms on the surface of the plastic which serves to inhibit
flame spreading. If there is enough char barrier, the flame will slowly extinguish.
Otherwise, heat will continue to be released at higher rates and the pyrolysis-combustion
process continues. The flow chart in Figure 34 illustrates the overall process of pyrolysis
and combustion.

11
Figure 3: Pyrolysis and Combustion Pathway of Plastics
1.4 Flame Retarding Pathways
A flame retardant behaves in a number of ways. Its main goal is to either increase the
overall resistance of the material to ignite or to delay the further spread of flames across
the material. The important fact to note is that flame retardants themselves are
combustible materials at certain temperatures; however, certain physical and structural
properties that flame retardants obtain effectively aid in retarding the flame’s spread or
resisting an initial ignition. As well as retard the flame, modern flame retardants are
specifically designed to decrease the production rate of harmful byproducts such as
carbon monoxide, hydrogen cyanide, soot, rogue char and debris. Certain fire testing
standards have been issued for various household appliances that require them have self-
extinguishing properties. Retarding additives are blended in mattresses and furniture
upholstery to prevent ignition from a common ignition sources like cigarettes. Likewise
high heat resistant coatings are applied to the surface of many electronics, computers,
stereos and cables, in the event of an electrical short. Altogether, the major goal of all
flame retardant research, development and production is to save lives, and this is
accomplished primarily by buying more time through lessening flame spread.
The life-span of a fire can be described in four main steps: initiation, propagation,
steady combustion, and termination5. Often, flames are initiated by a steady heat source

12
and elevated to a certain temperature. Once the heated material becomes sufficiently
energized, the material combusts. This is known as the flash point of that material. After
the material has reached flash point and has begun combustion, potentially combustible
volatile vapors are released from the material and hurriedly propagate the spread of the
flame. The term steady combustion is used to describe the third, most lingering,
component of combustion. During this stage, the flame spreads rapidly, and the body of
material being burned has a relatively stable heat release rate. After this point, the fire
slows to the termination stage. Within this stage, the flame’s intensity is lessened or
essentially ceased due to a variety of reasons. The flame not existing in an environment
with enough oxygen to burn, combustible vapors are not being emitted as quickly as
during the steady combustion stage, or external flame prevention methods were employed
to quench the flame are a few of the potential means by which a flame terminates. Figure
4 illustrates the four-stage pathway of a fire.
Figure 4: General Life-Cycle of a Fire
When a flame retardant is added to a material via coating, impregnation or blending
the resulting behavior of the retarded material during intense heating is greatly stabilized.
Flame retardants increased heat capacity and increased resistance to high heat inputs

13
change the behavior of the material under volatile conditions. This behavior is described
in Figure 5.
Figure 5: Life Cycle of a Fire with Flame Retardant
This figure is somewhat misleading. It can be inferred, from quick inspection of the
figure, that a material’s overall temperature will decrease over time after the addition of a
flame retardant. However, the ignition temperature of the material is neither altered nor
increased substantially. Although it is difficult to accurately predict the dynamics of a
material under extreme heat conditions, it is safe to assume that the addition of a flame
retardant would have little-to-no adverse effects on the behavior of the system at
increased external temperatures.

14
2.0 Flame Retardant Families
Some flame retardants cause a treated material to char thus inhibiting the pyrolysis
process. Others remove flammable gases by reacting with the hydrogen and hydroxide
radicals in the air. There are four primary substances which work to retard fire in
different ways. These families include halogenated, phosphorus, nitrogen and inorganic
flame retardants.
2.1 Halogenated Flame Retardants
Halogenated flame retardants are those that consist of one or more halogen atoms on
the flame retardant molecule. The effectiveness of the flame retardant increases with the
size of the halogen atom(s); however, fluorine and iodine are not used because they fail to
inhibit the combustion process. Fluorine is highly electronegative, thus its bonds with
carbon are too strong. Iodine is a relatively large halogen thus making its bonds with
carbon much weaker. Chlorine and bromine are both used in the flame retardant
industry. The reaction mechanism for halogenated flame retardant is shown below4:
When exposed to the flames, the bonds to the halogen atoms in the flame
retardant break and radicals are released.
RX → R· + X·
Then, the halogen radical reacts to form a halogen halide.
X· + RH → R· + HX
Next, the halogen reacts with the hydrogen and hydroxide radicals in the air to
form water.
HX + H· → H2 + X·
HX + OH· → H2O + X·

15
The effectiveness of the halogen depends on the quantity and control of release of the
atoms. Bromine flame retardants are most commonly used because the bromine atoms
are released over a narrower temperature range. Therefore, there is an optimal
concentration of bromine radicals in the flame zone6.
Halogenated flame retardants are widely used due to relatively low production and
raw material costs. However, the effectiveness depends on quantity of halogen atoms
and on the control of halogen release. Halogenated flame retardants are not
biodegradable.
Some have been banned because of their toxic nature. Penta-bromodiphenyl ether
and octa-bromodephenyl ether, when burned were found to form trace amounts of side
products, dioxins and furans. Dioxins are classified by the EPA as class 1 carcinogens.
Class 1 carcinogens potentially cause cancer in humans. Dioxins are also known to have
adverse effects on the reproductive and developmental systems in humans. Exposure to
dioxins has led to infertility, suppressed immune systems, learning disabilities, diabetes,
and more7. Furans have been known to cause cancer in animals, and the FDA is currently
evaluating the effect on humans8.
2.2 Phosphorus Flame Retardants
Another family of retardants is the phosphorus containing ones. These act in the solid
phase as opposed to the halogenated which act in the gas phase. Phosphorus flame
retardants are particularly effective in plastics, such as cellulose, which contain a high
oxygen content4. The mechanism of phosphorus flame retardants is given below:
When heated, phosphates decompose to form polymeric phosphoric acid.
Figure 6: Initiation step for phosphate based flame retardants.
R CH2 CH2 PHeat
R CH CH2
O
+ P
O
HOR CH2 CH2 PHeat
R CH CH2
O
+ P
O
HO P
O
HO

16
Figure 7: Formation of polyphosphate barrier
The phosphoric acid esterifies, dehydrates the oxygen-containing material, and causes
charring on the material it’s protecting.
Figure 8: Esterification stage
Figure 9: Charring stage
The chemical structure of char is not completely understood. It has been found to
be made of primarily of hydrogen and carbon. The chemical structure is
dependent upon the polymer from which it is created.
Phosphorus flame retardants can be used at lower concentrations than halogenated
flame retardants, but they tend to be more expensive the fore mentioned flame retardants.
This family of flame retardants is biodegradable and non-toxic.
2 P
O
HOHeat
OP
O
P
O
+ H2O2 P
O
HOHeat
OP
O
P
O
+ H2OP
O
HO P
O
HOHeat
OP
O
P
O
P
O
P
O
+ H2O
CH2 CH2 OP
O
P
O
+ CH2 CH2OP
O
P
O
O OHCH2 CH2CH2 CH2 OP
O
P
O
OP
O
P
O
P
O
P
O
P
O
P
O
+ CH2 CH2CH2 CH2OP
O
P
O
OP
O
P
O
P
O
P
O
O OH
+ HOHeat CH CH2 P
O
OP
O
P
O
CH2 CH2 O Charring+ HOHeat CH CH2 P
O
P
O
OP
O
P
O
CH2 CH2 O OP
O
P
O
OP
O
P
O
P
O
P
O
CH2 CH2 OCH2 CH2CH2 CH2 O Charring

17
2.3 Nitrogen Flame Retardants
Another family of flame retardants is the nitrogen containing ones. The mechanism
for nitrogen flame retardants is not fully understood. It is known that nitrogen flame
retardants form cross-linked molecular structures that are relatively stable at high
temperatures. This works by physically inhibiting the pyrolysis process. This complex
structure promotes the formation of char. The release of nitrogen gas works to dilute the
flammable gases, thus reducing the flames. To be effective, nitrogen flame retardants are
often used in conjunction with other flame retardants or in high concentrations6.
2.4 Inorganic Flame Retardants
The final family of flame retardants is the inorganic family. There are a few different
inorganic substances that are effective at retarding flames in the temperature range that
plastics decompose, between 150 and 400°C4. The most commonly used flame retardant
is aluminum hydroxide. This hinders fire in three ways, and its mechanism is illustrated
below:
It decomposes into aluminum oxide and water at about 200°C.
2 Al(OH)3 → Al2O3 + 3H2O
The aluminum oxide forms a protective layer on the surface of the protected
material. The water, as steam, dilutes the flammable gas phase. Also, the
endothermic reaction absorbs heat energy cooling the material and slowing down
the pyrolysis process.
Magnesium Hydroxide is another inorganic flame retardant that acts in the same
mechanism as above; however it decomposes at higher temperatures (300°C). Boron
compounds act by releasing water and forming a protective glassy layer on material
surface. They can release boric acid to cause charring. While most inorganic flame
retards inhibit fire physically, antimony trioxide retards the flame chemically. It acts as a
catalyst in the breakdown of halogenated fire retardants. It reacts with the halogenated

18
flame retardant to form antimony halogen compounds which are effective in removing H·
and OH· radicals4. Inorganic flame retardants can be relatively inexpensive; however
large concentrations are needed to be effective.

19
3.0 The Flame Retardant Market
3.1 Global Market
Annually, more than two billion pounds of flame retardants are produced worldwide.
The primary use for flame retardants is in plastics. Textiles, paper and wood products,
adhesives and sealants, rubber products and coatings are all smaller divisions of the flame
retardant market9. The global market as of 2000 was valued at $2.1 billion. The
breakdown of the market is shown below10.
Figure 10: Global Market Breakdown
3.2 United States Market
The flame retardant market in the United States accounts for almost half of the global
market, with about one billion pounds produced nationwide. The US flame retardant
market is composed of over sixty suppliers. The value of the market is $1 billion9.
3.3 Flame Retardant Coatings
The flame retardant coating industry is relatively young, with the first patent being
issued in 1948. As of 1998, flame retardant paints and coatings made up 10% of the
phosphorus flame retardant family and were valued at $9 million7. Assuming that
coatings still make up 10% of the phosphorus market, the value of the flame retardant
coating market currently would be $27.6 million. The market is growing rapidly due to
an increase demand in specialty flame retardants.

20
3.4 Market Projections
The demand for flame retardants in the United States is expected to increase 3.6% per
year and reach 1.1 billion pounds by 2008. The value of the market is supposed to
increase 5.9% annually to $1.3 billion. The average price for pound is increasing due to
an increase in the market of higher valued specialty flame retardants10.

21
4.0 Problem Statement
With sharp increases in urban sprawl and increased reliance on fire prevention
methods, new flame retardant products are being researched and developed across the
globe. As a result of strict EPA standards and waste management regulations, the need
for effective, environmentally friendly flame retardants is at an all time high. A vast
majority of the formerly used halogenated flame retardants, specifically brominated ones,
are being phased out due to the potential health hazards that their side products can cause.
This family of flame retardants degrades into toxic byproducts including dioxins and
furans. The major concern arises from the high concentrations of brominated flame
retardants being sold currently and their geographic location, many of which are “found
far from the locations they are being used.”11 Figure 10 depicts the structure of four major
brominated flame retardants, whereas figure 11 reveals the structure of the their toxic side
products.
Figure 11: Chemical Structures of A) PBBs, B) PBDEs, C) HBCD, D) TBBPA12
22
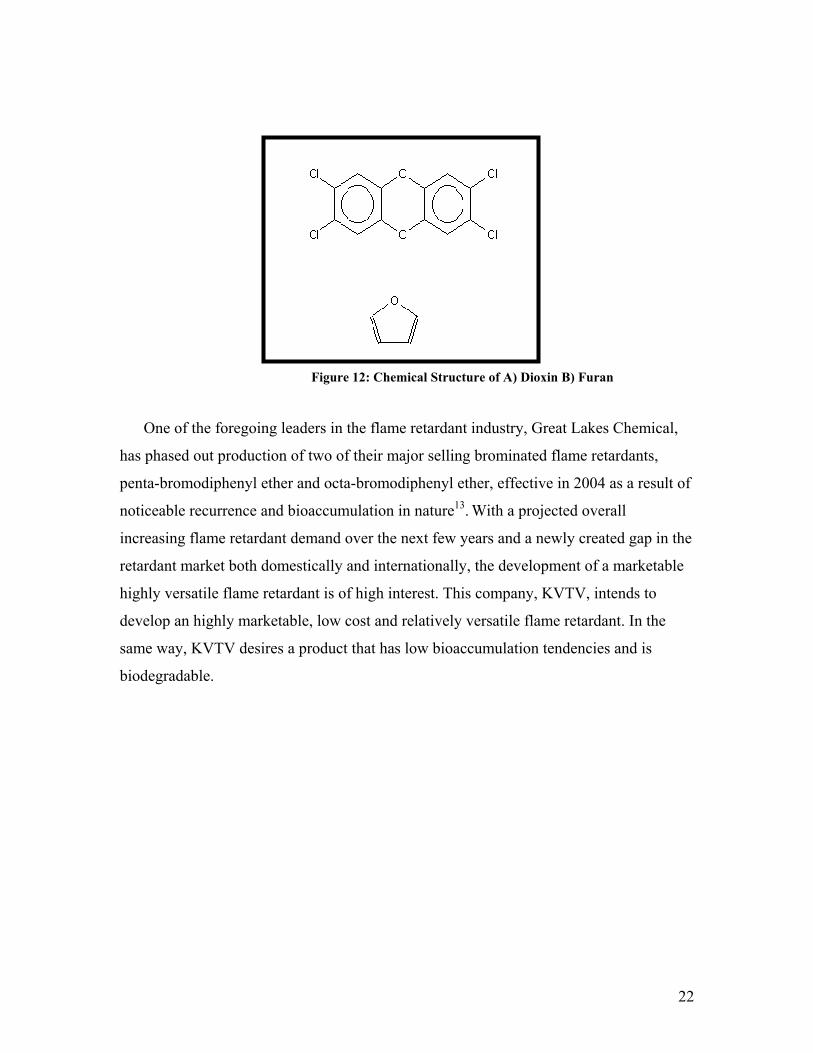
Figure 12: Chemical Structure of A) Dioxin B) Furan
One of the foregoing leaders in the flame retardant industry, Great Lakes Chemical,
has phased out production of two of their major selling brominated flame retardants,
penta-bromodiphenyl ether and octa-bromodiphenyl ether, effective in 2004 as a result of
noticeable recurrence and bioaccumulation in nature13. With a projected overall
increasing flame retardant demand over the next few years and a newly created gap in the
retardant market both domestically and internationally, the development of a marketable
highly versatile flame retardant is of high interest. This company, KVTV, intends to
develop an highly marketable, low cost and relatively versatile flame retardant. In the
same way, KVTV desires a product that has low bioaccumulation tendencies and is
biodegradable.

23
5.0 Our Product
5.1 Pathway to Discovery
There are multiple potential pathways that can lead to the development of a new
flame retardant. With many pathways, however, there are even more technical and
consumer considerations to accompany each. Among these pathways include developing
a product based upon pure trial-and-error, laboratory research and development,
statistical prediction techniques and former conclusive research and experimentation with
existing products. While each of these respective methodologies has a certain level of
merit, each method of product development has varying sets of limitations. KVTV’s
product flame retardant was developed to have high thermal resistance, increased wood
charring effects and low vapor pressures at high temperatures. KVTV only examined two
of these product development techniques
5.1.1 Statistical Method
There is an abundance of statistical modeling techniques that relate the type of
functional groups on different molecules to the physical properties the molecule exhibits.
The Lydersen Method14 predicts the critical properties of non-hydrocarbon organic
compounds within reasonable levels of uncertainty. Estimating these values allows for
better predictions for vaporization enthalpies, saturation pressures and boiling points,
properties essential to developing effective flame retardants. For example, the critical
properties of acetic acid are known and tabulated in literature. A comparison of measured
and calculated critical values is shown in Table 3.
Table 3: Lydersen Predicted Critical Constants
Group
Description # ∆T ∆P ∆V Tr
calc/Trtable(K) Pr
calc/Prtable(bar) Vr
calc/Vrtable (L/mol)
Methyl 1 0.02 0.277 0.055
Alcohol 1 0.082 0.06 0.018
Carbonyl 1 0.04 0.29 0.06
Total 3 0.142 0.627 0.133
570/593
4% Error
72.3/57.8
25% Error
0.173/0.172
1.2% Error

24
The calculated reduced properties correspond closely to those experimentally determined.
The major problem surfaces when adding more groups to a non-hydrocarbon organic
chain. The estimation errors compound quickly resulting in calculated inaccuracies of
critical points. For example, tri-ethyl phosphate is claimed to have a predicted melting
point of 770K by the Lydersen Method; however, its recorded boiling point is
approximately 490K. The resulting error is nearly 37%.
5.1.2 Use of Thermoplastics
Thermosets, the precursor to thermoplastics, are more rigid non-melting class of
thermoplastics. They withstand high heat inputs and are relatively hard materials.
NASA’s development of high heat resistant thermosets to coat surfaces of fuel tanks and
engine encasings, areas that must withstand elevated temperatures, has switched from the
area of thermosets to that of thermoplastics15 because of their promising enhanced
durability and longevity.Thermoplastics16 are a class of materials that are deformable,
melt to liquid upon heating and dry to a solid when cooled. These classes of compounds
have increased heat resistant properties, moduli of elasticity and impact resistance.
Thermoplastics are a relatively modern technology that is increasingly being researched.
Because thermoplastics were known to have enhanced physical properties, the research
was directed at developing a similar thermoplastic that exhibited flame retardant
properties, that was biodegradable and that was non-toxic.
Substantial research17 has been performed on thermosets and thermoplastics to
determine their behavior as flame retardants. Hussein18 reports in his study of organo-
phosphorous and nano-clay additives to epoxy resins that the addition of even 7.5% and
3% phosphate can result in as much as 37% increase in time to material ignition. Similar
studies17 on vinyl ester resins reveal that the flash temperatures of the resins studied
increased by more than 3%. There are recorded studies concluding that thermoplastics
can be effectively used as flame retardants.

25
5.2 Synthesis Path
The flame retardant that KVTV developed is a thermoplastic material consisting of a
base substrate polymer, PVOH, to which nano-clay, phosphates and water are added. The
raw materials being used are polyvinyl acetate (PVAc), Cloisite ® Na+ 19, dimethyl-
methyl phosphonate20 and water. KVTV has cleverly named their product flame retardant
Freeze-Flame Nano. Freeze-Flame Nano is a product with estimated low vapor pressures
at high temperatures, relatively low volatility, increased boiling point temperatures and
high thermal resistance.
Varying the composition of raw materials alters the performance of the flame
retardant product. For instance, increasing cloisite concentrations results in higher
thermal resistances, whereas increasing phosphate concentrations results in a greater
degree of charring. Before these properties are evaluated, the product synthesis paths and
the product’s behavior when exposed to flame must be understood. KVTV’s first step in
flame retardant production involved the saponification of polyvinyl acetate using a strong
base. Experimentation with the saponification of PVAc21 with NaOH found it to be
highly selective toward the acetate group on PVAc; however, these experiments were
conducted with low base (NaOH) concentrations. To fully convert all the PVAc into
PVOH, a more concentrated base must be used. The reaction of PVAc with NaOH is
relatively mild with low estimated heats of dissociation. The reaction can occur at
temperatures ranging from 65oC to 95oC. Since the reaction is slightly exothermic, the
heat released during reaction elevates the temperature of the first reacting system (PVAc
with NaOH); however, since such large quantities are being produced, the heat gain is
considered negligible. Figure 12 illustrates the first step in the synthesis of Freeze-Flame
Nano. NaAc is a byproduct of the first reaction and can be sold at a reasonable cost.
26
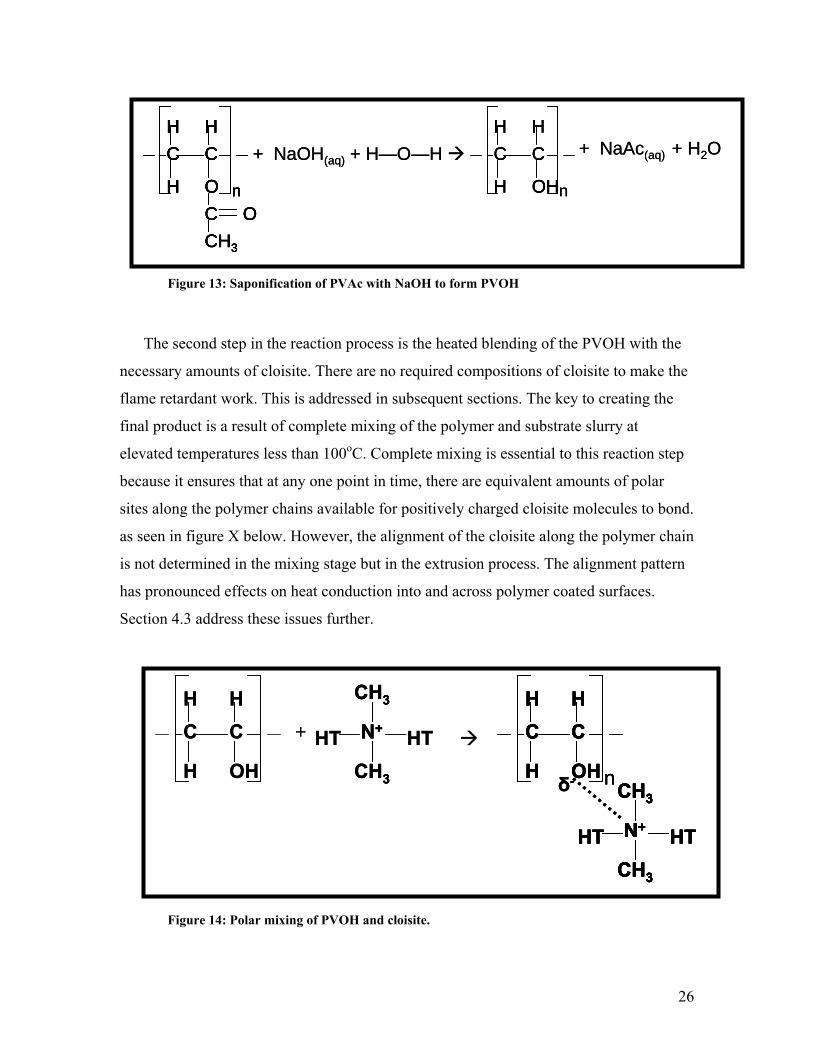
Figure 13: Saponification of PVAc with NaOH to form PVOH
The second step in the reaction process is the heated blending of the PVOH with the
necessary amounts of cloisite. There are no required compositions of cloisite to make the
flame retardant work. This is addressed in subsequent sections. The key to creating the
final product is a result of complete mixing of the polymer and substrate slurry at
elevated temperatures less than 100oC. Complete mixing is essential to this reaction step
because it ensures that at any one point in time, there are equivalent amounts of polar
sites along the polymer chains available for positively charged cloisite molecules to bond.
as seen in figure X below. However, the alignment of the cloisite along the polymer chain
is not determined in the mixing stage but in the extrusion process. The alignment pattern
has pronounced effects on heat conduction into and across polymer coated surfaces.
Section 4.3 address these issues further.
Figure 14: Polar mixing of PVOH and cloisite.
+ NaOH(aq) + H—O—H C C
H
H H
OH
+ NaAc(aq) + H2O
C OCH3
C C
H
H H
O n n
+ NaOH(aq) + H—O—H C C
H
H H
OH
C C
H
H H
OH
+ NaAc(aq) + H2O
C OCH3
C C
H
H H
O nC OCH3
C OCH3
C C
H
H H
O n
C C
H
H H
O
C C
H
H H
O n n
C C
H
H H
OH
C C
H
H H
OH
+ N+
CH3
CH3
HTHT N+
CH3
CH3
N+
CH3
CH3
HTHT C C
H
H H
OH nδ-
N+
CH3
CH3
HTHT
……….
C C
H
H H
OH nδ-
N+
CH3
CH3
HTHT
……….
C C
H
H H
OH
C C
H
H H
OH nδ-
N+
CH3
CH3
HTHT N+
CH3
CH3
N+
CH3
CH3
HTHT
……….

27
Alcohol groups are attached to the polymer chain mostly in a head-to-tail fashion. When
the monomers combine in a head-to-head manner the resulting polar groups are more
concentrated and confined to one location on the chain. This does not necessarily have an
adverse effect on the complete mixing, but it may result in unprotected areas on the
material it’s protecting. Once the polymer is allowed to cure for a given length of time,
the resulting product is a molten slurry of polymer and clay.
This mixture is then extruded with the phosphate under high shear conditions in a
screw press extruder22 and either injection molded or cast into a large film (sheet). There
are advantages to both types of processing methods. The most pronounced effect is in
how the clay will align with the polymer. Injection molding tends to align the clay
parallel to the substrate, PVOH, adding heat resisting effects. Cast film molding,
however, often aligns the clay parallel to the substrate at the surface but becomes more
randomly dispersed toward the center of the sheet. Figure 15 depicts the random
dispersion of clay and phosphate in the product polymer blend.
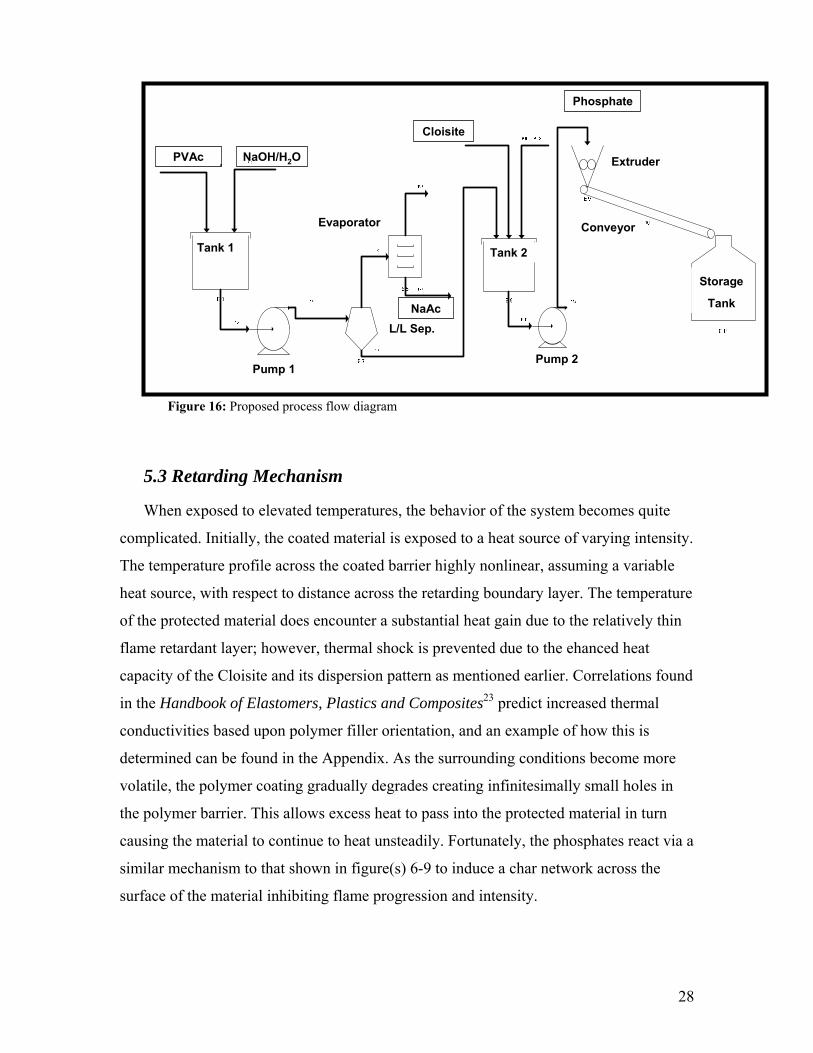
Figure 15: A) Polymer blend B) Legend
The product can then be sold in sheets or pulverized into a powderous material and sold.
The final product has no well defined concentration of sites occupied by the phosphate
and the clay. If this were easily explainable, then it’s possible to assert that one could
easily manipulate the placement of the phosphate and clay; such is not the case. The final
step involves storing the flame retardant product. Final products are stored in large
horizontal containment vessels with enough capacity to hold one week’s worth of
product. Below is a proposed process flow diagram for our plant.
Polar Sites=
Clay=
Phosphate=
Polymer=
Polar Sites=
Clay=
Phosphate=
Polymer=
B A
28
Figure 16: Proposed process flow diagram
5.3 Retarding Mechanism
When exposed to elevated temperatures, the behavior of the system becomes quite
complicated. Initially, the coated material is exposed to a heat source of varying intensity.
The temperature profile across the coated barrier highly nonlinear, assuming a variable
heat source, with respect to distance across the retarding boundary layer. The temperature
of the protected material does encounter a substantial heat gain due to the relatively thin
flame retardant layer; however, thermal shock is prevented due to the ehanced heat
capacity of the Cloisite and its dispersion pattern as mentioned earlier. Correlations found
in the Handbook of Elastomers, Plastics and Composites23 predict increased thermal
conductivities based upon polymer filler orientation, and an example of how this is
determined can be found in the Appendix. As the surrounding conditions become more
volatile, the polymer coating gradually degrades creating infinitesimally small holes in
the polymer barrier. This allows excess heat to pass into the protected material in turn
causing the material to continue to heat unsteadily. Fortunately, the phosphates react via a
similar mechanism to that shown in figure(s) 6-9 to induce a char network across the
surface of the material inhibiting flame progression and intensity.
Tank 1 Tank 2
Storage
Tank
Pump 1Pump 2
L/L Sep.
Evaporator
Extruder
Conveyor
PVAc NaOH/H2O
NaAc
Cloisite
Phosphate
29
According to F. L. Browne, a chemist at the Forest Products Laboratory in the U.S.
Department of Agriculture24, “[flame retarding] wood and other cellulosic materials is
based on changing the pyrolysis mechanism from that of fast pyrolysis to that of slow
pyrolysis.” Fast pyrolysis tends to eject volatile and combustible gasses that can increase
wood burning. On the other hand, slow pyrolysis yields charcoal and vapors of low
flammability. Altering the mechanism from fast to slow pyrolysis is highly dependent to
the degree of char formation, which can be enhanced through phosphate char networks.
Few studies24 have been performed verifying the enhancement of char formation from
phosphates, but those that have examined char formation rates have found it to increase
flame retarding times and decrease flaming.If char formation is sufficient, then the wood
will glow and inevitably slow burning; however if the heat resistive properties of the
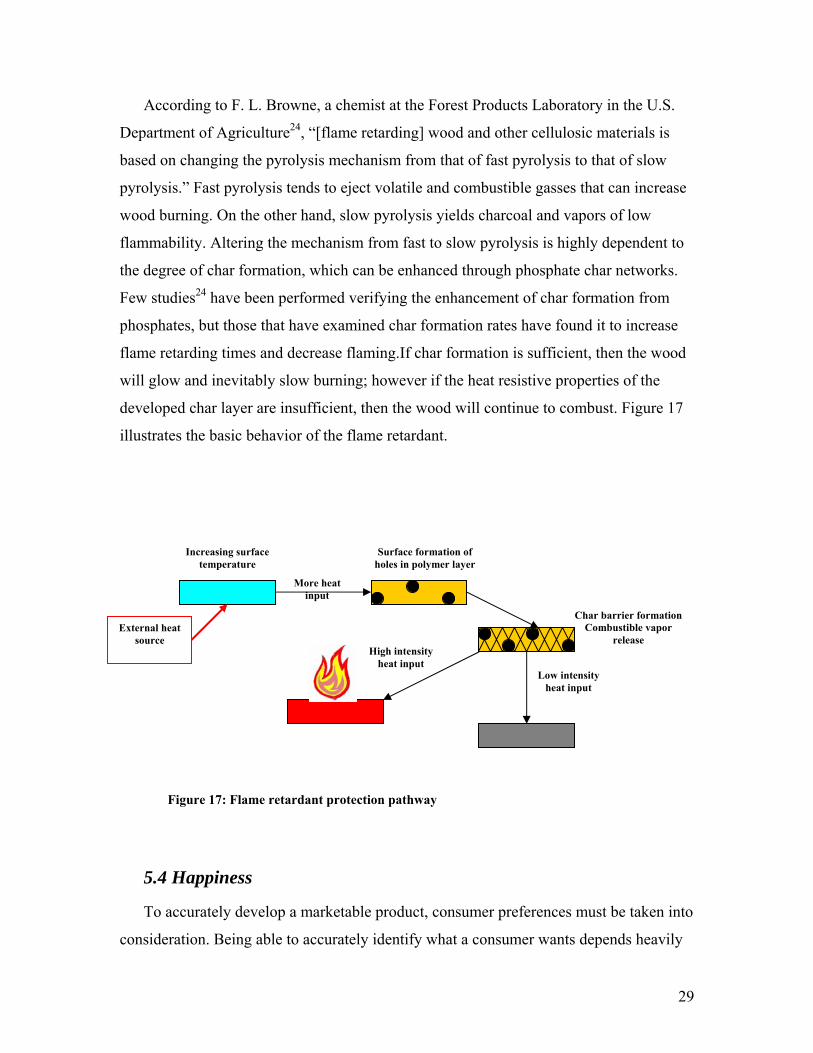
developed char layer are insufficient, then the wood will continue to combust. Figure 17
illustrates the basic behavior of the flame retardant.
Figure 17: Flame retardant protection pathway
5.4 Happiness
To accurately develop a marketable product, consumer preferences must be taken into
consideration. Being able to accurately identify what a consumer wants depends heavily
External heat source
Increasing surface temperature
More heat input
Surface formation of holes in polymer layer
Char barrier formation Combustible vapor
release High intensity
heat input Low intensity
heat input

30
on the type of product being developed; however, being able to accurately measure what
a consumer wants relates to the utility of the product. Utility25 is the measure of the
satisfaction gained from consuming or using a good or service. The goal is to somehow
relate consumer preferences to multiple properties of the product. By maximizing the
consumers’ utility, the true happiness value of the product can be estimated.
Based upon consumer surveys, it was possible to relate a consumers’ overall
happiness to characteristics of the product that can be altered to optimize happiness in the
final product. The major factors consumers consider when purchasing and using a flame
retardant were found to include: retardancy time, setting time, thickness, odor, effective
amount and toxicity. As well as the previous consumer considerations, KVTV has
included biodegradability as a measure of consumer’s utility and ultimately their
happiness. Happiness plots were then constructed to determine the effect that variations
in consumer factors would have on happiness. The list of figures below graphically
depicts relationship between consumer factors to overall happiness.

31
Retardancy Time
0
10
20
30
40
50
60
70
80
90
100
0 20 40 60 80 100 120 140 160 180 200
Time (sec)
% H
appi
ness
Setting Time
0
10
20
30
40
50
60
70
80
90
100
0 50 100 150 200 250 300
Setting Time (min)
% H
appi
ness
Thickness
0
10
20
30
40
50
60
70
80
90
100
0 1 2 3 4 5 6 7 8
# Applications
% H
appi
ness
Effective % Coated
0
10
20
30
40
50
60
70
80
90
100
0 10 20 30 40 50 60 70 80 90 100
% Coated
% H
appi
ness
Figure 18: Overall happiness relative to changes in consumer attributes
The happiness relationships for odor, toxicity and biodegradability are somewhat
different in nature. For odor, overall happiness was associated to the type of odor
producing functional groups present in the flame retardant. The functional groups
considered were grouped into categories including hydrocarbons, alcohols/halogens,
carboxylic acids, ethers, aromatics, amines, ketones and mercaptans. Each functional
group was then assigned a numeric value ranging from 0 to 7, respectively, based upon
known odorous properties. For toxicity and biodegradability, a value of 0 or 1 was
assigned to the product: 0 for toxic non-biodegradable, 1 for non-toxic biodegradable or
any combination thereof. The next step involves relating the consumer defined properties
to the physical properties exhibited by the product. This is greatly accomplished by
defining models that alter physical properties based upon varying product compositions.

32
Retardancy time is interpreted as the duration of time between a material first being
introduced to the flame and its eventual ignition (combustion). As mentioned before, the
predominate manner to protect materials from burning is by forming surface char that
encourages slow pyrolysis, and few studies have been conducted on this phenomena. To
estimate the total retardancy time, a study24 of prolysis rates and char formation on
Douglas-Fir wood was used. This study measured the overall conversion of wood based
upon the mass of char formed and the mass of wood remaining after burning for different
time intervals.
,0
,0
chari
iii mm
mmX
−
−= Eqn. 1
Equation 1 shows the conversion of the wood based upon m0,i (the mass of component i
within the wood initially), mi (the mass of component i within the wood after burning for
a specific time interval), and mchar (the mass of char formed after burning for a specific
time interval). This conversion measurement can be related to retardancy time by
equation 2,
( )ni
RTE
ii XeA
dtdX avg
A
−=⎟⎟⎠
⎞⎜⎜⎝
⎛ −
1 Eqn. 2
which has been experimentally derived from burning wood. In this case, Ai is the
frequency factor, EA is the activation energy, R is the universal gas constant, Tavg is the
average temperature of the burning wood and n is the reaction order (assumed 1). Since
wood is comprised predominately of cellulose, lignin and hemicellulose, the overall
conversion can be represented by the fractional conversion of the wood components as
seen in equation 3, where wi’s are the mass fractions of the subcomponents in the wood,
and other terms are previously defined.
HH
TLL
TCC
TW
T wdtdXw
dtdXw
dtdX
dtdX
avgavgavgavg⎟⎠⎞
⎜⎝⎛+⎟
⎠⎞
⎜⎝⎛+⎟
⎠⎞
⎜⎝⎛=⎟
⎠⎞
⎜⎝⎛ |||| Eqn. 3
American Society for Testing and Materials, ASTM, standard for flame retarding time
has a threshold value 120 sec. This was our goal time, and by altering the composition of
phosphate the total retardancy time can be estimated assuming an allowable conversion
(15 % was assumed).

33
There are a number of factors to consider when evaluating the setting time of flame
retardant product. Setting time is a function of the flame retardants thickness, which, in
turn, is a function of the number of applications. The recommended number of
applications varies from 2 to 3 depending on the type of application required. To model
the time required to evaporate water from the product, a Gurney-Lurie26 approximation
was used.
0,,
,
AsA
AsA
CCCC
Y−−
= Eqn. 4
Y is the unaccomplished concentration change where CA,s, CA and CA,0 are the
concentrations of water at the surface of the coating, at the point measured and at the
reference point, a pre-defined depth beneath the retardant layer.
1xkDm
c
AB= Eqn. 5
This equation gives the relative resistance of the evaporating system, where DAB is the
diffusivity of water at a specified temperature, kc is the convective mass transfer
coefficient and x1 is the characteristic length or the thickness of the retarding layer.
1xxn = Eqn. 6
Here n represents the relative position of measurement. The value x is the point from the
surface where the measurement is made, and x1 is defined previously. In order to
determine the expected setting (drying) time, one more parameter must be included.
21x
tDX ABD = Eqn. 7
XD is a measure of the relative time required to dry, and t is the total time required. If Y,
m, n and the geometry of the drying surface is known, XD can be determined. From this
the total drying time can be estimated.
The third happiness model predicts overall happiness based upon the average number
of coats required by competitors. Most flame retardant vendors recommend a certain
number of applications, and the average of these values was used to estimate the point of
maximum happiness. The total number of applications necessary is proportional to the
thickness of the layer protecting the material. KVTV recommends anywhere from 2 to 3

34
coats with each coat being approximately 1mm thick. Deviations in the number of
applications effect the consumer’s happiness: more coats imply less happiness, etc.
The final happiness model relates overall happiness with respect to the effective
amount of flame retardant applied on the surface. Determining an effective amount
requires a basis material to be chosen. KVTV basis consists of a 10cm x 10cm x 2 cm
block of wood. Since there is an assumed thickness per coat and there is a basis volume,
the amount of flame retardant necessary to resist the flame can be calculated by
subtracting the total volume of the coated material from the total volume of the basis.
After all the models have been well defined, weights must be assigned to the
consumer properties. The weights can be assigned arbitrarily or can be based on
consumer preference. KVTV used a combination of both methods to determine the final
weights. The next stage requires the calculation of total happiness. The general equation
used to estimate consumer happiness is given by,
∑=i
ii yxH1 Eqn. 8
where xi are the assigned weights and yi are the normalized scores determined from the
consumer happiness models. The total sum of the weights must be equal to one. To
achieve the “perfect product,” or product with maximum happiness, the compositions of
KVTVs components are varied to produce the maximum happiness with the given
weights. Contrastingly, to achieve a marketable product, the compositions of the flame
retardant are varied in a manner that optimizes profit. Beta gives the ratio of happiness
between H2 the competitor’s happiness, and H1 KVTV’s happiness.
1
2
HH
=β Eqn. 9
Table 4 shows the weights used to determine the cost-effective product and the perfect
product.

35
Consumer Attribute Weight
Retardancy time 0.30
Thickness 0.15
Odor 0.15
Setting time 0.25
Effective amount 0.07
Biodegradability 0.04
Toxicity 0.04
Table 4: Relative weights assigned
For the cost-effective product the compositions are 50% PVOH, 15% Phosphorus,
3% Cloisite and 32% Water. For the perfect product the compositions are 50% PVOH,
27% Phosphorus, 3% Cloisite and 20% Water. These percentages were found using
excels solver function that altered initial composition guesses to a final composition that
produced the greatest happiness value. The percentages of our closest competitor, Firetect
WT-102 includes 18.4 % Polyvinylidine Chloride, 21.8 % Phosphate, 3.4 % Sodium salt
and 41.9 % Butyl Acetate. The happiness value, H1, for this cost-effective product is
0.868, whereas the competitor’s happiness value, H2, is 0.574. The optimal happiness was
roughly 0.930. The ratio of the competitor’s happiness value to KVTV’s happiness value
is given by β. For the cost-effective product, β=0.661, and for the perfect product,
β=0.617. Listed below are the weights KVTV assigned to the happiness model.
36
6.0 Business Model
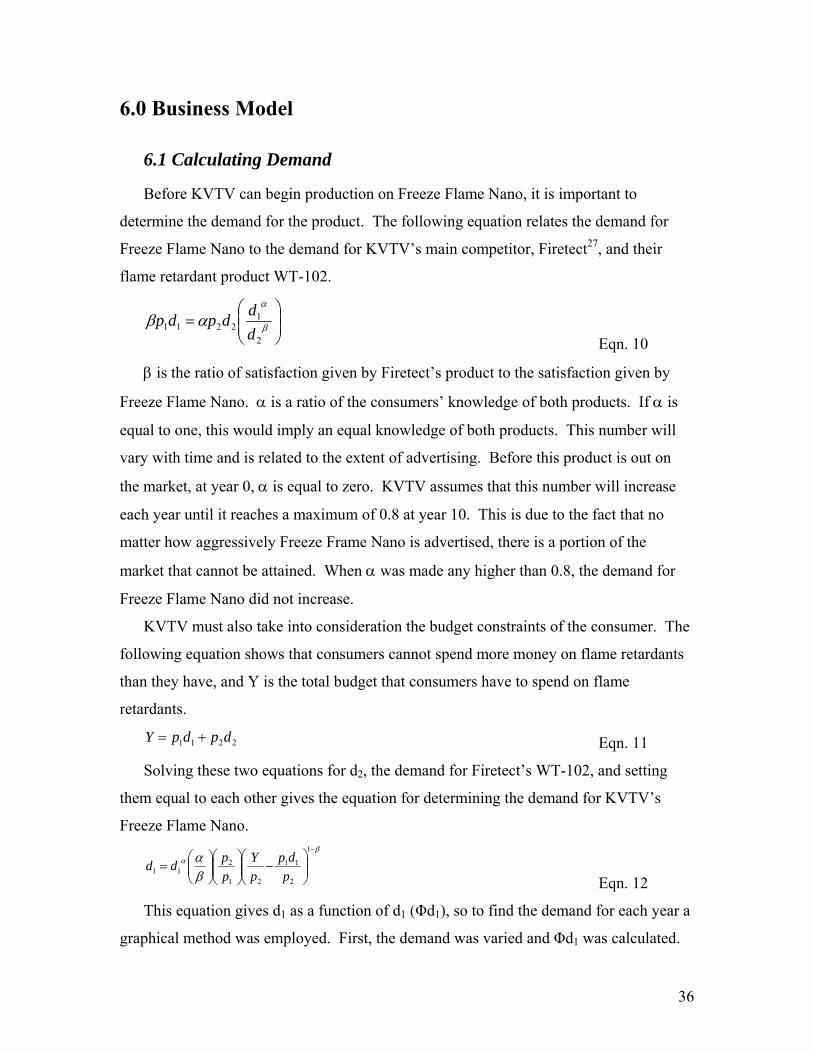
6.1 Calculating Demand
Before KVTV can begin production on Freeze Flame Nano, it is important to
determine the demand for the product. The following equation relates the demand for
Freeze Flame Nano to the demand for KVTV’s main competitor, Firetect27, and their
flame retardant product WT-102.
⎟⎟⎠
⎞⎜⎜⎝
⎛= β
α
αβ2
12211 d
ddpdp Eqn. 10
β is the ratio of satisfaction given by Firetect’s product to the satisfaction given by
Freeze Flame Nano. α is a ratio of the consumers’ knowledge of both products. If α is
equal to one, this would imply an equal knowledge of both products. This number will
vary with time and is related to the extent of advertising. Before this product is out on
the market, at year 0, α is equal to zero. KVTV assumes that this number will increase
each year until it reaches a maximum of 0.8 at year 10. This is due to the fact that no
matter how aggressively Freeze Frame Nano is advertised, there is a portion of the
market that cannot be attained. When α was made any higher than 0.8, the demand for
Freeze Flame Nano did not increase.
KVTV must also take into consideration the budget constraints of the consumer. The
following equation shows that consumers cannot spend more money on flame retardants
than they have, and Y is the total budget that consumers have to spend on flame
retardants.
2211 dpdpY += Eqn. 11
Solving these two equations for d2, the demand for Firetect’s WT-102, and setting
them equal to each other gives the equation for determining the demand for KVTV’s
Freeze Flame Nano. β
α
βα
−
⎟⎟⎠
⎞⎜⎜⎝
⎛−⎟⎟
⎠
⎞⎜⎜⎝
⎛⎟⎟⎠
⎞⎜⎜⎝
⎛=
1
2
11
21
211 p
dppY
ppdd
Eqn. 12
This equation gives d1 as a function of d1 (Φd1), so to find the demand for each year a
graphical method was employed. First, the demand was varied and Φd1 was calculated.

37
The solid curve below shows how this function changes with demand. Next, the line d1 =
d1 was put on the same graph as shown by the dashed line. Where these two functions
intersect is at the demand for Freeze Flame Nano at that particular year. The example
below shows the demand for year 4 of this process.
Year 4
0
1,000,000
2,000,000
3,000,000
4,000,000
5,000,000
6,000,000
7,000,000
8,000,000
9,000,000
0 1,000,000 2,000,000 3,000,000 4,000,000 5,000,000 6,000,000
d1
phi (
d1)
This function, Φd1, will change for each year because the value of α changes as does
the budget that the consumer has to spend on flame retardants. This method was used for
each year and the demand found for each year is shown in the table below.
Table 5: Calculated demand over 10-year life cycle
Year Demand (lb/year)
1 19,000
2 930,000
3 3,900,000
4 4,900,000
5 5,300,000
6 5,500,000
7 5,800,000
8 6,000,000
9 6,300,000
10 6,700,000

38
6.2 Regret Analysis
It is not economically feasible for KVTV to rebuild the production plant each year to
meet the demand for that particular year. Therefore, before building can occur, a
decision must be made as to which capacity the plant will be built. To do this a regret
analysis is performed. A regret analysis shows how much money could be made by
building the plant at a certain capacity in comparison to how much could be made by
building at another capacity. Three designs were taken into account for this analysis.
The first design consists of building for the maximum capacity of 3.9 million pounds per
year which is the demand at year 3. The second design is for the demand at year 6, 5.5
million pounds per year. The final design is to build for maximum capacity at year 10,
6.7 million pounds per year. The net present worth (NPW) of each design was calculated
under three different scenarios. One scenario is that the prices of all byproducts, raw
materials, equipment, and utility costs remain the current prices. This is called the
“medium” scenario. The “low” scenario would be when all of these prices are 15%
below the current prices, and the “high” scenario would be when these prices are 15%
higher than current prices. To calculate the net present worth the following equation was
used.
TCIiSVWC
iCFNPW
nn
n −++
++
= ∑=
10
10
1 )1()1( Eqn. 13
The NPW for each design under each scenario is given in the table below. The next
table shows the regret which is the NPW for that design and scenario subtracted from the
maximum NPW that could have been obtained in that scenario.

39
Table 6: Comparison of design scenarios and their effective NPW
NPW Low Med High Average
Design 1 $ 3,604,323
$ (1,271,019) $ (6,146,351) $ (1,271,016)
Design 2 $18,887,671
$12,583,641 $ 6,279,608 $12,583,640
Design 3 $22,003,977
$15,314,316 $ 8,624,652 $15,314,315
Max $22,003,977
$15,314,316 $ 8,624,652
Table 7: Regret analysis results
Regret Low Med High Max Regret
Design 1 18,399,653
16,585,335
14,771,004
18,399,653
Design 2 3,116,306
2,730,675
2,345,044
3,116,306
Design 3 0 0 0 0 Minimax 0
Since there was no regret in using the third design, KVTV has decided to build its
plant for the maximum capacity of 6.7 million pounds per year. The capacity of the
major equipment used is shown in the table below, along with the cost for that piece of
equipment. The total equipment cost with piping was found to be $310,000.
Table 8: Equipment Specifications
Component Capacity Equipment Cost
Tank 1 7.2 m3 $40,000
Tank 2 4.1 m3 $25,000
Pump 1 4.9 kW $7,000
Pump 2 0.6 kW $5,000
Settler 6.8 m3 $76,000
Evaporator 3.2 m3 $25,000
Extruder 0.7 m3 $47,000
Storage 85 m3 $40,000

40
The total capital investment, which is calculated using the equipment cost, was calculated
be $1.7 million. A distribution of the NPW that could be attained by using design 3 with
a 15% standard deviation is shown below. The maximum NPW attainable was found to
be $23.8 million, while the minimum is $6.9 million. The average NPW was found to be
$15.3 million.

41
7.0 Business Plan
7.1 Organizational Plan
7.1.1 Company Description
KVTV, Inc. is a small, Texas-based flame retardant supplier. The mission of KVTV
is to provide a non-toxic, biodegradable flame retardant and excellent service to its
customers. The short term goals of KVTV are to provide a flame retardant that is
effective, easily applicable, odor-free, and non toxic to constructions companies
throughout our region of the United States, and to capture 3% of the current flame
retardant market. To ensure a consistent supply, KVTV has established a relationship
with Science Lab Chemicals and Laboratory Equipment in Houston, Texas and with
DuPont in La Porte, Texas. KVTV will remain a regional supplier for the first ten years.
The long term goals of KVTV are to expand nationally. After establishing a loyal
consumer base with local construction companies, KVTV will begin to supply flame
retardant to companies nation-wide.
7.1.2 Our Product
KVTV will primarily sell a flame retardant called Freeze Flame Nano (FFN). FFN is
a phosphorus-based, non-toxic, biodegradable flame retardant coating. FFN is a mixture
of phosphate, nano-clay, polymer, and water. Our basic supply will consist of polyvinyl
acetate(PVAc), sodium hydroxide, Cloisite (a silica based nano-clay), and phosphoric
acid. Approximately 2 million pounds per year of PVAc are needed, while our supplier,
DuPont, produces 135 million pounds per year. Similarly, Science Lab also produces an
excess amount of sodium hydroxide and phosphoric acid. The nano-clay will be
provided by Rockwood. KVTV will first obtain the polyvinyl vinyl acetate needed for
FFN by the saponification of PVAc with sodium acetate. Then, a predetermined amount
of phosphoric acid and nano-clay will be added to the polymer slurry to yield Freeze
Flame Nano. This slurry will be pumped to an extruder and then stored. One week’s
supply of FFN will be stored. FFN will be packaged and then shipped by truck all over

42
the region. FFN will be sold by the gallon. The primary industry for FFN is the
construction industry; however, it can also be used to coat plastics and electronics.
7.1.3 Plant Location
The location of the Freeze Flame Nano production plant will be Corpus Christi,
Texas. The raw material suppliers are located in Texas, which keeps shipping cost low.
The land in Corpus Christi is also relatively inexpensive. KVTV, Inc. has acquired a 5.8
acre lot for $300,000. The price of land in Houston, Texas was also looked into. It was
found to be $3 per square foot. An equivalent lot in Houston would therefore be about
$750,000. The total shipping costs of raw materials to the plant in Corpus Christi are
approximated at $120,000 per year. Shipping to and from Houston would only be
$90,000 per year, but over the ten year life span of this process only $300,000 would be
saved in shipping by building in Houston. Therefore, Corpus Christi was chosen. Also,
there is high demand for flame retardants in the southwestern portion of the United
States. Freeze Flame Nano could be easily shipped from the Corpus Christi plant to
construction companies in Houston, Dallas, or Kansas City.
7.1.4 Management
KVTV will be managed by two partners, Keshan Velasquez and Tyler Viani. Tyler
Viani will be the Operational Manager. His responsibilities include process and product
improvements, as well as future product discovery. Keshan Velasquez will be the
Financial Manger. Her responsibilities include strategic planning, budgeting, data
management, and continual marketing analysis. There will also be a process manager
and three process engineers who will oversee daily operations. The projected total
income for all management is $400,000 per year.
7.1.5 Personnel
KVTV will consist of twelve operators. The production of FFN will call for four
operators per shift, and two shifts per day. The average wages of the operators will be
approximately $24 per hour. Operators will be allowed to work up to 40 hours a week.
As KVTV expands, more operators will be added as needed.

43
7.1.6 Insurance
KVTV will obtain commercial property insurance, liability insurance, and flood and
hail insurance from the Texas Department of Insurance. All employees will be given the
option of life and health insurance through Primerica Life. This will cost KVTV
approximately $60,000 per year.
7.1.7 Security
KVTV is dedicated to the security of its employees and assets. The production plant
of KVTV will be continuously monitored by ADT. Inventory of all raw materials and
product will be taken every three months to ensure against theft.
7.2 Marketing Plan
7.2.1 Market Analysis
The United States flame retardant market accounts for half of the global market,
which amounts to one billion pounds of flame retardant being produced in the U.S. per
year. The flame retardant coating market accounts for over $10 million per year. KVTV
will at first target the construction industry in the Midwest region of the United States.
The target consumers are shown in the table below, along with their regional offices.
Table 9: Target Consumers
Consumer Regional Office Locations
Turner Construction Co. Dallas, TX; Houston, TX; Kansas City, MO;
Denver, CO
Hansel Phelps Construction Co. Austin, TX
J E Dunn Construction Co. Dallas, TX; Houston, TX; Fort Worth, TX;
Topeka, KS; Kansas City, MO; Denver, CO;
Colorado Springs, CO
Centex Construction Dallas, TX; Houston, TX; Plano, TX;
Oklahoma City, OK; Lawton, OK; Goldsby, OK

44
There are several flame retardant coating producers in the United States. Some
companies produce a flame retardant additive that is mixed into a gallon of paint. The
major competitors of KVTV for this type of flame retardant include Flame Guard,
Fireshield, and RoscoFlamex. Other flame retardants are sold by the gallon, like Freeze
Flame Nano. Our major competitors from this type of flame retardant include Flame
Stop, Firetect, and Contego International.
7.2.2 Market Trends
The demand for flame retardants is expected to increase 3.8% annually. Consumers
are increasingly concerned with fire resistance as shown by the decreasing number of fire
reported annually. The average price of flame retardants is expected to increase due to an
increase in the consumer demand for specialty flame retardants. The value of the flame
retardant market will therefore increase 5.9% per year.
7.2.3 Marketing Strategy
The fixed capital investment (FCI) for this process was calculated as a percentage of
equipment cost. The FCI was found to be $1.5 million, and the total capital investment
(TCI) is $1.7 million. The NPW for FFN was calculated to be $15.3 million. The return
on investment which is profit divided by total capital investment was found to be almost
250%. The NPW and ROI were also calculated for the “perfect” flame retardant, which
is the product with the compositions of phosphoric acid, nano-clay, polyvinyl alcohol,
and water that provided the maximum happiness. These values were determined to be
$13.6 million and 200% respectively.
Freeze Flame Nano will be sold directly from the plant located in Corpus Christi, TX
and also on the KVTV website. To ensure that a quality flame retardant is delivered to
the consumer, an employee of KVTV will measure the effectiveness of one batch of FFN
per day before the product is packaged. FFN will be packaged by the gallon.
The price of FFN is comparable to the costs of other flame retardant in the market.
The price will start at $6.19 per pound in 2006 and increase between 8 and 10¢ per year.
The average price of flame retardants currently on the market is $6.29 per pound. KVTV
will introduce its product at a price below the market average to maintain a competitive
advantage. KVTV will also offer discounts for large orders.

45
7.3 Financial Plan
7.3.1 Financial Need
The owners of KVTV will invest an initial $200,000 into the FFN production process.
However, this only accounts for a portion of the total capital investment required. To
obtain the additional $1.5 million needed, KVTV will seek financing from the Small
Business Administration. This money will cover the purchasing of land, and start up
costs for the plant. This money will be paid back by 2011.
7.3.2 Cash Flow Statement
The cash flow of each year for the first ten years of production was calculated by
subtracting the annualized fixed cost from the annual revenue from the selling of FFN
and sodium acetate, the byproduct of the saponification process. The varying demand for
FFN provides for a varying flow of cash in and out of the company. The following figure
shows the projected cash flow for the first ten years of production as well as the overall
cash balance.
$(20,000,000)
$(10,000,000)
$-
$10,000,000
$20,000,000
$30,000,000
$40,000,000
$50,000,000
2006
2007
2008
2009
2010
2011
2012
2013
2014
2015
2016
Cash FlowCash Balance
Figure 19: Cash Balance for KVTV, Inc.

46
7.3.3 Projected Balance Sheet
The projected balance sheet for KVTV is given below. Table 10: Balance Sheet Pro Forma Balance Sheet Assets Current Assets FY 2007 FY 2009 FY 2011 Cash $5,000,000 $65,000,000 $93,000,000Accounts Receivable $11,400,000 $25,400,000 $9,400,000Other Current Assets $300,000 $300,000 $300,000Total Current Assets $16,700,000 $90,700,000 $102,700,000 Long-Term Assets $610,000 $610,000 $610,000Depreciation $68,500 $137,000 $205,500Total Long-Term Assets $241,500 $173,000 $104,500Total Assets $17,241,500 $91,173,000 $103,104,500 Liabilities and Capital Current Liabilities Accounts Payable $121,500 $5,948,000 $4,050,000Current Borrowing $300,000 $600,000 $600,000Other Current Liabilities $0 $10,000,000 $1,967,500Long-Term Liabilities $30,000 $300,000 $300,000Total Liabilities $451,500 $16,848,000 $6,917,500 Paid-in Capital $170,000 $170,000 $170,000Retained Earnings ($25,000,000) ($84,200,000) ($93,300,000)Total Capital ($24,830,000) ($84,030,000) ($93,130,000)Total Liabilities and Capital
($25,281,500) ($100,878,000) ($100,047,500)
Net Worth ($8,040,000) ($9,705,000) $57,000
7.3.4 Break-Even Analysis
To determine how long in will take to repay all loans and investments, a break-even
analysis was done. The projected cash balance for each year is compared to the total

47
capital investment. When the two are equal, the plant is said to break-even. This plant is
expected to break even by 2011. The analysis is shown graphically below.
$(30,000,000)
$(20,000,000)
$(10,000,000)
$-
$10,000,000
$20,000,000
$30,000,000
$40,000,000
$50,000,000
2008 2010 2012 2014 2016
Series1Linear (Series1)
Figure 20: Break-Even Analysis
7.3.5 Risk Associated with Investing
To determine the risk involved in investing in Freeze Flame Nano, a risk assessment
was conducted using @risk. The prices in all raw material, equipment cost, and utility
cost were varied by 15%. The figure bellows shows a graphical representation of the risk
involved. Table 8 shows the mean, maximum, and minimum of the profit that can be
obtained.

48
Distribution for Design 3 NPW/J27
Mean = 1.531434E+07
X <=1897093695%
X <=116964535%
0
0.2
0.4
0.6
0.8
1
1.2
1.4
1.6
1.8
2
6 12 18 24
Values in Millions
Val
ues
in 1
0^ -7
Figure 21: Risk Distribution
Table 11: Variability in Profit
Mean $15.3 million Min $6.9 million Max $23.8 million
7.3.6 Supporting Financial Documents
The following table shows the total capital investment for the FFN plant. All costs
were taken to be a percentage of the total equipment cost.
Table 12: Total Capital Investment
Description of Cost % of Purchased Equipment
Total Cost
Direct Costs Purchased equipment 100 $310,000 Installation 53 $164,300 Instrumentation and controls 29 $89,900 Piping 34 $105,400

49
Electrical Systems 11 $31,400 Buildings (incl. services) 32 $99,200 Yard Improvements 13 $40,300 Service Facilities 60 $186,000 Total Direct Cost 330 $1,023,000
Indirect Costs Engineering and Supervision 35 $108,500 Construction expenses 37 $114,700 Legal expenses 5 $15,500 Contractor Fee 21 $65,100 Contingency 40 $124,000 Total Indirect Costs 138 $427,800 Table 4: Continued Fixed Capital Investment 469 $1,453,900 Working Capital (15% of TCI) 75 $232,500 Total Capital Investment 544 $1,686,400
The total annualized cost for 2016 is calculated below. A basis for estimation is also
given.
Table 13: Total Annualized Cost
Description of Cost Basis for Estimate Cost ($/yr) Manufacturing Cost Direct Production Cost + Fixed Charges + Plant
Overhead Cost $103,267,000
Direct Production Cost
Raw Material
Polyvinyl Acetate $1.41/lb at 15,313,000 lb/yr $21,590,000 Water $0.00024/lb at 4,053,000 lb/yr $973 Sodium Hydroxide $10/lb at 6,005,000 lb/yr $60,050,000 Phosphate $1.60/lb at 1,982,000 lb/yr $3,170,000 Cloisite $3.18/lb at 396,000 lb/yr $1,260,000 Operating Labor 4 employee/shift 2shift/day pay is $28.00/hr $787,000 Direct Supervision and Clerical
15% operating labor $118,000
Utilities $188,000 Laboratory Charges 15% of Operating labor $118,000 Patents and Royalties 1% of Total Annualized Cost $1,095,000Sub-total $88,480,000

50
Fixed Charges
Depreciation Calculated Separately
Property Taxes 2% of FCI $29,000 Insurance 1% of FCI $175,000 Financing 10% of fixed capital investment $146,000 Advertising $9,600,000Sub-total $9,950,000
Overhead costs 60% of Labor, Supervision, and Maintenance $992,000
General Expenses
Administration costs 20% of Labor, Supervision, and Maintenance $198,000 Distribution and Marketing Costs
5% of Total Annualized Cost $5,474,000
Research and Development
4% of Total Annualized Cost $4,379,000
Sub-total $10,051,000 Total Annualized Cost Manufacturing Cost + General Expenses $109,473,000

51
8.0 Conclusions and Recommendations
8.1 Conclusions
• Freeze Flame Nano is a durable, heat resistant, char-inducing flame retardant.
• It will bind to multiple surfaces, especially porous wood, because of the
polymer’s polar nature.
• KVTV believes Freeze Flame Nano will benefit the construction industry the
most as well as benefit a certain portions of the plastics and electronics industries.
8.2 Recommendations
• KVTV would like to find a closer and possibly a less costly source of polyvinyl
acetate.
• KVTV hopes to research a cheaper alternative to PVAc that has same
environmentally friendly qualities as PVAc.
• Rigorous ASTM standardized lab-scale tests must be performed on Freeze Flame
Nano to determine its true performance.
• KVTV should try to research adding a color line to their product Freeze Flame
Nano

52
9.0 References 1 United States Fire Administration. National Fire Statistics. Accessed March 2006. www.usfa.fema.gov/statistic/national/ 2 Virnbaum, L and Staskal, D. 2004. “Brominated Flame Retardants: Cause for Concern?” Environmental Health Perspectives Vol. 112: 9-17. (BFR Cause for Concern PDF). 3 The Combustion of Alkanes and Cycloalkanes. Jim Clark 2003. Accessed March 2006. <http://www.chemguide.co.uk/organicprops/alkanes/oxygen.html> 4 Troitzsch, J.H. “Overview of Flame Retardants: Fire and Fire Safety, Markets and Applications, Mode of Action and Main Families, Role in Fire Gasses and Residue.”Chemistry Today. February 1998. Vol. 16 (Overview of Flame Retardants PDF). 5 Kesner, Miri. Teaching about Flame Retardants. A Joint Israeli-Dutch Project. Science Teaching Department, The Weizmann Institute of Science, Rehovot, Israel. Accessed March 2006. <http://jchemed.chem.wisc.edu/HS/Journal/Issues/2001/ Jan/clicSubscriber/V78N01/p41.pdf> 6 EFRA. The European Flame Retardants Association. “Protecting Lives, Property and the Environment.” Accessed January 2006. <http://www.cefic-efra.com/> (cefic-eftra PDF) 7 ActionPA. “Dioxin Homepage.” Last Modified January 29, 2005. Accessed March 2006. <http://www.ejnet.org/dioxin/> (dioxin PDF) 8 U.S. Food and Drug Administration. “Questions and Answers on the Occurrence of Furan in Food.” May 7, 2004. Accessed March 2006. <http://cfsan.fda.gov/~dms/furanqa.html> (furan PDF) 9 Freedonia Group. “Demand to Grow 3.6% per Annum through 2008.” Flame
Retardants Report. January 2001. (Demand to Grow 3.6% PDF) 10 Lerner, Ivan. “FR Market Down but not Out: Albemarle Stays the Course.” Chemical Market Reporter. December 10, 2001. Page 12. (FR Market Down but Not Out PDF) 11 Birnbaum, L and Staskal, D. “Brominated Flame Retardants: Cause for Concern?” Environmental Health Perspectives. Vol. 112: 9-17. (BFR Cause for Concern PDF). 12 Perry, Robert H. Green, Don W. Perry’s Chemical Engineer’s Handbook. 7th Edition. McGraw-Hill 1997.

53
13 Tulio, Alex. Great Lakes to Phase Out Flame Retardants. Provided by Dr. Miguel Bagajewicz (Provided Article PDF). 14 Perry, Robert H. Green, Don W. Perry’s Chemical Engineer’s Handbook. 7th Edition. McGraw-Hill 1997. 15 Composites and Advanced Materials. U.S. Centennial of Flight Commission. Dwayne A. Day. Accessed March 2006 <http://www.centennialofflight.gov/essay/ Evolution_of_Technology/composites/Tech40.htm> 16 Thermoplastics. Accessed March 2006. <http://en.wikipedia.org/wiki/ Thermoplastics > 17 Mazali, Cristiana A. Ittner and Maria Isabel Felisberti. “Vinyl Ester Resin Modified With Silicone-Based Additives: II. Flammability Properties.” Instituto de Quimica, Universidade Estadual de Campinas, SP Brazil. Wiley InterScience. April 8, 2005. 18 Hussein, M. et al. “Effect of Organo-Phosphorus and Nano-Clay Materials on th Thermal and Fire Performance of Epoxy Resins.” School of Physics and Materials Engineering, Monash University, Clayton, Australia. Wiley InterScience. May 13 2003. 19 Southern Clay Products, Inc. Gonzales, Tx. 20 Chemistry Webbook. <http://webbook.nist.gov/chemistry/> 21 Kumakura, Rie and Kazuo Yamaura. “Gel-Spinning of Partially Saponificated Poly(vinyl alcohol). Faculty of Textile Science and Technology, Shinshu University, Japan. September 1999. 22 Polymer Extrusion. Ralph Bridge. University of Connecticut. Accessed March 2006. < http://www.salspolymer.com/sources/Polymer%20Extrusion.htm> 23 Harper, Charles A. Handbook of plastics, elastomers, and composites. 4th Ed. New York : McGraw-Hill, c2002.
24 Browne, F. L. “Theories of the Combustion of Wood and its Control.” Forest Products Laboratory, U.S. Department of Agriculture. <http://www.fpl.fs.fed. us/documnts /fplmisc/rpt2136.pdf> 25 Utility. Accessed March 2006. < http://en.wikipedia.org/wiki/Utility> 26 Welty, James R. et al. Fundamentals of Momentum, Heat, and Mass Transfer. 4th Edition. John Wiley & Sons, Inc. Copyright 2001. 27 Firetect flame retardant. <http://www.firetect.com/>

54
Appendix
Lydersen Calculations:
[ ]
[ ][ ]∑
∑
∑∑
∆+=
∆+=
∆−∆+=
Vc
P
c
TT
bc
V
MP
TT
04.0
34.0101325.0
567.0
2
2
Where ∆T, ∆P, and ∆V are the sum of the group contributions as found in Perry’s 7th, and
Tb is the normal boiling point and M is the molecular mass of acetic acid.
Pump Work Calculations:
( )cpipe
eqpipefo gD
LLVfzgVPW
++∆+
∆+
∆=
22
22ρ
Heater Duty Calculations:
TmCQ P ∆=
Economic Calculations:
( ) ( )TCI
iWCVCF
iCF
NPWn
kn
Snk
k −+
+++
+= ∑
−
=
1
1 11