corrective action decision document/ closure report for
TRANSCRIPT
Environmental RestorationProject
U.S. Department o f EnergyNational Nuclear Security Administration
Nevada Site Office
Environmental RestorationProject
U.S. Department o f EnergyNational Nuclear Security Administration
Nevada Site Office
NevadaEnvironmentalRestorationProject
Corrective Action Decision Document/Closure Report for Corrective Action Unit 557: Spills and Tank SitesNevada Test Site, Nevada
Controlled Copy No.: Revision No.: 0
May 2009
Approved for public release; further dissemination unlimited.
DOE/NV--1319
UNCONTROLLED when Printed

Available for sale to the public from:
U.S. Department of CommerceNational Technical Information Service5285 Port Royal RoadSpringfield, VA 22161Phone: 800.553.6847Fax: 703.605.6900Email: [email protected] ordering: http://www.ntis.gov/ordering.htm
Available electronically at http://www.osti.gov/bridge
Available for a processing fee to U.S. Department of Energy and its contractors, in paper, from:
U.S. Department of EnergyOffice of Scientific and Technical InformationP.O. Box 62Oak Ridge, TN 37831-0062Phone: 865.576.8401Fax: 865.576.5728Email: [email protected]
Reference herein to any specific commercial product, process, or service by trade name, trademark, manufacturer, or otherwise, does not necessarily constitute or imply its endorsement, recommendation, or favoring by the United States Government or any agency thereof or its contractors or subcontractors.
Printed on recycled paper
UNCONTROLLED when Printed

CORRECTIVE ACTION DECISION DOCUMENT/CLOSURE REPORT FORCORRECTIVE ACTION UNIT 557:
SPILLS AND TANK SITESNEVADA TEST SITE, NEVADA
Approved by: Date:
Kevin J. CabbleFederal Sub-Project DirectorIndustrial Sites Sub-Project
Approved by: Date:
Robert F. BoehleckeFederal Project DirectorEnvironmental Restoration Project
UNCONTROLLED when Printed

DOE/NV--1319
CORRECTIVE ACTION DECISION DOCUMENT/CLOSURE REPORT FOR
CORRECTIVE ACTION UNIT 557: SPILLS AND TANK SITES
NEVADA TEST SITE, NEVADA
U.S. Department of EnergyNational Nuclear Security Administration
Nevada Site OfficeLas Vegas, Nevada
Controlled Copy No.:
Revision No.: 0
May 2009
Approved for public release; further dissemination unlimited.
UNCONTROLLED when Printed

Table of Contents
CAU 557 CADD/CRSection: ContentsRevision: 0Date: May 2009Page i of xiii
List of Figures . . . . . . . . . . . . . . . . . . . . . . . . . . . . . . . . . . . . . . . . . . . . . . . . . . . . . . . . . . . . . . . viList of Tables . . . . . . . . . . . . . . . . . . . . . . . . . . . . . . . . . . . . . . . . . . . . . . . . . . . . . . . . . . . . . . . . viiList of Acronyms and Abbreviations . . . . . . . . . . . . . . . . . . . . . . . . . . . . . . . . . . . . . . . . . . . . . . . xExecutive Summary . . . . . . . . . . . . . . . . . . . . . . . . . . . . . . . . . . . . . . . . . . . . . . . . . . . . . . . . . ES-11.0 Introduction. . . . . . . . . . . . . . . . . . . . . . . . . . . . . . . . . . . . . . . . . . . . . . . . . . . . . . . . . . . . . 1
1.1 Purpose . . . . . . . . . . . . . . . . . . . . . . . . . . . . . . . . . . . . . . . . . . . . . . . . . . . . . . . . . . 11.2 Scope. . . . . . . . . . . . . . . . . . . . . . . . . . . . . . . . . . . . . . . . . . . . . . . . . . . . . . . . . . . . 41.3 Corrective Action Decision Document/Closure Report Contents . . . . . . . . . . . . . 5
1.3.1 Applicable Programmatic Plans and Documents . . . . . . . . . . . . . . . . . . . 61.3.2 Data Quality Assessment Summary . . . . . . . . . . . . . . . . . . . . . . . . . . . . . 6
2.0 Corrective Action Investigation Summary . . . . . . . . . . . . . . . . . . . . . . . . . . . . . . . . . . . . . 72.1 Investigation Activities . . . . . . . . . . . . . . . . . . . . . . . . . . . . . . . . . . . . . . . . . . . . . . 7
2.1.1 Fuel Spill (CAS 01-25-02) . . . . . . . . . . . . . . . . . . . . . . . . . . . . . . . . . . . . 82.1.1.1 Visual Inspection . . . . . . . . . . . . . . . . . . . . . . . . . . . . . . . . . 82.1.1.2 Field Screening . . . . . . . . . . . . . . . . . . . . . . . . . . . . . . . . . . . 92.1.1.3 Sample Collection . . . . . . . . . . . . . . . . . . . . . . . . . . . . . . . . . 92.1.1.4 Conceptual Site Model Validation . . . . . . . . . . . . . . . . . . . 10
2.1.2 Area 3 Subdock UST (CAS 03-02-02) . . . . . . . . . . . . . . . . . . . . . . . . . . 102.1.2.1 Geophysical Survey . . . . . . . . . . . . . . . . . . . . . . . . . . . . . . 102.1.2.2 Radiological Survey . . . . . . . . . . . . . . . . . . . . . . . . . . . . . . 112.1.2.3 Visual Inspection . . . . . . . . . . . . . . . . . . . . . . . . . . . . . . . . 112.1.2.4 Video Surveys . . . . . . . . . . . . . . . . . . . . . . . . . . . . . . . . . . . 112.1.2.5 Field Screening . . . . . . . . . . . . . . . . . . . . . . . . . . . . . . . . . . 122.1.2.6 Sample Collection . . . . . . . . . . . . . . . . . . . . . . . . . . . . . . . . 122.1.2.7 Conceptual Site Model Validation . . . . . . . . . . . . . . . . . . . 12
2.1.3 Tar Spills (CAS 06-99-10) . . . . . . . . . . . . . . . . . . . . . . . . . . . . . . . . . . . 132.1.3.1 Visual Inspection . . . . . . . . . . . . . . . . . . . . . . . . . . . . . . . . 132.1.3.2 Field Screening . . . . . . . . . . . . . . . . . . . . . . . . . . . . . . . . . . 132.1.3.3 Sample Collection . . . . . . . . . . . . . . . . . . . . . . . . . . . . . . . . 132.1.3.4 Conceptual Site Model Validation . . . . . . . . . . . . . . . . . . . 14
2.1.4 Train Maintenance Bldg 3901 Spill Site (CAS 25-25-18) . . . . . . . . . . . 142.1.4.1 Radiological Survey . . . . . . . . . . . . . . . . . . . . . . . . . . . . . . 142.1.4.2 Visual Inspection . . . . . . . . . . . . . . . . . . . . . . . . . . . . . . . . 142.1.4.3 Field Screening . . . . . . . . . . . . . . . . . . . . . . . . . . . . . . . . . . 142.1.4.4 Sample Collection . . . . . . . . . . . . . . . . . . . . . . . . . . . . . . . . 152.1.4.5 Conceptual Site Model Validation . . . . . . . . . . . . . . . . . . . 16
2.2 Results. . . . . . . . . . . . . . . . . . . . . . . . . . . . . . . . . . . . . . . . . . . . . . . . . . . . . . . . . . 162.2.1 Summary of Analytical Data . . . . . . . . . . . . . . . . . . . . . . . . . . . . . . . . . 16
2.2.1.1 Fuel Spill (CAS 01-25-02) . . . . . . . . . . . . . . . . . . . . . . . . . 172.2.1.2 Area 3 Subdock UST (CAS 03-02-02) . . . . . . . . . . . . . . . . 17
UNCONTROLLED when Printed

Table of Contents (Continued)
CAU 557 CADD/CRSection: ContentsRevision: 0Date: May 2009Page ii of xiii
2.2.1.3 Tar Spills (CAS 06-99-10) . . . . . . . . . . . . . . . . . . . . . . . . . 192.2.1.4 Train Maintenance Bldg 3901 Spill Site
(CAS 25-25-18) . . . . . . . . . . . . . . . . . . . . . . . . . . . . . . . . . 202.2.2 Data Assessment Summary . . . . . . . . . . . . . . . . . . . . . . . . . . . . . . . . . . 22
2.3 Justification for No Further Action. . . . . . . . . . . . . . . . . . . . . . . . . . . . . . . . . . . . 232.3.1 Final Action Levels. . . . . . . . . . . . . . . . . . . . . . . . . . . . . . . . . . . . . . . . . 23
3.0 Recommendations. . . . . . . . . . . . . . . . . . . . . . . . . . . . . . . . . . . . . . . . . . . . . . . . . . . . . . . 264.0 References. . . . . . . . . . . . . . . . . . . . . . . . . . . . . . . . . . . . . . . . . . . . . . . . . . . . . . . . . . . . . 27
Appendix A - Corrective Action Investigation Results
A.1.0 Introduction. . . . . . . . . . . . . . . . . . . . . . . . . . . . . . . . . . . . . . . . . . . . . . . . . . . . . . . . . . . A-1A.1.1 Project Objective. . . . . . . . . . . . . . . . . . . . . . . . . . . . . . . . . . . . . . . . . . . . . . . . . A-2A.1.2 Contents . . . . . . . . . . . . . . . . . . . . . . . . . . . . . . . . . . . . . . . . . . . . . . . . . . . . . . . A-2
A.2.0 Investigation Overview . . . . . . . . . . . . . . . . . . . . . . . . . . . . . . . . . . . . . . . . . . . . . . . . . A-4A.2.1 Boring and Sample Locations. . . . . . . . . . . . . . . . . . . . . . . . . . . . . . . . . . . . . . . A-5A.2.2 Investigation Activities . . . . . . . . . . . . . . . . . . . . . . . . . . . . . . . . . . . . . . . . . . . . A-6
A.2.2.1 Radiological Walkover Surveys . . . . . . . . . . . . . . . . . . . . . . . . . . . . . . A-6A.2.2.2 Geophysical Surveys . . . . . . . . . . . . . . . . . . . . . . . . . . . . . . . . . . . . . . A-6A.2.2.3 Field Screening . . . . . . . . . . . . . . . . . . . . . . . . . . . . . . . . . . . . . . . . . . . A-6A.2.2.4 Video Surveys. . . . . . . . . . . . . . . . . . . . . . . . . . . . . . . . . . . . . . . . . . . . A-7A.2.2.5 Surface and Subsurface Soil Sampling. . . . . . . . . . . . . . . . . . . . . . . . . A-7A.2.2.6 Waste Characterization Sampling. . . . . . . . . . . . . . . . . . . . . . . . . . . . . A-8
A.2.3 Laboratory Analytical Information . . . . . . . . . . . . . . . . . . . . . . . . . . . . . . . . . A-10A.2.4 Comparison to Action Levels . . . . . . . . . . . . . . . . . . . . . . . . . . . . . . . . . . . . . . A-10
A.3.0 CAS 01-25-02, Fuel Spill, Investigation Results . . . . . . . . . . . . . . . . . . . . . . . . . . . . . A-12A.3.1 Corrective Action Investigation. . . . . . . . . . . . . . . . . . . . . . . . . . . . . . . . . . . . A-12
A.3.1.1 Visual Inspections. . . . . . . . . . . . . . . . . . . . . . . . . . . . . . . . . . . . . . . . A-12A.3.1.2 Field Screening . . . . . . . . . . . . . . . . . . . . . . . . . . . . . . . . . . . . . . . . . . A-14A.3.1.3 Sample Collection. . . . . . . . . . . . . . . . . . . . . . . . . . . . . . . . . . . . . . . . A-14A.3.1.4 Deviations . . . . . . . . . . . . . . . . . . . . . . . . . . . . . . . . . . . . . . . . . . . . . . A-15
A.3.2 Investigation Results. . . . . . . . . . . . . . . . . . . . . . . . . . . . . . . . . . . . . . . . . . . . . A-15A.3.2.1 Volatile Organic Compounds . . . . . . . . . . . . . . . . . . . . . . . . . . . . . . . A-16A.3.2.2 Semivolatile Organic Compounds . . . . . . . . . . . . . . . . . . . . . . . . . . . A-16A.3.2.3 Total Petroleum Hydrocarbons. . . . . . . . . . . . . . . . . . . . . . . . . . . . . . A-16
A.3.3 Nature and Extent of Contamination . . . . . . . . . . . . . . . . . . . . . . . . . . . . . . . . A-17A.3.4 Conceptual Site Model . . . . . . . . . . . . . . . . . . . . . . . . . . . . . . . . . . . . . . . . . . . A-17
A.4.0 CAS 03-02-02, Area 3 Subdock UST, Investigation Results . . . . . . . . . . . . . . . . . . . . A-18A.4.1 Corrective Action Investigation . . . . . . . . . . . . . . . . . . . . . . . . . . . . . . . . . . . . A-18
UNCONTROLLED when Printed
Table of Contents (Continued)
CAU 557 CADD/CRSection: ContentsRevision: 0Date: May 2009Page iii of xiii
A.4.1.1 Geophysical Survey . . . . . . . . . . . . . . . . . . . . . . . . . . . . . . . . . A-18A.4.1.2 Visual Inspections. . . . . . . . . . . . . . . . . . . . . . . . . . . . . . . . . . . . . . . . A-18A.4.1.3 Video Surveys. . . . . . . . . . . . . . . . . . . . . . . . . . . . . . . . . . . . . . . . . . . A-21A.4.1.4 Field Screening . . . . . . . . . . . . . . . . . . . . . . . . . . . . . . . . . . . . . . . . . . A-22A.4.1.5 Sample Collection. . . . . . . . . . . . . . . . . . . . . . . . . . . . . . . . . . . . . . . . A-22A.4.1.6 Deviations . . . . . . . . . . . . . . . . . . . . . . . . . . . . . . . . . . . . . . . . . . . . . . A-22
A.4.2 Investigation Results. . . . . . . . . . . . . . . . . . . . . . . . . . . . . . . . . . . . . . . . . . . . . A-23A.4.2.1 Volatile Organic Compounds . . . . . . . . . . . . . . . . . . . . . . . . . . . . . . . A-23A.4.2.2 Semivolatile Organic Compounds . . . . . . . . . . . . . . . . . . . . . . . . . . . A-23A.4.2.3 Total Petroleum Hydrocarbons. . . . . . . . . . . . . . . . . . . . . . . . . . . . . . A-23A.4.2.4 Total RCRA Metals and Beryllium . . . . . . . . . . . . . . . . . . . . . . . . . . A-24A.4.2.5 Polychlorinated Biphenyls. . . . . . . . . . . . . . . . . . . . . . . . . . . . . . . . . A-25A.4.2.6 Pesticides . . . . . . . . . . . . . . . . . . . . . . . . . . . . . . . . . . . . . . . . . . . . . . A-25A.4.2.7 Gamma-Emitting Radionuclides . . . . . . . . . . . . . . . . . . . . . . . . . . . . A-25A.4.2.8 Uranium, Plutonium, and Strontium-90 Isotopes . . . . . . . . . . . . . . . . A-26
A.4.3 Nature and Extent of Contamination . . . . . . . . . . . . . . . . . . . . . . . . . . . . . . . . A-26A.4.4 Conceptual Site Model . . . . . . . . . . . . . . . . . . . . . . . . . . . . . . . . . . . . . . . . . . . A-26
A.5.0 CAS 06-99-10, Tar Spills, Investigation Results. . . . . . . . . . . . . . . . . . . . . . . . . . . . . A-28A.5.1 Corrective Action Investigation . . . . . . . . . . . . . . . . . . . . . . . . . . . . . . . . . . . . A-28
A.5.1.1 Visual Inspections. . . . . . . . . . . . . . . . . . . . . . . . . . . . . . . . . . . . . . . . A-28A.5.1.2 Field Screening . . . . . . . . . . . . . . . . . . . . . . . . . . . . . . . . . . . . . . . . . . A-28A.5.1.3 Sample Collection. . . . . . . . . . . . . . . . . . . . . . . . . . . . . . . . . . . . . . . . A-31A.5.1.4 Deviations . . . . . . . . . . . . . . . . . . . . . . . . . . . . . . . . . . . . . . . . . . . . . . A-31
A.5.2 Investigation Results. . . . . . . . . . . . . . . . . . . . . . . . . . . . . . . . . . . . . . . . . . . . . A-31A.5.2.1 Volatile Organic Compounds . . . . . . . . . . . . . . . . . . . . . . . . . . . . . . . A-32A.5.2.2 Semivolatile Organic Compounds . . . . . . . . . . . . . . . . . . . . . . . . . . . A-32A.5.2.3 Total Petroleum Hydrocarbons. . . . . . . . . . . . . . . . . . . . . . . . . . . . . . A-32A.5.2.4 Total RCRA Metals . . . . . . . . . . . . . . . . . . . . . . . . . . . . . . . . . . . . . . A-33A.5.2.5 Polychlorinated Biphenyls . . . . . . . . . . . . . . . . . . . . . . . . . . . . . . . . . A-33A.5.2.6 Total Pesticides . . . . . . . . . . . . . . . . . . . . . . . . . . . . . . . . . . . . . . . . . . A-33A.5.2.7 Gamma-Emitting Radionuclides . . . . . . . . . . . . . . . . . . . . . . . . . . . . A-33A.5.2.8 Uranium, Plutonium, and Strontium-90 Isotopes . . . . . . . . . . . . . . . . A-34A.5.2.9 Potential Source Material . . . . . . . . . . . . . . . . . . . . . . . . . . . . . . . . . . A-34
A.5.3 Nature and Extent of Contamination . . . . . . . . . . . . . . . . . . . . . . . . . . . . . . . . A-34A.5.4 Conceptual Site Model . . . . . . . . . . . . . . . . . . . . . . . . . . . . . . . . . . . . . . . . . . . A-35
A.6.0 CAS 25-25-18, Train Maintenance Bldg 3901 Spill Site, Investigation Results . . . . . A-36A.6.1 Corrective Action Investigation . . . . . . . . . . . . . . . . . . . . . . . . . . . . . . . . . . . . A-36
A.6.1.1 Field Screening . . . . . . . . . . . . . . . . . . . . . . . . . . . . . . . . . . . . . . . . . . A-36A.6.1.2 Radiological Surveys . . . . . . . . . . . . . . . . . . . . . . . . . . . . . . . . . . . . . A-36A.6.1.3 Visual Inspections. . . . . . . . . . . . . . . . . . . . . . . . . . . . . . . . . . . . . . . . A-40
UNCONTROLLED when Printed
Table of Contents (Continued)
CAU 557 CADD/CRSection: ContentsRevision: 0Date: May 2009Page iv of xiii
A.6.1.4 Sample Collection. . . . . . . . . . . . . . . . . . . . . . . . . . . . . . . . . . . . . . . . A-40A.6.1.5 Deviations . . . . . . . . . . . . . . . . . . . . . . . . . . . . . . . . . . . . . . . . . . . . . . A-41
A.6.2 Investigation Results. . . . . . . . . . . . . . . . . . . . . . . . . . . . . . . . . . . . . . . . . . . . . A-41A.6.2.1 Volatile Organic Compounds . . . . . . . . . . . . . . . . . . . . . . . . . . . . . . . A-42A.6.2.2 Semivolatile Organic Compounds . . . . . . . . . . . . . . . . . . . . . . . . . . . A-42A.6.2.3 Total Petroleum Hydrocarbons. . . . . . . . . . . . . . . . . . . . . . . . . . . . . . A-42A.6.2.4 Total RCRA Metals and Beryllium . . . . . . . . . . . . . . . . . . . . . . . . . . A-44A.6.2.5 Polychlorinated Biphenyls . . . . . . . . . . . . . . . . . . . . . . . . . . . . . . . . . A-45A.6.2.6 Pesticides . . . . . . . . . . . . . . . . . . . . . . . . . . . . . . . . . . . . . . . . . . . . . . A-46A.6.2.7 Gamma-Emitting Radionuclides . . . . . . . . . . . . . . . . . . . . . . . . . . . . A-46A.6.2.8 Uranium, Plutonium, and Strontium-90 Isotopes . . . . . . . . . . . . . . . . A-47
A.6.3 Nature and Extent of Contamination . . . . . . . . . . . . . . . . . . . . . . . . . . . . . . . . A-48A.6.4 Conceptual Site Model . . . . . . . . . . . . . . . . . . . . . . . . . . . . . . . . . . . . . . . . . . . A-48
A.7.0 Waste Management. . . . . . . . . . . . . . . . . . . . . . . . . . . . . . . . . . . . . . . . . . . . . . . . . . . . A-49A.7.1 Investigation-Derived Waste . . . . . . . . . . . . . . . . . . . . . . . . . . . . . . . . . . . . . . A-49A.7.2 Best Management Practices Waste . . . . . . . . . . . . . . . . . . . . . . . . . . . . . . . . . . A-49
A.7.2.1 Waste Characterization and Disposition. . . . . . . . . . . . . . . . . . . . . . . A-51A.7.2.1.1 Steel Casing . . . . . . . . . . . . . . . . . . . . . . . . . . . . . . . . . . A-51A.7.2.1.2 Tar . . . . . . . . . . . . . . . . . . . . . . . . . . . . . . . . . . . . . . . . . . A-51
A.7.3 Toxicity Characteristic Leaching Procedure Results . . . . . . . . . . . . . . . . . . . . A-51A.8.0 Quality Assurance. . . . . . . . . . . . . . . . . . . . . . . . . . . . . . . . . . . . . . . . . . . . . . . . . . . . . A-53
A.8.1 Data Validation . . . . . . . . . . . . . . . . . . . . . . . . . . . . . . . . . . . . . . . . . . . . . . . . . A-53A.8.1.1 Tier I Evaluation . . . . . . . . . . . . . . . . . . . . . . . . . . . . . . . . . . . . . . . . . A-53A.8.1.2 Tier II Evaluation . . . . . . . . . . . . . . . . . . . . . . . . . . . . . . . . . . . . . . . . A-54A.8.1.3 Tier III Evaluation . . . . . . . . . . . . . . . . . . . . . . . . . . . . . . . . . . . . . . . A-55A.8.1.4 Field QC Samples . . . . . . . . . . . . . . . . . . . . . . . . . . . . . . . . . . . . . . . A-57A.8.1.5 Laboratory QC Samples . . . . . . . . . . . . . . . . . . . . . . . . . . . . . . . . . . . A-57
A.8.2 Field Nonconformances . . . . . . . . . . . . . . . . . . . . . . . . . . . . . . . . . . . . . . . . . . A-58A.8.3 Laboratory Nonconformances . . . . . . . . . . . . . . . . . . . . . . . . . . . . . . . . . . . . . A-58
A.9.0 Summary. . . . . . . . . . . . . . . . . . . . . . . . . . . . . . . . . . . . . . . . . . . . . . . . . . . . . . . . . . . . A-59A.10.0 References. . . . . . . . . . . . . . . . . . . . . . . . . . . . . . . . . . . . . . . . . . . . . . . . . . . . . . . . . . . A-60
Appendix B - Data Assessment
B.1.0 Data Assessment . . . . . . . . . . . . . . . . . . . . . . . . . . . . . . . . . . . . . . . . . . . . . . . . . . . . . . . B-1B.1.1 Review DQOs and Sampling Design . . . . . . . . . . . . . . . . . . . . . . . . . . . . . . . . . B-2
B.1.1.1 Decision I . . . . . . . . . . . . . . . . . . . . . . . . . . . . . . . . . . . . . . . . . . . . . . . B-2B.1.1.1.1 DQO Provisions To Limit False Negative
Decision Error . . . . . . . . . . . . . . . . . . . . . . . . . . . . . . . . . . B-2
UNCONTROLLED when Printed

Table of Contents (Continued)
CAU 557 CADD/CRSection: ContentsRevision: 0Date: May 2009Page v of xiii
B.1.1.1.2 DQO Provisions To Limit False Positive Decision Error . . . . . . . . . . . . . . . . . . . . . . . . . . . . . . . . . . B-7
B.1.1.2 Decision II . . . . . . . . . . . . . . . . . . . . . . . . . . . . . . . . . . . . . . . . . . . . . . B-7B.1.1.3 Sampling Design. . . . . . . . . . . . . . . . . . . . . . . . . . . . . . . . . . . . . . . . . . B-7
B.1.2 Conduct a Preliminary Data Review . . . . . . . . . . . . . . . . . . . . . . . . . . . . . . . . . B-8B.1.3 Select the Test and Identify Key Assumptions . . . . . . . . . . . . . . . . . . . . . . . . . . B-8B.1.4 Verify the Assumptions . . . . . . . . . . . . . . . . . . . . . . . . . . . . . . . . . . . . . . . . . . . B-8B.1.5 Draw Conclusions from the Data . . . . . . . . . . . . . . . . . . . . . . . . . . . . . . . . . . . . B-8
B.1.5.1 Decision Rules for Decision I. . . . . . . . . . . . . . . . . . . . . . . . . . . . . . . . B-9B.1.5.2 Decision Rules for Decision II . . . . . . . . . . . . . . . . . . . . . . . . . . . . . . B-10
B.2.0 References. . . . . . . . . . . . . . . . . . . . . . . . . . . . . . . . . . . . . . . . . . . . . . . . . . . . . . . . . . . B-11
Appendix C - Risk Assessment
C.1.0 Evaluation of Risk . . . . . . . . . . . . . . . . . . . . . . . . . . . . . . . . . . . . . . . . . . . . . . . . . . . . . C-1C.1.1 A. Scenario . . . . . . . . . . . . . . . . . . . . . . . . . . . . . . . . . . . . . . . . . . . . . . . . . . . . . C-2C.1.2 B. Site Assessment . . . . . . . . . . . . . . . . . . . . . . . . . . . . . . . . . . . . . . . . . . . . . . . C-4C.1.3 C. Site Classification and Initial Response Action . . . . . . . . . . . . . . . . . . . . . . . C-4C.1.4 D. Development of Tier 1 Lookup Table of RBSLs. . . . . . . . . . . . . . . . . . . . . . C-5C.1.5 E. Exposure Pathway Evaluation . . . . . . . . . . . . . . . . . . . . . . . . . . . . . . . . . . . . C-6C.1.6 F. Comparison of Site Conditions with Tier 1 RBSLs . . . . . . . . . . . . . . . . . . . . C-6C.1.7 G. Evaluation of Tier 1 Results . . . . . . . . . . . . . . . . . . . . . . . . . . . . . . . . . . . . . C-6C.1.8 H. Tier 1 Remedial Action Evaluation . . . . . . . . . . . . . . . . . . . . . . . . . . . . . . . . C-7C.1.9 I. Tier 2 Evaluation . . . . . . . . . . . . . . . . . . . . . . . . . . . . . . . . . . . . . . . . . . . . . . . C-7C.1.10 J. Development of Tier 2 SSTLs . . . . . . . . . . . . . . . . . . . . . . . . . . . . . . . . . . . . C-7C.1.11 K. Comparison of Site Conditions with Tier 2 SSTLs . . . . . . . . . . . . . . . . . . . . C-7C.1.12 L. Tier 2 Remedial Action Evaluation . . . . . . . . . . . . . . . . . . . . . . . . . . . . . . . . C-9
C.2.0 Recommendations. . . . . . . . . . . . . . . . . . . . . . . . . . . . . . . . . . . . . . . . . . . . . . . . . . . . . C-10C.3.0 References. . . . . . . . . . . . . . . . . . . . . . . . . . . . . . . . . . . . . . . . . . . . . . . . . . . . . . . . . . . C-11
Appendix D - Borehole and Sample Location Coordinates
D.1.0 Sample Location Coordinates . . . . . . . . . . . . . . . . . . . . . . . . . . . . . . . . . . . . . . . . . . . . . D-1
Appendix E - Nevada Division of Environmental Protection Comments
UNCONTROLLED when Printed

CAU 557 CADD/CRSection: ContentsRevision: 0Date: May 2009Page vi of xiii
List of Figures
Number Title Page
1-1 Nevada Test Site . . . . . . . . . . . . . . . . . . . . . . . . . . . . . . . . . . . . . . . . . . . . . . . . . . . . .2
1-2 Corrective Action Unit 557, CAS Location Map . . . . . . . . . . . . . . . . . . . . . . . . . . . .3
A.3-1 Corrective Action Investigation Site Map for CAS 01-25-02, Fuel Spill . . . . . A-13
A.4-1 Corrective Action Investigation Site Map for CAS 03-02-02, Area 3 Subdock UST . . . . . . . . . . . . . . . . . . . . . . . . . . . . . . . . . . . . . . . . . . . . . A-19
A.5-1 Corrective Action Investigation Site Map for CAS 06-99-10, Tar Spills. . . . . . A-29
A.6-1 Corrective Action Investigation Site Map for CAS 25-25-18,Train Maintenance Bldg 3901 Spill Site. . . . . . . . . . . . . . . . . . . . . . . . . . . . . . . A-37
C.1-1 Risk-Based Corrective Action Decision Process . . . . . . . . . . . . . . . . . . . . . . . . . .C-3
List of Figures
UNCONTROLLED when Printed

CAU 557 CADD/CRSection: ContentsRevision: 0Date: May 2009Page vii of xiii
List of Tables
Number Title Page
2-1 Maximum Concentration of Detected Contaminants in Soil for CAS 01-25-02, Fuel Spill . . . . . . . . . . . . . . . . . . . . . . . . . . . . . . . . . . . . . . . . . 17
2-2 Maximum Concentration of Detected Contaminants in Soil for CAS 03-02-02, Area 3 Subdock UST . . . . . . . . . . . . . . . . . . . . . . . . . . . . . . . . 18
2-3 Maximum Concentration of Detected Contaminants in Soil for CAS 06-99-10, Tar Spills . . . . . . . . . . . . . . . . . . . . . . . . . . . . . . . . . . . . . . . . . 19
2-4 Maximum Concentration of Detected Contaminants in Tar for CAS 06-99-10, Tar Spills . . . . . . . . . . . . . . . . . . . . . . . . . . . . . . . . . . . . . . . . . 20
2-5 Maximum Concentration of Detected Contaminants in Soil for CAS 25-25-18, Train Maintenance Bldg 3901 Spill Site . . . . . . . . . . . . . . . . . 21
2-6 Definition of FALs for CAU 557 COPCs . . . . . . . . . . . . . . . . . . . . . . . . . . . . . . . 25
A.2-1 Corrective Active Investigation Activities Conducted at CAU 557To Meet CAIP Requirements . . . . . . . . . . . . . . . . . . . . . . . . . . . . . . . . . . . . . . . . A-4
A.2-2 Laboratory Analyses and Methods, CAU 557 Investigation Samples . . . . . . . . . A-8
A.3-1 Samples Collected at CAS 01-25-02, Fuel Spill. . . . . . . . . . . . . . . . . . . . . . . . . A-14
A.3-2 Soil Sample Results for VOCs Detected above MDCs at CAS 01-25-02, Fuel Spill . . . . . . . . . . . . . . . . . . . . . . . . . . . . . . . . . . . . . . . . . . A-16
A.3-3 Soil Sample Results for TPH-DRO Detected above MDCs at CAS 01-25-02, Fuel Spill . . . . . . . . . . . . . . . . . . . . . . . . . . . . . . . . . . . . . . . . . . A-16
A.4-1 Samples Collected at CAS 03-02-02, Area 3 Subdock UST . . . . . . . . . . . . . . . A-20
A.4-2 Soil Sample Results for TPH-DRO Detected above MDCs at CAS 03-02-02, Area 3 Subdock UST. . . . . . . . . . . . . . . . . . . . A-24
A.4-3 Soil Sample Results for RCRA Metals and Beryllium Detected above MDCs at CAS 03-02-02, Area 3 Subdock UST. . . . . . . . . . . . . . . . . . . . A-24
List of Tables
UNCONTROLLED when Printed

CAU 557 CADD/CRSection: ContentsRevision: 0Date: May 2009Page viii of xiii
List of Tables (Continued)
Number Title Page
A.4-4 Soil Sample Results for Gamma-Emitting Radionuclides Detected above MDCs at CAS 03-02-02, Area 3 Subdock UST . . . . . . . . . . . . . . . . . . . A-26
A.4-5 Soil Sample Results for Isotopes Detected above MDCs atCAS 03-02-02, Area 3 Subdock UST . . . . . . . . . . . . . . . . . . . . . . . . . . . . . . . . A-27
A.5-1 Samples Collected at CAS 06-99-10, Tar Spills . . . . . . . . . . . . . . . . . . . . . . . . A-30
A.5-2 Soil Sample Results for TPH-DRO Detected above MDCs at CAS 06-99-10, Tar Spills . . . . . . . . . . . . . . . . . . . . . . . . . . . . . . . . . . . . . . . A-32
A.5-3 Soil Sample Results for Total RCRA Metals Detected above MDCs at CAS 06-99-10, Tar Spills . . . . . . . . . . . . . . . . . . . . . . . . . . . . A-33
A.5-4 Soil Sample Results for Gamma-Emitting Radionuclides Detected above MDCs at CAS 06-99-10, Tar Spills . . . . . . . . . . . . . . . . . . . . . . . . . . . . A-34
A.5-5 Tar Sample Results Detected above MDCs at CAS 06-99-10, Tar Spills . . . . . . . . . . . . . . . . . . . . . . . . . . . . . . . . . . . . . . . . . . . . . . . . . . . . . . A-35
A.6-1 Samples Collected at CAS 25-25-18, Train Maintenance Bldg 3901 Spill Site. . . . . . . . . . . . . . . . . . . . . . . . . . . . . . . . . . . . . . . . . . . . . . . . . . . . . . . A-38
A.6-2 Sample Results for Total VOCs Detected above MDCs at CAS 25-25-18, Train Maintenance Bldg 3901 Spill Site . . . . . . . . . . . . . . . . . A-42
A.6-3 Sample Results for Total SVOCs Detected above MDCs at CAS 25-25-18, Train Maintenance Bldg 3901 Spill Site . . . . . . . . . . . . . . . . . A-43
A.6-4 Soil Sample Results for TPH-DRO Detected above MDCs at CAS 25-25-18, Train Maintenance Bldg 3901 Spill Site . . . . . . . . . . . . . . . . . A-43
A.6-5 Sample Results for Total RCRA Metals and Beryllium Detected above MDCs at CAS 25-25-18, Train Maintenance Bldg 3901 Spill Site. . . . . . . . . . . . . . . . . . . . . . . . . . . . . . . . . . . . . . . . . . . . . . . . . . . . . . . A-44
A.6-6 Sample Results for PCBs Detected above MDCs at CAS 25-25-18, Train Maintenance Bldg 3901 Spill Site . . . . . . . . . . . . . . . . . . . . . . . . . . . . . . A-46
UNCONTROLLED when Printed
CAU 557 CADD/CRSection: ContentsRevision: 0Date: May 2009Page ix of xiii
List of Tables (Continued)
Number Title Page
A.6-7 Sample Results for Pesticides Detected above MDCs at CAS 25-25-18, Train Maintenance Bldg 3901 Spill Site . . . . . . . . . . . . . . . . . A-46
A.6-8 Sample Results for Gamma-Emitting Radionuclides Detected above MDCs at CAS 25-25-18, Train Maintenance Bldg 3901 Spill Site . . . . . . . . . . . . . . . . . . . . . . . . . . . . . . . . . . . . . . . . . . . . . . A-47
A.6-9 Sample Results for Isotopes Detected above MDCs atCAS 25-25-18, Train Maintenance Bldg 3901 Spill Site . . . . . . . . . . . . . . . . . A-48
A.7-1 Waste Summary. . . . . . . . . . . . . . . . . . . . . . . . . . . . . . . . . . . . . . . . . . . . . . . . . A-50
A.7-2 TCLP Sample Results for CAU 557 . . . . . . . . . . . . . . . . . . . . . . . . . . . . . . . . . A-52
B.1-1 CAU 557 Analyses Performed . . . . . . . . . . . . . . . . . . . . . . . . . . . . . . . . . . . . . . B-4
B.1-2 Analytes Failing Sensitivity Criteria . . . . . . . . . . . . . . . . . . . . . . . . . . . . . . . . . . B-4
B.1-3 Key Assumptions . . . . . . . . . . . . . . . . . . . . . . . . . . . . . . . . . . . . . . . . . . . . . . . . . B-9
C.1-1 Maximum Reported Value of TPH-DRO for Tier 1 Comparison . . . . . . . . . . . . C-4
C.1-2 Contaminants of Potential Concern Detected above PALs . . . . . . . . . . . . . . . . . C-6
C.1-3 Tier 2 SSTLs and CAU 557 Results for Hazardous Constituents of Diesel in Soil and Tar . . . . . . . . . . . . . . . . . . . . . . . . . . . . . . . . . . . . . . . . . . . C-8
D.1-1 Sample Location Coordinates and Locations of Interest for CAU 557. . . . . . . . D-1
UNCONTROLLED when Printed
CAU 557 CADD/CRSection: ContentsRevision: 0Date: May 2009Page x of xiii
List of Acronyms and Abbreviations
Ac Actinium
Am Americium
ASTM American Society for Testing and Materials
bgs Below ground surface
BMP Best management practice
CADD Corrective action decision document
CAI Corrective action investigation
CAIP Corrective action investigation plan
CAS Corrective action site
CAU Corrective action unit
CLP Contract Laboratory Program
COC Contaminant of concern
COPC Contaminant of potential concern
CP Control Point
CR Closure report
Cs Cesium
CSM Conceptual site model
DOE U.S. Department of Energy
DQA Data quality assessment
DQI Data quality indicator
DQO Data quality objective
DRO Diesel-range organics
EMAD Engine Maintenance, Assembly, and Disassembly
EML Environmental Measurements Laboratory
EPA U.S. Environmental Protection Agency
ETSM Engine Transport System MaintenanceList of Acronyms and Abbreviations
UNCONTROLLED when Printed
CAU 557 CADD/CRSection: ContentsRevision: 0Date: May 2009Page xi of xiii
List of Acronyms and Abbreviations (Continued)
Eu Europium
FAL Final action level
FD Field duplicate
FFACO Federal Facility Agreement and Consent Order
FSL Field-screening level
FSR Field-screening result
ft Foot
ID Identification
IDW Investigation-derived waste
in. Inch
LCS Laboratory control sample
LLVF Landfill Load Verification Form
m Meter
MDC Minimum detectable concentration
mg/kg Milligrams per kilogram
mi Mile
MS Matrix spike
MSD Matrix spike duplicate
N/A Not applicable
NAC Nevada Administrative Code
NAD North American Datum
NCRP National Council on Radiation Protection and Measurements
ND Nondetect
NDEP Nevada Division of Environmental Protection
NIST National Institute of Standards and Technology
NNSA/NSO U.S. Department of Energy, National Nuclear Security Administration Nevada Site Office
UNCONTROLLED when Printed

CAU 557 CADD/CRSection: ContentsRevision: 0Date: May 2009Page xii of xiii
List of Acronyms and Abbreviations (Continued)
NTS Nevada Test Site
NV/YMP Nevada Yucca Mountain Project
PAL Preliminary action level
Pb Lead
PB Preparation blank
PCB Polychlorinated biphenyl
pCi/g Picocuries per gram
PID Photoionization detector
POC Performance objective criteria
PPE Personal protective equipment
ppm Parts per million
PRG Preliminary remediation goal
PSM Potential source material
Pu Plutonium
QA Quality assurance
QAPP Quality Assurance Project Plan
QC Quality control
RadCon Radiological Control
RAIS Risk Assessment Information System
RBCA Risk-based corrective action
RBSL Risk-based screening level
RCRA Resource Conservation and Recovery Act
RESRAD Residual Radioactive
ROTC Record of Technical Change
RPD Relative percent difference
SCL Sample collection log
UNCONTROLLED when Printed
CAU 557 CADD/CRSection: ContentsRevision: 0Date: May 2009Page xiii of xiii
List of Acronyms and Abbreviations (Continued)
SDG Sample delivery group
SNJV Stoller-Navarro Joint Venture
Sr Strontium
SSL Soil screening level
SSTL Site-specific target level
SVOC Semivolatile organic compound
TBD To be determined
TC Toxicity characteristic
TCE Trichloroethene
TCLP Toxicity characteristic leaching procedure
Tl Thallium
TPH Total petroleum hydrocarbons
U Uranium
UST Underground storage tank
UTM Universal Transverse Mercator
VOC Volatile organic compound
yd3 Cubic yard
%R Percent recovery
UNCONTROLLED when Printed
CAU 557 CADD/CRExecutive SummaryRevision: 0Date: May 2009Page ES-1 of ES-2
Executive Summary
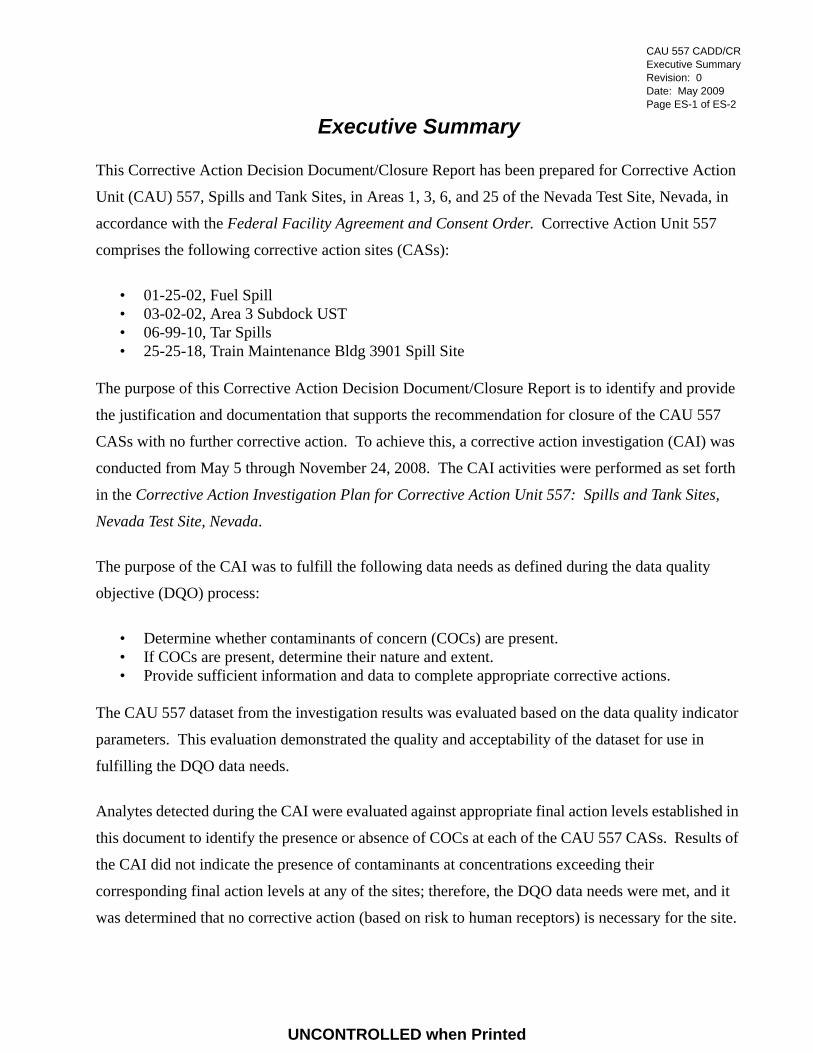
This Corrective Action Decision Document/Closure Report has been prepared for Corrective Action
Unit (CAU) 557, Spills and Tank Sites, in Areas 1, 3, 6, and 25 of the Nevada Test Site, Nevada, in
accordance with the Federal Facility Agreement and Consent Order. Corrective Action Unit 557
comprises the following corrective action sites (CASs):
• 01-25-02, Fuel Spill• 03-02-02, Area 3 Subdock UST• 06-99-10, Tar Spills• 25-25-18, Train Maintenance Bldg 3901 Spill Site
The purpose of this Corrective Action Decision Document/Closure Report is to identify and provide
the justification and documentation that supports the recommendation for closure of the CAU 557
CASs with no further corrective action. To achieve this, a corrective action investigation (CAI) was
conducted from May 5 through November 24, 2008. The CAI activities were performed as set forth
in the Corrective Action Investigation Plan for Corrective Action Unit 557: Spills and Tank Sites,
Nevada Test Site, Nevada.
The purpose of the CAI was to fulfill the following data needs as defined during the data quality
objective (DQO) process:
• Determine whether contaminants of concern (COCs) are present.• If COCs are present, determine their nature and extent.• Provide sufficient information and data to complete appropriate corrective actions.
The CAU 557 dataset from the investigation results was evaluated based on the data quality indicator
parameters. This evaluation demonstrated the quality and acceptability of the dataset for use in
fulfilling the DQO data needs.
Analytes detected during the CAI were evaluated against appropriate final action levels established in
this document to identify the presence or absence of COCs at each of the CAU 557 CASs. Results of
the CAI did not indicate the presence of contaminants at concentrations exceeding their
corresponding final action levels at any of the sites; therefore, the DQO data needs were met, and it
was determined that no corrective action (based on risk to human receptors) is necessary for the site.
Executive Summary
UNCONTROLLED when Printed

CAU 557 CADD/CRExecutive SummaryRevision: 0Date: May 2009Page ES-2 of ES-2
Based on the evaluation of the data quality indicator parameters for the CAI, the quality and
acceptability of the dataset were demonstrated by fulfilling the DQO needs. Therefore, the
U.S. Department of Energy, National Nuclear Security Administration Nevada Site Office provides
the following recommendations:
• No further action is necessary for CAU 557.
• A Notice of Completion to the U.S. Department of Energy, National Nuclear Security Administration Nevada Site Office is requested from the Nevada Division of Environmental Protection for closure of CAU 557.
• Corrective Action Unit 557 should be moved from Appendix III to Appendix IV of the Federal Facility Agreement and Consent Order.
UNCONTROLLED when Printed

CAU 557 CADD/CRSection: 1.0Revision: 0Date: May 2009Page 1 of 28
1.0 Introduction
This Corrective Action Decision Document (CADD)/Closure Report (CR) presents information
supporting closure of Corrective Action Unit (CAU) 557, Spills and Tank Sites, Nevada Test Site
(NTS), Nevada. The corrective actions presented in this document have been completed in
accordance with the Federal Facility Agreement and Consent Order (FFACO) that was agreed
to by the State of Nevada; U.S. Department of Energy (DOE), Environmental Management;
U.S. Department of Defense; and DOE, Legacy Management (FFACO, 1996; as amended
February 2008).
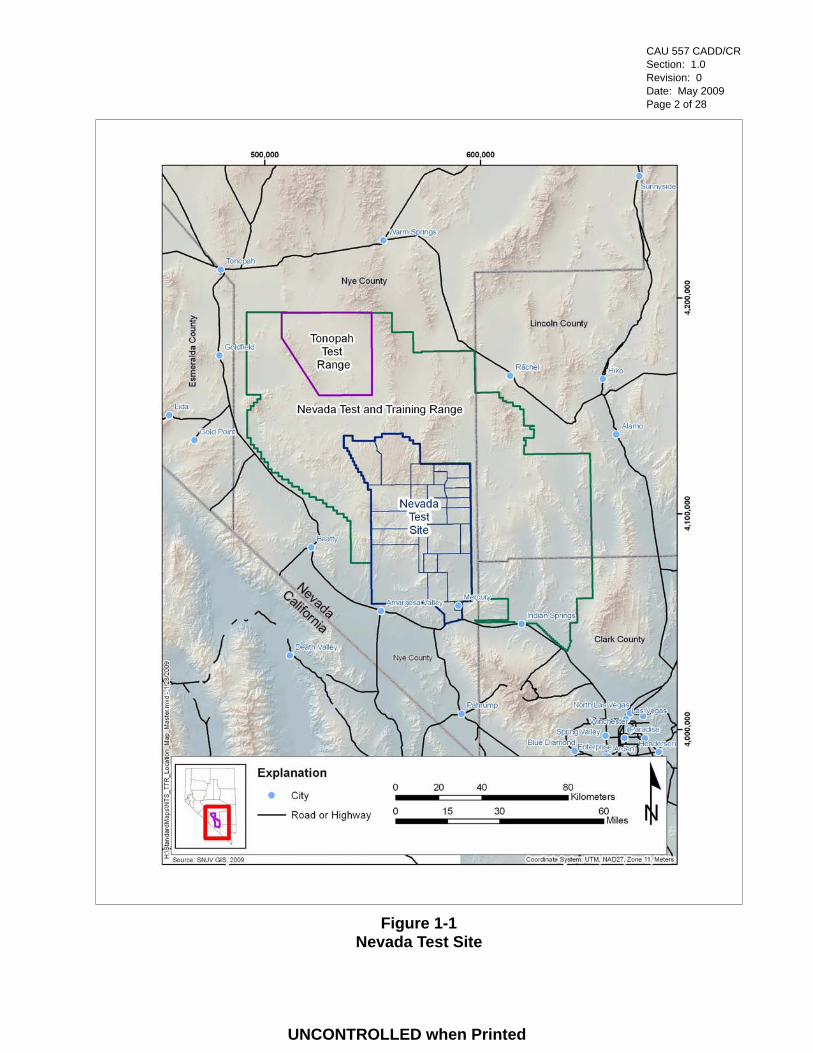
The NTS is approximately 65 miles (mi) northwest of Las Vegas, Nevada (Figure 1-1). Corrective
Action Unit 557 comprises the following four corrective action sites (CASs):
• 01-25-02, Fuel Spill• 03-02-02, Area 3 Subdock UST• 06-99-10, Tar Spills• 25-25-18, Train Maintenance Bldg 3901 Spill Site
Corrective Action Sites 01-25-02, 03-02-02, and 06-99-10 are located at the western, central, and
southwestern portions of the Yucca Flat Region in Areas 1, 3, and 6. Corrective Action Site 25-25-18
is located at the central portion of the Jackass Flats Region in Area 25 (Figure 1-2).
A detailed discussion of the history of this CAU is presented in the Corrective Action Investigation
Plan (CAIP) for Corrective Action Unit 557: Spills and Tank Sites, Nevada Test Site, Nevada
(NNSA/NSO, 2008). This CADD/CR provides or references the specific information necessary to
support closure of the four CAU 557 CASs.
1.1 Purpose
This CADD/CR provides justification why no further corrective action is necessary for CAU 557.
This justification is based on results of investigative activities conducted at the sites, which were
performed in accordance with the CAIP (NNSA/NSO, 2008).
Corrective Action Site 01-25-02 consists of historical diesel fuel soil contamination remaining at the
bottom of a backfilled excavation at the Area 1 Batch Plant. The contamination or CAS is associated
UNCONTROLLED when Printed
CAU 557 CADD/CRSection: 1.0Revision: 0Date: May 2009Page 2 of 28
Figure 1-1Nevada Test Site
UNCONTROLLED when Printed

CAU 557 CADD/CRSection: 1.0Revision: 0Date: May 2009Page 3 of 28
Figure 1-2Corrective Action Unit 557, CAS Location Map
UNCONTROLLED when Printed

CAU 557 CADD/CRSection: 1.0Revision: 0Date: May 2009Page 4 of 28
with a historical diesel fuel release that was remediated through excavation of the contaminated soil
in late 1993 and early 1994, at which time the excavation was backfilled to grade with clean native
soil (REECo, 1994a and b). However, it was reported that the diesel contamination was not
completely removed, as a diesel concentration of 1,740 milligrams per kilogram (mg/kg) remained at
the bottom of the excavation (REECo, 1994c).
Corrective Action Site 03-02-02 consists of an undocumented subsurface feature located at the Area 3
Subdock that was reportedly used for the diversion and drainage of surface water and subsequent
dispersion and release of the effluent into the surrounding soils. The Area 3 Subdock was used for
degreasing, cleaning, and repairing worn drill bits and realigning bent drill rods from the 1970s
through 1985, when it was relocated to Area 1.
Corrective Action Site 06-99-10 consists of a tar material spill released from an unknown source
located approximately 500 feet (ft) south of the Control Point-72 (CP-72) Building in Area 6, just
west of an utility access road that runs parallel to Mercury Highway. The spill site is not associated
with any known activities; however, it is suspected to be a release of unused tar that was allocated for
road paving material.
Corrective Action Site 25-25-18 consists of two stained areas of soil situated on either side of the
railroad tracks leading into the north bay of the Engine Transport System Maintenance (ETSM)
Building within the Engine Maintenance, Assembly, and Disassembly (EMAD) facility that is located
in Area 25. The ETSM Building (i.e., Bldg 3901) was used to perform maintenance of trains and
equipment and was operational from 1965 to 1985. The spills were reportedly associated with the
discharge of used engine oil from the north end of Bldg 3901.
1.2 Scope
The purpose of this CADD/CR is to justify that no further corrective action is required at CAU 557,
Spills and Tank Sites. The scope of the investigation performed to accomplish this purpose included
the following activities:
• Performed a radiological walkover survey at CASs 03-02-02 and 25-25-18.
• Performed field screening.
UNCONTROLLED when Printed

CAU 557 CADD/CRSection: 1.0Revision: 0Date: May 2009Page 5 of 28
• Collected environmental samples for laboratory analysis.
• Collected potential source material (PSM) samples to determine the potential to generate contaminants of concern (COCs) if released to the surrounding media.
• Collected potential waste samples to determine proper disposal.
• Collected quality control (QC) samples.
1.3 Corrective Action Decision Document/Closure Report Contents
This CADD/CR is divided into the following sections and appendices:
Section 1.0 – Introduction: Summarizes the purpose, scope, and contents of this CADD/CR.
Section 2.0 – Corrective Action Investigation (CAI) Summary: Summarizes the investigation field
activities and results of the investigation, and justifies that no further corrective actions are needed.
Section 3.0 – Recommendation: States why no further corrective action is required for CAU 557.
Section 4.0 – References: Provides a list of all referenced documents used in the preparation of this
CADD/CR.
Appendix A – Corrective Action Investigation Results: Provides a description of the project
objectives, field investigation and sampling activities, investigation results, waste management, and
quality assurance (QA). Sections A.3.0 through A.6.0 provide specific information regarding field
activities, sampling methods, and laboratory analytical results from the investigation.
Appendix B – Data Assessment: Provides a data quality assessment (DQA) that reconciles data
quality objective (DQO) assumptions and requirements to the investigation results.
Appendix C – Risk Assessment: Presents an evaluation of risk associated with the establishment of
final action levels (FALs).
Appendix D – Borehole and Sample Location Coordinates: Provides investigation sample
location coordinates.
Appendix E - Nevada Division of Environmental Protection (NDEP) comments.
UNCONTROLLED when Printed

CAU 557 CADD/CRSection: 1.0Revision: 0Date: May 2009Page 6 of 28
1.3.1 Applicable Programmatic Plans and Documents
Investigation activities were performed in accordance with the following documents:
• CAIP for CAU 557, Spills and Tank Sites (NNSA/NSO, 2008)• Industrial Sites Quality Assurance Project Plan (QAPP) (NNSA/NV, 2002)• FFACO (1996, as amended February 2008)• Approved procedures
1.3.2 Data Quality Assessment Summary
The DQA is presented in Appendix B and includes an evaluation of the data quality indicators (DQIs)
to determine the degree of acceptability and usability of the reported data in the decision-making
process. The DQO process ensures that the right type, quality, and quantity of data will be available
to support the resolution of those decisions at an appropriate level of confidence. Using both the
DQO and DQA processes helps to ensure that DQO decisions are sound and defensible.
The DQA process as presented in Appendix B comprises the following steps:
• Step 1: Review DQOs and Sampling Design • Step 2: Conduct a Preliminary Data Review • Step 3: Select the Test• Step 4: Verify the Assumptions • Step 5: Draw Conclusions from the Data
Sample locations that support the absence of COC contamination at each CAS are shown in
Sections A.3.0 through A.6.0 of Appendix A. Based on the results of the DQA presented in
Appendix B, the absence of COCs at the CAU 557 CASs has been adequately identified to support a
corrective action of no further action at each site. The DQA also determined that information
generated during the investigation supports the conceptual site model (CSM) assumptions, and the
data collected met the DQOs and support their intended use in the decision-making process.
UNCONTROLLED when Printed

CAU 557 CADD/CRSection: 2.0Revision: 0Date: May 2009Page 7 of 28
2.0 Corrective Action Investigation Summary
The following sections summarize the investigation activities and investigation results, and justify
why no further corrective action is needed at CAU 557. Detailed investigation activities and results
for individual CAU 557 CASs are presented in Appendix A of this document.
2.1 Investigation Activities
Corrective action investigation activities were performed as set forth in the CAU 557 CAIP
(NNSA/NSO, 2008) from May 5 through November 24, 2008. The purpose of the CAU 557 CAI
was to provide additional information needed to address the decision statements in the
project-specific DQOs. This was accomplished by:
• Determining whether COCs are present in the soils associated with CAU 557.
• If COCs were present in the soil, determining the lateral and vertical extent of the identified COCs.
• Ensuring adequate data have been collected to close the sites under FFACO requirements (FFACO, 1996; as amended in February 2008).
The scope of the CAI included the following activities:
• Performing radiological surveys.
• Field screening soil samples for volatile organic compounds (VOCs) and total (gross) alpha and beta/gamma radiation.
• Collecting environmental samples for laboratory analyses to determine the presence or absence of COCs and to define the vertical and lateral extent of COCs, if present.
• Collecting QC samples for laboratory analyses to ensure that the data generated from the analysis of investigation samples meet the requirements of the DQIs.
• Collecting waste to identify whether it represents potential sources of environmental contamination and to support waste decisions.
A judgmental sampling scheme was implemented for the CAU 557 CAI to select sample locations
and evaluate analytical results, as outlined in the CAIP (NNSA/NSO, 2008). Judgmental sampling
UNCONTROLLED when Printed

CAU 557 CADD/CRSection: 2.0Revision: 0Date: May 2009Page 8 of 28
allows the methodical selection of sample locations that target the populations of interest (defined in
the DQOs) rather than nonselective random locations generated by statistical methods.
For the judgmental sampling scheme, individual sample results (rather than average concentrations)
are used for comparison to FALs. Therefore, statistical methods used to generate site characteristics
(averages) are not necessary (EPA, 2006). If good prior information is available on the target site of
interest, then the sampling may be designed to collect samples only from areas known or likely to
have the highest concentration levels on the target site. If the observed concentrations from these
samples are below the action level, then a decision can be made that the site contains safe levels of the
contaminant without the samples being truly representative of the entire area.
The judgmental sampling design was used to confirm the absence of contamination at specific
locations. Confidence in judgmental sampling scheme decisions was established qualitatively by
validation of the CSM and justification that sampling locations are the most likely locations to
contain a COC, if a COC exists.
Waste characterization activities were conducted to gather sufficient information and data to support
waste disposal decisions. Information regarding waste characterization is presented in Appendix A.
The following sections describe specific CAI activities conducted at each CAS. Additional
information regarding the CAI is presented in Appendix A.
2.1.1 Fuel Spill (CAS 01-25-02)
The following sections summarize the field activities conducted at CAS 01-25-02.
2.1.1.1 Visual Inspection
Subsurface soils were visually inspected during drilling activities at CAS 01-25-02 to identify biasing
factors (i.e., staining, soil discoloration) and to identify the boundary between excavation backfill
material and the underlying native soil. Backfill material consisting of light brown gravelly sand was
observed from 0 ft below ground surface (bgs) to approximately 13 ft bgs. At 13 ft bgs, a distinct
color change to orange-brown moist sand was observed that may represent the native soil interface;
however, a distinct boundary between backfill material and native soil was not identified. This is
UNCONTROLLED when Printed

CAU 557 CADD/CRSection: 2.0Revision: 0Date: May 2009Page 9 of 28
attributed to the backfill material, consisting of gravelly sands, being similar in composition to the
geology of the Area 1 Batch Plant (accumulations of well to poorly sorted sandy wash sediments).
Therefore, field-screening results (FSRs) and other biasing factors were used to identify the soil
interval most likely to contain contamination. No additional biased samples were collected other than
those proposed in the CAU 557 CAIP (NNSA/NSO, 2008).
2.1.1.2 Field Screening
Investigation samples were field screened for VOCs using a photoionization detector (PID) and for
gross alpha and beta/gamma radiation using handheld radiological survey instruments. The FSRs
were compared to field-screening levels (FSLs) to guide subsequent sampling decisions. Core
material retrieved during drilling was field screened for VOCs at 5-ft intervals (or more often based
on biasing factors). Screening began at 12 ft bgs (a depth slightly shallower than the expected bottom
of the former excavation) and continued into native soil to a depth of 25 ft bgs. All VOC FSRs were
below 20 parts per million (ppm), with the highest recorded FSR of 5.5 ppm at a depth of 14.0 to
14.5 ft bgs (sample 557A001 and field duplicate [FD] 557A002). The FSRs decreased with depth
from this interval to 3.5 ppm at 20 ft bgs and to 3.0 ppm at 25 ft bgs. No samples exceeded alpha or
beta/gamma FSLs.
2.1.1.3 Sample Collection
Three environmental soil samples were collected at this CAS to determine whether diesel
contamination beneath the previously removed contaminated soil exceeds FALs. The sample
location and identification (ID) number, types, and analyses are listed in Table A.3-1, and the
locations are shown on Figure A.3-1. Soil samples were collected using drilling methods at a location
in the middle of the former excavation at depths where the greatest concentration of contaminants
were expected to be found, based on the 1993-1994 sampling results. Because the exact depth of the
former excavation was not known, screening for VOCs began at a depth of 12 ft bgs during this CAI
to approximate the bottom of the former excavation. Sample 557A001 (and FD 557A002) was
collected from the 14.0 to 14.5 ft bgs interval because the FSR for VOC headspace was the highest
(5.5 ppm) at this interval. This was also the interval of a distinct soil change from light brown
gravelly sand to orange brown sand with more moisture. Additional deeper soil intervals were field
screened for VOCs to verify that contamination decreases with depth. One soil sample (557A003)
UNCONTROLLED when Printed
CAU 557 CADD/CRSection: 2.0Revision: 0Date: May 2009Page 10 of 28
was collected from 24.5 to 25.0 ft bgs, which is the interval in native soil with the lowest FSR of
3.0 ppm. The CAIP for CAU 557 planned for a second boring to be drilled only if contamination
in the first boring was shown to increase with depth. Because this was not the case, only one boring
was drilled, and the lateral extent has been established by the former excavation sidewalls
(NNSA/NSO, 2008).
2.1.1.4 Conceptual Site Model Validation
A CSM was developed to represent the release mechanisms and potential migration pathways for
contaminant releases at this CAS. The CSM and associated discussion for CAS 01-25-02 are
provided in the CAU 557 CAIP (NNSA/NSO, 2008).
The CSM assumed that contaminant migration would be minimal based on the affinity of the
contaminants of potential concern (COPCs) for soil particles and the limited infiltration of
stormwater (based on low annual precipitation rates and high potential evapotranspiration rates
typical of the NTS environment). The extent of the underlying soil impact at this CAS was expected
to be minimal and dependent upon the volume of contaminants remaining in the soil at depth.
The information gathered during the CAI supported and validated the CSM as presented in the
CAU 557 CAIP (NNSA/NSO, 2008).
2.1.2 Area 3 Subdock UST (CAS 03-02-02)
The following sections summarize the field activities conducted at CAS 03-02-02.
2.1.2.1 Geophysical Survey
Before the CAI, a preliminary geophysical survey was performed at CAS 03-02-02 that identified two
large anomalies and several linear anomalies. The first anomaly corresponds to the main feature of
the CAS, a vertical steel casing with a lid that is flush with the ground surface and mostly covered
with soil. The second large anomaly is located approximately 5 ft northeast of the steel casing and
was interpreted to be a second feature connected to the steel casing by subsurface piping at a depth of
1 meter or less. A series of three parallel trenches were excavated (within the limits of two nearby
underground utility lines) to a total depth of 6 ft bgs in the area northeast of the steel casing. It was
UNCONTROLLED when Printed

CAU 557 CADD/CRSection: 2.0Revision: 0Date: May 2009Page 11 of 28
determined that no subsurface features, debris, or other biasing factors were identified in the area of
the anomaly that would warrant the collection of environmental samples. Also, soil was excavated
along the east-northeast side of the steel casing and confirmed that there are no subsurface
connections to other features. Two additional trenches were excavated on the south side of the steel
casing to investigate the smaller linear anomalies. It was determined that the anomalies south of the
steel casing corresponded to inactive telecommunication lines (typical of the NTS) that were
uncovered at a depth of 1.0 to 1.5 ft bgs.
2.1.2.2 Radiological Survey
A preliminary radiological survey was performed at CAS 03-02-02 before the CAI. Results of the
survey did not detect areas of concern at this CAS, and sample locations were not identified based on
the survey results.
2.1.2.3 Visual Inspection
Visual inspections were conducted during excavation activities to determine the configuration of the
CAS feature(s) and to identify any biasing factors that would warrant sample collection. The visual
inspection of the vertical steel casing feature did not identify additional system features or piping
associated within the CAS. An 8-inch (in.) diameter access portal was identified as part of the lid.
Initial inspection indicated that the casing was punctured with abundant 2- to 4-in. diameter circular
perforations spaced near the top and continuing to the bottom at 13 ft bgs to allow liquid outflow;
however, no pipe tie-ins were identified. Soil intervals were continuously monitored during hand
augering and excavation activities to identify biasing factors. Biased samples were collected from
dark-stained, rust-stained, and debris-containing soils that were identified in soil sample intervals
during hand augering within the steel casing. Trenches that were excavated to uncover geophysical
anomalies were also inspected (see Section 2.1.2.1).
2.1.2.4 Video Surveys
A video survey was conducted inside the casing to the extent possible to identify breaches, residual
material, and/or pipe tie-ins. The casing had 3 ft of void space before soil was encountered. The steel
design was perforated; however, no other breaches or pipe tie-ins were observed. Therefore, no
additional sample locations were identified at this CAS based on the video survey.
UNCONTROLLED when Printed

CAU 557 CADD/CRSection: 2.0Revision: 0Date: May 2009Page 12 of 28
2.1.2.5 Field Screening
Investigation soil samples were screened in the field for VOCs and for gross alpha and beta/gamma
radioactivity. A PID was used for screening VOCs by the headspace method. A handheld survey
instrument was used to screen for alpha and beta/gamma radioactivity before soil samples were
placed in sample jars. The radiological FSRs were compared to FSLs to guide subsequent sampling
decisions. Both the radiological and VOC FSRs were below their respective FSLs.
2.1.2.6 Sample Collection
Six environmental soil samples were collected at this CAS to determine whether contamination exists
in soils found within and outside the vertical casing at concentrations above FALs. The sample ID
numbers, locations, types, and analyses are listed in Table A.4-1, and sample locations are shown on
Figure A.4-1. Samples obtained from inside the casing were collected using a hand auger until
refusal was encountered at a depth of 9.5 ft bgs. Samples obtained from surrounding and beneath the
casing were collected using a backhoe.
Samples of the sand/sediment found within the casing (location B01) were collected from three
intervals based on the presence of dark-stained, rust-stained, or debris-containing soil (location B01;
samples 557B001, 557B002, and 557B003). Additional bounding soil samples were collected from
locations surrounding the casing (location B02; sample 557B004), at the bottom of the casing
(location B02; sample 557B005), and from native soil beneath the bottom of the casing
(location B03; sample 557B006).
2.1.2.7 Conceptual Site Model Validation
A CSM was developed to represent the release mechanisms and potential migration pathways for
contaminant releases at this CAS. The CSM and associated discussion for CAS 03-02-02 are
provided in the CAU 557 CAIP (NNSA/NSO, 2008).
The CSM assumed that contaminant migration would be minimal based on the design and structural
integrity of the system components, the affinity of the COPCs for soil particles, and the limited
infiltration of stormwater (based on low annual precipitation rates and high potential
evapotranspiration rates typical of the NTS environment). The extent of the soil impact at this CAS
UNCONTROLLED when Printed

CAU 557 CADD/CRSection: 2.0Revision: 0Date: May 2009Page 13 of 28
was minimal and appeared to remain within the vertical casing. Information gathered during the CAI
supports and validates the CSM as presented in the CAIP.
2.1.3 Tar Spills (CAS 06-99-10)
The following sections summarize the field activities conducted at CAS 06-99-10.
2.1.3.1 Visual Inspection
Before sampling activities, visual inspections performed of the two tar spills determined that they
were composed of the same material and that one sample would be collected instead of two samples
(see Section A.5.1.4), as agreed upon in the CAIP (NNSA/NSO, 2008). No visible signs of biasing
factors (e.g., staining) were noted during sampling activities, and additional biased sampling
locations were not identified at this site.
2.1.3.2 Field Screening
Soil samples were screened in the field for VOCs and for gross alpha and beta/gamma radioactivity.
A PID was used for screening VOCs by the headspace method, and a handheld survey instrument was
used to screen the soil for gross alpha and beta/gamma radioactivity before soil samples were placed
in sample jars. Both the VOC and radiological FSRs were below their respective FSLs, and no
additional sampling at this site was performed.
2.1.3.3 Sample Collection
Environmental soil sampling activities included the collection of two surface soil samples
(0 to 0.5 ft bgs) from directly beneath one of the hardened tar spills (samples 557C002 and FD
557C003) and one additional deeper subsurface soil sample (557C004) at a depth from 0.5 to 1.0 ft
bgs to determine whether the tar had leached into the underlying soils. The sample location and ID
number, types, and analyses are listed in Table A.5-1, and the locations are shown on Figure A.5-1.
Potential source material sampling activities included the collection of a tar material sample
(557C001) to determine whether it exceeds the PSM criteria. The tar was also sampled for waste
characterization purposes as presented in Section A.7.0.
UNCONTROLLED when Printed

CAU 557 CADD/CRSection: 2.0Revision: 0Date: May 2009Page 14 of 28
2.1.3.4 Conceptual Site Model Validation
A CSM was developed to represent the release mechanisms and potential migration pathways for
contaminant releases at the CAU 557 CASs. The CSM and associated discussion for CAS 06-99-10
are provided in the CAIP (NNSA/NSO, 2008).
Contaminant migration and the extent of the underlying soil impact at this CAS was minimal based
on the composition of the tar material. The migration pathway and release mechanism information
gathered during the CAI was consistent with the CSM, and all information gathered during the CAI
supports and validates the CSM as presented in the CAIP.
2.1.4 Train Maintenance Bldg 3901 Spill Site (CAS 25-25-18)
The following sections summarize the field activities conducted at CAS 25-25-18.
2.1.4.1 Radiological Survey
A radiological survey was performed at CAS 25-25-18 as part of the CAI. Survey results did not
identify areas of potential concern within the CAS boundary; therefore, no additional biased sampling
locations were identified as a result of this survey.
2.1.4.2 Visual Inspection
Visual inspections included monitoring vertical soil profiles to identify stained soil boundaries and
surveying the areas on either side of the railroad tracks to identify the locations exhibiting the highest
degree of staining for biased sample locations. Additional surface sample locations were identified
for collection of beryllium, and for pesticides and polychlorinated biphenyls (PCBs) based on their
proximity to Bldg 3901. Sample locations were also identified outside of the visibly stained areas to
define the lateral extent of contamination. No other features associated with the stained soil were
identified within this CAS.
2.1.4.3 Field Screening
Soil samples were screened in the field for VOCs and for alpha and beta/gamma radioactivity. A PID
was used for screening VOCs by the headspace method. A handheld survey instrument was used to
UNCONTROLLED when Printed

CAU 557 CADD/CRSection: 2.0Revision: 0Date: May 2009Page 15 of 28
screen for alpha and beta/gamma radioactivity before soil samples were placed in sample jars. The
radiological FSRs were compared to FSLs to guide subsequent sampling decisions. The radiological
FSLs exceeded the FSRs at surface sample locations D07 and D09; therefore, samples at deeper
intervals continued to be collected until FSRs were below FSLs. No other additional biased sampling
locations were identified as a result of field screening.
2.1.4.4 Sample Collection
Twenty-one surface and shallow subsurface environmental samples, including one FD, were collected
from various areas within and surrounding visibly stained soil on the east and west sides of the
railroad tracks that enter the north bay of the ETSM Bldg 3901. The CAU 557 CAIP planned for the
collection of samples at six locations (one location from each of the two stained soil areas and four
locations to define the lateral extent of potential contamination). During the CAI, a total of three
sample locations were identified in stained soil areas, and a total of six sample locations were
identified for defining the lateral extents of contamination. In addition to these sample locations, five
additional surface (0 to 0.25 ft bgs) samples (557D001 through 557D005) were collected from
locations D01 through D05 for the purposes of beryllium analysis only. The sample ID numbers,
locations, types, and analyses are listed in Table A.6-1, and the sample locations are shown on
Figure A.6-1.
Sample location D07 represents the area of darkest stained soil on the east side of the tracks. At D07,
sample 557D008 was collected at 0.0 to 0.5 ft bgs using hand sampling methods and represents the
darkest stained soil. A subsurface sample (557D014) was collected at 2.0 to 2.5 ft bgs using a
backhoe for the purpose of defining the vertical extent of potential contamination at D07. Three
sample locations (D06, D08, and D10) were collected for the purpose of defining the lateral extent of
potential contamination on the east side of the tracks. Sample locations D06 and D08 were collected
in close proximity to the stained soil and location D10 represents the lowest topographical point.
Pesticides and PCBs were added to the list of analytes for one representative sample (location D06;
sample 557D006) collected in close proximity to Bldg 3901 because these contaminants are
commonly identified adjacent to NTS building pads.
Sample locations D09 and D11 represent the areas of darkest stained soil on the west side of the
tracks, which is more extensive than the stained soil on the east side. At D09, samples 557D011
UNCONTROLLED when Printed

CAU 557 CADD/CRSection: 2.0Revision: 0Date: May 2009Page 16 of 28
(0 to 1.0 ft bgs) and 557D012 (1.0 to 1.5 ft bgs) were collected within the horizon of stained soil using
hand sampling and hand auger methods, and sample 557D015 was a subsurface sample collected at
5.5 to 6.0 ft bgs using a backhoe to define the vertical extent of potential contamination. At D11,
sample 557D016 (0 to 0.5 ft bgs) was collected from the horizon of stained soil using hand sampling
methods, and sample 557D017 (2.5 to 3.0 ft bgs) was a subsurface sample collected using a backhoe
to define the vertical extent of potential contamination. Three sample locations (D12, D13, and D14)
were collected for the purpose of defining the lateral extent of potential contamination on the west
side of the tracks. Location D12 was collected in the middle of the slope west of the stained soil, and
locations D13 and D14 were collected at the lowest topographical points (see Table A.6-1 for a list of
all samples collected).
2.1.4.5 Conceptual Site Model Validation
A CSM was developed to represent the release mechanisms and potential migration pathways for
contaminant releases at this CAS. The CSM and associated discussion for CAS 25-25-18 are
provided in the CAU 557 CAIP (NNSA/NSO, 2008).
The extent of the underlying soil impacted at this CAS was minimal and dependent upon the volume
of contaminants released from the surface staining.
The migration pathway and release mechanism information gathered during the CAI was consistent
with the CSM, and all information gathered during the CAI supports and validates the CSM as
presented in the CAIP.
2.2 Results
The summary of data from the CAI is provided in this section, and results were compared to action
levels. This section also summarizes the data assessment made in Appendix B, which demonstrates
that the investigation results satisfy the DQO data requirements for CAU 557.
2.2.1 Summary of Analytical Data
Chemical and radiological results for environmental and PSM samples collected from the CAU 557
CASs are summarized in the following subsections. Environmental soil sample results were
UNCONTROLLED when Printed

CAU 557 CADD/CRSection: 2.0Revision: 0Date: May 2009Page 17 of 28
compared against FALs to determine the absence or presence of COCs and the extent of COC
contamination, if present. Potential source material sample results were also evaluated to determine
whether a release of contaminants from these areas to the surrounding environmental media could
potentially result in the presence of a COC in that environmental media.
The preliminary action levels (PALs) for the CAU 557 investigation were determined during the
DQO process and are discussed in Section 3.3 of the CAU 557 CAIP (NNSA/NSO, 2008). The FALs
used for determining the absence or presence of COCs and evaluating the need for corrective action
are defined in Section 3.4 of the CAIP. Details about the analytical methods used during this CAI and
a comparison of sample results to the FALs are presented in Appendix A.
2.2.1.1 Fuel Spill (CAS 01-25-02)
All concentrations of the reported parameters at this site were compared to and were less than the
corresponding PALs. Therefore, the FALs were established at the corresponding PAL concentrations,
and no COCs were identified in the soils at this site.
The maximum concentration of each detected contaminant at this CAS is listed in Table 2-1.
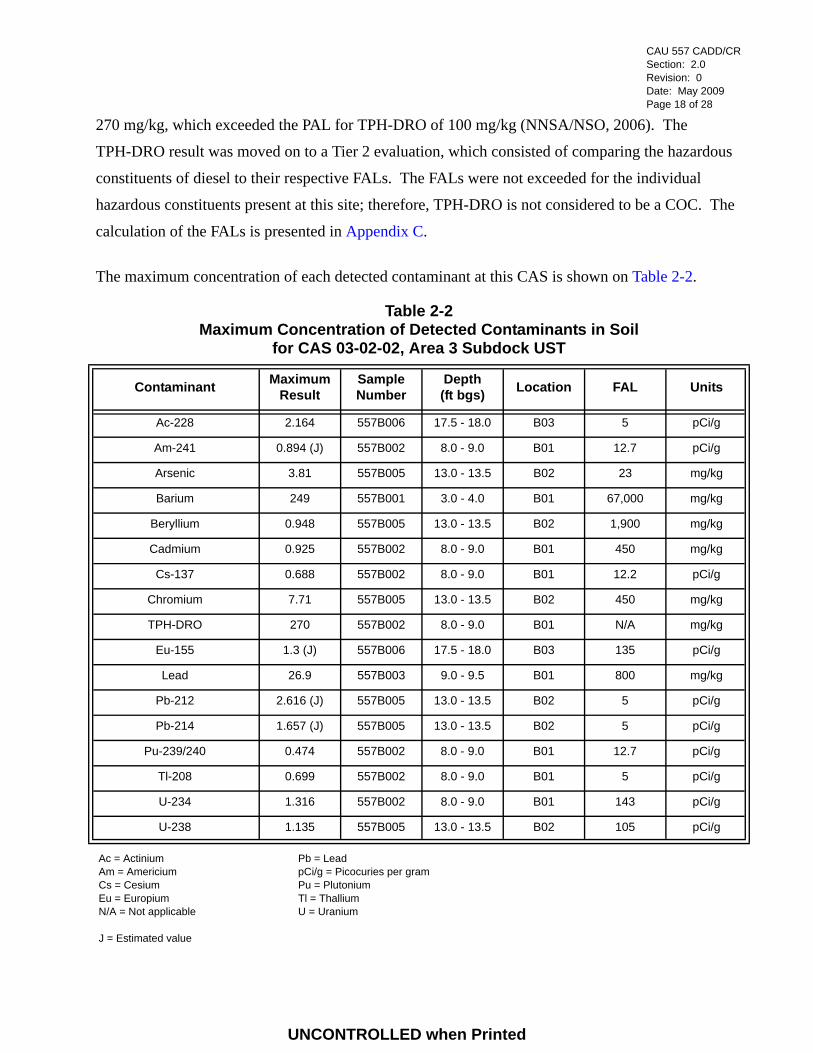
2.2.1.2 Area 3 Subdock UST (CAS 03-02-02)
With the exception of TPH-DRO detected in the soil within the casing, all soil concentrations of the
reported constituents were compared to and were less than PALs. One sand/sediment sample
(557B002) collected at location B01 within the casing showed a concentration of TPH-DRO at
Table 2-1Maximum Concentration of Detected Contaminants in Soil
for CAS 01-25-02, Fuel Spill
Contaminant MaximumResult
SampleNumber
Depth(ft bgs) Location FAL Units
Acetone 0.00303 (J) 557A001 14.0 - 14.5 A01 54,000 mg/kg
TPH-DRO 1.5 (J) 557A003 24.5 - 25.0 A01 100 mg/kg
DRO = Diesel-range organicsTPH = Total petroleum hydrocarbons
J = Estimated value
UNCONTROLLED when Printed
CAU 557 CADD/CRSection: 2.0Revision: 0Date: May 2009Page 18 of 28
270 mg/kg, which exceeded the PAL for TPH-DRO of 100 mg/kg (NNSA/NSO, 2006). The
TPH-DRO result was moved on to a Tier 2 evaluation, which consisted of comparing the hazardous
constituents of diesel to their respective FALs. The FALs were not exceeded for the individual
hazardous constituents present at this site; therefore, TPH-DRO is not considered to be a COC. The
calculation of the FALs is presented in Appendix C.
The maximum concentration of each detected contaminant at this CAS is shown on Table 2-2.
Table 2-2Maximum Concentration of Detected Contaminants in Soil
for CAS 03-02-02, Area 3 Subdock UST
Contaminant MaximumResult
SampleNumber
Depth(ft bgs) Location FAL Units
Ac-228 2.164 557B006 17.5 - 18.0 B03 5 pCi/g
Am-241 0.894 (J) 557B002 8.0 - 9.0 B01 12.7 pCi/g
Arsenic 3.81 557B005 13.0 - 13.5 B02 23 mg/kg
Barium 249 557B001 3.0 - 4.0 B01 67,000 mg/kg
Beryllium 0.948 557B005 13.0 - 13.5 B02 1,900 mg/kg
Cadmium 0.925 557B002 8.0 - 9.0 B01 450 mg/kg
Cs-137 0.688 557B002 8.0 - 9.0 B01 12.2 pCi/g
Chromium 7.71 557B005 13.0 - 13.5 B02 450 mg/kg
TPH-DRO 270 557B002 8.0 - 9.0 B01 N/A mg/kg
Eu-155 1.3 (J) 557B006 17.5 - 18.0 B03 135 pCi/g
Lead 26.9 557B003 9.0 - 9.5 B01 800 mg/kg
Pb-212 2.616 (J) 557B005 13.0 - 13.5 B02 5 pCi/g
Pb-214 1.657 (J) 557B005 13.0 - 13.5 B02 5 pCi/g
Pu-239/240 0.474 557B002 8.0 - 9.0 B01 12.7 pCi/g
Tl-208 0.699 557B002 8.0 - 9.0 B01 5 pCi/g
U-234 1.316 557B002 8.0 - 9.0 B01 143 pCi/g
U-238 1.135 557B005 13.0 - 13.5 B02 105 pCi/g
Ac = Actinium Pb = LeadAm = Americium pCi/g = Picocuries per gramCs = Cesium Pu = PlutoniumEu = Europium Tl = ThalliumN/A = Not applicable U = Uranium
J = Estimated value
UNCONTROLLED when Printed
CAU 557 CADD/CRSection: 2.0Revision: 0Date: May 2009Page 19 of 28
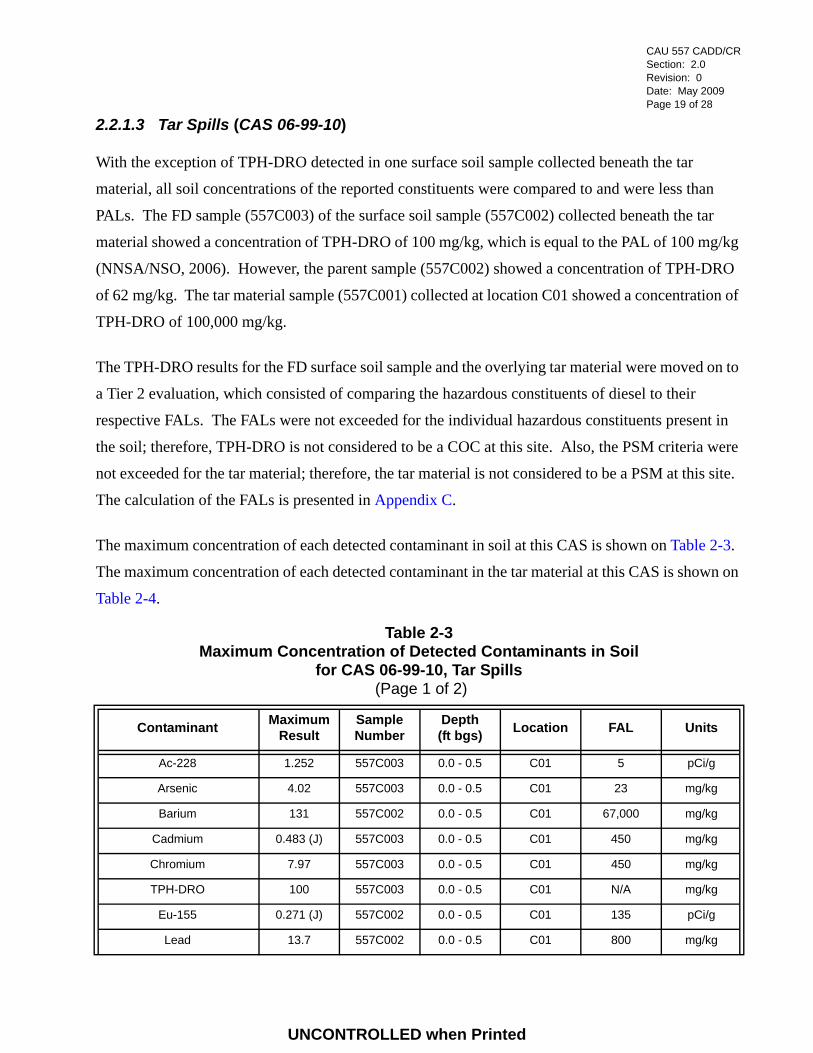
2.2.1.3 Tar Spills (CAS 06-99-10)
With the exception of TPH-DRO detected in one surface soil sample collected beneath the tar
material, all soil concentrations of the reported constituents were compared to and were less than
PALs. The FD sample (557C003) of the surface soil sample (557C002) collected beneath the tar
material showed a concentration of TPH-DRO of 100 mg/kg, which is equal to the PAL of 100 mg/kg
(NNSA/NSO, 2006). However, the parent sample (557C002) showed a concentration of TPH-DRO
of 62 mg/kg. The tar material sample (557C001) collected at location C01 showed a concentration of
TPH-DRO of 100,000 mg/kg.
The TPH-DRO results for the FD surface soil sample and the overlying tar material were moved on to
a Tier 2 evaluation, which consisted of comparing the hazardous constituents of diesel to their
respective FALs. The FALs were not exceeded for the individual hazardous constituents present in
the soil; therefore, TPH-DRO is not considered to be a COC at this site. Also, the PSM criteria were
not exceeded for the tar material; therefore, the tar material is not considered to be a PSM at this site.
The calculation of the FALs is presented in Appendix C.
The maximum concentration of each detected contaminant in soil at this CAS is shown on Table 2-3.
The maximum concentration of each detected contaminant in the tar material at this CAS is shown on
Table 2-4.
Table 2-3Maximum Concentration of Detected Contaminants in Soil
for CAS 06-99-10, Tar Spills (Page 1 of 2)
Contaminant MaximumResult
SampleNumber
Depth(ft bgs) Location FAL Units
Ac-228 1.252 557C003 0.0 - 0.5 C01 5 pCi/g
Arsenic 4.02 557C003 0.0 - 0.5 C01 23 mg/kg
Barium 131 557C002 0.0 - 0.5 C01 67,000 mg/kg
Cadmium 0.483 (J) 557C003 0.0 - 0.5 C01 450 mg/kg
Chromium 7.97 557C003 0.0 - 0.5 C01 450 mg/kg
TPH-DRO 100 557C003 0.0 - 0.5 C01 N/A mg/kg
Eu-155 0.271 (J) 557C002 0.0 - 0.5 C01 135 pCi/g
Lead 13.7 557C002 0.0 - 0.5 C01 800 mg/kg
UNCONTROLLED when Printed

CAU 557 CADD/CRSection: 2.0Revision: 0Date: May 2009Page 20 of 28
2.2.1.4 Train Maintenance Bldg 3901 Spill Site (CAS 25-25-18)
With the exception of TPH-DRO detected in several soil samples at this site, all soil concentrations of
the reported constituents were compared to and were less than their corresponding PALs. The
Pb-212 1.431 (J) 557C003 0.0 - 0.5 C01 5 pCi/g
Pb-214 0.993 (J) 557C003 0.0 - 0.5 C01 5 pCi/g
Mercury 0.0522 (J) 557C004 0.5 - 1.0 C01 310 mg/kg
Tl-208 0.765 557C004 0.5 - 1.0 C01 5 pCi/g
J = Estimated value
Table 2-4Maximum Concentration of Detected Contaminants in Tar
for CAS 06-99-10, Tar Spills
Contaminant MaximumResult
SampleNumber
Depth(ft bgs) Location FAL Units
Lead 0.438
557C001
N/A
C01
800 mg/kg
Barium 2.1 (J) N/A 67,000 mg/kg
TPH-DRO 100,000 (J) N/A 100 mg/kg
1,2,4-Trimethylbenzene 0.44 N/A 170 mg/kg
1,3,5-Trimethylbenzene 0.16 (J) N/A 70 mg/kg
2-Butanone 0.43 (J) N/A 110,000 mg/kg
4-Isopropyltoluene 0.12 (J) N/A 2,000 mg/kg
Acetone 0.84 (J) N/A 54,000 mg/kg
N-Butylbenzene 0.11 (J) N/A 240 mg/kg
Sec-Butylbenzene 0.23 (J) N/A 220 mg/kg
Total Xylenes 0.23 (J) N/A 420 mg/kg
Benzoic Acid 98 (J) N/A 100,000 mg/kg
J = Estimated value
Table 2-3Maximum Concentration of Detected Contaminants in Soil
for CAS 06-99-10, Tar Spills (Page 2 of 2)
Contaminant MaximumResult
SampleNumber
Depth(ft bgs) Location FAL Units
UNCONTROLLED when Printed

CAU 557 CADD/CRSection: 2.0Revision: 0Date: May 2009Page 21 of 28
maximum concentration of TPH-DRO in the stained soil was estimated at 8,700 mg/kg, which
exceeded the PAL of 100 mg/kg (NNSA/NSO, 2006). This soil sample was collected at location D11
from a surface area showing heavy staining. The TPH-DRO results were moved on to a Tier 2
evaluation, which consisted of comparing the hazardous constituents of diesel to their respective
FALs. The FALs were not exceeded for the individual hazardous constituents; therefore, TPH-DRO
is not considered to be a COC at this site. The calculation of the FALs is presented in Appendix C.
The maximum concentration of each detected contaminant at this CAS is shown on Table 2-5.
Table 2-5Maximum Concentration of Detected Contaminants in Soil for CAS 25-25-18, Train Maintenance Bldg 3901 Spill Site
(Page 1 of 2)
Contaminant MaximumResult
SampleNumber
Depth(ft bgs) Location FAL Units
2-Methylphenol 0.86 557D016 0.0 - 0.5 D11 31,000 mg/kg
4,4'-DDT 0.015 557D006 0.0 - 0.5 D06 7 mg/kg
Acetone 0.017 (J) 557D016 0.0 - 0.5 D11 54,000 mg/kg
Ac-228 2.287 557D009 0.0 - 0.5 D08 5 pCi/g
Am-241 4.261 557D018 0.0 - 0.5 D12 12.7 pCi/g
Aroclor 1260 0.12 557D006 0.0 - 0.5 D06 0.74 mg/kg
Arsenic 7.82 557D019 0.0 - 0.5 D13 23 mg/kg
Barium 288 557D016 0.0 - 0.5 D11 67,000 mg/kg
Benzoic acid 0.97 (J) 557D016 0.0 - 0.5 D11 100,000 mg/kg
Beryllium 0.363 (J) 557D007 1.0 - 2.0 D06 1,900 mg/kg
Bis(2-ethylhexyl)phthalate 1.3 557D016 0.0 - 0.5 D11 120 mg/kg
Cadmium 1.86 557D001 0.0 - 0.25 D01 450 mg/kg
Chromium 15.4 557D008 0.0 - 0.5 D07 450 mg/kg
Dieldrin 0.0062 (J) 557D006 0.0 - 0.5 D06 0.11 mg/kg
TPH-DRO 8,700 (J) 557D016 0.0 - 0.5 D11 N/A mg/kg
Endosulfan II 0.0052 (J) 557D006 0.0 - 0.5 D06 3,700 mg/kg
Endrin 0.014 (J) 557D006 0.0 - 0.5 D06 180 mg/kg
Eu-155 0.65 (J) 557D009 0.0 - 0.5 D08 135 pCi/g
Heptachlor epoxide 0.0026 557D006 0.0 - 0.5 D06 0.19 mg/kg
UNCONTROLLED when Printed

CAU 557 CADD/CRSection: 2.0Revision: 0Date: May 2009Page 22 of 28
2.2.2 Data Assessment Summary
The DQA is presented in Appendix B and includes an evaluation of the DQIs to determine the degree
of acceptability and usability of the reported data in the decision-making process. The DQO process
ensures that the right type, quality, and quantity of data will be available to support the resolution of
those decisions at an appropriate level of confidence. Using both the DQO and DQA processes help
to ensure that DQO decisions are sound and defensible.
The DQA process as presented in Appendix B comprises the following steps:
• Step 1: Review DQOs and Sampling Design • Step 2: Conduct a Preliminary Data Review • Step 3: Select the Test• Step 4: Verify the Assumptions • Step 5: Draw Conclusions from the Data
Lead 440 557D016 0.0 - 0.5 D11 800 mg/kg
Pb-212 2.323 (J) 557D009 0.0 - 0.5 D08 5 pCi/g
Pb-214 1.312 (J) 557D009 0.0 - 0.5 D08 5 pCi/g
Phenol 0.51 (J) 557D016 0.0 - 0.5 D11 100,000 mg/kg
Pu-239/240 0.288 557D021 0.0 - 0.5 D14 12.7 pCi/g
Selenium 2.95 557D019 0.0 - 0.5 D13 5,100 mg/kg
Silver 2.59 557D002 0.0 - 0.25 D02 5,100 mg/kg
Tl-208 0.733 557D009 0.0 - 0.5 D08 5 pCi/g
U-234 1.042 557D010 1.0 - 1.5 D08 143 pCi/g
U-235 0.153 557D008 0.0 - 0.5 D07 17.6 pCi/g
U-238 0.965 557D010 1.0 - 1.5 D08 105 pCi/g
J = Estimated value
Table 2-5Maximum Concentration of Detected Contaminants in Soil for CAS 25-25-18, Train Maintenance Bldg 3901 Spill Site
(Page 2 of 2)
Contaminant MaximumResult
SampleNumber
Depth(ft bgs) Location FAL Units
UNCONTROLLED when Printed

CAU 557 CADD/CRSection: 2.0Revision: 0Date: May 2009Page 23 of 28
Sample locations that support the presence and/or extent of contamination at each CAS are shown in
Appendix B. Based on the results of the DQA presented in Appendix B, the DQO requirements for
CAU 557 have been met. The DQA also determined that information generated during the CAI
support the CSM assumptions and that the data collected support their intended use in the
decision-making process.
2.3 Justification for No Further Action
No further corrective action is justified based on an evaluation of risk to ensure protection of the
public and the environment in accordance with Nevada Administrative Code (NAC) Section 445A
(NAC, 2006a), feasibility, and cost effectiveness. The decision that no further action is needed was
determined from DQO decision statements based on a comparison of the analyte concentrations
detected in CAI soil samples to the FALs defined in Section 2.3.1 of this document.
The only contaminant identified at concentrations exceeding PALs was TPH-DRO. This was
identified at three of the four CASs (CASs 03-02-02, 06-99-10, and 25-25-18); however, because the
individual hazardous constituents of diesel did not exceed their corresponding FALs, TPH-DRO is
not considered to be a COC at these sites.
As no COCs were identified, no corrective action is required for CAU 557. Appendix C presents the
justification for no further action based on risk.
As a best management practice (BMP) at CAS 03-02-02, the vertical casing will be removed and
properly disposed, and the resulting excavation will be backfilled to grade with inert material. As a
BMP at CAS 06-99-10, the tar material will be removed and properly disposed.
2.3.1 Final Action Levels
The CAU 557 FALs are risk-based cleanup goals that, if met, will ensure that each release site will
not pose an unacceptable risk to human health and the environment, and that conditions at each site
are in compliance with all applicable laws and regulations. The risk-based corrective action (RBCA)
process used to establish FALs is described in the Industrial Sites Project Establishment of Final
Action Levels (NNSA/NSO, 2006). This process conforms with NAC Section 445A.227, which lists
the requirements for sites with soil contamination (NAC, 2006b). For the evaluation of corrective
UNCONTROLLED when Printed

CAU 557 CADD/CRSection: 2.0Revision: 0Date: May 2009Page 24 of 28
actions, NAC Section 445A.22705 (NAC, 2006c) requires the use of American Society for Testing
and Materials (ASTM) Method E 1739-95 (ASTM, 1995) to “conduct an evaluation of the site, based
on the risk it poses to public health and the environment, to determine the necessary remediation
standards (i.e., FALs) or to establish that corrective action is not necessary.”
This RBCA process defines three tiers (or levels) of evaluation involving increasingly
sophisticated analyses:
• Tier 1 Evaluation – Sample results from source areas (highest concentrations) are compared to action levels based on generic (non-site-specific) conditions (i.e., the PALs established in the CAIP [NNSA/NSO, 2008]). The FALs may then be established as the Tier 1 action levels, or the FALs may be calculated using a Tier 2 evaluation.
• Tier 2 Evaluation – Conducted by calculating Tier 2 site-specific target levels (SSTLs) using site-specific information as inputs to the same or similar methodology used to calculate Tier 1 action levels. The Tier 2 SSTLs are then compared to individual sample results from reasonable points of exposure (as opposed to the source areas as is done in Tier 1) on a point-by-point basis. Total TPH concentrations will not be used for risk-based decisions under Tier 2 or Tier 3. Rather, the individual chemicals of concern will be compared to the SSTLs.
• Tier 3 Evaluation – Conducted by calculating Tier 3 SSTLs on the basis of more sophisticated risk analyses using methodologies described in Method E 1739-95 that consider site-, pathway-, and receptor-specific parameters.
A Tier 1 evaluation was conducted for all COPCs to determine whether contaminant levels satisfy the
criteria for a quick regulatory closure or warrant a more site-specific assessment. This was
accomplished by comparing individual source area contaminant concentration results to the Tier 1
action levels (the PALs established in the CAIP [NNSA/NSO, 2008]).
The constituents detected at the CAU 557 CASs that exceeded Tier 1 action levels were:
• TPH-DRO at CASs 03-02-02, 06-99-10, and 25-25-18
The concentrations of all constituents and CASs not listed above were below Tier 1 action levels, and
the corresponding FALs were established as the Tier 1 action levels.
The TPH-DRO results that exceeded Tier 1 action levels at CAS 03-02-02, 06-99-10, and 25-25-18
were passed on to a Tier 2 evaluation, which consisted of evaluating the hazardous constituents of
UNCONTROLLED when Printed

CAU 557 CADD/CRSection: 2.0Revision: 0Date: May 2009Page 25 of 28
diesel to their respective Tier 2 SSTLs. The Tier 2 SSTLs for the hazardous constituents of diesel
were established at the corresponding PAL concentrations. None of the individual hazardous
constituents of diesel exceeded their Tier 2 SSTLs. Therefore, the FALs were established at the
corresponding PAL concentrations, and neither TPH-DRO nor any of the individual hazardous
constituents of diesel are considered to be COCs at these sites. Additional details for the calculation
of the Tier 2 FALs are presented in Appendix C.
The FALs for all CAU 557 COPCs are shown in Table 2-6.
Table 2-6Definition of FALs for CAU 557 COPCs
COPCs Tier 1 Based FALs Tier 2 Based FALs Tier 3 Based FALs
VOCs PALs None N/A
SVOCs PALs None N/A
PCBs PALs None N/A
Pesticides PALs None N/A
RCRA Metals PALsa None N/A
TPH-DRO PALs Region 9 PRGs for individual hazardous constituents of dieselb N/A
Radionuclides PALs None N/A
aBased on the background concentrations for metals. Background is considered the average plus two times the standard deviation for sediment samples collected by the Nevada Bureau of Mines and Geology throughout the Nevada Test and Training Range (NBMG, 1998; Moore, 1999).bBased on Region 9 Preliminary Remediation Goals (PRGs) (EPA, 2004).
RCRA = Resource Conservation and Recovery ActSVOC = Semivolatile organic compound
UNCONTROLLED when Printed

CAU 557 CADD/CRSection: 3.0Revision: 0Date: May 2009Page 26 of 28
3.0 Recommendations
No further corrective action is required at CAU 557 based on the implementation of the following
corrective actions:
• Close CASs 01-25-02, 03-02-02, 06-99-10, and 25-25-18 under a corrective action of no further action as no contaminants were present at concentrations exceeding FALs.
Selection of this corrective action is consistent with past practices for CASs that do not
contain COCs.
The DOE, National Nuclear Security Administration Nevada Site Office (NNSA/NSO) requests that
NDEP issue a Notice of Completion for CAU 557 and approval to move the CAU from Appendix III
to Appendix IV of the FFACO.
UNCONTROLLED when Printed

CAU 557 CADD/CRSection: 4.0Revision: 0Date: May 2009Page 27 of 28
4.0 References
ASTM, see American Society for Testing and Materials.
American Society for Testing and Materials. 1995. Standard Guide for Risk-Based Corrective Action Applied at Petroleum Release Sites, ASTM E 1739-95 (Reapproved 2002). Philadelphia, PA.
EPA, see U.S. Environmental Protection Agency.
FFACO, see Federal Facility Agreement and Consent Order.
Federal Facility Agreement and Consent Order. 1996 (as amended February 2008). Agreed to by the State of Nevada; U.S. Department of Energy, Environmental Management; U.S. Department of Defense; and U.S. Department of Energy, Legacy Management.
Moore, J., Science Applications International Corporation. 1999. Memorandum to M. Todd (SAIC) entitled, “Background Concentrations for NTS and TTR Soil Samples, 3 February. Las Vegas, NV.
NAC, see Nevada Administrative Code.
NBMG, see Nevada Bureau of Mines and Geology.
NNSA/NSO, see U.S. Department of Energy, National Nuclear Security Administration Nevada Site Office.
NNSA/NV, see U.S. Department of Energy, National Nuclear Security Administration Nevada Operations Office.
Nevada Administrative Code. 2006a. NAC 445A, “Water Controls.” Carson City, NV. As accessed at http://www.leg.state.nv.us/nac on 16 April 2008.
Nevada Administrative Code. 2006b. NAC 445A.227, “Contamination of Soil: Order by Director for Corrective Action; Factors To Be Considered in Determining Whether Corrective Action Required.” Carson City, NV. As accessed at http://www.leg.state.nv.us/nac on 16 April 2008.
Nevada Administrative Code. 2006c. NAC 445A.22705, “Contamination of Soil: Evaluation of Site by Owner or Operator; Review of Evaluation by Division.” Carson City, NV. As accessed at http://www.leg.state.nv.us/nac on 16 April 2008.
Nevada Bureau of Mines and Geology. 1998. Mineral and Energy Resource Assessment of the Nellis Air Force Range, Open-File Report 98-1. Reno, NV.
UNCONTROLLED when Printed

CAU 557 CADD/CRSection: 4.0Revision: 0Date: May 2009Page 28 of 28
REECo, see Reynolds Electrical & Engineering Co., Inc.
Reynolds Electrical & Engineering Co., Inc. 1994a. Letter to D.R. Elle from E.W. Kendall entitled, “Transmittal of 45-Day Report for Nevada Division of Emergency Management (NDEM) Case Number H931124D - Area 1 Crusher Plant,” 20 January. Las Vegas, NV.
Reynolds Electrical & Engineering Co., Inc. 1994b. Memorandum to K.A. Hoar through J.W. Wiener to R.J. Miller entitled, “Work Request - Bill of Lading Number 530-5-10A,” 5 May. Las Vegas, NV.
Reynolds Electrical & Engineering Co., Inc. 1994c. Memorandum to C.C. Neagle from A.R. Latham entitled, “Sample Analytical Results,” 27 January. Las Vegas, NV.
SNJV GIS, see Stoller-Navarro Joint Venture Geographic Information Systems.
Stoller-Navarro Joint Venture Geographic Information Systems. 2009. ESRI ArcGIS Software.
U.S. Department of Energy, National Nuclear Security Administration Nevada Operations Office. 2002. Industrial Sites Quality Assurance Project Plan, Nevada Test Site, Nevada, Rev. 3, DOE/NV--372. Las Vegas, NV.
U.S. Department of Energy, National Nuclear Security Administration Nevada Site Office. 2006. Industrial Sites Project Establishment of Final Action Levels, Rev. 0, DOE/NV--1107. Las Vegas, NV.
U.S. Department of Energy, National Nuclear Security Administration Nevada Site Office. 2008. Corrective Action Investigation Plan for Corrective Action Unit 557: Spills and Tank Sites, Nevada Test Site, Nevada, Rev. 0, DOE/NV--1277. Las Vegas, NV.
U.S. Environmental Protection Agency. 2004. Region 9 Preliminary Remediation Goals (PRGs). As accessed at http://www.epa.gov/region09/waste/sfund/prg/index.htm on 23 April 2008. Prepared by S.J. Smucker. San Francisco, CA.
U.S. Environmental Protection Agency. 2006. EPA Guidance on Systematic Planning Using the Data Quality Objectives Process, EPA QA/G-4. Washington, DC.
UNCONTROLLED when Printed

Appendix A
Corrective Action Investigation Results
UNCONTROLLED when Printed

CAU 557 CADD/CRAppendix ARevision: 0Date: May 2009Page A-1 of A-61
A.1.0 Introduction
This appendix presents the CAI activities and analytical results for CAU 557: Spills and Tank Sites.
The following four CASs comprise CAU 557 and are located in Areas 1, 3, 6, and 25 of the NTS
(see Figure 1-1). Additional information regarding the history of each site, scope of the investigation,
and planning of activities, is presented in the CAU 557 CAIP (NNSA/NSO, 2008).
• CAS 01-25-02, Fuel Spill• CAS 03-02-02, Area 3 Subdock UST• CAS 06-99-10, Tar Spills• CAS 25-25-18, Train Maintenance Bldg 3901 Spill Site
Corrective Action Site 01-25-02, Fuel Spill, consists of residual diesel contamination in soil
remaining at the bottom of a backfilled excavation at the Area 1 Batch Plant. The diesel is associated
with a historical diesel fuel release that was remediated through excavation in late 1993 and early
1994 at which time the excavation was backfilled to grade with clean native soil (REECo, 1994a and
b). However, it was reported that the diesel contamination was not completely removed, as a diesel
concentration of 1,740 mg/kg remained at the bottom of the excavation (REECo, 1994c). The CAS
location and site layout is shown on Figure A.3-1.
Corrective Action Site 03-02-02, Area 3 Subdock UST, was investigated due to a potential release of
contaminants into the surrounding media from an undocumented flush-mounted subsurface steel
feature having an unknown purpose or design configuration. The feature was discovered in 2004
during a site visit to CAS 03-20-04 under CAU 145 (Fahringer, 2004). The CAS location and site
layout is shown on Figure A.4-1.
Corrective Action Site 06-99-10, Tar Spills, is located approximately 500 ft south of CP-72, just west
of a utility access road that parallels Mercury Highway, and consists of potential soil contamination
from two surface spills of a tar-like material released from an unknown source. The CAS location
and site layout is shown on Figure A.5-1.
Correction Action Site 25-25-18, Train Maintenance Bldg 3901 Spill Site, is located just north of the
ETSM Building within the EMAD facility in Area 25. This CAS consists of potential soil
contamination from a historic surface spill reported to be released on both sides of the railroad tracks
UNCONTROLLED when Printed

CAU 557 CADD/CRAppendix ARevision: 0Date: May 2009Page A-2 of A-61
leading into the north bay of the ETSM Building. The ETSM Building (Bldg 3901) was used for
servicing train engines and other equipment. The CAS location and site layout is shown on
Figure A.6-1.
A.1.1 Project Objective
The primary objective of the CAI is to provide sufficient information to document completion of
appropriate corrective actions for each CAS within CAU 557 and to support recommendations for
closure of the CAU 557 CASs. This objective was achieved by confirming the absence of COCs at
all four CASs within CAU 557.
The selection of soil and/or waste characterization sample locations for CAU 557 was based on a
combination of past and present site conditions and the sampling strategies developed for each site
during the DQO process, as outlined in Appendix A of the CAU 557 CAIP (NNSA/NSO, 2008).
The sampling strategy for CAU 557 implemented a judgemental sampling approach which involved
the collection of samples from biased locations at each CAS. Sampling locations were selected as the
most likely locations to find contamination, if present.
A.1.2 Contents
This appendix describes the investigation activities performed at CAU 557 and presents the results.
The contents of this appendix are as follows:
• Section A.1.0 describes the investigation background, objectives, and content.
• Section A.2.0 provides an overview of the investigation.
• Sections A.3.0 through A.6.0 provide CAS-specific information regarding the field activities, sampling methods, and laboratory analytical results from investigation sampling.
• Section A.7.0 summarizes waste management activities.
• Section A.8.0 discusses the QA and QC processes followed, and results of QA/QC activities.
• Section A.9.0 provides a summary of the investigation results.
• Section A.10.0 lists the cited references.
UNCONTROLLED when Printed

CAU 557 CADD/CRAppendix ARevision: 0Date: May 2009Page A-3 of A-61
The complete field documentation and laboratory data — including field activity daily logs, sample
collection logs (SCLs), analysis request/chain-of-custody forms, sample descriptions, laboratory
certificates of analyses, analytical results, and surveillance results — are retained in the CAU 557
project files as hard copy or as electronic media.
UNCONTROLLED when Printed

CAU 557 CADD/CRAppendix ARevision: 0Date: May 2009Page A-4 of A-61
A.2.0 Investigation Overview
Field investigation and sampling activities for the CAU 557 CAI were conducted from May 5 through
November 24, 2008. Table A.2-1 lists the CAI activities that were conducted at each CAS.
The investigation and sampling program was managed in accordance with the requirements set forth
in the CAU 557 CAIP (NNSA/NSO, 2008). Samples were collected and documented following the
Table A.2-1Corrective Active Investigation Activities Conducted at CAU 557
To Meet CAIP Requirements
CAI ActivitiesCAS
01-25-02 03-02-02 06-99-10 25-25-18
Inspected CAS and potential CAS system components identified in the CAIP.
X X X X
Reviewed previous site geophysical survey results. -- X -- --
Reviewed previous site radiological walkover survey results and conducted a radiological surface soil walkover survey.
-- X -- X
Performed general site walkovers to identify biased sampling locations.
X X X X
Drilled a borehole, observed lithology changes, logged soil types, and collected soil samples.
X -- -- --
Conducted video surveys using a video-mole survey instrument to identify system configurations.
-- X -- --
Field screened selected soil samples for VOCs using an air headspace method and handheld PID.
X X X X
Field screened samples for alpha and beta/gamma radiation using a handheld survey instrument.
X X X X
Collected sand/sediment, solid material, and stained soil for waste characterization in support of potential disposal recommendations.
-- X X X
Collected surface, near subsurface and/or subsurface soil samples.
X X X X
Collected swipes of sample jars and shipping coolers for removable radioactivity for shipping samples to offsite laboratories.
X X X X
Submitted select samples for offsite laboratory analysis. X X X X
Collected site marker and sample coordinates for reference. X X X X
-- = Not applicable
UNCONTROLLED when Printed
CAU 557 CADD/CRAppendix ARevision: 0Date: May 2009Page A-5 of A-61
CAIP and approved protocols and procedures. Quality control samples (e.g., field blanks, equipment
rinsate blanks, trip blanks, and FD samples) were collected as required by the Industrial Sites QAPP
(NNSA/NV, 2002) and the CAU 557 CAIP. During field activities, waste minimization practices
were followed according to approved procedures, including segregation of the wastes according to
their waste stream.
The CASs were investigated by conducting radiological surveys, sampling potential contaminant
sources, and sampling surface and shallow subsurface soils. At CAS 01-25-02, subsurface soils were
collected using a drill rig. At all other CASs, surface soil samples were collected through excavation
using hand tools and subsurface soil samples were collected using a hand auger or via excavation
using a backhoe when sampling depths were greater than 4 ft bgs. The soil samples were field
screened at specific locations for VOCs using the headspace method, and for total (gross) alpha and
beta/gamma radiation using handheld instruments. The FSRs were compared against FSLs to select
samples to be submitted for offsite laboratory analyses. Samples of tar at CAS 06-99-10 were
collected to support both environmental and waste characterization decisions.
The planned sampling locations were accessible, and sampling activities were not restricted and
remained within anticipated spatial boundaries at each CAS.
Based on analytical sampling results, Decision II step-out samples were not necessary at any of the
CAU 557 CASs. Sections A.2.1 through A.2.4 provide the investigation methodology, site geology
and hydrology, and laboratory analytical information.
A.2.1 Boring and Sample Locations
Investigation locations selected for sampling were based on interpretation of existing engineering
drawings, aerial and land photographs, interviews with former and current site employees,
information obtained during site visits, and site conditions as provided in the CAU 557 CAIP
(NNSA/NSO, 2008). Sampling points for each site were selected based on the approach provided in
the CAIP. The planned biased sample locations are discussed in text and represented on figures
provided in the CAIP. Actual environmental sample locations are shown on the figures included in
Sections A.3.0 through A.6.0 of this document. Some locations at CAS 03-02-02 were modified
slightly from planned positions due to field conditions and/or observations made during inspections.
UNCONTROLLED when Printed

CAU 557 CADD/CRAppendix ARevision: 0Date: May 2009Page A-6 of A-61
Sample locations were staked and labeled for reference, and Appendix D presents the coordinates in
tabular format for sample locations at each CAS.
A.2.2 Investigation Activities
The investigation activities performed at each CAS within CAU 557 were based on field
investigation activities discussed in the CAU 557 CAIP (NNSA/NSO, 2008). The technical approach
consisted of the activities listed in Table A.2-1. The CAS-specific investigation strategy allowed for
the establishment of the nature and extent of potential contamination associated with each CAS. The
following sections describe the specific investigation activities that took place at the CAU 557 CASs.
A.2.2.1 Radiological Walkover Surveys
Before the CAI at CAS 03-02-02 and during the CAI at CAS 25-25-18, surface radiological
walkover surveys were performed to identify the presence of potential radiological contaminants at
activities that are distinguishable from background activities at these sites. The surveys were
performed using a handheld plastic scintillation detector in conjunction with a global positioning
receiver and data logger.
A.2.2.2 Geophysical Surveys
No geophysical surveys were performed at any of the CASs during this investigation; however, at
CAS 03-02-02, previous geophysical survey results were reviewed, and investigation areas and
proposed sampling points were identified in the CAIP (NNSA/NSO, 2008).
A.2.2.3 Field Screening
Field-screening activities for VOCs, gross alpha and beta/gamma radiation, and gamma-emitting
radionuclides were performed at each CAS as specified in the CAU 557 CAIP (NNSA/NSO, 2008).
Field screening for VOCs was conducted using a PID. Gross alpha and beta/gamma radioactivities
were determined by using a handheld radiation detection instrument that was held within an inch over
the sample for one minute. The radiological field screening was performed using an NE Technology
Electra fitted with a DP6 dual-alpha and beta/gamma radiation scintillation probe.
UNCONTROLLED when Printed

CAU 557 CADD/CRAppendix ARevision: 0Date: May 2009Page A-7 of A-61
Before the start of sampling activities at each CAS, the background activity for gross alpha and
beta/gamma radiation was established for the site. The site-specific FSLs for radiation were defined
as the mean background activity level plus two times the standard deviation of readings taken from
10 background locations that were selected near each CAS. In addition, the radiation FSLs are
instrument-specific and were established for each instrument and CAS before use. At each specific
sampling location, the sample material was field screened for gross alpha and beta/gamma radiation,
before sample collection. The FSRs were compared against daily FSLs to guide in the selection of
samples from specific intervals and/or locations. Field screening was also performed for health and
safety controls and to meet transportation requirements.
The CAS-specific sections of this document identify the CASs where field screening was conducted
and how the FSLs were used to aid in the selection of samples. Field-screening results are recorded
on SCLs and are retained in project files.
A.2.2.4 Video Surveys
A video survey was conducted at CAS 03-02-02 using a video-mole surveying instrument to inspect
the interior of the vertical casing, to determine the integrity of the steel casing and the presence of any
pipe tie-ins, and to determine whether contents were present within the casing itself. Video-mole
surveys were not required at any of the other CAU 557 CASs.
A.2.2.5 Surface and Subsurface Soil Sampling
Surface soil samples were collected using hand sampling methods (scoop and trowel), while
subsurface soil samples were collected using hand augering, backhoe excavation, and drill rig
methods. All samples were field screened for alpha and beta/gamma radiation before the start of
sampling, as well as for VOC headspace screening during sample collection to guide in the sample
collection decisions during the CAI and to serve as a health and safety control for protection of the
sampling team. Sample containers were filled according to the following sequence:
1. Volatile organic compound sample containers were filled with soil directly from the sample location for both laboratory analysis and headspace field screening.
UNCONTROLLED when Printed
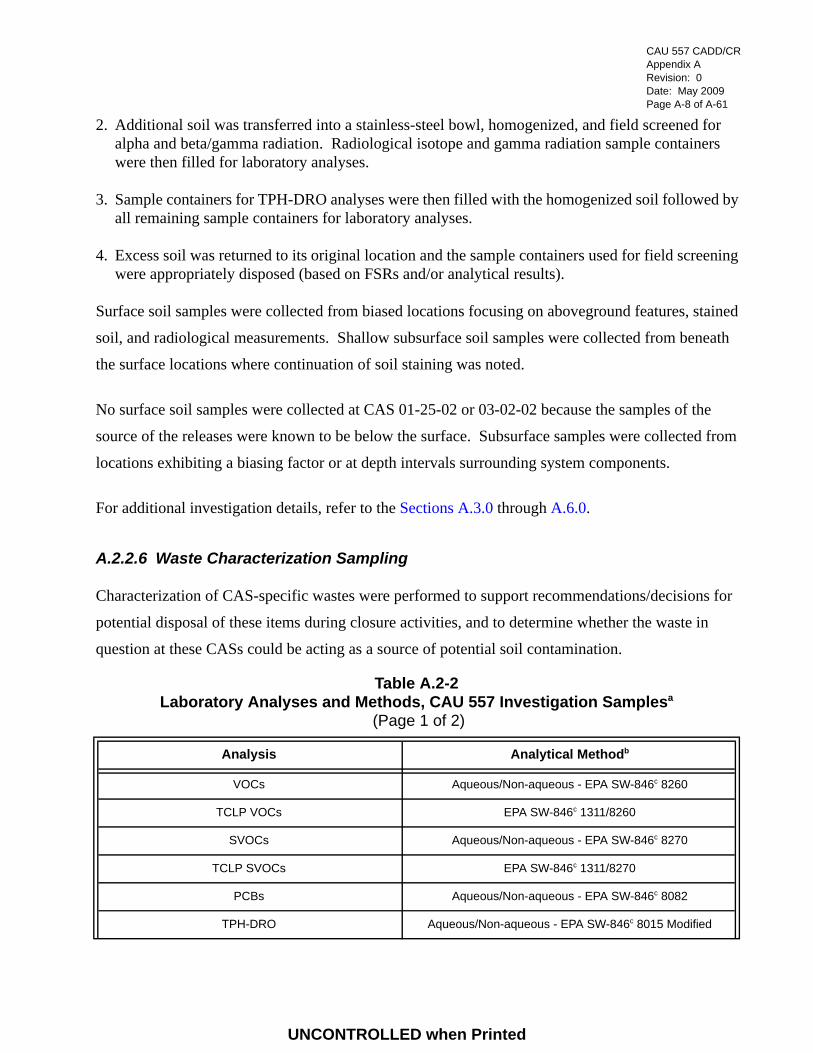
CAU 557 CADD/CRAppendix ARevision: 0Date: May 2009Page A-8 of A-61
2. Additional soil was transferred into a stainless-steel bowl, homogenized, and field screened for alpha and beta/gamma radiation. Radiological isotope and gamma radiation sample containers were then filled for laboratory analyses.
3. Sample containers for TPH-DRO analyses were then filled with the homogenized soil followed by all remaining sample containers for laboratory analyses.
4. Excess soil was returned to its original location and the sample containers used for field screening were appropriately disposed (based on FSRs and/or analytical results).
Surface soil samples were collected from biased locations focusing on aboveground features, stained
soil, and radiological measurements. Shallow subsurface soil samples were collected from beneath
the surface locations where continuation of soil staining was noted.
No surface soil samples were collected at CAS 01-25-02 or 03-02-02 because the samples of the
source of the releases were known to be below the surface. Subsurface samples were collected from
locations exhibiting a biasing factor or at depth intervals surrounding system components.
For additional investigation details, refer to the Sections A.3.0 through A.6.0.
A.2.2.6 Waste Characterization Sampling
Characterization of CAS-specific wastes were performed to support recommendations/decisions for
potential disposal of these items during closure activities, and to determine whether the waste in
question at these CASs could be acting as a source of potential soil contamination.
Table A.2-2Laboratory Analyses and Methods, CAU 557 Investigation Samplesa
(Page 1 of 2)
Analysis Analytical Methodb
VOCs Aqueous/Non-aqueous - EPA SW-846c 8260
TCLP VOCs EPA SW-846c 1311/8260
SVOCs Aqueous/Non-aqueous - EPA SW-846c 8270
TCLP SVOCs EPA SW-846c 1311/8270
PCBs Aqueous/Non-aqueous - EPA SW-846c 8082
TPH-DRO Aqueous/Non-aqueous - EPA SW-846c 8015 Modified
UNCONTROLLED when Printed
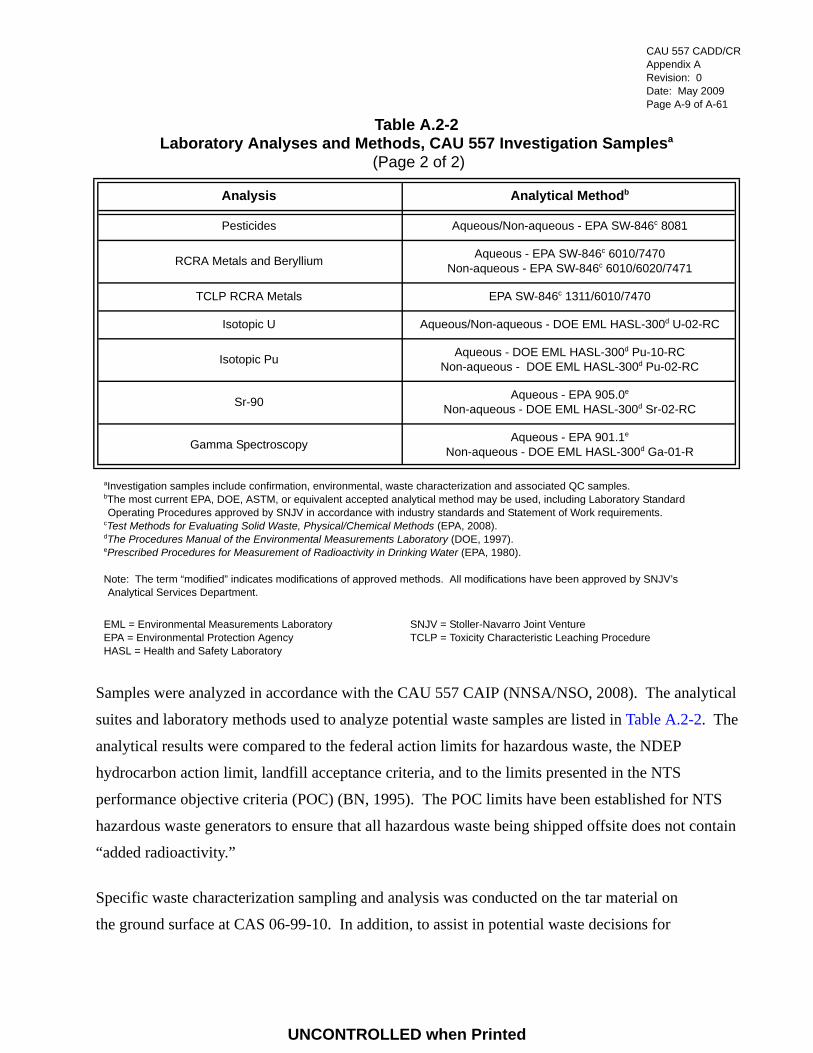
CAU 557 CADD/CRAppendix ARevision: 0Date: May 2009Page A-9 of A-61
Samples were analyzed in accordance with the CAU 557 CAIP (NNSA/NSO, 2008). The analytical
suites and laboratory methods used to analyze potential waste samples are listed in Table A.2-2. The
analytical results were compared to the federal action limits for hazardous waste, the NDEP
hydrocarbon action limit, landfill acceptance criteria, and to the limits presented in the NTS
performance objective criteria (POC) (BN, 1995). The POC limits have been established for NTS
hazardous waste generators to ensure that all hazardous waste being shipped offsite does not contain
“added radioactivity.”
Specific waste characterization sampling and analysis was conducted on the tar material on
the ground surface at CAS 06-99-10. In addition, to assist in potential waste decisions for
Pesticides Aqueous/Non-aqueous - EPA SW-846c 8081
RCRA Metals and Beryllium Aqueous - EPA SW-846c 6010/7470Non-aqueous - EPA SW-846c 6010/6020/7471
TCLP RCRA Metals EPA SW-846c 1311/6010/7470
Isotopic U Aqueous/Non-aqueous - DOE EML HASL-300d U-02-RC
Isotopic Pu Aqueous - DOE EML HASL-300d Pu-10-RCNon-aqueous - DOE EML HASL-300d Pu-02-RC
Sr-90 Aqueous - EPA 905.0e
Non-aqueous - DOE EML HASL-300d Sr-02-RC
Gamma Spectroscopy Aqueous - EPA 901.1e
Non-aqueous - DOE EML HASL-300d Ga-01-R
aInvestigation samples include confirmation, environmental, waste characterization and associated QC samples.bThe most current EPA, DOE, ASTM, or equivalent accepted analytical method may be used, including Laboratory Standard Operating Procedures approved by SNJV in accordance with industry standards and Statement of Work requirements.
cTest Methods for Evaluating Solid Waste, Physical/Chemical Methods (EPA, 2008).dThe Procedures Manual of the Environmental Measurements Laboratory (DOE, 1997).ePrescribed Procedures for Measurement of Radioactivity in Drinking Water (EPA, 1980).
Note: The term “modified” indicates modifications of approved methods. All modifications have been approved by SNJV’s Analytical Services Department.
EML = Environmental Measurements LaboratoryEPA = Environmental Protection AgencyHASL = Health and Safety Laboratory
SNJV = Stoller-Navarro Joint VentureTCLP = Toxicity Characteristic Leaching Procedure
Table A.2-2Laboratory Analyses and Methods, CAU 557 Investigation Samplesa
(Page 2 of 2)
Analysis Analytical Methodb
UNCONTROLLED when Printed

CAU 557 CADD/CRAppendix ARevision: 0Date: May 2009Page A-10 of A-61
CASs 03-02-02 and 25-25-18, waste characterization sampling and analysis was also conducted on
the sediment within the steel casing at CAS 03-02-02 and on the stained soil at CAS 25-25-18.
Additional detail regarding waste characterization activities, analyses, and sample results are
provided in the applicable CAS-specific subsections and in Section A.7.0.
A.2.3 Laboratory Analytical Information
The analytical parameters are CAS-specific and were selected through the application of site process
knowledge according to the DQOs presented in the CAU 557 CAIP (NNSA/NSO, 2008). Chemical
analyses were performed by EMAX Laboratories, Inc., of Torrance, California, while the radiological
analyses were performed by Eberline Services of Oakridge, Tennessee. The analytical suites and
laboratory analytical methods used to analyze investigation samples are listed in Table A.2-2.
Analytical results are reported in the following CAS-specific subsections only if they were detected
above the laboratory minimum detectable concentrations (MDCs). The complete laboratory data
packages are available in the project files.
Validated analytical data for CAU 557 investigation samples have been compiled and evaluated to
confirm the absence of COC contamination at each of the four sites. The analytical results for each
CAS are presented in Sections A.3.0 through A.6.0.
A.2.4 Comparison to Action Levels
A COC is defined as any contaminant present in environmental media exceeding a FAL. A COC may
also be defined as a contaminant that, in combination with other like contaminants, is determined to
jointly pose an unacceptable risk based on a multiple constituent analysis (NNSA/NSO, 2006).
Multiple constituent analyses are presented in Appendix C.
If a COC is present in the environmental media, a corrective action must be considered for the CAS.
The FALs for the CAU 557 investigation have been defined for each CAS as shown in Appendix C.
Analytical results that are equal to or greater than FALs are identified by bold text in the CAS-specific
results tables present in Sections A.3.0 through A.6.0.
UNCONTROLLED when Printed

CAU 557 CADD/CRAppendix ARevision: 0Date: May 2009Page A-11 of A-61
A corrective action may also be necessary if there is a potential for waste material that is present at a
site to release a COC to the site environmental media (i.e., PSM). To evaluate a waste for such a
scenario, the following conservative assumptions were made:
• Any physical waste containment would fail at some point, and the contents would be released to the surrounding media.
• For non-liquid wastes, the concentration of the contaminants in the surrounding soil would be equal to the concentration of contaminants in the waste.
• For liquid wastes, the resulting concentration of contaminants in the surrounding soil would be calculated based on the concentration of contaminants in the wastes and the liquid holding capacity of the soil.
UNCONTROLLED when Printed
CAU 557 CADD/CRAppendix ARevision: 0Date: May 2009Page A-12 of A-61
A.3.0 CAS 01-25-02, Fuel Spill, Investigation Results
Corrective Action Site 01-25-02 is located at the Area 1 Batch Plant and was investigated to confirm
the absence or presence of diesel fuel at the bottom of a former excavation. It was reported in late
1993 that stained soil was discovered while excavating for the construction of a concrete pad
(REECo, 1994a). The CAS location and site layout is shown on Figure A.3-1.
The hydrocarbon-impacted soil was removed in late 1993 and early 1994, and the excavation was
backfilled to grade. Soil verification samples were collected from the sidewalls and bottom of the
excavation before backfilling (REECo, 1994b). Review of the analytical results determined sufficient
soil had been removed in the horizontal direction; however, diesel fuel still remained at the
excavation bottom at a concentration of greater than regulatory levels (REECo, 1994c).
During the DQO process in preparation for the CAU 557 CAIP (NNSA/NSO, 2008), review of
analytical results from the 1993-1994 soil removal and sampling activities was inconclusive with
respect to the detection and removal of the hazardous constituents of diesel fuel at the base of the
former excavation.
A.3.1 Corrective Action Investigation
A total of three confirmation soil samples (including one FD) were collected during CAI activities at
CAS 01-25-02. The sample IDs, locations, matrix types, and analyses are listed in Table A.3-1, while
the sampling locations are shown on Figure A.3-1. The specific CAI activities conducted to satisfy
the CAIP requirements at this CAS (NNSA/NSO, 2008) are described in the following sections.
A.3.1.1 Visual Inspections
Subsurface soils were visually inspected during drilling activities at CAS 01-25-02 to identify biasing
factors (i.e., staining, soil discoloration) and to identify the boundary between excavation backfill
material and the underlying native soil. Backfill material consisting of light brown gravelly sand was
observed from 0 ft bgs to approximately 13 ft bgs. At 13 ft bgs, a distinct color change to
orange-brown moist sand was observed that may represent the native soil interface; however, a
distinct boundary between backfill material and native soil was not identified. This is attributed to the
UNCONTROLLED when Printed

CAU 557 CADD/CRAppendix ARevision: 0Date: May 2009Page A-13 of A-61
Figure A.3-1Corrective Action Investigation Site Map for CAS 01-25-02, Fuel Spill
UNCONTROLLED when Printed
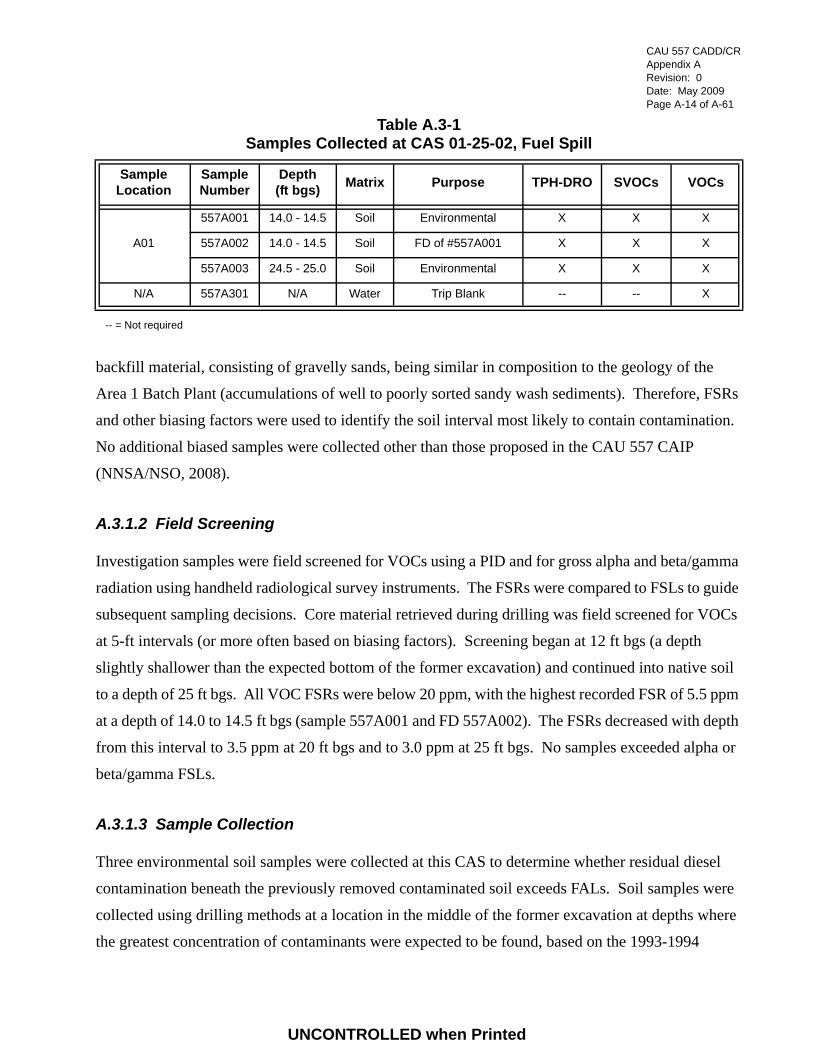
CAU 557 CADD/CRAppendix ARevision: 0Date: May 2009Page A-14 of A-61
backfill material, consisting of gravelly sands, being similar in composition to the geology of the
Area 1 Batch Plant (accumulations of well to poorly sorted sandy wash sediments). Therefore, FSRs
and other biasing factors were used to identify the soil interval most likely to contain contamination.
No additional biased samples were collected other than those proposed in the CAU 557 CAIP
(NNSA/NSO, 2008).
A.3.1.2 Field Screening
Investigation samples were field screened for VOCs using a PID and for gross alpha and beta/gamma
radiation using handheld radiological survey instruments. The FSRs were compared to FSLs to guide
subsequent sampling decisions. Core material retrieved during drilling was field screened for VOCs
at 5-ft intervals (or more often based on biasing factors). Screening began at 12 ft bgs (a depth
slightly shallower than the expected bottom of the former excavation) and continued into native soil
to a depth of 25 ft bgs. All VOC FSRs were below 20 ppm, with the highest recorded FSR of 5.5 ppm
at a depth of 14.0 to 14.5 ft bgs (sample 557A001 and FD 557A002). The FSRs decreased with depth
from this interval to 3.5 ppm at 20 ft bgs and to 3.0 ppm at 25 ft bgs. No samples exceeded alpha or
beta/gamma FSLs.
A.3.1.3 Sample Collection
Three environmental soil samples were collected at this CAS to determine whether residual diesel
contamination beneath the previously removed contaminated soil exceeds FALs. Soil samples were
collected using drilling methods at a location in the middle of the former excavation at depths where
the greatest concentration of contaminants were expected to be found, based on the 1993-1994
Table A.3-1Samples Collected at CAS 01-25-02, Fuel Spill
Sample Location
Sample Number
Depth(ft bgs) Matrix Purpose TPH-DRO SVOCs VOCs
A01
557A001 14.0 - 14.5 Soil Environmental X X X
557A002 14.0 - 14.5 Soil FD of #557A001 X X X
557A003 24.5 - 25.0 Soil Environmental X X X
N/A 557A301 N/A Water Trip Blank -- -- X
-- = Not required
UNCONTROLLED when Printed

CAU 557 CADD/CRAppendix ARevision: 0Date: May 2009Page A-15 of A-61
sampling results. Because the exact depth of the former excavation was not known, screening for
VOCs began at a depth of 12 ft bgs during this CAI to approximate the bottom of the former
excavation. Sample 557A001 (and FD 557A002) was collected from the 14.0 to 14.5 ft bgs interval
because the FSR for VOC headspace was the highest (5.5 ppm) at this interval. This was also the
interval of a distinct soil change from light brown gravelly sand to orange brown sand with more
moisture. Additional deeper soil intervals were field screened for VOCs to verify that contamination
decreases with depth. One soil sample (557A003) was collected from 24.5 to 25.0 ft bgs, which is the
interval in native soil with the lowest FSR of 3.0 ppm. The CAIP for CAU 557 planned for an
optional second boring to be drilled if contamination in the first boring was shown to increase with
depth. Because this was not the case, only one boring was drilled, and the lateral extent has been
established by the former excavation sidewalls (NNSA/NSO, 2008).
A.3.1.4 Deviations
There were no deviations to the CAIP requirements at this CAS. Investigation samples were
collected as outlined in the CAU 557 CAIP (NNSA/NSO, 2008). Samples were submitted for
laboratory analysis, as specified in the CAIP.
A.3.2 Investigation Results
The following sections provide analytical results from the samples collected to complete
investigation activities as outlined in the CAIP (NNSA/NSO, 2008). Investigation samples were
analyzed for the CAIP-specified COPCs. The analytical parameters and laboratory methods used to
analyze the investigation samples are listed in Table A.2-2. The sample-specific analytical suite for
CAS 01-25-02 is listed on Table A.3-1. An assessment of the analytical results is provided in
Appendix B.
Analytical results from the soil samples with concentrations exceeding MDCs are summarized in the
following sections. An evaluation was conducted on all contaminants detected above MDCs by
comparing individual concentration results against the corresponding PALs. The FALs were
established as the corresponding PAL concentrations if the contaminant concentrations were below
their respective PALs. Establishment of the FALs is presented in Appendix C.
UNCONTROLLED when Printed

CAU 557 CADD/CRAppendix ARevision: 0Date: May 2009Page A-16 of A-61
A.3.2.1 Volatile Organic Compounds
Analytical results for VOCs in soil samples collected at this CAS that were detected above MDCs are
presented in Table A.3-2. No VOCs were detected at concentrations exceeding their respective PALs.
Therefore, the FALs were established at the corresponding PAL concentrations.
A.3.2.2 Semivolatile Organic Compounds
No analytical results for SVOCs in soil samples collected at this CAS were detected above MDCs.
A.3.2.3 Total Petroleum Hydrocarbons
Analytical results for TPH-DRO in soil samples collected at this CAS that were detected above
MDCs are presented in Table A.3-3. Because TPH-DRO was not detected at a concentration
exceeding the PAL, the FAL was established at the corresponding PAL concentration.
Table A.3-2Soil Sample Results for VOCs Detected above MDCs at CAS 01-25-02, Fuel Spill
Sample Location Sample Number Depth(ft bgs)
COPCs (mg/kg)
Acetone
FAL 54,000
A01557A001 14.0 - 14.5 0.00303 (J)
557A003 24.5 - 25.0 0.003 (J)
J = Estimated value
Table A.3-3Soil Sample Results for TPH-DRO Detected above MDCs at CAS 01-25-02, Fuel Spill
Sample Location Sample Number Depth(ft bgs)
COPCs (mg/kg)
TPH-DRO
FAL 100
A01
557A001 14.0 - 14.5 1.47 (J)
557A002 14.0 - 14.5 1.21 (J)
557A003 24.5 - 25.0 1.5 (J)
J = Estimated value
UNCONTROLLED when Printed

CAU 557 CADD/CRAppendix ARevision: 0Date: May 2009Page A-17 of A-61
A.3.3 Nature and Extent of Contamination
Based on the analytical results in the environmental soil samples collected within CAS 01-25-02, no
COCs are present, and the initial 1993-1994 cleanup was confirmed. Therefore, no further action is
required at this CAS.
A.3.4 Conceptual Site Model
The CAIP requirements were met at this CAS, and no revisions were necessary to the original CSM.
UNCONTROLLED when Printed

CAU 557 CADD/CRAppendix ARevision: 0Date: May 2009Page A-18 of A-61
A.4.0 CAS 03-02-02, Area 3 Subdock UST, Investigation Results
Corrective Action Site 03-02-02 is located at the Area 3 Subdock and consists of an undocumented
buried steel casing used for unknown purposes. The system components consist of a flush-mounted
5-ft diameter perforated steel casing, which is set vertically. The casing is fitted with a steel lid that is
welded to the top and has side flaps overlapping the first 2 ft of the casing. No other features
associated with the casing were identified during the CAI. The CAS location and site layout is shown
on Figure A.4-1.
Before the CAI, geophysical walkover surveys were conducted at this CAS that indicated a possible
second feature, suggesting shallow piping connecting to the main feature (Weston, 2006). In
addition, a radiological walkover survey was conducted at CAS 03-02-02 which indicated the general
CAS area to be similar to the site background readings and no radiological concern was identified.
A.4.1 Corrective Action Investigation
A total of six environmental soil samples were collected during CAI activities at CAS 03-02-02. The
sample IDs, locations, matrix types, and analyses performed are listed in Table A.4-1, while the
sample locations are shown on Figure A.4-1. The specific CAI activities conducted to satisfy the
CAIP requirements at this CAS (NNSA/NSO, 2008) are described in the following sections.
A.4.1.1 Geophysical Survey
Before the CAI, a preliminary geophysical survey was performed at CAS 03-02-02 that identified two
large anomalies and several linear anomalies (Weston, 2006). The first anomaly corresponds to the
main feature of the CAS, a vertical steel casing with a lid that is flush with the ground surface and
mostly covered with soil. The second large anomaly is located approximately 5 ft northeast of the
steel casing and was interpreted to be a second feature connected to the steel casing by subsurface
piping at a depth of 1 m or less.
A.4.1.2 Visual Inspections
Visual inspections were conducted during excavation activities to determine the configuration of the
CAS feature(s) and to identify any biasing factors that would warrant sample collection. Initial
UNCONTROLLED when Printed

CAU 557 CADD/CRAppendix ARevision: 0Date: May 2009Page A-19 of A-61
Figure A.4-1Corrective Action Investigation Site Map for CAS 03-02-02, Area 3 Subdock UST
UNCONTROLLED when Printed

CAU 557 CADD/CRAppendix ARevision: 0Date: May 2009Page A-20 of A-61
Table A.4-1Samples Collected at CAS 03-02-02, Area 3 Subdock UST
Sample Location
Sample Number
Depth(ft bgs) Matrix Purpose
TPH
-DR
O
Gam
ma
Spec
tros
copy
RC
RA
Met
als
PCB
s
VOC
s
SVO
Cs
Plut
oniu
m
Sr-9
0
TCLP
Met
als
TCLP
SVO
Cs
TCLP
VO
Cs
Ura
nium
B01
557B001 3.0 - 4.0a Sediment Environmental X X X X X X X X -- -- -- X
557B002 8.0 - 9.0b Sediment Environmental X X X X X X X X -- -- -- X
557B003 9.0 - 9.5c Sediment Environmental X X X X X X X X X X X X
B02557B004 9.0 - 9.5 Soil Environmental X X X X X X X X -- -- -- X
557B005 13.0 - 13.5 Soil Environmental X X X X X X X X -- -- -- X
B03 557B006 17.5 - 18.0 Soil Environmental X X X X X X X X -- -- -- X
N/A 557B301 N/A Water Trip Blank -- -- -- -- X -- -- -- -- -- -- --N/A 557B302 N/A Water Trip Blank, QC -- -- -- -- X -- -- -- -- -- -- --
Sample Table 557B303 N/A Water Field Blank X X X X -- X X X -- -- -- X
N/A 557B304 N/A Water Equipment Rinsate X X X X -- X X X -- -- -- X
N/A 557B305 N/A Water Equipment Rinsate X X X X -- X X X -- -- -- X
aCasing contents start at 3 ft bgs (i.e., sample was taken from 0 to 1 ft below top of sand/sediment layer).bCasing contents start at 3 ft bgs (i.e., sample was taken from 5 to 6 ft below top of sand/sediment layer).cCasing contents start at 3 ft bgs (i.e., sample was taken from 6 to 6.5 ft below top of sand/sediment layer).
Sr = Strontium-- = Not required
UNCONTROLLED when Printed

CAU 557 CADD/CRAppendix ARevision: 0Date: May 2009Page A-21 of A-61
inspection identified an 8-in. diameter access portal as part of the steel casing lid; however, no pipe
tie-ins to the casing were observed. Further excavation identified abundant 2- to 4-in. diameter
perforations throughout the length of the 13-ft steel casing. The perforations allowed the liquid to
directly discharge to the surrounding soils. To uncover the possible origins of the geophysical
anomalies, a series of three parallel trenches were excavated (within the limits of two nearby
underground utility lines) to a total depth of 6 ft bgs in the area northeast of the steel casing. No
subsurface features, debris, or other biasing factors were identified in the area of the anomaly that
would warrant the collection of environmental samples. Also, soil was excavated along the
east-northeast side of the steel casing and confirmed that there are no subsurface connections to other
features. Two additional trenches were excavated on the south side of the steel casing to investigate
the smaller linear anomalies. It was determined that the anomalies south of the steel casing
corresponded to inactive telecommunication lines (typical of the NTS) that were uncovered at a depth
of 1.0 to 1.5 ft bgs.
Soil intervals were continuously monitored during hand augering and excavation activities to identify
biasing factors. Biased samples were collected from dark-stained, rust-stained, and debris-containing
soils that were identified in soil sample intervals during hand augering within the steel casing.
Trenches that were excavated to uncover geophysical anomalies were also inspected during
excavation activities (see Section 2.1.2.1).
A.4.1.3 Video Surveys
The interior of the vertical casing was inspected with a video-mole camera by accessing an 8-in.
diameter portal present on the welded steel lid. A video survey was performed to determine the
design configuration of the system, evaluate the integrity of the CAS components, identify possible
component pipe tie-ins, and identify whether contents were present. No additional feature
components were identified, and no pipe tie-ins to the casing were observed. The casing contained
approximately 3 ft of void space above a mixture of sandy sediment; however, no liquid influent was
present in the casing.
UNCONTROLLED when Printed

CAU 557 CADD/CRAppendix ARevision: 0Date: May 2009Page A-22 of A-61
A.4.1.4 Field Screening
Investigation samples were field screened for VOCs, and alpha and beta/gamma radiation. The FSRs
were compared to respective FSLs to guide subsequent sampling decisions where appropriate. The
VOC headspace FSRs were not exceeded in samples collected at this CAS. Gross alpha or
beta/gamma radiation FSLs were not exceeded in any samples.
A.4.1.5 Sample Collection
Intrusive investigation activities were conducted to support Decision I environmental sampling and
included the collection of six subsurface soil samples. Because the perforated vertical casing was
designed to release effluent directly into the surrounding soils, three samples were collected adjacent
to, at the base of, and below the casing to determine whether contamination had been released from
the system. Three samples (557B001, 557B002, and 557B003) were collected via hand auger from
the sand/sediment that had accumulated inside the casing as a result of the surface runoff to determine
whether contamination had adhered or adsorbed to the soil particles and remained inside the casing.
All three intervals sampled had biasing factors present, including slightly moist and discolored soil
that contained bits of paper debris and scraps of rusted metal. Auger refusal was at 9.5 ft bgs when a
soil and gravel mixture was encountered. Sampling (557B004) continued via backhoe at 9.5 ft bgs
from the native soil outside the casing adjacent to a perforation in the steel at the same depth as the
auger refusal. A deeper sample (557B005) was collected in the native soil adjacent to a perforation
from the casing bottom depth at 13 to 13.5 ft bgs due to maximum reach of the backhoe. An
additional soil sample (557B006) was collected beneath the bottom of the casing, in native soil, at a
depth from 17.5 to 18 ft bgs using sloping excavation methods. No additional biased sample
locations were identified at this CAS.
A.4.1.6 Deviations
There were no deviations to the CAIP requirements at this CAS. Investigation samples were
collected as outlined in the CAU 557 CAIP (NNSA/NSO, 2008). Samples were submitted for
laboratory analysis, as indicated in the CAIP.
UNCONTROLLED when Printed

CAU 557 CADD/CRAppendix ARevision: 0Date: May 2009Page A-23 of A-61
A.4.2 Investigation Results
The following sections provide analytical results from the environmental soil samples collected to
complete investigation activities as outlined in the CAIP (NNSA/NSO, 2008). Investigation samples
were analyzed for the CAIP-specified COPCs. The parameters and laboratory methods used to
analyze the investigation samples are listed in Table A.2-2. The sample-specific analytical suite for
CAS 03-02-02 is listed on Table A.4-1. An assessment of the analytical results is provided
in Appendix B.
Analytical results from the soil samples with concentrations exceeding MDCs are summarized in the
following sections. An evaluation was conducted on all contaminants detected above MDCs by
comparing individual concentration or activity results against their respective FALs. Establishment
of the FALs is presented in Appendix C.
Additional results (i.e., TCLP results) to support potential waste disposal of the soil within the casing
are presented in Section A.7.3.
A.4.2.1 Volatile Organic Compounds
No analytical results for VOCs in soil samples collected at this CAS exceeded MDCs. Therefore, the
FALs were established at the corresponding PAL concentrations
A.4.2.2 Semivolatile Organic Compounds
No analytical results for SVOCs in soil samples collected at this CAS exceeded MDCs. Therefore,
the FALs were established at the corresponding PAL concentrations.
A.4.2.3 Total Petroleum Hydrocarbons
Analytical results for TPH-DRO concentrations in soil samples collected at this CAS that were
detected above MDCs are presented in Table A.4-2. One sand/sediment sample collected from within
the casing exceeded the PAL of 100 mg/kg for TPH-DRO. The TPH-DRO was moved on to a Tier 2
evaluation, and FALs were established for the hazardous constituents of diesel. Concentrations of the
hazardous constituents of diesel did not exceed FALs. Therefore, TPH-DRO is not considered a
UNCONTROLLED when Printed
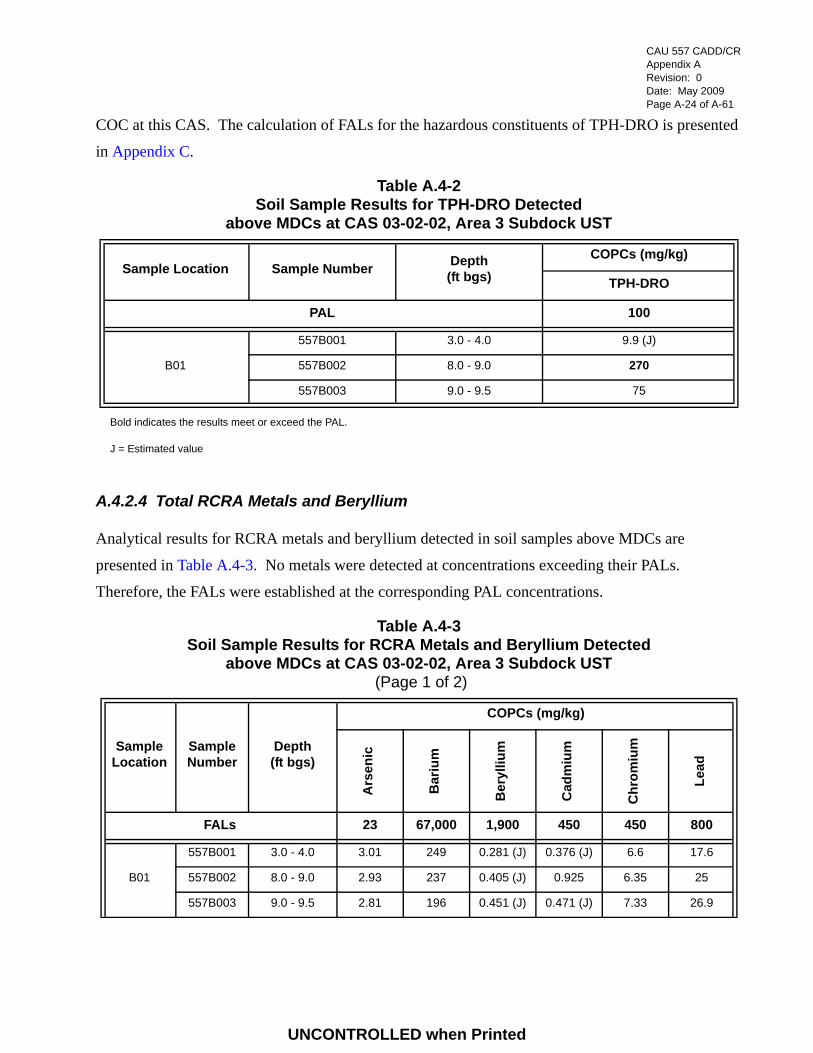
CAU 557 CADD/CRAppendix ARevision: 0Date: May 2009Page A-24 of A-61
COC at this CAS. The calculation of FALs for the hazardous constituents of TPH-DRO is presented
in Appendix C.
A.4.2.4 Total RCRA Metals and Beryllium
Analytical results for RCRA metals and beryllium detected in soil samples above MDCs are
presented in Table A.4-3. No metals were detected at concentrations exceeding their PALs.
Therefore, the FALs were established at the corresponding PAL concentrations.
Table A.4-2Soil Sample Results for TPH-DRO Detected
above MDCs at CAS 03-02-02, Area 3 Subdock UST
Sample Location Sample Number Depth(ft bgs)
COPCs (mg/kg)
TPH-DRO
PAL 100
B01
557B001 3.0 - 4.0 9.9 (J)
557B002 8.0 - 9.0 270
557B003 9.0 - 9.5 75
Bold indicates the results meet or exceed the PAL.
J = Estimated value
Table A.4-3Soil Sample Results for RCRA Metals and Beryllium Detected
above MDCs at CAS 03-02-02, Area 3 Subdock UST (Page 1 of 2)
Sample Location
Sample Number
Depth(ft bgs)
COPCs (mg/kg)
Ars
enic
Bar
ium
Ber
ylliu
m
Cad
miu
m
Chr
omiu
m
Lead
FALs 23 67,000 1,900 450 450 800
B01
557B001 3.0 - 4.0 3.01 249 0.281 (J) 0.376 (J) 6.6 17.6
557B002 8.0 - 9.0 2.93 237 0.405 (J) 0.925 6.35 25
557B003 9.0 - 9.5 2.81 196 0.451 (J) 0.471 (J) 7.33 26.9
UNCONTROLLED when Printed

CAU 557 CADD/CRAppendix ARevision: 0Date: May 2009Page A-25 of A-61
A.4.2.5 Polychlorinated Biphenyls
No analytical results for PCBs in soil samples collected at this CAS exceeded MDCs. Therefore, the
FALs were established at the corresponding PAL concentrations.
A.4.2.6 Pesticides
No analytical results for pesticides in soil samples collected at this CAS exceeded MDCs. Therefore,
the FALs were established at the corresponding PAL concentrations.
A.4.2.7 Gamma-Emitting Radionuclides
Analytical results for gamma-emitting radionuclides detected in soil samples above MDCs are
presented in Table A.4-4. No gamma-emitting radionuclides were detected at concentrations
exceeding their PALs. Therefore, the FALs were established at the corresponding PAL
concentrations.
Sample Location
Sample Number
Depth(ft bgs)
COPCs (mg/kg)
Ars
enic
Bar
ium
Ber
ylliu
m
Cad
miu
m
Chr
omiu
m
Lead
FALs 23 67,000 1,900 450 450 800
B02557B004 9.0 - 9.5 2.54 232 0.253 (J) 0.121 (J) 4.04 11.1
557B005 13.0 - 13.5 3.81 219 0.948 0.208 (J) 7.71 21.5
B03 557B006 17.5 - 18.0 3.1 165 0.658 0.198 (J) 5.08 13
J = Estimated value
Table A.4-3Soil Sample Results for RCRA Metals and Beryllium Detected
above MDCs at CAS 03-02-02, Area 3 Subdock UST (Page 2 of 2)
UNCONTROLLED when Printed

CAU 557 CADD/CRAppendix ARevision: 0Date: May 2009Page A-26 of A-61
A.4.2.8 Uranium, Plutonium, and Strontium-90 Isotopes
Analytical results for uranium, plutonium, or Sr-90 isotopes detected in soil samples above MDCs are
presented in Table A.4-5. No isotopes were detected at concentrations exceeding their PALs.
Therefore, the FALs were established at the corresponding PAL concentrations.
A.4.3 Nature and Extent of Contamination
Based on the analytical results, no COCs were identified in the environmental soil samples collected
within CAS 03-02-02.
A.4.4 Conceptual Site Model
The CAIP requirements were met at this CAS, and no revisions were necessary to the CSM.
Table A.4-4Soil Sample Results for Gamma-Emitting Radionuclides Detected
above MDCs at CAS 03-02-02, Area 3 Subdock UST
Sample Location
Sample Number
Depth(ft bgs)
COPCs (pCi/g)
Ac-
228
Am
-241
Cs-
137
Eu-1
55
Pb-2
12
Pb-2
14
Tl-2
08
FALs 5 12.7 12.2 135 5 5 5
B01
557B001 3.0 - 4.0 1.768 -- -- -- 1.622 (J) 1.363 (J) 0.49
557B002 8.0 - 9.0 2.109 0.894 (J) 0.688 0.484 (J) 2.298 (J) 1.461 (J) 0.699
557B003 9.0 - 9.5 -- -- 0.433 -- 2.13 (J) 1.318 (J) 0.638
B02557B004 9.0 - 9.5 1.302 -- -- 0.291 (J) 1.491 (J) 1.104 (J) 0.456
557B005 13.0 - 13.5 2.1 -- -- -- 2.616 (J) 1.657 (J) 0.69
B03 557B006 17.5 - 18.0 2.164 -- -- 1.3 (J) 1.992 (J) 1.314 (J) 0.592
J = Estimated value-- = Not detected above MDCs.
UNCONTROLLED when Printed

CAU 557 CADD/CRAppendix ARevision: 0Date: May 2009Page A-27 of A-61
Table A.4-5Soil Sample Results for Isotopes Detected
above MDCs at CAS 03-02-02, Area 3 Subdock UST
Sample Location
Sample Number
Depth(ft bgs)
COPCs (pCi/g)
Pu-2
39/2
40
U-2
34
U-2
38
FALs 12.7 143 105
B01
557B001 3.0 - 4.0 -- 0.95 0.96
557B002 8.0 - 9.0 0.474 1.316 1.121
557B003 9.0 - 9.5 -- 0.942 (J) 0.828 (J)
B02557B004 9.0 - 9.5 -- 0.898 (J) 0.931 (J)
557B005 13.0 - 13.5 -- 1.161 1.135
B03 557B006 17.5 - 18.0 -- 0.95 1.022
-- = Not detected above MDCs.J = Estimated value
UNCONTROLLED when Printed

CAU 557 CADD/CRAppendix ARevision: 0Date: May 2009Page A-28 of A-61
A.5.0 CAS 06-99-10, Tar Spills, Investigation Results
Corrective Action Site 06-99-10 is located in Area 6 approximately 500 ft south of Building CP-72
off a utility access road running parallel to Mercury Highway and consists of potential soil
contamination resulting from historical tar material spills. The larger of the two main spills measures
approximately 20 by 15 ft while the smaller spill measures 5 by 2 ft. The hardened tar material varies
between less than 1 in. in thickness to several inches thick. Additional detail is provided in the CAIP.
The CAS location and site layout is shown on Figure A.5-1.
A.5.1 Corrective Action Investigation
A total of three environmental soil samples (including one FD) and one PSM tar sample were
collected during CAI activities at CAS 06-99-10. The sample IDs, locations, matrix types, and
analyses are listed in Table A.5-1 while the sample locations are shown on Figure A.5-1. The specific
CAI activities conducted to satisfy the CAIP requirements at this CAS (NNSA/NSO, 2008) are
described in the following sections.
A.5.1.1 Visual Inspections
The area of the spill was visually inspected during sampling activities at CAS 06-99-10 and no other
features were identified to be associated with this CAS. The two tar material spills were observed to
be of the same material. The asphalt and gravel composition within the tar appeared to be of the same
amount and degree.
A.5.1.2 Field Screening
Investigation samples were field screened for VOCs, and alpha and beta/gamma radiation. The FSRs
were compared to respective FSLs to select samples to be submitted to the laboratory for analyses.
The VOC headspace FSRs were not exceeded in any sample collected at this CAS. Gross alpha and
beta/gamma radiation FSLs were not exceeded in any samples. Therefore, samples were not
collected at additional locations or depths.
UNCONTROLLED when Printed

CAU 557 CADD/CRAppendix ARevision: 0Date: May 2009Page A-29 of A-61
Figure A.5-1Corrective Action Investigation Site Map for CAS 06-99-10, Tar Spills
UNCONTROLLED when Printed
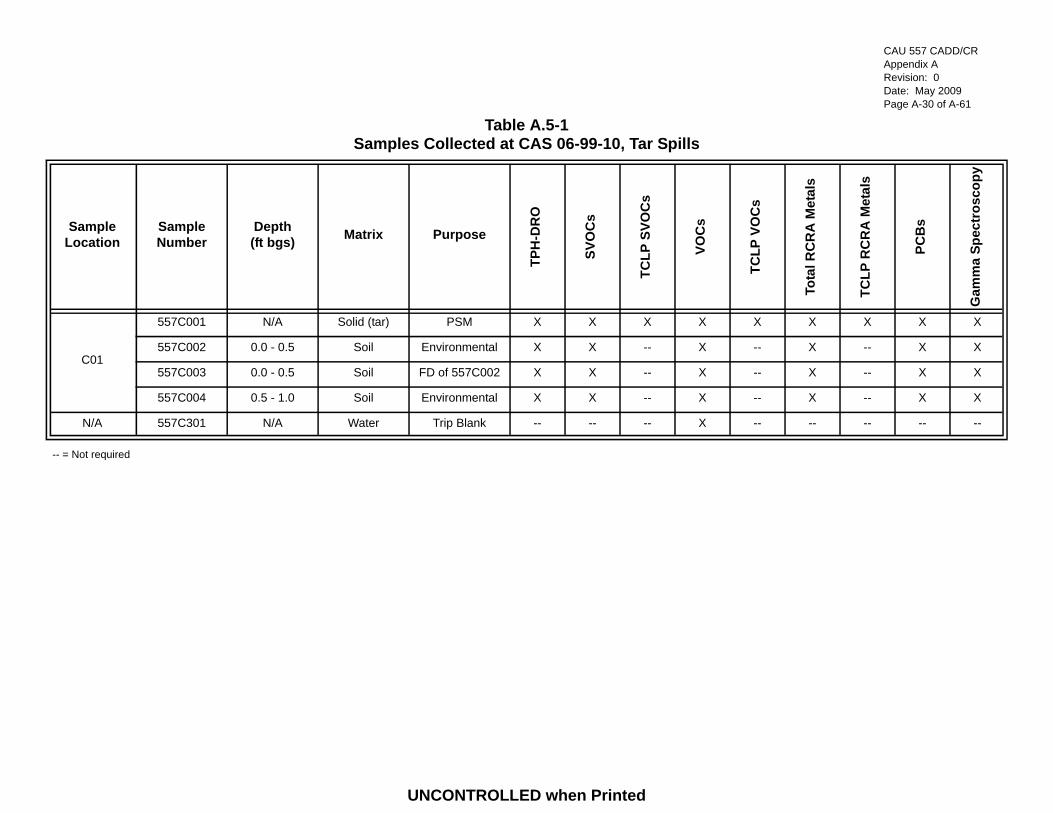
CAU 557 CADD/CRAppendix ARevision: 0Date: May 2009Page A-30 of A-61
Table A.5-1Samples Collected at CAS 06-99-10, Tar Spills
Sample Location
Sample Number
Depth(ft bgs) Matrix Purpose
TPH
-DR
O
SVO
Cs
TCLP
SVO
Cs
VOC
s
TCLP
VO
Cs
Tota
l RC
RA
Met
als
TCLP
RC
RA
Met
als
PCB
s
Gam
ma
Spec
tros
copy
C01
557C001 N/A Solid (tar) PSM X X X X X X X X X
557C002 0.0 - 0.5 Soil Environmental X X -- X -- X -- X X
557C003 0.0 - 0.5 Soil FD of 557C002 X X -- X -- X -- X X
557C004 0.5 - 1.0 Soil Environmental X X -- X -- X -- X X
N/A 557C301 N/A Water Trip Blank -- -- -- X -- -- -- -- --
-- = Not required
UNCONTROLLED when Printed

CAU 557 CADD/CRAppendix ARevision: 0Date: May 2009Page A-31 of A-61
A.5.1.3 Sample Collection
Environmental soil sampling activities included the collection of two surface soil samples
(0 to 0.5 ft bgs) from directly beneath one of the hardened tar spills (samples 557C002 and FD
557C003) and one additional deeper subsurface soil sample (557C004) at a depth from 0.5 to 1.0 ft
bgs to determine whether the tar had leached into the underlying soils.
Waste characterization sampling activities included the collection of a tar material sample (557C001)
to determine the appropriate waste management and potential future disposal actions of the tar. The
TCLP results are discussed in Section A.7.3 and presented on Table A.7-2.
A.5.1.4 Deviations
One minor sampling modification was made in the field during the CAI. It was determined (after a
visual survey of the tar material) that the two spills were of the same material. Therefore, one
representative tar sample was collected and analyzed from the largest spill, instead of one sample
from each of the two spills. In addition, underlying soil was collected under the same single tar spill.
The samples were submitted for laboratory analysis, as indicated in the CAU 557 CAIP
(NNSA/NSO, 2008). Because the tar material did not meet the criteria for being a PSM, and no
COCs were identified in the soil, this deviation is considered minor and did not affect the
investigation outcome.
A.5.2 Investigation Results
The following sections provide analytical results from the samples collected to complete
investigation activities as outlined in the CAIP (NNSA/NSO, 2008). Investigation samples were
analyzed for the CAIP-specified COPCs. The parameters and laboratory methods used to analyze the
investigation samples are listed in Table A.2-2. Table A.5-1 lists the sample-specific analytical suite
for CAS 06-99-10.
Analytical results from the soil and tar samples with concentrations exceeding MDCs are summarized
in the following sections. An evaluation was conducted on all contaminants detected above MDCs by
comparing the individual concentration or activity results against the corresponding FALs.
Establishment of the FALs is presented in Appendix C.
UNCONTROLLED when Printed

CAU 557 CADD/CRAppendix ARevision: 0Date: May 2009Page A-32 of A-61
Analytical results to determine whether the tar is a PSM are discussed in Section A.5.2.9. Waste
characterization (TCLP) results to support the recommended BMP for tar removal are discussed in
Section A.7.3.
A.5.2.1 Volatile Organic Compounds
No analytical results for VOCs in environmental samples collected at this CAS exceeded the MDCs.
Therefore, the FALs were established at the corresponding PAL concentrations.
A.5.2.2 Semivolatile Organic Compounds
No analytical results for SVOCs in environmental samples collected at this CAS exceeded the MDCs.
Therefore, the FALs were established at the corresponding PAL concentrations.
A.5.2.3 Total Petroleum Hydrocarbons
Analytical results for TPH-DRO in environmental soil samples collected at this CAS that were
detected above MDCs are presented in Table A.5-2. One FD surface soil sample had a concentration
at the PAL of 100 mg/kg for TPH-DRO. The parent soil sample only had a concentration of
62 mg/kg. The TPH-DRO results were moved on to a Tier 2 evaluation, and FALs were established
for the hazardous constituents of diesel. Because concentrations of the hazardous constituents of
diesel did not exceed FALs, TPH-DRO is not considered a COC at this CAS. The calculation of
FALs for the hazardous constituents of diesel is presented in Appendix C.
Table A.5-2Soil Sample Results for TPH-DRO Detected above MDCs
at CAS 06-99-10, Tar Spills
Sample Location Sample Number Depth(ft bgs)
COPCs (mg/kg)
TPH-DRO
PAL 100
C01
557C002 0.0 - 0.5 62
557C003 0.0 - 0.5 100
557C004 0.5 - 1.0 32
Bold indicates the results meet or exceed the PAL.
UNCONTROLLED when Printed

CAU 557 CADD/CRAppendix ARevision: 0Date: May 2009Page A-33 of A-61
A.5.2.4 Total RCRA Metals
Analytical results for total RCRA metals detected in soil samples above MDCs are presented in
Table A.5-3. No metals were detected at concentrations exceeding their PALs. Therefore, the FALs
were established at the corresponding PAL concentrations.
A.5.2.5 Polychlorinated Biphenyls
No analytical results for PCBs in environmental samples collected at this CAS exceeded the MDCs.
Therefore, the FALs were established at the corresponding PAL concentrations.
A.5.2.6 Total Pesticides
No analytical results for pesticides in environmental samples collected at this CAS exceeded the
MDCs. Therefore, the FALs were established at the corresponding PAL concentrations.
A.5.2.7 Gamma-Emitting Radionuclides
Analytical results for gamma-emitting radionuclides detected in soil samples above MDCs are
presented in Table A.5-4. No results exceeded their respective PALs. The FALs were established at
the corresponding PAL concentrations.
Table A.5-3Soil Sample Results for Total RCRA Metals Detected
above MDCs at CAS 06-99-10, Tar Spills
Sample Location
Sample Number
Depth(ft bgs)
COPCs (mg/kg)
Ars
enic
Bar
ium
Cad
miu
m
Chr
omiu
m
Lead
Mer
cury
FALs 23 67,000 450 450 800 310
C01
557C002 0.0 - 0.5 3.58 131 0.469 (J) 7.93 13.7 --
557C003 0.0 - 0.5 4.02 125 0.483 (J) 7.97 13.6 0.041 (J)
557C004 0.5 - 1.0 3.91 117 0.464 (J) 6.42 11.9 0.0522 (J)
-- = Not detected above MDCs.J = Estimated value
UNCONTROLLED when Printed

CAU 557 CADD/CRAppendix ARevision: 0Date: May 2009Page A-34 of A-61
A.5.2.8 Uranium, Plutonium, and Strontium-90 Isotopes
No analytical results for uranium, plutonium, and Sr-90 isotopes in environmental samples collected
at this CAS exceeded the MDCs. Therefore, the FALs were established at the corresponding
PAL concentrations.
A.5.2.9 Potential Source Material
Analytical results from the analyses listed in Table A.5-1 for the tar material that were detected above
MDCs are presented in Table A.5-5. The sample of the tar material has a concentration of
100,000 mg/kg TPH-DRO. These results were moved on to a Tier 2 evaluation, and the FALs were
established for the hazardous constituents of TPH-DRO. Because concentrations of these hazardous
constituents did not exceed FALs, TPH-DRO is not considered a COC, and the tar material is not
considered to be a PSM. The calculation of FALs for the hazardous constituents of TPH-DRO is
presented in Appendix C.
A.5.3 Nature and Extent of Contamination
Based on the analytical results for soil samples collected within CAS 06-99-10, no COCs were
identified in the soil.
Table A.5-4Soil Sample Results for Gamma-Emitting Radionuclides Detected
above MDCs at CAS 06-99-10, Tar Spills
Sample Location
Sample Number
Depth(ft bgs)
COPCs (pCi/g)
Ac-
228
Eu-1
55
Pb-2
12
Pb-2
14
Tl-2
08
PALs 5 135 5 5 5
C01
557C002 0.0 - 0.5 0.914 0.271 (J) 1.173 (J) 0.892 (J) 0.363
557C003 0.0 - 0.5 1.252 -- 1.431 (J) 0.993 (J) 0.302
557C004 0.5 - 1.0 0.899 -- 0.702 0.49 0.765
-- = Not detected above MDCs.J = Estimated value
UNCONTROLLED when Printed

CAU 557 CADD/CRAppendix ARevision: 0Date: May 2009Page A-35 of A-61
A.5.4 Conceptual Site Model
The CAIP requirements were met at this CAS, and no revisions were necessary to the CSM.
Table A.5-5Tar Sample Results Detected
above MDCs at CAS 06-99-10, Tar Spills
SampleLocation
SampleNumber
SampleMatrix Parameter Results Units FAL
Exceededa
C01 557C001 Solid
Lead 0.438 mg/kg No
Barium 2.1 (J) mg/kg No
TPH-DRO 100,000 (J) mg/kg Noa
1,2,4-Trimethylbenzene 0.44 mg/kg No
1,3,5-Trimethylbenzene 0.16 (J) mg/kg No
2-Butanone 0.43 (J) mg/kg No
4-Isopropyltoluene 0.12 (J) mg/kg No
Acetone 0.84 (J) mg/kg No
N-Butylbenzene 0.11 (J) mg/kg No
Sec-Butylbenzene 0.23 (J) mg/kg No
Total Xylenes 0.23 (J) mg/kg No
Benzoic Acid 98 (J) mg/kg No
aFAL is not exceeded for individual hazardous constituents of diesel in tar; therefore, TPH-DRO is not considered a COC (i.e., PSM) in tar at this location. Refer to Section 2.2.1.3.
J = Estimated value
UNCONTROLLED when Printed

CAU 557 CADD/CRAppendix ARevision: 0Date: May 2009Page A-36 of A-61
A.6.0 CAS 25-25-18, Train Maintenance Bldg 3901 Spill Site, Investigation Results
Corrective Action Site 25-25-18 is located just north of the ETSM Building (i.e., Bldg 3901), which
is within the EMAD Complex. The CAS consists of two areas of hydrocarbon-impacted soil situated
on both sides of the railroad tracks that lead into Bldg 3901 and were reported to be from the
discharge of used engine oil from the north end of Bldg 3901. The ETSM Building was used to
perform maintenance of trains and equipment and was operational from 1965 to 1985. Additional
detail is provided in the CAIP. The CAS location and site layout is shown on Figure A.6-1.
A.6.1 Corrective Action Investigation
A total of 21 environmental soil samples (including one FD) and one QC water sample were collected
during CAI activities at CAS 25-25-18. The sample IDs, locations, matrix types, and analyses are
listed in Table A.6-1, while the sample locations are shown on Figure A.6-1. The specific CAI
activities conducted to satisfy the DQO requirements outlined in the CAIP (NNSA/NSO, 2008) for
this CAS are described in the following sections.
A.6.1.1 Field Screening
Investigation samples were field screened for VOCs, and alpha and beta/gamma radiation. The FSRs
were compared to the respective FSLs to guide selections of samples to be submitted for analyses.
The VOC headspace FSRs were not exceeded in any samples collected at this CAS. Gross alpha and
beta/gamma radiation FSLs were slightly exceeded in two shallow subsurface (1 to 1.5 ft bgs) soil
samples collected from areas of heavy staining located on each side of the railroad tracks (D07 from
the east stain and D09 from the west stain). The FSLs were below the FSRs in the deeper subsurface
soil collected in these locations.
A.6.1.2 Radiological Surveys
A radiological walkover survey was performed at this CAS. Survey results were not distinguishable
from background activities and no additional samples were collected based on this survey.
UNCONTROLLED when Printed

CAU 557 CADD/CRAppendix ARevision: 0Date: May 2009Page A-37 of A-61
Figure A.6-1Corrective Action Investigation Site Map for CAS 25-25-18,
Train Maintenance Bldg 3901 Spill Site
UNCONTROLLED when Printed

CAU 557 CADD/CRAppendix ARevision: 0Date: May 2009Page A-38 of A-61
Table A.6-1Samples Collected at CAS 25-25-18, Train Maintenance Bldg 3901 Spill Site
(Page 1 of 2)
Sample Location
Sample Number
Depth(ft bgs) Matrix Purpose
TPH
-DR
O
Ber
ylliu
m
Gam
ma
Spec
tros
copy
Tota
l RC
RA
Met
als
PCB
s
Pest
icid
es
Plut
oniu
m
Sr-9
0
SVO
Cs
TCLP
RC
RA
Met
als
TCLP
SVO
Cs
TCLP
VO
Cs
Ura
nium
VOC
s
D01 557D001 0.0 - 0.25 Soil Environmental -- X -- X -- -- -- -- -- -- -- -- -- --
D02 557D002 0.0 - 0.25 Soil Environmental -- X -- X -- -- -- -- -- -- -- -- -- --
D03 557D003 0.0 - 0.25 Soil Environmental -- X -- X -- -- -- -- -- -- -- -- -- --
D04 557D004 0.0 - 0.25 Soil Environmental -- X -- X -- -- -- -- -- -- -- -- -- --
D05 557D005 0.0 - 0.25 Soil Environmental -- X -- X -- -- -- -- -- -- -- -- -- --
D06557D006 0.0 - 0.5 Soil Environmental X -- X X X X X X X -- -- -- X X
557D007 1.0 - 2.0 Soil Environmental X -- X X -- -- X X X -- -- -- X X
D07557D008 0.0 - 0.5 Soil Environmental X -- X X -- -- X X X X X X X X
557D014 2.0 - 2.5 Soil Environmental X -- X X -- -- X X X -- -- -- X X
D08557D009 0.0 - 0.5 Soil Environmental X -- X X -- -- X X X -- -- -- X X
557D010 1.0 - 1.5 Soil Environmental X -- X X -- -- X X X -- -- -- X X
D09
557D011 0.0 - 1.0 Soil Environmental X -- X X -- -- X X X X X X X X
557D012 1.0 - 1.5 Soil Environmental X -- X X -- -- X X X -- -- -- X X
557D015 5.5 - 6.0 Soil Environmental X -- X X -- -- X X X -- -- -- X X
D10 557D013 0.0 - 0.5 Soil Environmental X -- X X -- -- X X X -- -- -- X X
UNCONTROLLED when Printed

CAU 557 CADD/CRAppendix ARevision: 0Date: May 2009Page A-39 of A-61
D11557D016 0.0 - 0.5 Soil Environmental X -- X X -- -- X X X -- -- -- X X
557D017 2.5 - 3.0 Soil Environmental X -- X X -- -- X X X -- -- -- X X
D12 557D018 0.0 - 0.5 Soil Environmental X -- X X -- -- X X X -- -- -- X X
D13 557D019 0.0 - 0.5 Soil Environmental X -- X X -- -- X X X -- -- -- X X
D14557D020 0.0 - 0.5 Soil Environmental X -- X X -- -- X X X -- -- -- X X
557D021 0.0 - 0.5 Soil FD of #537D020 X -- X X -- -- X X X -- -- -- X X
N/A 557D301 N/A Water Trip Blank, QC -- -- -- -- -- -- -- -- -- -- -- -- -- X
N/A 557D302 N/A Water Trip Blank, QC -- -- -- -- -- -- -- -- -- -- -- -- -- X
N/A 557D303 N/A Water Source Blank, QC X -- X X X X X X X -- -- -- X X
-- = Not required
Table A.6-1Samples Collected at CAS 25-25-18, Train Maintenance Bldg 3901 Spill Site
(Page 2 of 2)
Sample Location
Sample Number
Depth(ft bgs) Matrix Purpose
TPH
-DR
O
Ber
ylliu
m
Gam
ma
Spec
tros
copy
Tota
l RC
RA
Met
als
PCB
s
Pest
icid
es
Plut
oniu
m
Sr-9
0
SVO
Cs
TCLP
RC
RA
Met
als
TCLP
SVO
Cs
TCLP
VO
Cs
Ura
nium
VOC
s
UNCONTROLLED when Printed

CAU 557 CADD/CRAppendix ARevision: 0Date: May 2009Page A-40 of A-61
A.6.1.3 Visual Inspections
Visual inspections included monitoring vertical soil profiles to identify stained soil boundaries, and
surveying the areas on either side of the railroad tracks to identify the locations exhibiting the highest
degree of staining for biased sample locations. Additional surface sample locations were identified
for collection of beryllium, and for pesticides and PCBs based on their proximity to Bldg 3901.
Sample locations were also identified outside of the visibly stained areas to define the lateral extent of
contamination. No other features associated with the stained soil were identified within this CAS.
A.6.1.4 Sample Collection
Twenty-one surface and shallow subsurface environmental samples, including one FD, were collected
from various areas within and surrounding visibly stained soil on the east and west sides of the
railroad tracks that enter the north bay of the ETSM Bldg 3901. The CAU 557 CAIP planned for the
collection of six sample locations (one location from each of the two stained soil areas and four
locations to define the lateral extent of potential contamination). During the CAI, a total of three
sample locations were identified in stained soil areas, and a total of six sample locations were
identified for defining the lateral extents of contamination. In addition to these sample locations, five
additional surface samples (557D001 through 557D005) were collected at 0.0 to 0.25 ft bgs using
hand sampling methods from locations D01 through D05 for the purposes of total RCRA metals and
beryllium analysis.
Sample location D07 represents the area of darkest stained soil on the east side of the tracks. At D07,
sample 557D008 was collected at 0.0 to 0.5 ft bgs using hand sampling methods. A subsurface
sample (557D014) was collected at 2.0 to 2.5 ft bgs using a backhoe for the purpose of defining the
vertical extent of potential contamination at D07. Three sample locations (D06, D08, and D10) were
collected for the purpose of defining the lateral extent of potential contamination on the east side of
the tracks. Sample locations D06 and D08 were collected in close proximity to the stained soil and
location D10 represents the lowest topographical point. Pesticides and PCBs were added to the list of
analytes for one representative sample (location D06; sample 557D006) collected in close proximity
to Bldg 3901 because these contaminants are commonly identified adjacent to NTS building pads.
UNCONTROLLED when Printed
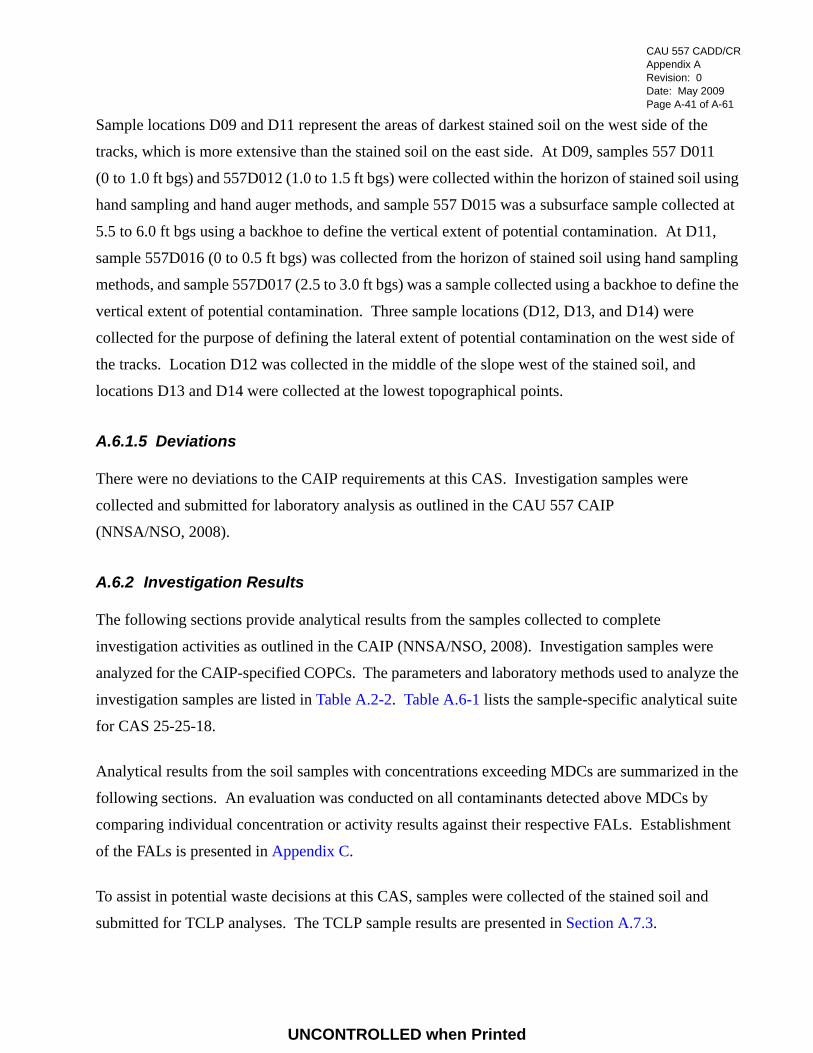
CAU 557 CADD/CRAppendix ARevision: 0Date: May 2009Page A-41 of A-61
Sample locations D09 and D11 represent the areas of darkest stained soil on the west side of the
tracks, which is more extensive than the stained soil on the east side. At D09, samples 557 D011
(0 to 1.0 ft bgs) and 557D012 (1.0 to 1.5 ft bgs) were collected within the horizon of stained soil using
hand sampling and hand auger methods, and sample 557 D015 was a subsurface sample collected at
5.5 to 6.0 ft bgs using a backhoe to define the vertical extent of potential contamination. At D11,
sample 557D016 (0 to 0.5 ft bgs) was collected from the horizon of stained soil using hand sampling
methods, and sample 557D017 (2.5 to 3.0 ft bgs) was a sample collected using a backhoe to define the
vertical extent of potential contamination. Three sample locations (D12, D13, and D14) were
collected for the purpose of defining the lateral extent of potential contamination on the west side of
the tracks. Location D12 was collected in the middle of the slope west of the stained soil, and
locations D13 and D14 were collected at the lowest topographical points.
A.6.1.5 Deviations
There were no deviations to the CAIP requirements at this CAS. Investigation samples were
collected and submitted for laboratory analysis as outlined in the CAU 557 CAIP
(NNSA/NSO, 2008).
A.6.2 Investigation Results
The following sections provide analytical results from the samples collected to complete
investigation activities as outlined in the CAIP (NNSA/NSO, 2008). Investigation samples were
analyzed for the CAIP-specified COPCs. The parameters and laboratory methods used to analyze the
investigation samples are listed in Table A.2-2. Table A.6-1 lists the sample-specific analytical suite
for CAS 25-25-18.
Analytical results from the soil samples with concentrations exceeding MDCs are summarized in the
following sections. An evaluation was conducted on all contaminants detected above MDCs by
comparing individual concentration or activity results against their respective FALs. Establishment
of the FALs is presented in Appendix C.
To assist in potential waste decisions at this CAS, samples were collected of the stained soil and
submitted for TCLP analyses. The TCLP sample results are presented in Section A.7.3.
UNCONTROLLED when Printed

CAU 557 CADD/CRAppendix ARevision: 0Date: May 2009Page A-42 of A-61
A.6.2.1 Volatile Organic Compounds
Analytical results for VOCs in soil samples collected at this CAS that were detected above MDCs are
presented in Table A.6-2. No VOCs were detected at concentrations exceeding their respective PALs.
Therefore the FALs were established at the corresponding PAL concentrations.
A.6.2.2 Semivolatile Organic Compounds
Analytical results for SVOCs in soil samples collected at this CAS that were detected above MDCs
are presented in Table A.6-3. No SVOCs were detected at concentrations exceeding the respective
PALs. Therefore, the FALs were established at the PAL concentrations.
A.6.2.3 Total Petroleum Hydrocarbons
Analytical results for TPH-DRO in soil samples collected at this CAS that were detected above
MDCs are presented in Table A.6-4. Four surface samples exceeded the PAL of 100 mg/kg for
TPH-DRO while one surface sample showed a concentration equal to the PAL. One continuation
subsurface sample had a concentration of 140 mg/kg. The TPH-DRO was moved on to a Tier 2
evaluation, and FALs were established for the hazardous constituents of TPH-DRO. Because the
concentrations of the hazardous constituents of TPH-DRO did not exceed FALs, TPH-DRO is not
considered a COC. The calculation of FALs for the hazardous constituents of TPH-DRO is presented
in Appendix C.
Table A.6-2Sample Results for Total VOCs Detected
above MDCs at CAS 25-25-18, Train Maintenance Bldg 3901 Spill Site
SampleLocation
SampleNumber
Depth(ft bgs)
COPCs (mg/kg)
Acetone
FAL 54,000
D11 557D016 0.0 - 0.5 0.017 (J)
J = Estimated value
UNCONTROLLED when Printed

CAU 557 CADD/CRAppendix ARevision: 0Date: May 2009Page A-43 of A-61
Table A.6-3Sample Results for Total SVOCs Detected
above MDCs at CAS 25-25-18, Train Maintenance Bldg 3901 Spill Site
SampleLocation
SampleNumber
Depth(ft bgs)
COPCs (mg/kg)
2-M
ethy
lphe
nol
Ben
zoic
Aci
d
Bis
(2-e
thyl
hexy
l)pht
hala
te
Phen
ol
FALs 31,000 100,000 120 100,000
D09 557D011 0.0 - 1.0 -- 0.49 (J) 0.82 --
D11 557D016 0.0 - 0.5 0.86 0.97 (J) 1.3 0.51 (J)
-- = Not detected above MDCs.J = Estimated value
Table A.6-4Soil Sample Results for TPH-DRO Detected
above MDCs at CAS 25-25-18, Train Maintenance Bldg 3901 Spill Site (Page 1 of 2)
Sample Location Sample Number Depth(ft bgs)
COPCs (mg/kg)
TPH-DRO
PAL 100
D06 557D006 0.0 - 0.5 9 (J)
D07557D008 0.0 - 0.5 3,000 (J)
557D014 2.0 - 2.5 57
D08 557D010 1.0 - 1.5 7.5 (J)
D09557D011 0.0 - 1.0 1,700
557D012 1.0 - 1.5 140
D10 557D013 0.0 - 0.5 100
D11 557D016 0.0 - 0.5 8,700 (J)
D12 557D018 0.0 - 0.5 3,000 (J)
UNCONTROLLED when Printed

CAU 557 CADD/CRAppendix ARevision: 0Date: May 2009Page A-44 of A-61
A.6.2.4 Total RCRA Metals and Beryllium
Analytical results for RCRA metals and beryllium detected in soil samples above MDCs are
presented in Table A.6-5. No metals were detected at concentrations exceeding their PALs. The
FALs were established at the corresponding PAL concentrations.
D14557D020 0.0 - 0.5 6.5 (J)
557D021 0.0 - 0.5 8.2 (J)
Bold indicates the results meet or exceed the PAL.
J = Estimated value
Table A.6-5Sample Results for Total RCRA Metals and Beryllium Detected
above MDCs at CAS 25-25-18, Train Maintenance Bldg 3901 Spill Site (Page 1 of 2)
Sample Location
Sample Number
Depth(ft bgs)
COPCs (mg/kg)
Ars
enic
Bar
ium
Ber
ylliu
m
Cad
miu
m
Chr
omiu
m
Lead
Sele
nium
Silv
er
FALs 23 67,000 1,900 450 450 800 5,100 5,100
D01 557D001 0.0 - 0.25 3.59 80.2 -- 1.86 13.6 117 -- --
D02 557D002 0.0 - 0.25 4.46 101 -- 1.74 9.21 152 -- 2.59
D03 557D003 0.0 - 0.25 4.4 130 0.204 (J) 1.7 10.5 316 -- --
D04 557D004 0.0 - 0.25 3.56 155 0.298 (J) 0.422 (J) 5.73 106 -- --
D05 557D005 0.0 - 0.25 2.63 73.2 0.213 (J) 0.217 (J) 4.93 15 -- --
D06557D006 0.0 - 0.5 3.15 104 -- 0.557 5.5 54.3 -- --
557D007 1.0 - 2.0 2.55 74.1 0.363 (J) 0.343 (J) 3.97 9.78 -- --
Table A.6-4Soil Sample Results for TPH-DRO Detected
above MDCs at CAS 25-25-18, Train Maintenance Bldg 3901 Spill Site (Page 2 of 2)
Sample Location Sample Number Depth(ft bgs)
COPCs (mg/kg)
TPH-DRO
PAL 100
UNCONTROLLED when Printed

CAU 557 CADD/CRAppendix ARevision: 0Date: May 2009Page A-45 of A-61
A.6.2.5 Polychlorinated Biphenyls
Analytical results for PCBs in soil samples detected above MDCs are shown in Table A.6-6. No
concentrations exceeded their PALs; therefore, the FALs were established at the corresponding
PAL concentrations.
D07557D008 0.0 - 0.5 2.77 147 -- 0.829 15.4 47.7 -- --
557D014 2.0 - 2.5 1.83 58.4 -- -- 2.78 6.25 -- --
D08557D009 0.0 - 0.5 6.33 101 -- 0.421 (J) 7.6 17.5 -- --
557D010 1.0 - 1.5 3.89 74.6 -- 0.51 (J) 7.19 22 -- --
D09
557D011 0.0 - 1.0 3.07 69.6 -- 0.129 (J) 2.71 12.8 -- --
557D012 1.0 - 1.5 3.78 78.2 -- -- 4.94 9.46 -- --
557D015 5.5 - 6.0 1.3 77.8 -- -- 1.33 4.39 -- --
D10 557D013 0.0 - 0.5 1.89 58.1 -- 0.324 (J) 3.6 19.9 -- --
D11557D016 0.0 - 0.5 2.77 288 -- 1.38 8.14 440 -- 0.308 (J)
557D017 2.5 - 3.0 1.95 82.7 -- -- 3.13 5.86 -- --
D12 557D018 0.0 - 0.5 1.91 68.8 -- 0.117 (J) 2.83 64.9 -- --
D13 557D019 0.0 - 0.5 7.82 65.9 -- -- 3.86 11.1 2.95 --
D14557D020 0.0 - 0.5 1.84 64.1 -- 0.13 (J) 2.57 20.8 -- --
557D021 0.0 - 0.5 1.71 66.2 -- 0.133 (J) 2.76 242 -- --
-- = Not detected above MDCs.J = Estimated value
Table A.6-5Sample Results for Total RCRA Metals and Beryllium Detected
above MDCs at CAS 25-25-18, Train Maintenance Bldg 3901 Spill Site (Page 2 of 2)
Sample Location
Sample Number
Depth(ft bgs)
COPCs (mg/kg)
Ars
enic
Bar
ium
Ber
ylliu
m
Cad
miu
m
Chr
omiu
m
Lead
Sele
nium
Silv
er
FALs 23 67,000 1,900 450 450 800 5,100 5,100
UNCONTROLLED when Printed
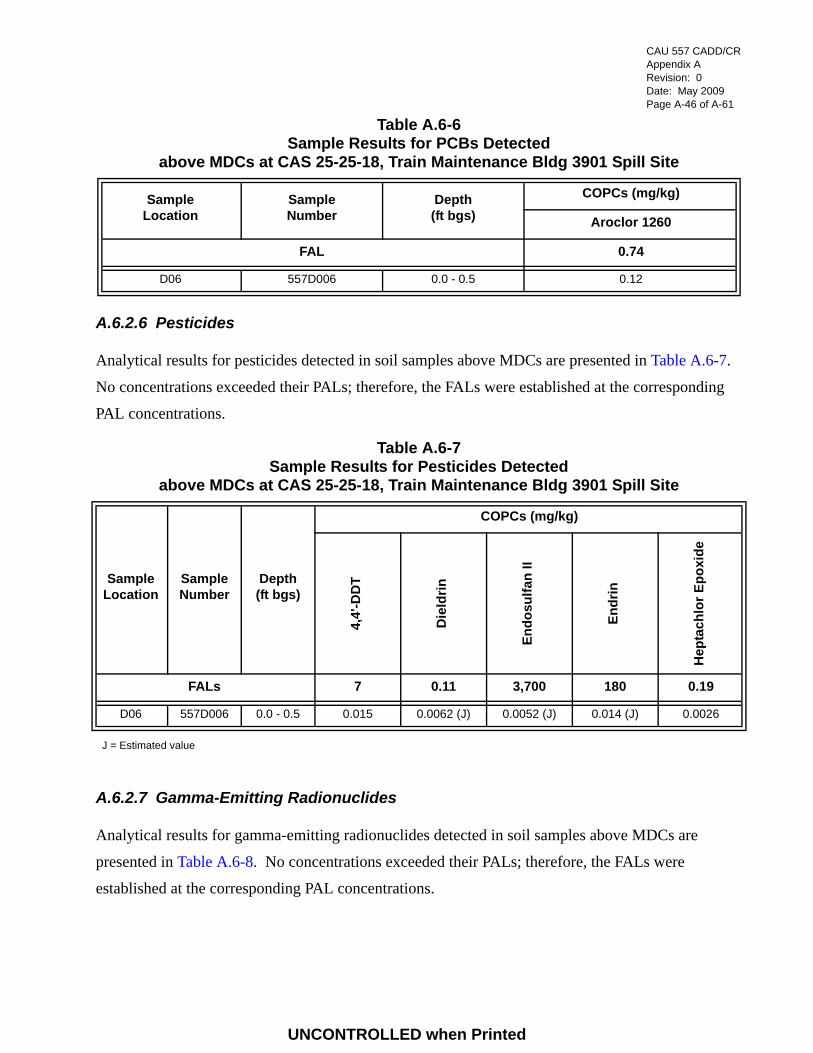
CAU 557 CADD/CRAppendix ARevision: 0Date: May 2009Page A-46 of A-61
A.6.2.6 Pesticides
Analytical results for pesticides detected in soil samples above MDCs are presented in Table A.6-7.
No concentrations exceeded their PALs; therefore, the FALs were established at the corresponding
PAL concentrations.
A.6.2.7 Gamma-Emitting Radionuclides
Analytical results for gamma-emitting radionuclides detected in soil samples above MDCs are
presented in Table A.6-8. No concentrations exceeded their PALs; therefore, the FALs were
established at the corresponding PAL concentrations.
Table A.6-6Sample Results for PCBs Detected
above MDCs at CAS 25-25-18, Train Maintenance Bldg 3901 Spill Site
SampleLocation
SampleNumber
Depth(ft bgs)
COPCs (mg/kg)
Aroclor 1260
FAL 0.74
D06 557D006 0.0 - 0.5 0.12
Table A.6-7Sample Results for Pesticides Detected
above MDCs at CAS 25-25-18, Train Maintenance Bldg 3901 Spill Site
SampleLocation
SampleNumber
Depth(ft bgs)
COPCs (mg/kg)
4,4'
-DD
T
Die
ldrin
Endo
sulfa
n II
Endr
in
Hep
tach
lor E
poxi
deFALs 7 0.11 3,700 180 0.19
D06 557D006 0.0 - 0.5 0.015 0.0062 (J) 0.0052 (J) 0.014 (J) 0.0026
J = Estimated value
UNCONTROLLED when Printed
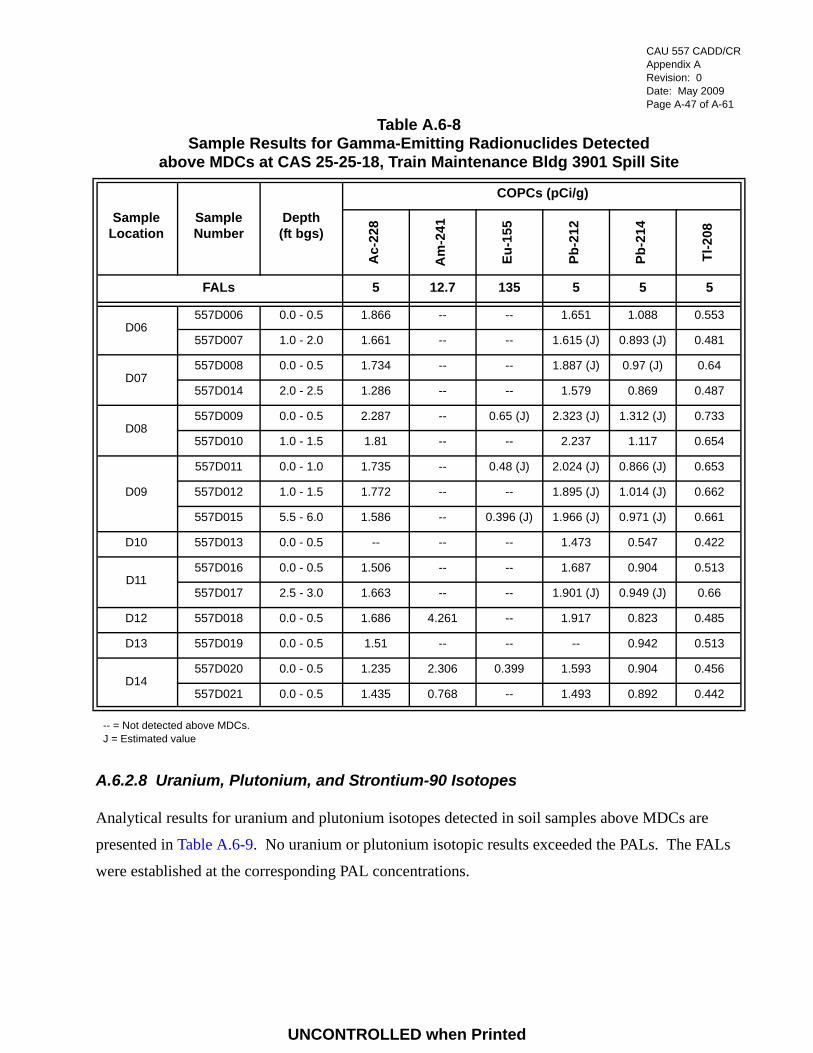
CAU 557 CADD/CRAppendix ARevision: 0Date: May 2009Page A-47 of A-61
A.6.2.8 Uranium, Plutonium, and Strontium-90 Isotopes
Analytical results for uranium and plutonium isotopes detected in soil samples above MDCs are
presented in Table A.6-9. No uranium or plutonium isotopic results exceeded the PALs. The FALs
were established at the corresponding PAL concentrations.
Table A.6-8Sample Results for Gamma-Emitting Radionuclides Detected
above MDCs at CAS 25-25-18, Train Maintenance Bldg 3901 Spill Site
SampleLocation
SampleNumber
Depth(ft bgs)
COPCs (pCi/g)
Ac-
228
Am
-241
Eu-1
55
Pb-2
12
Pb-2
14
Tl-2
08
FALs 5 12.7 135 5 5 5
D06557D006 0.0 - 0.5 1.866 -- -- 1.651 1.088 0.553
557D007 1.0 - 2.0 1.661 -- -- 1.615 (J) 0.893 (J) 0.481
D07557D008 0.0 - 0.5 1.734 -- -- 1.887 (J) 0.97 (J) 0.64
557D014 2.0 - 2.5 1.286 -- -- 1.579 0.869 0.487
D08557D009 0.0 - 0.5 2.287 -- 0.65 (J) 2.323 (J) 1.312 (J) 0.733
557D010 1.0 - 1.5 1.81 -- -- 2.237 1.117 0.654
D09
557D011 0.0 - 1.0 1.735 -- 0.48 (J) 2.024 (J) 0.866 (J) 0.653
557D012 1.0 - 1.5 1.772 -- -- 1.895 (J) 1.014 (J) 0.662
557D015 5.5 - 6.0 1.586 -- 0.396 (J) 1.966 (J) 0.971 (J) 0.661
D10 557D013 0.0 - 0.5 -- -- -- 1.473 0.547 0.422
D11557D016 0.0 - 0.5 1.506 -- -- 1.687 0.904 0.513
557D017 2.5 - 3.0 1.663 -- -- 1.901 (J) 0.949 (J) 0.66
D12 557D018 0.0 - 0.5 1.686 4.261 -- 1.917 0.823 0.485
D13 557D019 0.0 - 0.5 1.51 -- -- -- 0.942 0.513
D14557D020 0.0 - 0.5 1.235 2.306 0.399 1.593 0.904 0.456
557D021 0.0 - 0.5 1.435 0.768 -- 1.493 0.892 0.442
-- = Not detected above MDCs.J = Estimated value
UNCONTROLLED when Printed

CAU 557 CADD/CRAppendix ARevision: 0Date: May 2009Page A-48 of A-61
A.6.3 Nature and Extent of Contamination
Based on the analytical results for soil samples collected within CAS 25-25-18, no COCs were
identified in the soil.
A.6.4 Conceptual Site Model
The CAIP requirements were met at this CAS, and no revisions were necessary to the CSM.
Table A.6-9Sample Results for Isotopes Detected
above MDCs at CAS 25-25-18, Train Maintenance Bldg 3901 Spill Site
SampleLocation
SampleNumber
Depth(ft bgs)
COPCs (pCi/g)
Pu-2
39/2
40
U-2
34
U-2
35
U-2
38
FALs 12.7 143 17.6 105
D06557D006 0.0 - 0.5 -- 0.953 0.102 0.894
557D007 1.0 - 2.0 -- 0.757 -- 0.812
D07557D008 0.0 - 0.5 -- 0.722 0.153 0.846
557D014 2.0 - 2.5 -- 0.809 -- 0.826
D08557D009 0.0 - 0.5 -- 0.801 -- 0.724
557D010 1.0 - 1.5 -- 1.042 -- 0.965
D09
557D011 0.0 - 1.0 -- 0.599 (J) -- 0.681 (J)
557D012 1.0 - 1.5 -- 0.698 0.15 0.715
557D015 5.5 - 6.0 -- 0.788 -- 0.86
D10 557D013 0.0 - 0.5 -- 0.702 -- 0.649
D11557D016 0.0 - 0.5 -- 0.792 -- 0.662
557D017 2.5 - 3.0 -- 0.792 (J) -- 0.706 (J)
D12 557D018 0.0 - 0.5 -- 0.719 -- 0.698
D13 557D019 0.0 - 0.5 -- 0.794 (J) -- 0.744
D14557D020 0.0 - 0.5 0.161 0.688 -- 0.682
557D021 0.0 - 0.5 0.288 0.672 -- 0.592
-- = Not detected above MDCs.J = Estimated value
UNCONTROLLED when Printed

CAU 557 CADD/CRAppendix ARevision: 0Date: May 2009Page A-49 of A-61
A.7.0 Waste Management
Wastes generated during the CAI were characterized based on associated soil samples, direct samples
of the waste, and/or process knowledge. The characterization and disposition of the waste was based
on federal and state regulations, permit limitations, and acceptance criteria. The types, volumes, and
disposal of the wastes are addressed in the following subsections. Section A.7.1 addresses
investigation-derived waste (IDW), and Section A.7.2 addresses wastes generated as part of the best
management practices at the CAU 557 CASs. Results from TCLP analyses run on samples collected
from CASs 03-02-02, 06-99-10, and 25-25-18 for potential waste decisions are presented in
Section A.7.3.
A.7.1 Investigation-Derived Waste
Investigation-derived waste generated during the field activities for CAU 557 included disposable
personal protective equipment (PPE), disposable sampling equipment, plastic sheeting, and empty
sample jars. The IDW, which are collected daily, is field screened as generated to comply with the
radiological release limits of Table 4-2 of the NV/YMP Radiological Control Manual (NNSA/NSO,
2004). The wastes are visually inspected as generated and packaged for evidence of staining or other
evidence of hazardous/chemical contamination. The IDW streams for CAU 557 met all of the release
criteria and were characterized as industrial waste based on process knowledge, site environmental
samples, and radiological surveys of the waste. The waste was bagged, marked, and placed in a
roll-off container at Building 23-153 for disposition at the NTS Area 9 U10c Industrial Landfill.
A.7.2 Best Management Practices Waste
The following subsections describe the potential wastes that will be generated from the recommended
BMPs. Table A.7-1 presents the volumes, waste characterizations, and disposition of these waste
streams for each CAS within CAU 557.
UNCONTROLLED when Printed

CAU 557 CADD/CRAppendix ARevision: 0Date: May 2009Page A-50 of A-61
Table A.7-1Waste Summary
CAS Container Number
Waste Description
Volume Capacity
Process Knowledge
Analytical Data
Landfill Limits
NTS POC
LagoonCriteria
Disposal Pathway Volume Disposal
DateDisposal
Document
01-25-02 No waste was generated or managed at CAS 01-25-02.
03-02-02 557B01 Debris(Pipe Casing)
13 ft x 5 ft Diameter
Pipe Casing
Carbon Steel Pipe
Industrial Waste Meets N/A N/A
Area 9U10c
Industrial Landfill
5 - 6 yd3 TBD LLVF
06-99-10 557C01 Tar Material ~ 3 yd3 N/A Industrial Waste N/A N/A N/A
Area 6Hydrocarbon
Landfill~ 3 yd3 TBD LLVF
25-25-18 No waste was generated or managed at CAS 25-25-18.
LLVF = Landfill Load Verification FormTBD = To be determinedyd 3 = Cubic yard
UNCONTROLLED when Printed

CAU 557 CADD/CRAppendix ARevision: 0Date: May 2009Page A-51 of A-61
A.7.2.1 Waste Characterization and Disposition
The following waste streams were identified for CAU 557:
• Steel casing from CAS 03-02-02• Tar from CAS 06-99-10
All preliminary estimates of these waste streams are based on process knowledge, radiological
surveys, sites samples, and/or direct samples of the waste. These estimated characterizations and
disposition pathways are shown on Table A.7-1 and are based on current federal and state regulations,
permit limitations, and acceptance criteria.
A.7.2.1.1 Steel Casing
A waste stream of one empty perforated steel casing will be generated as part of the BMP
recommendation for CAS 03-02-02. The steel casing measures approximately 13 ft long and 5 ft in
diameter. A preliminary evaluation of the steel casing resulting from the BMP to be conducted at
CAS 03-02-02 determined this waste will be characterized as industrial waste and meets the waste
acceptance criteria for the NTS Area 9 U10c Industrial Landfill.
A.7.2.1.2 Tar
The BMP recommended at CAS 06-99-10 is the removal of the tar. This volume of the tar is
estimated at approximately 3.0 yd3. Analytical results for TCLP run on the tar samples are presented
in Table A.7-2. A preliminary evaluation of the tar resulting from the BMP to be conducted at
CAS 06-99-10 determined this waste will be characterized as hydrocarbon-impacted industrial waste
and meets the waste acceptance criteria for disposal at the NTS Area 6 Hydrocarbon Landfill.
A.7.3 Toxicity Characteristic Leaching Procedure Results
To assist in potential waste decisions, samples were submitted for TCLP analyses of the soil within
the steel casing at CAS 03-02-02, the tar material at CAS 06-99-10, and the worst-case stained soil at
CAS 25-25-18. Analytical results of MDCs from these samples are shown on Table A.7-2.
UNCONTROLLED when Printed

CAU 557 CADD/CRAppendix ARevision: 0Date: May 2009Page A-52 of A-61
Table A.7-2TCLP Sample Results for CAU 557
Sample Location
Sample Number
Depth(ft bgs) Matrix Parameter Result Criteriaa
(TC Levels) Units
CAS 03-02-02
B01 557B003 9.0 - 9.5 Sediment Barium 1.22 100 mg/L
CAS 06-99-10
C01 557C001 N/A Solid Barium 0.589 100 mg/L
CAS 25-25-18
D07 557D008 0.0 - 0.5 Soil
Barium 1.17 100 mg/L
Cadmium 0.016 (J) 1.0 mg/L
Lead 0.0549 5.0 mg/L
D09 557D011 0.0 - 1.0 SoilBarium 1.1 100 mg/L
Lead 0.0169 5.0 mg/L
aBased on 40 Code of Federal Regulations Part 261, “Identification and Listing of Hazardous Waste” (CFR, 2006).
mg/L = Milligrams per literTC = Toxicity characteristic
J = Estimated value
UNCONTROLLED when Printed

CAU 557 CADD/CRAppendix ARevision: 0Date: May 2009Page A-53 of A-61
A.8.0 Quality Assurance
This section contains a summary of QA/QC measures implemented during the sampling and analysis
activities conducted in support of the CAU 557 CAI. The following sections discuss the data
validation process, QC samples, and nonconformances. A detailed evaluation of the DQIs is
presented in Appendix B.
Laboratory analyses were conducted for samples used in the decision-making process to provide a
quantitative measurement of any COPCs present. Rigorous QA/QC was implemented for all
laboratory samples, including documentation, verification and validation of analytical results, and
affirmation of DQI requirements related to laboratory analysis. Detailed information regarding the
QA program is contained in the Industrial Sites QAPP (NNSA/NV, 2002).
A.8.1 Data Validation
Data validation was performed in accordance with the Industrial Sites QAPP and approved protocols
and procedures. All laboratory data from samples collected and analyzed for CAU 557 were
evaluated for data quality in a tiered process described in Sections A.8.1.1 through A.8.1.3. Data
were reviewed to ensure that samples were appropriately processed and analyzed, and the results
were evaluated using validation criteria. Documentation of the data qualifications resulting from
these reviews is retained in project files as a hard copy and electronic media.
One hundred percent of the data analyzed as part of this investigation were subjected to Tier I
and Tier II evaluations. A Tier III evaluation was performed on approximately 5 percent of the
data analyzed.
A.8.1.1 Tier I Evaluation
Tier I evaluation for chemical and radiochemical analysis examines, but is not limited to:
• Sample count/type consistent with chain of custody. • Analysis count/type consistent with chain of custody.• Correct sample matrix. • Significant problems and/or nonconformances stated in cover letter or case narrative.• Completeness of certificates of analysis.
UNCONTROLLED when Printed

CAU 557 CADD/CRAppendix ARevision: 0Date: May 2009Page A-54 of A-61
• Completeness of Contract Laboratory Program (CLP) or CLP-like packages.• Completeness of signatures, dates, and times on chain of custody.• Condition-upon-receipt variance form included.• Requested analyses performed on all samples.• Date received/analyzed given for each sample.• Correct concentration units indicated.• Electronic data transfer supplied.• Results reported for field and laboratory QC samples.• Whether or not the deliverable met the overall objectives of the project.
A.8.1.2 Tier II Evaluation
Tier II evaluation for chemical analysis examines, but is not limited to:
• Correct detection limits achieved.
• Sample date, preparation date, and analysis date for each sample.
• Holding time criteria met.
• Quality control batch association for each sample.
• Cooler temperature upon receipt.
• Sample pH for aqueous samples, as required.
• Detection limits properly adjusted for dilution, as required.
• Blank contamination evaluated and applied to sample results/qualifiers.
• Matrix spike (MS)/matrix spike duplicate (MSD) percent recoveries (%R) and relative percent differences (RPDs) evaluated and qualifiers applied to laboratory results, as necessary.
• Field duplicate RPDs evaluated using professional judgment and qualifiers applied to laboratory results, as necessary.
• Laboratory duplicate RPDs evaluated and qualifiers applied to laboratory results, as necessary.
• Surrogate %R evaluated and qualifiers applied to laboratory results, as necessary.
• Laboratory control sample %R evaluated and qualifiers applied to laboratory results, as necessary.
• Initial and continuing calibration evaluated and qualifiers applied to laboratory results, as necessary.
• Internal standard evaluation.
• Mass spectrometer tuning criteria.
• Organic compound quantitation.
UNCONTROLLED when Printed

CAU 557 CADD/CRAppendix ARevision: 0Date: May 2009Page A-55 of A-61
• Inductively coupled plasma interference check sample evaluation.
• Graphite furnace atomic absorption QC.
• Inductively coupled plasma serial dilution effects.
• Recalculation of 10 percent of laboratory results from raw data.
Tier II evaluation for radiochemical analysis examines, but is not limited to:
• Correct detection limits achieved.
• Blank contamination evaluated and, if significant, qualifiers are applied to sample results.
• Certificate of Analysis consistent with data package documentation.
• Quality control sample results (duplicates, laboratory control samples [LCSs], laboratory blanks) evaluated and used to determine laboratory result qualifiers.
• Sample results, uncertainty, and MDC evaluated.
• Detector system calibrated with National Institute of Standards and Technology (NIST)- traceable sources.
• Calibration sources preparation was documented, demonstrating proper preparation and appropriateness for sample matrix, emission energies, and concentrations.
• Detector system response to daily or weekly background and calibration checks for peak energy, peak centroid, peak full-width half-maximum, and peak efficiency, depending on the detection system.
• Tracers NIST-traceable, appropriate for the analysis performed, and recoveries that met QC requirements.
• Documentation of all QC sample preparation complete and properly performed.
• Spectra lines, photon emissions, particle energies, peak areas, and background peak areas support the identified radionuclide and its concentration.
A.8.1.3 Tier III Evaluation
The Tier III review is an independent examination of the Tier II evaluation. A Tier III review of
5 percent of the sample analytical data was performed by Analytical Quality Associates, Inc., of
Albuquerque, Arizona. Tier II and Tier III results were compared and where differences are noted,
data were reviewed and changes were made accordingly. This review included the following
additional evaluations:
UNCONTROLLED when Printed

CAU 557 CADD/CRAppendix ARevision: 0Date: May 2009Page A-56 of A-61
• Review:
- Case narrative, chain of custody, and sample receipt forms
- Lab qualifiers (applied appropriately)
- Method of analyses performed as dictated by the chain of custody
- Raw data, including chromatograms, instrument printouts, preparation logs, and analytical logs
- Manual integrations to determine whether the response is appropriate
- Data package for completeness
• Determine sample results qualifiers through the evaluation of (but not limited to):
- Tracers and QC sample results (e.g., duplicates, LCSs, blanks, MSs) evaluated and used to determine sample results qualifiers
- Sample preservation, sample preparation/extraction and run logs, sample storage, and holding time
- Instrument and detector tuning
- Initial and continuing calibrations
- Calibration verification (initial, continuing, second source)
- Retention times
- Second column and/or second detector confirmation
- Mass spectra interpretation
- Interference check samples and serial dilutions
- Post digestion spikes and method of standard additions
- Breakdown evaluations
UNCONTROLLED when Printed

CAU 557 CADD/CRAppendix ARevision: 0Date: May 2009Page A-57 of A-61
• Perform calculation checks of:
- At least one analyte per QC sample and its recovery
- At least one analyte per initial calibration curve, continuing calibration verification, and second source recovery
- At least one analyte per sample that contains positive results (hits); radiochemical results only require calculation checks on activity concentrations (not error)
• Verify that target compound detects identified in the raw data are reported on the results form.
• Document any anomalies for the laboratory to clarify or rectify. The contractor should be notified of any anomalies.
A.8.1.4 Field QC Samples
Field QC samples consisted of trip blanks, equipment rinsate blanks, field blanks, source blanks,
laboratory QC samples, and FD samples that were collected and submitted for analysis by the
laboratory using the analytical methods shown in Table A.2-2. The QC samples were assigned
individual sample numbers and sent to the laboratory “blind.”
The FD samples were also sent as blind samples to the laboratory and were analyzed for the
investigation parameters listed in Table A.2-2. For these samples, the precision results were
evaluated between the duplicate and the parent sample (i.e., RPDs between the environmental sample
results and their corresponding FD sample results). Additional samples were selected by the
laboratory to be analyzed as laboratory duplicates.
A.8.1.5 Laboratory QC Samples
Analysis of QC preparation blanks (PBs) was performed on each sample delivery group (SDG) for
inorganics. Analysis for surrogate spikes and method blanks was performed on each SDG for
organics only. Initial and continuing calibration and LCSs were performed for each SDG. The results
of these analyses were used to qualify associated environmental sample results when appropriate.
Documentation of data qualifications resulting from the application of these guidelines is retained in
project files as both hard copy and electronic media.
UNCONTROLLED when Printed
CAU 557 CADD/CRAppendix ARevision: 0Date: May 2009Page A-58 of A-61
The laboratory included a PB, LCS, and a laboratory duplicate sample with each batch of field
samples analyzed for radionuclides.
A.8.2 Field Nonconformances
There were no field nonconformances identified for the CAI.
A.8.3 Laboratory Nonconformances
Laboratory nonconformances are generally due to inconsistencies in the analytical instrumentation
operation, sample preparations, extractions, missed holding times, and fluctuations in internal
standard and calibration results.
UNCONTROLLED when Printed

CAU 557 CADD/CRAppendix ARevision: 0Date: May 2009Page A-59 of A-61
A.9.0 Summary
Organic, inorganics, and radionuclide contaminants detected in environmental samples during the
CAI were evaluated against FALs to determine the nature and extent of COCs for CAU 557.
Assessment of the data generated from investigation activities indicates that FALs were not exceeded
for any parameters at any of the CAU 557 CASs. The following summarizes the investigation results
for each CAS.
CAS 01-25-02, Fuel Spill
Based on field observations and analytical results for soil samples collected at this CAS, no COCs
are present, and the initial 1993-1994 cleanup was confirmed. Therefore, no further action is required
at this CAS.
CAS 03-02-02, Area 3 Subdock UST
Based on the analytical results of the environmental samples collected at this CAS, no COC
contamination has been released to the soil at this CAS. Therefore, no further action is required at
this CAS. However, as a BMP at this CAS, removal and disposal of the vertical steel casing will
be performed.
CAS 06-99-10, Tar Spills
Based on analytical results of the environmental samples collected at this CAS, no COC
contamination has been released to the soil at this CAS. Therefore, no further action is required at
this CAS. However, as a BMP, the tar material will be removed and properly disposed.
CAS 25-25-18, Train Maintenance Bldg 3901 Spill Site
Based on the analytical results of the environmental samples collected at this CAS, no COC
contamination has been released to the soil at this CAS. Therefore, no further action is required at
this CAS.
UNCONTROLLED when Printed

CAU 557 CADD/CRAppendix ARevision: 0Date: May 2009Page A-60 of A-61
A.10.0 References
BN, see Bechtel Nevada.
Bechtel Nevada. 1995. Nevada Test Site Performance Objective for Certification of Nonradioactive Hazardous Waste, Rev. 0, G-E11/96.01. Las Vegas, NV.
CFR, see Code of Federal Regulations.
Code of Federal Regulations. 2006. Title 40 CFR Parts 260 to 282, “Hazardous Waste Management.” Washington, DC: U.S. Government Printing Office.
DOE, see U.S. Department of Energy.
EPA, see U.S. Environmental Protection Agency.
Fahringer, P., Stoller-Navarro Joint Venture. 2004. Memorandum to B. Iverson (SNJV) entitled, “CAU 145 Geophysics - Memorandum of Findings, Winter 2004.” 9 April. Las Vegas, NV.
NNSA/NV, see U.S. Department of Energy, National Nuclear Security Administration Nevada Operations Office.
NNSA/NSO, see U.S. Department of Energy, National Nuclear Security Administration Nevada Site Office.
REECo, see Reynolds Electrical & Engineering Co., Inc.
RSL, see Remote Sensing Laboratory.
Remote Sensing Laboratory. 1989a. Aerial photograph “6612-137,” 23 September. Las Vegas, NV: EG&G Energy Measurements, Inc.
Remote Sensing Laboratory. 1989b. Aerial photograph “6613-144,” 23 September. Las Vegas, NV: EG&G Energy Measurements, Inc.
Remote Sensing Laboratory. 1994. Aerial Photograph “7895-028,” 7 September. Las Vegas, NV: EG&G Energy Measurements, Inc.
Remote Sensing Laboratory. 1996. Aerial photograph “8811-72-08,” 29 August. Las Vegas, NV.
Reynolds Electrical & Engineering Co., Inc. 1994a. Letter to D.R. Elle from E.W. Kendall entitled, “Transmittal of 45-Day Report for Nevada Division of Emergency Management (NDEM) Case Number H931124D - Area 1 Crusher Plant,” 20 January. Las Vegas, NV.
UNCONTROLLED when Printed

CAU 557 CADD/CRAppendix ARevision: 0Date: May 2009Page A-61 of A-61
Reynolds Electrical & Engineering Co., Inc. 1994b. Memorandum to C.C. Neagle from A.R. Latham entitled, “Sample Analytical Results,” 27 January. Las Vegas, NV.
Reynolds Electrical & Engineering Co., Inc. 1994c. Memorandum to K.A. Hoar through J.W. Wiener to R.J. Miller entitled, “Work Request - Bill of Lading Number 530-5-10A,” 5 May. Las Vegas, NV.
SNJV GIS Systems, see Stoller-Navarro Joint Venture Geographic Information Systems.
Stoller-Navarro Joint Venture Geographic Information Systems. 2009. ESRI ArcGIS Software.
U.S. Department of Energy. 1997. The Procedures Manual of the Environmental Measurements Laboratory, HASL-300. 28th Ed., Vol. I. February. New York, NY.
U.S. Department of Energy, National Nuclear Security Administration Nevada Operations Office. 2002. Industrial Sites Quality Assurance Project Plan, Nevada Test Site, Nevada, Rev. 3, DOE/NV--372. Las Vegas, NV.
U.S. Department of Energy, National Nuclear Security Administration Nevada Site Office. 2004. NV/YMP Radiological Control Manual, DOE/NV--11718-079, Rev. 5, UC-702. Prepared by Bechtel Nevada. Las Vegas, NV.
U.S. Department of Energy, National Nuclear Security Administration Nevada Site Office. 2006. Industrial Sites Project Establishment of Final Action Levels, DOE/NV--1107, Rev. 0. Las Vegas, NV.
U.S. Department of Energy, National Nuclear Security Administration Nevada Site Office. 2008. Corrective Action Investigation Plan for Corrective Action Unit 557: Spills and Tank Sites, Nevada Test Site, Nevada, Rev. 0, DOE/NV--1277. Las Vegas, NV.
U.S. Environmental Protection Agency. 1980. Prescribed Procedures for Measurement of Radioactivity in Drinking Water, EPA 600/4-80-032. Cincinnati, OH: Environmental Monitoring and Support Laboratory Office of Research and Development.
U.S. Environmental Protection Agency. 2008. SW-846 On-Line, Test Methods for Evaluating Solid Waste, Physical/Chemical Methods. As accessed at http://www.epa.gov/epaoswer/hazwaste/test/main.htm on 9 January 2009.
Weston, see Weston Solutions, Inc.
Weston Solutions, Inc. 2006. After Action Report: Technical Services for Preliminary Assessment Geophysical Investigations, Nevada Test Site, Six Corrective Action Sites, Nye County, Nevada. October. West Chester, PA.
UNCONTROLLED when Printed

Appendix B
Data Assessment
UNCONTROLLED when Printed

CAU 557 CADD/CRAppendix BRevision: 0Date: May 2009Page B-1 of B-11
B.1.0 Data Assessment
The DQA process is the scientific evaluation of the actual CAI results to determine whether the DQO
criteria established in the CAU 557 CAIP (NNSA/NSO, 2008) were met and whether DQO decisions
can be resolved at the desired level of confidence. The DQO process ensures that the right type,
quality, and quantity of data will be available to support the resolution of those decisions at an
appropriate level of confidence. Using both the DQO and DQA processes help to ensure that DQO
decisions are sound and defensible.
The DQA involves five steps that begin with a review of the DQOs and end with an answer to the
DQO decisions. The five steps are briefly summarized as follows:
Step 1: Review DQOs and Sampling Design – Review the DQO process to provide context for
analyzing the data. State the primary statistical hypotheses; confirm the limits on decision errors for
committing false negative (Type I) or false positive (Type II) decision errors; and review any special
features, potential problems, or deviations to the sampling design.
Step 2: Conduct a Preliminary Data Review – Perform a preliminary data review by reviewing QA
reports and inspecting the data both numerically and graphically, validating and verifying the data to
ensure that the measurement systems performed in accordance with the criteria specified, and using
the validated dataset to determine whether the quality of the data is satisfactory.
Step 3: Select the Test – Select the test based on the population of interest, population parameter,
and hypotheses. Identify the key underlying assumptions that could cause a change in one of the
DQO decisions.
Step 4: Verify the Assumptions – Perform tests of assumptions. If data are missing or are censored,
determine the impact this has on DQO decision error.
Step 5: Draw Conclusions from the Data – Perform the calculations required for the selected test.
UNCONTROLLED when Printed

CAU 557 CADD/CRAppendix BRevision: 0Date: May 2009Page B-2 of B-11
B.1.1 Review DQOs and Sampling Design
This section contains a review of the DQO process presented in Appendix A of the CAU 557 CAIP
(NNSA/NSO, 2008). The DQO decisions are presented with the DQO provisions to limit false
negative or false positive decision errors. Special features, potential problems, or any deviations to
the sampling design are also presented.
B.1.1.1 Decision I
The Decision I statement as presented in the CAU 557 CAIP is: “Is any COPC associated with the
CAS present in environmental media at a concentration exceeding its corresponding FAL?”
(NNSA/NSO, 2008).
Decision I Rules:
• If the population parameter of any COPC in a target population exceeds the FAL for that COPC, then that COPC is identified as a COC.
• If a COC is detected, then the Decision II statement must be resolved.
• If COCs are not identified, then the CAI is complete.
B.1.1.1.1 DQO Provisions To Limit False Negative Decision Error
A false negative decision error (where consequences are more severe) was controlled by meeting the
following criteria:
1. Having a high degree of confidence that locations selected will identify COCs if present anywhere within the CAS.
2. Having a high degree of confidence that analyses conducted will be sufficient to detect any COCs present in the samples.
3. Having a high degree of confidence that the dataset is of sufficient quality and completeness.
UNCONTROLLED when Printed

CAU 557 CADD/CRAppendix BRevision: 0Date: May 2009Page B-3 of B-11
Criterion 1:
The following field-screening techniques, methods, and biasing factors (stipulated in the CAU 557
DQOs [NNSA/NSO, 2008]) were used in selecting judgmental sample locations:
• Screening samples for VOCs using a PID
• Screening samples for alpha- and beta/gamma-emitting radionuclides using an NE Technology Electra
• Conducting visual inspections of soil profiles surrounding CAS-component(s) during sampling and excavation activities and core material during drilling operations to identify staining and the presence of debris
• Preselecting areas based on process knowledge of the site (e.g., known stained areas at CAS 25-25-18, presence of tar at CAS 06-99-10) for source and location of a release
Criterion 2:
Samples were analyzed using the analytical methods outlined in Section A.2.3 and shown on
Tables 3-4 and 3-5 of the CAU 557 CAIP (NNSA/NSO, 2008). Table B.1-1 provides a reconciliation
of the planned analytical program for CAU 557 to the actual samples analyzed to ensure that adequate
samples were collected and analyzed from Decision I locations. The tar sample from CAS 06-99-10
was also submitted and analyzed for RCRA metal analysis.
Sensitivity
Sample results were assessed against the acceptance criterion for the DQI of sensitivity as defined in
the Industrial Sites QAPP (NNSA/NV, 2002). The sensitivity acceptance criterion defined is that the
analytical detection limit will be less than the corresponding action level for the sample result. This
criterion was not achieved for analytical results from the samples at CAS 25-25-18 that are listed in
Table B.1-2. Three chemical COPCs failed the sensitivity criteria: benzo(a)pyrene,
dibenzo(a,h)anthracene, and n-nitro-di-n-propylamine. These results were not used in making DQO
decisions and are considered as rejected data. The impact of these failed sensitivity results on DQO
decisions is addressed in the assessment of completeness.
UNCONTROLLED When Printed

CAU 557 CADD/CRAppendix BRevision: 0Date: May 2009Page B-4 of B-11
Table B.1-1CAU 557 Analyses Performed
CASVO
Cs
SVO
Cs
RC
RA
Met
als
Ber
ylliu
m
PCB
s
TPH
-DR
O
Pest
icid
es
Gam
ma
Spec
tros
copy
Isot
opic
U
Isot
opic
Pu
Sr-9
0
01-25-02 RS RS -- -- -- RS -- -- -- -- --
03-02-02 RS RS RS -- RS RS -- RS RS RS RS
06-99-10 RS RS RS -- RS RS -- RS -- -- --
25-25-18 RS RS RS RSa RSb RS RSc RS RS RS RS
aSurface soil samples at locations D01 through D05 were also submitted and analyzed for beryllium. bSurface soil sample at location D06 were submitted and analyzed for PCBs. cSurface soil sample at location D06 were submitted and analyzed for pesticides.
RS = Required and submitted-- = Not required and not submitted
Table B.1-2Analytes Failing Sensitivity Criteria
SampleNumber COPCs MDC
(mg/kg)FAL
(mg/kg)
557D008
Benzo(a)pyrene 0.86 0.21
Dibenzo(a,h)anthracene 0.86 0.21
N-Nitroso-di-n-propylamine 0.86 0.25
557D016
Benzo(a)pyrene 0.34 0.21
Dibenzo(a,h)anthracene 0.34 0.21
N-Nitroso-di-n-propylamine 0.34 0.25
557D018
Benzo(a)pyrene 0.35 0.21
Dibenzo(a,h)anthracene 0.35 0.21
N-Nitroso-di-n-propylamine 0.35 0.25
mg/kg = Milligrams per kilogram
UNCONTROLLED When Printed

CAU 557 CADD/CRAppendix BRevision: 0Date: May 2009Page B-5 of B-11
Criterion 3:
To satisfy the third criterion, the entire dataset, as well as individual sample results, was assessed
against the acceptance criteria for the DQIs of precision, accuracy, representativeness, completeness,
and comparability, as defined in the Industrial Sites QAPP (NNSA/NV, 2002). The DQI goals are
presented in Table 6-1 of the CAU 557 CAIP (NNSA/NSO, 2008). As presented in the following
sections, these goals were met for each of the DQIs.
Precision
Precision was evaluated as described in Section 6.2.3 of the CAU 557 CAIP (NNSA/NSO, 2008).
Precision is a measure of the repeatability of the analysis process from sample collection through
analysis results that is used to access the variability between two equal samples. There were no
chemical or radiological data qualified for precision, therefore, the DQI for precision was
100 percent. As all contaminants exceed the precision goal for CAU 557 of 80 percent, the datasest is
determined to be acceptable for the DQI of precision.
Accuracy
Accuracy was evaluated as described in Section 6.2.4 of the CAU 557 CAIP (NNSA/NSO, 2008).
Accuracy is a measure of the closeness of an individual measurement to the true value and is used to
assess the performance of laboratory measurement processes. There were no chemical or radiological
data qualified for accuracy; therefore, the DQI for accuracy was 100 percent. As all contaminants
exceed the accuracy goal for CAU 557 of 80 percent, the datasest is determined to be acceptable for
the DQI of accuracy.
Representativeness
The DQO process, as identified in Section 6.2.5 of the CAU 557 CAIP (NNSA/NSO, 2008), was used
to address sampling and analytical requirements for CAU 557. During this process, appropriate
locations were selected that enabled the samples collected to be representative of the population
parameters identified in the DQO (the most likely locations to contain contamination and the most
likely locations that bound COCs). The sampling locations identified in the Criterion 1 discussion
meet this criterion. Therefore, the analytical data acquired during the CAU 557 CAI are considered
representative of the population parameters.
UNCONTROLLED when Printed

CAU 557 CADD/CRAppendix BRevision: 0Date: May 2009Page B-6 of B-11
Completeness
Section 6.2.6 of the CAU 557 CAIP (NNSA/NSO, 2008) defines acceptable criteria for completeness
to be that the dataset is sufficiently complete to be able to make the DQO decisions. As shown on
Table 6-1 in the CAIP, this is initially evaluated as 80 percent of CAS-specific COPCs (non-critical
analytes) that are identified on Table 3-3 in the CAIP as having usable results, and 100 percent of
CAS-specific targeted contaminants (critical analytes) as having usable results. For CAU 557, there
were no data qualified as rejected, and all contaminants met the 80 percent completeness criteria.
The targeted contaminants identified for the CAU 557 CASs were TPH-DRO and the hazardous
constituents of TPH-DRO. Results for the targeted contaminants of TPH-DRO and the hazardous
constituents of TPH-DRO were 100 percent complete with the exception of benzo(a)pyrene, which
did not meet the criteria for sensitivity and is considered to be rejected data (and therefore did not
meet the 100 percent completeness criterion for targeted contaminants). Dibenzo(a,h)anthracene and
n-nitroso-di-n-propylamine also did not meet the sensitivity criteria in 3 of the 16 samples, resulting
in a completeness rate of 81 percent (and therefore met the completeness criterion of 80 percent).
These rejected data (that failed the criterion of sensitivity) were not used in the resolution of DQO
decisions and are not counted toward meeting the completeness acceptance criterion.
Benzo(a)pyrene failed the initial completeness criterion of 100 percent in three samples analyzed
from CAS 25-25-18 (557D008, 560D016, and 560D018). These samples were diluted and/or
prepared at reduced volume resulting in elevated detection limits that were greater than their
corresponding FAL concentrations. However, valid results were obtained for benzo(a)pyrene
contaminants in 14 other samples from this CAS for a completeness rate of 82 percent. As
benzo(a)pyrene was not detected in any sample for this CAS, there is no evidence to suspect that
benzo(a)pyrene is present at CAS 25-25-18. Therefore, there is sufficient information to make the
DQO decisions at each of the CASs, and the dataset was determined to meet the criteria for
completeness.
Comparability
Field sampling, as described in the CAU 557 CAIP (NNSA/NSO, 2008), was performed and
documented in accordance with approved procedures that are comparable to standard industry
practices. Approved analytical methods and procedures per DOE were used to analyze, report, and
UNCONTROLLED when Printed

CAU 557 CADD/CRAppendix BRevision: 0Date: May 2009Page B-7 of B-11
validate the data. These are comparable to other methods used not only in industry and government
practices, but most importantly are comparable to other investigations conducted for the NTS.
Therefore, project datasets are considered comparable to other datasets generated using these same
standardized DOE procedures, thereby meeting DQO requirements.
Also, standard, approved field and analytical methods ensured that data were appropriate for
comparison to the investigation action levels specified in the CAIP.
B.1.1.1.2 DQO Provisions To Limit False Positive Decision Error
The false positive decision error was controlled by assessing the potential for false positive analytical
results. Quality assurance/QC samples such as field blanks, trip blanks, LCSs, and method blanks
were used to determine whether a false positive analytical result may have occurred. This provision
is evaluated during the validation process, and appropriate qualifications are applied to the data
results when applicable.
Proper decontamination of sampling equipment and the use of certified clean sampling equipment
and containers also minimized the potential for cross contamination that could lead to a false positive
analytical result.
B.1.1.2 Decision II
Decision II was not assessed because no COCs were present at the CAU 557 CASs and it was not
necessary to determine the extent of contamination.
B.1.1.3 Sampling Design
The CAU 557 CAIP (NNSA/NSO, 2008) made the following commitments for sampling:
1. Judgmental sampling will be conducted at all CASs based on the CAS features and biasing factors present. Soil samples will be collected beneath and/or adjacent to collection and release points to identify releases of contaminants.
Result: At CAS 01-25-02, the soil most likely to be contaminated was successfully sampled based on visual observations of soil discoloration, VOC headspace FSRs, and process knowledge regarding the former excavation (e.g., approximate depth to interface between backfill material and native soil). At CAS 03-02-02, the soils most likely to be contaminated were successfully
UNCONTROLLED when Printed

CAU 557 CADD/CRAppendix BRevision: 0Date: May 2009Page B-8 of B-11
sampled based on the presence and known release points from the CAS feature (steel casing with perforations), visual observations of stained and debris containing soil within the casing, and investigation of subsurface geophysical anomalies. At CAS 06-99-10, the soil most likely to be contaminated was successfully sampled based on the presence of two tar spills of the same material and collecting a representative soil sample directly underneath tar material. At CAS 25-25-18, the soils most likely to be contaminated were successfully sampled based on a visual survey to identify the darkest areas of stained soil.
2. Waste present that has the potential to cause a future release will be sampled.
Result: At CAS 06-99-10, a representative sample of the tar material was sampled and submitted for laboratory analysis.
B.1.2 Conduct a Preliminary Data Review
A preliminary data review was conducted by reviewing QA reports and inspecting the data. The
contract analytical laboratories generate a QA nonconformance report when data quality does not
meet contractual requirements. All data received from the analytical laboratories met contractual
requirements, and a QA nonconformance report was not generated. Data were validated and verified
to ensure that the measurement systems performed in accordance with the criteria specified. The
validated dataset quality was found to be satisfactory.
B.1.3 Select the Test and Identify Key Assumptions
The test for making DQO Decision I was the comparison of the maximum analyte result from each
CAS to the corresponding FAL. The test for making DQO Decision II was the comparison of all
COC analyte results from each bounding sample to the corresponding FALs.
The key assumptions that could impact a DQO decision are listed in Table B.1-3.
B.1.4 Verify the Assumptions
The results of the CAI support the key assumptions identified in the CAU 557 DQOs and
Table B.1-3. All data collected during the CAI supported CSMs.
B.1.5 Draw Conclusions from the Data
This section resolves the two DQO decisions for each of the CAU 557 CASs.
UNCONTROLLED when Printed

CAU 557 CADD/CRAppendix BRevision: 0Date: May 2009Page B-9 of B-11
B.1.5.1 Decision Rules for Decision I
Decision Rule: If the concentration of any COPC in a target population exceeds the FAL for that
COPC during the initial investigation, then that COPC is identified as a COC, and Decision II
sampling will be conducted.
Result: Because no COPCs were identified in any on a target population exceeding their FALs, no
COCs were identified, and no Decision II sampling was conducted at any of the CAU 557 CASs.
Table B.1-3Key Assumptions
Exposure Scenario
Site workers are only exposed to COCs through oral ingestion, inhalation, external exposure to radiation, or dermal contact (by absorption) of COCs absorbed onto the soils.Exposure to contamination is limited to industrial site workers, construction/remediation workers, and military personnel conducting training.The investigation results did not reveal any potential exposures other than those identified in the CSM.
Affected Media
Surface soil, shallow subsurface soil, and potentially perched (shallow) groundwater.Deep groundwater contamination is not a concern.Contaminants migrating to regional aquifers are not considered.The investigation results did not reveal any affected media other than those identified in the CSM. Because no COCs were present at any CAS, shallow groundwater is not an affected media.
Location of Contamination/Release Points
The area of contamination is contiguous (except at CAS 06-99-10).The extent of COC concentration decreases away from the area of contamination.No COCs were identified as a result of the CAI.
Transport Mechanisms
Surface transport may occur as a result of a spill or storm water runoff.Surface transport beyond shallow substrate is not a concern.The investigation results did not reveal any transport mechanisms other than those identified in the CSM.
Preferential Pathways None. The investigation results did not reveal any pathways other than those identified in the CSM.
Lateral and Vertical Extent of Contamination
Subsurface contamination, if present, is contiguous and decreases with distance and depth from the source. Surface contamination may occur laterally as a result of a spill or storm water runoff.No surface or subsurface contamination is present, as no COCs were identified.
Groundwater Impacts None. The investigation results did not identify any impacts to groundwater.
Future Land Use Nonresidential. The investigation results did not reveal any future land uses other than those identified in the CSM.
Other DQO AssumptionsContamination may be present in the soils adjacent to a feature due to surface water runoff or intended use (e.g., casing). The investigation results did not identify any contamination associated with the steel casing of CAS 03-02-02.
UNCONTROLLED when Printed

CAU 557 CADD/CRAppendix BRevision: 0Date: May 2009Page B-10 of B-11
Decision Rule: If all COPC concentrations are less than the corresponding FALs, then the decision
will be no further action.
Result: Because all COPC concentrations were less than their corresponding FALs, the decision of
no further action was identified as the corrective action for all the CAU 557 CASs.
B.1.5.2 Decision Rules for Decision II
Decision II was not assessed because no COCs were present at the CAU 557 CASs, and it was not
necessary to determine the extent of contamination.
UNCONTROLLED when Printed

CAU 557 CADD/CRAppendix BRevision: 0Date: May 2009Page B-11 of B-11
B.2.0 References
NNSA/NSO, see U.S. Department of Energy, National Nuclear Security Administration Nevada Site Office.
NNSA/NV, see U.S. Department of Energy, National Nuclear Security Administration Nevada Operations Office.
U.S. Department of Energy, National Nuclear Security Administration Nevada Operations Office. 2002. Industrial Sites Quality Assurance Project Plan, Nevada Test Site, Nevada, Rev. 3, DOE/NV--372. Las Vegas, NV.
U.S. Department of Energy, National Nuclear Security Administration Nevada Site Office. 2008. Corrective Action Investigation Plan for Corrective Action Unit 557: Spills and Tank Sites, Nevada Test Site, Nevada, Rev. 0, DOE/NV--1277. Las Vegas, NV.
UNCONTROLLED when Printed

Appendix C
Risk Assessment
UNCONTROLLED when Printed

CAU 557 CADD/CRAppendix CRevision: 0Date: May 2009Page C-1 of C-12
C.1.0 Evaluation of Risk
The RBCA process used to establish FALs is described in the Industrial Sites Project Establishment
of Final Action Levels (NNSA/NSO, 2006). This process conforms with NAC Section 445A.227,
which lists the requirements for sites with soil contamination (NAC, 2006a). For the evaluation of
corrective actions, NAC Section 445A.22705 (NAC, 2006b) requires the use of ASTM Method E
1739-95 (ASTM, 1995) to “conduct an evaluation of the site, based on the risk it poses to public
health and the environment, to determine the necessary remediation standards (i.e., FALs) or to
establish that corrective action is not necessary.”
The presence of a COC would require a corrective action. A corrective action may also be necessary
if there is a potential for waste that is present at a site to release a COC to the site environmental
media (i.e., PSM). To evaluate a waste for such a scenario, the following conservative assumptions
were made:
• Any physical waste containment would fail at some point, and the contents would be released to the surrounding media.
• For non-liquid wastes, the concentration of the contaminants in the surrounding soil would be equal to the concentration of contaminants in the waste.
• For liquid wastes, the resulting concentration of contaminants in the surrounding soil would be calculated based on the concentration of contaminants in the wastes and the liquid holding capacity of the soil.
This section contains documentation of the RBCA process used to establish FALs described in the
Industrial Sites Project Establishment of Final Action Levels (NNSA/NSO, 2006). This process
defines three tiers (or levels) to establish FALs used to evaluate DQO decisions:
• Tier 1 – Sample results from source areas (highest concentrations) compared to risk-based screening levels (RBSLs) (i.e., PALs) based on generic (non-site-specific) conditions.
• Tier 2 – Sample results from exposure points compared to SSTLs calculated using site-specific inputs and Tier 1 formulas.
• Tier 3 – Sample results from exposure points compared to SSTLs and points of compliance calculated using chemical fate/transport and probabilistic modeling.
UNCONTROLLED when Printed

CAU 557 CADD/CRAppendix CRevision: 0Date: May 2009Page C-2 of C-12
The risk-based corrective action decision process stipulated in the Industrial Sites Project
Establishment of Final Action Levels (NNSA/NSO, 2006) is summarized in Figure C.1-1.
C.1.1 A. Scenario
Corrective Action Unit 557 is comprised of the following four CASs:
• 01-25-02, Fuel Spill• 03-02-02, Area 3 Subdock UST• 06-99-10, Tar Spills• 25-25-18, Train Maintenance Bldg 3901 Spill Site
Corrective Action Site 01-25-02, Fuel Spill, is located at the Area 1 Batch Plant and consists of a
1994 cleanup of an historical diesel fuel release from an unknown source that was discovered in
late 1993. The hydrocarbon-impacted soils were removed, and the excavation was backfilled to
grade. The Area 1 Batch Plant operated between 1965 and 1985 and functioned as a screening
facility for recovered desert soil and rock from a nearby strip mine. Parts of the Shaker Plant are
currently active.
Corrective Action Site 03-02-02, Area 3 Subdock UST, consists of a flush-mounted subsurface steel
feature that was reportedly used for the diversion and drainage of surface water runoff and the
subsequent dispersion and release of the effluent into the surrounding soils. The Area 3 Subdock was
used for degreasing, cleaning, and repairing worn drill bits and realigning bent drill rods from the
1970s through 1985, when it was relocated to Area 1.
Corrective Action Site 06-99-10, Tar Spills, is located approximately 500 ft south of the CP-72
Building in Area 6, just west of an utility access road that runs parallel to Mercury Highway, and
consists of a tar material spill released from an unknown source. The spill site is not associated with
any known activities; however, it is suspected to be a release of unused tar that was allocated for road
paving material.
Correction Action Site 25-25-18, Train Maintenance Bldg 3901 Spill Site, is located just north of the
ETSM Building (i.e., Bldg 3901), which is part of the EMAD facility in Area 25. The CAS consists
of two areas of hydrocarbon-impacted soil situated on both sides of the railroad tracks that lead into
Bldg 3901 and were reported to be from the discharge of used engine oil from the north end of
UNCONTROLLED when Printed

CAU 557 CADD/CRAppendix CRevision: 0Date: May 2009Page C-3 of C-12
Figure C.1-1Risk-Based Corrective Action Decision Process
UNCONTROLLED when Printed
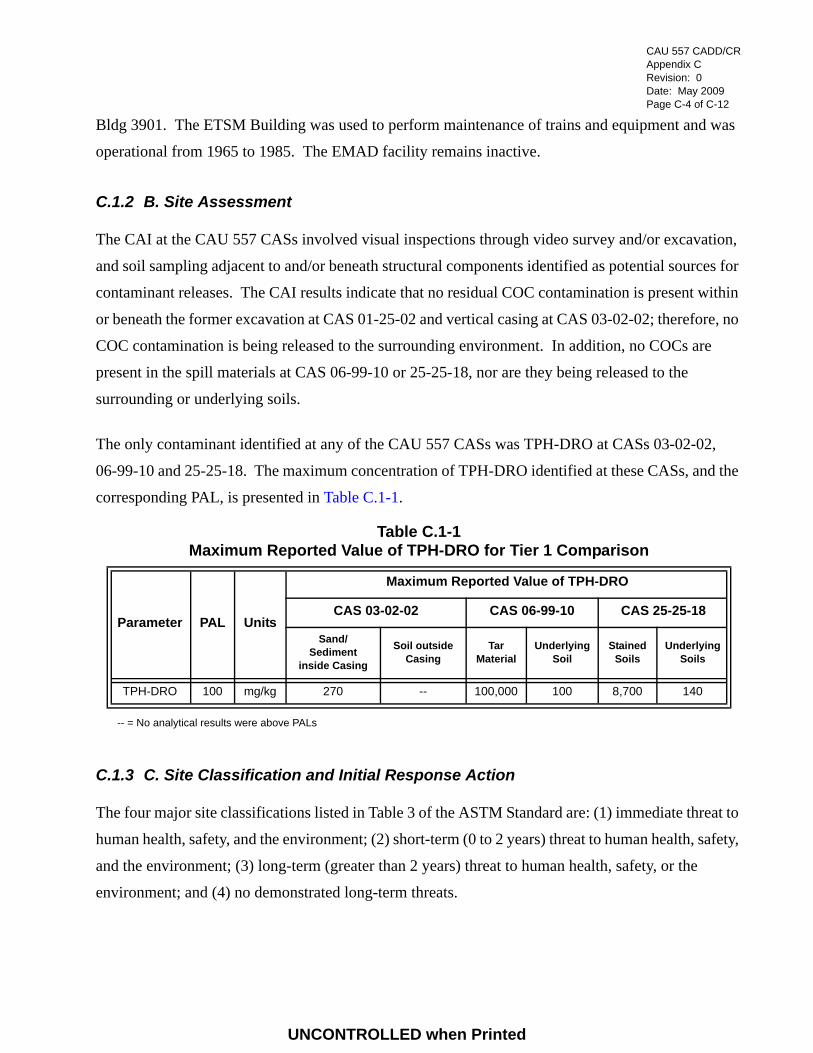
CAU 557 CADD/CRAppendix CRevision: 0Date: May 2009Page C-4 of C-12
Bldg 3901. The ETSM Building was used to perform maintenance of trains and equipment and was
operational from 1965 to 1985. The EMAD facility remains inactive.
C.1.2 B. Site Assessment
The CAI at the CAU 557 CASs involved visual inspections through video survey and/or excavation,
and soil sampling adjacent to and/or beneath structural components identified as potential sources for
contaminant releases. The CAI results indicate that no residual COC contamination is present within
or beneath the former excavation at CAS 01-25-02 and vertical casing at CAS 03-02-02; therefore, no
COC contamination is being released to the surrounding environment. In addition, no COCs are
present in the spill materials at CAS 06-99-10 or 25-25-18, nor are they being released to the
surrounding or underlying soils.
The only contaminant identified at any of the CAU 557 CASs was TPH-DRO at CASs 03-02-02,
06-99-10 and 25-25-18. The maximum concentration of TPH-DRO identified at these CASs, and the
corresponding PAL, is presented in Table C.1-1.
C.1.3 C. Site Classification and Initial Response Action
The four major site classifications listed in Table 3 of the ASTM Standard are: (1) immediate threat to
human health, safety, and the environment; (2) short-term (0 to 2 years) threat to human health, safety,
and the environment; (3) long-term (greater than 2 years) threat to human health, safety, or the
environment; and (4) no demonstrated long-term threats.
Table C.1-1Maximum Reported Value of TPH-DRO for Tier 1 Comparison
Parameter PAL Units
Maximum Reported Value of TPH-DRO
CAS 03-02-02 CAS 06-99-10 CAS 25-25-18
Sand/Sediment
inside Casing
Soil outside Casing
Tar Material
UnderlyingSoil
Stained Soils
UnderlyingSoils
TPH-DRO 100 mg/kg 270 -- 100,000 100 8,700 140
-- = No analytical results were above PALs
UNCONTROLLED when Printed

CAU 557 CADD/CRAppendix CRevision: 0Date: May 2009Page C-5 of C-12
Based on the CAI, none of the CASs present an immediate threat to human health, safety, and the
environment; therefore, no interim response actions are necessary at these sites. Based on this
information, all four CASs are determined to be Classification 4 sites as defined by ASTM Method E
1739-95 and pose no demonstrated near- or long-term threats.
C.1.4 D. Development of Tier 1 Lookup Table of RBSLs
Tier 1 action levels have been defined as the PALs established during the DQO process. The PALs
are a tabulation of chemical-specific (but not site-specific) screening levels based on the type of
media (soil) and potential exposure scenarios (industrial). These are very conservative estimates of
risk, are preliminary in nature, and are used as action levels for site screening purposes. Although the
PALs are not intended to be used as FALs, a FAL may be defined as the Tier 1 action level (i.e., PAL)
value if individual contaminant analytical results are below the corresponding Tier 1 action level
value. The FAL may also be established as the Tier 1 action level value if individual contaminant
analytical results exceed the corresponding Tier 1 action level value and implementing a corrective
action based on the FAL is practical. The PALs are defined as:
• EPA Region 9 Risk-Based PRGs for Industrial Soils (EPA, 2004).
• Background concentrations for RCRA metals will be evaluated when natural background exceeds the PAL, as is often the case with arsenic. Background is considered the mean plus two times the standard deviation of the mean based on data published in Mineral and Energy Resource Assessment of the Nellis Air Force Range (NBMG, 1998; Moore, 1999).
• TPH concentrations above the action level of 100 mg/kg per NAC 445A.2272 (NAC, 2006c).
• For COPCs without established PRGs, a protocol similar to EPA Region 9 will be used to establish an action level; otherwise, an established PRG from another EPA region may be chosen.
• The PALs for radioactive contaminants are based on the National Council on Radiation Protection and Measurements (NCRP) Report No. 129 recommended screening limits for construction, commercial, industrial land-use scenarios (NCRP, 1999) scaled to 25-millirem-per-year dose constraint (Appenzeller-Wing, 2004) and the generic guidelines for residual concentration of radionuclides in DOE Order 5400.5 (DOE, 1993).
The PALs were developed based on an industrial scenario. Because the CAU 557 CASs in Areas 1,
3, 6, and 25 are not assigned work stations and are considered to be in remote or occasional use areas,
UNCONTROLLED when Printed
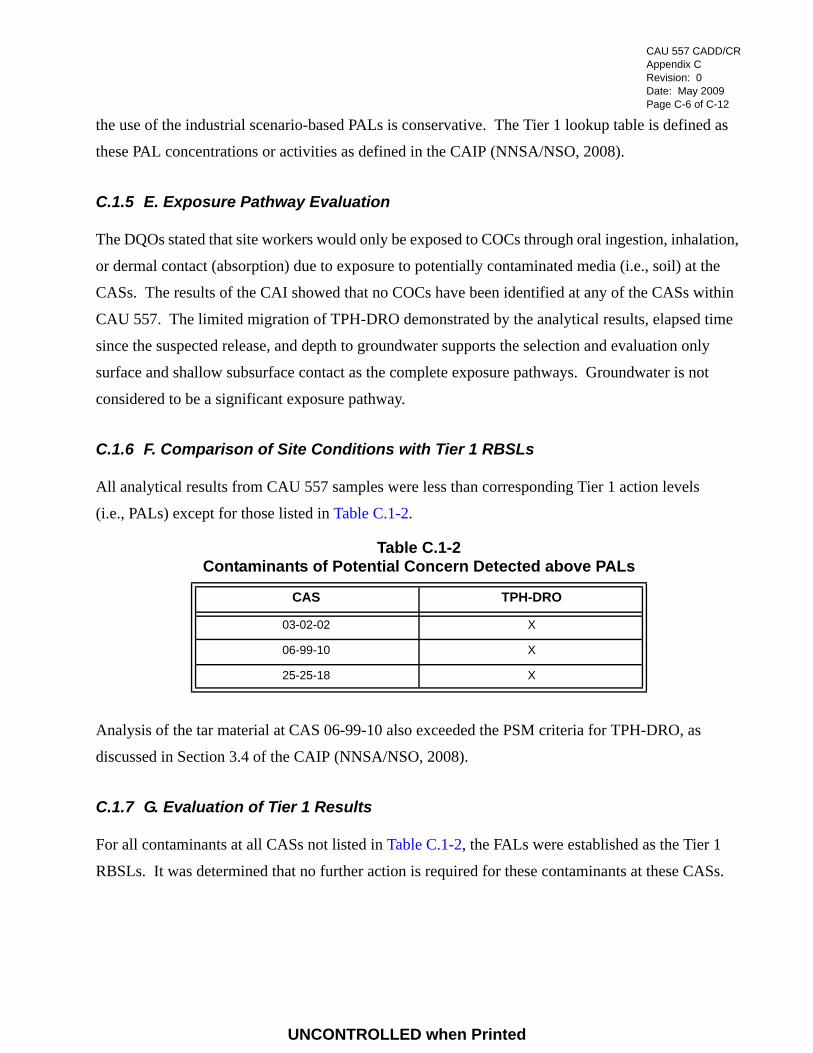
CAU 557 CADD/CRAppendix CRevision: 0Date: May 2009Page C-6 of C-12
the use of the industrial scenario-based PALs is conservative. The Tier 1 lookup table is defined as
these PAL concentrations or activities as defined in the CAIP (NNSA/NSO, 2008).
C.1.5 E. Exposure Pathway Evaluation
The DQOs stated that site workers would only be exposed to COCs through oral ingestion, inhalation,
or dermal contact (absorption) due to exposure to potentially contaminated media (i.e., soil) at the
CASs. The results of the CAI showed that no COCs have been identified at any of the CASs within
CAU 557. The limited migration of TPH-DRO demonstrated by the analytical results, elapsed time
since the suspected release, and depth to groundwater supports the selection and evaluation only
surface and shallow subsurface contact as the complete exposure pathways. Groundwater is not
considered to be a significant exposure pathway.
C.1.6 F. Comparison of Site Conditions with Tier 1 RBSLs
All analytical results from CAU 557 samples were less than corresponding Tier 1 action levels
(i.e., PALs) except for those listed in Table C.1-2.
Analysis of the tar material at CAS 06-99-10 also exceeded the PSM criteria for TPH-DRO, as
discussed in Section 3.4 of the CAIP (NNSA/NSO, 2008).
C.1.7 G. Evaluation of Tier 1 Results
For all contaminants at all CASs not listed in Table C.1-2, the FALs were established as the Tier 1
RBSLs. It was determined that no further action is required for these contaminants at these CASs.
Table C.1-2Contaminants of Potential Concern Detected above PALs
CAS TPH-DRO
03-02-02 X
06-99-10 X
25-25-18 X
UNCONTROLLED when Printed

CAU 557 CADD/CRAppendix CRevision: 0Date: May 2009Page C-7 of C-12
C.1.8 H. Tier 1 Remedial Action Evaluation
TPH-DRO Evaluation
No actions to remediate any of the sites to Tier 1 action levels for TPH-DRO are proposed, and
TPH-DRO was moved to a Tier 2 evaluation.
C.1.9 I. Tier 2 Evaluation
No additional data were needed to complete a Tier 2 evaluation.
C.1.10 J. Development of Tier 2 SSTLs
Evaluation of TPH-DRO SSTLs
Method E 1739-95 stipulates that risk evaluations for TPH-DRO contamination be calculated and
evaluated based on the risk posed by the potentially hazardous constituents of diesel. Section 6.4.3
(“Use of Total Petroleum Hydrocarbon Measurements”) of ASTM Method E 1739-95 states: “TPHs
should not be used for risk assessment because the general measure of TPH-DRO provides
insufficient information about the amounts of individual chemical(s) of concern present” (see also
Sections X1.5.4 and X1.42 of Method E 1739-95 in ASTM, 1995). Therefore, the individual
potentially hazardous constituents in diesel were compared to corresponding Tier 2 SSTLs based on
PAL concentrations to evaluate the need for corrective action at each individual CAS at CAU 557.
These SSTLs and the maximum reported level for each diesel constituent per CAS are presented in
Table C.1-3.
C.1.11 K. Comparison of Site Conditions with Tier 2 SSTLs
The Tier 2 action levels are typically compared to individual sample results from reasonable points of
exposure (as opposed to the source areas as is done in Tier 1) on a point-by-point basis. Points of
exposure are defined as those locations or areas at which an individual or population may come in
contact with a COC originating from a CAS. For CAU 557, the Tier 2 action levels were compared to
maximum contaminant concentrations from each sample location. No potentially hazardous
constituents of diesel exceeded their corresponding Tier 2 SSTLs. The FALs for the potentially
hazardous constituents of diesel were established at the corresponding Tier 2 SSTLs (i.e., PALs),
UNCONTROLLED when Printed
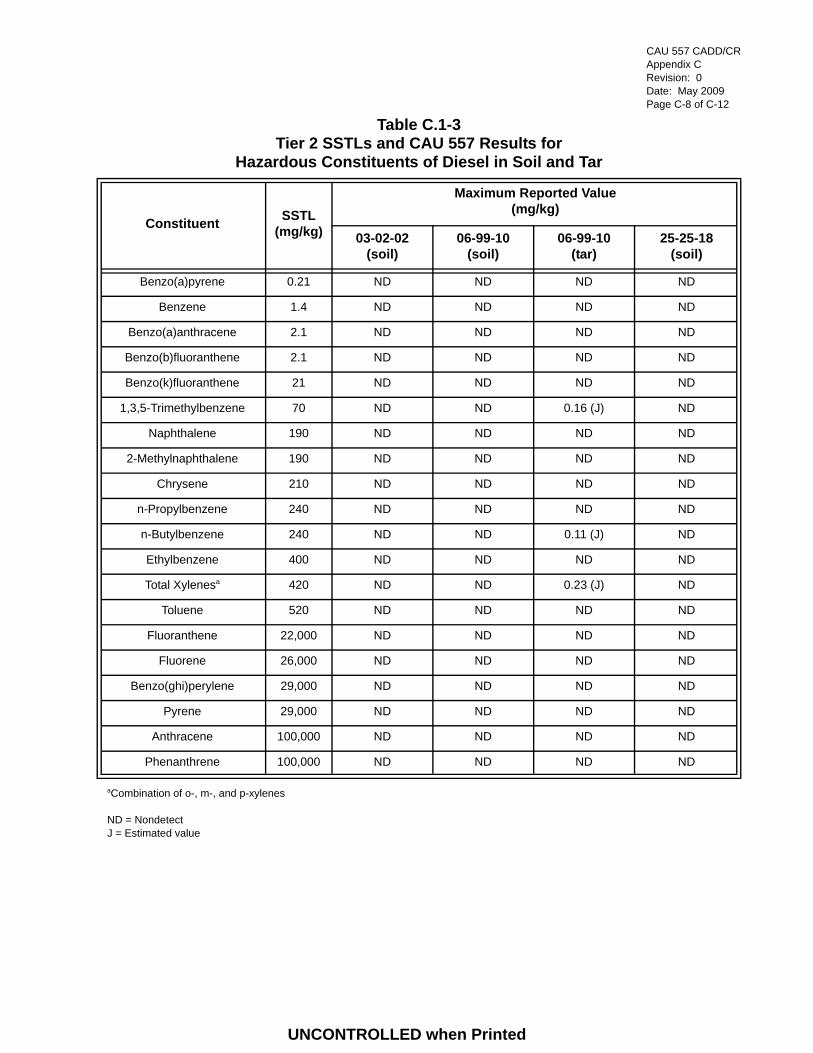
CAU 557 CADD/CRAppendix CRevision: 0Date: May 2009Page C-8 of C-12
Table C.1-3Tier 2 SSTLs and CAU 557 Results for
Hazardous Constituents of Diesel in Soil and Tar
Constituent SSTL(mg/kg)
Maximum Reported Value(mg/kg)
03-02-02(soil)
06-99-10(soil)
06-99-10(tar)
25-25-18(soil)
Benzo(a)pyrene 0.21 ND ND ND ND
Benzene 1.4 ND ND ND ND
Benzo(a)anthracene 2.1 ND ND ND ND
Benzo(b)fluoranthene 2.1 ND ND ND ND
Benzo(k)fluoranthene 21 ND ND ND ND
1,3,5-Trimethylbenzene 70 ND ND 0.16 (J) ND
Naphthalene 190 ND ND ND ND
2-Methylnaphthalene 190 ND ND ND ND
Chrysene 210 ND ND ND ND
n-Propylbenzene 240 ND ND ND ND
n-Butylbenzene 240 ND ND 0.11 (J) ND
Ethylbenzene 400 ND ND ND ND
Total Xylenesa 420 ND ND 0.23 (J) ND
Toluene 520 ND ND ND ND
Fluoranthene 22,000 ND ND ND ND
Fluorene 26,000 ND ND ND ND
Benzo(ghi)perylene 29,000 ND ND ND ND
Pyrene 29,000 ND ND ND ND
Anthracene 100,000 ND ND ND ND
Phenanthrene 100,000 ND ND ND ND
aCombination of o-, m-, and p-xylenes
ND = NondetectJ = Estimated value
UNCONTROLLED when Printed

CAU 557 CADD/CRAppendix CRevision: 0Date: May 2009Page C-9 of C-12
C.1.12 L. Tier 2 Remedial Action Evaluation
Based on the Tier 2 evaluation of the potentially hazardous constituents of diesel, the TPH-DRO does
not pose an unacceptable risk to human health and the environment. Therefore, no further action
concerning TPH-DRO required at the CASs within CAU 557.
As all contaminant FALs were established as Tier 1 or Tier 2 action levels, a Tier 3 evaluation was
not considered necessary.
UNCONTROLLED when Printed

CAU 557 CADD/CRAppendix CRevision: 0Date: May 2009Page C-10 of C-12
C.2.0 Recommendations
All of the hazardous constituents of diesel concentrations in soil and tar identified from the analysis
of CAU 557 samples are less than the corresponding FALs at all locations. Therefore, it has been
determined that TPH-DRO is not a COC at these locations and does not pose a significant risk to
human health or the environment. Based on this determination, these sites do not warrant corrective
actions. However, this does not preclude the consideration of these sites for additional protective
measures that are recommended as BMPs (i.e., removal of the perforated vertical steel casing at
CAS 03-02-02 and removal of the tar material at CAS 06-99-10).
UNCONTROLLED when Printed

CAU 557 CADD/CRAppendix CRevision: 0Date: May 2009Page C-11 of C-12
C.3.0 References
ASTM, see American Society for Testing and Materials.
American Society for Testing and Materials. 1995. Standard Guide for Risk-Based Corrective Action Applied at Petroleum Release Sites, ASTM E 1739-95 (Reapproved 2002). Philadelphia, PA.
Appenzeller-Wing, J., U.S. Department of Energy, National Nuclear Security Administration Nevada Site Office. 2004. Letter to T.A. Maize (NDEP) entitled, “Submittal of Proposed Radiological Preliminary Action Levels (PALs) for the Industrial Sites Project,” 15 January. Las Vegas, NV.
DOE, see U.S. Department of Energy.
EPA, see U.S. Environmental Protection Agency.
Moore, J., Science Applications International Corporation. 1999. Memorandum to M. Todd (SAIC), “Background Concentrations for NTS and TTR Soil Samples,” 3 February. Las Vegas, NV.
NAC, see Nevada Administrative Code
NBMG, see Nevada Bureau of Mines and Geology.
NCRP, see National Council on Radiation Protection and Measurements.
NNSA/NSO, see U.S. Department of Energy, National Nuclear Security Administration Nevada Site Office.
National Council on Radiation Protection and Measurements. 1999. Recommended Screening Limits for Contaminated Surface Soil and Review of Factors Relevant to Site-Specific Studies, NCRP Report No. 129. Bethesda, MD.
Nevada Administrative Code. 2006a. NAC 445A.227, “Contamination of Soil: Order by Director for Corrective Action; Factors To Be Considered in Determining Whether Corrective Action Required.” Carson City, NV. As accessed at http://www.leg.state.nv.us/nac on 4 February 2009.
Nevada Administrative Code. 2006b. NAC 445A.22705, “Contamination of Soil: Evaluation of Site by Owner or Operator; Review of Evaluation by Division.” Carson City, NV. As accessed at http://www.leg.state.nv.us/nac on 4 February 2009.
Nevada Administrative Code. 2006c. NAC 445A.2272, “Contamination of Soil: Establishment of Action Levels.” Carson City, NV. As accessed at http://www.leg.state.nv.us/nac on 4 February 2009.
UNCONTROLLED when Printed

CAU 557 CADD/CRAppendix CRevision: 0Date: May 2009Page C-12 of C-12
Nevada Bureau of Mines and Geology. 1998. Mineral and Energy Resource Assessment of the Nellis Air Force Range, Open-File Report 98-1. Reno, NV.
U.S. Department of Energy. 1993. Radiation Protection of the Public and the Environment, DOE Order 5400.5, Change 2. Washington, DC: U.S. Government Printing Office.
U.S. Department of Energy, National Nuclear Security Administration Nevada Site Office. 2006. Industrial Sites Project Establishment of Final Action Levels, Rev. 0, DOE/NV--1107. Las Vegas, NV
U.S. Department of Energy, National Nuclear Security Administration Nevada Site Office. 2008. Corrective Action Investigation Plan for Corrective Action Unit 557: Spills and Tank Sites, Nevada Test Site, Nevada, Rev. 0, DOE/NV--1277. Las Vegas, NV.
U.S. Environmental Protection Agency. 2004. Region 9 Preliminary Remediation Goals (PRGs). As accessed at http://www.epa.gov/region09/waste/sfund/prg/index.htm on 4 February 2009. Prepared by S.J. Smucker. San Francisco, CA.
UNCONTROLLED when Printed
Appendix D
Borehole and Sample Location Coordinates
UNCONTROLLED when Printed

CAU 557 CADD/CRAppendix DRevision: 0Date: May 2009Page D-1 of D-2
D.1.0 Sample Location Coordinates
Sample locations and pertinent locations of interest are shown on Figures A.3-1 through A.6-1. The
corresponding coordinates for the four CAU 557 CASs are listed Table D.1-1.
Table D.1-1Sample Location Coordinates and Locations of Interest for CAU 557
(Page 1 of 2)
Location Northing Easting Latitude Longitude
CAS 01-25-02
Site Marker 4102659.5 576684.4 37.06885 -116.13827
A01 4102660.0 576693.8 37.06885 -116.13816
CAS 03-02-02
Site Marker 4100553.4 584413.3 37.04920 -116.05157
B01 4100556.0 584411.1 37.04922 -116.05159
B02 4100556.3 584414.1 37.04923 -116.05156
B03 4100556.0 584410.4 37.04923 -116.05160
CAS 06-99-10
Site Marker 4087430.6 584543.0 36.93091 -116.05158
C01 4087431.1 584545.4 36.93091 -116.05155
CAS 25-25-18
Site Marker 4073586.6 562176.0 36.80786 -116.30385
D01 4073580.0 562176.8 36.80780 -116.30384
D02 4073584.0 562177.1 36.80784 -116.30383
D03 4073581.8 562168.6 36.80782 -116.30393
D04 4073589.3 562165.8 36.80789 -116.30396
D05 4073593.1 562151.7 36.80792 -116.30412
D06 4073583.2 562180.6 36.80783 -116.30380
D07 4073586.8 562180.9 36.80786 -116.30379
D08 4073589.0 562176.8 36.80788 -116.30384
D09 4073594.6 562170.1 36.80793 -116.30391
UNCONTROLLED when Printed

CAU 557 CADD/CRAppendix DRevision: 0Date: May 2009Page D-2 of D-2
CAS 25-25-18 (continued)
D10 4073595.1 562177.5 36.80794 -116.30383
D11 4073583.3 562163.2 36.80783 -116.30399
D12 4073590.9 562159.8 36.80790 -116.30403
D13 4073598.2 562153.3 36.80797 -116.30410
D14 4073589.6 562152.3 36.80789 -116.30411
Table D.1-1Sample Location Coordinates and Locations of Interest for CAU 557
(Page 2 of 2)
Location Northing Easting Latitude Longitude
UNCONTROLLED when Printed

Appendix E
Nevada Division of Environmental Protection Comments
(2 Pages)
UNCONTROLLED when Printed

UNCONTROLLED when Printed

UNCONTROLLED when Printed

CAU 557 CADD/CRDistributionRevision: 0Date: May 2009Page 1 of 1
Library Distribution List
Copies
U.S. Department of Energy 1 (Uncontrolled, electronic copy)National Nuclear Security AdministrationNevada Site OfficeTechnical LibraryP.O. Box 98518, M/S 505Las Vegas, NV 89193-8518
U.S. Department of Energy 1 (Uncontrolled, electronic copy)Office of Scientific and Technical InformationP.O. Box 62Oak Ridge, TN 37831-0062
Southern Nevada Public Reading Facility 2 (Uncontrolled, electronic copies)c/o Nuclear Testing ArchiveP.O. Box 98521, M/S 400Las Vegas, NV 89193-8521
Manager, Northern Nevada FFACO 1 (Uncontrolled, electronic copy)Public Reading Facilityc/o Nevada State Library & Archives100 N Stewart StreetCarson City, NV 89701-4285
UNCONTROLLED when Printed