correlation and regression correlation: “ correlation analysis deals with the association between...
TRANSCRIPT


CORRELATION:
“ Correlation analysis deals with the association between two or more variables.”
“Correlation analysis attempts to determine the ‘degree ofrelationship’ between variables.”
Types of Correlation:
1. Positive or negative2. Simple and Multiple3. Linear and Non linear.
“When two variables move in the same direction, that is when one increases the other also increases and when one decreases the other also decreases, such a relation is called positive correlation”
Example Example Typically, in the summer Typically, in the summer as the temperature increases as the temperature increases people are thirstierpeople are thirstier..
When two variables move in the different directions, that is when one increases the other decreases and when one decreases the other increases, such a relation is called negative correlation.”
Example:Demand of commodityAnd its price
When two variables change in constant proportion, it is called linear correlation
When two variables do not change in any constant proportion, the relationship is said to be non-linear correlation
Simple Correlation implies the study of relationship between two variables only. Like the relationship between price and demand
When the relationship among three or more than
three variables is studied simultaneously,
it is called multiple correlation.

StrengthStrength ofof LinearLinear AssociationAssociation
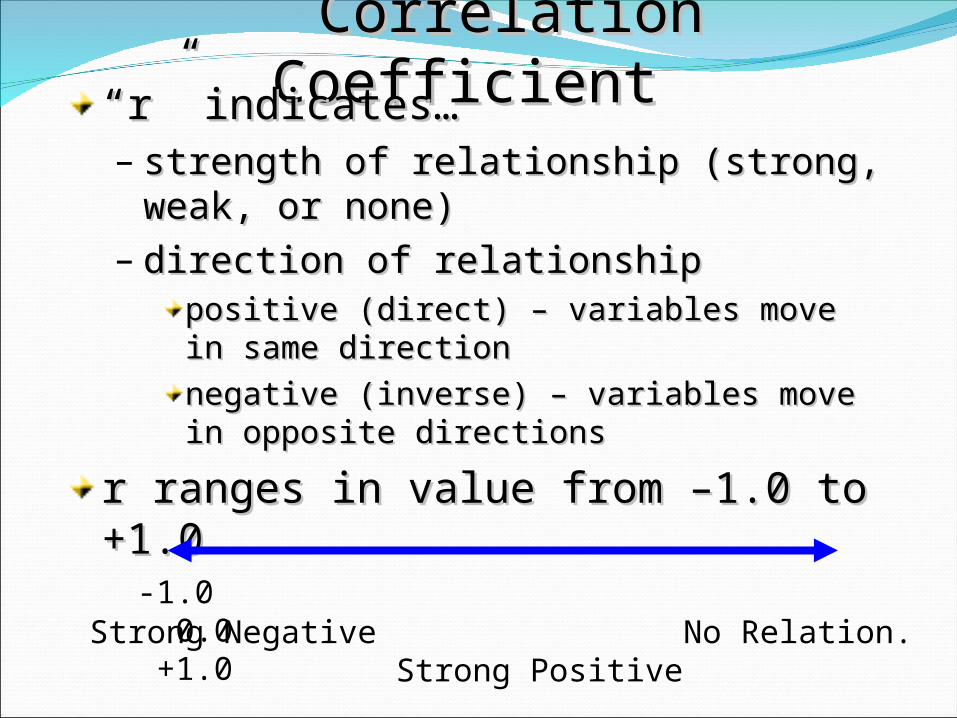
Correlation CoefficientCorrelation Coefficient““r” indicates…r” indicates…– strength of relationship (strong, weak, strength of relationship (strong, weak,
or none)or none)– direction of relationshipdirection of relationship
positive (direct) – variables move in same positive (direct) – variables move in same directiondirection
negative (inverse) – variables move in negative (inverse) – variables move in opposite directionsopposite directions
r ranges in value from –1.0 to +1.0r ranges in value from –1.0 to +1.0
Strong Negative No Relation. Strong Positive-1.0 0.0 +1.0

Degree Of Correlation:
Degree Positive Negative
Perfect +1 -1
High .75 to 1 -.75 to -1
Moderate .25 to .75 -.25 to -.75
Low 0 to +.25 0 to -.25
Zero 0 0
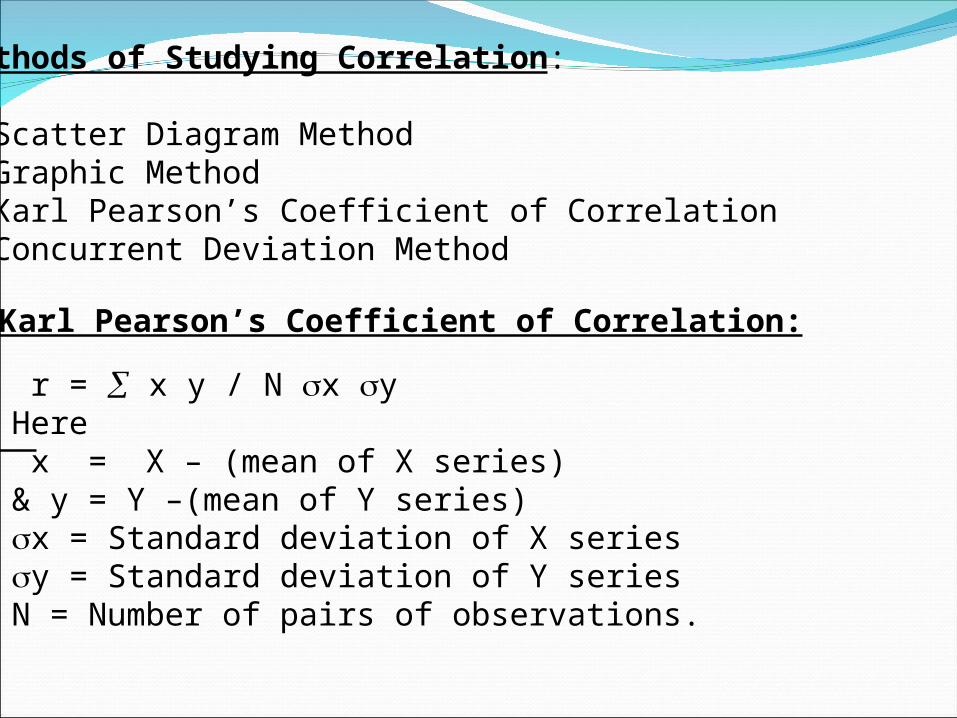
Methods of Studying Correlation:
• Scatter Diagram Method• Graphic Method• Karl Pearson’s Coefficient of Correlation• Concurrent Deviation Method
Karl Pearson’s Coefficient of Correlation:
r = x y / N x yHere x = X – (mean of X series)& y = Y –(mean of Y series)x = Standard deviation of X seriesy = Standard deviation of Y seriesN = Number of pairs of observations.
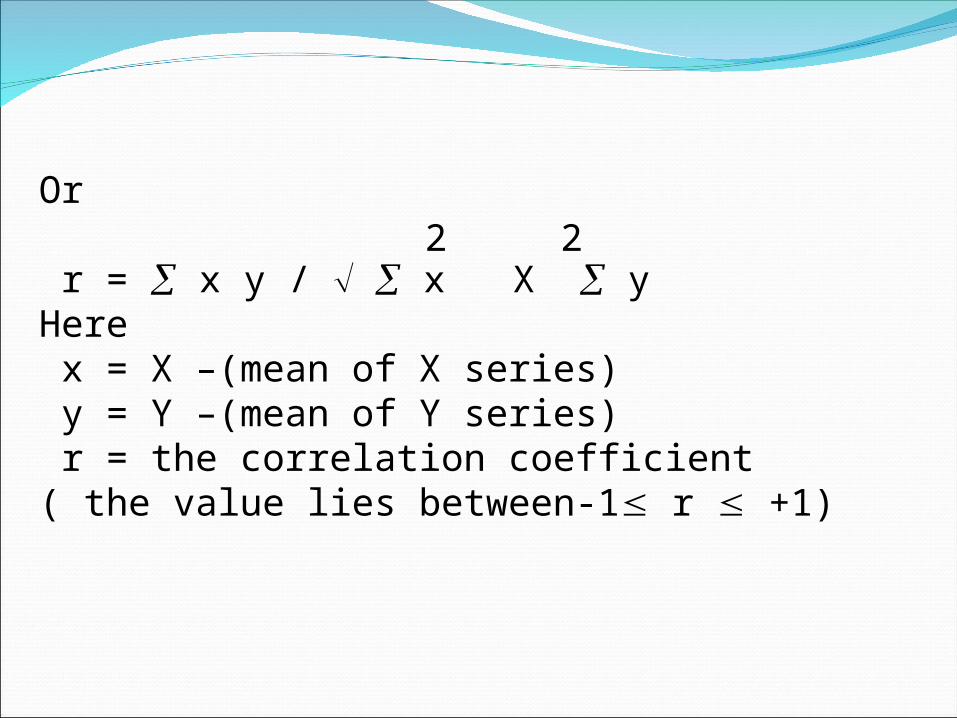
Or
r = x y / x X y Here x = X –(mean of X series) y = Y –(mean of Y series) r = the correlation coefficient ( the value lies between-1 r +1)
2 2

When deviations are taken from an assumed mean
r = N dx dy - dx dy
N dx – ( dx) N dy – (dy)2 2 2 2
Heredx = sum of deviations of X series from assumed meandy = sum of deviations of Y series from assumed meandx dy = sum of product of the deviation of X & Y series from their assumed meandx = sum of squares of the deviation of X series from
assumed mean dy = sum of squares of the deviation of Y series from
assumed mean
2
2
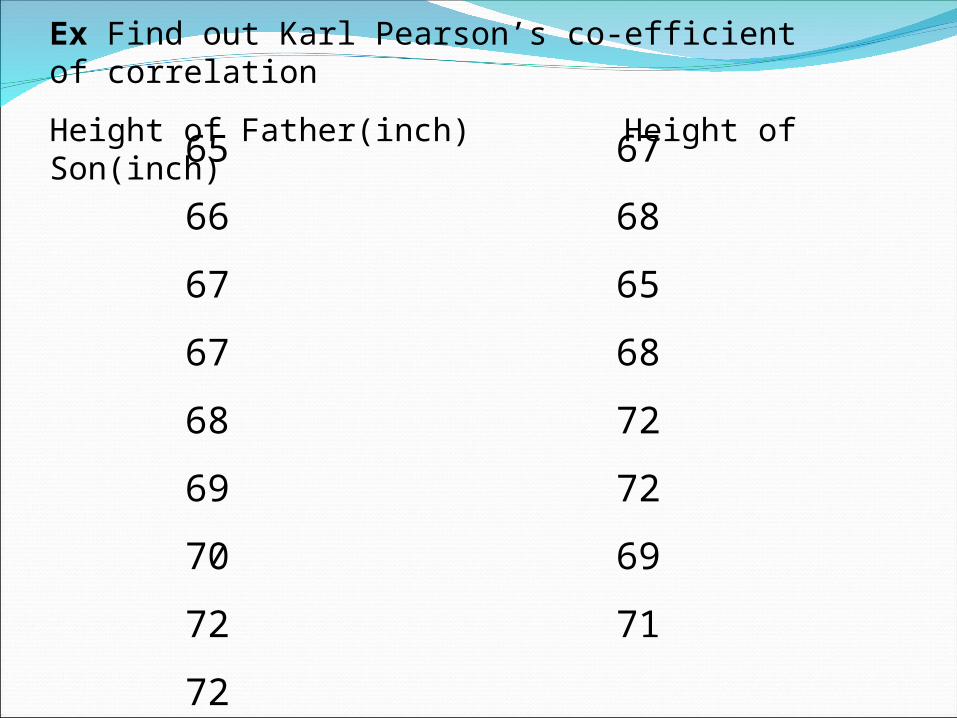
Ex Find out Karl Pearson’s co-efficient of correlation
Height of Father(inch) Height of Son(inch)
65 67
66 68
67 65
67 68
68 72
69 72
70 69
72 71
72 71

Example:Calculate the Karl Pearson’s coefficient of correlation from the following data.
Marks in accountancy : 48 35 17 23 47
Marks in Statistics : 45 20 40 25 45
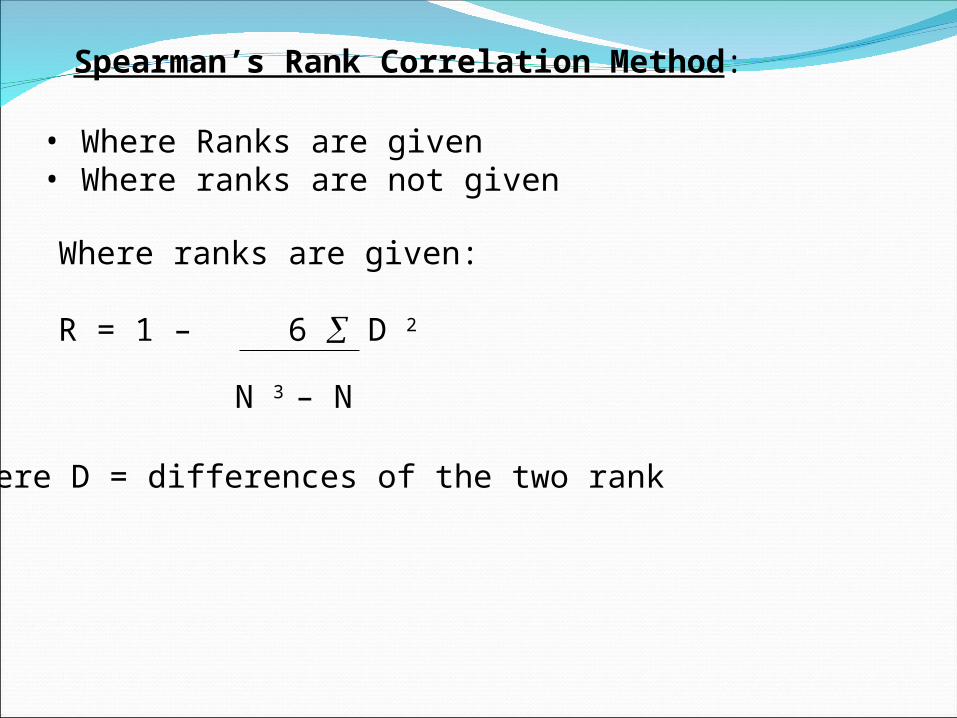
Spearman’s Rank Correlation Method:
• Where Ranks are given• Where ranks are not given
Where ranks are given:
R = 1 – 6 D 2
N 3 – N
Here D = differences of the two rank
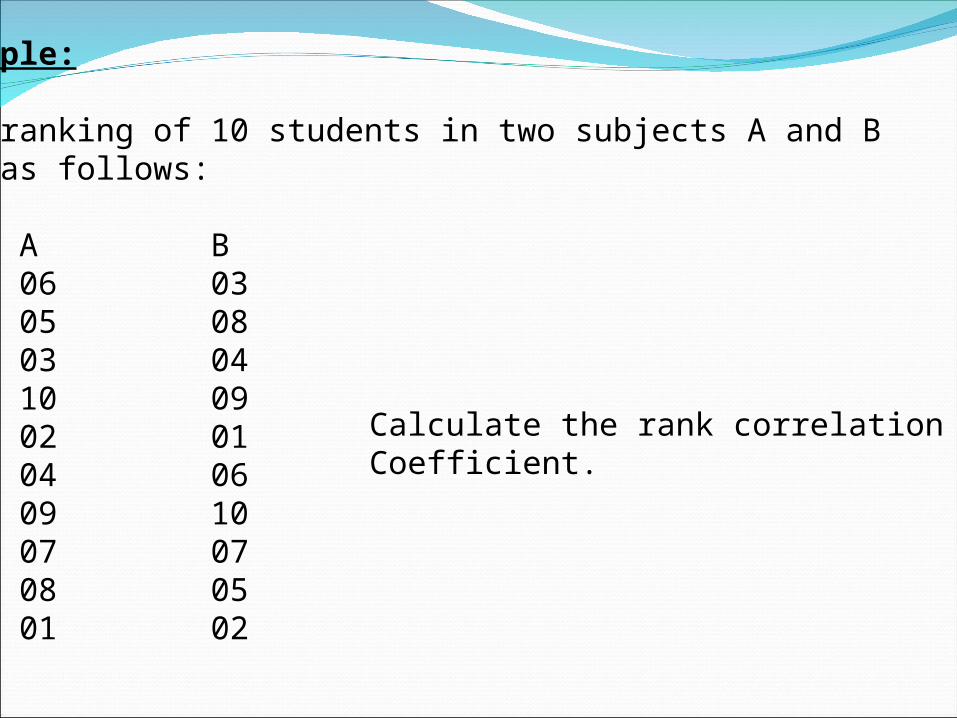
Example:
The ranking of 10 students in two subjects A and B are as follows:
A B06 0305 0803 0410 0902 0104 0609 1007 0708 0501 02
Calculate the rank correlationCoefficient.

When ranks are not given:
When we are given the actual data and not the ranks, it will be necessary to assign the ranks. Ranks can be assignedBy taking either highest value as 1 or the lowest value as 1.But whether we start with the lowest value or the highest valuewe must follow the same method in both the cases.
Example:Calculate the Spearman’s coefficient of correlation between marks assigned to 10 students by judges X and Y in a certainCompetitive test as shown below:

Marks by Judge X Marks By Judge Y
52 6553 6842 4360 3845 7741 4837 3538 3025 2527 50
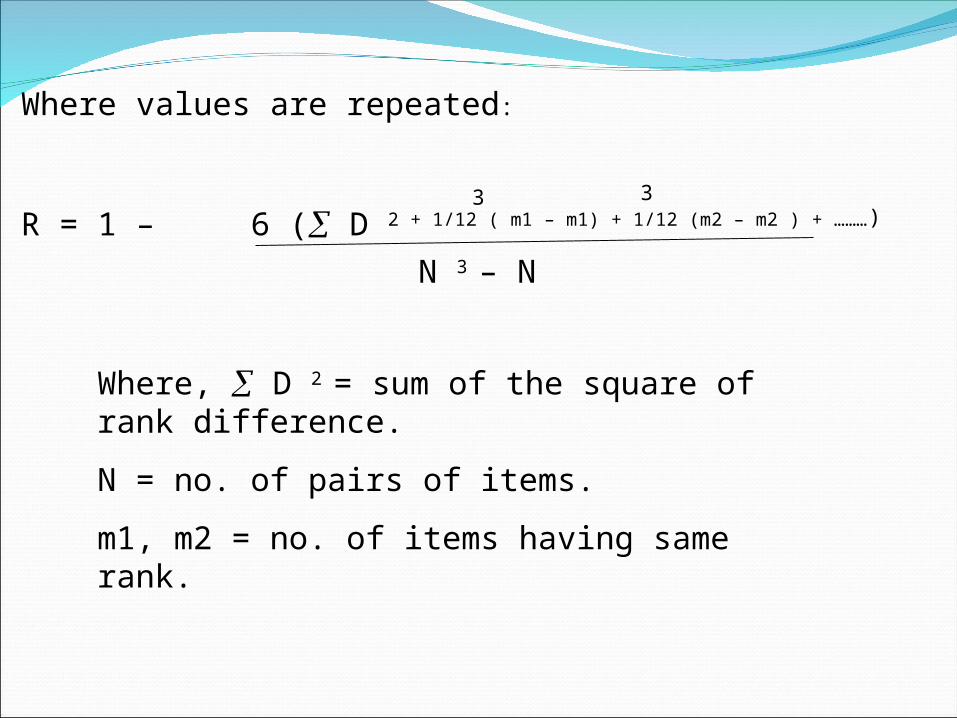
Where values are repeated:
R = 1 – 6 ( D 2 + 1/12 ( m1 – m1) + 1/12 (m2 – m2 ) + ………)
N 3 – N
3 3
Where, D 2 = sum of the square of rank difference.
N = no. of pairs of items.
m1, m2 = no. of items having same rank.
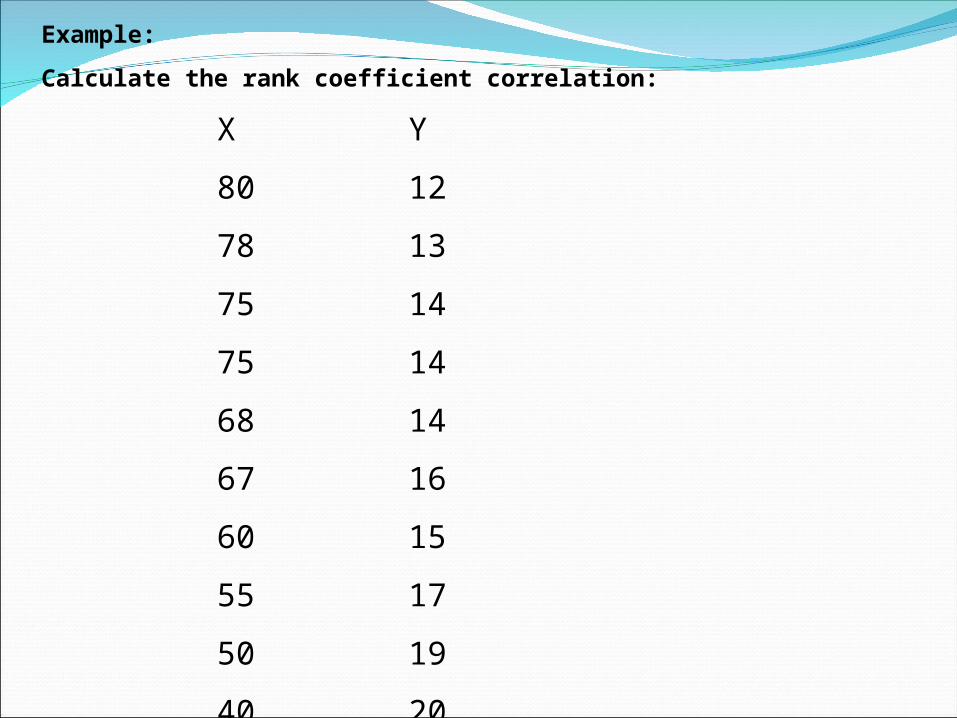
Example:
Calculate the rank coefficient correlation:
X Y
80 12
78 13
75 14
75 14
68 14
67 16
60 15
55 17
50 19
40 20
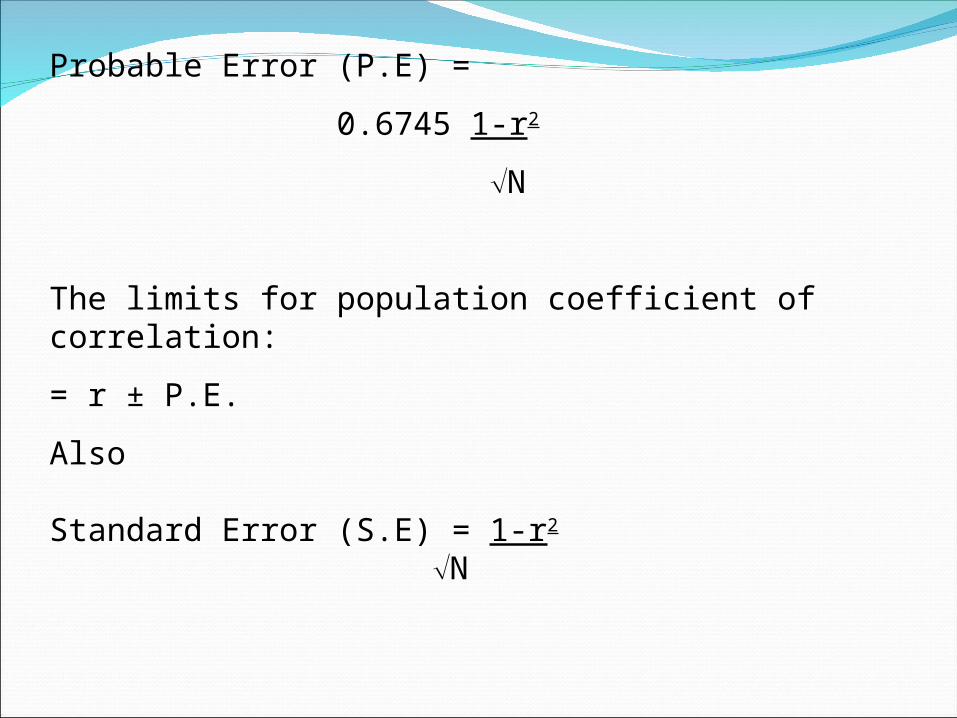
Probable Error (P.E) =
0.6745 1-r2
N
The limits for population coefficient of correlation:
= r ± P.E.
Also
Standard Error (S.E) = 1-r2
N