correlation. correlation key concepts: types of correlation methods of studying correlation a)...
TRANSCRIPT
CORRELATION
Correlation key concepts: Types of correlation Methods of studying correlation a) Scatter diagram b) Karl pearson’s coefficient of correlation c) Spearman’s Rank correlation coefficient d) Method of least squares
Correlation Correlation: The degree of relationship between the
variables under consideration is measure through the correlation analysis.
The measure of correlation called the correlation coefficient . The degree of relationship is expressed by coefficient which
range from correlation ( -1 ≤ r ≥ +1) The direction of change is indicated by a sign. The correlation analysis enable us to have an idea about the
degree & direction of the relationship between the two variables under study.
Correlation Correlation is a statistical tool that helps
to measure and analyze the degree of relationship between two variables.
Correlation analysis deals with the association between two or more variables.
Correlation & Causation Causation means cause & effect relation. Correlation denotes the interdependency among the
variables for correlating two phenomenon, it is essential that the two phenomenon should have cause-effect relationship,& if such relationship does not exist then the two phenomenon can not be correlated.
If two variables vary in such a way that movement in one are accompanied by movement in other, these variables are called cause and effect relationship.
Causation always implies correlation but correlation does not necessarily implies causation.
Types of Correlation Type I
Correlation
Positive Correlation Negative Correlation
Types of Correlation Type I Positive Correlation: The correlation is said to
be positive correlation if the values of two variables changing with same direction.
Ex. Pub. Exp. & sales, Height & weight. Negative Correlation: The correlation is said to
be negative correlation when the values of variables change with opposite direction.
Ex. Price & qty. demanded.
Direction of the Correlation
Positive relationship – Variables change in the same direction.
As X is increasing, Y is increasing As X is decreasing, Y is decreasing
E.g., As height increases, so does weight. Negative relationship – Variables change in
opposite directions. As X is increasing, Y is decreasing As X is decreasing, Y is increasing
E.g., As TV time increases, grades decrease
Indicated bysign; (+) or (-).
More examples
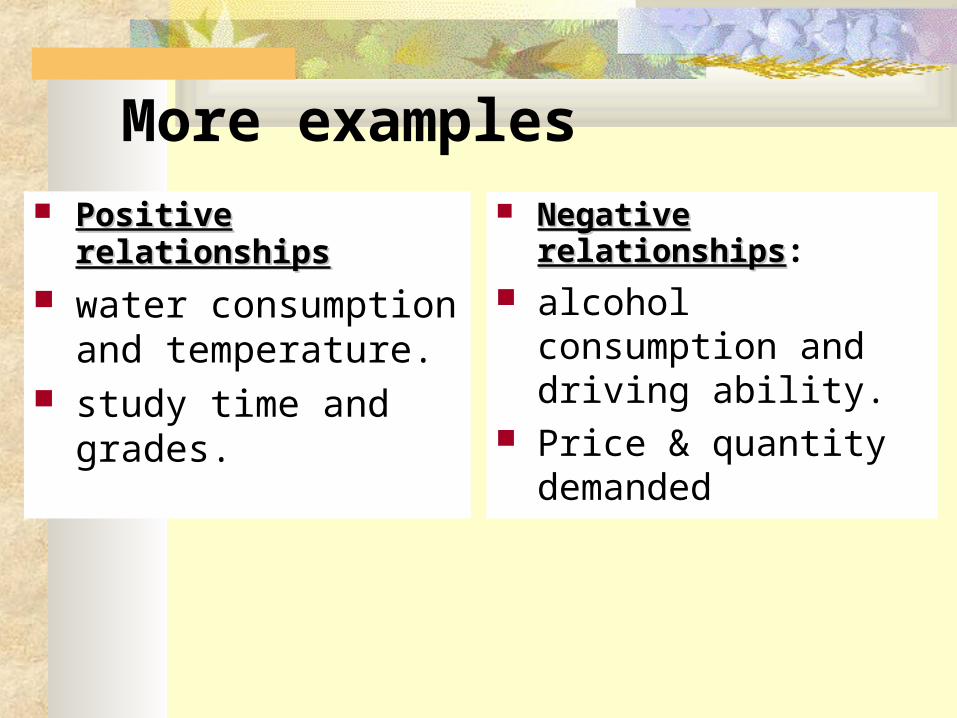
Positive relationshipsPositive relationships
water consumption and temperature.
study time and grades.
Negative relationshipsNegative relationships:
alcohol consumption and driving ability.
Price & quantity demanded
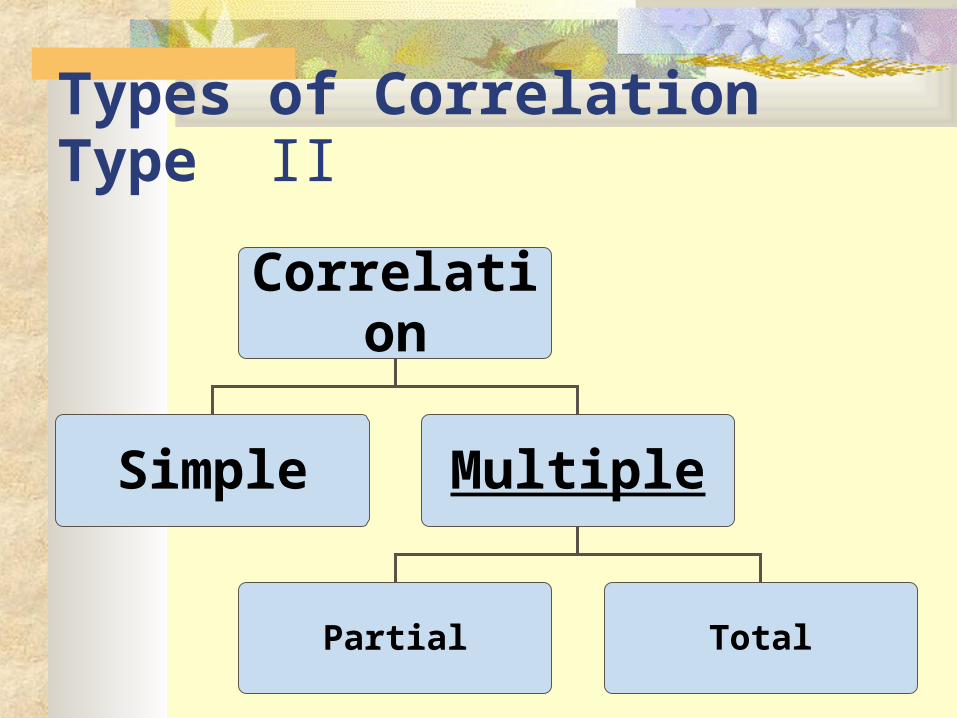
Types of Correlation Type II
Correlation
Simple Multiple
Partial Total
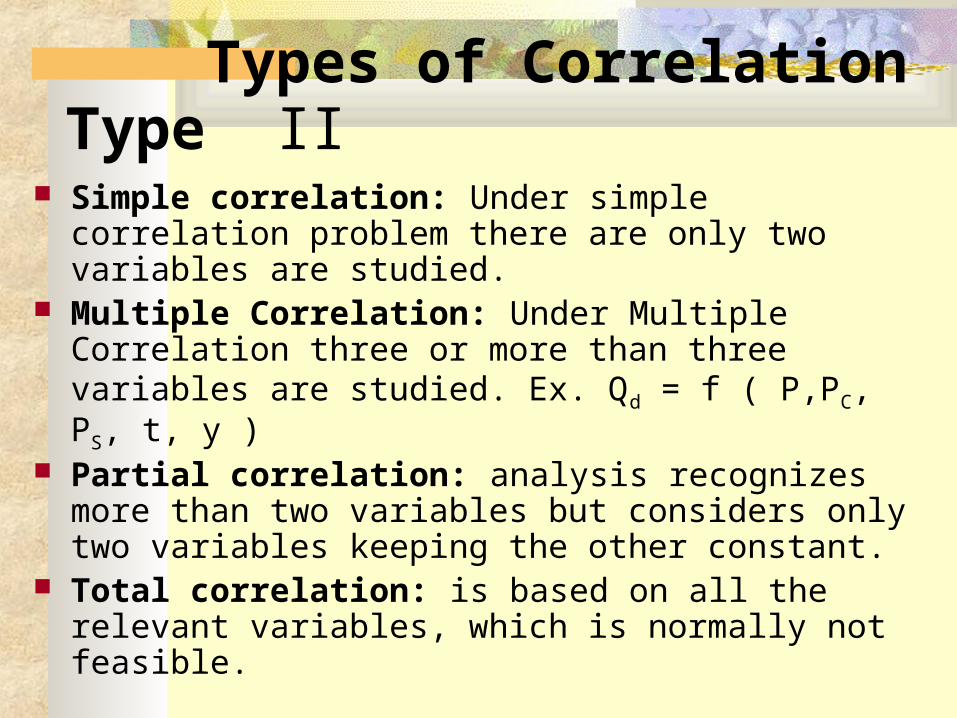
Types of Correlation Type II Simple correlation: Under simple correlation
problem there are only two variables are studied.
Multiple Correlation: Under Multiple Correlation three or more than three variables are studied. Ex. Qd = f ( P,PC, PS, t, y )
Partial correlation: analysis recognizes more than two variables but considers only two variables keeping the other constant.
Total correlation: is based on all the relevant variables, which is normally not feasible.
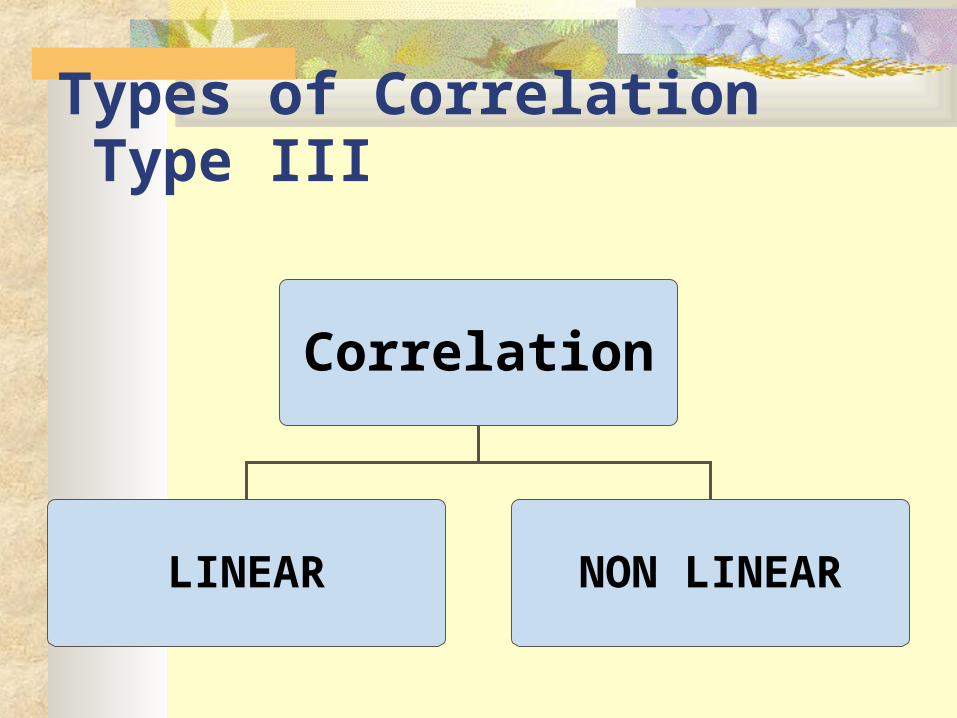
Types of Correlation Type III
Correlation
LINEAR NON LINEAR
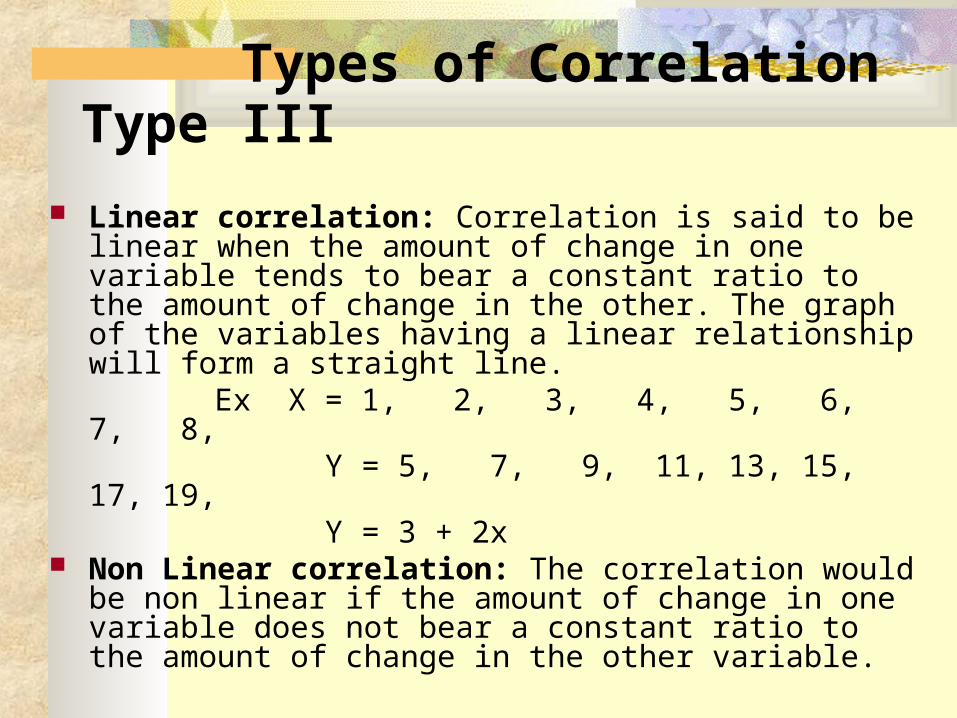
Types of Correlation Type III
Linear correlation: Correlation is said to be linear when the amount of change in one variable tends to bear a constant ratio to the amount of change in the other. The graph of the variables having a linear relationship will form a straight line.
Ex X = 1, 2, 3, 4, 5, 6, 7, 8, Y = 5, 7, 9, 11, 13, 15, 17, 19, Y = 3 + 2x Non Linear correlation: The correlation would be
non linear if the amount of change in one variable does not bear a constant ratio to the amount of change in the other variable.
Methods of Studying Correlation
Scatter Diagram Method Graphic Method Karl Pearson’s Coefficient of
Correlation Method of Least Squares
Scatter Diagram Method
Scatter Diagram is a graph of observed plotted points where each points represents the values of X & Y as a coordinate. It portrays the relationship between these two variables graphically.
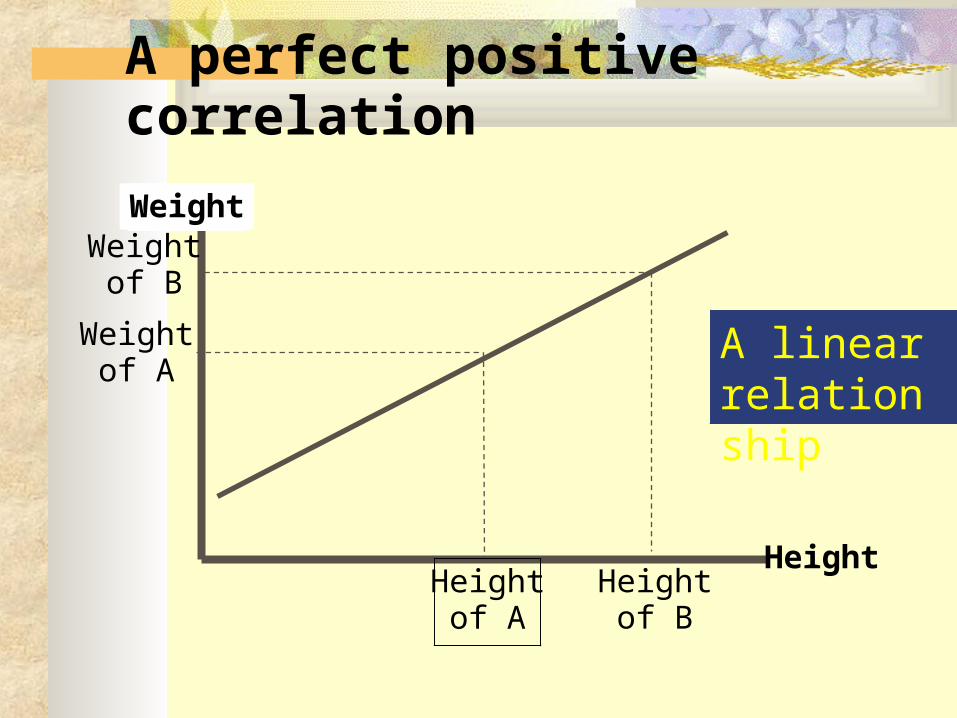
A perfect positive correlation
Height
Weight
Heightof A
Weightof A
Heightof B
Weightof B
A linearrelationship
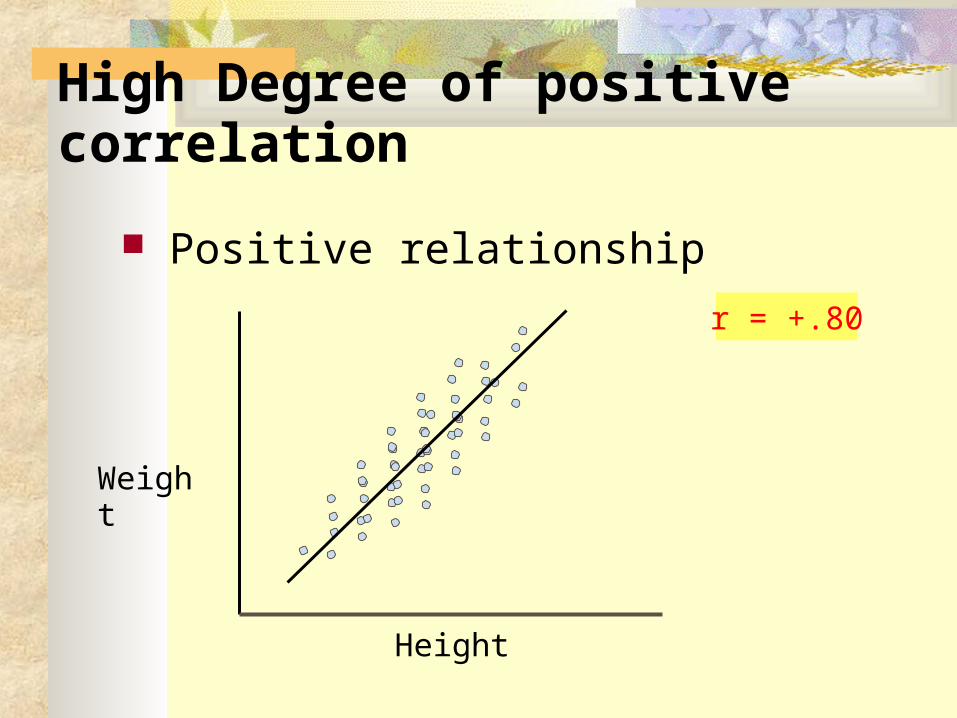
High Degree of positive correlation
Positive relationship
Height
Weight
r = +.80
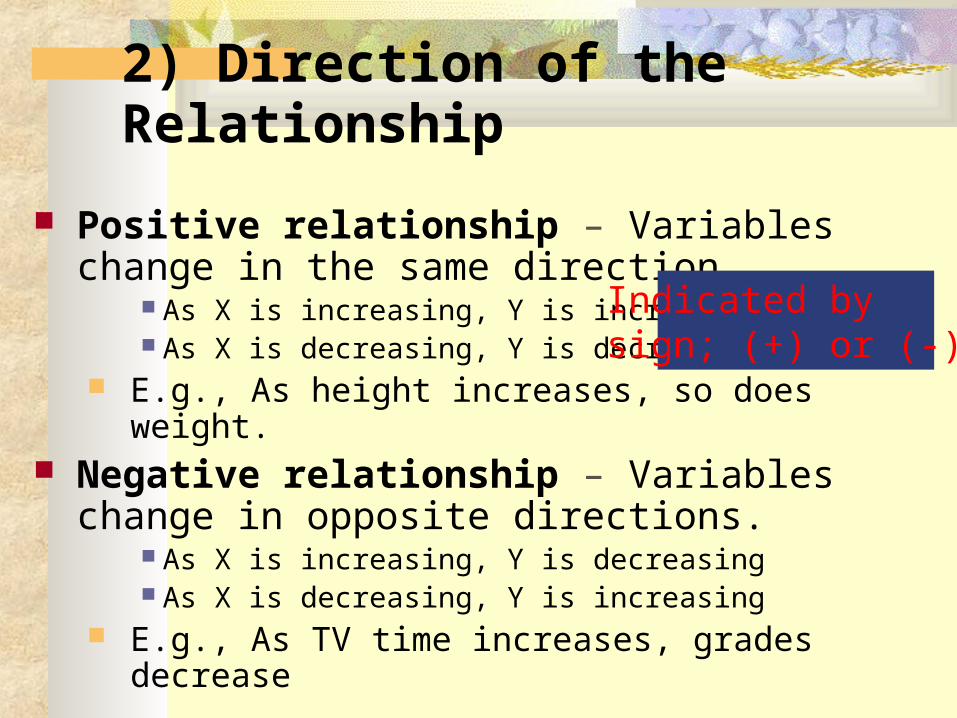
2) Direction of the Relationship
Positive relationship – Variables change in the same direction.
As X is increasing, Y is increasing As X is decreasing, Y is decreasing
E.g., As height increases, so does weight. Negative relationship – Variables change in
opposite directions. As X is increasing, Y is decreasing As X is decreasing, Y is increasing
E.g., As TV time increases, grades decrease
Indicated bysign; (+) or (-).
Karl Pearson's Coefficient of Correlation
Pearson’s ‘r’ is the most common correlation coefficient.
Karl Pearson’s Coefficient of Correlation denoted by- ‘r’ The coefficient of correlation ‘r’ measure the degree of linear relationship between two variables say x & y.
Karl Pearson's Coefficient of Correlation Karl Pearson’s Coefficient of
Correlation denoted by- r -1 ≤ r ≥ +1 Degree of Correlation is expressed by a
value of Coefficient Direction of change is Indicated by sign ( - ve) or ( + ve)
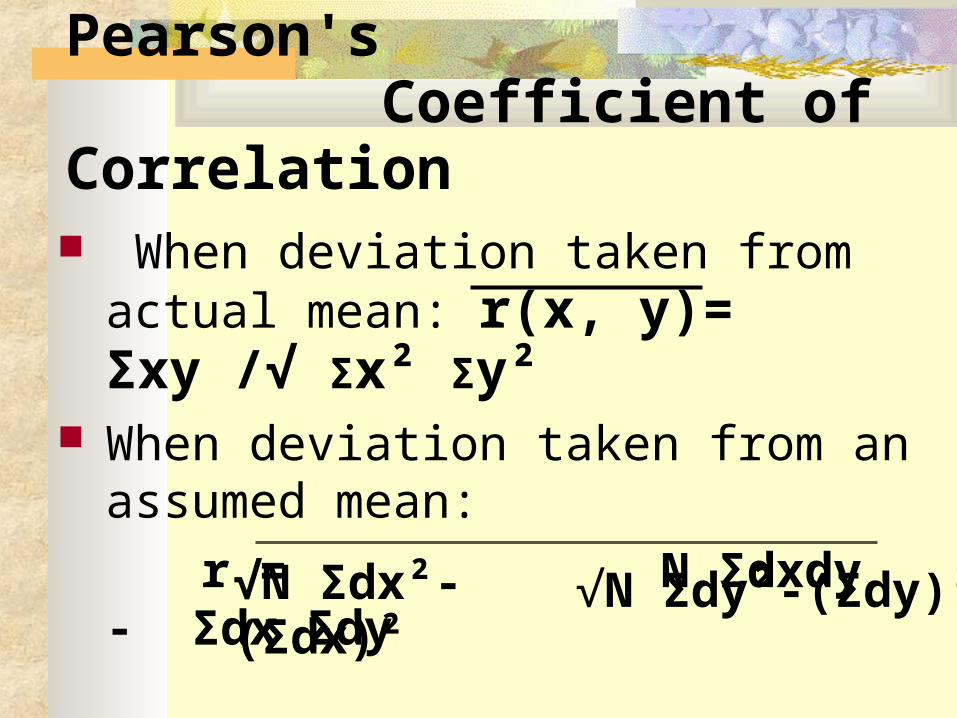
Karl Pearson's Coefficient of Correlation
When deviation taken from actual mean: r(x, y)= Σxy /√ Σx² Σy²
When deviation taken from an assumed mean:
r = N Σdxdy - Σdx Σdy
√N Σdx²-(Σdx)² √N Σdy²-(Σdy)²

Procedure for computing the correlation coefficient
Calculate the mean of the two series ‘x’ &’y’ Calculate the deviations ‘x’ &’y’ in two series from their
respective mean. Square each deviation of ‘x’ &’y’ then obtain the sum of
the squared deviation i.e.∑x2 & .∑y2 Multiply each deviation under x with each deviation under
y & obtain the product of ‘xy’.Then obtain the sum of the product of x , y i.e. ∑xy
Substitute the value in the formula.
Interpretation of Correlation Coefficient (r)
The value of correlation coefficient ‘r’ ranges from -1 to +1
If r = +1, then the correlation between the two variables is said to be perfect and positive
If r = -1, then the correlation between the two variables is said to be perfect and negative
If r = 0, then there exists no correlation between the variables
Properties of Correlation coefficient The correlation coefficient lies between -1 & +1
symbolically ( - 1≤ r ≥ 1 ) The correlation coefficient is independent of the
change of origin & scale. The coefficient of correlation is the geometric mean of
two regression coefficient.
r = √ bxy * byx
The one regression coefficient is (+ve) other regression coefficient is also (+ve) correlation coefficient is (+ve)
Advantages of Pearson’s Coefficient
It summarizes in one value, the degree of correlation & direction of correlation also.
Limitation of Pearson’s Coefficient
Always assume linear relationship Interpreting the value of r is difficult. Value of Correlation Coefficient is
affected by the extreme values. Time consuming methods
Coefficient of Determination The convenient way of interpreting the value of
correlation coefficient is to use of square of coefficient of correlation which is called Coefficient of Determination.
The Coefficient of Determination = r2. Suppose: r = 0.9, r2 = 0.81 this would mean that
81% of the variation in the dependent variable has been explained by the independent variable.
Coefficient of Determination
The maximum value of r2 is 1 because it is possible to explain all of the variation in y but it is not possible to explain more than all of it.
Coefficient of Determination = Explained variation / Total variation
Coefficient of Determination: An example
Suppose: r = 0.60
r = 0.30 It does not mean that the first correlation is twice as strong as the second the ‘r’ can be understood by computing the value of r2 .
When r = 0.60 r2 = 0.36 -----(1)
r = 0.30 r2 = 0.09 -----(2)
This implies that in the first case 36% of the total variation is explained whereas in second case 9% of the total variation is explained .
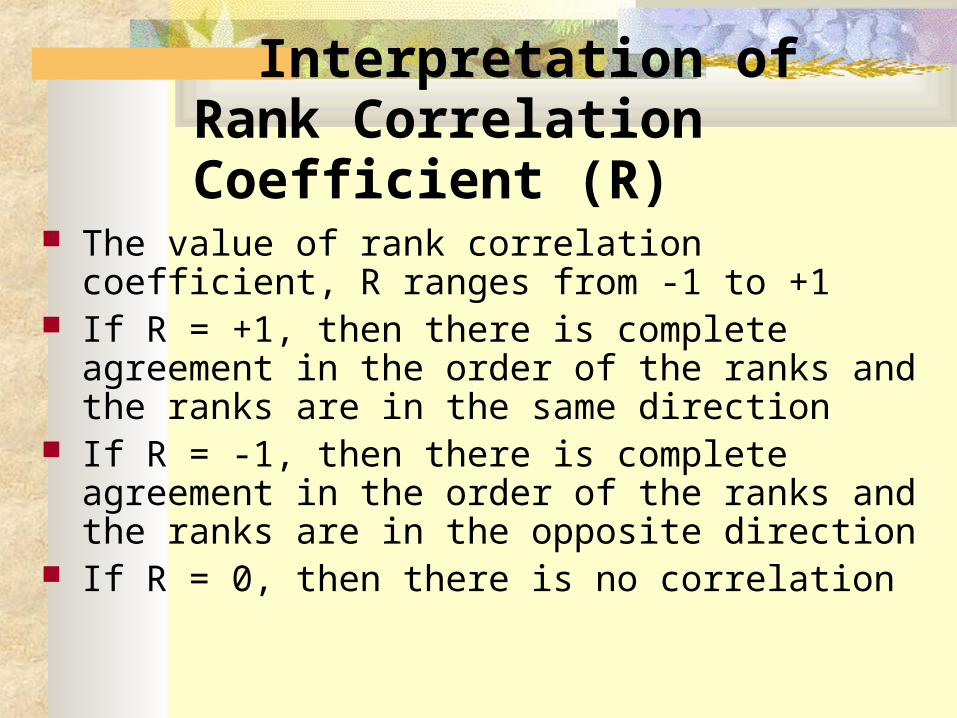
Interpretation of Rank Correlation Coefficient (R)
The value of rank correlation coefficient, R ranges from -1 to +1
If R = +1, then there is complete agreement in the order of the ranks and the ranks are in the same direction
If R = -1, then there is complete agreement in the order of the ranks and the ranks are in the opposite direction
If R = 0, then there is no correlation
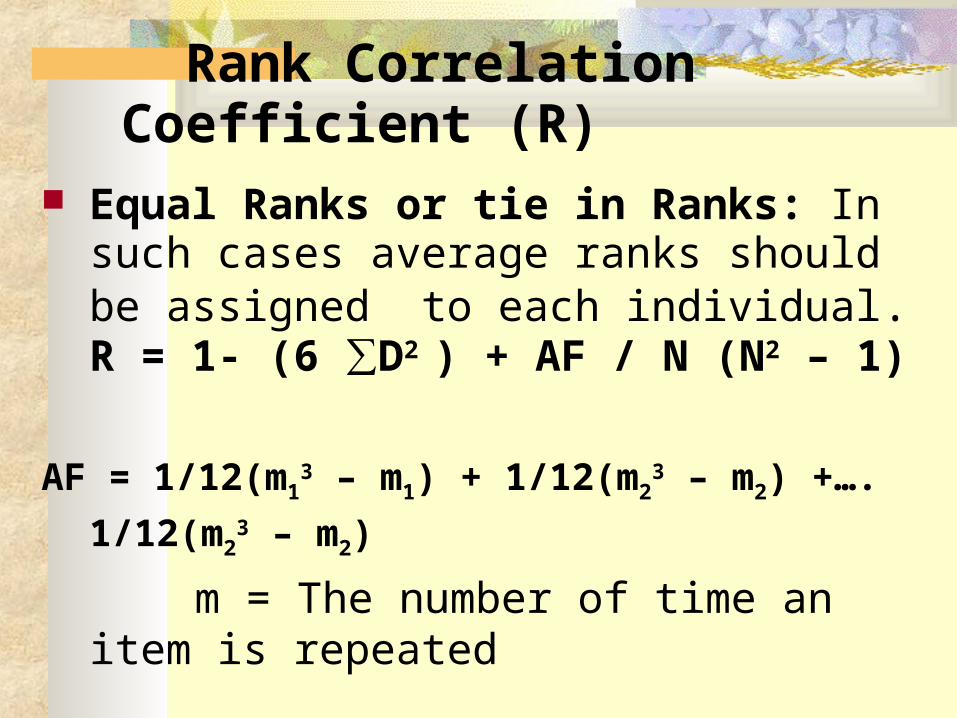
Rank Correlation Coefficient (R) Equal Ranks or tie in Ranks: In such cases
average ranks should be assigned to each individual. R = 1- (6 ∑D2 ) + AF / N (N2 – 1)
AF = 1/12(m13 – m1) + 1/12(m2
3 – m2) +…. 1/12(m23 – m2)
m = The number of time an item is repeated
Regression Analysis
Regression Analysis is a very powerful tool in the field of statistical analysis in predicting the value of one
variable, given the value of another variable, when those variables are
related to each other.
Regression Analysis
Regression Analysis is mathematical measure of average relationship between two or more variables.
Regression analysis is a statistical tool used in prediction of value of unknown variable from known variable.
Advantages of Regression Analysis Regression analysis provides estimates of
values of the dependent variables from the values of independent variables.
Regression analysis also helps to obtain a measure of the error involved in using the regression line as a basis for estimations .
Regression analysis helps in obtaining a measure of the degree of association or correlation that exists between the two variable.
What is regression? Fitting a line to the data using an equation in order
to describe and predict data Simple Regression
Uses just 2 variables (X and Y) Other: Multiple Regression (one Y and many X’s)
Linear Regression Fits data to a straight line Other: Curvilinear Regression (curved line)
We’re doing: Simple, Linear Regression
From Geometry:
Any line can be described by an equation For any point on a line for X, there will be a
corresponding Y the equation for this is y = mx + b
m is the slope, b is the Y-intercept (when X = 0) Slope = change in Y per unit change in X Y-intercept = where the line crosses the Y axis
(when X = 0)
Regression equation
Find a line that fits the data the best, = find a line that minimizes the distance from all the data points to that line
Regression Equation: Y(Y-hat) = bX + a Y(hat) is the predicted value of Y given a
certain X b is the slope a is the y-intercept
^
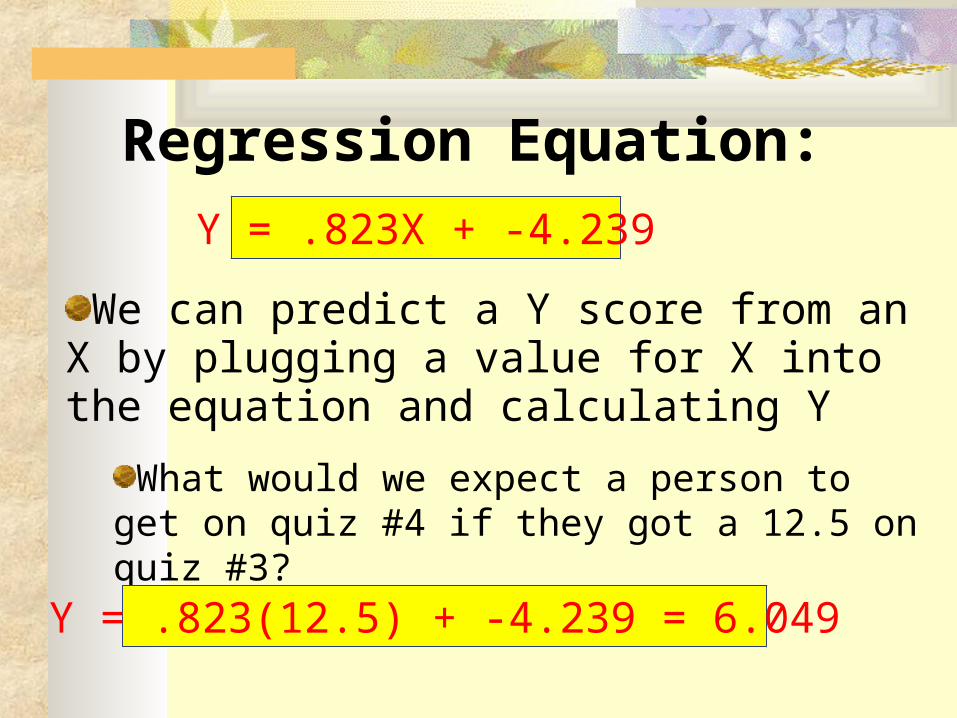
Regression Equation:
We can predict a Y score from an X by plugging a value for X into the equation and calculating Y
What would we expect a person to get on quiz #4 if they got a 12.5 on quiz #3?
Y = .823X + -4.239
Y = .823(12.5) + -4.239 = 6.049
Advantages of Correlation studies
Show the amount (strength) of relationship present Can be used to make predictions about the variables
studied Can be used in many places, including natural
settings, libraries, etc. Easier to collect correlational data