correlation the measure that one trait (or behavior) is related to another
TRANSCRIPT

CorrelationThe measure that one trait (or behavior) is related to another

Correlation Coefficient
Expressed as an “r” value that ranges from -1 to + 1Helps explain how closely two things vary together, which in turn lets
us know how well one predicts the otherIt shows the strength and direction of a relationship between variables

Types of Correlations
Correlations
No Correlation
Negative Correlation(Inverse Correlation)
Positive Correlation(Direct Correlation)
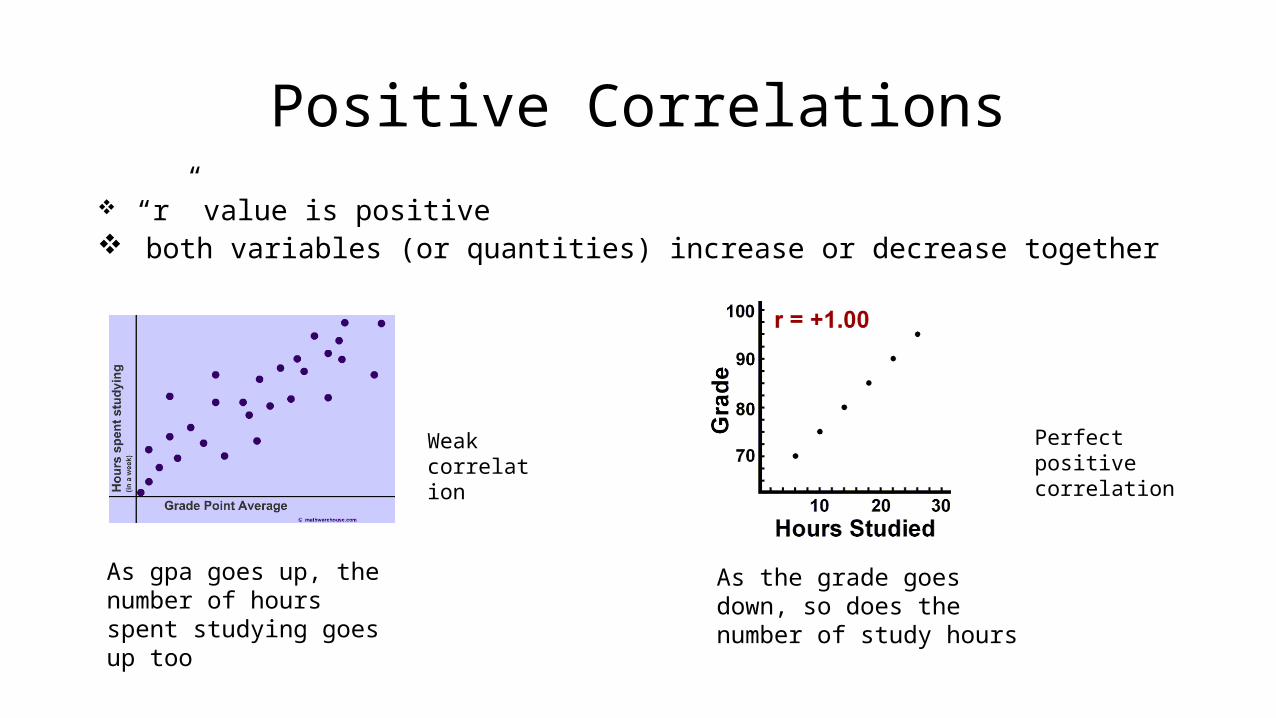
Positive Correlations
“r” value is positive both variables (or quantities) increase or decrease together
As gpa goes up, the number of hours spent studying goes up too
Weak correlation
As the grade goes down, so does the number of study hours
Perfect positive correlation

Negative Correlations “r” value is negative as one variable (or quantity) increases, the other variable decreases and vice versa.
Gpa goes down as the number of video game hours goes up
Weak negative correlation
As the grade goes up, the number of beers drank goes down
Perfect negative correlation

No Correlation
has an “r” value that is close to zero “r” values can be (+) or (-) shows a very weak association between the two variables (or
quantities)
It is almost impossible to find an appropriate “trend” in the scatterplot. When this occurs, we say that one quantity (time spent watching TV) is not a good predictor of the other quantity (size of the TV)

Finding the Correlation Coefficient
input the data into your calculator (STAT, EDIT, enter L1, L2) plot the data on your calculator
1. Turn STAT PLOT on 2. Change the WINDOW settings to match the data set3. GRAPH the data
calculate the “r value” (DIAGNOSTIC ON, STAT, CALC, 1-VAR STATS) interpret the “r” value

Interpreting the “r” value of a correlation
The closer the “r value” is to + 1 or -1, the more you can predict the effect that one quantity has on another with strong conviction. Most statisticians believe < ± 0.8 shows a weak correlation.

Example Data Set
Literacy Percent Life Expectancy
.29 42
.92 77
.52 58
.55 47
.40 48
.66 55
1. Input Data2. Graph Data on Calculator3. Calculate the “r” value
What does the “r” value say about the relationship between literacy percent and life expectancy?

The Measures of Central Tendency
Mean Median Mode
The sum of all the data divided by the number of data pieces.
The middle value when the data pieces are ranked in order from least to greatest.
The most frequently occurring number in a list of numbers… can be more than one (bi- or tri – modal).
These assign a single number to a set of data. These measures only allow us to summarize the data we have. No conclusions can be made beyond the data.

Calculating Mean, Median, and Mode
1. Input data into calculator (STAT, EDIT, L1,L2)
2. Calculate the values (STAT, CALC, 1-Var STATS)
Mean = Median = MedMode = find it visually from list
Mean =
Median = Mode =
Mean =
Median = Mode =

Measures of Spread
Variance (
How similar or diverse the data points are
Averages derived from scores with low variability are more reliable than
averages based on high variability
Standard Deviation()
Measure of how much scores vary around the mean score.
Better gauge of whether scores are packed together or dispersed
If a group of scores has a small standard deviation, then you can
draw more stable conclusions from the data set

Calculating Standard Deviation
the sum ofx = each individual term = the mean n = number of terms in the set

The Bell Curve Large sets of data often form a symmetrical, bell-shaped distribution
THE NORMAL CURVE

Interpretting the Bell Curve
68% of the data fall within 1 standard deviation from the mean 95% of the data fall within 2 standard deviations from the mean 99.7% of the data fall within 3 standard deviations from the mean

UNEVEN/SKEWED DISTRIBUTIONS
The Bell Curve or Normal Curve
Skewed Right most data is less than the mean
Skewed leftmost data is more than the mean

SKEWED RIGHT
A distribution that is skewed right, means that the tail extends to the right.
MEAN > MEDIAN
Example: 1,1,1,2,2,3,5,12, 17
What would cause this to happen?

SKEWED LEFT
A distribution that is skewed left, means that the tail extends to the left.
MEAN < MEDIAN
Example: Suppose a person is buying a house in Boulder County and asks you what houses typically cost. Would a mean or median be a better quote to state to the person?

Interpretting Intelligence using Normal Curve
What is the probability that a random person scores less than 115 on the intelligence test?
P(<115) = 34% + 34% + 14% + 2% +.1% = 84.1%

Calculating a Z-Score
𝑧=𝑥−𝑥𝜎
The normal curve is standardized by assigning 0 to the mean and ±1 to 1 standard deviation, ±2 for 2 standard deviations, etc. This allows us to see what slice of the normal curve a piece of data fits in as a percentage.

UNDERSTANDING THE Z SCORE
Suppose a person scores a 112 on an intelligence test. The mean score was 100 with a standard deviation of 15.
Because it is +0.8 it lies in the 34% slice to the right of zero. This means they scored 84% better than the othersthat took the same test.