correlations between dnom characteristics and key ...folk.uio.no/rvogt/cv/presentations/11th int...
TRANSCRIPT

1
Correlations between DNOM characteristics and key descriptive
parameters of the watershed
Rolf D. Vogt, Dag Olav Andersen, Tone Gadmar, Egil Gjessing, Gudrun Abbt-Braun, Jarkko Akkanen, Jim Alberts, Peter Blaser, Jussi Kukkonen, Jörg Luster, Andrea Paul,
Stephan Pflugmacher, Christian Steinberg, Monika Takacs and Ádám Zsolnay
Funded by

2
Parameter interpretation
Functional characteristics are not intuitively deduced from simple bulk chemical and structural parameters Lack of comparable data due to:
Large number of Isolation techniques Sample collection and pre-treatment alter DNOM's bio-physico-chemical characteristics
Conditional K’ rather than K
Temporal and spatial variation
Approach: Provide a set of DNOM material, isolated in the same way, to the scientific community and compile their data

3
DNOM material:Reverse Osmosis (RO) isolation
Methods
Isolated 500 - 1100L spring and fall surface water sample
Ionexchanged Me2+ for Na+
Up concentrated to 25LRota-Evaporated Freeze dried
Recovery of 85-90%
Represent a non-labile DNOM material enabling multi-dimensional characterisation and thereby parameter comparison

4
Site characteristicsSpan a large range in anthropogenic deposition, climate and size
All sites are similar in that they are dominated by:
Unmanaged coniferous forests (Norway spruce or Pine) with heather on
Podzolic soils & Histosols on
Gneiss or granite bedrock
Parameter Min Max
Tot S (g S/m2/y) 0.3 0.9Latitude 58.23 63.10Growing season (days) 102 180Precipitation (mm) 592 2500Size (ha) 6.2 464Volume (106 m3) 0 2.9Retention time (yr) 0 1.5Peat (%) 17 35

5
Water chemistryLarge span in water chemistry
All low ionic strength and oligothrophic
Parameter min max
H+ (µM) 0.38 37.0
Ca2+ (µeq/L) 9.1 118TOC (mg C/L) 3.6 19Total Al (µM) 0.5 15Si (µM) 13.6 92Conductivity (mS/m) 1.48 3.74

6
Methods
sUVa & SAR
SAR
468
101214161820
0.1 1 10 100 1000
mg C/L
Abs
254
/600
sUVa
3
4
5
6
7
0.1 1 10 100 1000
mg C /L
Abs
254
/ mg
C
cmEcmE
SARnm
nm
600
254
=
mmgL
LCmg
cmE
sUVanm
=⋅
=100254
sUVa: UV-adsorbing functional groups relative to total carbon SAR: UV-adsorbing functional groups relative to large coloured NOM compounds
UV adsorbing functional groups: Aromatic, Carbonylic and Carboxylic
Parameters varies with concentration..

7
Fluorescence emission spectrum (FES) – acidification effect
Parameter value at pH 2- pH2
Humification Index (RkH / RkL)HIX
effect of pH change to pH2(pH)
Relative fluor. emission in redderregion, more condensed material
RkH
Relative fluor. emission in bluer region, less condensed material
RkL
Fluorescence Efficiency (AU cm)SFE
relative fluor. emissionRkSF
Description
A. Zsolnay

8
2D-Total Luminescence spectra (TLS)
Methods
Relative fluorenscingIntensities (RFI) of peaks give the proportion of compounds
RFI-ASimple phenolic compounds
Phenolic
CAromatic
A
HumifiedB
RFI-CHighly conjugated aromatic compounds
RFI-BHumified material
Jörg Luster and Monika Takacs
9
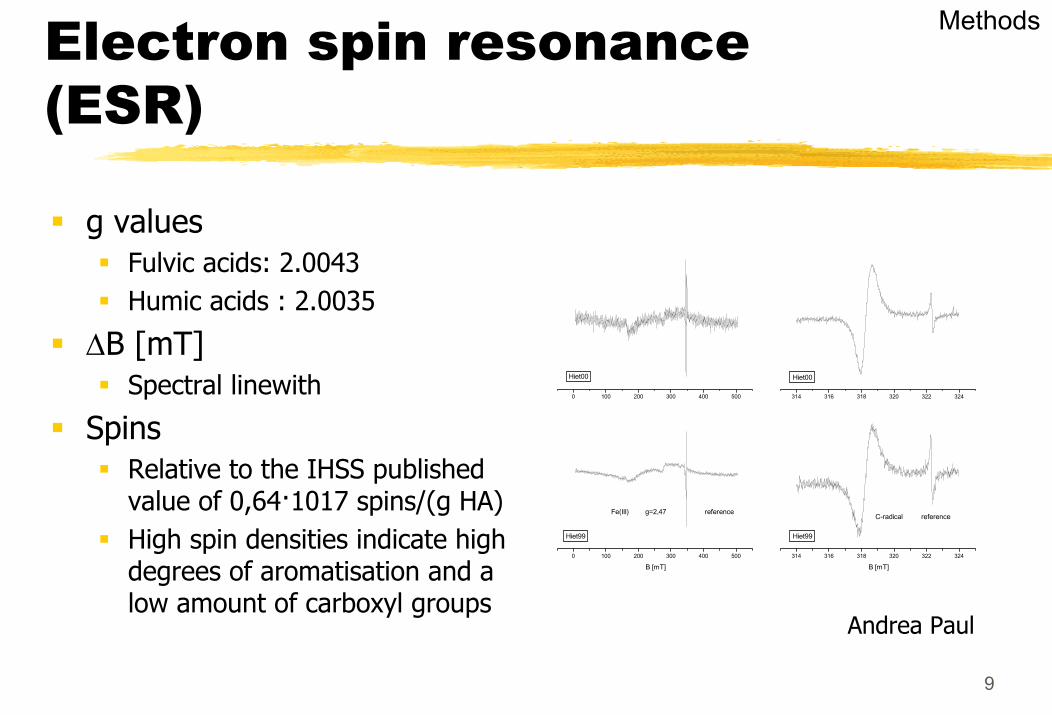
Electron spin resonance (ESR)
Methods
g valuesFulvic acids: 2.0043Humic acids : 2.0035
∆B [mT]Spectral linewith
SpinsRelative to the IHSS published value of 0,64·1017 spins/(g HA)High spin densities indicate high degrees of aromatisation and a low amount of carboxyl groups
0 100 200 300 400 500 314 316 318 320 322 324
0 100 200 300 400 500 314 316 318 320 322 324
Hiet00
Hiet00
Fe(III) g=2,47 reference
B [mT]
Hiet99
C-radical reference
B [mT]
Hiet99
Andrea Paul

10
13C-Nuclear Magnetic Resonance (NMR)
The main difference between the sites lie in the relative amounts of Carbohydrates and Aromatic compounds
Carbonyl: 228 – 190ppmCarboxyl: 190 – 155ppmAromatic: 155 – 99ppmCarbohyd.: 99 – 64ppmAliphatic: 64 – 5ppm

11
Methods
Amino acids
0
10
20
30
40
50
60
Fall
Spr
ing
Fall
Spr
ing
Fall
Spr
ing
Fall
Spr
ing
Fall
Spr
ing
Hietajärvi Valkea-Kotinen
Svartberget Birkenes Skjervatern
µg A
A/ m
g DO
C
Amino acids after acid hydrolysis.
Gudrun Abbt-Braun

12
Methods
DOC fractions
0%
25%
50%
75%
100%
Bir
Fall
Sprin
g
Val
Fal
l
Sprin
g
Hie
Fal
l
Sprin
g
Sva
Fal
l
Sprin
g
Skj
Fall
Sprin
g
HPI-N
HPI-B
HPI-A
HPO-Ph
HPO-N
HPO-B
HPO-A
Fractionation into Hydrophobic and Hydrophilic -acid, -bases, -neutrals and -phenolic fractions
Large variation between seasons and sites
13
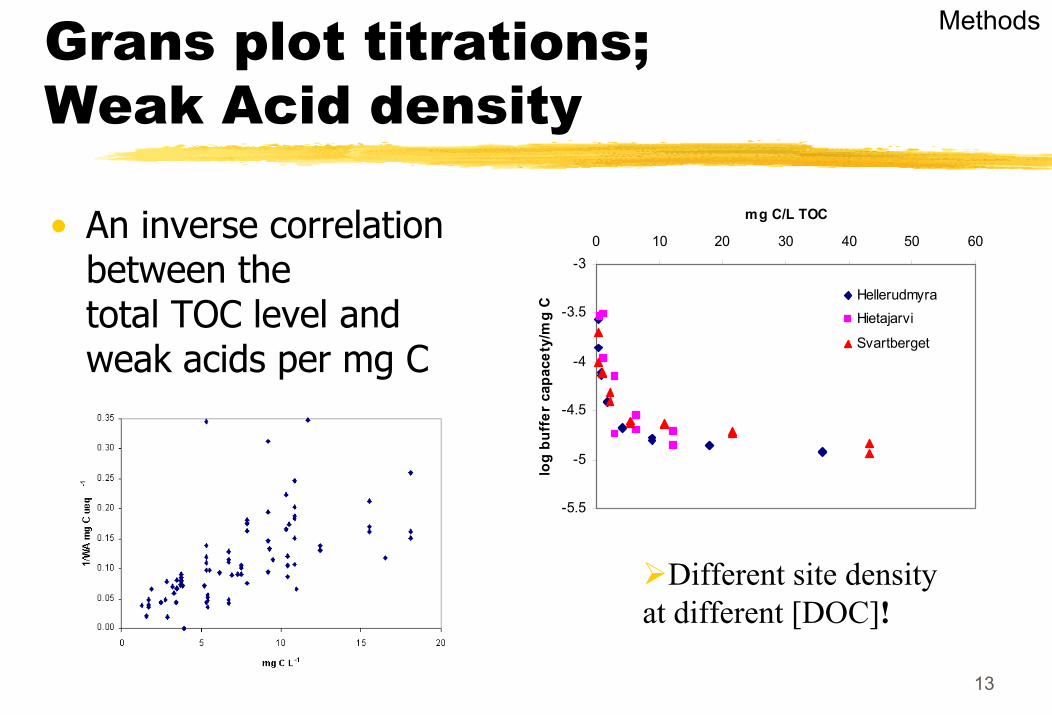
Grans plot titrations; Weak Acid density
Methods
-5.5
-5
-4.5
-4
-3.5
-30 10 20 30 40 50 60
mg C/L TOC
log
buff
er c
apac
ety/
mg
C HellerudmyraHietajarvi
Svartberget
• An inverse correlation between the total TOC level and weak acids per mg C
Different site density at different [DOC]!

14
Partitioning coefficients (KD)of micro pollutants
Methods
B(a)Ppartition coefficients for benzo[a]pyrene
TCBpartition coefficients for 3,3’,4,4’-tetrachlorobiphenyl
Pyrenepartition coefficients for pyrene
0
1
2
3
4
5
6
Fall Spring Fall Spring Fall Spring Fall Spring Fall Spring
Hietajärvi Valkea-Kotinen
Svartberget Birkenes Skjervatjern
KDO
C x
10E
-4
0510152025303540
KDO
C x
10E
-4 B
(a)P
Pyrene
TCB
B[a]P
Jarkko Akkanen and Jussi Kukkonen

15
Methods
Algae response
PS; Photosynthetic oxygen production
Low PS indicate that the plant has serious stress
POD; Peroxidase, ROS enzyme
High POD indicate that the plant has to deal with reactive oxygen species, which might be a by-product of de-toxicationmetabolism. ROS can make serious damages e.g. to DNA
Christian Steinberg and
Stephan Pflugmacher
16
Results
Disclaimer
Correlation Does Not Imply CausationCorrelations may
be fortuitous due to the limited number (N=10) of samples be due to a co-variation with a third parameter
This is especially the case regarding the site characteristics, as many of these parameters are inherently correlated
This presentation therefore only suggests possible conceptual links between correlated parameters

17
Water quality vs. DNOM characteristics
Results
Increased Nitrate correlated with more aromatisation (ESR spin)
Water chemistry
NOM characteristics r
Conductivity SpinsESR -0.870PODAlgal respons -0.810g-valueESR -0.810
Ca2+ Density -0.822HPI-N 0.935SpinsESR 0.836
total Al RFI-ATLS 0.925HPI-A 0.805RkH-pH2FES 0.940psESR -0.940AliphaticNMR -0.875WA density -0.910
H+
NO3--RO
Silicate

18
Water quality vs. DNOM characteristics
Results
Increased Nitrate correlated with more aromatisation (ESR spin) Increase in the Phenolic peak intensity (RFI-A) with increased Al is characteristic for the formation of Al complexes with DNOMLuster et al.1996
Water chemistry
NOM characteristics r
Conductivity SpinsESR -0.870PODAlgal respons -0.810g-valueESR -0.810
Ca2+ Density -0.822HPI-N 0.935SpinsESR 0.836
total Al RFI-ATLS 0.925HPI-A 0.805RkH-pH2FES 0.940psESR -0.940AliphaticNMR -0.875WA density -0.910
H+
NO3--RO
Silicate

19
Water quality vs. DNOM characteristics
Results
Increased Nitrate correlated with more aromatisation (ESR spin) Increase in the Phenolic peak intensity (RFI-A) with increased Al is characteristic for the formation of Al complexes with DNOMLuster et al.1996
Several DNOM characteristics are correlated to Silicate, possiblyreflecting the influence of a oligothrophic/dystrophic gradient of the water source.
Water chemistry
NOM characteristics r
Conductivity SpinsESR -0.870PODAlgal respons -0.810g-valueESR -0.810
Ca2+ Density -0.822HPI-N 0.935SpinsESR 0.836
total Al RFI-ATLS 0.925HPI-A 0.805RkH-pH2FES 0.940psESR -0.940AliphaticNMR -0.875WA density -0.910
H+
NO3--RO
Silicate

20
Results
Collective properties vs. Structural characteristics
rHIX-pH2FES 0.925SFE(pH)FES -0.806
Abs254nm TOC 0.975PyreneKD -0.929SFEFES 0.844RkL-pH2FES -0.837∆B[mT]ESR 0.881SFEFES -0.821RFI-ATLS 0.871WA density 0.837
RkH(pH)FES WA density 0.815C:N SFE-pH2FES -0.847
RkL-pH2FES 0.844Aminoacid 0.830
HPI-B SpinsESR 0.811HPO-A RkL(pH)FES 0.819HPO-B RkL-pH2FES -0.900HPO-Ph RkL(pH)FES -0.901WA density %C -0.802RFI-BTLS SFEFES 0.826RkL-pH2FES Aminoacid 0.813
Ko/w
UV Abs(pH)
NOM characteristics
H+-RO
sUVa
SAR-RORelative more Humified material (HIX) appears to generate a more acid solution(H+-RO)

21
Results
Collective properties vs. Structural characteristics
rHIX-pH2FES 0.925SFE(pH)FES -0.806
Abs254nm TOC 0.975PyreneKD -0.929SFEFES 0.844RkL-pH2FES -0.837∆B[mT]ESR 0.881SFEFES -0.821RFI-ATLS 0.871WA density 0.837
RkH(pH)FES WA density 0.815C:N SFE-pH2FES -0.847
RkL-pH2FES 0.844Aminoacid 0.830
HPI-B SpinsESR 0.811HPO-A RkL(pH)FES 0.819HPO-B RkL-pH2FES -0.900HPO-Ph RkL(pH)FES -0.901WA density %C -0.802RFI-BTLS SFEFES 0.826RkL-pH2FES Aminoacid 0.813
Ko/w
UV Abs(pH)
NOM characteristics
H+-RO
sUVa
SAR-RORelative more Humified material (HIX) appears to generate a more acid solution(H+-RO)The less UV-absorbing functional groups compared to the coloured ones (SAR), the greater the materials ability is to bind PAH

22
Results
Collective properties vs. Structural characteristics
rHIX-pH2FES 0.925SFE(pH)FES -0.806
Abs254nm TOC 0.975PyreneKD -0.929SFEFES 0.844RkL-pH2FES -0.837∆B[mT]ESR 0.881SFEFES -0.821RFI-ATLS 0.871WA density 0.837
RkH(pH)FES WA density 0.815C:N SFE-pH2FES -0.847
RkL-pH2FES 0.844Aminoacid 0.830
HPI-B SpinsESR 0.811HPO-A RkL(pH)FES 0.819HPO-B RkL-pH2FES -0.900HPO-Ph RkL(pH)FES -0.901WA density %C -0.802RFI-BTLS SFEFES 0.826RkL-pH2FES Aminoacid 0.813
Ko/w
UV Abs(pH)
NOM characteristics
H+-RO
sUVa
SAR-RORelative more Humified material (HIX) appears to generate a more acid solution(H+-RO)The less UV-absorbing functional groups compared to the coloured ones (SAR), the greater the materials ability is to bind PAHsUVa is negatively related to relative less condensed material (RkL)

23
Results
Collective properties vs. Structural characteristics
rHIX-pH2FES 0.925SFE(pH)FES -0.806
Abs254nm TOC 0.975PyreneKD -0.929SFEFES 0.844RkL-pH2FES -0.837∆B[mT]ESR 0.881SFEFES -0.821RFI-ATLS 0.871WA density 0.837
RkH(pH)FES WA density 0.815C:N SFE-pH2FES -0.847
RkL-pH2FES 0.844Aminoacid 0.830
HPI-B SpinsESR 0.811HPO-A RkL(pH)FES 0.819HPO-B RkL-pH2FES -0.900HPO-Ph RkL(pH)FES -0.901WA density %C -0.802RFI-BTLS SFEFES 0.826RkL-pH2FES Aminoacid 0.813
Ko/w
UV Abs(pH)
NOM characteristics
H+-RO
sUVa
SAR-RORelative more Humified material (HIX) appears to generate a more acid solution(H+-RO)The less UV-absorbing functional groups compared to the coloured ones (SAR), the greater the materials ability is to bind PAHsUVa is negatively related to relative less condensed material (RkL)pH effect on UV absorbance and on the relative condensity (RkH(pH)) is positively related to Weak Acid site density (WA density)

24
Results
Collective properties vs. Structural characteristics
rHIX-pH2FES 0.925SFE(pH)FES -0.806
Abs254nm TOC 0.975PyreneKD -0.929SFEFES 0.844RkL-pH2FES -0.837∆B[mT]ESR 0.881SFEFES -0.821RFI-ATLS 0.871WA density 0.837
RkH(pH)FES WA density 0.815C:N SFE-pH2FES -0.847
RkL-pH2FES 0.844Aminoacid 0.830
HPI-B SpinsESR 0.811HPO-A RkL(pH)FES 0.819HPO-B RkL-pH2FES -0.900HPO-Ph RkL(pH)FES -0.901WA density %C -0.802RFI-BTLS SFEFES 0.826RkL-pH2FES Aminoacid 0.813
Ko/w
UV Abs(pH)
NOM characteristics
H+-RO
sUVa
SAR-RORelative more Humified material (HIX) appears to generate a more acid solution(H+-RO)The less UV-absorbing functional groups compared to the coloured ones (SAR), the greater the materials ability is to bind PAHsUVa is negatively related to relative less condensed material (RkL)pH effect on UV absorbance and on the relative condensity (RkH(pH)) is positively related to Weak Acid site density (WA density)The less condensed (RkL) the more Lipophilic (Ko/w)

25
Site vs. DNOM characteristics
Results
Site characteristics
NOM characteristics rC:N -0.840PyreneKD -0.834SAR-RO 0.859SFEFES 0.856
Latitude RFI-ATLS -0.813Growing season RFI-CTLS 0.817Retention time RFI-CTLS -0.959Precipitation PODAlgae response -0.812Log catchm. size g-valueESR 0.841Lake Volume SpinsESR 0.942Log volume Ko/w 0.803% Peat SpinESR 0.943
WA density 0.818RFI-ATLS 0.925
Tot S deposition
% Rock
The less S deposition - the lower is the N-content of the DNOM
- more coloured DOM - the better carriers of PAH

26
Site vs. DNOM characteristics
Results
Site characteristics
NOM characteristics rC:N -0.840PyreneKD -0.834SAR-RO 0.859SFEFES 0.856
Latitude RFI-ATLS -0.813Growing season RFI-CTLS 0.817Retention time RFI-CTLS -0.959Precipitation PODAlgae response -0.812Log catchm. size g-valueESR 0.841Lake Volume SpinsESR 0.942Log volume Ko/w 0.803% Peat SpinESR 0.943
WA density 0.818RFI-ATLS 0.925
Tot S deposition
% Rock
The less S deposition - the lower is the N-content of the DNOM
- more coloured DOM - the better carriers of PAHThe proportion of Phenolicsdecrease further northThe proportion of Humicsincrease with increasing length of summer and retention time

27
Site vs. DNOM characteristics
Results
Site characteristics
NOM characteristics rC:N -0.840PyreneKD -0.834SAR-RO 0.859SFEFES 0.856
Latitude RFI-ATLS -0.813Growing season RFI-CTLS 0.817Retention time RFI-CTLS -0.959Precipitation PODAlgae response -0.812Log catchm. size g-valueESR 0.841Lake Volume SpinsESR 0.942Log volume Ko/w 0.803% Peat SpinESR 0.943
WA density 0.818RFI-ATLS 0.925
Tot S deposition
% Rock
The less S deposition - the lower is the N-content of the DNOM
- more coloured DOM - the better carriers of PAHThe proportion of Phenolicsincrease further northThe proportion of Humicsincrease with increasing length of summer and retention timeWeak acid site density higher in sites with shallow soils

28
PCA on combined dataset
• 8+10 RO isolates from Gjessing et al. and Vogt et al.NOM-typing NOMiNiC
• Main PC describe the differences in the two datasets• Possibly due to differences in
elevation and the % lake of total catchment area
• Second PC describe the content of DNOM
• Sites are clustered• Small seasonal effects

29
ConclusionsThese correlations indicate that:
Many spectral properties may serve as proxies for functional characteristicsAs the S-deposition decreases we may find
More coloured DNOM that isbetter to adsorb micro-pollutants
TOC concentration is a key chemical parameter in describing several DNOM characteristics
Possibly concentration artefact on quality parameters
Comparison of data express a need for conformity assessment