corrosion and tribocorrosion study of cocrmo biomedical alloy · corrosion and tribocorrosion study...
TRANSCRIPT

POLITECNICO DI MILANO
Department of Chemistry, Materials and Chemical
Engineering “Giulio Natta”
Master’s degree in chemical engineering
Corrosion and tribocorrosion study of
CoCrMo biomedical alloys
Academic year 2013-2014
Supervisors
Prof. Roberto Chiesa
Prof. Anna Igual Muñoz
Author
Giovanni Negroni
Matr. 797703


Acknowledgments To Prof. Anna Igual Muñoz of the Universidad
Politecnica de Valencia for her constant help and support
during the whole year and for being able to communicate her
incredible passion for the subject.
To Doc. Virginia Guiñon for her wise advices and for the
patience she demonstrated in the course of my year abroad in
Valencia.
To Ma’ and Pa’: from tightening my shoelaces to
correcting my thesis, and more, always there.


I
Index
Summary/Sommario………………………………………………………………………………..……….
1. Introduction……………………………………………………………………………………………….
1.1 Biomaterials………………………………………………………………………………………………….
1.1.1 Definition and characterization……………………………………………………………
1.1.2 CoCrMo biomedical alloys……………………………………………………………………
1.1.3 Body fluids………………………………………………………………………………………..
1.2 Corrosion in the human body ……………………………………………………………………….
1.2.1 Fundamentals of corrosion………………………………………………………………..
1.2.2 Electrochemical techniques………………………………………………………………...
1.2.3 Electrochemical behaviour of the CoCrMo biomedical alloy….…………….
1.2.4 Clinical implication of CoCrMo alloy corrosion……………………………………
1.3 Tribocorrosion………………………………………………………………………………………………
1.3.1 Fundamentals of tribocorrosion…………………………………………………………..
1.3.2 Triboelectrochemical techniques………………………………………………………..
1.3.3 Wear mechanisms……………………………………………………………………………..
1.3.4 Tribocorrosion mechanisms……………………………………………………………….
1.3.5 Modeling in tribocorrosion………………………………………………………………..
2 Aim of the work………………………………………………………………………………
3 Materials and methods…………………………………………………………………….. 3.1 Materials…………………………………………………………………………………………………
3.1.1 CoCrMo alloy…………………………………………………………………………………….
3.1.2 Solution……………………………………………………………………………………………
3.1.3 CoCrMo with cells……………………………………………………………………………..
3.1.4 Counterpart: ball………………………………………………………………………………
3.2 Corrosion experiments ……………………………………………………………………………
3.2.1 Surface preparation…………………………………………………………………………..
3.2.2 Electrochemical measurements…………………………………………………………..
3.3 Tribocorrosion experiments…………………………………………………………………….
3.3.1 Experimental settings………………………………………………………………………..
3.3.2 Contact pressure……………………………………………………………………………….
3.3.3 Experimental sequences…………………………………………………………………….
3.3.4 Surface analysis………………………………………………………………………………..
3.3.5 Overall wear volume calculation………………………………………………………….
3.3.6 Metal loss by electrochemical oxidation at OCP……………………………………
4 Results………………………………………………………………………………………….. 4.1 Pure corrosion experiments…………………………………………………………………………..
4.1.1 OCP measurements…………………………………………………………………………….
4.1.2 Polarization curves……………………………………………………….…….……………..
4.1.3 Passivation transients………………………………………………………….…………….
4.2 Tribocorrosion experiments…………………………………………………………………….……..
4.2.1 Open Circuit Potential (OCP) experiments………………………………………….
4.2.2 Potentiostatic experiments at passive potential of 0V…………………………
Page
1
5
6
6
10 13 14
14
19 24 26
29
29
31
34
35
39
45
46
47
47 47
48
49 50
50
50 52
52
53
56
57 58
59
60
61
61
62
63
66
66
68

Corrosion and tribocorrosion study of CoCrMo biomedical alloy
II
4.2.3 Friction and wear……………………………………………………………………………………
4.2.4 Wear morphology………………………………………………………………………………….
5 Discussion………………………………………………………………………………………… 5.1 Model validation……………………………………………………………………………………………….
5.2 Influence of the electrochemical potential in tribocorrosion…………………………………
5.3 Influence of the contact pressure in tribocorrosion…………………………………………….
5.4 Effects of the cell culture on the CoCrMo alloy…………………………………………………….
6 Conclusion………………………………………………………………………………………….
References………………………………………………………………………………………….
71
78
83
84
90 91
94
98
100

1
Summary
In the past years a considerable increasing number of articles
highlighted a growing scientific interest for tribocorrosion studies of
biomedical alloys. Considering the increasing patients’ population with
orthopaedic implants, clinical implication caused by wear and corrosion
of the biomedical alloys has to be considered very relevant for its serious
consequences. Although the studies of corrosion and tribocorrosion of
CoCrMo alloys have reached a wide knowledge of the phenomena
involved, many unknown aspects of the deterioration mechanisms must
be cleared in order to minimize the damage inflicted by human body
implants. In this thesis the role of some aspects concerning CoCrMo
biomedical alloy degradation is investigated. The effects correlated to
the presence of cells on the metal surface and to variables such as the
contact pressure and the electrochemical potential have been studied.
Two existing predictive models were used in order to confirm their
validity under the applied experimental conditions. The study was
carried out by both corrosion and tribocorrosion experimental
techniques. Tribocorrosion tests were performed by using a rotating ball-
on-plate system operating under potentiostatic conditions as well as
open circuit potential under different loadings. Scanning electron
microscopy and confocal microscopy were used for characterizing wear
pattern and debris formation.

Corrosion and tribocorrosion study of CoCrMo biomedical alloy
2
Results show that the cell culture modifies the surface behaviour of the
CoCrMo by increasing the OCP toward more anodic potentials. The
presence of the cells also reduces the reaction kinetics of the cathodic
reaction. This inhibition does not only affect the corrosion, but also the
tribocorrosion of the CoCrMo. The experiments confirmed that a
minimum contact pressure, correlated with plastic deformation of the
metal, is necessary to trigger wear accelerated corrosion. Wear
accelerated corrosion due to the mechanical removal of the passive film
during sliding acts as a major contribution to the overall degradation.
The prevailing electrochemical conditions, in particular at lower applied
loads, resulted to affect the tribocorrosion behaviour of this alloy. Model
validation highlighted the necessity of further work in order to reach a
better approximation of the metals behaviour. Specifically the galvanic
coupling model is consistent with the results found in literature, but it
does not apply under the investigated tribocorrosion experimental
conditions. In this matter the depassivation corrosion mechanisms are
still insufficiently understood in sliding contacts and further study is
needed.

3
Sommario
L’aumento del numero di articoli pubblicati negli ultimi anni
sottolinea l’incremento dell’interesse scientifico nei confronti della
tribocorrosione delle leghe biomediche. Le implicazioni cliniche causate
dal logoramento e dalla corrosione delle leghe biomediche devono
essere considerate di estrema rilevanza per le loro serie conseguenze
sulla salute dei pazienti. Anche se gli studi di corrosione e
tribocorrosione delle leghe al CoCrMo sono riusciti ad analizzare molti
aspetti del fenomeno, alcuni meccanismi di deterioramento meccanico
devono ancora essere approfonditi per minimizzare i possibili danni
causati dagli impianti sul corpo umano. In questa tesi si sono studiati
alcuni degli aspetti dell’usura delle leghe biomediche al CoCrMo. In
particolare sono stati analizzati gli effetti dovuti alla presenza delle
cellule sulla superficie metallica e di altre variabili quali la pressione di
contatto ed il potenziale elettrochimico. Due modelli preditivi già
esistenti in letteratura sono stati implementati per verificarne la loro
validità ed applicabilità nelle condizioni sperimentali di laboratorio. I test
sono stati eseguiti con tecniche sperimentali di corrosione e
tribocorrosione. I test di tribocorrosione sono stati svolti usando un
sistema rotante ball-on-plate in condizioni potenziostatiche e di
potenziale di circuito aperto con diversi carichi applicati. La

Corrosion and tribocorrosion study of CoCrMo biomedical alloy
4
caratterizzazione del logoramento della superficie è stata eseguita con
analisi al SEM e al microscopio confocale.
I risultati mostrano che la coltura cellulare modifica il comportamento
superficiale del CoCrMo spingendo l’OCP verso valori piu anodici. La
presenza delle cellule riduce inoltre la cinetica delle reazioni catodiche.
Questa inibizione non influisce solo sulla corrosione ma anche sulla
tribocorrosione del CoCrMo. Gli esperimenti confermano che esiste una
pressione di contatto minima, correlata alla deformazione plastica del
metallo, che innesca la corrosione accelerata dal logoramento
meccanico. La corrosione accelerata dal logoramento meccanico, dovuta
alla rimozione del film passivo durante la rotazione e le sfregamento, è la
principale causa dell’usura complessiva. Inoltre il comportamento nella
tribocorrosione della lega è fortemente influenzato dalle condizioni
elettrochimiche instaurate, in particolare quando si applicano carichi non
elevati. La validazione dei modelli preditivi ha messo in evidenza la
necessità di dover eseguire ulteriori studi per apprfondire più
accuratamente il comportamento del metallo. In particolare la
simulazione ottenuta utilizzando il modello galvanico è stata coerente
con i risultati trovati in letteratura, ma non è risultata applicabile con
adeguata precisione negli esperimenti effettuati di tribocorrosione,
soprattutto per la comprensione del meccanismo di depassivazione della
superficie.

5
1 Introduction
A long healthy life: in recent years we have come a long way towards
fulfilling this old dream of mankind, thanks to the achievement of modern
medicine. But this great success also creates a multitude of new challenges for
medicine. People are growing older and older and, as a result, the number of age
related illnesses is also on the rise. Our diet is different from the one of our
grandparents, resulting in obesity and in increasing metabolic disorders. Also the
trend to recreational sports is persisting with potential hazard ranging from
fracture to severe internal injuries. Tomorrow medicine must confront these
changes in modern society, today. It is in this concern that biomaterial scientists
study high tech materials for tomorrow medicine. Their final goal is to replace
diseased or damaged tissues and cells, even entire organs or bones, for a limited
period of time using novel biomaterials [11].
In order for such a replacement to be successful and to last in time, it is of major
relevance to reach a profound knowledge of biomaterials behaviour. This
introduction will first present the main features that characterize biomaterials,
introducing the concept of biocompatibility and the concerns related to it. It will
then focus on the core aspects of this thesis: corrosion and tribocorrosion of
biomaterials. Electrochemistry plays a crucial role in these two chapters, laying the
theoretical basis and the notions for its understanding and for its modelling.

Corrosion and tribocorrosion study of CoCrMo biomedical alloy
6
1.1 Biomaterials
1.1.1 Definition and characterization
A biomaterial can be defined as any substance (other than a drug), synthetic or natural, that can
be used as a system or part of a system that treats, augments, or replaces any tissue, organ, or
function of the body; especially, material suitable for use in prostheses that will be in contact with
living tissue [1,2]. Such devices include artificial hips, knees, elbows, pacemakers, heart valves,
intraocular lenses, etc. Figure 1.1 summarizes the major applications of biomaterials in the human
body [3-5].
Figure 1.1 – Major applications of biomaterials in the human body [6]
Biomaterials are engineered to take different forms which, alone or as a part of a complex system,
are used to direct, by control of interactions with components of living systems, the course of any
therapeutic or diagnostic procedures in medicine [8]. The necessity of such a variety of

Chapter 1 - Introduction
7
applications has led the field of biomaterials into evolving in such a manner that more than 50
different materials are used in more than 40 types of complex prosthetic devices, as highlighted in
Figure 1.1.
The types of biomaterials that can be used to produce medical devices are metals, polymers,
ceramics and composites, natural or synthetic, biodegradable or not. A range of needs and
requirements linked to an evaluation of advantages and disadvantages of the use of a specific
material affects the choice of biomaterial related to the specific application [6]. Table 1.1 shows a
comparison of these properties regarding four types of biomaterials.
Table 1.1 – Classes and properties of materials used in human body [6]
Materials Advantages Disadvantages Examples
Polymers (nylon, silicone, rubber, polyester, etc.)
Resilient Easy to fabricate
Not strong Deforms with time May degrade
Sutures, blood vessels, hip socket, ear, nose
Metals (Ti and its alloys, CoCr alloys, Au, Ag stainless steels, etc.)
Strong, tough Ductile
May corrode Dense Difficult to make
Joint replacements, dental root implants, paces and suture wires, bone plates and screws
Ceramics (alumina zirconia, carbon)
Very biocompatible
Brittle Not resilient Weak in tension
Dental and orthopaedic implants
Composites (carbon-carbon, wire- or fiber- reinforced bone cement)
Strong Tailor-made
Difficult to make Bone cement Dental resin
One of the most important developments in clinical medicine has been the replacement of
diseased joints with artificial implants. Since the early cemented hip replacements of the 1960s
there has been a constant flow of new materials and designs for implantable devices and the
number is steady increasing as technological process and medical practice allow for increased
functionality and safety.
The properties that should exhibit a biomaterial for successful application in total joint
replacement are [7]:

Corrosion and tribocorrosion study of CoCrMo biomedical alloy
8
Biocompatible chemical composition to avoid adverse tissue reaction
Corrosion resistance to the body fluid which is considered one of the most aggressive
environments (complex chemical composition)
High strength to tolerate cyclic loading endured by the joint
Low modulus in order to minimize bone resorption
High fatigue and wear resistance to minimize wear debris generation.
High ductility
No cytotoxicity
Among these the most important factor that distinguishes a biomaterial from any other material is
its ability to exist in contact with tissues of the human body without causing an unacceptable
degree of harm. Compatibility with the biological environment is a necessary condition for a
proper use of implantable devices manufactured with biomaterials. Such compatibility is
expressed mainly in three issues [6]:
1. Morphological compatibility: dimension interface, shape, and mass.
2. Functional compatibility: function performed by the implant compared to the required
role.
3. Biological compatibility or biocompatibility.
Biocompatibility refers to the ability of a material to perform its desired function with respect to a
medical therapy, without eliciting any undesirable local or systemic effects in the recipient or
beneficiary of that therapy, but generating the most appropriate beneficial cellular or tissue
response in that specific situation, and optimizing the clinically relevant performance of that
therapy [9].
The biocompatibility is essential to direct positively the reaction of the human body to the
implant. Such a reaction is always present when a biomaterial is implanted in a living tissue and
appears as a series of responses that are initiated by the implantation procedure, as well as the
presence of the same biomaterial. The effects of host material implantation can be mainly
distinguished in [10]:
1. Effects on tissue caused by implant:
a. Local events: blood interactions, cytotoxicity, inflammation, infection;

Chapter 1 - Introduction
9
b. Systemic events: embolism, accumulation of released materials in far target organs,
systemic toxicity, immune reactions and allergic sensitization.
2. Effects on implant caused by tissue:
a. Physics and mechanics: wear, fatigue, corrosion, surface cracking, degradation,
dissolution;
b. Biological: adsorption of substances from tissue, enzymatic degradation,
calcification;
c. Mixed: environmental stress cracking.
At the biomaterial surface level, the principal processes due to implantation and to contact with
living tissue are [10] [12]:
1. Surface absorption of proteins: the composition of the protein layer depends on the
properties and topography of the biomaterial surface and on the proteins typology that
the surrounding fluid contains.
2. Materials surface modifications: biological fluids may totally change the chemical
composition of the implants surface. Metallic surfaces can undergo to electrochemical
modifications like oxidation or to release of metal ions into tissues.
3. Cells adhesion: function of the type, conformation and following rearrangement of the
proteins film absorbed. It can be non-specific and non-mediated by receptors, weak
due to non-adhesive surface, or specific with receptors mediation.
4. Cells activation: function of the type, conformation and following rearrangement of the
proteins film absorbed. It also depends on the presence of activation factor in the
surrounding environment.
Human joints suffer from degenerative diseases such as arthritis leading to pain or loss in function.
The degenerative diseases lead to degradation of the mechanical properties of the bone due to
excessive loading or absence of normal biological self-healing process. In USA, it has been
estimated that 90% of population over the age of 40 suffers from these kinds of degenerative
diseases and the aged people population has increased tremendously in recent past and it is
estimated that there will be a further increase [13].
Actually there is a tremendous increase in the demand for the new long lasting implants. The data
collected on total hip replacements surgery estimated that by the end of 2030 the number of total

Corrosion and tribocorrosion study of CoCrMo biomedical alloy
10
hip replacements in the USA will raise by 174% and total knee arthoplasties is projected to grow
by 673% [14].
The reason for joint replacements is attributed to diseases such as osteoporosis, which causes
weakening of the bones; osteoarthritis and trauma.
Scientific research on biomaterials has greatly contributed to the development of biomedical
devices and implants that are fundamental in the most modern and effective healing techniques.
In recent years, the number of applications of biomaterials has increased significantly the
therapeutic efficacy. This led to the restitution of compromised function, often essential for life, to
a large number of patients. Therefore biomaterials are one of the most important sectors of
biomedical engineering in terms of health utility and economic interests.
1.1.2 CoCrMo biomedical alloys
Because one of the most important property of biomaterials is biocompatibility, corrosion-
resistant materials such as stainless steel, cobalt-chromium-molybdenum alloys and titanium
alloys are commonly employed. However, there is still a significant concern associated with
biomedical alloys related to the production of metal particles and ions [15,16] which can lead to
cellular toxicity [17-19], metal hypersensitivity [20,21], and chromosomal changes [22].
Furthermore, the material release can lead to loss of biomaterial fixation and the consequently
revision surgeries could be needed.
Titanium alloys are the most corrosion-resistant alloys within the metallic group of biomaterials
but its low wear resistance impedes them to be used where wear can occur [23]. On the other
side, in stainless steel biomaterials a low Ni content is found, resulting in possible allergic reactions
in patients.
A successful alternative to the use of stainless steel and titanium alloys are the Co-Cr based alloys,
which also present high bio-corrosion resistance, high wear resistance and low rigidity.
There are at least four compositions for cobalt-base alloys that are designated by ASTM (American
Section of the International Association for Testing Materials). CoCrMo is a cast alloy commonly

Chapter 1 - Introduction
11
used in many applications and CoCrWNi is a wrought alloy that is more suitable for hot rolling.
CoNiCrMo and CoNiCrMoWFe are less frequently used. The chemical composition and the
mechanical properties required for this sort of alloys are regulated by the following specifications
and they are summarized in Table 1.2 and Table 1.3 respectively:
CoCrMo F75-87. Standard specification for Cast Cobalt-Chromium-Molybdenum Alloy for
Surgical Implant Application.
CoCrWNi F90-87. Standard specification for Wrought Cobalt-Chromium-Tungsten-Nickel
Alloy for Surgical Implant Application.
CoNiCrMo F562-84. Standard specification for Wrought Cobalt-Nickel-Chromium-
Molybdenum Alloy for Surgical Implant Application.
CoNiCrMoWFe F562-84. Standard specification for Wrought Cobalt-Nickel-Chromium-
Molybdenum-Tungsten-Iron Alloy for Surgical Implant Application.
Table 1.2 - Chemical composition of cobalt-base alloys (ASTM,1992) [24].
ELEMENT
F75 F90 F562 F563
Cr 27-30 19-21 19-21 18-22 Mo 5-7 - 9-10.5 3-4 Ni 2.5 max 9-11 33-37 15-25 Fe 0.75 max 3 max 1 max 4-6 C 0.35 max 0.05-0.15 0.025 max 0.05 max Si 1 max 0.4 max 0.15 max 0.5 max
Mn 1 max 1-2 0.15 max 1 max W - 14-16 - 3-4 P - - 0.015 max - S - 0.03 max 0.01 max 0.01 max Ti - - 1 max 0.5-3.5 Co BALANCE

Corrosion and tribocorrosion study of CoCrMo biomedical alloy
12
Table 1.3 - Mechanical properties of the cobalt-chromium alloys (ASTM,1992) [24].
PROPERTY
F75 F90 F562
Traction resistance 655 MPa 860 MPa 1793 MPa Fluency limit 450 MPa 310 MPa 1585 MPa Lengthening 8 % 10 % 8 %
Area reduction 8 % - 35 % Fatigue resistance 310 MPa - -
Yield strength 580 Mpa - -
As stated in Table 1.2 CoCrMo alloys contain generally 26-30% of Cr, 5-7% of Mo and the balance
composition of Co. Contemporary Co-Cr alloys are superior to stainless steel, both in fatigue and
wear resistance, and are therefore preferred in total joints replacements, in both supportive and
articulating locations. However, fatigue fracture still remains a possible complication [25], and
corrosion issues after porosity initiation may occur [23]. Furthermore, the absence of nickel in
these alloys allows them to be employed in patients with sensibility and allergy to this element
[16].
Co-Cr-Mo alloys are mainly used in hip (component that replaces the spherical head of the femur
and the component that assembles into the femur in order to give stability) and knee (femoral
component) implants [26] represented in Figure 1.2a and 1.2b respectively.
Figure 1.2 - (a) Typical hip implant with femoral component and (b) knee implant

Chapter 1 - Introduction
13
1.1.3 Body fluids
The surrounding media of the metallic implants (body fluids) plays an important role on its
durability. This fluid is one of the most aggressive environments due to the high concentration of
chloride ions and organic compounds. Main components of body fluids are salts (NaCl, KCl, and
CaCl2), organic molecules (proteins) and inorganic species (phosphates). The general composition
of human biological fluids (plasma or serum and synovial fluid) is shown in Table 1.4. Fluid
properties and composition can readily change as a result of disease, aging and drug ingestion
[27].
Table 1.4. General chemical composition of the human biological fluids [27].
COMPOUND PLASMA (SERUM)
SYNOVIAL FLUID
Bicarbonate 25-30 mM -
Calcium 2.12-2.72 mM 1.2-2.4 mM
Cloride 100-108 mM 87-138 mM
Phosphorous (total) 2.87-4.81 mM -
Potassium 3.5-4.7 mM 3.5-4.5 mM
Sodium 134-143 mM 133-139 mM
Amino acids 20-51 mg mL-1 -
Glucosa 650-966 mg mL-1 -
Uric acid 30.5-70.7 mg mL-1 39 mg mL-1
Water 930-955 mg mL-1 960-988 mg mL-1
Albumin 37.6-54.9 mg mL-1 6-10 mg mL-1
IgG 6.4-13.5 mg mL-1 1.47-4.62 mg mL-1
Fibrinogen 2-4 mg mL-1 -
Due to the aggressive biological environment in which biomaterials are in contact and to the
nature of metals, it is necessary to understand the corrosion phenomena that these materials
experience. The next chapter will introduce the main concepts of corrosion including some of the
most relevant issues concerning the CoCrMo alloys.

Corrosion and tribocorrosion study of CoCrMo biomedical alloy
14
1.2 Corrosion in the human body
1.2.1 Fundamentals of corrosion
The corrosion process is an irreversible chemical or electrochemical reaction occurring at the
interface of the material representing the spontaneous dissolution of the metal (M) by its reaction
with the environment resulting in the loss of the material or in the dissolving of one of the
constituents of the environment into the material [28]. The oxidation of the metal, equation (1.1),
is coupled to the reduction of the oxidizing agent (environment) which takes the electrons from
the oxidation reaction. The equations (1.2) and (1.3) show the reduction reactions favoured in
acidic media, while the equations (1.4) and (1.5) take place in neutral or alkaline media.
(1.1)
(1.2)
(1.3)
(1.4)
(1.5)
In order to understand the basis of these electrochemical reactions taking place on the biomaterial
surface and their kinetics it is important to know the situation at the biomaterial/body fluid
interface. This knowledge allows one to predict the corrosion behaviour of the biomaterial into
the body related to its duration and the amount of metal ion release. Figure 1.3 shows a scheme
of the reaction steps (anodic and cathodic) occurring at the biomaterial surface during the
corrosion process in liquid environments.

Chapter 1 - Introduction
15
Figure 1.3 - Reaction steps during the corrosion process of a metal in liquid environments [28].
A charged surface is present in the metal in contact with the electrolyte. In order to maintain the
electroneutrality of the interface, this surface leads to the formation of an electric double layer in
the electrolyte. The charge distribution at the metal/electrolyte interface depends on many
factors: electronic properties of the solid, adsorption of water molecules and of hydrated cations
and of chemisorption of anions. Therefore, the structure of the double layer varies with the
chemical composition of the environment and with certain external conditions (i.e. applied
potential). Thus, the sum of the positive charges in the double layer equals the number of the
negative ones. Different models have been proposed in order to explain the charge distribution at
the metal/electrolyte interface. Helmholtz model is the simplest one. It assumes the compensation
of the surface excess charge by a monolayer of opposite charge (two planes with different charge)
where the potential linearly drops over the double layer. A more advanced model (Stern model)
describes the charge distribution in terms of an inner rigid layer and an outer diffusion layer.
In biosystems, the electrical double layer formed onto metallic interfaces presents huge
complexity due to the high variety of compounds that constitute the body fluids (ionic, inorganic,
proteins, cells and biomolecules). The oxidizing agents present in the electrolyte that simulates the
body fluids diffuse towards the electrode surface where it reacts by accepting the electrons. Mass
transport phenomena, taking place before or after the charge transfer reactions that could occur
at the biomaterial/electrolyte interface, determine the concentration of the reactants and
products at the electrode surface. The electrolyte layer contiguous to the metal surface in which

Corrosion and tribocorrosion study of CoCrMo biomedical alloy
16
the concentration of the reactants or products differs from that in the bulk electrolyte is called the
diffusion layer. The thickness of the diffusion layer mainly depends on the convection conditions.
Values between 1 and 100 m are typically reached. The diffusion layer is thicker than the electric
double layer which ranges between 0.2 and 10 nm [29].
In a bio-system involving metallic biomaterials several corrosion phenomena can take place:
passivation, active dissolution, passive dissolution, transpassive dissolution, localized corrosion
and adsorption [29].
The phenomenon involving the formation of a thin oxide layer on the metallic biomaterial, also
described as passivity, is known as passivation. The passivity of metals consists in the
development of an oxide layer on their surface which protects the metal from its environment.
Thus, the biomaterials are self-protected by the spontaneous formation of this thin oxide film
being the kinetic factor that controls the corrosion rate in biological aqueous solutions. Therefore,
the biocompatibility of these biomaterials is closely related to the stability of this oxide layer. The
passive film plays two roles in limiting both the anodic and cathodic reactions, serving as a physical
barrier for cations (ions positive charged) and anions (ions negative charged) transported to the
metal surface as well as an electronic barrier for electrons.
The protectiveness of the passive film is determined by the rate of ion transfer through the film as
well as the stability of the film against dissolution. A variety of factors can influence ion transport
through the film, such as its chemical composition, structure, thickness and presence of defects.
The nature and stability of a passive film on a particular metal or alloy depends on the
environment conditions such as the chemical composition of the electrolyte, the redox conditions,
the exposure time and temperature [23].
Typically, hydroxyl groups are found at the outer surface of the film. Their presence is due to the
fact that the oxide surface is hydrated or it may result from the precipitation of a thin hydroxide
layer from the solution. The chemical composition of the passive film formed on alloys is even
more complicated because two or more metal cations are present in different concentrations.
Indeed, the concentration ratio of cations in passive film on alloys often differs substantially from
that expected from the alloy composition. Two phenomena, selective oxidation of alloy elements
and selective dissolution of films constituents, can contribute to this fact [28].

Chapter 1 - Introduction
17
Metals free of oxide film are in their active state. The dissolution of these metallic materials is
denominated active dissolution and involves a charge transfer at the metal-electrolyte interface.
The generated ions are dissolved into the solution in form of hydrated or complexed species
according to equation (1.1). The concentration generated by dissolution often exceeds that of the
bulk electrolyte which allows the continuous dissolution of these species; however, when the
solubility of the species is overcome, solid reaction products begin to precipitate forming a porous
film (corrosion products).
Passive dissolution takes place when passive metals are dissolved. In this case, cations are also
generated in the interface metal/oxide film by a charge transfer reaction and the ions migrate
across the passive film/electrolyte interface [29]. Equation (1.6) shows the formation of the oxide
film as a consequence of the cation (M+n) migration towards the outer surface and the anion (O-2)
migration in the opposite direction while equation (1.7) represents the passive dissolution where
the cations are dissolved from the passive film into the solution. The overall reaction (equations
(1.6) and (1.7)) is equivalent to equation (1.1).
A picture of the general reactions occurring during passive dissolution is presented in Figure 1.4.
Figure 1.4 - Scheme of the reactions taking place on the passive metal surface. Strong electric field is presented in the film which favours the cation/ion migration through the oxide passive film [28].
⁄ (1.6)
⁄
(1.7)

Corrosion and tribocorrosion study of CoCrMo biomedical alloy
18
Transpassive dissolution occurs when the protecting passive film is oxidized to species with higher
oxidation valence which are characterized by high solubility (i.e. Cr+6, Co+6) [30]. It can occur below
the potential of oxygen formation (uniform transpassive dissolution by film oxidation) or when
oxygen evolution takes place (high-rate transpassive dissolution). In the first case, typical of
stainless steel and CoCrMo alloys, the oxidation is not sufficient to trigger high-rate of transpassive
dissolution which is observed when the oxygen evolution is produced [31,32]. Dissolution at
transpassive potentials is relevant to corrosion in strongly oxidizing media and in presence of
highly oxidant species such as OH radicals and H2O2 (intermediary compound produced in the
metabolic reactions). The main problem of this this kind of oxidation is the generation of Cr+6
which presents high level of toxicity [19].
An important type of corrosion is the localized corrosion in which an intensive attack takes place
in small local sites at a much higher rate than the rest of the surface (which is corroding at a much
lower rate). Localized corrosion is associated with other mechanical processes (such as stress,
fatigue and erosion) and other forms of chemical attack. The main form of localized corrosion in
passive alloys (i.e. stainless steel) is pitting corrosion: the metal is removed preferentially from
vulnerable areas on the surface. Pitting corrosion is a local dissolution leading to the formation of
cavities in passive metals or alloys that are exposed to environments with aggressive ions (i.e.
chlorides) [33-35]. Pitting corrosion in CoCrMo is rarely observed, since this material fails by
generalized transpassive corrosion. In surgical stainless steel, pitting corrosion is more common
since it is produced at lower potentials than the oxidation of the Cr+3 to Cr+6. Other type of
localized corrosion is the crevice corrosion which occurs when a different availability of oxygen
takes place in regions of the biomaterial and therefore mass transfer is limited (occluded areas
within the implant structure). In these areas, the presence of certain aggressive ions such as
chloride ions diminishes the pH values and depletion of oxygen can contribute to the surface
activation. The high amount of Cr in the oxide passive film formed onto CoCrMo alloys provides
high corrosion resistance to this type of corrosion [29].
Other common phenomenon in biological systems is adsorption of certain species present in the
body fluid (i.e. proteins, biomolecules and cells) onto the surface of metallic materials. The
adsorption is established between the adsorbed species and the surface due to weak forces or Van
der Waals forces and it can modify the passive dissolution rate of biomaterials among others.

Chapter 1 - Introduction
19
According to the described mechanisms, the phenomena which take place on the metal will
determine the kinetic rate of the electrochemical reactions occurring on the metallic biomaterial.
Taking into account the kinetics of the electrochemical reaction evolutions it is possible to
distinguish three mechanisms depending on the rate-limiting step [29]:
Corrosion controlled by the kinetics of a charge-transfer reaction, either anodic or
cathodic, at the metal-electrolyte interface. The kinetic/s reaction/s is determined by
its activation energy.
Corrosion controlled by the rate of mass transport of the oxidizing agent or of anodic
reaction products. This mechanism is related to the overpotential generated as
consequence of the different concentration of reactants and products between the
bulk electrolyte and the metal interface.
Corrosion controlled by the properties of the passive film. The reaction is then under
anodic control and the average corrosion rate is often quite small.
1.2.2 Electrochemical techniques
Corrosion studies are commonly carried out using electrochemical techniques which allow one to
get a deeper insight into corrosion mechanisms and quantify the extents of corrosion rates. In the
present work the electrochemical techniques used are the Open Circuit Potential tests,
potentiodynamic curves and potentiostatic tests. The basic configuration of three-electrode is
used for carrying out the electrochemical measurements. The electrode system is formed by the
working electrode (WE), i.e. the investigated biomaterial; the reference electrode (RE) and the
counter electrode (CE). The RE is needed to measure the potential of an electrode and it has a
stable and well-defined electrode potential. It has to be non-polarizable (not sensible to current
flow). The CE is made of inert materials such as gold, platinum or graphite and its function is to
ensemble the electrical circuit by controlling the applied or measured current. The potential of the
counter electrode can be adjusted to balance the reaction occurring at the working electrode. This
configuration allows the potential of the working electrode to be measured against a known
reference electrode without compromising the stability of that reference electrode by passing

Corrosion and tribocorrosion study of CoCrMo biomedical alloy
20
current over it. The three electrodes are connected to the potentiostat which is essentially an
electronic amplifier that regulates the current between the working and the reference electrode.
i. Open Circuit Potential (OCP) tests
The open circuit potential is the potential set up spontaneously by an electrode in absence of
external current [29]. Thus, at open circuit potential (i.e. under free corrosion conditions), the
anodic and cathodic reactions occur simultaneously and at the same rate. Therefore, the total
current flow is zero and cannot be directly measured. In electrochemical systems the OCP is
measured during a certain time in order to stabilize the electrochemical conditions of the samples
into the electrolyte. This measurement is useful because it represents initial information about the
surface state of the biomaterial in the studied media. In addition, information about the progress
of possible chemical reactions taking place on the electrode surface can be studied if the OCP
evolution is analysed with time, i.e. formation of the oxide film. When the biomaterial is
spontaneously passivized (without applying any external current) the OCP shifts towards more
anodic potentials with time until reaching a steady-state value of potential.
ii. Potentiodynamic curves
This technique consists in measuring the current density as a function of the applied potential
when the latter is swept at a constant rate using a function generator to drive the potentiostat.
Thus, a registration of the current density versus potential is obtained. The potentiodynamic
curves constitute the first approach in a corrosion study since it permits to observe the effect of
variables such as chemical composition of the electrolyte and temperature. ASTM G5-94 [58]
establishes a standard protocol for measuring potentiodynamic curves where experimental
conditions such as scan rate and range of applied potentials are indicated. The scan rate of
potential has to be sufficiently slow to permit steady state mass transport conditions at the
electrode surface without limiting current plateau.
In all polarization curves the total current density is given by the sum of the partial anodic
current density ( ) and the partial cathodic current density ( ) as described by equation (1.8):
(1.8)
By convention, the anodic current density is positive and the cathodic current density is negative.
The potential at which the total current shifts from cathodic to anodic current is called corrosion
potential ( ) and is characterized by a net current density equal to zero (i.e. current density of

Chapter 1 - Introduction
21
semi-reactions is equal). This potential is the potential of equilibrium of the metal in the
electrolyte at the system conditions. The value of the current density of the semi-reactions is the
corrosion current density ( ) which is directly related to the corrosion rate of the material in
the studied media. Applying Tafel equation on the polarization curves it is possible to deduce the
corrosion current density and the corrosion potential. Thus, the Tafel coefficients can be extracted
from the slopes of the straight lines in the Tafel region (Figure 1.5).
Sometimes, the reaction is limited by diffusion which occurs when mass transport is the rate
determining step. In this case the charge transfer is faster compared with the diffusion of the
reacting species in the surface or the dissolved cations moving away from the surface. Thus, the
concentration of reactants and products in the bulk electrolyte differs from that found at the
electrode surface. This leads to an overpotential that varies with the rate of transport of the
reactants and products to and from the electrode. When the semi-reaction is controlled by
diffusion mechanism, the current density is potential independent and is called limiting current
density ( ).
Figure 1.5 represents the typical potentiodynamic curve of a passive metal.
Figure 1.5 - Polarization curve and calculation of its parameters [29].
Four potential domains can be clearly distinguished, as shown in Figure 1.6. The cathodic region
includes potentials below the and the current is determined by the reduction of water and
dissolved oxygen. The active region is observed for potentials above the and it is

Corrosion and tribocorrosion study of CoCrMo biomedical alloy
22
characterized by the dissolution of the metal in form of soluble ions dissolved into the solution. An
increase of the anodic current density with the potential is observed in this region due to the
reaction kinetics of active metal dissolution. The passive region describes the state where the
surface of the metal is covered by a thin protective layer which can slow down metal dissolution
and therefore the current density considerably decreases. Important parameters to describe the
passive behaviour are defined: the passivation potential separates the active from the
passive potential region, the maximum current density corresponding to the is the
passivation current density ( ).
The passive current density ( ) corresponds to the current density that flows through the metal
electrode when the oxide film is formed onto the surface. Therefore, the characterizes the
dissolution behaviour of the metal in the passive potential region which is an important parameter
in order to evaluate the protective quality of the passive film.
Finally, the transpassive region is characterized by the increase in current due to the uniform
transpassive dissolution resulting from oxidation of the passive film as well as oxygen evolution
due to water oxidation. The transpassive dissolution can occur in some passive materials by pitting
resulting from local film breakdown where the potential is called breakdown potential or
transpassivation potential and it marks the end of the passive potential region and the transition
from passive to transpassive behaviour.
Figure 1.6 - Schematic polarization curve with the four regions: cathodic, active, passive and transpassive. In this case the water
dissociation potential is more anodic than the transpassive potential of the working electrode.

Chapter 1 - Introduction
23
In general, this method constitutes the first approach in a corrosion study and most analysis has
been performed on the results obtained from the potentiodynamic polarization curves.
Comparison between biomaterials and/or microstructure, surface treatments and coatings can be
carried out according to the electrochemical parameters extracted from the potentiodynamic
polarization curves [29].
iii. Potentiostatic tests
Potentiostatic tests consist of measuring the transient of current when a selected potential E is
imposed on the system. The potentiostat regulates the appropriate current between the working
electrode and the counter electrode in such a way as to keep the potential between the working
electrode and the reference electrode constant. By means of this technique it is possible to
measure the evolution of the current density with time at an applied potential which allows one to
follow the evolution of the electrochemical kinetics of the involved reactions.
The current measured during a potentiostatic test corresponds to the sum of the anodic and
cathodic currents involving all the electrochemical reactions (index k) taking place on the
electrode surface as described by equation (1.9)
∑ ∑ (1.9)
When a cathodic potential is applied the dissolution rate of the metal is negligible and the
measured current is determined by the kinetics of the cathodic reactions. On the contrary, for
anodic potentials the rate of the cathodic reactions is negligible instead of metal oxidation which is
favoured.
Faraday’s law (equation (1.10)) establishes a relationship between the mass loss of metal and the
current in the exposed anodic area.
(1.10)
In equation (1.10) m is the mass of metal oxidized during time t, I is the anodic current, F is
Faraday’s constant (95485 C mol-1), n is the oxidation valence and Mr is the atomic mass of the
metal. Therefore, the conversion of current into mass of oxidized metal can be determined by
knowing the oxidation valence and only if the metal oxidation is the prevailing contribution to the
measured current.

Corrosion and tribocorrosion study of CoCrMo biomedical alloy
24
Different interpretation can be driven from the potentiostatic tests. Milosev and Strehblow [37],
for example, studied the effect of applied potential on the composition, thickness and structure of
the oxide layer formed on a CoCrMo in simulated physiological solutions (SPS). In all the studies of
the electrochemical behaviour of biomedical alloys, the passive film characterization is a key factor
since the control of the corrosion behaviour and durability of the biomaterial is related to the
stability of this passive layer. Thus, the relevance of this technique, when an applied potential is
selected, is the characterization of the passivation process and the kinetics of the passive film
formation. In this case, when applying a passive potential, the current density abruptly increases
until a maximum value and then diminishes until reaching a constant value due to the oxide film
formation which generation reduces the transient of current density.
1.2.3 Electrochemical behaviour of the CoCrMo biomedical alloy
It is observed a continuous increase of the number of papers about CoCrMo biomedical alloys. This
increase coincides with the unceasing growth of the number of implanted CoCrMo alloys in the
biomedical field (artificial joints) [61]. According to the presented research works, an approach of
the electrochemical behaviour of the CoCrMo alloy in biological environments can be attained.
The high biocompatibility of the CoCrMo is related to the spontaneous formation of an oxide film
that protects the metal from the surrounding environment (body fluid). It is well known that the
properties of this oxide film control the chemical and mechanical properties of the biomaterial and
therefore its durability into the human body. The physico-chemical properties of the passive film
also control the corrosion behaviour of the materials, the interaction with tissues and the
electrolyte and thus the degree of the material biocompatibility. The properties of the film may
change depending on the external conditions (i.e. temperature and potential) but usually present
similar composition due to the stability of that passive film [29]. The composition of the passive
film of CoCrMo alloys presents high content in Cr (mainly Cr(III) and smaller amount of Cr(OH)3)
with a minor contribution of Co and Mo oxides [36-38]. A direct relation between the thickness of
the passive film and the applied potential (increasing around 1 nm V-1 in the passive domain) was
observed by Milosev and Strehblow [37]. Hanawa et al. [39] studied by X-ray photoelectron
spectroscopy (XPS) the surface oxide film formed on CoCrMo in quasi-biological environments and

Chapter 1 - Introduction
25
determined that Cr and Mo were distributed at the inner layer of the film while the Co was
dissolved from the film, reaching a thickness of 2.5-2.9 nm. The alloying elements play an
important role in the electrochemical behaviour of the alloy. Metikos et al. [40] demonstrated that
the corrosion behaviour of the passive alloy is determined by the presence of Cr although its
corrosion resistance is higher due to the beneficial effect of the Mo on the passivity. According to
Li et al. [41], Mo in the alloy does not react with the electrolyte since the passive film (composed
by Cr and Co species) protects the underlying Mo from further oxidation. They also observed that
at lower potentials the Cr species play major role in the passivation of the alloy while at higher
potentials Co species take on these roles. The major dissolving species from the alloy is Co which
strongly depends on the electrochemical conditions [38]. Contu et al. [42] proved that the
variations of the polarization resistance of the alloy immersed in serum was due to Co dissolution
from the oxide film.
The exact chemistry of the passive layer is highly dependent on the chemical composition of the
electrolyte [36]. Therefore, special care has to be taken when formulating the simulated body
fluids in order to obtain electrochemical results for clinical application. At this moment, there is
not a general consensus in the scientific community about the best simulated body fluid to be used
for characterizing metallic biomedical alloys. Further research on the influence of the solution
chemistry on the corrosion mechanisms is required to avoid this uncertainty [29].
Different biomedical grades of CoCrMo alloys are used. With respect to the carbon content in the
alloy, low carbon (carbon content less than 0.15 wt. %) and high carbon (carbon content between
0.15 % and 0.3 wt. %) were studied. The main differences between the selected alloys is their
microstructure [44]. In addition, further differences are observed depending on the fabrication
process: cast alloys are mainly used for knee joints while wrought alloys are used for component
of simpler geometry (hip joints). Thermal treatments improve the mechanical properties of the
alloy providing commonly more homogeneous microstructures [44,45]. All those processes affect
the overall electrochemical behaviour of the alloy [46,47].

Corrosion and tribocorrosion study of CoCrMo biomedical alloy
26
1.2.4 Clinical implication of CoCrMo alloy corrosion
The main corrosion mechanism of CoCrMo alloys in the body fluids is passive dissolution. In vitro
[16,17,48] and in vivo [22,49] tests confirm that metal ion release from the CoCrMo alloys takes
place through that corrosion mechanism. Different phenomena as a consequence of metal ion
release occur into the human body such as transportation, metabolism, accumulation in organs,
allergy and carcinoma [16,17,22,49,50,51]. These effects can be generally harmful for human
health, mainly in the case of the CoCrMo where the alloying elements Cr and Co generate high risk
of carcinogenicity. Although the definitive effects of these metal ions have not been determined,
toxicity and metal allergy are the most significant concerns. For example, it has been
demonstrated that Cr3+ and Co+2 have a toxicity effect on osteoblast and induced cell mortality
[15]. Chromium ions exist in two oxidation states: Cr+3 and Cr+6 where the latter is more harmful
since it is carcinogenic.
Catelas et al. [18,52,53] quantitatively analysed the macrophage apoptosis and necrosis induced
by cobalt and chromium ions in vitro. Apoptosis consists in a mode of cell death that occurs under
normal physiological conditions. Necrosis occurs when cells are exposed to extreme variance from
physiological conditions which may result in damage to the plasma membrane. The results
demonstrated that macrophage mortality induced by metal ions depends on ion type,
concentration and incubation time.
The extrapolation of these results to the human body is en evidence that a real implication of the
Cr and Co ions into the body exists. Although the behaviour of these ions into the body is
unknown, the design of new biomaterials which decreases the release of them into the body is
required. Furthermore, this decrease will improve the durability of the implant into the body
reducing the number of surgical revisions.
According to Hanawa [51] metal ion release into the body does not always damage the body. The
combination of the metal ion with a partner is critical. Every molecule has a chance to combine
with the ion. When an ion is active and immediately reacts with water molecules or inorganic
anions (Figure 1.7 left) its possibilities to bond with a biomolecule is reduced. On the other hand,
inactive ions do not immediately combine with water molecules and inorganic anions and survive
as an ionic state for long time (Figure 1.7 right). Therefore, these ions have more chance to bond
with biomolecules and reveal toxicity.

Chapter 1 - Introduction
27
Figure 1.7 - Toxicity of metal ions classified with the possibility of bond with water molecules and anions [51].
Simultaneously to the effect of the biomaterials implanted in the human body there is also an
influence of the body fluids on the biomaterials. Lin and Bumgardner [54] demonstrated that
macrophage cells and their released reactive chemical species change the surface composition of
CoCrMo alloy. They proposed several mechanisms in which the reactive chemical species (H2O2,
O2- and NO) released by activate cells further oxidized the alloys surfaces.
Reduction of H2O2 and the released oxygen may further react with the metal.
H2O2 also participates in the formation of hydroxyl radicals ( ) in the presence of metal
(M) or metal oxides and thus further oxidizes metal oxides on the surface (especially
transition metals such as Cr) [55,56].
Changes in the composition of the surface oxide of the alloy over time by presence of cells and
extracellular matrix are also important for the understanding of host-material interactions and the
release of corrosion products from the alloy [29].
The clinical implications caused by corrosion are not the only concern. Due to the mechanical wear
induced by the sliding movements of the implants components there is a release of harmful metal
particles in the body. This phenomenon is often associated with ion release but there is not a
common consensus on the influence of the corrosion and wear behaviour of CoCrMo alloys. A
review on the effects of the environment correlated with wear ranking and corrosion of

Corrosion and tribocorrosion study of CoCrMo biomedical alloy
28
biomedical CoCrMo alloys [57] has been carried out. The authors concluded that the reactions
between contacting materials and environment played a crucial role emphasizing the importance
of considering surface chemical dependent phenomena in the evaluation of biomedical alloys. It is
also not clear in what extent the interaction between the two events of corrosion and wear are
related to each other. These issues led to the conception of the field of tribocorrosion: topic of the
next chapter.

Chapter 1 - Introduction
29
1.3 Tribocorrosion
1.3.1 Fundamentals of tribocorrosion
Problems regarding friction and wear in biomedical prosthesis of hip and knee replacement have
been studied in recent years given their relevance in the durability of the implants. It is generally
accepted that the most important factor concerning the life of the implants is the formation of
debris (wear particles) which is related to inflammation of tissues and compromised bone-implant
structures [59]. The cause of debris formation is not purely mechanical. When the surfaces of two
materials are in contact, the reciprocating movements at the interface create the conditions for
wear mechanisms. Moreover, biomaterials are usually applied in corrosive environments and their
corrosion resistance is an important parameter for their successful operation [60]. The material
deterioration resulting from the combined action of wear and corrosion lead to the topic this
chapter introduces: tribocorrosion.
Tribocorrosion describes material degradation due to the simultaneous action of chemical and
mechanical effects in a tribological contact [62]. The consequences of coupling wear and corrosion
are complex. The knowledge of the tribological behaviour in the absence of corrosive medium and
that of the electrochemical behaviour in the absence of wear is not sufficient to predict the
tribocorrosion behaviour. There is synergy between wear and corrosion [60]. Indeed, surface films
may influence the mechanical response of contacting metals while the scraping of protective films
can significantly accelerate corrosion [61].
Tribocorrosion may occur under a variety of conditions (i.e. sliding, fretting, rolling, impingement)
in a corrosive medium. Sliding is defined as the continuous or reciprocating movement of two
surfaces in contact. When the surfaces of those contacting parts directly slide one over the other,
the situation is defined as two-body contact. If the sliding surfaces are separated by a lubricant,
wear particles or particles added on purpose, the situation is defined as three-body contact [62].
In a tribocorrosion sliding system two- or three-body contacts can be a cause of degradation and
wear.
When passive materials are subjected to sliding in equilibrium conditions, worn areas are formed
where the passive layer is removed while the unworn areas remain passive. The interaction

Corrosion and tribocorrosion study of CoCrMo biomedical alloy
30
between mechanical and chemical factors governing tribocorrosion is still little understood and
needs further investigation. Prerequisite for tribocorrosion experiments is the possibility to control
not only the mechanical but also the chemical test conditions. In aqueous ionic electrolytes,
electrochemical techniques offer the possibility to control in-situ and in real time the surface
reactivity of metals and other electronically conductive materials. However, the interpretation of
electrochemical results obtained in tribocorrosion tests is much more delicate than in the case of
pure corrosion. A tribological experiment carried out in an ionic conductor under controlled
electrochemical conditions is defined as triboelectrochemical experiment [60].
Tribocorrosion involves different degradation phenomena (corrosion, wear accelerated corrosion
and wear) [61,93]. Corrosion occurs on the whole metal surface exposed to the corrosive fluids
while wear accelerated corrosion and mechanical wear occur only on area subject to sliding, i.e.,
the joint bearing area (the head-cup contact in hip joints) in orthopaedic implants. The different
mechanisms are schematically illustrated in Fig. 1.8.
Figure 1.8 – Schematic illustration of the degradation mechanisms of passive metals subject to tribocorrosion [61]. The sliding of the indenter removes the passive layer of the metal.
As other biomedical alloys (i.e., titanium and its alloys, stain-less steels) CoCrMo alloys are passive,
i.e., they form spontaneously by contact with water a thin surface oxide layer (typically 2 to 10 nm
thin) that significantly slows down the corrosion rate [1]. Sliding against a counter body can locally
remove this passive film thus exposing highly reactive bare metal to the environment and
enhancing the corrosion rate (wear accelerated corrosion). The loss of passivity under sliding
conditions can occur as a consequence of splitting the passive film or the metal and of plastic
deformation of the metal. The exposed bare metal repassivates usually in a short time during

Chapter 1 - Introduction
31
which however metal can corrode. Further, sliding can result in mechanical wear associated with
the detachment and release of metal particles. Despite the mechanical nature of this process,
corrosion can significantly affect it. For example passive films may render metals brittle and prone
to wear. Corrosion products may also act as lubricant, as in the case of phosphate ions [61].
1.3.2 Triboelectrochemical techniques
The main purpose of biomedical CoCrMo alloys research is to investigate corrosion resistance and
tribocorrosion. Studies of wear accelerated corrosion of passive metals are usually carried out by
imposing a passive electrode potential to the metal while rubbing against a counter piece. In this
way, the acceleration of corrosion can be measured by recording the current necessary to
maintain the passive potential [61]. A different type of experiments measures the OCP evolution
of the metal during rubbing. In both cases the rubbing of the metal removes the passive film
evolving into a continuous process of local depassivation/repassivation that yields to a steady
state overall wear accelerated corrosion. These experiments can be implemented with different
methodologies. A deeper insight of these techniques was given my Mischler (2008) [77] and
recently an overview of all the recent work published about tribocorrosion has been published
[61]. An introduction of the main techniques is given in the next paragraphs, while the equipment
used for the tribocorrosion experiments of this thesis will be described in chapter 3.3.
Two laboratory conditions can be distinguished: in vivo and in vitro experiments. In the first case
the purpose is to investigate the consequences of metal dissolution and particle formation in
human body due to tribocorrosion. Main concern of the in vitro experiment is to comprehend the
degradation mechanisms involved. Based on the purpose of the test, the in vitro experiments can
be performed with a simulator or with a tribometer. If the purpose of the work is to examine
geometrical and mechanical parameters or the use of a lubricant or a new material, than a
biomedical simulator best fits these needs; on the other side, laboratory tribometers are used
when the interest is the tribocorrosion mechanism. The in vitro laboratory tribometer experiments
are in fact the only ones that permit a major control of all the electrochemical conditions present
at the metal surface.

Corrosion and tribocorrosion study of CoCrMo biomedical alloy
32
Simulators are devices intended to test components of similar geometry and size as the actual
implants. The contact in simulators involves concave/convex contacts between the femoral head
and the acetabular cup. The forces and displacements imposed during a single cycle are variable
and are supposed to mimic the real complex conditions of a joint. The load varies typically from
few hundred Newton up to 3400 N during a gait cycle. The extracted average Hertzian contact
pressure varies between 14 and 60 MPa [61].
Tribometers are used for accelerated material evaluation using simpler geometries, such as ball on
plate or ball on plate, that are more easily manufactured than simulator components. They usually
operate under simple mechanical conditions involving constant loads and unidirectional sliding
movements. The lubricants palette used in tribometers is wider than in simulators and ranges
from simple saline solutions with or without addition of organic molecules to more complex body
fluids including bovine serum or synovial fluids. In research work the tribometers are often
coupled with electrochemical set-ups that allow monitoring the corrosion response to friction.
Sample preparation for tribometers is much easier than in the case of simulators using industrial
components. This facilitates testing not only a wider range of material compositions but also of
microstructures resulting for example from different heat treatments. The flexibility in contact
geometry proper to tribometers allows working under a wide spectrum of initial contact
pressures, ranging from 2 up to 1300 MPa, and using different counter materials (typically ceramic
materials) [61]. The type of motion is essentially limited to reciprocating or unidirectional sliding
and the sliding velocities are comprised between 10 and 100 mm/s. Test duration is generally
shorter than in simulators and typically does not last longer than few hours. In most cases a ball
(or hemispherical ball) on flat contact configuration is used to avoid alignment problems that in
flat on flat contacts may cause non uniform pressure distributions inside the contact. The
disadvantage of ball on flat contacts is that their geometry changes with the progress of wear
usually resulting in a decreased pressure [61].
The investigation of tribocorrosion requires the control of the chemical conditions during a wear
test. In aqueous electrolytes, this is achieved by using different types of electrochemical-
controlled wear experiments (triboelectrochemical experiments). The triboelectrochemical
techniques were applied on a variety of sliding contact conditions, varying from unidirectional
motion (pin on disk), reciprocating motion contacts, fretting or spinning contacts. The techniques

Chapter 1 - Introduction
33
used by authors can be divided in four main types [77]: (1) corrosion potential technique, (2)
galvanic cells, (3) potentiostatic technique and (4) potentiodynamic technique. The most used
techniques were the potentiostatic and the corrosion potential ones; they will be described later
in this chapter. Potentiodynamic techniques have already been described in chapter 1.2.2. Other
techniques involve the study of electrochemical noise or the electrochemical impedance
spectroscopy; a limited number of papers have been published on these two topics.
The two main techniques are schematically illustrated in Figs. 1.9-1.10 together with typical
measurements obtained during rubbing of an alumina ball against a titanium-based alloy
immersed in NaCl solution [77].
Figure 1.9 – (a) Schematic view of a tribocorrosion experimental set-up including the measurement of the corrosion potential. (b) Evolution of the corrosion potential of a titanium-based alloy rubbing against an alumina ball in NaCl solution [77].
Figure 1.10 – (a) Schematic view of a tribocorrosion experimental three-electrode set-up for a potentiostatic test. (b) Evolution of the current of a titanium-based alloy rubbing against an alumina ball in NaCl solution. The potentiostat maintains the selected
potential between working (WE) and reference (RE) electrodes by passing an appropriate current between working (WE) and counter (CE) electrodes [77].

Corrosion and tribocorrosion study of CoCrMo biomedical alloy
34
i. Measurement of corrosion potential
This technique (Fig. 1.9) consists in recording the corrosion potential, i.e. the potential difference
spontaneously established between the working electrode (the metal being investigated) and a
reference electrode placed in the solution close to the working electrode. As illustrated in Fig.
1.9b, at the onset of rubbing, the corrosion potential of the passive titanium alloys shifts to lower
values (cathodic shift). During rubbing, the measured corrosion potential reflects the galvanic
coupling of two distinct surface states of the metal [77]: (1) the passive metal (unworn area) and
(2) the bare metal (worn area) exposed to the solution by abrasion of the passive film. After
stopping sliding, the corrosion potential in Fig. 1.9b attains again the initial value, because the
passive film forms again on the worn area.
ii. Potentiostatic tests
In potentiostatic tribocorrosion tests (Fig. 1.10a), a selected potential E is imposed to the metal
samples by using a three electrode set-up including the working electrode (the metal being
investigated), the reference electrode and the counter electrode (made out from inert materials
such as platinum or graphite). The three electrodes are connected to a potentiostat, which is an
electronic device that maintains the selected potential between working and reference electrodes
by passing an appropriate current between working and counter electrodes. The current is
measured at fixed potential as a function of the time to follow the evolution of the
electrochemical kinetics of the involved reactions. Fig. 1.10b shows that the onset of rubbing
corresponds to a sudden increase in current due to the oxidation of the bare titanium alloy
exposed to the solution after abrasion of the passive film. When rubbing stops, the current
decreases again to the value before rubbing, since all the metal passivates again. The potential
determines the prevailing electrochemical reactions [77]. The relation between loss of mass of
metal and the current in the anodic area is given by Faraday’s law as already explained in chapter
1.2.2.
1.3.3 Wear mechanisms
In chapter 1.2 corrosion mechanisms have been widely presented, but it is also necessary, before
introducing the tribocorrosion mechanisms, to summarize the ways in which wear can occur. Four

Chapter 1 - Introduction
35
main wear mechanisms are commonly recognized in literature [63,64,67,83,87]: adhesive,
abrasive, fatigue and tribochemical wear.
Adhesive wear occurs when the asperities of the two bodies of a system adhere together
due to material interactions. When two surfaces are put in contact, strong adhesive
junctions of asperities might be formed and adhesive wear takes place when the shearing
stresses break the junctions, leaving them adhered to one of the surfaces. In the
successive process of repeated sliding, the adhered material leaves the contact as free
particles or remains adhered to any of the surfaces.
Abrasive wear occurs in contacts where one of the surfaces is harder than the other. This
can take place when there are hard asperities in the contact or when hard particles get
trapped at the interface due to contamination or formation in situ of particles (oxidation
or mechanical formation).
Fatigue wear is characterized by crack formation and flaking of material due to repeated
alternating loading (stress cycling) of solid surfaces.
Tribochemical wear is the wear process in which chemical or electrochemical reaction
with environment contributes to material removal.
The terminology used in the literature for this last wear mechanism is broad; the term
tribochemical wear has more recently been substituted by the term tribocorrosion [62].
1.3.4 Tribocorrosion mechanisms
It was not until the 1990s that tribocorrosion mechanisms in sliding contacts were proposed
[74,78]. Since then tribocorrosion mechanisms of passive metals sliding or interacting against an
inert counterpart have been explored from several approaches, which form the basis for this
chapter.
The synergistic approach consists of measuring the individual contribution of corrosion (C0) in a
separate test where the mechanical part is eliminated; the individual contribution of wear (W0) by
applying a cathodic potential of 1V versus OCP during wear to eliminate the corrosion component

Corrosion and tribocorrosion study of CoCrMo biomedical alloy
36
and the concurrence of wear-corrosion by the total material loss (T). Thus the total material loss
due to tribocorrosion can be expressed as the sum of the material loss due to pure wear, the
material loss due to corrosion in absence of wear and the synergistic factor (S), which is the
combined effect of wear and corrosion.
(1.11)
The synergistic term (S) is defined as the sum of the change in corrosion rate due to wear (wear
accelerated corrosion) and the change in wear rate due to corrosion (corrosion-accelerated wear).
However this approach shows some limitations due to the mandatory use of external references
for evaluating the synergy. The difficulty consists in measuring a single effect while suppressing
the other one with an experimental technique that does not alter the conditions of the test [62].
The mechanistic approach distinguishes two main contributions: anodic dissolution (wear-
accelerated corrosion) and mechanical removal of metal particles (mechanical wear). A
methodology for quantifying the two contributions was developed at the Ecole Polytechnique
Fédérale de Lausanne (EPFL, Switzerland) in the early 1990s [62,69,78-80]. They observed on one
hand that the electrochemical material removal rate is strongly influenced by mechanical
parameters and, on the other hand, that mechanical material removal rate depends on the
prevailing electrochemical conditions.
In this approach and for a mechanistic interpretation of the tribocorrosion phenomenon the total
wear volume (Vtot) is understood as the sum of the metal loss due to chemical or electrochemical
oxidation (Vchem) and the metal loss due to mechanical wear (Vmec) [62]. The approach leads to
equation (1.12):
(1.12)
In passive metals, Vchem is the sum of the corrosion in the passive areas and the corrosion in the
depassivated areas, although the former is usually neglected compared to the magnitude of the
latter. The oxidation kinetics can be quantified in situ and in real time by measuring the current
flowing through the metal electrode (Ip) in potentiostatically controlled experiments [78]. In a
potentiostatic tribocorrosion experiment the amount of anodically oxidized metal (Vchem) can be
determined from the measured current using Faraday’s law:

Chapter 1 - Introduction
37
(1.13)
Where Q is the electric charge flowing in the wear track obtained by integrating the measured
current (Ip) over time (t) of the experiment:
∫
(1.14)
M is the atomic mass of the metal, n is the charge number for the oxidation reaction (apparent
valence), F is the Faraday constant and ρ is the density of the metal.
According to Landolt et al. [73] equation (1.13) can be applied under two assumptions: (1) the
measured current must be equal to the anodic partial current for metal oxidation (negligible
cathodic partial currents) and (2) the charge number n for the oxidation reaction must be known.
The latter can be a problem for pure metals in which the valence of the oxidation products varies
with the applied potential and for alloys with complex chemical oxide composition [69,73]. In
those cases, n can be determined only through detailed surface analysis [62].
The total wear volume (Vtot) is determined by measuring the volume of the wear track after the
experiment by profilometric techniques or by measuring the vertical displacement of the ball
during rubbing. The mechanical volume (Vmec) is then obtained by subtracting the anodic volume
(Vchem) from the wear track volume (Vtot):
(1.15)
Unfortunately, there is no experimental way to determine Vchem and inconsistencies can be found
when interpreting tribocorrosion results using this approach [81,84,85].
The two degradation mechanisms in a tribocorrosion system do not proceed independently,
meaning that mechanical and chemical phenomena interact with each other. Dependence of the
anodic volume on mechanical parameters has been found and is expected because the oxidation is
related to a mechanical depassivation process. The chemical and mechanical metal rates depend
not only on surface chemistry (provided by electrochemical applied potential), but also on
mechanical factors (i.e. applied load). Thus, the simple calculation of both contributions (Vchem and
Vmec) to the whole wear damage may not be sufficient for the fundamental understanding of
tribocorrosion sliding systems. Therefore, although useful for specific interpretations (i.e. studies

Corrosion and tribocorrosion study of CoCrMo biomedical alloy
38
of the tribocorrosion resistance of coatings) the described approach cannot explain phenomena
such as the build-up of third bodies [62].
The third-body approach was defined from a material point of view as a zone with a different
composition from that of the bulk first bodies and, from a mechanical point of view as operators
transmitting load between first bodies while accommodating during its progress in the contact
[62]. The third body mechanism is based on the observation that mechanical wear usually results
in the formation of wear debris, which remains in the tribological contact for a certain period
before it is eliminated. Fractions of the metal particles can be ejected from the contact, get
oxidized or they can be transferred back on the metal surface by smearing, as shown in Figure
1.11.
Figure 1.11 – Scheme of material flows occurring during the formation of third bodies in a tribocorrosion experiment of a passive metal (first body) sliding against an inert counterpart (second body) [77].
The role of third body particles is particularly critical in tribocorrosion systems because depending
on their physical properties they can act as an abrasive accelerating wear or as a solid lubricant
diminishing friction and wear. From this point of view several parameters can be considered to
influence the properties and behaviour of third bodies: mechanical parameters (contact pressure,
sliding velocity, and lubrication), surface chemical effects (metal oxidation and dissolution,
adsorption of chemical compounds present in the surrounding environment) and material
properties (composition, microstructure, hardness). The influence of the mechanical conditions of
the contact on the third body behaviour has been found varying with the load: higher normal

Chapter 1 - Introduction
39
loads lead to higher amounts of wear debris in tribocorrosion experiments [62]. The effect of the
material properties has been found in the formation of large amount of wear particles observed in
hard materials and in the low debris formation of high yield strength materials. The
electrochemical conditions in the contact also have a significant influence on the formation rate
and the properties of third bodies [62].
The nanochemical wear approach focuses on tribocorrosion mechanisms that involve subsurface
structural or chemical modifications at the nano-scale of the material. The mechanism consists of
two main steps: (1) the formation of a nanocrystalline microstructure at the contact subsurface
produced by the strain accumulation and (2) the wear generated by detachment of nano-grains.
1.3.5 Modeling in tribocorrosion
Several tribocorrosion models have been proposed in literature [61]. For the purpose of this thesis
two models were developed in terms of analysing the evolution of the OCP in tribocorrosion
sliding systems and the role of the passivation kinetics: the galvanic cell model for tribocorrosion at
OCP and the current transient model.
i. Galvanic cell model for tribocorrosion at open circuit potential
This model has been first developed by Vieira et al. [76] to quantify wear accelerated corrosion
and it has been successfully applied to a series of metals by Papageorgiou and Mischler [86].
In a classic laboratory tribometer experiment, without an externally imposed electrode potential,
i.e. at OCP, when the ball slides on the disk and removes the oxide protective layer, the passive
film is locally removed thus exposing bare metal to the solution. The Ecor of the bare metal differs
from the potential of the surrounding passive areas since its oxidation kinetics is much higher. As a
consequence a galvanic coupling forms between passive and depassivated zones. The Ecor of the
abraded metal and thus wear accelerated corrosion depends on this galvanic coupling. This effect
can best be visualized using the Evans diagrams (Figure 1.12) representing the evolution of the
current density (reaction rate) of the cathodic (reduction of dissolved oxygen for example) and
anodic reaction (metal oxidation) as a function of the electrode potential.

Corrosion and tribocorrosion study of CoCrMo biomedical alloy
40
In absence of rubbing Ecor (Figure 1.12a) corresponds to the intersection of the cathodic and the
anodic curves. The rubbed areas experience an increase in metal oxidation rate because of the loss
of passivity. Therefore their theoretical corrosion potential is expected to move towards more
cathodic values (E’cor in Figure 1.12b). However, since the depassivated and still passive areas are
in electronic contact, a galvanic coupling occurs. In an ideal short circuit condition the two areas
would reach the same potential situated in between Ecor and E’cor. However, due to the finite ionic
resistance R of the solution a difference in potential, given by the product of R time the current Ia,
is maintained between depassivated and passive areas, which attain the potentials Ea and Ec,
respectively (Figure 1.12c).
Figure 1.12 – Schematic Evans diagrams showing the situation of a passive metal (a) before rubbing and (b) during rubbing. The potential established in the galvanic coupled passive and depassivated worn areas are shown in (c) [61].
Based on this approach, Vieira et al. [76] developed a simple galvanic coupling model for
describing the potential of depassivated (Ea) and passive (Ec) areas created during rubbing [61].
In a galvanic cell the anodic current Ia is equal to the absolute cathodic current Ic. Considering the
cathodic ic and anodic ia current densities one can write
(1.16)
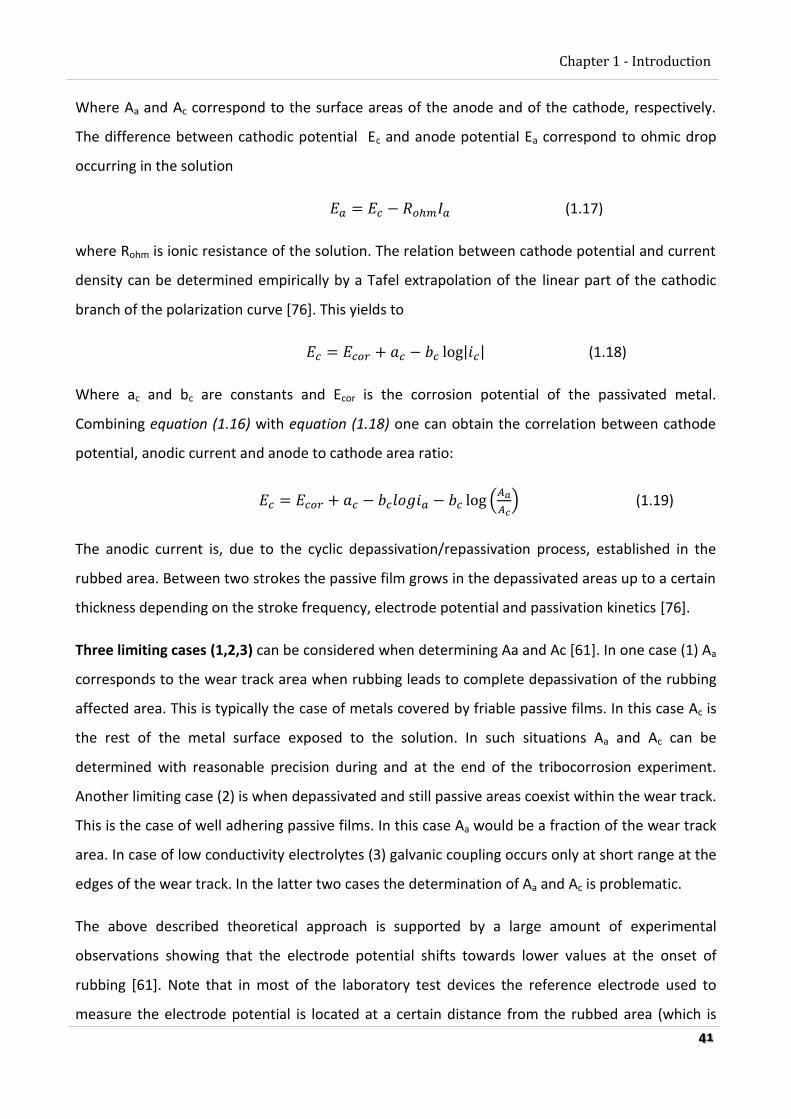
Chapter 1 - Introduction
41
Where Aa and Ac correspond to the surface areas of the anode and of the cathode, respectively.
The difference between cathodic potential Ec and anode potential Ea correspond to ohmic drop
occurring in the solution
(1.17)
where Rohm is ionic resistance of the solution. The relation between cathode potential and current
density can be determined empirically by a Tafel extrapolation of the linear part of the cathodic
branch of the polarization curve [76]. This yields to
| | (1.18)
Where ac and bc are constants and Ecor is the corrosion potential of the passivated metal.
Combining equation (1.16) with equation (1.18) one can obtain the correlation between cathode
potential, anodic current and anode to cathode area ratio:
(
) (1.19)
The anodic current is, due to the cyclic depassivation/repassivation process, established in the
rubbed area. Between two strokes the passive film grows in the depassivated areas up to a certain
thickness depending on the stroke frequency, electrode potential and passivation kinetics [76].
Three limiting cases (1,2,3) can be considered when determining Aa and Ac [61]. In one case (1) Aa
corresponds to the wear track area when rubbing leads to complete depassivation of the rubbing
affected area. This is typically the case of metals covered by friable passive films. In this case Ac is
the rest of the metal surface exposed to the solution. In such situations Aa and Ac can be
determined with reasonable precision during and at the end of the tribocorrosion experiment.
Another limiting case (2) is when depassivated and still passive areas coexist within the wear track.
This is the case of well adhering passive films. In this case Aa would be a fraction of the wear track
area. In case of low conductivity electrolytes (3) galvanic coupling occurs only at short range at the
edges of the wear track. In the latter two cases the determination of Aa and Ac is problematic.
The above described theoretical approach is supported by a large amount of experimental
observations showing that the electrode potential shifts towards lower values at the onset of
rubbing [61]. Note that in most of the laboratory test devices the reference electrode used to
measure the electrode potential is located at a certain distance from the rubbed area (which is

Corrosion and tribocorrosion study of CoCrMo biomedical alloy
42
usually a small fraction of the sample area). Therefore the measured potential is thought to
correspond quite closely to Ec.
Vieira et al. [76] applied the model to the tribocorrosion of aluminium alloys (alumina antagonist).
Assuming a completely depassivated wear track (Aa) this simple model provided an accurate
description of the evolution of potential during rubbing in NaCl solutions. However, under this
assumption the model could not be applied for NaNO3 solutions probably because passive zones
were still maintained within the wear track due to the higher hardness of the passive film [61].
Clearly, this model needs further validation. Nevertheless it constitutes a promising predictive tool
for evaluating the electrochemical conditions in a tribocorrosion system.
ii. Current transient model
For a passive film covering the entire surface, two types of rate-limiting processes can be
distinguished: (1) high field assisted ionic transport through the film or (2) charge transfer at either
the metal/film or film/electrolyte interface. These purely electrochemical models will be referred
to as high field (HFM) and interface (IFM) models, hereafter. The HFM model assumes that the
transport of ionic species in the oxide by migration limits the growth rate of the passive film: at
constant potential the electric field diminishes with increasing oxide thickness and so does the
growth rate. The IFM model assumes that the electrochemical reactions at either the metal-oxide
or the oxide-solution interface limit the growth rate. The electric field in the oxide is constant and
therefore the potential difference at the interface, and hence the growth rate, diminishes with
increasing film thickness [62]. These classical electrochemical models were used already in the
1980s in the first attempts to model current transients measured during scratch tests by
considering ohmic effects and film growth kinetics according to the HFM model [65,66,68,82].
Scratch tests on iron and AISI 304L stainless steel in KOH under potentiostatic conditions were
carried out in order to mechanically remove a pre-existing oxide film and thus obtaining fresh
electrodes. Subsequent analysis of the current transients during repassivation followed the
classical high-field ion conduction model.
For the purpose of this thesis a theoretical model developed by Jemmely et al. [70] was applied in
order to simulate passive film growth in potentiostatic experiments. By theoretically modeling
the shape of the current transient and its magnitude one can get information on how
repassivation kinetics affects the chemical metal removal rate under tribocorrosion conditions. As
the ball moves on, the depassivated surface area re-oxidizes, a process which implies a loss of

Chapter 1 - Introduction
43
electrons of the reacting metal atoms and, hence, a charge transfer reaction at the interface which
yields either dissolved metal ions or a solid oxide [70].
Two distinct models for describing passivation of an activated surface are considered here, both
being based on the assumption that only solid oxides but no dissolved ions are formed in the
anodic reaction. This assumption is critical and will be further discussed in Chapter 5. The first
model (the surface coverage model) assumes that the passive film on a surface element of area A
is removed entirely and the metal oxidation occurs exclusively on the bare metal surface leading
to lateral growth of an oxide (in principle of monolayer thickness). The current stops when the
oxide covers the entire surface. In the second model (the film growth model), it is assumed that
an anodic oxide grows uniformly on the surface, the growth rate being determined by high field
conduction (HFM) [70]. This model is not expected to be physically realistic in the very first
moments of repassivation, but it provides useful insight into the behaviour at later stages. The
two models describing limiting cases can be combined by assuming lateral growth up to
monolayer coverage followed by growth in thickness. The combination of the two models showed
results very similar to the second approach [70], for which only the second model will be
developed in this chapter.
The current density for high field conduction is described by equation (1.20)
(
) (1.20)
Here, is the potential difference across the oxide film, which is assumed to correspond to the
difference of the electrode potential and the minimum value of potential needed for film
formation
(1.21)
The potential Eg is the passivation potential, i.e., the minimum potential where film growth starts.
The other quantities in Equation (1.20) are the film thickness L, the kinetic constants kB , and B
which characterizes film growth.
For migration of a single ionic species
(1.22)

Corrosion and tribocorrosion study of CoCrMo biomedical alloy
44
where z is the charge of the migrating ionic species, α a symmetry coefficient and a the jump
distance [70]. For the calculation of the current–time transient, one sets for the film thickness L:
(1.23)
Here, q is the charge passed, Mox is the atomic mass of the metal oxide, n is the charge number for
the oxidation reaction (apparent valence), F is the Faraday constant and ρox is the density of the
metal oxide.
With equations (1.20), (1.21), (1.22) and (1.23) one obtains after transformation:
( )
( ) ( )
(1.24)
where B’=B/kν.
The growth rate constant (kB) and constant B’ can be extrapolated from experimental results.
Equation (1.24) can be numerically solved for the current density varying the potential and the
ohmic resistance leading to current transient profiles.

45
2 Aim of the work
This work aims to analyze some of the aspects concerning CoCrMo biomedical
alloy degradation and to investigate their role in tribocorrosion through laboratory
experiments by triboelectrochemical techniques and surface characterization. The
study included both corrosion and tribocorrosion experiments conducted in the
presence and absence of a cell culture on the CoCrMo surface. The purpose is to
understand if the cell culture affected the electrochemical and wear behaviour of the
metal surface: focus will be held on the analysis of the possible different behaviour
created by the removal of the cells before testing.
The tribocorrosion mechanisms introduced in chapter 1 contribute to the fundamental
understanding of tribocorrosion, but not much to the prediction of the phenomena.
Thus the predictive model of the galvanic coupling between depassivated and
passivated areas in the working electrode will be taken into account. The model will be
validated comparing the simulation to the experimental results obtained. Another
existing model used in the prediction of the passivation transients will be validated.
Finally the study of variables such as the electrochemical potential and the contact
characteristics (i.e. counterpart material, load) on the corrosion and tribocorrosion
behaviour of the studied biomedical alloys, which can be very useful for improving the
understanding of the tribocorrosion mechanisms, will be carried out.

46
3 Materials and methods
In this chapter all the materials, the equipment and the procedures
employed for approaching the objectives of the current thesis will be
presented. The first chapter provides a description of the samples and
the solutions used. In the second part there will be a general picture of
the electrochemical techniques applied followed by the tribocorrosion
experiment procedures. At the end an overview of the methods applied
for surface characterization will be presented.
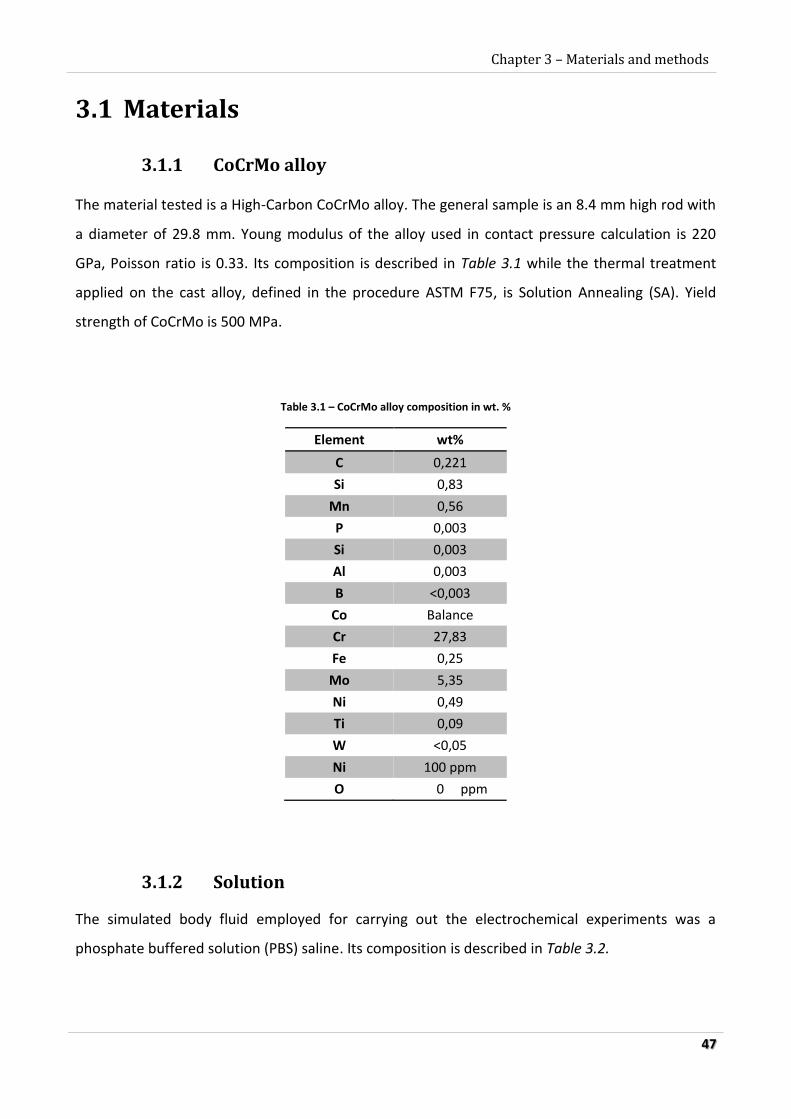
Chapter 3 – Materials and methods
47
3.1 Materials
3.1.1 CoCrMo alloy
The material tested is a High-Carbon CoCrMo alloy. The general sample is an 8.4 mm high rod with
a diameter of 29.8 mm. Young modulus of the alloy used in contact pressure calculation is 220
GPa, Poisson ratio is 0.33. Its composition is described in Table 3.1 while the thermal treatment
applied on the cast alloy, defined in the procedure ASTM F75, is Solution Annealing (SA). Yield
strength of CoCrMo is 500 MPa.
Table 3.1 – CoCrMo alloy composition in wt. %
3.1.2 Solution
The simulated body fluid employed for carrying out the electrochemical experiments was a
phosphate buffered solution (PBS) saline. Its composition is described in Table 3.2.
Element wt%
C 0,221
Si 0,83
Mn 0,56
P 0,003
Si 0,003
Al 0,003
B <0,003
Co Balance
Cr 27,83
Fe 0,25
Mo 5,35
Ni 0,49
Ti 0,09
W <0,05
Ni 100 ppm
O 0 ppm

Corrosion and tribocorrosion study of CoCrMo biomedical alloy
48
Table 3.2 – Composition of PBS
COMPOUND CONCENTRATION [g/l]
NaCl 8
KCl 0,2
Na2HPO4 1,44
KH2PO4 0,25
The PBS solution was prepared at pH values of 7.4 and it was preheated before each experiment.
The solution was poured into the cell and maintained at a temperature of approximately 37°C
during the experiments. All experiments of the current thesis are executed with a PBS solution at
37°C.
3.1.3 CoCrMo with cells
A cell culture was processed on polished CoCrMo samples in order to investigate the effects of the
adhesion of cells on the alloy. The CoCrMo rods are 5.7mm high and have a diameter of 19.2mm.
The cell line of osteoblasts grown on the alloy is the Saos-2 osteosarcoma. This cell line was
cultivated in Dulbecco’s modified Eagle’s medium (DMEM) without red phenol and also contained
a 10% (v/v) of fetal bovine serum (FBS) and 1% of Penicillin-Streptomycin (DMEMc).
On half of the samples, the cell line cultures were removed after the growth. The detachment was
performed by washing with PBS first and by adding 1ml of Trypsin-EDTA. On the surface of these
samples there is a trace of cells remains, easily located with an optical microscope as shown in
Figure 3.1. The superficial chemical composition of the surface of these samples may be altered by
the generation of the extracellular matrix. On the other half of the samples (Figure 3.2) the cells
where fixed on the surface by adding glutaraldehyde at 2,5% in PBS first and by washing with
water and ethanol secondly.
Samples of CoCrMo with fixed cells are indicated in this thesis as “CoCrMo-c” while samples where
cells have been grown and then removed are named as “CoCrMo-rc”.

Chapter 3 – Materials and methods
49
Figure 3.1 – Optical microscope images of the surface of a CoCrMo-rc sample before the experiments.
Figure 3.2 – Optical microscope images of the surface of a CoCrMo-c sample before the experiments.
3.1.4 Counterpart: ball
Two different materials were tested as a counterpart in the tribocorrosion experiments: alumina
and polyethylene. The polycrystalline alumina balls used as a counter piece were 6 mm in
diameter. Young modulus used in contact pressure calculation is 300 GPa while Poisson ratio is
0.21. The high density polyethylene employed in the tests is the PE-UHMV usually utilized for
surgical implants. Its Young modulus is 0.72 GPa and its Poisson ratio is 0.5.
Yield strength values for alumina and PE considered in this thesis are 230 MPa and 30 MPa
respectively.

Corrosion and tribocorrosion study of CoCrMo biomedical alloy
50
3.2 Corrosion experiments
3.2.1 Surface preparation
Samples were mechanically polished, washed with pure water and dried with compressed air
before use in each experiment. The polishing was performed by wet grinding with grit SiC paper
500, 1000, 2400 and 4000. The samples were consequently polished using diamond particles of 1
µm. These polishing operations of the working electrode were performed on a Struers Labopol-21
polishing machine with rotating disks.
3.2.2 Electrochemical measurements
The basic configuration of three-electrode is used for carrying out the electrochemical
measurements as described in chapter 1.2.2. A silver/silver chloride electrode (Ag/AgCl) was used
as RE. Thus, in the current thesis, all potentials are given with respect to this electrode, the
standard of which is 0.205 V with respect to the SHE. The CE employed in this experimental work is
a platinum electrode (Figure 3.3).
Figure 3.3 - Counter electrode (1) and reference electrode (2)
Electrochemical measurements were carried out using described electrodes connected to a
Solartron 1286 Potentiostat controlled by CorrWare software or to an Autolab 302N Potentiostat
controlled by Nova 1.7 software.

Chapter 3 – Materials and methods
51
All the experiments were repeated at least 2 times in order to verify the reproducibility of the
results.
The polarization curves were carried out according to the following sequence:
- Measurement of the OCP for 30 min
- Potentiodynamic test from OCP to -1,1V at a sweep rate of 1mV/s
- Potentiodynamic test from -1,1V to 1,2V at a sweep rate of 1mV/s
The current transients were measured using potential step chrono-amperometry. The tests were
carried out in an electrochemical cell using the same electrodes as in the potentiodynamic
polarization curves test. The passivation transients were analysed employing the following steps:
- Potentiostatic test at -1,1V for 5 min
- Potentiostatic test at desired potential for 30 min. Three anodic potentials were tested:
-0,2V, 0V, 0,2V.

Corrosion and tribocorrosion study of CoCrMo biomedical alloy
52
3.3 Tribocorrosion experiments
3.3.1 Experimental settings
Alloys surface is prepared as described in Chapter 3.2.1 before each tribocorrosion experiment.
Once the surface has been polished it can be placed on the support of the tribometer where it is
established an electrical connection between the sample (the working electrode) and the
potentiostat through the tribometer.
The device employed to execute the tribo-electrochemical measurements is a rotating Ball-on-Disk
equipment with an electrochemical cell including a silver/silver chloride reference electrode and a
platinum coil as a counter electrode (Figure3.4).
Figure 3.4 – Silver/silver chloride RE and platinum coil CE
For the tribological wear experiments an alumina ball or PE ball are employed. To obtain the
tribological measurements a Microtest S.A. (model MT 60/NI/CORR) tribometer was employed.
The tribometer spins around a fixed axis at a variable speed of rotation. This setting allows to
measure the electrochemical magnitudes while applying a normal load and recording the frictional
force.

Chapter 3 – Materials and methods
53
The equipment described is illustrated in Figure 3.5.
3.3.2 Contact pressure
Several models exist for describing the extent of anodic current induced by sliding on passive
metals as a function of contact geometry. For the configurations used in evaluating CoCrMo alloys
(metal flat sliding against polished Al2O3 balls), the most useful model is the one corresponding to
a flat smooth inert counter piece sliding over a relatively rough metal. Here we consider that the
Hertzian elastic deformation produces a flat macroscopic contact area. Depassivation occurs thus
by plastic deformation of microscopic asperities contacting the counter body within the hertzian
contact area. An average Hertzian contact pressure can be predicted between the ball and the
sample considering an elastohydrodynamic lubrication model. Elastohydrodynamic lubrication is a
form of hydrodynamic lubrication where the elastic deformation of the contacting bodies and the
changes of viscosity with pressure play fundamental roles [63].
From elementary mechanics it is known that two contacting surfaces under load will deform. The
deformation may be either plastic or elastic depending on the magnitude of the applied load and
the material's hardness. Consequent to the deformation is the generation of stresses, which can
be determined from the analytical formulae, based on the theory of elasticity, developed by Hertz
in 1881 [63].
Figure 3.5 – Tribometer (left) with electrochemical cell (right)

Corrosion and tribocorrosion study of CoCrMo biomedical alloy
54
Hertz's model of contact stress was first based on the following simplifying assumptions [63]:
the materials in contact are homogeneous and the yield stress is not exceeded,
contact stress is caused by the load which is normal to the contact tangent plane,
the contact area is very small compared with the dimensions of the contacting solids,
the contacting solids are at rest and in equilibrium,
the effect of surface roughness is negligible.
Subsequent refinements of Hertz's model by later workers have removed most of these
assumptions, permitting the application to sliding conditions and tangential forces. Hertz's theory
forms the basis of the model of elastohydrodynamic lubrication used in the current thesis.
Applying Hertz’s theory for the general case of two spheres in contact, it is possible to deduce
formulae that can be applied in the tribometer ball on plate interaction. The formulae for the main
contact parameters of two spheres in contact are summarized in Table 3.3.
Table 3.3 - Formulae for contact parameters between two spheres [63]
Where:
a is the radius of the contact area [m];
W is the normal load [N];
P is the contact pressure (Hertzian stress) [Pa];
δ is the total deflection at the centre of the contact (i.e. δ = δA + δB; where ‘δA’ and
‘δB’ are the maximum deflections of body ‘A’ and ‘B’ respectively) [m];
τ is the shear stress [Pa];
z is the depth under the surface where the maximum shear stress acts [m];
E' is the reduced Young's modulus [Pa];
R ' is the reduced radius of curvature [m].

Chapter 3 – Materials and methods
55
The reduced Young's modulus is defined as:
[
] (3.1)
Where νA and νB are the Poisson’s ratios of the contacting bodies A and B respectively and EA and
EB are the Young’s moduli of the contacting bodies A and B respectively.
For the purpose of this thesis the geometry of a contact between a flat surface and a convex
surface is considered, Figure 3.6. The formulae in Table 3.3 can be applied to this case by
considering an infinite radius of curvature for body B.
Figure 3.6 – Geometry of two bodies with one convex and one flat surface in contact [63]
The reduced radius of curvature for two spheres in contact is defined according to this theory as
(3.2)
Since one of the contacting surfaces is a plane then it has infinite radii of curvature, i.e.:
(3.3)
In the particular case of this thesis the ball used has spherical geometry then the contact area
between a sphere and a plane surface must be considered, see Figure 3.7. Symmetry of the sphere
applies so that
(3.4)
The reduced radius of curvature is therefore given by:
(3.5)

Corrosion and tribocorrosion study of CoCrMo biomedical alloy
56
Figure 3.7 – Contact between a sphere and a flat surface [63]
The contact parameters for the configuration illustrated in Figure 3.7 and discussed above can be
calculated according to the formulae summarized in Table 3.3 and an average Hertzian contact
pressure can be estimated.
3.3.3 Experimental sequences
The experiments were carried out applying normal loads of 1N or 3N. The cell of the tribometer
was rotating creating a reciprocating velocity of 60 rpm. The radius of the circular track formed
was approximately 6mm. The average contact pressures estimated between the alumina ball and
the CoCrMo surface were 495 MPa and 714 MPa respectively. The average contact pressures
calculated for the experiments with polyethylene balls were of the magnitude of 12 MPa for 1N
and of 18 MPa for 3N.
All the experiments have been repeated at least 2 times in order to verify the reproducibility of
the results. Tribocorrosion tests were performed both at OCP and at an applied anodic potential of
0V.
For the potentiostatic experiments at 0V the procedure is the following:
- OCP measurement for 10 min
- Potentiostatic test at -1,1V for 5 min

Chapter 3 – Materials and methods
57
- Potentiostatic test at 0V for 60 min
- Potentiostatic test at 0V for 60 min with sliding at 60 rpm
- 20 min of recovery at 0V after the sliding has ended.
OCP tests were carried out with the following procedure:
- Potentiostatic test at -1,1V for 5 min
- OCP measurement for 60 min
- OCP measurement for 60 min with sliding at 60 rpm.
- 20 min recovery at OCP after the sliding has ended.
3.3.4 Surface analysis
Once the triboelectrochemical tests were completed the materials surfaces were analysed in order
to characterize tribocorrosion damage.
Confocal microscopy was used to quantify the total wear volume of the sample by profilometric
techniques. The microscope model is an Olympus LEXT OLS3000. On each CoCrMo sample, several
profiles along the wear track perpendicularly to the sliding direction were taken. Wear volume can
be calculated from these profiles by integrating the wear track cross-section obtained by scanning
laser profilometry and multiplying for the perimeter of the track. Also the alumina and PE balls
were analysed with this microscope.
The worn surfaces were also observed by scanning electron microscope (SEM). The energy of the
incident beam was 20kW. An energy-dispersive X-ray (EDX) spectroscopy was employed in the
analysis of the debris produced.

Corrosion and tribocorrosion study of CoCrMo biomedical alloy
58
3.3.5 Overall wear volume calculation
The mechanistic approach described in chapter 1.3.4 was chosen to study the tribocorrosion
mechanisms. After profilometry of the sample has been obtained it is possible to calculate the
overall volume of metal lost during the experiment. Integration of values below zero within the
wear track with an Excel worksheet identifies the area removed by tribocorrosion (wear track area
Awt in Figure 3.8). This area was calculated in several points along the track and an average value
was estimated. The average area value is then multiplied by the wear track length L to obtain
volume V.
(3.6)
A schematic diagram illustrates the profile and the wear track area:
Figure 3.8 – 2D schematic profile of the wear track: the profile obtained with the confocal (dark blue) is integrated along x-axis within the wear track to obtain the wear track area Awt(light blue)
In the experiments were PE balls have been employed a simple model was used to calculate the
volume of PE lost during rubbing. Through confocal microscopy it is possible to measure the area
(Aball) of the PE ball abraded. Assuming perfect sphere geometry, from this area, knowing the
radius of the ball R, it is possible to evaluate the volume of the segment of the sphere (spherical
cap) applying equations (3.7) and (3.8):
(
) (3.7)
√
(3.8)
Where h is the height of the spherical cap.
Awt

Chapter 3 – Materials and methods
59
3.3.6 Metal loss by electrochemical oxidation at OCP
The amount of metal loss due to electrochemical oxidation during the sliding can be determined
from the measured current using Faraday’s law, as explained in chapter 1.3.4. However the
measurement of the current is only possible in potentiostatic tests. Thus, another approach must
be considered for the OCP tests where no measurement of current density is conceivable.
Wear accelerated corrosion can be quantified using a galvanic coupling model proposed by Vieira
et al. [76] as described in chapter 1.3. The cathodic shift of OCP during the sliding is usually
attributed to the removal of surface films by abrasion leading to an enhanced anodic reactivity of
the metal exposed to the solution and thus to a modification of the electrode potential [61]. Thus
rubbing at open circuit potential can accelerate the corrosion rate (ia in equation (1.19)) inside the
wear track through the abrasion of the passive film. Equation (1.19) can be reformulated in order
to express the extent of wear accelerated corrosion as a function of geometrical and
electrochemical parameters.
(
) (3.9)
Where Ecor [V] is the corrosion potential, Ec [V] is the potential attained before rubbing stops; ac
and bc are Tafel constants. Aa corresponds to the wear track area (measured at the end of the
experiment). Ac corresponds to the cathode area which can be approximated by the sample area.
The chemical wear volume for OCP tribocorrosion tests was determined by introducing the ia
values calculated into Faraday’s equation. For each test the mechanical wear volume Vmec was
then determined by subtracting Vchem from the overall wear volume.

60
4 Results
In this chapter all the results of this thesis will be presented. The
corrosion results will be offered first. Tribocorrosion tests will be
presented in the second part, showing the results obtained at OCP and
at an applied passive potential of 0V. Different counterpart materials
(alumina and PE balls), the presence of the cells on the samples and
the effect of different loads, producing different contact pressure, will
be analysed in the tribocorrosion experiments.

Chapter 4 - Results
61
4.1 Corrosion experiments
In this section the electrochemical results corresponding to the OCP measurements, polarisation
curves and passivation kinetics will be presented.
4.1.1 OCP measurements
Figure 4.1 shows the time evolution of the Open Circuit Potential of the CoCrMo alloys during 30
min. As explained in chapter 3 “CoCrMo-c” indicated samples with cell growth while “CoCrMo-rc”
(removed cells) labels the samples where cells have been grown and then removed. Dashed lines
represent the repetitions of the experiments, representative of the reproducibility of the results.
Figure 4.1 - Time evolution of OCP of CoCrMo samples
As observed in Figure 4.1 the OCP of the CoCrMo starts from more cathodic values and increases
toward anodic values, reaching a stable value approximately after 600s. The average OCP value of
the CoCrMo is -255 mV with a deviation of 75 mV.
CoCrMo-c and CoCrMo-rc show much higher OCP values, around 0V. OCP of CoCrMo-c is very
constant from the beginning of the test, while OCP of CoCrMo-rc slightly increases during the first
600s. Table 4.1 summarizes the mean values obtained during the OCP tests. Standard deviation
from the mean value of these results is an indication of the reproducibility of the experiments
under these conditions.

Corrosion and tribocorrosion study of CoCrMo biomedical alloy
62
Table 4.1 - Mean OCP values and standard deviation
SAMPLE OCP [V]
CoCrMo -0.255 ± 0.075
CoCrMo-rc 0.027 ± 0.055
CoCrMo-c -0.027 ± 0.072
4.1.2 Polarization curves
Polarization curves of the CoCrMo, CoCrMo-c and CoCrMo-rc samples are shown in Figure 4.2.
Figure 4.2 - Polarisation curves of CoCrMo, CoCrMo-c and CoCrMo-rc samples in PBS. Dashed vertical black lines show the potentials involved in tribocorrosion tests.
The cathodic domain of the CoCrMo is situated at potentials below -0.44V, which is the average
value of the corrosion potential (point of transition from cathodic to anodic current densities). In
this region the current density is determined by the reduction of water and, to a lesser extent, by
the reduction of oxygen dissolved in the solution. In the CoCrMo-c and CoCrMo-rc samples this
region is reduced and it is situated at potentials below -0.91V and -0.81V respectively.
Potentials between -0.44V and -0.3V correspond to the active region of the CoCrMo. No active
peak is observed for the CoCrMo. This region is situated at more cathodic potentials for the
CoCrMo-rc and the CoCrMo-c samples and it presents higher current densities. A smooth active
peak is observed. In both cells-treated samples the active region ends at the passivation potential

Chapter 4 - Results
63
of -0.6V. The passive domain of the CoCrMo extends from -0.3 V up to the breakdown potential
(0.4-0.6V). In the passive domain of the CoCrMo-rc and CoCrMo-c the current density slightly
decreases with the applied potential. Transpassive region is characterized by potentials above
0.4V for the CoCrMo and above 0.5V for the CoCrMo-c and CoCrMo-rc. Above the transpassive
potential the current increases due to water oxidation and oxidation of Cr3+ species into soluble
Cr6+ [88].
Tribocorrosion tests were carried out at the potentials shown in Fig. 4.2 with dashed lines. They all
correspond to the passive domains of the alloys: 0V was the applied potential of the potentiostatic
tests of the CoCrMo; approximately −0.3V for the CoCrMo and -0.5V for the CoCrMo-c and
CoCrMo-rc were the OCP established during rubbing.
Electrochemical parameters such as the corrosion potential, the corrosion and passive current
densities and the breakdown potential were extracted from the polarization curves of Figure 4.2
and they are shown in Table 4.2.
Table 4.2 - Electrochemical parameters of the CoCrMo/-c/-rc alloys
SAMPLE Ecorr [V] icorr [µA/cm2] ip [µA/cm2] Eb [V]
CoCrMo -0.49 ± 0.18 2.6 ± 1.8 3.6 ± 0.4 0.45 ± 0.09
CoCrMo-rc -0.81 7.9 6.8 0.5
CoCrMo-c -0.91 10 6.6 0.5
4.1.3 Passivation transients
Figure 4.3 shows typical passivation transients of CoCrMo at different applied potentials. The
current density decreases within the first seconds due to the passive film formation and further
reduces afterwards due to film thickening. This trend corresponds well with previously reported
passivation behaviour of CoCrMo alloys [88]. Tests were executed for 3 different passive
potentials: -0.2 V, 0 V and 0.2 V. Dashed lines represent repetitions under the same conditions.
Passivation kinetics is deduced from the evolution of the current density with time. In Figure 4.3
only the first 2 seconds of the time evolution are presented, as the current density values drop
very quickly (approximately in 0.5 s).

Corrosion and tribocorrosion study of CoCrMo biomedical alloy
64
Figure 4.3 - Kinetics of passivation of CoCrMo samples at 3 different anodic potentials
For a more focused insight of the current density drop, in Figure 4.4 the first 0.5 s of the current
density evolution are highlighted. The area under the current density represents the charge
needed for passivation. One can observe from this graph that this charge depends on the applied
potential and it is inversely proportional to the increase of the applied potential.
Figure 4.4 - Kinetics of passivation of CoCrMo samples at 3 different anodic potentials: first 0.5 s
V

Chapter 4 - Results
65
The passivation charge density Qp was determined by integrating the current density with time.
Average Qp values of two independent experiments are listed in Table 4.3 at different applied
passive potentials. This charge density corresponds to the amount of metal that is oxidized at a
given potential during passivation of a bare CoCrMo surface.
Table 4.3 - Passivation charge densities of CoCrMo in PBS solution
Potential [V] Passivation charge Qp [mC/cm2]
-0.2 7.39 ± 0.64
0 9.30 ± 1.58
0.2 8.08 ± 1.53

Corrosion and tribocorrosion study of CoCrMo biomedical alloy
66
4.2 Tribocorrosion experiments
Tests were carried out under two different electrochemical conditions: Open Circuit Potential
(OCP) and applied anodic potential (potentiostatic tests at 0V). Results for different loads and
counterpart materials are shown in both cases. Only for OCP tests the treatment of the CoCrMo
with cells was analysed.
4.2.1 Open Circuit Potential (OCP) experiments
During tribocorrosion tests carried out at open circuit potential the electrode potential shifted to
more cathodic values. Results at different applied loads (1N and 3N) are presented in Figure 4.5
for the CoCrMo sliding against an alumina ball. When rubbing stops the OCP recovers its original
level, reaching values of OCP more anodic than the ones established during rubbing. The overall
open circuit potential observed during rubbing results from the galvanic couple established
between the depassivated and still passive metal areas [88].
Figure 4.5 - Tribocorrosion test results at OCP with different loads: 1N and 3N
The effects of the CoCrMo treatment with cells are highlighted in the results of Figure 4.6. For
comparison purposes the evolution with time of the CoCrMo OCP is also presented. OCP evolution
during the tribocorrosion test of the CoCrMo-c and the CoCrMo-rc is very similar. The OCP
established in the first 35 min before sliding is more anodic than the CoCrMo potential, reaching
values around 0V. However, the cathodic shift in potential is much wider and leads to more

Chapter 4 - Results
67
cathodic OCP than the CoCrMo (200mV lower) in both cases. The typical OCP values lie depending
on the test around −0.5V, i.e. very close to the corrosion potential.
Figure 4.6 - OCP evolution with time in a tribocorrosion experiment for CoCrMo, CoCrMo-c and CoCrMo-rc
Figure 4.7 shows the tribocorrosion results of the CoCrMo sliding against a PE ball at different
applied loads (1N and 3N). After a small OCP cathodic shift at the onset of the rubbing the OCP
returns to the anodic values established before the sliding and reaches even more anodic values as
the experiment continues. When the rubbing stops, after 3900s, a very small cathodic shift of OCP
appears.
Figure 4.7 - OCP evolution of CoCrMo samples in tribocorrosion experiment with a PE ball as a counterpart

Corrosion and tribocorrosion study of CoCrMo biomedical alloy
68
Table 4.4 summarizes the OCP value before, during and after sliding. Potential drops (∆OCP)
generated at the onset of the sliding on the sample are presented in order to compare the
magnitude of the cathodic shift, independently from the initial OCP value (OCP0).
Table 4.4 – OCP and OCP drops in tribocorrosion tests with different loads and counterparts
Ball Sample Load OCP0 [mV] OCPsliding [mV] ∆OCP [mV] OCPf [mV]
Alumina
CoCrMo 1N -232 ± 70 -315 ± 47 128 ± 35 -179 ± 49
3N -347 -425 143 -290
CoCrMo-rc 1N -12 -468 525 -183
CoCrMo-c 1N -78 -488 452 -230
PE CoCrMo 1N -326 -289 69 -276
3N -255 -230 75 -200
4.2.2 Potentiostatic experiments at passive potential of 0V
In the case of tests conducted under an anodic applied potential, the evolution of the current was
plotted in Figure 4.8 as a function of time. The first 600s correspond to the passivation time prior
to rubbing where the initial current peak decreases rapidly with time due to the ongoing passive
film growth. At the onset of the rubbing (600s) the current sharply increases, this is due to the
removal of the passive film. The cyclic depassivation and repassivation sequence keeps the current
at a relatively high and constant value. Results at different applied loads (1N and 3N) are
presented in Figure 4.8 for a tribocorrosion test with an alumina ball as counterpart at the anodic
potential of 0V. The magnitude of the current increase at the onset of rubbing is proportional to
the applied load. After a small initial decrease a constant value seems to be reached until sliding
stops. Once the rubbing stops the current decreases again to the passive current value.

Chapter 4 - Results
69
Figure 4.8 - Current evolution in a tribocorrosion experiment at imposed anodic potential of 0V under 2 different applied loads
The chemical wear volume that, together with mechanical wear, contributes to the overall
degradation of the CoCrMo can be extracted from the current evolution plotted in Figure 4.8. For
this goal the following procedure has been used.
First the excess current Ir was determined by subtracting to the value of the current I during sliding
the average value of the current values measured just before rubbing (I0) and 60s after rubbing (If).
This calculation allows eliminating the contribution to the current from the area outside the wear
track. According to the Faraday's law the excess of current produced by rubbing at passive
potential corresponds to an equivalent metal volume (Vchem [cm3]) that was oxidized.
(4.1)
Here Qr [C] is the electric charge flowing in the wear track obtained by integrating current Ir over
time of the experiment (trub = 3600s), Mmol (58.59g mol-1) is the molecular mass of the alloy, n
(2.36) is the charge number [88], F (96500 C/mol) is Faraday’s constant and ρ (7.44 g cm-3) the
mass density. The charge number (n) was calculated from the alloy molar ratio by assuming an
oxidation valence of 2, 3 and 5 for Co, Cr and Mo, respectively. Results for Vchem calculated are
shown in the next section, in Table 4.8.
Tribocorrosion tests with PE balls as counterpart were also studied at applied potential. Results
under different applied loads (1N and 3N) are shown in Figure 4.9. Current increase at the onset of
rubbing appears, even though with a smaller intensity compared to the tests with alumina balls.

Corrosion and tribocorrosion study of CoCrMo biomedical alloy
70
Immediately after this current peak there is an exponential current recovery due to the
repassivation during sliding.
Figure 4.9 - Current evolution in a tribocorrosion experiment at an applied anodic potential of 0V with two different applied loads and a PE ball as a counterpart
Average values of current density before and after sliding are summarized in Table 4.5 for all tests.
The initial rise of current density at the onset of rubbing has been defined as ∆i. This value
considers the difference between the peak generated by rubbing the surface and the initial value
of i0. Final and initial current densities are similar in all cases, while peaks reached are dependent
on both the applied load and material of the ball.
Table 4.5 - Average values of current density before and after the sliding of the ball and current peaks in a tribocorrosion experiment of a CoCrMo alloy at 0V
Ball Load i0 [µA/cm2] ∆i [µA/cm2] if [µA/cm2]
Alumina 1N 0.23 ± 0.10 11.11 ± 4.78 0.08 ± 0.03
3N 0.34 ± 0.03 14.55 ± 2.99 0.10 ± 0.01
PE 1N 0.12 0.56 0.05
3N 0.11 2.72 0.04

Chapter 4 - Results
71
4.2.3 Friction and wear
The coefficient of friction (µ) was determined by taking the ratio between the measured frictional
force between the ball and the sample and the applied normal force. The coefficient of friction
was constant during all the experiments with no evident running in period, as shown in Figure
4.10.
Figure 4.10 – Coefficient of friction (COF) evolution of the CoCrMo at different applied loads and electrochemical conditions and with different counterpart materials
The average value of the coefficient of friction measured during rubbing with the corresponding
deviation is shown in Table 4.6 and Table 4.7 for the OCP and applied passive potential tests,
respectively. The COF for the alumina ball tests are around 0.4 and 0.7, while values for the PE
balls are one order of magnitude lower, shifting between 0.01 and 0.05.
Table 4.6 - Coefficient of friction: average values of tribocorrosion tests at OCP for the CoCrMo, CoCrMo-rc and CoCrMo-c under different applied loads and with different counterpart ball
Ball Sample Load µ
Alumina
CoCrMo 1N 0.62 ± 0.09
3N 0.46
CoCrMo-rc 1N 0.50
CoCrMo-c 1N 0.47
PE CoCrMo 1N 0.03 ± 0.03
3N 0.02

Corrosion and tribocorrosion study of CoCrMo biomedical alloy
72
Table 4.7 - Coefficient of friction: mean values of tribocorrosion tests at 0V for the CoCrMo under different applied loads and with different counterpart ball
Ball Load µ
Alumina 1N 0.59 ± 0.12
3N 0.60 ± 0.04
PE 1N 0.05
3N 0.03
Samples surfaces were analysed with confocal microscopy after each tribocorrosion experiment.
The profilometer cross sections of the CoCrMo samples are illustrated in Figure 4.11 and Figure
4.12 for OCP and applied passive potential (0V) tests respectively. Both the 1N and 3N profiles are
represented. The size of the wear tracks increases with applied load. Wear is much less severe at
lower potentials.
Figure 4.11 - 2D profile of CoCrMo surface wear track, applied load of 1N (a) and 3N (b) at OCP

Chapter 4 - Results
73
Figure 4.12 - 2D profile of CoCrMo surface wear track, applied load of 1N (a) and 3N (b) at 0V applied potential
The overall wear volume has been calculated from 2D profiles as explained in chapter 3.3.5. A
mean value of the area has been calculated by averaging the integrated profiles of several points
along the wear track. The width of the wear track is not constant, thus a mean value had to be
considered. Figure 4.13 and Figure 4.14 show the comparison of several wear tracks after
tribocorrosion tests at 1N at different zooms: CoCrMo at OCP, CoCrMo at 0V, CoCrMo-c and
CoCrMo-rc at OCP. Pictures were taken with confocal microscopy.
In Figure 4.14a it is possible to observe the presence of the adhered cells and the extracellular
matrix (ECM) on the sample CoCrMo-c. Also a 3D image of this sample has been obtained by
confocal microscopy (Figure 4.15). The inner area is the wear track, while the blue peaks on both
sides of the track represent the ECM. An intermediate region between the ECM and the track is
observed in this sample.
(b) (a) (b)

Corrosion and tribocorrosion study of CoCrMo biomedical alloy
74
Figure 4.13 - Confocal pictures of the wear track of CoCrMo samples of OCP (a) and 0V (b) experiments and of CoCrMo-c (c) and CoCrMo-rc (d) of OCP experiments. All tests employed a 1N load. Confocal zoom at 20x.
Figure 4.14 - Confocal pictures of the wear track of CoCrMo-c (a) and CoCrMo-rc (b) of OCP experiments with a 1N load. Confocal zoom at 10x.
(a) (b)
(c) (d)
(a) (b)

Chapter 4 - Results
75
Figure 4.15 – 3D image of a CoCrMo-c sample obtained by confocal microscopy.
The average value of the wear track area has to be multiplied by the wear track length to calculate
the overall wear volume (chapter 3.3.5). Chemical volume lost during sliding, Vchem, (see
mechanistic approach in Chapter 1.3) can be calculated applying Faraday’s law. As explained in the
methods of chapter 3.3.6 the galvanic coupling model has been used to evaluate the metal loss
due to electrochemical oxidation (Vchem) at OCP. Values of the Tafel constants, ac and bc, are -1.17
± 0.90 V and 0.22 ± 0.12 V for CoCrMo, -2.07 V and 0.28 V for CoCrMo-c and -2.48 V and 0.31 V for
CoCrMo-rc, respectively. These parameters were extrapolated from the cathodic branch of the
polarization curves by linear regression as shown in Figure 4.16.
Figure 4.16 - Extrapolation of the electrochemical parameters of the CoCrMo, CoCrMo-c and CoCrMo-rc for the galvanic coupling model.

Corrosion and tribocorrosion study of CoCrMo biomedical alloy
76
Mechanical volume is finally calculated by subtracting the chemical volume from the overall
volume. Results for all volumes are shown in Table 4.8 and they are graphically represented in
Figure 4.17.
Table 4.8 - Values of chemical, mechanical and total volume lost in the tribocorrosion experiments. *Indicates that for the tests where PE ball has been employed it is not possible to calculate the wear track of the sample, hence the volume of PE lost was
estimated by methods explained in chapter 3.5
Potential Ball Sample Load Vchem [10-3mm3] Vmec [10-3mm3] Vtot [10-3mm3]
OCP
Alumina
CoCrMo 1N 0.08 ± 0.03 0.78 ± 0.42 0.86 ± 0.40
3N 0.21 ± 0.05 2.79 ± 0.40 2.99 ± 0.38
CoCrMo-rc 1N 0.21 1.71 1.92
CoCrMo-c 1N 0.17 1.39 1.56
PE * CoCrMo 1N n.d. n.d 2.416
3N n.d. n.d. 8.085
0V
Alumina CoCrMo 1N 1.10 ± 0.28 1.88 ± 0.96 2.98 ± 0.68
3N 1.92 ± 0.91 2.23 ± 1.16 4.15 ± 0.75
PE * CoCrMo 1N n.d. n.d. 2.642
3N n.d. n.d. 11.784
Figure 4.17 – Wear volumes of tribocorrosion experiments with alumina ball. Columns represent the total volume; blue and red identify mechanical and chemical volume, respectively. Adjacent columns represent repetition tests results

Chapter 4 - Results
77
OCP experiments are characterized by the lowest wear volumes. Chemical volume results much
higher under the applied potential of 0V, while mechanical volume strongly increases with applied
load.
Calculation of volumes by profilometric analysis shows its limitations in the case of experiments
involving the PE ball; therefore no results for PE balls tests have been shown in Figure 4.17. As
shown in Figure 4.18 the track abraded by the PE ball is very small, almost negligible, and no
debris has been found. Consequently the model applied for calculating the overall volume from
profilometry is not applicable here since no distinct profile can be revealed by confocal
microscopy, neither with 1N or 3N loads applied.
Figure 4.18 - Wear track of a CoCrMO sample after a tribocorrosion experiment at applied potential of 0V and under a 3N load with a PE ball as counterpart
What is indicated in Table 4.8 as PE* refers to the calculation of the volume abraded from the PE
balls (considered a spherical cap as described in chapter 3.5). This phenomenon of abrasion is
observed in Figure 4.19, where a comparative image between the PE ball before and after a 0V
tribocorrosion test with a 3N load is given.

Corrosion and tribocorrosion study of CoCrMo biomedical alloy
78
Figure 4.19 – Comparison between the surface of a PE ball before (left) and after (right) rubbing. Image taken with confocal microscopy at 10x. for a potentiostatic test at the applied potential of 0V and an applied load of 3N
For comparison purposes also the abrasion of the surface of the alumina ball was analysed by confocal
microscopy. The area abraded in this case is much smaller, as visible in the images of Figure 4.20.
Figure 4.20 – Comparison between the surface of an alumina ball before (left) and after (right) rubbing. Image taken with confocal microscopy at 10x. for a potentiostatic test at the applied potential of 0V and an applied load of 3N
4.2.4 Wear morphology
SEM analysis was carried out after the tribocorrosion tests for the CoCrMo, CoCrMo-c and
CoCrMo-rc in order to characterize the wear morphology. A comparison of the wear track of the 3
samples is given in Figure 4.21.

Chapter 4 - Results
79
Figure 4.21 – Comparisons between the wear track of the CoCrMo (left), CoCrMo-c (middle) and CoCrMo-rc (right) at three different zooms with SEM: 100x (a), 1000x (b) and 5000x (c). Images at 5000x show the presence of debris particles in the wear
track of the size <10µm.
SEM micrographs zoomed at 5000x (Figure 4.21c) show the presence of wear particles of
dimensions ranging from a few hundreds nanometers to approximately 5 µm in all three analysed
samples. The larger particles appear to be constituted by agglomeration of finer debris.
(a) 100x
CoCrMo
CoCrMo
CoCrMo
CoCrMo-c
CoCrMo-c
CoCrMo-c
CoCrMo-rc
CoCrMo-rc
CoCrMo-rc
(c) 5000x
(b) 1000x

Corrosion and tribocorrosion study of CoCrMo biomedical alloy
80
The composition of these particles has been investigated with EDX analyses. Next results will show
the average composition obtained, considering only the chemical elements which present
significant atomic percentage in the surface: C, O, Cr, Mo and Co.
Figure 4.22 is a SEM image of the wear track of the CoCrMo after the OCP tribocorrosion test at 1N
load. Spectrum 1 is characteristic of the chemical composition of the CoCrMo alloy while Spectrum
2, taken in an area of debris accumulation, presents a high percentage of oxygen. Similar results
have been obtained in the wear tracks of samples CoCrMo-c and CoCrMo-rc.
Figure 4.20 – SEM image of CoCrMo wear track at 5000x. EDX chemical composition results are shown in the tables below for Spectrum 1 and Spectrum 2 indicated in the picture.
Spectrum2
Spectrum1
CoCrMo, wear track - Spectrum 1
Element Atomic %
C 16
O 0
Cr 28
Mo 3.4
Co 52.6
Total % 100
CoCrMo, wear track - Spectrum 2
Element Atomic %
C 14.4
O 36.9
Cr 16.3
Mo 1.9
Co 30.5
Total % 100

Chapter 4 - Results
81
SEM image of the extracellular matrix of CoCrMo-c is shown in Figure 4.23 for a sample after the
OCP tribocorrosion test with 1N load. High atomic percentage of carbon is found in Spectrum 1,
taken on what seems an agglomerated structure. Spectrum 2 was taken far from the
agglomerated structure where a different chemical composition was found: carbon percentage is
still significantly high, but EDX revealed the presence of metals as well.
Figure 4.23 – SEM image of CoCrMo-c cellular matrix at 1000x. EDX chemical composition results are shown in the tables below for Spectrum 1 and Spectrum 2 indicated in the picture.
Spectrum1
Spectrum2
CoCrMo-c, extracellular matrix - Spectrum 1
Element Atomic %
C 80.6
O 17.3
Cr 0.5
Mo 0.4
Co 1.2
Total % 100
CoCrMo-c, extracellular matrix - Spectrum 2
Element Atomic %
C 52.6
O 2.1
Cr 14.8
Mo 1.6
Co 28.9
Total % 100

Corrosion and tribocorrosion study of CoCrMo biomedical alloy
82
Wear particles are observed in the area outside the wear track (Fig. 4.24) to a much greater extent
than inside the track. Figure 4.24 is a SEM image of the intermediate region defined between the
wear track and the extracellular matrix of the CoCrMo-c after the OCP tribocorrosion test with 1N
load. Spectrum 1, taken in an area where debris was accumulated and formed a thin layer,
presents a relatively high percentage of oxygen and carbon. Similar results have been obtained for
the region next to the wear track of the CoCrMo-rc. Spectrum 2 is characteristic of the chemical
composition of the CoCrMo alloy with a slightly higher percentage of carbon compared to the bare
metal analysed in the wear track of CoCrMo (Figure 4.22, Spectrum 1).
Figure 4.24 – SEM image of CoCrMo-c intermediate region at 5000x. EDX chemical composition results are shown in the tables below for Spectrum 1 and Spectrum 2 indicated in the picture.
Spectrum1
Spectrum2
CoCrMo-c, intermediate region - Spectrum 2
Element Atomic %
C 24.1
O 0.5
Cr 24.7
Mo 3
Co 47.7
Total % 100
CoCrMo-c, intermediate region - Spectrum 1
Element Atomic %
C 22.6
O 24
Cr 17.4
Mo 1.8
Co 34.2
Total % 100

83
5 Discussion
The results obtained with the presented models will be examined
in this chapter in order to verify their validity. The influence of the
electrochemical potential and the contact pressure between the ball and
the alloy in the tribocorrosion test will also be discussed. Finally the
effects caused by the cell treatments of the CoCrMo alloy will be
considered and argued.

Corrosion and tribocorrosion study of CoCrMo biomedical alloy
84
5.1 Model validation
iii. Galvanic model for tribocorrosion at open circuit potential
Eq. (1.19) can be used to quantitatively evaluate the evolution of the open circuit potential during
rubbing by assuming that the wear track area Awt corresponds to the anodic area Aa while the rest
of the electrode surface constitutes the cathode which area is Aowt (area outside the wear track)
[76]. As a consequence of wear, Awt increases with rubbing time. The wear track area Awt
corresponds to the wear track length L multiplied by the cord length of the circular segment of the
ball in contact with the surface and is given by Eq. (5.1):
(5.1)
Where R is the radius of the ball and θ (rad) is the central angle defining
the circular segment. The wear track area Awt can be extracted from the
instantaneous wear track volume. The wear track volume V can be
approximately calculated by multiplying the stroke length L by the area
of the circular segment (Acs) defined by the alumina ball (of radius R)
impinging into the metal according to Eq. (5.2):
( ) (5.2)
For angles lower than 0.6 (i.e. wear scar width lower than 1.75 mm), Eq. (5.2) can be empirically
simplified by Taylor series approximation
(considering L = 1.9 cm, R = 0.3 cm as
described in the experimental section) yielding to Eq. (5.3):
(5.3)
Additionally, according to Archard wear law, a linear relationship between the wear volume (V)
and rubbing time (t) can be assumed:
( ) (5.4)
where Cw is a constant that can be calculated by dividing the wear track volume measured at the
end of the test by the rubbing duration.
Extracting θ from Eq. (5.3) and considering Eq. (5.4) to define V, Eq. (5.1) can be rewritten as:
(
)
(5.5)
Figure 5.1 – Geometrical parameters of the ball in
galvanic coupling model applied to tribocorrosion test at OCP
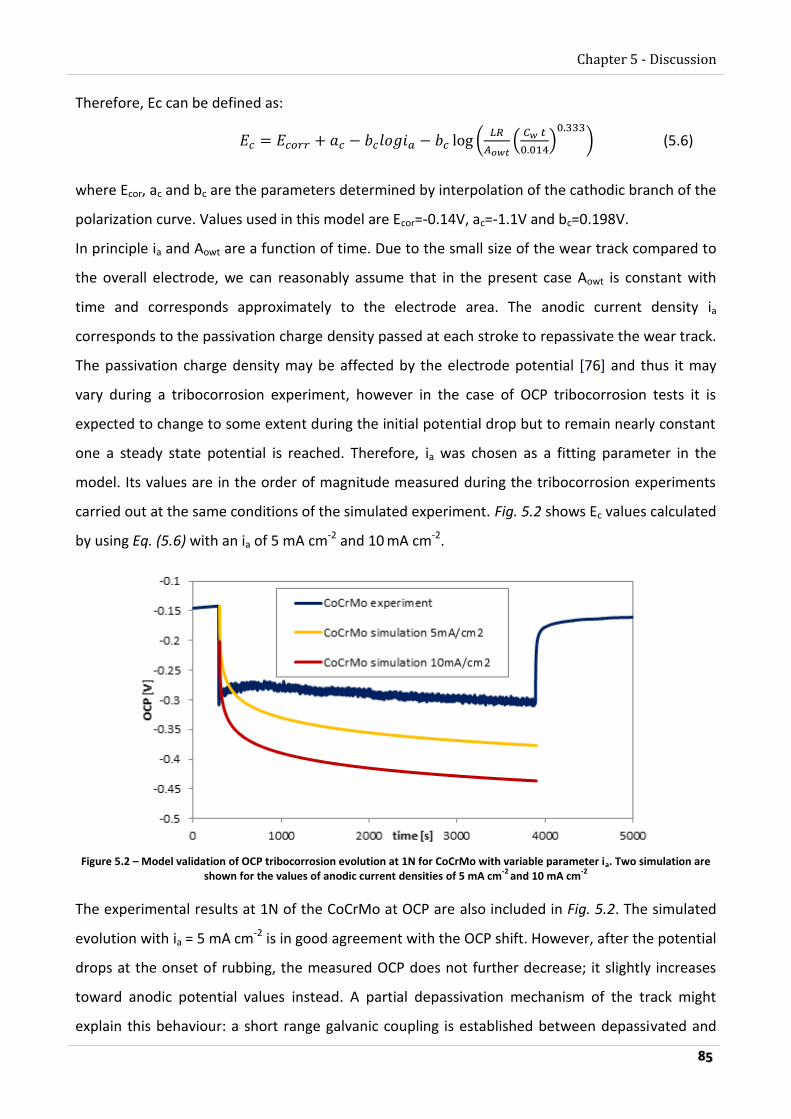
Chapter 5 - Discussion
85
Therefore, Ec can be defined as:
(
(
)
) (5.6)
where Ecor, ac and bc are the parameters determined by interpolation of the cathodic branch of the
polarization curve. Values used in this model are Ecor=-0.14V, ac=-1.1V and bc=0.198V.
In principle ia and Aowt are a function of time. Due to the small size of the wear track compared to
the overall electrode, we can reasonably assume that in the present case Aowt is constant with
time and corresponds approximately to the electrode area. The anodic current density ia
corresponds to the passivation charge density passed at each stroke to repassivate the wear track.
The passivation charge density may be affected by the electrode potential [76] and thus it may
vary during a tribocorrosion experiment, however in the case of OCP tribocorrosion tests it is
expected to change to some extent during the initial potential drop but to remain nearly constant
one a steady state potential is reached. Therefore, ia was chosen as a fitting parameter in the
model. Its values are in the order of magnitude measured during the tribocorrosion experiments
carried out at the same conditions of the simulated experiment. Fig. 5.2 shows Ec values calculated
by using Eq. (5.6) with an ia of 5 mA cm-2 and 10 mA cm-2.
Figure 5.2 – Model validation of OCP tribocorrosion evolution at 1N for CoCrMo with variable parameter ia. Two simulation are shown for the values of anodic current densities of 5 mA cm
-2 and 10 mA cm
-2
The experimental results at 1N of the CoCrMo at OCP are also included in Fig. 5.2. The simulated
evolution with ia = 5 mA cm-2 is in good agreement with the OCP shift. However, after the potential
drops at the onset of rubbing, the measured OCP does not further decrease; it slightly increases
toward anodic potential values instead. A partial depassivation mechanism of the track might
explain this behaviour: a short range galvanic coupling is established between depassivated and

Corrosion and tribocorrosion study of CoCrMo biomedical alloy
86
still passive areas within the wear track and on the area surrounding it. As discussed by Vieira et al.
[76] this mechanism is favoured at low loads. The galvanic coupling model supposed in the
simulation does not take this phenomenon into account, which is why the simulation is not so
precise after the shift. Simulation results are consistent with the results obtained by authors who
applied the same model: Vieira et al. [76] and Papageorgiou [60] but does not seem to apply
precisely to the conditions at which the experiment of this thesis was performed.
Validity of equation (5.6) to the tribocorrosion of CoCrMo alloys in simulated body fluids is subject
to some limitations [61]. Kinetics parameters (Ecor, ac, bc) must be extracted from independent
electrochemical measurements such as polarization curves in the cathodic domain by Tafel
extrapolation of linear part. The formulation of equation (5.6) presupposes that the cathodic
kinetic can be described by a Tafel behaviour (logarithmic dependence between potential and
current), a situation not necessarily achieved when two or more reactions (reduction of water,
oxygen or protons) occur in the same potential range. This represents a limitation because
extraction of the linear part from the curves is not always precise and Tafel parameters are very
sensible to small variations. The parameters are specific for the type of alloy and solution
composition and for this reason they were calculated for all samples: CoCrMo, CoCrMo-c and
CoCrMo-rc. Results are given in chapter 4.2.3. The experimental protocol used to measure
polarization curves is another key factor as evidenced by a recent inter-laboratory investigation of
the corrosion of CoCrMo alloys [61]. Here 15 laboratories from different countries applied the
same protocol for measuring polarization curves of a given CoCrMo alloy in a phosphate buffered
solution with and without protein. Although repeatability within individual laboratories was good,
large scattering was observed among laboratories indicating that experimental protocols as well as
data extraction procedures need to be improved in order to obtain reproducible and reliable
electrochemical characterisation of such alloys [61].
iv. Current transient model
Passivation transients measured at three different passive potentials are presented in a log-log
scale in Figure 5.3. The growth rate constant (kB) and constant B’ necessary in equation (1.24) can
be extrapolated from these experimental results. All transients exhibit an initial current plateau
the height of which is ohmically controlled [70]. After an initial period of ohmic control the current
decreases because of anodic film growth which leads to an additional non-ohmic resistance

Chapter 5 - Discussion
87
increasing with time. This initial slope corresponds to the region of mixed control by the ohmic
resistance of the electrolyte and by the film resistance, but compared with results of Jemmely et
al. [70] it does not show an increased steepness; instead its slope is quite flat.
Figure 5.2 - Current transient on a log-log scale for three passive potentials. Dashed lines represent repetitions
After 0.1 s the current becomes entirely controlled by film growth kinetics (and the transients on a
log–log plot exhibit a constant slope) therefore the growth rate constants were extrapolated from
this region. The average values of the parameters and their deviations are shown in Table 5.1. The
values were obtained from a plot of the logarithm of the current as a function of the inverse of the
charge using equation (5.1), which follows from equation (1.20) and (1.23) for negligible ohmic
resistance in the electrolyte [70].
( )
( )
(5.1)
The charge q was determined by numerical integration of the measured current. Fig. 5.4 shows a
plot of ln i vs q-1.

Corrosion and tribocorrosion study of CoCrMo biomedical alloy
88
Figure 5.4 - Current density vs. the inverse of the charge passed for passivation transients measured at different applied potentials.
Table 5.1 - Kinetic constants derived from passivation experiments at different potentials
Eappl [V] ln (kB[A/cm2]) B' [C V-1 cm-2]
-0.2V -11.7 ± 0.9 0.090 ± 0.014
0V -12.3 ± 0.3 0.022 ± 0.005
0.2V -11.5 ± 0.3 0.011 ± 0.001
Equation (1.24) has been integrated using the software Matlab 7.7.0 with an integration step of
0.0001s. The parameters showed in Table 5.1 are used:
ln kB = -12.3 A/cm2 B’ = 0.022 C/cm2/V
Eappl = 0V Eg = -0.25 V
Contact area and ohmic resistance values are [70]:
A = 1.17 cm2 Rohm = 20 Ω
Figures 5.5 and 5.6 show the results obtained for the applied potential of 0V.

Chapter 5 - Discussion
89
Figure 5.5 – Model validation of the passivation transient of the CoCrMo at 0V applied potential
Figure 5.6 – Model validation of the passivation transient of the CoCrMo at 0V applied potential, log-log scale
As described by Jemmely et al. [70] in the initial phase of a transient the surface coverage model
should apply, and at a later stage the growth model. The film growth model was used in this
simulation: it is based on high field conduction which has been found to describe well the film
growth kinetics of anodically polarized metals [70]. Prediction of the evolution is quite accurate,
but a better modeling of the ohmically controlled region would be reached if a combined model
was used as predicted in chapter 1.3.5. Only a certain fraction of the measured anodic charge
serves for film growth. For the present experimental conditions, this fraction is not known
precisely and, therefore, the effect was not included in the model. This does not change the
validity of the present modeling approach because taking into account the effect of selective
dissolution would simply add a correction factor [70].

Corrosion and tribocorrosion study of CoCrMo biomedical alloy
90
5.2 Influence of the electrochemical potential in tribocorrosion
The chemical and mechanical wear volumes obtained at 1N and 3N were plotted in Fig. 4.15 as a
function of the applied potential. The tribocorrosion degradation of the investigated CoCrMo alloy
is greatly affected by the electrochemical conditions. The prevailing potential influences both the
mechanical and the chemical wear, which can be ascribed to two factors related to the wear
promoting effect of passive films [61]. First, passive films are known to render metal surfaces more
prone to mechanical wear. In literature this phenomenon has been attributed to the
embrittlement of the metal surface (Roscoe effect) caused by the presence of thin surface passive
film that interferes with dislocation mobility [88]. Mechanical wear slightly increases with the
electrochemical potential (from the OCP to 0V) since both these potentials belong to the passive
domain. The increase is more evident at 1N than it is at 3N. Namely in the latter case mechanical
wear volume is much higher compared to the former case, due to the higher contact pressure
established. This results in a less pronounced increase. Second, passive metals are subjected to
wear accelerated corrosion due to the continuous cyclic removal and regrowth of the oxide film.
This effect is expected to be more pronounced in case of thicker films. Thus the increase of
chemical volume with the potential can be attributed to the severer oxidative conditions
established at the larger anodic potentials of 0V.
The strong dependence of wear on the electrochemical conditions is of relevance for the implant
practice as implant degradation rate may change up to one order of magnitude depending on
electrode potential [61]. The control of the electrochemical conditions in which implants operate
is therefore essential and as relevant as mechanical loading. The open circuit potential of a
metallic implant depends on the kinetics of the prevailing reduction and oxidation electrochemical
reactions taking place on the metal surface. These in turn depend on a variety of experimental
parameters including material’s composition and structure, strain state, temperature, chemical
composition of the environment, mass transport conditions, and contact with other materials [61].
For these reasons, it is very difficult to predict open circuit potentials and although its
measurement is relatively easy for in-vitro tests, there is only one reported in-vivo value by
Steinmann [91] of 0.2 VSHE. The open circuit potential is measured in-vitro [89,90,92,93], in a
variety of environments (bovine serum, sodium chloride and phosphate solution with and without
proteins). Values extend in the range from -0.5 VSHE to 0.2 VSHE.

Chapter 5 - Discussion
91
5.3 Influence of the contact pressure in tribocorrosion
Four average contact pressures were studied by changing the applied load (1N and 3N) and the
material of the counterpart. The values calculated following the model described in chapter 3.3.2
are shown in table 5.2.
Table 5.2 – Average contact pressures calculated between the CoCrMo and the counterpart for different materials at different loads. Also yield strength of the material is given
Counterpart Average contact pressure [MPa]
1N 3N
Alumina ball 500 700
PE ball 12 18
The yield strength of the CoCrMo is 500 MPa. Hence plastic deformation is expected in the
tribocorrosion tests at 3N with the alumina ball. The mechanisms expected for the PE ball
experiments are instead of elastic deformation. Maldonado et al. [88] reported that a minimum
force (approximately 0.6 N) is necessary to trigger chemical wear. This force corresponds to an
initial average Hertz pressure of 420 MPa, a value close to the yield strength of the alloy (500
MPa). Plastic deformation of the contact occurs only when the average pressure exceeds the yield
strength. Thus plastic deformation of the metal is a prerequisite for depassivation and thus for
wear accelerated corrosion. The chemical volume results at 1N with alumina (where the average
contact pressure is around 500MPa) agree with this assumption. In the OCP tribocorrosion tests
these values are very low, while higher values are found in the tribocorrosion tests at 0V, where
metal oxidation is favoured by the more anodic electrochemical conditions. When the contact
pressure increases to 700MPa (i.e. at 3N with alumina) more plastic deformation takes place.
Indeed, an increase in the chemical volume values is observed, in agreement with the assumption
considered.
The current density in a tribocorrosion test at a passive applied potential is known to increase
during the rubbing under certain circumstances. In particular this behaviour seems to be
correlated to the extent of the normal applied load. In fact the drift of increasing is found in the
results published in literature where the applied loads range from 4N up to 17.5N [88,76], while it
does not appear in the experiments of the current thesis. An analogous tendency characterizes the
OCP tests, where the electrochemical potential tends to decrease during the rubbing. Both these

Corrosion and tribocorrosion study of CoCrMo biomedical alloy
92
drifts were attributed in literature to the enlargement of the wear track with progressing wear
[88]. In the experiments of the present thesis the loads applied are lower (1N and 3N) than the
ones commonly applied in literature, therefore depassivation is partial and no such an
enlargement can be attributed to the track. This difference explains the dissimilar behaviour of the
CoCrMo tested, since the drifts are not present in the results, in both the OCP tests and the tests
at 0V. As a consequence, the OCP evolution predicted by the galvanic coupling model in chapter
5.1 is not so accurate after the cathodic shift. A more precise simulation would be obtained if
higher loads were applied. However the model appears as a useful tool to rationalize the effect of
different parameters on the electrochemical response of the CoCrMo alloy during tribocorrosion.
The small decrease of the current intensity after the initial peak (at the onset of rubbing) can be
correlated to the evolution of the coefficient of friction. Considering the values of the frictional
force shown in Figure 5.7, one can observe that the COF has an evolution very similar to the
current.
Figure 5.7 - Coefficient of Friction (COF) evolution for a CoCrMo sample in a tribocorrosion test at 0V applied potential with a 1N applied load alumina ball as counterpart
The COF values have approximately the same magnitude in all the experiments with the alumina
balls. Frictional force decreases of one order of magnitude when the PE balls are employed, a fact
that is in agreement with the contact pressures calculated.
Calculation of the overall wear volume by profilometric analysis represents a valuable method to
quantify the magnitude of the metal loss. This method results less precise when a lower load is
applied. The calculation of the volumes from the 2D profiles of the wear track (Fig 4.11-4.12)
depends on the chosen domain of integration, i.e. the edges of the track, which are not always

Chapter 5 - Discussion
93
revealed by the profile. Furthermore this method is not appropriate when the profiles are very
small. This is the case of the experiments where the PE balls were employed. For this reason, in
these tests, the volume calculated and presented in Table 4.7 is not the metal loss, but the PE
volume loss. These values are much higher than the overall wear volume of the CoCrMo calculated
in the tests with alumina balls.
Scratches can be observed inside the wear track after tribocorrosion (Fig. 4.21). No major
degradation of the alumina balls could be observed instead (Fig. 4.20). The scratches are due to
the formation of wear particles that are trapped within the track. The particle formation induces a
three-body sliding abrasion situation. A high percentage of oxygen in the debris found within the
wear track by EDX analyses reveals metal oxide formation. Not all debris particles analysed
revealed such a high percentage of oxygen; thus it is assumed that debris particles are made of
both metal and metal oxides.
In the tribocorrosion experiments at 0V with the PE ball the current evolution is comparable to the
passivation transients of the CoCrMo (compare Figure 4.9 and Figure 4.3); it is an indication of the
passive film re-growth on the surface during sliding. The current increases at the onset of rubbing
(to lower peaks compared to the tests with the alumina balls) and immediately recovers its initial
level afterwards. The repassivation kinetics is dominant over the weak depassivating action of the
rubbing. The hardness of the PE ball is not sufficient to remove the passive film. The metal surface
is only partially depassivated at the first strokes (corresponding to the low peak of current at the
onset of the rubbing), when contact pressure is maximum. Subsequently contact pressure
decreases and the PE ball does not damage the metal surface. The contact in this case is between
two rough materials (alumina is considered to be smooth). Thus the degradation mechanism is not
pure abrasion, even though PE hardness is much lower than the hardness of CoCrMo. The pictures
taken by confocal microscopy show the degradation of the PE balls after the experiments,
confirming the presence of abrasive wear on its surface (Figs 4.18-4.19). The recovery of the
current intensity observed for the PE ball tests at 0V agrees with the evolution of the OCP
observed in the tribocorrosion tests. The cathodic shift at the onset of rubbing is much smaller
compared to the shifts of the OCP in tribocorrosion with the alumina ball (Table 4.3). Immediately
after the shift, the repassivation kinetics leads the OCP to the recovery of its initial values (Fig.4.7),
exactly in the same way that the current recovered its initial values as described above.

Corrosion and tribocorrosion study of CoCrMo biomedical alloy
94
5.4 Effects of the cell culture on the CoCrMo alloy
As observed in Figure 4.1 the evolution of the CoCrMo OCP starts from cathodic values and
increases toward less negative values. This evolution suggests the formation of a protective
passive layer. Indeed, as shown in the results of Figure 4.2, the potential established is -255mV,
which belongs to the passive region of the polarization curves. For both the CoCrMo-c and
CoCrMo-rc the OCP stabilizes at values next to 0V. These potentials belong to the passive region of
the polarization curves as well (Figure 4.2). The alteration created by the cell culture affects the
metal surface increasing the OCP of the CoCrMo toward more anodic potentials; this behaviour
seems to be independent from the removal of the cells after the culture. The superficial chemical
composition of the alloy might be altered from the creation of the extracellular matrix (ECM). EDX
analysis showed a much higher percentage of carbon in the CoCrMo-c. The same EDX analysis did
not show an increase in the carbon percentage on the CoCrMo-rc surface, since here the cells had
been removed, yet optical microscope images in Fig 3.1 show the presence of remains of the ECM.
In the latter case the high energy beam used in the EDX analysis probably penetrates the organic
matter residuals.
The polarization curves of the CoCrMo-c/-rc are quite different from the ones of the CoCrMo: their
corrosion and passivation potentials have more cathodic values; the passivation current densities
are higher and the passive current densities decrease with the potential changing to anodic values.
These higher passive current densities are relative to the passive domain that extends in a more
cathodic region compared to the passive region of the CoCrMo. The passive current densities of
the CoCrMo-c/-rc slightly decrease with the applied potential until reaching approximately the
same values of the CoCrMo current densities at the breakdown potentials. The removal of the
cells does not seem to affect the results of this experiment, except for a slightly lower corrosion
potential.
The cathodic branches of Fig. 5.8 are measured with the potentiodynamic test, following
sequences explained in chapter 3.2.2. Two different behaviours of the CoCrMo alloy are shown.
The dashed blue line represents the regular evolution of the CoCrMo, while the continuous blue
line is the case of a specific experiment where the lower cathodic current density measured
implies a stronger resistance to the electrochemical reduction reactions. This resistance is caused
by the presence of the passive film on the surface formed before the experiment at the OCP. In
this potentiodynamic test a different evolution for the CoCrMo-c and the CoCrMo-rc is observed in

Chapter 5 - Discussion
95
Fig. 5.8, suggesting a different behaviour caused by the removal of the cells after culture. The ECM
of the CoCrMo-c might oppose a stronger resistance to the electrochemical reduction reactions;
indeed the cathodic current density is lower. The ECM might therefore inhibit the reduction
reaction. In fact the CoCrMo-rc, where ECM was mainly removed, has an evolution that is
analogous to the average CoCrMo alloy with higher current densities, but still shows an inhibited
kinetics.
Figure 5.8 - Cathodic branch of partial polarization curve showing the CoCrMo sample where a sort of resistance to corrosion appears and its comparison with CoCrMo-c
The OCP cathodic shift in the tribocorrosion test of the CoCrMo-c and CoCrMo-rc at 1N load is
much larger than the shift of the CoCrMo under the same experimental conditions (Figure 4.6).
This behaviour might be explained by considering the different galvanic coupling established
between the depassivated and still passive regions in both the CoCrMo-c and CoCrMo-rc samples.
Since the chemical composition of the surfaces has been altered by the cell culture, the kinetics of
the semi-reactions of the still passive area is different than the one of the CoCrMo. In particular
observing the results of Figure 5.8 it is possible to assume that the cathodic kinetics of the
CoCrMo-c/-rc is inhibited by the cell culture. The calculated Tafel’s parameters shown in chapter
4.3.2 (Fig. 4.16) confirm this assumption. Nevertheless the oxidation kinetics of the bare metal
(depassivated area) is unchanged. Thus the anodic current (Ia) is unaffected and one can assume
that it was the same value of the depassivated CoCrMo. In a galvanic cell the anodic current Ia is
equal to the absolute cathodic current Ic (equation (1.16)). This means that also the cathodic
current Ic in the CoCrMo-c/-rc must be the same as the one of the tribocorrosion test of the

Corrosion and tribocorrosion study of CoCrMo biomedical alloy
96
CoCrMo. However, for such a current to be established with an inhibited cathodic kinetics, a more
cathodic potential (compared to the one reached by the CoCrMo) must be established during the
sliding of the CoCrMo-c/-rc, resulting in an increased cathodic shift.
With SEM images (Figure 4.21) it is possible to estimate the size of the debris. At the 100x zoom
the layer of debris accumulated is visible in the outer part of the wear track. The size of the debris
ranges from particles smaller than 1µm to agglomerated structures with values of almost 10µm. In
the CoCrMo-c (Figure 4.19a, 4.14, 4.13a) the rubbing removes the layer of ECM. Hence three
regions can be distinguished: the wear track left by the alumina ball where the rubbing of the
metal took place; the area untouched by the ball, where the ECM layer persists, and the
intermediate region included between the other two, where cells have been removed but no
scratches appear on the surface of the metal. The brittle fracture of the ECM might explain this
intermediate region. The signs of the brittle fracture are given by the discontinuous profile of the
ECM observe in Figure 4.14a. Also the greater value of the contact pressure in the middle of the
wear track could explain this conformation. In this sense it is assumed that the contact pressure on
the sides is lower, being sufficient to remove the ECM layer, but not enough to scratch the metal.
Furthermore, supposing the validity of the model introduced in chapter 3.3.2, at the onset of the
rubbing, the contact area is very small, hence the initial pressure is high. The rubbing causes
deformation and abrasion of the materials in contact, increasing the contact area (see wear track
area defined in eq. (5.3) and used in the galvanic coupling model); thus the contact pressure
decreases during the rubbing. This occurrence is in agreement with the fact that the 2D profiles
are always deeper in the middle of the track. However these are just assumptions that could
explain the three regions. Further study on the mechanical characterization is needed.
EDX analysis confirmed the presence of organic substances in the extracellular matrix of the
CoCrMo-c. In particular there seems to be agglomerated structures (Spectrum 1, Figure 4.21)
where the percentage of C reaches values up to 80%. The beam energy might penetrate the ECM
layer: in fact spectra obtained far from agglomerated structures show higher percentages of Co, Cr
and Mo. In this case the percentage of C is around 50%. Particles found inside the wear track of
the CoCrMo-c sample have been analysed by EDX with the purpose of verifying the presence of
organic materials. An increase of the atomic percentage of carbon from the value corresponding
to the bare metal (16%) to a value of 25 in carbon percentage is observed. This percentage is much
lower than the ones found in the extracellular matrix, included between 50% and 80%. Thus no

Chapter 5 - Discussion
97
proof can be assumed with certainty of organic material. In the intermediate region and in the
surroundings of the wear track, EDX analysis suggested the presence of metal oxides with high
carbon percentage for CoCrMo-c and CoCrMo-rc. The atomic percentage of oxygen is 24% with a
22.6% of C, a 34% of Co and 17% of Cr. The conformation of this oxide layer can be explained
considering the third-body approach (see Chapter 1.3).

98
6 Conclusion
The study of the behaviour of biomedical CoCrMo conducted in this thesis has been
completed throughout corrosion and tribocorrosion experiments.
The corrosion experiments showed that the cell culture (forming the ECM) modifies the surface
behaviour of the CoCrMo by increasing the OCP toward more anodic potentials. The ECM of the
CoCrMo-c reduces the reaction kinetics of the cathodic reaction as it is possible to observe from
the reduction in the cathodic current density measured during the polarization curves compared
to the CoCrMo. The CoCrMo-rc sample, where ECM was mainly removed, also inhibits the cathodic
kinetics of the reduction reaction although in a less extent than the covered sample.
The passivity of the CoCrMo has been modelled by Jemmely et al. [70]. The model represents very
well the passive current transients measured on the CoCrMo alloy and allows one to interpret the
passivation kinetics under the studied conditions.
However further work is needed for a better approximation of the ohmically controlled region
and the intermediate region. Better results could be obtained by applying the combined model
described by Jemmely et al. [70] and by considering the effect of selective dissolution.
The effects of different parameters in tribocorrosion tests were also studied:

Chapter 6 - Conclusion
99
The experiments that employed the PE balls confirmed that a minimum contact pressure is
necessary to trigger wear accelerated corrosion, since this mechanism is directly correlated
to the plastic deformation of the metal. Indeed, only chemical wear volumes can be
measured when contact pressures exceed the yield strength of the material, thus causing
depassivation.
A small increase in mechanical wear is observed between the OCP and the passive applied
potential tribocorrosion tests. Its extent is related to the applied load: specifically at 3N the
increase is higher than at 1N due to the superior contact pressure established.
The cathodic kinetics inhibited by the cell culture not only affects the corrosion, but also
the tribocorrosion of the CoCrMo; in fact a larger OCP cathodic shift than the CoCrMo was
observed. Additionally the overall wear volumes calculated are superior in the case of the
CoCrMo-c/-rc samples.
Wear accelerated corrosion due to depassivation of worn areas is likely to contribute significantly
to the overall contact degradation. Its contribution was evaluated using the galvanic coupling
formalism proposed by Vieira et al [76]. The galvanic coupling model for the tribocorrosion tests at
the OCP is a very simple electrochemical model that can be used to predict the behaviour of a
metal during tribocorrosion. The model is consistent with the results found in literature, but it
does not apply when the partial depassivation mechanism (consequence of the low applied loads)
leads to a short range galvanic coupling. Depassivation/repassivation corrosion mechanisms are
still insufficiently understood in sliding contacts; hence a better modeling is necessary to
accurately simulate tribocorrosion under these conditions. However, despite the simple premises
on which this model is based, it has shown to be a useful tool to appraise chemical aspects of
CoCrMo degradation. Further, a better understanding of the passivation of CoCrMo alloys needs
to be established over a wide range of anodic and cathodic potentials representative of the in-vivo
tribocorrosion situations in order to predict failures in biomedical engineering applications. In
addition, the understanding of these phenomena will be an important tool for designing new
materials and materials treatments for applications where tribocorrosion is the main cause of
failure.

Corrosion and tribocorrosion study of CoCrMo biomedical alloy
100
REFERENCES [1] J. W. Boretos and N. J. Eden, Contemporary Biomaterial, park Ridge, NJ., 1984.
[2] F. Burny, M. Donkerwolcke, D. Muster, Materials Science and Engineering: A 199 (1995) 53-59.
[3] A. Balamurugan, S. Rajeswari, G. Balossier, A. H. S. Rebelo, J. M. F. Ferreira, Materials and
Corrosion 59 (2008) 855-869.
[4] D. Hill, Design Engineering of Biomaterials for Medical Devices, John Wiley and Sons, Chichester,
1988.
[5] G. Manivasagam, D. Dhinasekaran, A. Rajamanickan, Recent Patents on Corrosion Science 2 (2010)
40-54.
[6] J. Park and R.S. Lakes, Biomaterials: An introduction, Springer, 2007
[7] M. Geetha, A.K. Singh, R. Asokamani, and A.K. Gogia, Progress in Materials Science, vol. 54, 2009,
pp. 397-425.
[8] D.F. Williams, Biomaterials, vol. 30, Oct. 2009, pp. 5897-909.
[9] D. F. Williams, Biomaterials 29 (2008) 2941-2953.
[10] J.M. Anderson, Annual Review of Materials Research, vol. 31, 2001, p. 81–110.
[11] “https://www.youtube.com/watch?v=dgrbVNyOaOs.”
[12] D. a Puleo and A. Nanci, Biomaterials, vol. 20, Dec. 1999, pp. 2311-21.
[13] “http://www.datamonitor.com/”
[14] S. Kurtz, K. Ong, E. Lau, F. Mowat, and M. Halpern, the Journal of Bone and Joint Surgery, 2007, pp.
780-785.
[15] C. Fleury, A. Petit, F. Mwale, J. Antoniou, D. J. Zukor, M. Tabrizian, O. L. Huk, Biomaterials 27
(2006) 3351-3360.
[16] Y. Okazaki, E. Gotoh, Biomaterials 26 (2005) 11-21.
[17] M. A. Germain, A. Hatton, S. Williams, J. B. Matthews, M. H. Stone, J. Fisher, E. Ingham,
Biomaterials 24 (2003) 469-479.
[18] I. Catelas, A. Petit, D. J. Zukor, O. L. Huk, Journal of Materials Science: Materials in Medicine 12
(2001) 949-953.
[19] S. M. Horowitz, W. T. Luchetti, J. B. Gonzales, C. K. Ritchie, Journal of biomedical materials research
41 (1998) 468-473.

References
101
[20] Granchi D., Cenni E., G. Trisolino, Giunti A., Baldini N., Journal of Biomedical Materials Research.
Part B: Applied Biomaterials 77 (2006) 257-264.
[21] N. J. Hallab, K. Mikecz, J. J. Jacobs, Journal of biomedical materials research 53 (2000) 480-489.
[22] A. Masse, M. Bosetti, C. Buratti, O. Visentin, D. Bergadano, M. Cannas, Journal of Biomedical
Materials Research Part B-Applied Biomaterials 67B (2003) 750-757.
[23] S. Virtanen, I. Milosev, E. Gomez-Barrena, R. Trebse, J. Salo, Y. T. Konttinen, Acta Biomaterialia 4
(2008) 468-476.
[24] M. Comín, R. Dejoz, C. Atienza, J. Prat, J. L. Peris, P. Vera, A. Gil, and C. Reig, Biomecánica articular y
sustituciones protésicas, 1998.
[25] A. G. Della Valle, B. Becksaç, J. Anderson, T. Wright, B. Nestor, P. M. Pellicci, E. A. Salvati, The
Journal of Arthroplasty 20 (2005) 1084-1088.
[26] P. S. Walker, B. L. Gold, Wear 17 (1971) 285-299.
[27] J. Black and G. Hastings, Handbook of biomaterial properties (Blood and related fluids), London
(United Kingdom), 1998.
[28] D. Landolt, Corrosion and surface chemistry of metals, EPFL press, Lausanne, Switzerland, 2007.
[29] C. Valero Vidal, “Study of the degradation mechanisms of the CoCrMo biomedical alloy in
physiological media by electrochemical techniques and surface analysis”, Doctoral Thesis, July
2012.
[30] P. Marcus and J. Oudar, Corrosion mechanisms in theory and practice, New York (Unites States of
America), 1995.
[31] P. Schmutz, D. Landolt, Electrochimica Acta 45 (1999) 899-911.
[32] P. Schmutz, D. Landolt, Corrosion Science 41 (1999) 2143-2163.
[33] Q. Bi, W. Liu, J. Ma, J. Yang, Y. Pu, Q. Xue, Tribology International 42 (2009) 1081-1087.
[34] Z. Szklarska-Smialowska, Pitting corrosion of metals, Houston, Texas (United States of America),
1986.
[35] J. Shu, H. Bi, X. Li, Z. Xu, Corrosion Science 57 (2012) 89-98.
[36] A. Igual Muñoz, S. Mischler, Journal of the Electrochemical Society 154 (2007) C562-C570.
[37] I. Milosev, H.-H. Strehblow, Electrochimica Acta 48 (2003) 2767-2774.
[38] A. W. E. Hodgson, S. Kurz, S. Virtanen, V. Fervel, C.-O. A. Olsson, S. Mischler, Electrochimica Acta
49 (2004) 2167-2178.
[39] T. Hanawa, S. Hiromoto, K. Asami, Applied Surface Science 183 (2001) 68-75.

Corrosion and tribocorrosion study of CoCrMo biomedical alloy
102
[40] M. Metikos-Hukovic, Z. Pilic, R. Babic, D. Omanovic, Acta Biomaterialia 2 (2006) 693-700.
[41] Y.-S. Li, K. Wang, P. He, B. X. Huang, P. Kovacs, Journal of raman spectroscopy 30 (1999) 97-103.
[42] F. Contu, B. Elsener, H. Bohni, Journal of biomedical materials research 62 (2002) 412-421.
[43] F. Contu, B. Elsener, H. Böhni, Corrosion Science 47 (2005) 1863-1875.
[44] J. Cawley, J. E. P. Metcalf, A. H. Jones, T. J. Band, D. S. Skupien, Wear 255 (2008) 999-1006.
[45] H. S. Dobbs, J. L. M. Robertson, Journal of Materials Science 18 (1983) 391-404.
[46] F. S. Georgette, J. A. Davidson, Journal of biomedical materials research 20 (1986) 1229-1248.
[47] L. Casabán Julián, A. Igual Muñoz, Tribology International 44 (2011) 318-329.
[48] K. Merritt, S. A. Brown, Journal of biomedical materials research 29 (1995) 627-633.
[49] J. H. Dumbleton, M. T. Manley, Journal of Arthroplasty 20 (2005) 174-188.
[50] J. J. Jacobs, J. L. Gilbert, R. M. Urban, Journal of Bone and Joint Surgery-American Volume 80A
(1998) 268-282.
[51] T. Hanawa, Materials Science and Engineering: C 24 (2004) 745-752.
[52] I. Catelas, A. Petit, H. Vali, C. Fragiskatos, R. Meilleur, D. J. Zukor, J. Antoniou, O. L. Huk,
Biomaterials 26 (2005) 2441-2453.
[53] O. L. Huk, I. Catelas, F. Mwale, J. Antoniou, D. J. Zukor, A. Petit, The Journal of Arthroplasty 19
(2004) 84-87.
[54] H. Y. Lin, J. D. Bumgardner, Biomaterials 25 (2004) 1233-1238.
[55] P. Tengvall, H. Elwing, L. Sjöqvist, I. Lundström, L. M. Bjursten, Biomaterials 10 (1989) 118-120.
[56] P. Tengvall, I. Lundström, L. Sjöqvist, H. Elwing, L. M. Bjursten, Biomaterials 10 (1989) 166-175.
[57] A. Igual Muñoz, S. Mischler, Journal of Materials Science: Materials in Medicine 22 (2011) 437-
450.
[58] A. Sargeant, T. Goswami, Materials & Design 28 (2007) 155-171.
[59] A.Essner, G.Schmidig, A.Wang. Wear. 259 (2005) 882-886.
[60] N. Papageorgiou, Tribology International 66 (2013) 60-71.
[61] S. Mischler, A. Igual, Wear 297 (2013) 1081-1094.
[62] D. Landolt, S. Mischler, Tribocorrosion of passive metals and coatings, Woodhead Publishing,
2011.

References
103
[63] G.W. Stachowiak, and A.W. Batchelor, (2005), Engineering tribology, Elsevier Butterwoth-
Heinemann, Burlington.
[64] B. Bhushan, (2001), Modern tribology handbook, CRC Press, London.
[65] G.T. Burstein, and A.J. Davenport, (1989) Journal of the Electrochemical Society, 136, 936–941.
[66] G.T. Burstein, and P.I. Marshall, (1983) Corrosion Science, 23, 125–137.
[67] H.Czichos, (1978), Tribology. A systems approach to the science and technology of friction,
lubrication and wear. Elsevier, Amsterdam.
[68] F.P. Ford, G.T. Burstein, T.P. Hoar(1980), Journal of Electrochemical Society, 127, 1325–1331.
[69] P. Jemmely, S. Mischler, D. Landolt, (1999) Tribology International, 32, 295–303.
[70] P. Jemmely, S. Mischler, D. Landolt, (2000) Wear, 237, 63–76.
[71] J. Jiang, M.M. Stack, (2006) Wear, 261, 954–965.
[72] J. Jiang, M.M. Stack, A. Neville (2002) Tribology International, 35, 669–679.
[73] D. Landolt, S. Mischler, M. Stemp, (2001), Electrochimica Acta, 46, 3913–3929.
[74] B.W. Madsen, (1994), ASTM G119–93, Ann. Book ASTM Standard, 03.02, 507–512.
[75] S. Mischler, (2003), ‘Electrochemical control of wear: a third body approach’, In: D. Dowson et al.
(Editors), Tribological research and design for engineering systems, Elsevier, Amsterdam, pages 47–
56.
[76] A.C. Vieira, L.A. Rocha, N. Papageorgiou, S. Mischler, Corrosion Science, 54 (2012), 26-35.
[77] S. Mischler (2008) Tribology International, 41, 573–583.
[78] S. Mischler, E.A. Rosset, D. Landolt, (1993) Tribology Series, 25, 245–253.
[79] S. Mischler, S. Debaud, D. Landolt (1998) Journal of Electrochemical Society, 145, 750–758.
[80] S. Mischler, A. Spiegel, D. Landolt (1999) Wear, 225–229, 1078–1087.
[81] S. Mischler, A. Spiegel, D. Landolt, M. Stemp (2001) Wear, 251, 1295–1307.
[82] H.J. Pearson, G.T. Burstein, R.C. Newman, (1980) Journal of the Electrochemical Society, 128, 2297-
2303.
[83] E. Rabinowicz (1965), Friction and wear of materials, John Wiley and sons, New York.
[84] M. Stemp, S. Mischler, D. Landolt (2003a) Corrosion Science, 45, 625–640.
[85] M. Stemp, S. Mischler, D. Landolt (2003b) Wear, 255, 466–475.

Corrosion and tribocorrosion study of CoCrMo biomedical alloy
104
[86] N. Papageorgiou, S. Mischler, Tribology letters 48 (3) (2012) 271-283.
[87] J.A. Williams (1994), Engineering tribology, Oxford University Press, New York.
[88] S. G. Maldonado, S. Mischler, M. Cantoni, W. J. Chitty, C. Falcand, D. Hertz, Wear 308 (2013), 213-
221.
[89] A. Iwabuchi, J.W. Lee, M. Uchidate, Wear 263(1–6) (2007) 492–500
[90] Y. Yan, A. Neville, D. Dowson, Journal of Physics D: Applied Physics 39 (2006) 3200–3205.
[91] S. G. Steinmann, Corrosion of surgical implants in vivo and in vitro tests, in: G.D. Winter, J. L. Leray,
K. de Groot (Eds.), Evaluation of Biomaterials, John Wiley & Sons Ltd., 1980, pp. 1–34.
[92] R. Alonso Gil, A. Igual Muñoz, Journal of the Mechanical Behavior of Biomedical Materials 4 (8)
(2011) 2090–2102.
[93] A. Igual Muñoz, S. Mischler, Inter-Laboratory Study on Electrochemical Methods for the
Characterisation of CoCrMo Biomedical Alloys in Simulated Body Fluids. Wakefield, UK. Maney
Publishing 2011.