corrosion by molten salts
TRANSCRIPT

Corrosion of Stainless Steels and Carbon Steelby Molten Mixtures of Commercial Nitrate Salts
S.H. Goods and R.W. Bradshaw
(Submitted 10 September 2003; in revised form 9 October 2003)
The isothermal corrosion behavior of two stainless steels and a carbon (C) steel in mixtures of NaNO3 andKNO3 was evaluated to determine if the impurities found in commodity grades of alkali nitrates aggravatecorrosivity as applicable to an advanced solar thermal energy system. Corrosion tests were conducted forapproximately 7000 hours with Types 304 and 316 stainless steels at 570 °C and A36 C steel at 316 °C inseven mixtures of NaNO3 and KNO3 containing variations in impurity concentrations. Corrosion testswere also conducted in a ternary mixture of NaNO3, KNO3, and Ca(NO3)2. Corrosion rates were deter-mined by descaled weight losses while oxidation products were examined by scanning electron microscopy(SEM), electron microprobe analysis (EPMA), and x-ray diffraction (XRD). The nitrate mixtures wereperiodically analyzed for changes in impurity concentrations and for soluble corrosion products. Resultsof these tests indicated that the short-term corrosion rates of the stainless steel specimens in many of themixtures could be described in terms of parabolic kinetics. However, no single rate law could be assignedto the corrosion kinetics resulting from exposure in all of the mixtures. For engineering applications,corrosion rates over the entire exposure period are best described as linear with respect to time. In thebinary nitrate mixtures, the annualized rates of metal loss were found to be between 6 and 15 µm/year forthe stainless steel specimens at 570 °C depending on the particular mixture. Metal loss for the C steelspecimens immersed in these same mixtures at 316 °C extrapolated to approximately 1-4 µm/year. SEMand XRD revealed that the complex, multiphase surface oxides formed on the stainless steel coupons werecomposed primarily of iron-chromium spinel, iron oxides, and sodium ferrite. Magnetite was the principalcorrosion product formed on the carbon steel specimens. Overall, for the typical range of impurities incommercially available nitrate salts, corrosion rates for solar thermal energy applications remained ac-ceptable for all of the materials examined.
Keywords Containment, corrosion, nitrate salt, solar centralreceiver, stainless steel
1. Introduction
This work examines the isothermal corrosion behavior ofprimary containment materials that can be used in a solar cen-tral receiver power plant. Solar Two, a 10 megawatt (peakelectric) demonstration facility, is a recent example of such anapplication and was undertaken as a joint project between aconsortium of electric power utilities and the U.S. Departmentof Energy.[1] In a typical system, the receiver structure consistsof a number of tubing panels through which circulates a heattransfer fluid that is heated by sunlight focused by an array ofcomputer-controlled mirrors (heliostats). Based on earlierwork, the heat transfer fluid is likely to be a molten nitrate saltconsisting of 60 wt.% NaNO3 and 40 wt.% KNO3, which hasa melting point of 238 °C and an intended working range of290 to 570 °C.[2] These proportions of the individual nitrateswere chosen because the resulting mixture optimizes a numberof important properties, including heat capacity, thermal con-ductivity, corrosivity, ease of handling and storage, and cost.
It is expected that carbon (C) steel will be used to construct
the low temperature portions of the system and a higher per-formance material, such as a stainless steel, will be used in hightemperature portions (e.g., the receiver). We have chosen toexamine A36 as the C steel and 304SS and 316SS as theyrepresent likely and low cost candidates for each of these tem-perature regimes. The 300 series stainless steels are goodchoices for this study as previous work has shown that theyexhibit good corrosion resistance and no degradation in me-chanical properties after relatively long-term exposure to high-purity molten nitrates at the temperatures of interest.[3-5]
Large quantities of molten salt are needed to optimize thethermal energy storage capacity of this system. For example,the total inventory of salt in the Solar Two facility was about1.5 million kilograms to provide thermal energy storageequivalent to several hours of peak electric power generation.Due to the very large salt inventory, it is important to select themost economical grades of these nitrates salts that satisfy theengineering requirements. A cost savings of nearly $1M dollarscan be realized by choosing low-cost nitrates. Since theselower cost grades of nitrate can have higher impurity concen-trations, it is necessary to assess their impact on containmentmaterial compatibility. The impurities typically present insome grades of nitrates, such as NaCl, KClO4, Na2SO4, alka-linity, etc., must not aggravate corrosion of the containmentalloys. For example, dissolved chloride may be a concern sinceit is often found to accelerate corrosion in high temperatureoxidizing environments.[6]
While the previous studies referenced above have estab-lished that high purity nitrates constitute a relatively benign
S.H. Goods and R.W. Bradshaw, Materials and Engineering SciencesCenter, Sandia National Laboratories, Livermore, CA, 94550. Contacte-mail: [email protected].
JMEPEG (2004) 13:78-87 ©ASM InternationalDOI: 10.1361/10599490417542 1059-9495/$19.00
78—Volume 13(1) February 2004 Journal of Materials Engineering and Performance
corrosion environment, there is little specific information re-garding the effects of impurities on corrosion resistance. Thepotential effects of salt impurities are illustrated in the work ofSingh and Sen in which the effect of sulfate ion on corrosion ofmild steel in nitrate melts was reported.[7] In this study, it wasfound that corrosion rates increased 20% when 7.5 wt.%Na2SO4 was added to nitrate salt melts. For chloride impurities,a few papers in the technical literature describe the results ofshort-term nitrate exposures, although at temperatures muchhigher than our application. The results generally indicate thatchloride ion concentrations above 0.3 wt.% measurably in-crease corrosion rates of iron (Fe) and C steels compared withchloride-free melts.[8-10] Due to these findings, one specificgoal of the current work was to address the question of increas-ing chloride concentration on corrosivity.
2. Experimental
2.1 Nitrate Mixtures
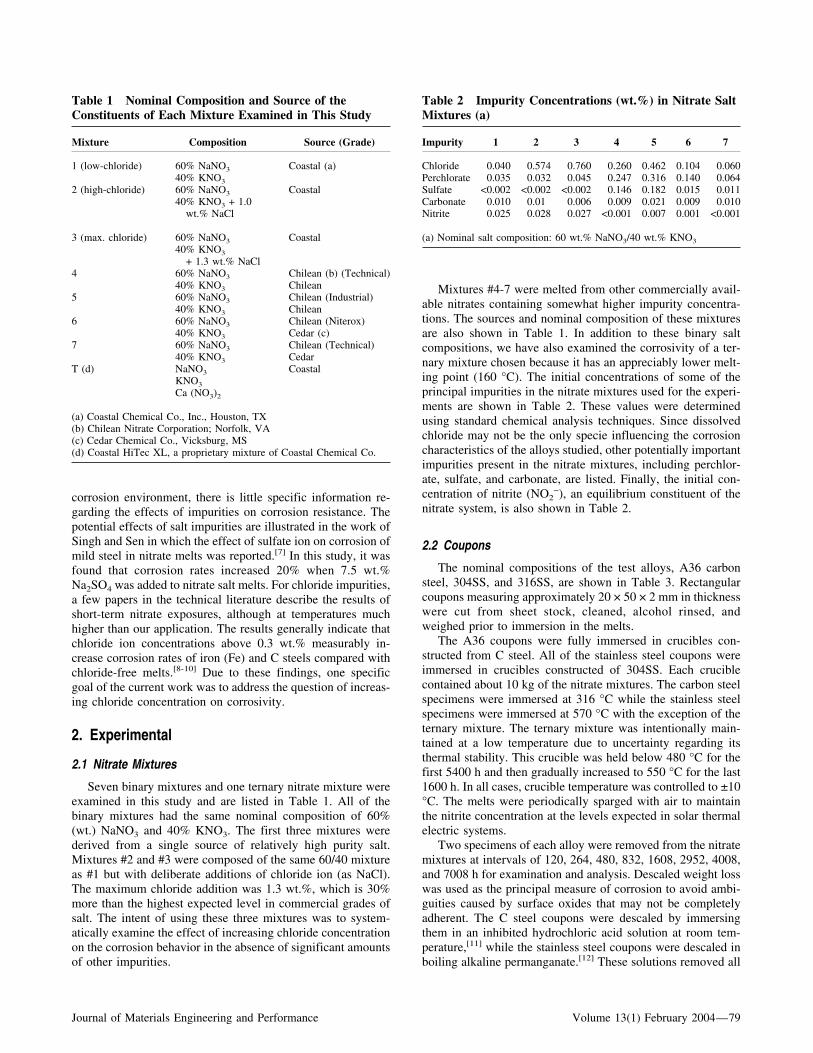
Seven binary mixtures and one ternary nitrate mixture wereexamined in this study and are listed in Table 1. All of thebinary mixtures had the same nominal composition of 60%(wt.) NaNO3 and 40% KNO3. The first three mixtures werederived from a single source of relatively high purity salt.Mixtures #2 and #3 were composed of the same 60/40 mixtureas #1 but with deliberate additions of chloride ion (as NaCl).The maximum chloride addition was 1.3 wt.%, which is 30%more than the highest expected level in commercial grades ofsalt. The intent of using these three mixtures was to system-atically examine the effect of increasing chloride concentrationon the corrosion behavior in the absence of significant amountsof other impurities.
Mixtures #4-7 were melted from other commercially avail-able nitrates containing somewhat higher impurity concentra-tions. The sources and nominal composition of these mixturesare also shown in Table 1. In addition to these binary saltcompositions, we have also examined the corrosivity of a ter-nary mixture chosen because it has an appreciably lower melt-ing point (160 °C). The initial concentrations of some of theprincipal impurities in the nitrate mixtures used for the experi-ments are shown in Table 2. These values were determinedusing standard chemical analysis techniques. Since dissolvedchloride may not be the only specie influencing the corrosioncharacteristics of the alloys studied, other potentially importantimpurities present in the nitrate mixtures, including perchlor-ate, sulfate, and carbonate, are listed. Finally, the initial con-centration of nitrite (NO2
−), an equilibrium constituent of thenitrate system, is also shown in Table 2.
2.2 Coupons
The nominal compositions of the test alloys, A36 carbonsteel, 304SS, and 316SS, are shown in Table 3. Rectangularcoupons measuring approximately 20 × 50 × 2 mm in thicknesswere cut from sheet stock, cleaned, alcohol rinsed, andweighed prior to immersion in the melts.
The A36 coupons were fully immersed in crucibles con-structed from C steel. All of the stainless steel coupons wereimmersed in crucibles constructed of 304SS. Each cruciblecontained about 10 kg of the nitrate mixtures. The carbon steelspecimens were immersed at 316 °C while the stainless steelspecimens were immersed at 570 °C with the exception of theternary mixture. The ternary mixture was intentionally main-tained at a low temperature due to uncertainty regarding itsthermal stability. This crucible was held below 480 °C for thefirst 5400 h and then gradually increased to 550 °C for the last1600 h. In all cases, crucible temperature was controlled to ±10°C. The melts were periodically sparged with air to maintainthe nitrite concentration at the levels expected in solar thermalelectric systems.
Two specimens of each alloy were removed from the nitratemixtures at intervals of 120, 264, 480, 832, 1608, 2952, 4008,and 7008 h for examination and analysis. Descaled weight losswas used as the principal measure of corrosion to avoid ambi-guities caused by surface oxides that may not be completelyadherent. The C steel coupons were descaled by immersingthem in an inhibited hydrochloric acid solution at room tem-perature,[11] while the stainless steel coupons were descaled inboiling alkaline permanganate.[12] These solutions removed all
Table 1 Nominal Composition and Source of theConstituents of Each Mixture Examined in This Study
Mixture Composition Source (Grade)
1 (low-chloride) 60% NaNO3 Coastal (a)40% KNO3
2 (high-chloride) 60% NaNO3 Coastal40% KNO3 + 1.0
wt.% NaCl
3 (max. chloride) 60% NaNO3 Coastal40% KNO3
+ 1.3 wt.% NaCl4 60% NaNO3 Chilean (b) (Technical)
40% KNO3 Chilean5 60% NaNO3 Chilean (Industrial)
40% KNO3 Chilean6 60% NaNO3 Chilean (Niterox)
40% KNO3 Cedar (c)7 60% NaNO3 Chilean (Technical)
40% KNO3 CedarT (d) NaNO3 Coastal
KNO3
Ca (NO3)2
(a) Coastal Chemical Co., Inc., Houston, TX(b) Chilean Nitrate Corporation; Norfolk, VA(c) Cedar Chemical Co., Vicksburg, MS(d) Coastal HiTec XL, a proprietary mixture of Coastal Chemical Co.
Table 2 Impurity Concentrations (wt.%) in Nitrate SaltMixtures (a)
Impurity 1 2 3 4 5 6 7
Chloride 0.040 0.574 0.760 0.260 0.462 0.104 0.060Perchlorate 0.035 0.032 0.045 0.247 0.316 0.140 0.064Sulfate <0.002 <0.002 <0.002 0.146 0.182 0.015 0.011Carbonate 0.010 0.01 0.006 0.009 0.021 0.009 0.010Nitrite 0.025 0.028 0.027 <0.001 0.007 0.001 <0.001
(a) Nominal salt composition: 60 wt.% NaNO3/40 wt.% KNO3
Journal of Materials Engineering and Performance Volume 13(1) February 2004—79

corrosion products with negligible attack of the underlyingmetal. In some instances, the companion specimens for se-lected time intervals were cross-sectioned and prepared formetallographic examination. Optical and scanning electron mi-croscopy (SEM) and electron microprobe analysis were used tocharacterize the structure and composition of the adherent cor-rosion products. The oxide phases present were identified by anx-ray diffraction procedure as described elsewhere.[13]
3. Results and Discussion
3.1 Stainless Steels
3.1.1 Descaled weight loss316SS. Figure 1(a) shows a plot of the average (of two)
descaled weight loss data versus time for 316SS. Weight lossmeasurements on duplicate coupons extracted from the saltmixtures at each time interval indicate that the scatter in themeasurements was approximately 10% or less. The weightlosses were between 5 and 6 mg/cm2 after 7008 h of immer-sion, except for mixture #6, which was somewhat higher at 8mg/cm2. The weight losses at 7008 h correspond to reductionsin metal thickness of 6-10 �m.
The close grouping of the weight loss curves for each of thesalt mixtures indicates that corrosion of 316SS was relativelyinsensitive to the impurity content of the various nitrate mix-tures. The small, descaled weight losses of coupons in theternary salt mixture (#T) were due to the low temperature ofthat crucible until near the end of the test. The average valuesof the descaled weight losses of 316SS are plotted in Fig. 1(b)using logarithmic coordinates. When plotted in this way,weight loss versus time data can often be used to infer a cor-rosion mechanism. For example, data that exhibits one-halfpower time dependence implies that the surface corrosion prod-ucts grow by a diffusion-controlled process where the rate offormation slows as the oxide film thickens. Such a “parabolic”process is inherently protective since the formation of the scaleimpedes further corrosion. Alternatively, linear kinetics canarise in a number of ways. In this instance, the corrosion filmmay be porous and therefore not constitute an effective diffu-sion barrier. Net linear kinetics may arise through a sequentialprocess of protective oxide layer growth and spallation.
In the present experiments, we are unable to assign a power-law (i.e., a unique kinetic process) to most of the data. In manyof the mixtures, kinetics appears to closely follow parabolicrate laws initially and then become linear after prolonged ex-posures. This situation often arises when oxide layers growuntil their adhesion is compromised, by the formation of re-sidual stresses in the oxide layer for example.[14] In the absenceof uniform corrosion kinetics for the entire duration of these
tests, a conservative approach based on a linear extrapolationof the data seems warranted for estimating corrosion-inducedmetal loss at longer times. For isothermal exposures, such lin-ear extrapolations yield annualized weight losses of 6-10 mg/cm2. It should be recognized that in a solar thermal powerapplication, the receiver is only at temperature approximately1/3 of the time. Thus, for a projected 30-year service life typi-cal of solar thermal applications, an upper estimate of weightloss for 316SS is about 100 mg/cm2. This corresponds to a totalmetal loss for 316SS of approximately 125 �m (0.005 in). Weemphasize that these estimates are based solely on the currentisothermal exposure data and do not account for effects thatmay arise from the diurnal cycling inherent in receiver opera-tion.
304SS. Descaled weight loss measurements for the 304SScoupons versus time are plotted in Fig. 2(a). Overall, 304SSexhibited more variability in corrosion resistance comparedwith 316SS. The weight losses range from 4-10 mg/cm2 after7000 h of immersion or annualized losses of 5-12 mg/cm2.These weight losses correspond to an annualized reduction inmetal thickness of 6-15 �m. For a 30-year service life, an upperestimate of total metal loss for 304SS is approximately 150 �m(0.006 in). Again, the ternary mixture (#T) was an exceptiondue to the singularly low temperature in that crucible until latein the test.
The weight loss data for 304SS reveal the presence of aneffect due to chloride concentration. The effect is particularlyevident for the high-purity mixture (#1) versus the chloride-doped mixtures, #2 and #3 (solid symbols in Fig. 2). The mix-tures containing a variety of impurities, #4-7, also generallyshow increasing corrosion rates as chloride content increased,although other impurities, such as sulfate in mixture #5, mayalso affect corrosion rates.[15] Those mixtures containing lessthan approximately 0.3 wt.% chloride, #1, #6 and #7, experi-enced ∼50% of the corrosion observed in the mixtures exceed-ing this level of chloride. We also note that corrosion rates ofboth 304SS and 316SS in the mixtures containing the lowestconcentrations of impurities, #1, #6 and #7, were essentiallyidentical.
All of the 304SS coupons exhibited relatively large weightlosses of 1-2 mg/cm2 within the first 100 h of exposure, fol-lowed by much slower rates of weight loss. These initial weightlosses may be attributed to surface finish effects and may notbe typical of the bulk material response. To determine thecorrosion kinetics for the data shown in Fig. 2(a), it is neces-sary to normalize the data to remove the short-term weightlosses. The normalization is performed by subtracting the timeand weight loss measurements of the first exposure intervalfrom all subsequent measurements. The relatively small weightlosses, combined with the scatter in the data, preclude an un-ambiguous interpretation of Fig. 2(b), a logarithmic plot of thenormalized data.
The normalized data do, however, reveal certain interestingtrends that further suggest the presence of a chloride effect. Thecoupons exposed to the higher chloride concentration mixtures(#2-5) tend to exhibit nearly linear weight loss kinetics, al-though the rates are generally low. For the remaining low-chloride binary mixtures (#1, #6, and #7), the kinetics appearsto more closely follow parabolic or one-half power time de-pendence. This can be seen more clearly in Fig. 3, which shows
Table 3 Nominal Elemental Composition of Alloys(wt. %)
Alloy C Mn Si Cu Mo Cr Ni
A 36 0.29 0.85-1.20 0.15-0.30 0.20 … … …304 SS 0.08 2.0 1.0 … … 18-20 8-10316 SS 0.08 2.0 1.0 … 2.0-3.0 16-18 10-14
80—Volume 13(1) February 2004 Journal of Materials Engineering and Performance

a nearly linear relationship between descaled weight loss plot-ted against the square root of time (parabolic coordinates). Thissuggests that the corrosion scales formed in these low-chloridemixtures are protective. We suspect that the low linear corro-sion rates in the higher chloride concentration mixtures are dueto repeated detachment of otherwise protective oxides.
3.1.2 Oxide Scale Adherence. Visual inspection of thecoupons before descaling clearly indicated that the surface ox-ide layers spalled to some degree on numerous samples. Inmany cases the unoxidized base metal was visible, indicatingthat spallation had occurred as the samples cooled to roomtemperature. Because both net weight change data and descaledmetal loss data were obtained at corresponding time intervals,the tendencies of oxide scales to spall can be quantitatively
evaluated. We define S to be the ratio of the net weight gain(the weight of a coupon upon removal from the crucibles minusits initial weight) and the descaled weight loss. If all of theoxide formed by corrosion adheres to a coupon and if the lossof metal alloy constituents as solutes in the melt is negligible,then the value of S is established by the stoichiometry of theoxide according to Eq 1.
S =gO � W�a�o�Oxygen
gM � W�a�o�Metal(Eq 1)
In Eq 1, gO and gM are the stoichiometric coefficients ofoxygen and metal of the oxide compound comprising the scale
Fig. 1 (a) Descaled weight loss measurements for 316 stainless steel specimens exposed to nitrate salt mixtures at 570 °C; (b) logarithmic plotof descaled weight loss measurements shown in (a)
Fig. 2 (a) Descaled weight loss measurements for 304 stainless steel specimens exposed to nitrate salt mixtures at 570 °C; (b) logarithmic plotof descaled weight loss measurements shown in (a). To eliminate surface effects, the data have been normalized to exclude weight loss measure-ments from the first sampling interval.
Journal of Materials Engineering and Performance Volume 13(1) February 2004—81

and W(a/o)Oxygen and W(a/o)Metal are their respective atomicweights. Based on the x-ray diffraction (XRD) results dis-cussed later, we assume that magnetite, Fe3O4, constitutes themajor fraction of the oxide formed. For this case, the value ofS is 0.38. Spinel [Fe(Fe,Cr)2O4] was also formed, but the valueof S changes marginally as the transition metals Fe and chro-mium (Cr) have comparable atomic weights.
To obtain an indicator of oxide adherence that varies be-tween unity for completely adherent layers and zero for com-pletely detached oxides, we note that for completely adherentoxides, the weight of a coupon as removed from the melt,Wf, is
Wf = Wo + S ��Wloss�
where Wo is the initial coupon weight. To obtain a quantity onthe left-hand side that becomes zero if all the oxide spalls off,we subtract the weight of the descaled coupon, Wd, from eachside.
(Wf − Wd) � (Wo − Wd) + S (�Wloss ) � (S + 1) (�Wloss)
The above equation can be rearranged into an identity thatwe define as the scale adherence factor, Y.
Y =1
S + 1
�Wf − Wd�
�Wloss(Eq 2)
We expect that oxide scales should be adherent at shorttimes, so the sampling time at which Y decreases below unityindicates that oxide spallation has occurred. Because weightchange measurements are aggregated over the entire coupon,the value of the indicator gives no information about the typeof spallation and is not necessarily useful for mechanistic in-terpretations of spalling. Values less than unity does not serve
to indicate that spallation occurs concurrently with the hightemperature exposure or at some time subsequent to exposure.A similar approach has been used recently by Ziemniak andHanson to determine the adherence of oxide layers formed onAlloy 625 during long-term exposure to high-temperaturesteam.[22] The “corrosion release factor” used by these authorsis essentially the complement of the “scale adherence factor”defined here.
The calculated values of Y for 316SS and 304SS are shownin Fig. 4 and 5 versus log time. Figure 4 shows that the oxidelayers on 316SS are adherent in all the salt mixtures for at least1600 h, except for mixture #6. At the next sampling interval(2952 h), these values decline below unity in all cases. Thisresult correlates with the weight loss measurements in Fig. 1(a)and 1(b) in that parabolic kinetics are obeyed at short timeintervals while linear kinetics hold for longer-term exposures.In contrast to 316SS, Fig. 5 shows that even at 100 h, the oxidelayers on 304SS were not completely adherent. The lack ofoxide adherence indicated in Fig. 5 is not inconsistent with theparabolic weight change data for 304SS shown in Fig. 3 formixtures #1, #6, and #7. Rather, these two observations suggestthat the loss in oxide adherence results from thermal stressesinduced upon specimen cooling to room temperature, ratherthan oxide growth stresses.
3.1.3 Oxide Structure and Composition. Detailed char-acterization of the structure and evolution of the corrosionproducts was made difficult due to the degree of spallation thatoccurred and by the complexity of the surface oxidation prod-ucts. Notwithstanding these difficulties, remnant oxide scalesfrom several coupons provided useful information regardingstructure. Figure 6 shows a scanning electron micrograph(SEM) of a metallographic cross-section of a 304SS couponimmersed in mixture #4 for 1608 h. The coupon was nickel(Ni) plated prior to metallographic preparation (to protect thecorrosion products from damage) and the layer of plating ismarked on the micrograph. The microscopy reveals that theoxide has formed a surface film with an average thickness of5-12 �m. The scale in Fig. 6 is composed of two distinctregions separated by a well-defined crack that runs parallel to
Fig. 3 Descaled weight loss for 304 stainless steel specimens ex-posed to nitrate salt mixtures 1, 6, and 7. After an initial rapid increase,weight loss measurements exhibit a parabolic dependence with respectto exposure time.
Fig. 4 Scale adherence factor for 316 SS. Data indicate that thesurface oxides were adherent through 1600 hours of exposure.
82—Volume 13(1) February 2004 Journal of Materials Engineering and Performance

the oxide-metal interface. The scale formed at the externalsurface (adjacent to the nickel layer) is the most irregular inthickness, varying from 1 to 8 �m. The variability in the thick-ness of the oxide reflects the lack of adherence (it is likely thatthe structure shown is not a first generation scale). While theoxide adjacent to the alloy is considerably more uniform in
thickness, it appears to be quite porous. The general morphol-ogy of the corrosion products shown in this figure was char-acteristic of those formed in each of the binary salt mixtures.However, the extensive porosity at the oxide-metal interfaceevident in Fig. 6 was only occasionally observed. It was notseen in any of the 304SS coupons at times shorter than 1608 hand was observed in the 316SS specimens at only much longertimes. This porosity may explain the lack of adherence of thecorrosion products. The fact that this porosity is only occasion-ally observed suggests it develops slowly with time as eachsuccessive generation of oxide is formed.
Figure 7 shows a backscatter electron image (BSE) of theadherent oxide on a 304SS coupon immersed in mixture #1 for7008 h. The contrast in the corrosion layer reflects the sensi-tivity of BSE to the atomic mass of the constituents of thedifferent oxide phases. The figure also shows the elementaldistribution of the principal alloying elements of 304SS andcertain constituents of the nitrate mixture,[16] sodium and mag-nesium, through the thickness of the surface scale. This analy-sis was done using the wavelength dispersive analysis (WDS)capability of the electron microprobe (EMP) and is semi-quantitative in nature. Due to the extensive spallation, neitherthe image nor the elemental profiles reflect the structure andcomposition of a 7000 h oxide. Rather, they only reflect theresidual, adherent structure of an nth generation scale. Thus,these elemental profiles can show considerable variation be-tween specimens. For the corrosion features shown in Fig. 7,the WDS results reveal that the oxide at the external surface(the surface in contact with the salt) was a Cr-free, Fe-basedoxide that contained ∼12% sodium. This is typical of many ofthe residual oxides at this and at shorter time intervals and hasbeen observed in an earlier study.[17] X-ray diffraction (seebelow) identified this surface scale as NaFeO2. The analysisfurther revealed that Fe and Cr were the principal metallicconstituents of the subsurface scale. Manganese (Mn) was alsofound in this layer at 2-3 times its normal concentration in thealloy. Chemical analysis revealed that mixture #1 containedonly trace amounts of magnesium (Mg) and in agreement withthis, no magnesium Mg was detected in any of the oxide layers.
XRD was used to identify specific crystallographic phasesin the oxide structures. The analyses focused primarily onsamples removed from mixtures #1 and #5 at progressivelylonger sampling times up to 2952 h. Three major phases wereidentified on both alloys. These consisted of an orthorhombicFe2O3 (hematite) type phase, a cubic spinel Fe3O4 (magnetite)type and orthorhombic sodium ferrite, NaFeO2. The sodiumferrite may have its origin in the reaction between traceamounts of sodium oxide in the molten nitrate and hematite as
Na2O + Fe2O3 → 2�aFeO2
Based on the corresponding EMP data, Cr and Mn likelysubstitute for iron in the cubic spinel oxide corresponding to an(Fe, Cr, Mn)3O4 type structure. In addition, it is likely thatsubstitution of Mg (when present) and Cr for Fe in the spinelFe3O4 phase corresponds to a (Fe, Cr, Mg)O4 type cubic struc-ture. Where Mg is detected, it is likely that Mg+2 substitutes forFe+2 in Fe3O4 to form MgFe2O4.
Coupons immersed in mixtures #4 and #5 had surface scales
Fig. 6 Scanning electron micrograph of a metallographic cross-section of a 304SS coupon immersed in mixture #4 for 1608 h
Fig. 5 Scale adherence factor for 304 SS. Data indicate that thesurface oxides were not adherent even at short times.
Journal of Materials Engineering and Performance Volume 13(1) February 2004—83

with a distinctive rust-red coloration indicative of hematite(Fe2O3). The relative abundance of the different phaseschanged with immersion time. For instance, the XRD resultsfor the samples immersed for 864 h identified the presence ofboth the Fe2O3 and Fe3O4 type of oxides. At this samplinginterval, Fe2O3 was more abundant compared with Fe3O4,based on relative intensity of the diffraction peaks. The Fe3O4
phase increased with respect to Fe2O3 as exposure time in-creased. NaFeO2 was first observed for the 1608 h samples(both 304 and 316SS) and was most abundant in the samplesremoved from mixture #5. Furthermore, the NaFeO2 phasecontinued to increase in samples removed at 2952 h. Due to theextensive spallation, x-ray analysis was not performed atlonger immersion times. Even at shorter times, the observationsregarding the relative abundance of the different oxide phasesmust be considered qualitative.
All of the 304SS coupons exhibited the presence of darksubsurface features located in a 5 �m wide band immediatelybelow the oxide-metal interface. In each instance, these fea-tures are associated with elevated Ni concentrations (≈14-20wt.%) and depleted Cr concentrations (∼12%).
The oxide structures formed on a 316SS coupon exhibitedsimilar features to those shown for the 304SS coupons.
3.2 Carbon Steel
3.2.1 Descaled weight loss. Descaled weight loss mea-surements for the carbon steel specimens at 316 °C are shownin Fig. 8(a). In general, the data fall into two distinct categories.The specimens exposed to the high-purity/chloride-doped mix-tures (#1-3) experienced both larger initial weight losses andlarger long-term weight losses than coupons immersed in mix-tures #4-7, which contained a variety of impurities in additionto chloride. Chloride concentration alone cannot account forthese differences in corrosivity since the chloride levels ofmixtures #4-7 were intermediate between mixtures #1 and #2(see Table 1). Indeed, even for those specimens immersed onlyin mixtures #1, #2, and #3, where the base nitrate compositionwas identical, the increasing chloride concentration did notresult in an unambiguous increase in corrosion. For the speci-mens exposed to nitrate mixtures containing other impurities(#4-7), the overall weight changes do not show a systematiceffect of chloride levels on corrosion.
These observations contrast with previous findings of short-term corrosion tests. For example, El Hosary, et al.,[8] reportedthat the corrosion rate of mild steel at 400 °C increased ap-proximately as the logarithm of the chloride concentration in
Fig. 7 Backscatter electron image (BSE) of the adherent oxide on a 304SS coupon immersed in mixture #1 for 7008 h
84—Volume 13(1) February 2004 Journal of Materials Engineering and Performance

the range studied here. In that work, at 0.5 wt.% chloride, thecorrosion rate increased by a factor of about three comparedwith a chloride-free melt during an 8 h test. Notoya, et al.,report substantially the same results for corrosion of iron at400-450 °C.[10] The lower temperatures used in the currentwork may be the source of the contrasting behavior.
Figure 8(b) is a logarithmic plot of the weight loss datashown in Fig. 8(a). Similar to the behavior of the 304SS, all ofthe carbon steel coupons exhibited a relatively large weightloss in the first sampling interval, ranging between 0.2 and 0.5mg/cm2. As before, it is necessary to normalize the data toremove the short-term effects to identify the corrosion kinetics.Here too, the small weight change measurements coupled withthe scatter in the data preclude unambiguous interpretation ofFig. 8(b). However, the coupons exposed to mixtures #1-3 tendto exhibit nearly linear weight loss kinetics. For the remainingbinary mixtures (#4-7), the kinetics appear to more closelyfollow parabolic or one-half power kinetics, suggesting an oxi-dation process that yields more protective scales than for thefirst three mixtures. Other studies have shown that carbonsteels can display parabolic oxidation kinetics in molten ni-trates during short (10 h) immersion times.[8-10]
3.2.2 Oxide Adherence on Carbon Steel. In contrast tothe stainless steel coupons, the carbon steel coupons did notshow any spallation of oxides to the bare metal upon visualexamination. To estimate the amount of spallation, the sameprotocol used above was applied to the weight change dataobtained for carbon steels. The results of these calculations arepresented in Fig. 9 and generally show that oxides on the Csteel specimens immersed in mixtures #4-#7 are adherent evenafter 7000 h of immersion. This adherence is no doubt partlydue to the relatively thin layers that grow at the lower tem-perature of these tests. Thinner layers generate both lowergrowth stresses as well as lower thermally-induced stress uponcooling. The calculated adherence factors for the specimensimmersed in mixtures #1-#3 are somewhat less than unity andthe weight loss data presented in Fig. 8(b) indicate that thecorrosion kinetics are more accurately described as linear.
The rather low amounts of corrosion rendered microscopyineffective as an analytical tool for characterizing the structureand composition of the residual corrosion products simply be-cause the oxide scales were only 2-4 �m in thickness, based onweight change data. However, XRD showed the scale to con-sist of two phases, a dominant Fe3O4 spinel phase and a minorphase corresponding to Fe2O3.
We have not discussed the structure and composition of theoxide layers formed on the alloys immersed in the ternarymixture. This is due principally to the minimal corrosion ex-perienced by all the stainless steels at the low exposure tem-perature. The very thin surface scales formed on the stainlesscoupons precluded any quantitative or even qualitative analysisof the type discussed above. We note however, that the A36coupons exposed to the ternary mixture (#T) exhibited lowerweight losses than those in any of the binary mixtures at thesame temperature. It was evident that a different type of oxide
Fig. 8 (a) Descaled weight loss measurements for carbon steel specimens exposed to nitrate salt mixtures at 316 °C; (b) logarithmic plot ofdescaled weight loss measurements shown in (a). To eliminate surface effects, the data have been normalized to exclude weight loss measurementsfrom the first sampling interval.
Fig. 9 Oxide adherence factor for carbon steel specimens. Data in-dicate that the surface oxides were generally adherent at this relativelylow exposure temperature.
Journal of Materials Engineering and Performance Volume 13(1) February 2004—85

was formed on C steel in the ternary salt since it was difficultto descale these coupons compared with the others.
3.3 Molten Salt Composition
The concentrations of the impurity species listed in Table 2and dissolved metallic corrosion products were analyzed peri-odically. A detailed discussion of molten salt chemistry and thechanges in composition of the impurities in the molten saltmixtures during these experiments is available elsewhere.[21]
With regard to the discussion of corrosion in this paper, wenote that the molten salt mixtures maintained concentrations ofnitrite ion consistent with equilibrium calculations for the ni-trate-nitrite-oxygen shift reaction given contact with air at thetemperatures used for corrosion testing.[18] This reaction in-creased the concentration of nitrite to about 3.6 wt.% at 570 °C.The amount of nitrite at 316 °C was negligible.
The chloride concentrations in a number of mixtures in-creased slightly during the first 1608 h of the test. The in-creases in chloride occurred in concert with a correspondingand stoichiometric decrease in perchlorate (ClO4
−) concentra-tion until, at 1608 h, the perchlorate concentration in all of thehigh temperature crucibles was essentially zero. The chloridelevels then stabilized at the higher values. Although the per-chlorate ion is reported to be stable in KNO3 at 450 °C,[19] itcan be reduced to chloride by a number of reactions. A redoxreaction would likely occur with nitrite since a stoichiometricexcess of nitrite is formed by the shift reaction mentionedabove. The free energy change for perchlorate reduction bynitrite is favorable based on the data available for low tem-perature.[20] Perchlorate can also be reduced by metallic cor-rosion or by other impurities in the melts. The rate of perchlor-ate reduction was much slower at 316 °C.
Molten salt samples from each high temperature cruciblewere analyzed for dissolved Cr and Mg as the hexavalent oxi-dation products of these alloying elements (chromates andmanganates) are soluble in molten nitrates.[2] Figure 10 showsthe increase in Cr concentration with time. After initially in-creasing up to 864 h, the Cr concentration remained nearlyconstant, suggesting that the solubility limit of an unidentifiedmetallic chromate compound was reached. The Mn concentra-tion continued to increase with time although at a much lowerlevel than Cr due to its relatively low concentration in thealloys. Analyses for Fe and Ni were not performed, as theseelements do not form soluble species in molten nitrate salts.[2]
4. Summary
The experimental data presented here show that the impu-rities typically contained in commercial grades of alkali nitrateshave relatively small effects on corrosion of stainless and car-bon steels in molten salts prepared from these constituents. Thecorrosion rates of 316SS and 304SS imply that metal losses of6-15 �m/year may be anticipated during isothermal service at570 °C. For the 304SS coupons, the influence of increasingchloride concentration was evident; namely, the rate of weightloss increased as the chloride concentration increased. How-ever, the magnitude of the effect was not significant in thecontext of the engineering application. No single rate law could
be ascribed to the corrosion kinetics for the alloy in all of themixtures. The low-chloride mixtures tended to exhibit para-bolic kinetics while the remainder of the mixtures exhibitedapproximately linear kinetics. For 316SS, weight loss generallyfollowed parabolic corrosion kinetics at short times, transition-ing to linear kinetics at longer exposure times. Corrosion ratesfor 316SS were largely insensitive to the impurity content ofthe melts. Elemental analysis of the corrosion products on thestainless steel coupons revealed that they consisted of a com-plex mixture of iron-based oxides that contained several otherelements derived from both the alloying elements (Cr, Mn) andconstituents of the molten salt (Na, Mg).
The differences between the corrosion behavior of the twotypes of stainless steel tested may well arise from differences inthe initial surface finish of the test coupons or from minordifferences in their elemental compositions.
Neither the incomplete oxide adherence of the stainless steelsamples nor the gradual evolution of porosity in the alloysimmediately below the surface scale has been previously ob-served. These particular results indicate the need to conductcorrosion tests using non-isothermal conditions to obtain reli-able estimates of corrosion allowances for components such asreceiver tubes that necessarily undergo daily thermal cyclingbetween the maximum and ambient temperatures. These testsare in progress at this time.
The experimental data demonstrate that at 316 °C, A36carbon steel is relatively tolerant to the impurities typicallyfound in commodity grades of alkali nitrates. The influence ofdeliberate additions of chloride to a high-purity nitrate mixturewas not clearly evident. While there appears to be some dif-ference in the corrosion behavior among various salt mixtures,the overall weight losses were modest and correspond to cor-rosion rates of about 5 �m/year. Oxide layers, which consistedprimarily of magnetite, were generally adherent during theselong-term tests.
Acknowledgments
The authors wish to acknowledge the contribution of thefollowing individuals: A.D. Gardea, and D.R. Boehme (SNL/
Fig. 10 Chemical analysis of concentration of dissolved chromium inthe molten nitrate salt mixtures during the corrosion tests at 570 °C
86—Volume 13(1) February 2004 Journal of Materials Engineering and Performance

CA), and, M.R. Prairie and J.M. Chavez (SNL/NM). This workwas supported by the U.S. Department of Energy under con-tract DE-AC04-94AL85000.
References
1. P.J. Speidel, B.D. Kelly, M.R. Prairie, J.E. Pacheco, R.L. Gilbert andH.E. Reilly: “Performance of the Solar Two Central Receiver PowerPlant,” J. Phys. IV, 1999, 9, pp. 181-87.
2. R.W. Bradshaw and R.W. Carling, A Review of the Chemical andPhysical Properties of Molten Alkali Nitrate Salts and Their Effect onMaterials Used for Solar Central Receivers, SAND87-8005, SandiaNational Laboratories, Livermoe, CA, April 1987.
3. R.W. Bradshaw, Corrosion of 304SS by Molten NaNO3-KNO3 in aThermal Convection Loop, SAND80-8856, Sandia National Labora-tories, Livermore, CA, Dec. 1980.
4. S.H. Goods: J. Mater. Energy Sys., 1983, 5, pp. 28-36.5. S.H. Goods: “Mechanical Properties of Alloy Steels in Molten So-
dium-Potassium Nitrate Salts,” High Temperature Corrosion in En-ergy Systems, M.F. Rothman, ed., The Metallurgical Society of AIME,Philedephia, PA, 1985, pp. 643-58.
6. P. Hancock: Oxid. Metals, 1985, 23, pp. 305-11.7. I.B. Singh and U. Sen: Brit. Corros. J., 1992, 27, pp. 299-304.8. A.A. El Hosary, A. Baraka, and A.I. Abdel-Rohman: Brit. Corros. J.,
1976, 11, pp.228-230.9. A. Baraka, A. I. Abdel-Rohman, and A.A. El Hosary, Brit. Corros. J.,
1976, 11, pp. 44-46.10. T. Notoya, T. Ishikawa, and R. Midorikawa: “Corrosion Behavior of
Iron and Low Carbon Steels in Molten Alkali Nitrates ContainingAlakali Halide” in Proc. Fifth Int’l. Congress on Metallic Corrosion,N.A.C.E., Houston, TX, 1972, pp. 1039-143.
11. I. Kayafas: Corrosion, 1980, 36, pp. 443-45.
12. N.A.C.E. Technical Practices Committee: “Procedures for Quantita-tive Removal of Oxide Scales Formed in High temperature Water andSteam,” Mater. Performance, 1967, 6, p. 69-72.
13. R.W. Bradshaw, S.H. Goods, M.R. Prairie, and D.R. Boehme: “Cor-rosion of Carbon Steel and Stainless Steels In Molten Nitrate Mix-tures” in Proceedings of the International Symposium on Molten SaltChemistry and Technology—1993, M.L. Saboungi and H. Kojima, ed.,PV-93-9, The Electrochemical Society, Pennington, NJ, 1993, pp. 446-51.
14. J. Armitt, D. R. Holmes, M. I. Manning, D. B. Meadowcroft, and E.Metcalfe: “The Spalling of Steam Grown Oxide from Superheater andReheater Tube Steels,” Central Electricity Generating Board (UK),RD/L/R 1974 (Feb. 1978).
15. Martin-Marietta Corp., “Alternate Central Receiver Power System,Phase II,” Final Report, Vol. III–Molten Salt Materials Tests,SAND81-8192/3, Jan. 1984, Sandia National Laboratories, Albuquer-que, NM.
16. Chemical Composition Specifications, Chilean Nitrate Corporation,Norfolk, VA, 1984.
17. D.R. Boehme and R.W. Bradshaw: High Temp. Sci., 1984, 18, pp.39-51.
18. D.A. Nissen and D.E. Meeker: Inorg. Chem., 1983, 22, pp. 716-21.19. O.J. Kleppa and S.V. Meschel: J. Phys. Chem., 1963, 67, p. 2750-55.20. I. Barin, O. Knacke, and O. Kubachewski: “Thermochemistry of An-
ion Mixtures in Simple Fused Salt Systems” in Thermochemical Prop-erties of Inorganic Substances, Springer-Verlag, Berlin, Germany,1977.
21. S.H. Goods, R.W. Bradshaw, M.R. Prairie, and J. M. Chavez, Corro-sion of Stainless and Carbon Steels in Molten Mixtures of IndustrialNitrates, SAND94-8211, Sandia National Laboratories, Livermore,CA, March 1994.
22. S.E. Ziemniak and M. Hanson: Corros. Sci., 2003, 45, pp. 1595-1618.
Journal of Materials Engineering and Performance Volume 13(1) February 2004—87