corrosion of aluminum in water of aluminum in water ... found that the corrosion of 6061-~6 alloy...
TRANSCRIPT

NASA CR-899
CORROSION OF ALUMINUM IN WATER
By D. N. Fultonberg
Distribution of this repor t is provided in the interest of information exchange. Responsibility for the contents r e s ides in the author or organization that prepared it.
Prepared under Contract No. NAS 3-5215 by WESTINGHOUSE ELECTRIC CORPORATION
Pittsburgh, Pa.
for Lewis Research Center
NATIONAL AERONAUT ICs AND SPACE ADMINISTRATION
For sa le by the Clearinghouse for Federal Scient i f ic and Technica l Information Springfield, Virginia 22151 - CFSTI price $3.00
https://ntrs.nasa.gov/search.jsp?R=19670028812 2018-05-14T17:41:04+00:00Z

FOREWORD
The research described herein, which was conducted by the Westinghouse Atomic Power Divisions, was performed under NASA Contract NAS-3 -5215 with Mr. M. H. Krasner, Nuclear Systems Division, NASA-Lewis Research Center, as Technical Manager. The report w a s originally issued as Westinghouse document WCAP-7029, May 1967.
iii
PRECEDING PAGE BLANK W T FiUt;ED.
T A B U OF CONTENTS
L i s t of Figures
L i s t of Tables
I. ABSTRACT
11. SUMMARY
111. INTROWCTION
I V . PROGRAM REQUIREMENTS
V. EXPERIMENTAL PROGRAM
V I . S T R I P P I N G OF SPECIMENS
V I I . EXPERIMENT& RESULTS
V I I I . CONCLUSIONS
REF'ERENCES
APPENDIX A A n a l y s i s of H y d r o g e n i n Solution
APPENDIX B A l u m i n u m S t r ipp ing Procedure (6061-~6)
Page No.
v i
v i i
46
53
7 1
73
74
75
V

LIST OF FIGURES
Figure No.
1
2
3 4
5
6
7
8
9 10
11
12
13 14 15 16 17
18
1-9
20
21
T i t l e
Modified Mater ia ls Compatibil i ty
Test Spec ime n He a t e r Connect ion
Test Sect ion Manifold
Modified Mater ia ls Compatibil i ty
Test Loop
Test Loop, Test Sect i on He a t e r s E l e c t r i c a1 Schematic
Modified Mater ia ls Compatibil i ty Test Loop Control Schematic
Hydrogen Generation During Passivat ion Run i n Test
Hydrogen Generation Rate During Passivat ion Run i n Test Loop
Hydrogen Generation i n Loop, No Specimens
Hydrogen Generation i n Loop During Low Power Test
Hydrogen Generation i n High Power Loop Test
Autoclave Test Setup
Results of P r e t r e a t i n g Autoclave Specimens
Hydrogen Analysis of 200°F Autoclave Test
Hydrogen Analysis of 300'F Autoclave Test
Test Weight Change for 200'F Autoclave Test
Test Weight Change f o r 300'F Autoclave T e s t
Test Weight Change as a %net ion of Preoxidation Weight Change f o r t h e 200 F Autoclave Test
Test Weight Change A s a %net ion of Preoxidation Weight Change f o r t h e 300 F Autoclave Test
Autoclave Test Specimen Weight During T e s t Change Versus T e s t Duration
Hydrogen Generation Results
To ta l Hydrogen Generation Caused by Aluminum Corrosion
Loop
Page No.
9 11 12
14
15
17
18
20
23 29 31
33
38 39 42 43
55
56
57 59
63
v i
LIST OF TABUS
Table No. T i t l e
1
2
3 4 5 6 Chemical Analyses - Autoclave Base Line Operation
7 Chemistry Sunnary - 200'F Autoclave Test
8 Chemistry Summary - 300°F Autoclave Test
9 Weight Change Results from 200°F Autoclave Test
10 Weight Change Results from 300°F Autoclave Test
11 200'F Autoclave Test - Analyses o f Solut ions and Composite Residue
300°F Autoclave Test - Analyses o f Solut ions and Composite Residue
Results of S t r ipp ing Steam Treated Specimens
Results of Str ipping Untested Samples
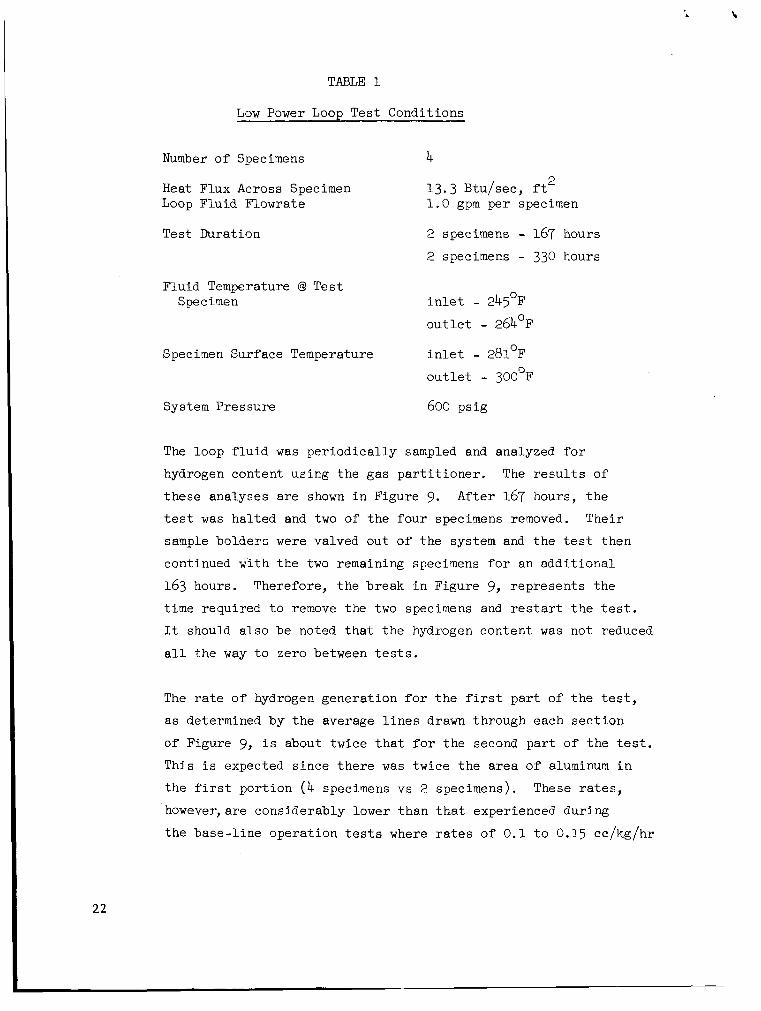
Low Power Loop Test Conditions
Low Power Test Specimen Weight Change
Chemistry Analyses from Low Power Loop Test
High Power Loop Test Conditions
High Power Loop Test- Specimen Weight Change
12
13 14 15 Analyses of S t r i p Solutions
16 17 18 Hydrogen Generation from Autoclave Specimens -
Results of Str ipping Autoclave Specimens
Resul ts of S t r ipp ing Loop Test Specimens
Calculated Using S t r i p Weight Change Information
Page No.
22
24
26
27
28
35
36
37
4 0
4 1
44
45
48
49
50
5 1
52
60
v i i
E 9
I. ABSTRACT
Tes t s were performed i n autoclave systems and i n pumped loops i n
o r d e r t o determine t h e corrosion and hydrogen generat ion of aluminum
when subjected t o condi t ions t y p i c a l of those an t i c ipa t ed i n a Tungsten
Water-Mcderated Reactor (TWMR).
t h e r e s u l t s obtained are discussed. It was concluded t h a t t h e hydrogen
gene ra t ion could be excessive under c e r t a i n condi t ions and t h a t a broader
program would be necessary i n order t o p red ic t it with some confidence.
These tests, t h e equipment used, and
1
t 'c
11. SUMMARY
A t e s t program was conducted which was d i r e c t e d toward obtaining
r e l a t ionsh ips e s t a b l i s h i n g t h e generat ion of hydrogen as a r e s u l t of
aluminum corrosion i n water. This information could then be u t i l i z e d
i n the design of a Tungsten Water-Moderated Reactor (TWMR) whose moderator
f l u i d (water) would be contained i n an aluminum pressure vessel . '
Two general types of t e s t s were performed; autoclave and loop t e s t s ,
each a t seve ra l condi t ions. Test v a r i a b l e s included temperature, t e s t
duration, surface treatment, and heat f lux .
I n t e r p r e t a t i o n o f t h e t es t r e s u l t s was attempted by seve ra l methods;
some of which yielded apparently u s e m 1 r e l a t i o n s h i p s , o t h e r s being d i s -
carded. The s c a t t e r of d a t a from these few t e s t s i n d i c a t e tha t . many more
t e s t s , w i t h fewer va r i ab le s , and more c l o s e l y con t ro l l ed conditions w i l l
be required i f meaningful r e l a t i o n s h i p s a r e t o be evolved.
The steam treatment of aluminum a t the conditions used i n t h i s
program reduced the subsequent corrosion of t h e aluminum s i g n i f i c a n t l y
as compared t o the "Hardcoat" treatment, and as evidenced by the autoclave
t e s t r e s u l t s . This aspect can a l s o be improved upon by f u r t h e r experimentation
w i t h steaming conditions.
2

111. INTRODUCTION
The moderator f l u i d i n t h e Tungsten Water-Moderated Reactor (TWMR) i s
contained i n a pressure v e s s e l constructed of aluminum.
tubes and flow b a f f l e s are imnersed in , and the re fo re i n contact with, t h i s
moderator f l u i d .
The aluminum pressure
The moderator system i s maintained a t a pressure o f 600 p s i g during
r e a c t o r operat ion. T h i s pressure i s reduced t o 100 ps ig when t h e r e a c t o r
i s shutdown so t h a t l a r g e d i f f e r e n t i a l pressures w i l l not e x i s t between
t h e moderator system and o t h e r systems. If t h e noderator water contains
dissolved gases i n s u f f i c i e n t q u a n t i t i e s t o exceed t h e i r s o l u b i l i t i e s a t
t h e reduced pressure o f 100 p s i , these gases w i l l evolve from so lu t ion .
The presence o f excessive amounts of gas would cause an increase i n system
pressure, possibly above t o l e r a b l e l i m i t s . This s i t u a t i o n would n e c e s s i t a t e
co r rec t ion ; nanely, removal o f t h i s excess gas. An a d d i t i o n a l system would
the re fo re be required, t o perform t h e funct ion of c o l l e c t i o n and vent ing o f
t h e gas under condi t ions of zero g rav i ty . It becomes necessary the re fo re t o
s tudy the s i t u a t i o n , examine t h e generat ion o f gas, and determine t h e condi t ions
e f f e c t i n g t h i s gas generation.
It was t h e express purpose of t h i s program t o study t h e f a c t o r s inf luencing
the generat ion of gas i n a system containing aluminum i n contact with water.
The gas i n quest ion i s hydrogen, a product of t h e r e a c t i o n of aluminum and
water, t h e corrosion process. This react ion can be expressed by:
2A1 + X H 2 0 + A l 0 . (X-3 )H2 + 3H2 2 3
The water hydrating with t h e alumina has been known t o vary from 7 moles per
mole of alumina down t o none. The spec i f i c r eac t ion as w e l l a s t h e ra te of
r e a c t i o n i s dependent upon t h e environmental conditions. Some o f these con-
d i t i o n s which could inf luence t h e hydrogen generat ion include: temperature,
pressure, aluminum surface condition, water p u r i t y and pH, water ve loc i ty ,
heat f l u x and du ra t ion o f contac t .
3

A l i t e r a t u r e survey revealed t h e l a r g e e f f e c t o f s o l u t i o n pH on the
corrosion of aluminum.
being equal, oxide formed 2.7 times f a s t e r when t h e coolant pH was 5.17 t o
Griess, e t a11j2, a t OFNL found t h a t o t h e r condi t ions
7.10 than when t h e pH was 5.0. Lobsinger3 and Draley 495 bo th found s i m i l a r
e f f e c t s although t h e magnitude d i f f e r e d somewhat.
Lobsinger3 r epor t s t h a t a t v e l o c i t i e s below about 60 f t / s e c t h e e ros ive
e f f e c t of t h e f l u i d should be neg l ig ib l e . English, e t a 1 on t h e o t h e r hand,
found t h a t t h e cor ros ion of 6061-~6 a l l o y increased as the water v e l o c i t y was
increased from 20 t o lo7 f t / s e c during 10 day tes t s .
6
It has been reported t h a t heat f l u x i t s e l f i s not a s i g n i f i c a n t v a r i a b l e
i n determining aluminum corrosion. With cons tan t sur face temperature, oxide
buildup was independent of heat f l u x e s i n t h e range 1 t o 2 x IO6 Btu/hr f t . The oxide formation i n a so lu t ion of pH 5.10 was r e l a t e d t o t i m e and sur face
temperature by the r e l a t ionsh ip :
2
.' - 4600 x = 443 Q0'778 exp
Where x i s t h e oxide thickness i n m i l s , Q i s t h e t i m e i n hours, and k
the surface temperature i n degrees ke lv in . I n t h e pH range 5.7 t o 7.0 t h e
coe f f i c i en t changes from 443 t o 1200, a l l o the r cons tan ts remaining t h e same.
A t heat f luxes below 1 x 10 , t h e c o r r e l a t i o n p red ic t s oxide th ickness con-
s iderably higher than were observed, i . e . a t 0.5 x lo6 Btu/hr f t , the
co r re l a t ion predicted th ickness twice those a c t u a l l y found. E a r l i e r work by
Griess2 a l s o showed t h a t t h e r a t e of oxide formation was a func t ion of t h e
temperature a t the specimen-water i n t e r f a c e and t h a t heat f l u x a s w e l l a s
flow r a t e and coolant temperature i n t h e ranges inves t iga ted were important
on ly i n t h a t they a f f ec t ed t h i s temperature.
pressures high enough t o prevent sur face boi l ing , p ressure i s not a f a c t o r
i n determining cor ros ion r a t e .
6 2
Griess a l s o found t h a t a t
4
6 The e f f e c t of su r f ace pretreatment was touched upon by Griess who
found t h a t a t v e l o c i t i e s up t o 47 f t / s e c a t 260°C, specimens p re t r ea t ed t o
o b t a i n 0.04 t o 0.09 m i l of corrosion, corroded only l/3 t o 1/2 t h e amount
of t h e "as-machined" specimens. Some comparative t es t s between "as-machined"
6 0 6 ~ ~ 6 aluminum and 6061-~6 aluminum with a 0.002 inch "Hdrd Coat" surface
run i n cadmium s u l f a t e s o l u t i o n a t atmospheric b o i l i n g i n d i c a t e a d r a s t i c
reduct ion i n t h e su r face corrosion due t o the hard coa t treatment.7 This
treatment i s a p r e p r i e t a r y process of Alcoa Company.
a t ORNL i nd ica t ed t h a t t h e hard coa t treatment reduced corrosion considerably.
Additional t e s t s run 8
Cer ta in impur i t i e s i n t h e water could cause a considerable e f f e c t on
t h e co r ros ion of t h e aluminum. Draley found t h a t ch lo r ide ion present t o
only 1 ppm induces p i t t i n g on 1100 aluminum.
hydrogen peroxide caused less corrosion during t h e i n i t i a l period b u t about
t he same r a t e t h e r e a f t e r a s f o r t h e d i s t i l l e d water case.
4
The presence o f 34 ppm of
5
I V . PROGRAM REQU1RE"TS
A review of the condi t ions i n t h e TWMR along wi th t h e information found
i n some o f the ref'erences j u s t c i t e d , lead t o t h e establishmbnt of a t e s t
program designed t o determine t h e genera t ion of hydrogen expected during t h e
TWMR l i f e t i m e .
T h i s program was divided i n t o two phases. One phase would simulate
conditions t o be experienced during r e a c t o r operat ion and t h e i n i t i a l shut-
down periods.
shutdown periods following t h e i n i t i a l period included i n phase one t e s t i n g .
The second t e s t phase would be r ep resen ta t ive of r e a c t o r
A. Phase I - Reactor Operation & I n i t i a l Shutdown
These t e s t s were conducted i n a loop i n which t h e t e s t f l u i d i s pumped
a t des i r ed v e l o c i t i e s and i s maintained a t the required chemistry
condi t ions.
clad i n 6 0 6 1 - ~ 6 aluminum generat ing t h e des i r ed heat i n o rde r t o
study the e f f e c t of heat f l u x on corrosion.
The aluminum specirqens were a c t u a l l y immersion heaters ,
During each t e s t the following was monitored: s o l u t i o n temperature
system pressure, water flow r a t e , and tes t heater power. Liquid
samples were p e r i o d i c a l l y removed f o r hydrogen ana lys i s . These
samples along w i t h the water i n the loop a t t h e tes t conclusion,
were analyzed f o r aluminum content as well as o t h e r impuri t ies .
Following a t e s t , t h e hea te r specimens were weighed t o measure t h e
weight change during tes t . The ou-ter surface of some heaters were
chemically t r e a t e d t o remove oxide i n o rde r t o determine r e a c t i o n
r a t e s .
6
B. Phase I1 - Reactor Shutdown
These tes ts represented long periods of reactor shutdown. They were
conducted i n s tagnant autoclave systems a t d i f f e r e n t temperatures.
Preweighed coupons of 6 0 6 ~ ~ 6 aluminum were immersed i n so lu t ion f o r
varying per iods of t i m e .
mine t e s t weight change.
manner similar t o t h e heater i n phase I.
Af te r t e s t they were a l l reweighed t o d e t e r -
Some of these were chemically t r e a t e d i n a
The autoclave s o l u t i o n was p e r i o d i c a l l y sampled f o r hydrogen as w e l l
as impurity content.
7

, f.
v. EXPERIMENTAL PROGRAM
A. Phase I
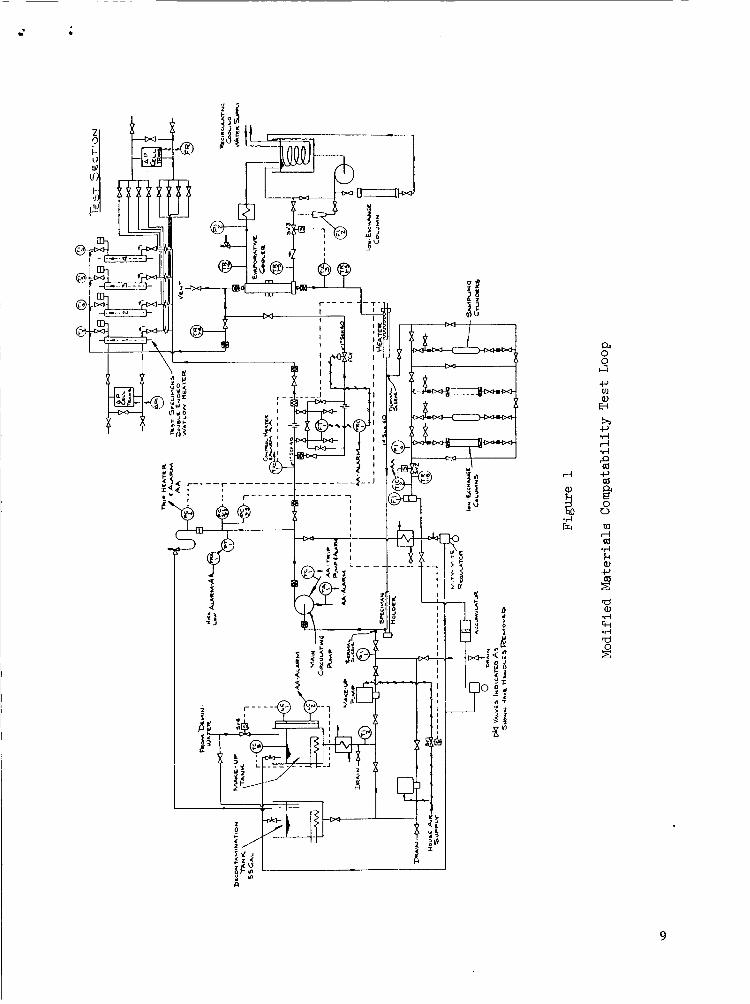
1. Loop Design - The "Modified Mater ia ls Compatibil i ty Test Loop",
used f o r t h i s p a r t of t h e program i s shown i n Figure 1. The t e s t
f a c i l i t y c o n s i s t s of a
sect ion, a t e s t s e c t i o n bypass, a loop cooler, a loop heater sect ion,
and a coupon holder sec t ion . Auxil iary loop systems c o n s i s t of a
p u r i f i c a t i o n and decontamination system w i t h provis ions f o r t h e
addi t ion of chemicals and hydrogen gas, and a pressurizer-volume
con t ro l system.
primary loop with a c e n t r i f u g a l pump, a tes t
The primary system piping i s 1" Sch. 40, 316 SST with a des ign
pressure of 2500 p s i and 650°F.
socket weld globe valves Type 347 SST ra t ed f o r 1500 p s i a t 1050°F
and 3105 p s i a t 650°F.
r a t ed f o r operat ion a t 2500 p s i and 650°F.
Primary system valves a r e Hancock,
A l l Grayloc pipe connections a r e 316 SST
The primary system c i r c u l a t i n g pump i s a Chernpurnp Model CGH
1-1/2-3/4 S. f lowrate and 85 f t of head a t 30 gpm.
t i o n a t 2000 p s i and 500'F.
system, i s the l i m i t i n g f a c t o r when s e t t i n g the maximum operat ing
temperature and pressure.
The pump has an ava i l ab le head of 100 f t a t 10 gpm
The pump i s r a t ed fo r opera-
This component, t he re fo re , when i n t h i s
The t e s t s ec t ion bypass i s f ab r i ca t ed of 1" Sch. 40, 316 SST pipe
and has an o r i f i c e t o measure bypass flow. A flow c o n t r o l valve i s
located downstream of t h e o r i f i c e . The valve i s a Fischer Governor Type
657 D wi th a 316 SST body r a t ed f o r 3600 p s i a t 100°F and can operate a t
2500 psi and 650°F.
8
a 0 0 4
9

An 88 kw evaporative cooler serves as t h e loop coo le r and operates
a t manually programmed primary flow e x i t temperature s e t t i n g s . The
cooler downstream of t h e t e s t s e c t i o n i s f ab r i ca t ed from 2" Sch. 80 Inconel primary pipe i n a 304 SST, 3 inch Sch. 10 s h e l l . The s h e l l s i d e
water l e v e l i s regulated by a normally open solenoid valve located i n the
cooling water i n l e t l i n e . The solenoid valve i s wired t o a Minneapolis-
Honeywell Pyrovane, a temperature i n d i c a t o r of the cooler . The coo le r
i s capable of operat ion e i t h e r as t h e evaporative type or, p a r t i a l l y o r
completely flooded.
The system pressure and volume i s control led by means of Hydrodyne
Pis ton Type accumulator, model 62 A-300-4. The 1/2 ga l lon accumulator
has been provided t o prevent l o s ing system f l u i d during operat ion from
normal makeup and letdown and from temperature f l u c t u a t i o n s .
The p u r i f i c a t i o n and sample system shown i n t h e attached f i g u r e i s
valved out during t e s t periods. It i s only t o be used t o c lean the system
up p r i o r t o t e s t i n g , f o r t h e add i t ion of hydrogen f o r those t e s t s r equ i r ing
it, and f o r per iodic sampling during t e s t operation.
The loop t e s t i n g required e i t h e r 2, 3 o r 4 specimens t o be t e s t e d
simultaneously, depending on the p a r t i c u l a r t e s t . Therefore, a t e s t
sec t ion manifold was b u i l t t o accommodate up t o fou r specimens. The
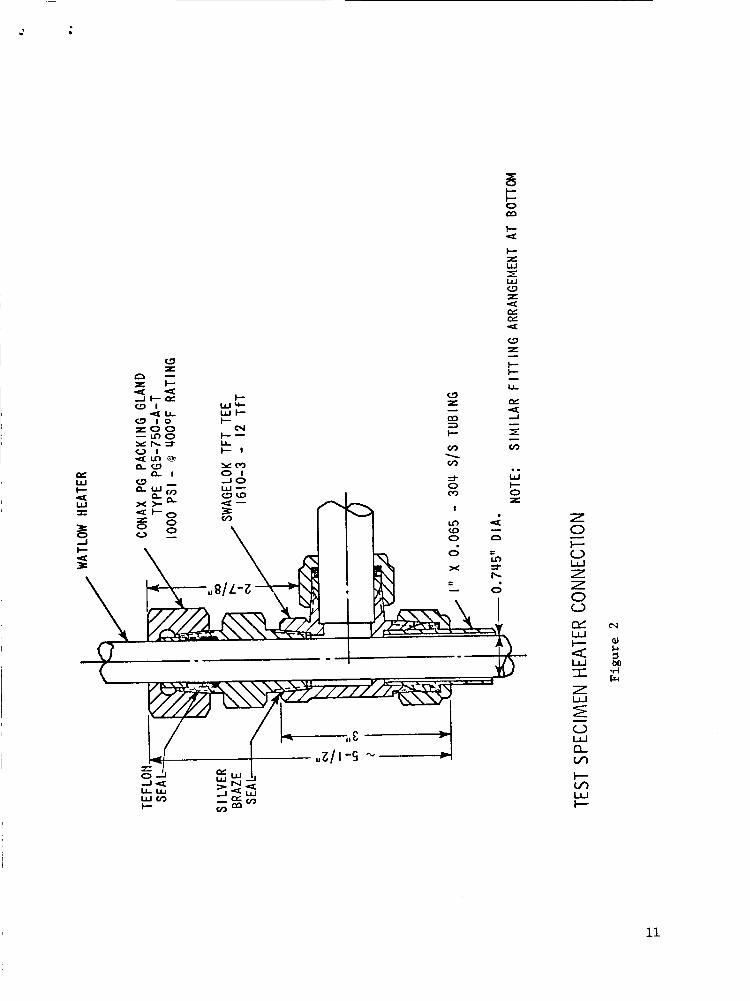
manifold cons i s t s of an upper and lower header, connected by 1" O.D. x 0.065" wal l 304 SST tubing.
and e x i t from the loop through Conax packing glands i n the manner shown
i n Figure 2. A photograph of t h i s manifold i n s t a l l e d wi th d r iv ing heaters
i s shown i n Figure 3.
The t e s t pieces were in se r t ed i n t h i s tubing
Gate valves a r e provided on t h e i n l e t and o u t l e t of each t e s t u n i t t o
permit i s o l a t i o n and removal of any p a r t i c u l a r u n i t during operation. I n
order t o prevent aga ins t hazards r e s u l t i n g from tu rn ing on power t o a
p a r t i c u l a r u n i t while t h e i s o l a t i n g g a t e valves a r e closed, Inconel
rupture d i sks were added t o each u n i t .
10
E W
!z W 32
0 W 0- u, F u, W I-
11
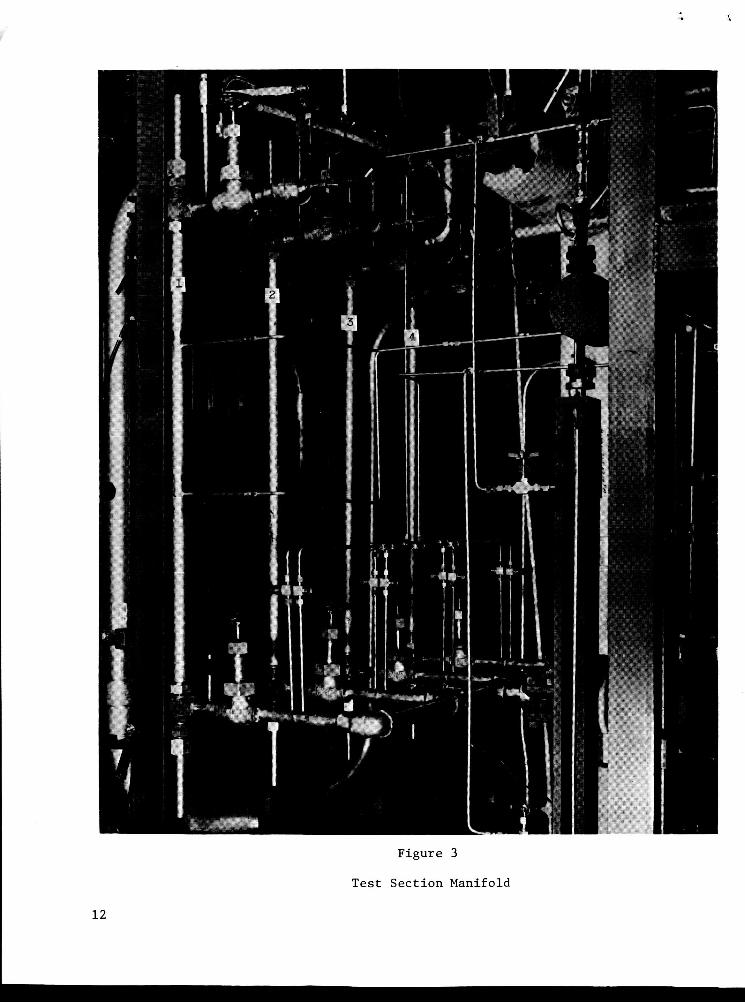
Figure 3
Test Section Manifold
12
A " f loa t ing p is ton" type accumulator, Hydrodyne Indus t r i e s model
number 62 A-3004, of 112 ga l lon capaci ty , was provided t o prevent los ing f l u i d
during operat ion, which might be caused by normal temperature f luc tua t ions .
F lu id makeup t o t h e system only provided to rep lace f l u i d removed during t h e
hydrogen sampling per iod.
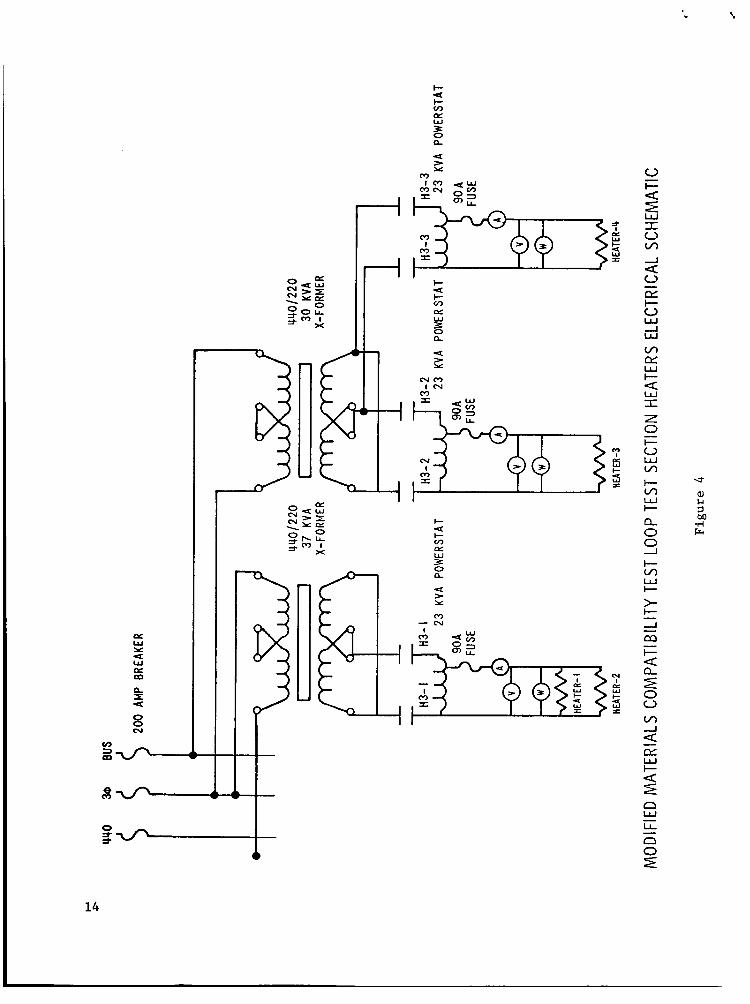
Addit ional e l e c t r i c a l cont ro ls , flow monitoring devices, and thermo-
couples, were provided t o permit t h e t e s t i n g of up t o fou r u n i t s toge ther .
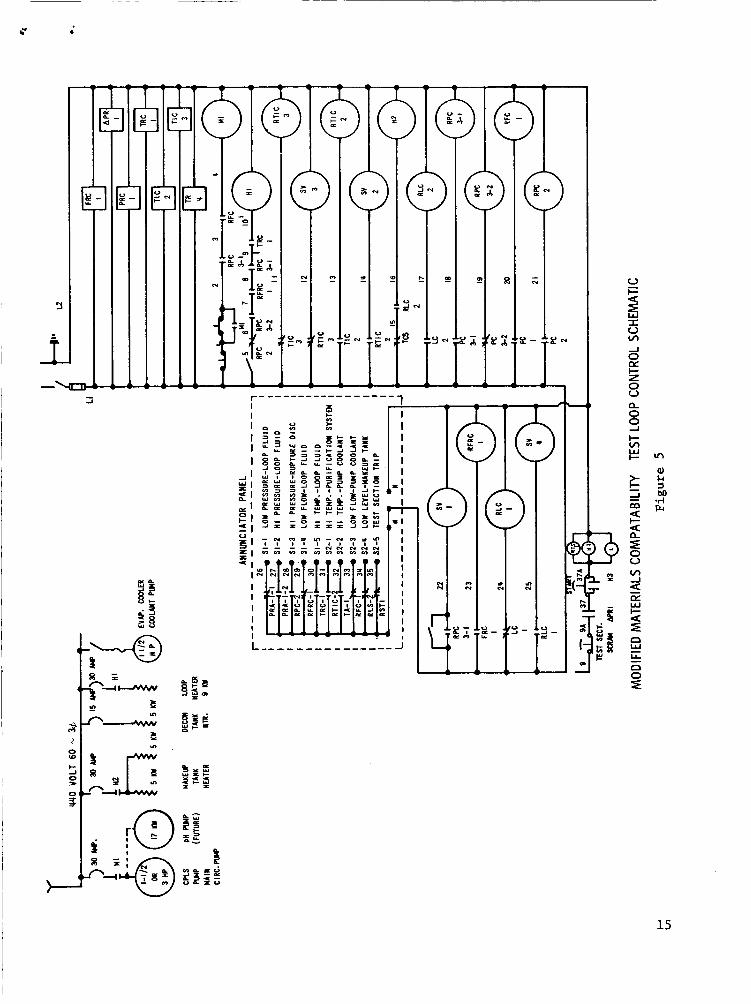
The e l e c t r i c a l schematic of t h e t e s t heaters i s shown i n Figure 4. con t ro l schematic of t h e loop i s shown i n Figure 5.
A
2. T e s t Specimen Design - The aluminum specimens were manufactured by Watlow E l e c t r i c Company, S t . Louis, Missouri i n t h e form of r i g h t
c i r c u l a r c y l i n d r i c a l hea te rs ca l l ed "Firerods'l . The hea ter was clad
wi th 6 0 6 ~ ~ 6 aluminum and had a n ove ra l l l eng th of 51 inches.
heated sec t ion was 11 inches long with 18 and 22 inches of unheated
l eng th on each end respec t ive ly .
type with e l e c t r i c a l l eads e x i t i n g from bo th ends.
of t h e cladding was 0.745 inch and was r a t ed a t 19 kw a t 230 v o l t s
f o r t h e 11 inch heated length .
pene t ra t ion of t h e leads i n t o the heater, therefore , bo th ends of
t h e hea ter were kept o u t of t h e loop f l u i d .
The
The hea te r was of t h e double ended
The ou t s ide diameter
There was no l i q u i d seal a t t h e
V-A-3 Loop Preconditioning
Three methods were considered f o r determining t h e cor ros ion of t he
aluminum specimens and therefore the hydrogen genera t ion during t h e
loop tes t s .
concentrat ion i n t h e loop so lu t ion and by d i f fe rence , determine t h e
r a t e of hydrogen buildup.
r e s u l t not on ly of t h e specimen corrosion, but a l s o the cor ros ion of
t h e loop components.
One of these was t o per iodica l ly measure t h e hydrogen
However, t h i s hydrogen bui ldup was a
13
PL w Y U W PL
L I 4
rn
8 N
v)
2-
I
PL I W z tz 0 L L I
x
I- U c v) tz W z k
L
U
c U I- v)
2 0 0-
U w Y
-Nm I - N
m
m
E 9
14
a 8 ?
c -1
0 >
0 f =r
+
E In
2rE 3 ' 0
15
During t h e most severe loop tes t , t h e loop components would be
subjected t o a maximum temperature of 300 F.
t o reduce t h e corrosion o f loop components during tes ts , so t h a t
most o r a l l hydrogen generat ion would be a r e s u l t o f aluminum
corrosion, t he loop was operated a t 400 F f o r about 10 days t o
precorrode o r passivate i t s surfaces . The s o l u t i o n i n t h e loop
was adjusted t o pH 10 by t h e add i t ion of concentrated potassium
hydroxide so lu t ion .
0 Therefore, i n o rde r
, 0
This would a c c e l e r a t e t h e pas s iva t ion process.
Samples of loop f l u i d were p e r i o d i c a l l y taken i n t h e high pressure
sample cyl inder and analyzed f o r hydrogen content by t h e method
described i n t h e Appendix.
information i s r ep lo t t ed i n Figure 7 by t ak ing t h e d i f f e r e n c e between
hydrogen analyses, d iv id ing by t h e time between analyses, r e s u l t i n g
i n a generat ion rate. It appears t h a t t h e passivated hydrogen generat ion
r a t e has reached an equi l ibr ium value of about 0.2 cc/kg/hr.
The r e s u l t s are shown i n Figure 6. This b
It should be noted here, t h a t t hese hydrogen gene ra t ion numbers a s
w e l l as a l l those t o be reported and discussed i n subsequent sect ions,
have been corrected t o standard condi t ions o f temperature and pressure.
V-A-4 Base-Line Loop Operation
Once t h e loop has been passivated, it becomes necessary t o e s t a b l i s h
t h e loop corrosion and hydrogen generat ion rate a t condi t ions t o be
experienced during testing. Therefore, t h e loop was operated a t 300 F
with i t s so lu t ion adjusted t o a pH of 5 by t h e add i t ion of s u l f u r i c
acid through the sample cyl inder .
0
16

J I T = UOO°F, P = 600 P S I , pH = IO
0 50 I 00 I50 200 2 50 31
TIME, HOURS
3
HYDROGEN GENERATION DURING PASSIVATION RUN IN TEST LOOP
Figure 6
17

* b
II 5 n
wl - x u I -E r f J r f J I - z 3 - z w o rfJ w w - 0-
r r w o z 0
W C L w w
Z C L - 0 o w z LL n w u w o
J O I O Z W P . o O W I I 9 u > - a
z e z 0
I- x "
n m n w
I - U I - n
W U I - C A F i d
/
I I
0 I 0 I b / o
v) zt c3
0 0 0
hl
0 .
- 0
3 n 3
8 ?r)
8 N
0 In -
0 0 -
0 Ln
0
a. 0 0 A I- v) W I- z z 3 cy: z 0 I-
> v) v)
-
- a -
W I- < cy: z 0 I-
cy: W z w c3 z W c3 0 E
>- I
- a
n
18

Hydrogen analyses were performed per iodica l ly and a f t e r about 6 days
it appeared t h a t equi l ibr ium had been a t ta ined . The r e s u l t s a r e
p l o t t e d i n Figure 8. f i g u r e have reached equi l ibr ium between 0.1 and 0.15 cc jkgjhr .
The r a t e s , p lo t t ed i n t he bottom por t ion of t he
Loop s o l u t i o n was co l l ec t ed and f i l t e r e d t o determine crud content ,
which was 17.3 ppm.
V-A-5 Low Power Test
A. Pretreatment of LOOD SDecimens
The corrosion of aluminum, l i k e most metals, i s r e l a t i v e l y
rap id during i n i t i a l per iods; t h e r a t e becoming d r a s t i c a l l y
reduced as corrosion products bu i ld up on the surface. It
was deemed d e s i r a b l e t o avoid t h i s i n i t i a l per iod of rapid
cor ros ion by p re t r ea t ing specimens in o rde r t o e s t a b l i s h
an oxide f i l m on sur faces so t h a t during subsequent tes ts ,
t h e cor ros ion r a t e , and the re fo re the hydrogen generat ion
r a t e , would be g r e a t l y reduced. Consultation with o t h e r s
i n t h e field,lO’ll and autoclave t e s t s which w i l l be described
l a t e r , helped e s t a b l i s h the pretreatment condi t ions.
The loop was modified s l i g h t l y by the add i t ion of clamp-shell
hea te rs t o the specimen holders i n order t o g e t add i t iona l heat
required f o r t h e pretreatment.
steam, near o r a t sa tura t ion . Small amounts of t h i s steam would
flow by t h e specimens f o r about 100 hours, a s determined i n t h e
autoclave tes ts , t o insure t h e formation of t h e oxide coat ing.
The condi t ions se lec ted were 35OoF
The opera t ion of t h e loop was t o f l o w a l l t h e f l u i d through t h e
t e s t sec t ion bypass a t 400 F.
expanded t o steam across a valve and reheated t o 350 F, and
d i r ec t ed across the specimens. This f l u i d was then removed from
0 Approximately 100-200 ccjmin were 0
19

16
14
12
y” I O \
z 0 0
N
f 8 w I- z 0 0
N = 6
4
2
0
[’: 1 ;000;1
I
TIME, HOURS 20 40 60 80 I 00 I20 I40
0.2 e X \ W \ 0
O0 Y 0 O O
0 20 40 60 80 IO0 I20 I40 TIME, HOURS
HYDROGEN GENERATION I N LOOP, NO SPECIMENS
Figure 8
20

P 4
t h e loop v i a t h e letdown regu la to r i n s t a l l e d a t t h e e x i t of t h e
t e s t specimens. Control o f t h e steam flowrate, t he letdown
pressure and t h e clamp-shell heater power regulated t h e pre-
treatment condi t ions.
Weighing t h e t e s t specimen heaters i s inaccurate a t b e s t f o r
s eve ra l reasons. Mainly, t h e ends of t h e hea te r are open t o
t h e atmosphere, exposing t h e magnesia i n s u l a t i o n between the
h e a t e r element and t h e sheath. The magnesia, which r e a d i l y
absorbs water, w i l l release t h e water i f heated above b o i l i n g
or if t h e heater i s held i n a vacuum. T h i s absorption and
r e l e a s e are unknown and not r epea t ib l e or c o n t r o l l a b l e f o r
specimens o f t h i s nature. Therefore, any weight measurements
made of t h e heaters , e s p e c i a l l y s ince t h e d i f f e rence i n weights
i s small compared t o absolute weights, are inaccurate .
To minimize t h i s e f f e c t , t h e specimens were held i n a vacuum f o r
24 hours a t room temperature t o remove t h e moisture p r i o r t o
making the weighings required. This same procedure was repeated
a f t e r t h e pretreatment. The fou r heaters so t r e a t e d , had i n d i -
cated weight increase during the pretreatment of l5., 11.5, 16. and 21.4 %/dm . specimens which underwent s i m i l a r treatment.
2 These values look reasonable compared t o autoclave
B. T e s t ODeration
The fou r t e s t specimen heaters were then reposi t ioned i n t h e
loop, t h e loop f i l l e d w i t h f resh, degassed dernineralized water
whose pH had been adjusted t o 5.0 and t h e low power t es t run
under t h e following condi t ions:
2 1
TAl3LE 1
Low Power Loop Test Conditions
Number o f Specimens 4 2 Heat Flux Across Specimen
Loop Fluid Flowrate 1 .0 gpm per specimen 13.3 Btu/sec, f t
Test Duration 2 specimens - 167 hours
2 specimens - 330 hours
Fluid Temperature @ Test Spec i m e n i n l e t - 245°F
o u t l e t - 264'F
i n l e t - 2 8 1 ' ~
o u t l e t - 300°F
Specimen Surface Temperature
System Pressure 600 p s i g
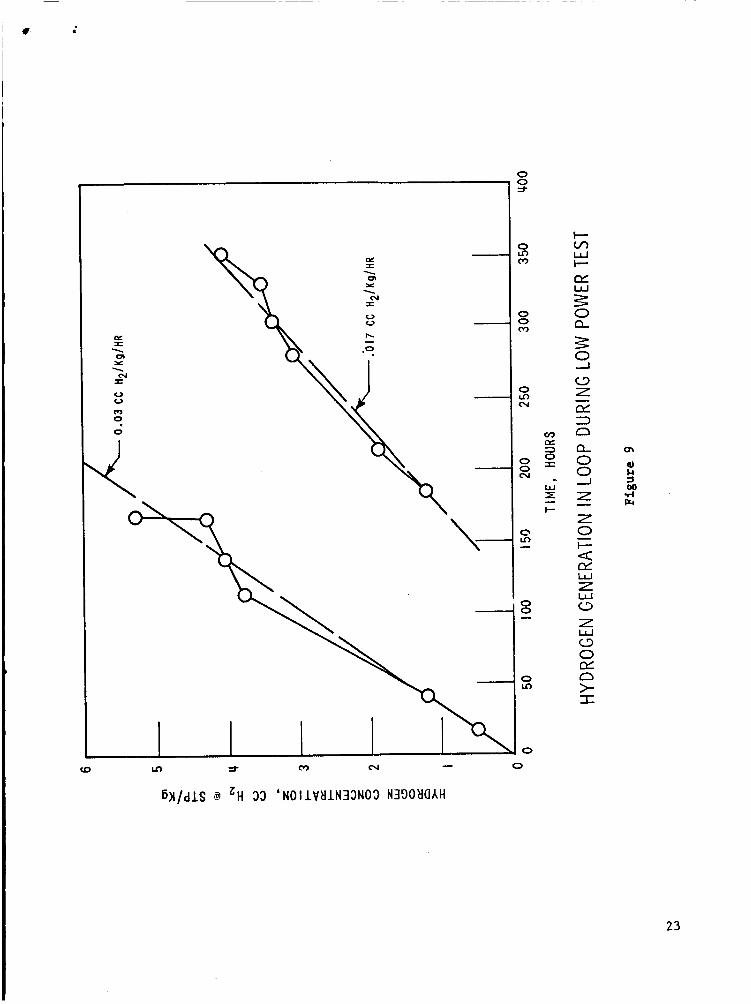
The loop f l u i d was pe r iod ica l ly sampled and analyzed for
hydrogen content using the gas p a r t i t i o n e r . The r e s u l t s of
t hese analyses are shown i n Figure 9. After 167 hours, t h e
t es t was hal ted and two of t h e f o u r specimens removed. Their
sample bolders were valved ou t o f the system and t h e t e s t then
continued with t h e two remaining specinens f o r an add i t iona l
163 hours. Therefore, t h e break i n Figure 9, r ep resen t s t h e
t i m e required t o remove the two specimens and res ta r t t h e t e s t . It should a l s o be noted t h a t t h e hydrogen content was not reduced
a l l t he way t o zero between tes t s .
The rate of hydrogen generat ion f o r t h e f i r s t p a r t o f t h e t es t ,
as determined by t h e average l i n e s drawn through each s e c t i o n
of Figure 9, i s about twice t h a t f o r t h e second p a r t o f t h e test .
This i s expected s ince t h e r e was twice t h e area of aluminum i n
the f i r s t po r t ion ( 4 specimens vs 2 specimens).
however, are considerably lower than t h a t experienced during
the base- l ine operat ion tes ts where rates o f 0.1 t o 0.15 cc/kg/hr
These rates,
22
0 V *)
0 9
\
W
z 0 - c a CY W z LIA c3 z c3 0 CY
>- S
W
n
23
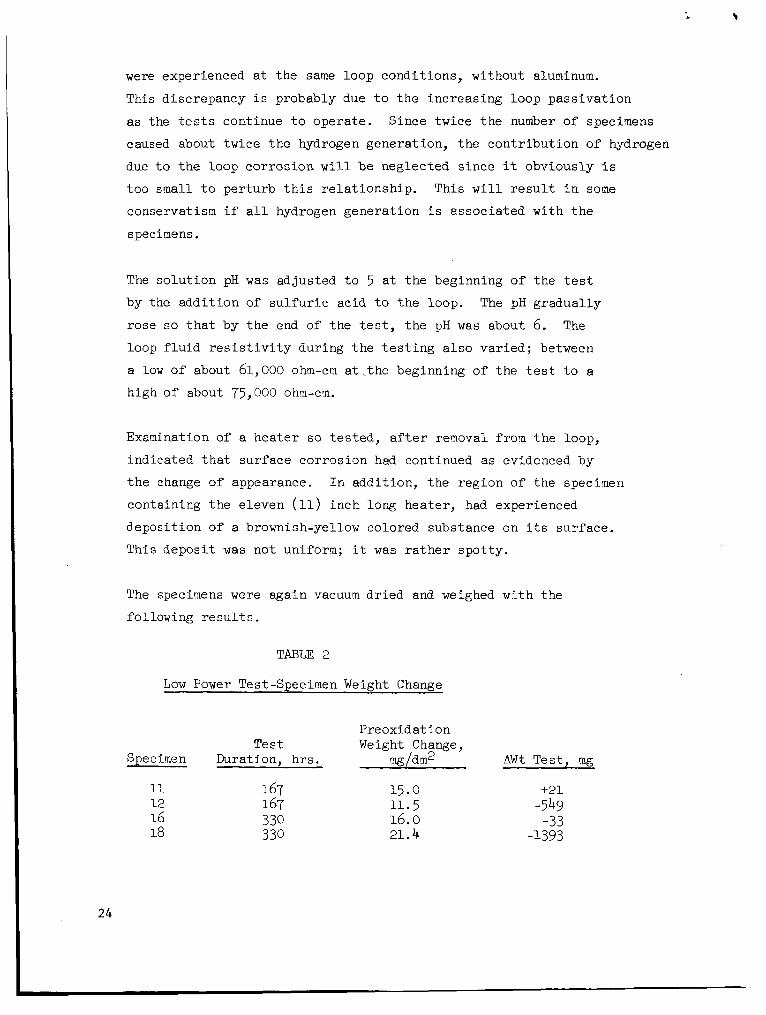
were experienced a t t he same loop conditions, without aluminum.
This discrepancy i s probably due t o t h e increasing loop pass iva t ion
as the t es t s continue t o operate . Since twice t h e number o f specimens
caused about twice t h e hydrogen generation, t h e con t r ibu t ion o f hydrogen
due t o t h e loop co r ros ion w i l l be neglected s ince it obviously i s
too small t o per turb t h i s r e l a t ionsh ip . This w i l l r e s u l t i n some
conservatism if a l l hydrogen generat ion i s associated with t h e
specimens.
The so lu t ion pH was adjusted t o 5 a t t h e beginning o f t h e t e s t
by the add i t ion of s u l f u r i c acid t o t h e loop. The pH gradual ly
rose so t h a t by t h e end of t h e t e s t , t h e pH was about 6. loop f l u i d r e s i s t i v i t y during t h e t e s t i n g a l s o var ied; between
a low of about 61,000 ohm-cm a t . the beginning o f t he t e s t t o a high of about 75,000 ohm-cm.
The
Examination of a hea te r so t e s t ed , af ter removal from t h e loop,
indicated t h a t surface corrosion had continued a s evidenced by
t h e change of appearance. I n addi t ion, t h e region of t h e specimen
containing t h e eleven (11) inch long hea ter , had experienced
deposi t ion o f a brownish-yellow colored substance on i t s sur face .
This depos i t was not uniform; it was r a t h e r spo t ty .
The specimens were again vacuum dr i ed and weighed wi th the
following r e s u l t s .
TABLE 2
Low Power Test-Specimen Weight Change
Preoxidat i on Test Weight Change,
Specixen Duration, hrs . mg/dm2 A W t Test, mg
11 167 12 167 16 330 18 330
15.0 11.5 16. o 21.4
+21 -549 -33
1-393
24

Two of t h e f o u r specimens apparent ly l o s t l a rge amounts of weight
while one o t h e r l o s t a small amount and t h e f o u r t h gained a small
amount. The loop so lu t ion was subsequently analyzed f o r aluminum
t o confirm these weight l o s ses . The analysis of samples taken a t
t h e beginning of t h e t e s t , a f t e r t h e 167 hour break, and a t t h e
end of t h e t e s t a r e shown i n Table 3. The analyses of res idues
co l l ec t ed by f i l t r a t i o n of t h e second two l i q u i d samples a r e a l s o
shown. It i s very obvious from these r e s u l t s t h a t p r a c t i c a l l y no
aluminum had a c t u a l l y l e f t t h e specimens. Therefore, t h e weight
l o s s e s experienced were probably a r e s u l t o f water being dr iven out
of t h e specimen hea ter insu la t ion .
25

Element
Ag A 1 A S
Au B Ba Be B i Ca Cd co C r cs cu Fe I n K L i Mg Mn Mo Na Nb N i P Pb Rb Sb S i Sn Sr Th T i T1 U V W Zn Zr
TAI3I.E 3
Chemistry Analyses from Low Power Loop Tes t
( Spectrographic Analyses )
Solu t ion Analyses
5 hrs. i n t o t e s t *
a. 02 <O. 04
a. 2 0.17
<o. 02 <o. 0006 <o. 02 0.01 0.14
<o. 06 <o. 06
<o .002 0.09 4.06
-
-
- - 0.031 0.04
<o. 02
4.02 0.11
<o. 2 <o. 06
4.2 0.7
<o. 06 <o. 006 <o. 06 <o. 006
<o. 06 <o. 06 <o. 2 <o. 006
-
-
- -
167 hrs. i n t o test*
<o. 02 0.05 -
<o. 2 0.10 4.02 <o. 0006 4.02 0.40 0.16
<o. 06 <o. 06
0.06 4.06
0.13 0.16
4 . 0 2
<o. 02 0.07
<o. 2 <o. 06
4). 2
<o. 06 <o. 006 <o. 06 4.006
<o. 06 <o. 06 <o. 2 <o. 006
- 0.004
- -
-
-
0.47
- -
330 hrs , i n t o test*
<0.02 <o .04
<o. 2 0.40
<o. 02 <o .0006 <0.02
0.09 0.50
<o. 06 <o. 06
0.17 <0.06
-
- 0.002
- - 0.11 0.16
<o .02
<o. 02 0.10
<o. 2 ~0.06
<o. 2 0.23 4.06 <o. 006 <o. 06 4.006
<o. 06 KO. 06 <o. 2 <o . ooe
-
-
- -
Analyses of F i l t e r e d Residues
167 hrs . 330 hrs . i n t o test** i n t o test**
4.3 0.55
0.0016
- -
0.03 0.60
0.0015
- -
- - ,
a. 003 0.004 0.45 0.25 1.5 0.22 0.010 0.010 0.64 0.61 - 0.17 38.8
-
- 0.08 21.2
-
- 0.26 0.31 0.16 - - 0.12 - 0.52
3.1 0.003
<o. 03 0.033
- -
-
-
- 0.30 0.020 0.35
0.36
0.31
- - -
- - 2.1 0.03
0.090
- 0.04
- - - a. 003 <o. 003
<o. 003 <o. 003
- - 0.06 0.04
Tota l W t . of Residue MG 5.4 11.5 *
** Resul ts i n pg/nl + 3O$ r e l a t i v e Resul ts i n w t $ + 76 r e l a t i v e -
26

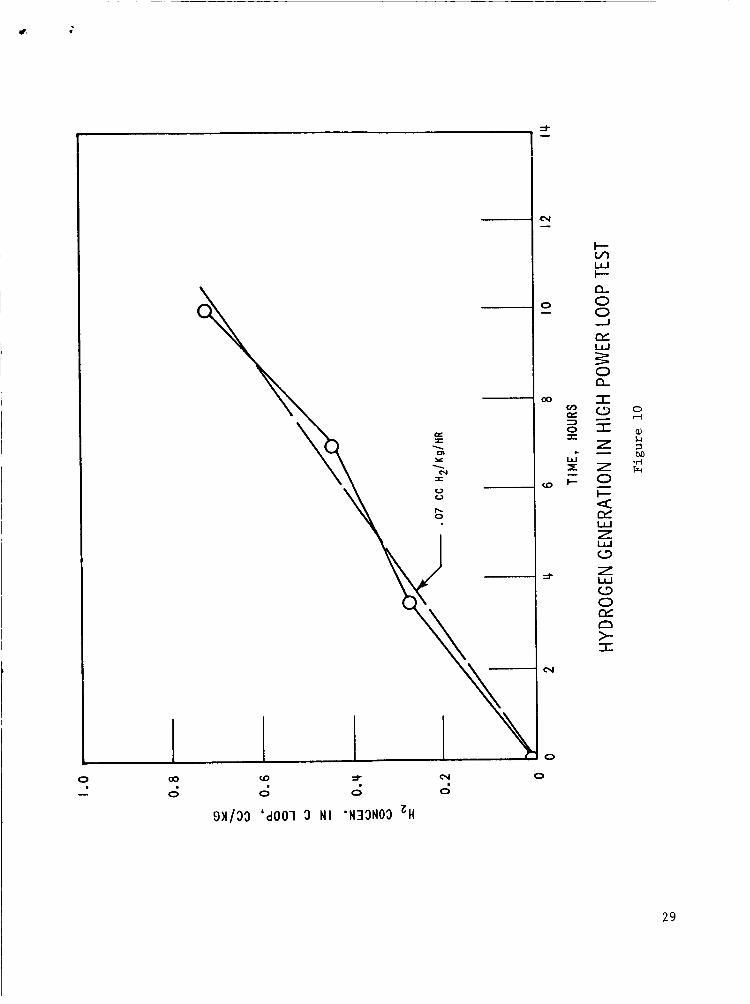
V-A-6 High Power Test
The "high power tes t" had as i t s funct ion, the determinat ion of hydrogen
genera t ion a s a r e s u l t of t he corrosion of aluminum under condi t ions of
high heat f l u x and high f l u i d ve loc i ty .
The specimens were p re t r ea t ed p r i o r t o t e s t i n g i n t h e same manner as
descr ibed for t h e low power t e s t .
The tes t condi t ions f o r t h i s t e s t a r e l i s t e d below i n Table 4.
High Power Loop Test Conditions
Number of Specimens 3
Heat Flux across specimens-
Loop Flu id Flowrate
Test Duration
F lu id Temperature t3 Test Sec.
f l u i d i n t e r f a c e
Specimen Surface Temp.
System pressure
2 92.5-93.8 Btu/sec f t
7.5 gpm per specimen
10 hours
I n l e t - 225 Outlet - 245 F
I n l e t - 2 8 0 ' ~ Outlet - 300°F
600 ps ig
0
27

This t e s t was of very s h o r t du ra t ion compared t o t h e previous tes t . This
necessi ta ted c a r e f u l con t ro l duri.ng t h e period preceding t h e tes t so as
no t to d r a s t i c a l l y e f f e c t t e s t r e s u l t s . Bas ica l ly , t h i s meant keeping t h e
loop f l u i d away from t h e t e s t specimen by flowing only through t h e bypass
l e g u n t i l t h e t e s t was t o begin. Proper t e s t condi t ions of temperature
and chemistry were a t t a ined during t h i s bypass flow period. Samples were
taken f o r hydrogen analyses a t 0, 3-112, 7, and 10 hours.
a r e shown i n Figure 10.
The r e s u l t s
The specimens were weighed a f t e r removal from t h e loop and vacuum drying.
The weight change r e s u l t s were s imi l a r t o those experienced f o r t he low
power t e s t ; t h a t i s , t he specimens l o s t weight, bu t t h e so lu t ion ana lys i s
showed e s s e n t i a l l y none of t h e aluminum was present . Therefore, it again
was assumed t h a t t he weight change information was a f fec ted by t h e hea t ing
and drying process and t h e i r e f f e c t s on t h e i n s u l a t i o n moisture. These
weight change d a t a a re shown i n t h e fol lowing t a b l e .
TABm 5
High Power Loop Test - Specimen W t Change
Preoxidat ion w t Change, mg A W t T e s t , pngs G 2
Specimen
10 28.6 -201
17 0.2 -102
21 2.0 -175
It should be noted t h a t t h e preoxidat ion weight changes f o r t hese
specimens var ied more than f o r t h e low power t e s t specimens. Since
they were both p re t r ea t ed under i d e n t i c a l condi t ions, and had a
s imi l a r v i s u a l appearance, it i s assumed t h a t v a r i a t i o n s were caused by
d i f fe rences i n vacuum drying of t h e specimens.
28
.
a0 (0 9 cv 0 d
0 - 0 0 0
91/33 'do01 3 MI 'N33N03 'H
I- v, W I- a. 0 0 J
CY
0 a. r"
z c3 0 CY
> I
W
n
29

The solut ion pH varied between 5.2 and 5.7 during the t e n hour t es t dura-
t i o n while the so lu t ion var ied from 66,000 t o 96,000 ohm-cm respec t ive ly .
The solut ion ana lys i s a f t e r t es t indicated t h a t the aluminum content was
<0.04 m g / m l .
apparent loss of weight of the specimens due t o t e s t i n g was not due t o a
loss of aluminum.
This confirms, as with the low power t e s t specimens, t h a t the
V-B Phase I1 Tests
1. Autoclave Systems
Two independent ai toclave systems rere s e t up f o r t h i s phase of t h e
program. Figure 11 i s a schematic diagram of one of t hese f a c i l i t i e s .
A d e s c r i p t i o n of the operat ion of the system would b e s t desc r ibe the
funct ion of the equipment shown.
The system was f i r s t evacuated t o in su re removal of atmospheric gases.
The f i l l tank was v i o l e n t l y boi led t o remove atmospheric gases and
then pumped i n t o t h e autoclave. A l l l i n e s were bled t o in su re complete
f i l l i n g . The system was then heated t o b o i l i n g while a vacuum was
pulled f o r a sho r t time t o insure complete degassing. The system was
then heated t o the desired temperature. The Sprague o r the Mighty-Mite
1, let-down regu la to r was then used t o a d j u s t t h e system pressure t o
600 p s i .
During tes t operation, samples were p e r i o d i c a l l y taken f o r hydrogen
analysis.
Might-Mite 1 was valved out while the valve i n t h e sample t r a i n was
opened. This
continued u n t i l f l u i d was let-down from Might-Mite 2 which was set j u s t
above 600 p s i .
1. Sample cyl inder-2 was put i n t h e l i n e j u s t t o i n su re t h a t t h e sample
taken was t r u l y r ep resen ta t ive of the autoclave s o l u t i o n a t t h e sample
time.
P r i o r t o sample taking, t h e f i l l tank was heated and boiled.
The Sprague pump was s t a r t e d and s e t j u s t above 600 p s i .
The sample f o r ana lys i s was contained i n sample cy l inde r -
30

3 ,
31

c
2. Specimen Preparat ion
The t e s t specimens were 1" x 1-1/2" x 1/8" t h i ck .
diameter hole d r i l l e d through t h e 1/8" thickness near t h e t o p for
hanging on a t ree .
Each had an 1/8"
Nine specimens were cleaned, and weighed and run i n t h e autoclave i n
350°F sa tu ra t ed steam f o r up t o 96 hours t o determine t h e optimum
pretreatment condi t ions. The r e s u l t s are shown i n Figure 12.
Sone specirnens were taken ou t a t i n t e rva l s of 24 and 48 hours
respect ively. One specimen was scratched and i s not shown here.
The curve i n d i c a t e s t h a t t h e i n i t i a l period of rapid corrosion
occurs wi th in t h e f i rs t 24 hours bu t t h a t a period of about 96 hours
probably would be d e s i r a b l y f o r pretreatment. The specimens a l l had
turned a uniform d u l l co lor , and when checked with a micrometer had
increased i n thickness 0 .1 - 0.3 m i l s f o r t h e 24 hour specimen, t o 0.3 - 1.7 m i l s f o r t h e 96 hour specimens.
3. Autoclave Base-Line Operation
The two autoclave systems were operated a t t h e t es t conditions wi th
solut ion of proper chemistry but without aluminum specimens, i n o r d e r
t o e s t a b l i s h the hydrogen generat ion rate caused by corrosion of t h e
autoclave i n t e r n a l s .
One system was maintained a t 200°F and t h e o t h e r a t 30OoF f o r 12 days
or 288 hours.
The p H o f each autoclave f l u i d was i n i t i a l l y adjusted t o 5.0 by t h e
addi t ion of sulphuric acid.
The pressure was maintained a t 600 p s i i n both systems.
Samples for hydrogen ana lys i s were p e r i o d i c a l l y taken.
amounts o f hydrogen were found i n e i t h e r system anytime during the t e s t
duration. The sample and d e t e c t i o n system were checked with s tandards
t o in su re t h e taking of r ep resen ta t ive samples.
No measurable
The minimum d e t e c t a b l e
32

.
\
0 0 -
0 a3
0 W
0 3-
0 ru
0
0 v, i- d 3 v, W
33
2 l i m i t of hydrogen wi th the sample s i z e ava i l ab le 9.5 x cc H
p e r Kg so lu t ion .
The pH of the sample s o l u t i o n was a l s o checked a t each hydrogen
sampling.
3OO'F t e s t pH var ied between 5.0 and 6.4. and f i l t e r e d residues a f t e r t es t , i n d i c a t e s u f f i c i e n t q u a n t i t i e s o f
corrosion product i r o n t o cause t h e pH t o r ise t o these l e v e l s .
These chemical analyses are shown i n Table 6.
The 200'F t e s t pH varied between 5.0 and 6.5 while t h e
Analyses of t h e so lu t ions
V-B-4 Autoclave Test Operation
Two autoclave tes t s were run simultaneously; one a t 200'F and one a t
300°F.
s ix t een (16) which had been p re t r ea t ed f o r 96 hours i n 350°F steam,
and f i v e ( 5 ) which had been t r e a t e d by t h e "Hardcoat" process r e s u l t i n g
i n a 2 m i l coating.
Each autoclave was loaded with twenty-one (21) specimens;
The two systems were sampled p e r i o d i c a l l y and determinations made of
so lu t ion pH, r e s i s t i v i t y and hydrogen content . These r e s u l t s are shown
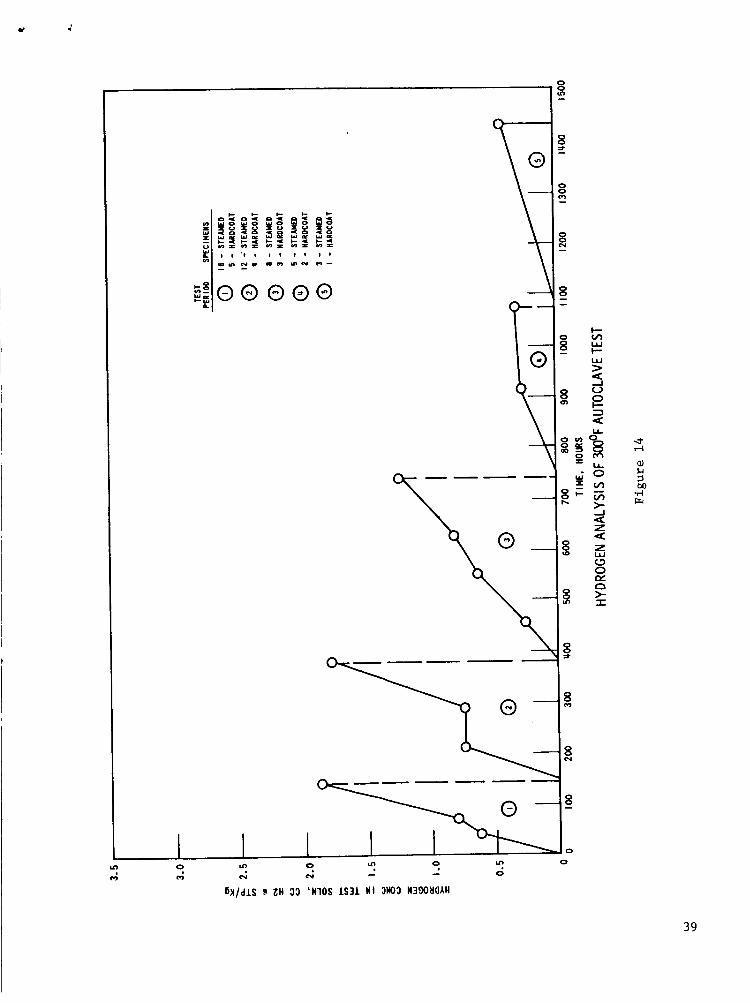
i n Tables 7 and 8. The hydrogen analyses are a l s o p lo t t ed i n Figure 13 and 14. A l l analyses a r e connected by s t r a i g h t l i n e s .
The t e s t s were in t e r rup ted a t each of t h e periods shown i n these two
f igures . A t each i n t e r r u p t i o n coupons of bo th t h e steam t r e a t e d v a r i e t y
and hard coat t r e a t e d were removed f o r f u r t h e r examination.
These specimens were weighed t o determine t h e t es t weight change. The
r e s u l t s a r e shown i n Tables 9 and 10 f o r t h e 200'F and 30O0F autoclave
t e s t s r e spec t ive ly . The weight change d a t a f o r t he steam t r e a t e d speci-
mens a r e shown i n Figures 15 and 16.
Autoclave sample so lu t ions were pe r iod ica l ly analyzed spectrographical ly
t o determine impurity content, s p e c i f i c a l l y aluminum.
These analyses for bo th autoclave systems a r e shown i n Tables 11 and 12.
A l s o shown a r e t h e analyses f o r t h e r e s idues obtained by f i l t r a t i o n of
a l l solut ions (mostly t h e f i n a l s o l u t i o n ) co l l ec t ed f o r a given system
and combined i n t o one.
34

TABLE 6
Chemical Analyses - Autoclave Base-Line Operation / \
solut ions( 1 ) Residue s \ l I ug/ml wt%J
200'F 300°F 200°F 300°F T e s t Test Test --- Element Test
Ag A 1 A s Au B Ba Be B i C e Cd co C r cs cu Fe I n K L i Mg Mn MD Na Nb N i P Pb Rb Sb S i Sn S r Th T i T 1 Ta v W Zn Zr
a 10
<30 16
0.03 0.4 -
<o. 3
<o. 03 <o. 003 <o. 1 0.70 2.8
<o. 3 2.5
<o. 3 6.0 16
0.15 0.03
0.50
0.02
<1
0.40
0.22 0.2
<o. 1 1 . 2 a
0.3 4 . 3 <o. 3 4.0
<o. 3 <o. 1 4 . 3
a <o. 3 4.1 <o. 3 <o. 3
0.80
0.05
<o. 01 1.0 -
<o. 3 0.03
<0.03 <o. 003
0.25 0.95
<o. 3 2.7
<o. 3 4.0 25
0.05
0.30 0.32 0.95 0.05
CO. 1
-a
0.01
<o. 1 1 .2 <1 <o. 3 <o. 3 4 . 3
2.6 4 . 3 4.1 4 . 3
<o. 3
<o. 3 <o. 3 <o. 03
0.25 4
<o. 1
W t Residue wgs 4.888 8.631
(1) Resul ts obtained spectrochemically.
35
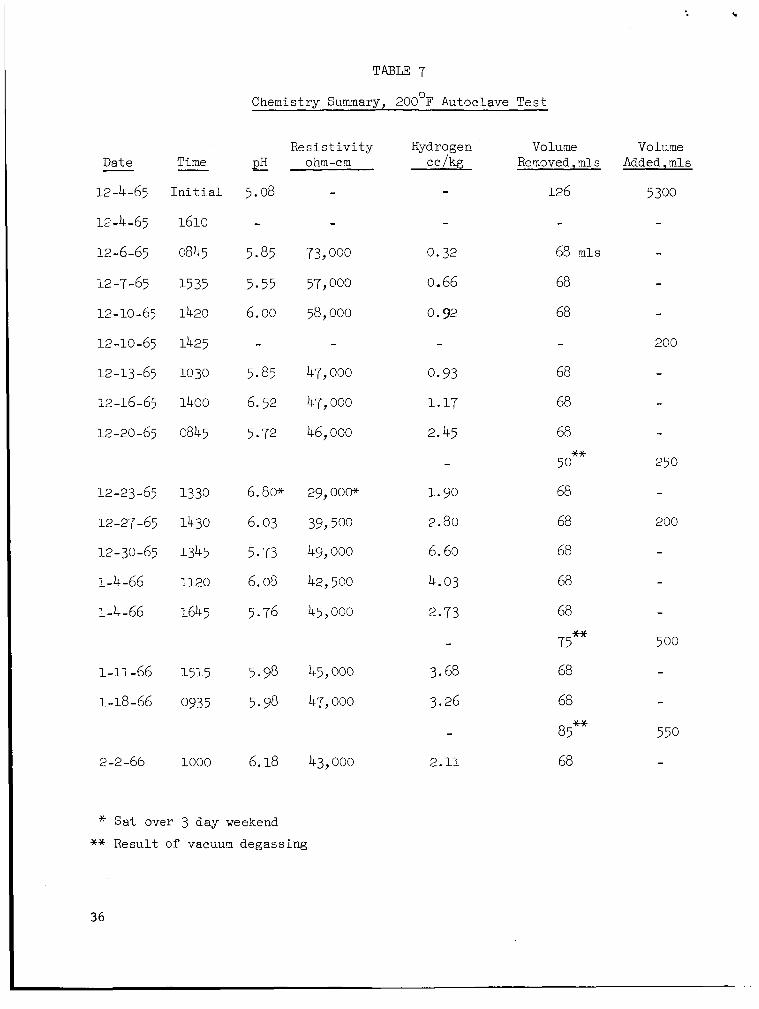
TAl3LF: 7
Chernistrv Sumarv. 200°F Autoclave Test
R e s i s t i v i t y Time pH ohm-cm - Date -
12-4-65 I n i t i a l 5.08
12 -4 -65
12-6-65
12 -7 -65
12 - 10 - 65 12-10-65
12-13-65
12-16-65
12-20-65
1610
0845
1535
1420
1425
1030
1400
0845
12-23-65 1330
12-27-65 1430
12-30-65 1345
1-4 -66 1120
1-4-66 164 5
1-11-66 1515
1-18-66 0935
2-2-66 1000
-
5.85
5.55
6.00
-
5.85
6.52
5.72
6.80*
6.03
5.73
6.08
5.76
5.98
5.98
6.18
* Sat over 3 day weekend
-
-
737 000
57,000
58,000
-
47,000
47,000
46, ooo
29,000"
397 500
49,000
42,500
45,000
45,000
47,000
43,000
Hyd rog e n A
-
-
0.32
0.66
0.92
-
0.93
1.17
2.45
-
1.90
2.80
6.60
4.03
2.73
-
3.68
3.26
- 2.11
Vo lurne Removed, m l s
126
-
68 m l s
68
68
-
68
68
68
5 0**
68
68
68
68
68
75**
68
68
85**
68
** Result of vacuun degassing
36

TABLE 8
Chemistry Summary - 300 F Autoclave Test 0
_L Time pH Date - 12-4-65 I n i t i a l 5.08
12-4-65 1600
12-6-65 1030
12-7-65 1415
12-10-65 1330
12-10-65 -
12-13-65 0915
12-16-65 1525
12 -20-65 0945
12-23-65 1430
12-27-65 1330
12-30-65 1545
1-4-66 0940
1-4 -66 1740
1-11-66 1415
1-18-66 0820
2-2-66 0840
-
5.58
5.85
5.53 -
5.47
5.90
5.72
6.40*
6.23
5.90
5.68
5.15
5.32
5.54
6.04
R e s i s t i v i t y ohm-cm
-
-
67, ooo 89,000
71, ooo -
56, ooo 54,000
46, ooo
58,000"
48, ooo 50, ooo
49,000
44,500
48, ooo
51,500
48, ooo
T I Hydrogen Volurne V 0 1iline Removed, rllls Added, mls cc/kg
- -
0.61
0.79
1.87
-
0.73
0.73
1.78
-
0.26
0.63
0.81
1.23
-
-
0.28
0.32
- 0.43
405 -
68
68
68
-
68
68
68
60*
68
68
68
68
68
170**
68
68 **
22
68
* S a t over 3 day weekend.
** Result of vacuum degassing.
37

4 1
0 b W In t n r 4 - m W
6M/dlS @ ‘H 33 ‘ Y l O S IS31 YI 3NO3 W39OJJOAH
8
I- VI W I-
3
n .Y
v) * a
I-
n
,
a
m rl
al L
38
39

c
x x x x x x x x x x x x x x x x x I I I I
N
a
i h
m
a,
5 rl u 0 +J
2
k
? i o c h a , a .rl 0 0 f i a ,
r, f f l v ,
a + B o " d'R z m m
v)
a, * z
40
h
rl v
rl
a
41
c
0
0
0 0
0
c
42
0
0 % )
0
0
4 3

TABU 11
200°F Autoclave Test - Analyses of Solut ions and Composite Residue
Element
Ag A1 A s Au B Ba Be B i Ca Cd CO C r cs cu Fe I n K L i
Mn Mo Na m N i P Pb Rb Sb S i Sn Sr Th T i T 1 U v W Zn Z r
Mg
Initialj:)) 140 hrs. S o h . i n t o t e s t
<o. 02 <O. 04
<o. 2 0.03
<o. 02 <o ,0006 <o. 02 0.10 0.12
<o. 06 <o. 06
0.02 <o. 04 <o. 06
0.05 0.03
-
-
- -
<o. 02
-a. 02 0.07
<o. 2 <o. 06
4.2 0.07 4.06 0.006
<o. 06 <o .006
<o. 06 <o. 06 4.2 <o. 006
-
-
- -
(0.02 <O. 04
<o. 2 0.05
<o. 02 <o. 0006 <o .02 0.04 0.87
<o. 06 <o. 06
0.01 0.13
<o. 06
0.08 0.06 4.02
<o. 02 0.07
<o. 2 <0.06
<o. 2 0.12
<o. 06 0.006 4. 06 <o. 006
<o. 06 <o. 06 C0.2 <o. 006
-
-
- -
-
-
- -
370 hrs. i n t o t e s t
<o. 02 <O. 04
<o. 2 0.07
<o. 02 <o. 0006 <o. 02 0.10 1.2 4.06 <o. 06
0.52 4.06
-
- 0.02
- - 0.14 0.14
<o. 02
co. 02 0.07 4.2 a. 06
<o. 2 0.12
<o. 06 0.006
-a. 06 <o. 006
<o. 06 4-06 <o. 2 <o. 006
-
-
- -
730 hrs. i n t o t e s t
4.02 <o. 04
<o. 2 0.09
<o. 02 <o. 0006 4.02 0.10 0.86
<o. 06 <o. 06
0.02 0.43
<o. 06
0.18 0.14
<o. 02
4.02 0.05
<o. 2 4.06
<o. 2 0.12
<o. 06 0.006
<o. 06 4.006
<o. 06 a. 06 4.2 -a. 006
-
-
- -
-
-
- -
1070 hrs . i n t o t es t
<O. Q2 4.04
<o. 2 0.35
<o. 02 <o. 0006 <o. 02 0.10 1.1
<o. 06 <o. 06
0.02 0.48
<o. 06
-
-
- - 0.43
<o .02
4.02 0.08 4.2 <o. 06
4.2
<o. 06 0.007 4.06 a. 006
~0.06 <o. 06 (0.2 <o .006
0.30
-
-
0.14
- -
F i n a l S o h .
<o. 02 <O. 04
<o. 2 0.25
<o. 02 -=a. 0006 <o. 02 0.10 0.60
<o. 06 <o. 06
<o. 002 <O. 04 <o. 06
-
-
- - 0.11
4.02
4.02 0.04
<o. 2 <o. 06
<o. 2 0.09
<o. 06 <o. 006 4.06 a. 006
4.06 <o .06 <o. 2 <o. 006
0.15
-
-
- -
Composite Residue (2) (1) A l l s o l u t i o n analyses a r e
cu 4.9 pg/& A1 5.1* Cd 1.4 Fe 17.5 C r CO.02 N i 0.15 (2 ) Results obtained spectro-
4 4

TBIX 12
300 F Autoclave Test - Analyses of Solutions and Coaposite Residue o
Element
Ag A1 A s AU
B Ba B e B i Ca Cd CO C r cs cu Fe I n K L i Mg Mn Mo Na Nb N i P Pb Rb Sb S i Sn S r Th T i T 1 U V W Zn Zr
(1) I n i t i a l f 2 ) S o h .
<o. 02 ~ 0 . 0 4
4 . 2 0.031
<o. 02 4. 0006 <o. 02 0.07 0.07 4.06 4.06
<o. 04 4. 06
-
- 0.008
- 0.037 0.03
<o. 02
<o. 02 <O. 04 <o. 2
-
<o. 06
4.2 0.07 4.06 <o. 006 a. 06 <o .006
4-06 4.06 <o. 2 4.006
-
- -
Composite Res idue(2)
A1 5.1* Cu 4.9 Cd 1 .4 Fe 17.5 C r < 0.02 N i 0.15
Tota l Weight 42.4 mg
140 hrs . i n t o t e s t
<o. 02 4 . 0 4
C0.2 0.07
4 . 0 2 <o. 0006 <o .02
0.15 0.39 4.06 a. 06
0.13 4.06
-
- 0.024
- -
0.12
<o. 02
<o. 02 <O .Ob 4 . 2 4.06
<o. 2 0.17
<o. 06 41. 006 <o. 06 4. 006
4.06 x). 06 4 . 2 4.006
0.09
-
-
- -
370 nrs. i n t o t e s t
<o .02 <O. 04
<o. 2 0.035
4 . 0 2 <o. 0006 -a. 02
0.11 0.35 4.06 <o. 06
0.015 0.25
-a. 06
-
-
- 0.09 0.09
4 . 0 2
4.02 <o. 04 4.2 <o. 06
4 . 2
7
-
0.10 10.06 4.006 4.06 4. 006
- 4.06 <o. 06 4 . 2 4.006
1070 h r s . i n t o t e s t
<o .02 0.06 -
4 . 2 2.0
<o. 02 <o .0006 ro. 02
0.19 0.60 43.06 41.06
0.033 0.23 4.06
-
- - 0.12 0.18
<o. 02
4 . 0 2 0.08
<o. 2 4.06
-
- <o. 2
0.20 co. 06 0.006 4. 06 0.06
a. 06 41.06 4 . 2 4.006
- -
Fina l S o h .
<o. 02 <o .oh
C0.2 0.08
<o. 02 <o. 0006 <o. 02 0.11 0.70
<o. 06 <0.06
0.15 0.11 4.06
0.13 0.16
<o. 02
4 . 0 2 <O. 04 <o. 2 4.06
43.2
4.06 4.006 <o .06 <o .006
4.06 <o. 06 <o. 2 a. 006
-
-
-
- -
-
-
0.15
- -
(1) AI^ so lu t ion analyses a r e
( 2 ) Results obtained spectrochemically.
* Weight 4 .
Dg/ml .
45

V I . STRIPPING OF SPECIMENS
The tes t s j u s t described were designed t o y i e ld information t h a t could
be used i n pred ic t ing the genera t ion of hydrogen as a r e s u l t of aluminum
corrosion. One obvious method of doing t h i s was t o measure t h e hydrogen
d i r e c t l y by chemical means. The measurement of hydrogen i n a so lu t ion i s
very precise and reproducible. However, t h e r e were many complicating f a c t o r s .
I n the autoclave tests, two specimen surface t reatments were being t e s t e d
simultaneously, and although t h e hydrogen sampling and ana lys i s was prec ise ,
t h e d i f f e r e n t cor ros ion r a t e s of the two specimen types def ied one t o determine
where the hydrogen was coming from. I n t h e loop tes ts , t he hydrogen genera t ion
appeared t o be smaller with t h e specimens i n s t a l l e d than had been t h e genera t ion
r a t e during the base- l ine operat ion.
of corrosion r a t e of t h e s t a i n l e s s s t e e l loop sur faces complicated by the
t e s t i n g and volume con t ro l methods.
This was probably caused by t h e change
The weight change of specimens during t e s t could be used as a measure
of t he corrosion and the re fo re the hydrogen genera t ion providing a number of
f a c t o r s were known. F i r s t , t h e r eac t ion equat ion has t o be def ined; t h a t i s ,
t h e nurilber of waters hydrating with t h e alumina must be determined. Secondly,
it must be determined whether corrosion product i s remaining on t h e sur face
where it i s formed, or whether it i s leaving t h e sur face and can be found i n
so lu t ion o r i n res idues.
Since ne i the r of these methods appeared t o be completely s a t i s f a c t o r y
f o r a l l cases , another approach was a l s o pursued. If t h e t o t a l aluminum a t t a c k
and t h e pretreatment weight change could be ascer ta ined, and i f t h e pretreatment
reac t ion equat ion could be defined, t hen by d i f fe rence , t h e aluminuni reac ted
during t e s t could be found. This would be used i n determining hydrogen genera-
t i o n .
Draley'' a t Argonne Nat ional Laboratory had developed a procedure f o r
p r e f e r e n t i a l l y s t r ipp ing aluminum oxide o f f aluminum specimens without s i g n i f i -
cant base metal a t tached. The method was modified s l i g h t l y t o s u i t t he needs
of t h i s program and appears as used i n t h e appendix. A pretreatment i n a

b a s i c ac id so lu t ion i s used t o loosen t h e adhering oxide, the a c t u a l s t r i p p i n g
i s performed i n the chromic-phosphoric acid so lu t ion . The weight change of
t h e specimen during s t r i p p i n g and t h e analysis of s t r i p so lu t ion for aluminum
content can both be used t o determine aiuminum a t t ack .
Specimens t h a t had been steam t r ea t ed i n the autoclave were s t r ipped t o
determine t h e a b i l i t y of t h e method t o remove oxide. These r e s u l t s are shown
i n Table 13. Using t h e equation f o r t he react ion involving one and two waters
of hydration, t h e r a t i o s of t he various weight changes are shown t o agree reason-
ab ly w e l l wi th those predicted f o r one water of hydration. This confirmed the
u s a b i l i t y o f t h e method.
Additionally, s t r i p p i n g was performed on an untreated blank and on a
steam t r e a t e d sample taken from the batch t o be t e s t e d . T h e s e r e s u l t s a r e
shown i n Table 14.
specimen 54, a l s o agree with what i s expected for t h i s treatment.
l o s s of s t r i p s t e p number 1 for specimen 68 i s a t t r i b u t e d t o a probable
su r face covering of t h i n oxide.
The r a t i o comparisons as described above, made with
The weight
The r e s u l t s of Table 14 t h a t proved su rp r i s ing were the aluminum
analyses of the s t r i p so lu t ions for specimen 54 and 68 respect ively, t h e r e
was apparent ly b e t t e r than 2 and 3 t i m e s the aluminum i n s t r i p so lu t ion a s
had been evidenced by specimen weight change ( t o t a l metal a t t a c k ) .
P r i o r t o these analyses, standard sol tuions were prepared and analyzed
i n o rde r t o determine t h e lower l i m i t s of d e t e c t i o n of various elements i n t h e
so lu t ion , and t h e amounts of these elements present i n f r e s h l y prepared chromic-
phosphoric s t r i p so lu t ion .
68 are shown i n Table 15 . These r e s u l t s along with those f o r specimens 54 and
47

.
TABLE 13
Resul ts of S t r ipp ing Steam Treated Specimens
Spec imen 14 18 12 19
Steam Duration, h r s . 24 48 96 96
Weight G a i n During 5.3’17 7.095 7.757 7.900 Steaaing, ws
Weight Loss During 8.987 13.290 13.513 13.827 S t r ipp ing , rngs
T o t a l Metal Attack, rngs 3.670 6.195 5.756 5.927
A W t s t r i p/AWt steaming 1.69 1.87 1.74 1.75
Total Met A t t / A W t Steaming 0.69 0.87 0.74 0.75
T o t a l Met A t t / A W t S t r i p p i n g 0.41 0.47 0.43 0.43
3H2 T h e o r e t i c a l : 2 A 1 + (3+n)%O j A1203 * nH20 +
n = l n=2
( a ) A wt . s t r ip /A wt.steaming = LA1 0 -nH20]/r03-nH201 = 1.82 1.64
(b) A w t . steaming
2 3
= 0.82 0.65 attack = C2A1]/[03. nH20]
Tota l metal a t tack = r 2 A 1 ] / r A l 2 O 3 - nH20] = 0.45 0.39 A w t . s t r i p p i n g

TABLE 14
Resul ts o r Str ipping Untested Samples
Specimen
Co nd it ion
W t Gain During Steaming, mgs
W t Loss During S t r i p p ng, rngs
S t r i p 1
2
3
4
5
6
7
Total, mgs
To ta l Metal Attack, ngs
A W t Strip/A W t Steaming
Tot Met A t t / A W t Steaming
Tot Met A t t / A W t S t r ipp ing
Alumin S t r i p Solution, rngs
54 68
96 h r Steaming Clean
4.271
3 - 629 1.879
1.006
0.547
0.337
0.110
0.007
0.569
0.008
0.000
0.003
+o. 011
0.005
0.017
7- 517
3.244
1.76
0.76
0.43
6.99
0.591-
49

TABLE 15
Analyses of S t r i p Solut ions
Elemental Spec 54 Spec 68 Fresh S t r i p L i m i t s of Analysis u g / m l u,g/ml Soln, ug/rnl Detection, pg/rnl
A 1 36(’) lo(;?) 1 .0 1.0
cu 0.56 0.22 4.1 0.1
Fe 1.7 1.1 1.1 1.0
Cd <4.0 41.0 d . 0 4.0
N i 0.11 0.44 0.1 4.1
(1) Should be 16.7 based upon t o t a l aluninun a t t a c k , so lu t ion w t . was 209.4 gms
( 2 ) Should be 3.2 based upon t o t a l aluninum a t t a c k , so lu t ion w t . was 198.4 gms
The specimens were subsequently examined using x-ray techniques t o
determine i f any chrome from t h e s o l u t i o n o r platinum from the e l ec t rode
had plated out on t h e aluminum specimen during t h e oxide s t r i p p i n g opera-
t ion . Nothing above minimum de tec t ab le amounts was encountered. The
discrepancy between weight change d a t a and analyses f o r aluminum i n
solut ion remains unsolved.
I n s p i t e of these apparent discrepancies , s t r i p p i n g of bo th autoclave
coupons and loop hea te r specimens was c a r r i e d out i n o rde r t o e s t a b l i s h
addi t ional methods of comparison of r e s u l t s t o determine hydrogen generation.
The r e s u l t s of s t r i p p i n g autoclave coupons, bo th specimen weight changes
and so lu t ion analyses are shown i n Table 16. r e s u l t s are shown i n Table 17.
The loop hea te r specimen
50

cu rl 3 0
cn a3 3
a3 M 3
0 . . 0 a? M
ri M f
0 0 0 0
. . . . . . . . 4 cu cu M A - cu cu 0 M
a T 4 k t, m
s a
A a .rl M U v) ? I , I I I I I I I
f V M
a, u w cd U
6 E? M
m G M
2 M
E? M
2 M
m E! M
m G M
m E M
m E! ho m c u o r l f
c u r l u 3 r l r l 3 I I I I r- In 3 a3 cu rl
cu r- r- cn t- 0
rl cu 0 rl rl rl
h t- co cu rl 3 0
ou3 r - 3 r l ln z3
. . . 'u' - iu Ln r-i cu rl
4 N) cu
0' 0 4 c u f l n r - c u d rlrldrirlrl . . . . . . I I I I I
n u v) a, u a, M 0 w a, P
. . . . . . b cr ob bi @h 2 cu cv cu cu M M M M PI iJ.7
0 0 0 0 0 0 0 0 0 0 0 ~ @ i N 0 0 0 0 0 0 0 0 rl *rl lnr-ou3mou3cocna3
MMf MMrlMMMcu
m m m m m m m m m m E ! E ! E ! E ! E ! G d E ! E ! E ! M M M M M M M M M M rdw u o
U c . . . . . . . . . .
51

" O O " 0
o l n r - c c r l m 0
Tu 0
o o c c m o c u
v ( u L n s ; " " " " "
d 2
0 a, a cn
-. m a, k 4 a
.ri k t-' tn
2 M
r- 0 tn a
*rl k c, tn
r: 0
.rl t-' 3 d 0 tn % 0
(0
m x d a $2 4
2 +J m
h
d 9
k a, a a 0 u
r: 0 k H
a .rl k -P rn
52
c
V I I . EXPERIMENTAL FG3SULTS
The o b j e c t i v e of the t e s t program was t o determine hydrogen generat ion a s
a r e s u l t of t h e corrosion of aluminum under various condi t ions. Each phase
of t h e program presented a Sew independent means of dete1,lniniiig t h i s generat icn
a t a given s e t o f condi t ions. It was o r i g i n a l l y planned t o use these separate
means as checks, one upon t h e o ther ; thereby r e s u l t i n g i n meaningful generat ion
in fo raa t ion .
and o t h e r s j u s t d i d n ' t work for one reason o r another. A l l o f them w i l l be
discussed i n t h i s s e c t i o n with only the applicable r e s u l t s being used t o
e s t a b l i s h t h e hydrogen gene ra t ion.
However, too many of t h e techniques proved n o t ' t o be appl icable
A. Autoclave Tests
Hydrogen generat ion could be determined by d i r e c t measurement as a
r e s u l t of sample ana lys i s pe r iod ica l ly drawn from each autoclave system.
The weight change of t h e specilnens during tes t , coupled with an aluminum
a n a l y s i s of t h e t e s t s o l u t i o n could a l s o be used t o determine hydrogen
generat ion. If specimens were stripped, hydrogen generat ion during t e s t
could be determined by an ana lys i s of t h e s t r i p s o l u t i o n coupled with
information about weight change during pretreatment. Specimen weight
change during s t r i p p i n g could be used a s a check of t h e s t r i p s o l u t i o n
ana lys i s .
1. Direct Hydrogen Measureaent
0 The d i r e c t measurement of hydrogen was made f o r both t h e 200 F o and 300 F autoclave t e s t s . The r e s u l t s were shown i n Figures 13
and 14. r a t e s f o r t he aluminum specimens from t h i s information, because
t h e r e were two types of specinens included i n each t e s t . Each
t e s t s t a r t e d with 16 speciaens t h a t had been steam t r e a t e d p r i o r
t o t e s t and 5 specimens t h a t had a hard-coat applied p r i o r t o t e s t .
When t h e specimen weight change information was made ava i l ab le a t
t h e end of each period of t e s t ing , a t t e m p t s were lnade t o c o r r e l a t e
It would be very d i f f i c u l t t o determine hydrogen generat ion
53
t h i s with hydrogen generat ion measurements. This was unsuccessful.
A l l specimens were not removed and weighed a t each period, t he re fo re
one had t o assume t h a t those specimens removed represented an
average. This was la te r found not t o be necessa r i ly t r u e . Therefore,
a f t e r many attempts t o e s t a b l i s h co r re l a t ions , t h e d i r e c t measure-
ment information was temporarily discarded. It was r ea l i zed t h a t
much simpler t es t s each with fewer specimens, a l l of t he satne type,
would be required t o make t h i s measurement more meaningful.
2. Measurement of Test Weight Change
The specimens were r insed and d r i e d then weighed on the micro-
balance a f te r removal from t h e autoclave tes t . These r e s u l t s were
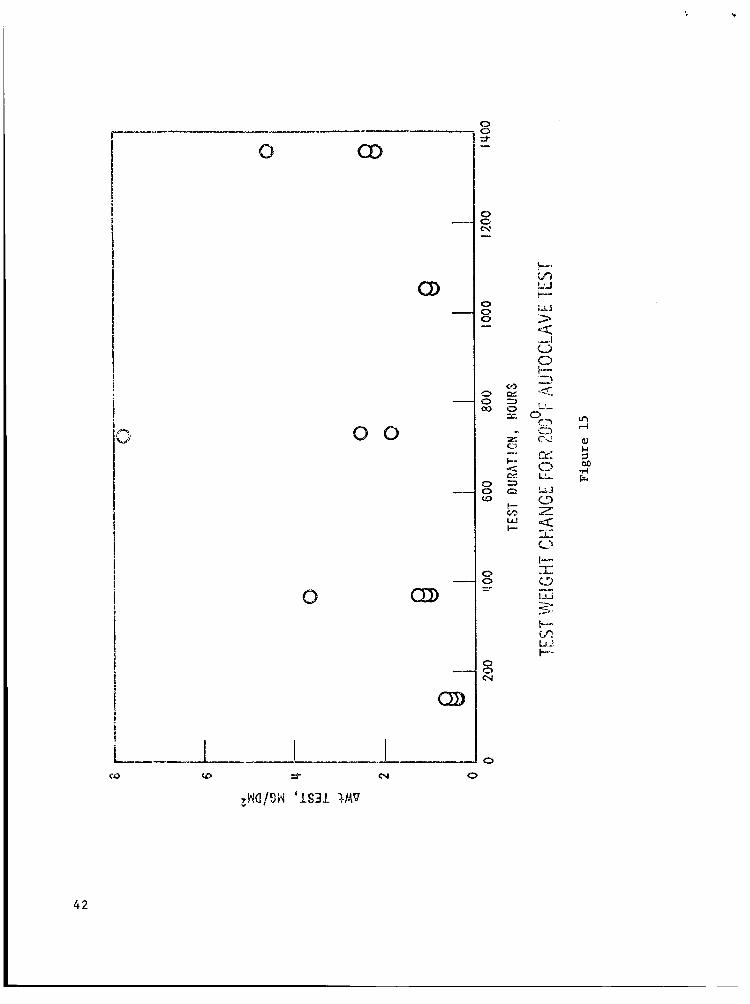
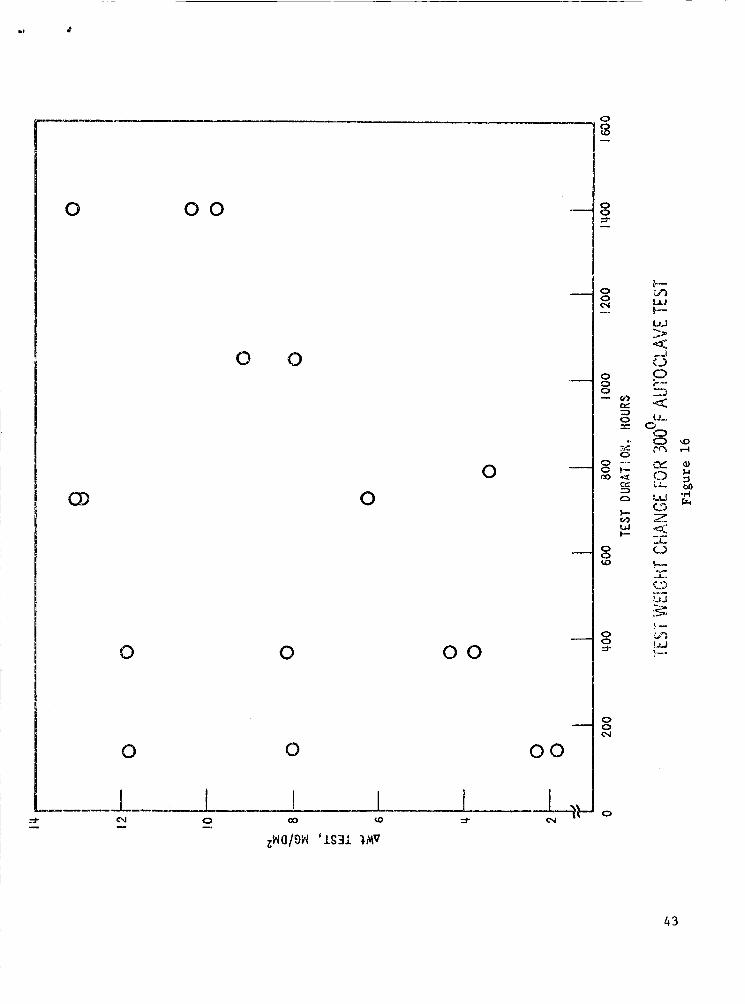
shown i n Figures 1 5 and 16. s c a t t e r on these two f i g u r e s t h a t t h e t e s t weight change was dependent
on something more than j u s t t es t du ra t ion .
r e su l t s , it became apparent t h a t t h e r e was some c o r r e l a t i o n between
t e s t weight change and the pretreatment weight change for t h e steam
t r ea t ed specimens. This i s p lo t t ed i n Figures 17 and 18. The t rend
i s t h a t , t he g r e a t e r t h e pretreatment weight change, t h e smaller i s
the subsequent t e s t weight change. This makes more sense when it
i s r ea l i zed t h a t i n i t i a l corrosion r a t e s are high u n t i l a f i l m i s
establ ished. These r a t e s probably decrease with time. However,
surface condi t ion has a b i g e f f e c t on corrosion r a t e s a s evidenced
by t h e v a r i a t i o n of preoxidation weight changes, a l l specimens being
t r ea t ed simultaneously .
It became very obvious wi th t h e apparent
After study of t h e
Examination of Figures 17 and 18 revea l s t h a t below a preoxida-
t h e weight change during t e s t 2 t i o n weight change of about 12 mg/dm
i s not a funct ion of t e s t du ra t ion . Since t h e t es t weight change
i s inve r se ly proport ional t o t h e preoxidation weight change, Only
the d a t a points above 12 mg/dm
Figure 19.
2 perox A weight were r e p l o t t e d i n
54

8
7
6
5
N I n \ c3 I . s 4
!G
w + a
3
2
1
0
SYMBOL TEST DURATION
0 IU2 HRS.
A 370.8
0 725.8
v 1054.5
m 1335.5
I I I I I 0 5 IO 15 20 25
AWT PREOX, M G / D M ~
TEST WEIGHT CHANGE A S A FUNCTION OF PREOXIDATION WEIGHT CHANGE FOR THE 2OPF AUTOCLAVE TEST
I
Figure 17
55

0 cv
c v) W I- W > 0 0 c 3
LL
z5
a
“8 m
9
9
p1
W c3 z V
z 0 K u z E? a a v)
W c3 z
u I- I
9
s 2
I- v) w +
56
0
o w N C
I l I l
a
\ \ \ \
57

.- e .
The so lu t ions co l l ec t ed from t h e autoclave tes t s and t h e i r
f i l t e r e d residues were analyzed f o r aluninun content .
minimun de tec t ab le amounts were found. Therefore, it was
assuned t h a t the specimens i n these so lu t ions exhibi ted l i t t l e
or no s p a l l i n g o r f l a k i n g of t h e oxide f i l m . This assunption
then allows f o r t he d i r e c t conversion of t e s t weiglh change t o
hydrogen generation.
Only
This was done using the formula.
2 A 1 + 4 H 2 0 + A l 0 . H 0 + 3 H2 2 3 2
For every 2 moles o f aluminum reacted, t h e weight increase
would be 66 grams, and t h e r e would be 3 moles of hydrogen gener-
ated.
change f o r t he specimens undergoing > 12 mg/dm proxidat ion
weight change (shown i n Figure 19) i s p lo t t ed i n Figure 20.
f igure a l so contains o t h e r information obtained from o t h e r t e s t s
and w i l l be r e fe r r ed t o i n subsequent s ec t ions .
The calculated hydrogen generat ion from t h e t e s t weight 2
This
3. Coupon S t r ipp ing
Some of t he coupons t e s t e d a t both 200'F and 300°F were
s t r ipped of t h e i r oxide f i l m s i n t h e manner previously descr ibed.
The weight change d a t a and so lu t ion analyses were shown i n Table 16. The information obtained from t h e s t r i p p i n g could be in t e rp re t ed by
two rneans:
analyses da t a .
using t h e s t r i p weight change d a t a or using t h e s o l u t i o n
The t o t a l metal a t t a c k i s ca l cu la t ed from t h e d i f f e r e n c e i n
preoxidation (before autoclave t reatment) specimen weight and t h e
pos t - s t r ip weight. O f t h i s amount, some aluminum w a s reacted
during preoxidation, t h e remainder i s t h e weight of aluminum
reacted during t h e test . This t e s t metal a t t a c k can then be
used t o compute t h e t e s t hydrogen generation. The r e s u l t s are
shown i n Table 18 and are p l o t t e d i n Figure 20. There appears t o be
58

W 0 4
I- d
W
W CI = I O '
IO0 I
TEST DURATION, HOURS
HYDROGEN GENERATION RESULTS
Figure 20
59

I
I
I
M
cu cn r-i
Ln t- cO rl
u M
I
I
I
M Q) 2
t - c O u c O m n . . . . . .
C U t - l n M r - d O c u O 0 s ; . . . . . . o o r - i m m r l
. . . . . . o o r l r l r l r -
o d o m c u 3 I r l r n c n r l \ O O
o o o c u m c u . . . . . .
. . . . . c ; c i c u M 3 c u c u
r: 0 .rl c, a k 5 x G
k 0
k a, c,
? 2 z 2
0
.rl E?
m a
0 d 0 u *
60

good agreement between these r e s u l t s and those obtained from the
t e s t weight change information f o r the 300°F autoclave t e s t .
Annther c a l c u l a t i o n involving t h e s t r i p weight change i s a l so
I n t h i s shown i n Table 18 with t h e r e s u l t s plot ted i n Figure 20.
one, t h e steam treatment oxide formation i s subtracted from t h e
s t r i p weight change, the r e s u l t being the amount of oxide formed
during tes t . T h i s i s then converted t o hydrogen generation assuming
one water of hydration. The r a t i o of t o t a l metal a t t a c k t o t h e
s t r i p weight change f o r t hese specimens was shown i n Table 16. The average of a l l specimens was 0.426 as compared t o a t h e o r e t i c a l
of 0.45 f o r the one water of hydration r e l a t ionsh ip .
allows one t o use t h i s equation without much e r r o r . When p lo t t ed
i n Figure 20, they a l s o agree with the weight change r e s u l t s .
This then
The remaining method of ana lys i s involving t h e s t r i p p i n g
procedure, i s the use of the chemical analyses of the s t r i p
so lu t ions .
so lu t ions was from 1.8 t o 3.5 times as high as the t o t a l aluminum
a t tack , the average being 2.6 times as g r e a t .
generat ion calculated i n t h i s manner w i l l be high by the same amount
and w i l l not be p l o t t e d i n Figure 20.
It was shown i n Table 16 t h a t t h e aluminum i n s t r i p
Therefore the hydrogen
4. Empirical Relationships Derived from Autoclave Results
The autoclave t e s t da t a shown i n Figure 20 represent t h e r e s u l t s of t h r e e analyses of t e s t information :
a .
b .
measured weight change of specjmens during t e s t (curves 1 and 4)
measured ve?’ght change of specimens as a r e s u l t (curves 2 and 5 )
o f s t r i p p i n g t h e aluminum oxide
c. t o t a l metal a t t a c k calculated from t h e d i f f e rence between pre-
oxidat ion specimen weight and p o s t - s t r i p specimen weight
(curves 3 and 6)
The empir ical hydrogen generation c o r r e l a t i o n s a r e based on
t h e measured weight change during t e s t . The s t r i p p i n g da ta were
no t d i r e c t l y used t o determine empirical hydrogen generation re -
a ,
61

l a t i onsh ip because of t h e disagreement between t h e s t r i p weight
change and t h e s t r i p so lu t ion analyses .
hydrogen measurement were disregarded because of l a r g e d i f f e rences
i n corrosion between t h e two types of specimen present ("hard coat"
and steam t r e a t e d , see paragraph A . 1 , p. 53). Curves 1 and 4 of
figure 20 have similar s lopes and for s impl i f i ca t ions i t was assumed
they had t h e same slope with t h e following resu l t :
Data obtained by d i r e c t
f o r 3 0 0 ' ~ tes t , H2 gener ( c c / f t 2 ) = 0.567 ( t ) 0.711
f o r 200°F test, H2 gener ( c c / f t 2 ) = 0.142 ( t ) 0.711
where t i s t h e t e s t dura t ion i n hours.
I n order t o combine these two equat ions i n t o one, t h e fol lowing
was done. The above equat ion i s t h e form:
log H2 = log a + b log t
where a and b a r e t h e cons tan ts i n t h e previous equat ions.
l e t log a = log P + Q log T
where P and Q a r e cons tan ts and T i s t h e temperature i n degrees
Fahrenheit .
The r e s u l t i s an equat ion where hydrogen genera t ion i s a
funct ion of tes t dura t ion and specimen temperature with no heat
f l u x across t h e specimen-liuqid in t e r f ace . The r e l a t i o n s h i p i s :
-2 T 3.44 (t)0.711 (m) H gener = 1.32 x 10 2
This empir ica l c o r r e l a t i o n is again p lo t t ed i n Figure 21 along
with the hydrogen genera t ion values determined from t h e weight
change da ta . A l s o shown i s t h e c o r r e l a t i o n developed by Griess (Reference 1) f o r heat f l uxes between one and two mi l l i on Btu/hr-f t 2 . It should be noted t h a t t h e hydrogen genera t ion i n a system
experiencing heat f l u x i s propor t iona l t o t h e hydrogen generated
i n a system without heat f lux , e.g. t h e curves are approximately
pa ra l l e l .
62

.-
B. Loop Tes t s
1. Low Power Test
The generat ion of hydrogen from t h i s t e s t can t h e o r e t i c a l l y be
determined from the same type of analysis as was j u s t described f o r
t h e autoclave t e s t s ; namely, by d i r e c t measurement, by u t i l i z i n g
specimen s t r i p p i n g d a t a such as weight change and so lu t ion analyses,
and by knowledge o s t e s t weight change.
63
0 0 0
42 - N
I-
U O d
\ \ \ \ \ \ \
a \ \ \ \
a
\ \
64

a. Direct Hydrogen Measurement
The r e s u l t s of analyzing l iqu id samples from the loop
f l u i d f o r hydrogen content were shown i n Figure 9. The amount
of hydrogen present i n so lu t ion a t any t i m e i s a r e s u l t o f
cor ros ion i n t h e heat f l ux region o f t h e specimen, cor ros ion
i n t h e non-heat f l u x region of the specimen and cor ros ion of
t h e loop metal sur faces . These amounts could be diminished
by lo s ses of hydrogen from t h e system.
The purpose of t h e loop preconditioning descr ibed i n
sec t ion V-A-3, was t o pass iva te t h e loop metal sur faces o r
preoxidize them, so t h a t t h e cont r ibu t ion of hydrogen from
t h i s source during t e s t i n g would be small. The subsequent
loop "base-line" operat ion, described i n sec t ion V-54 , served t h e func t ion of determining t h i s genera t ion r a t e
which was t o have been subt rac ted from t h e generat ion r a t e
during tes t , r e s u l t i n g i n a value which could be associated
wi th specimen corrosion.
"base l i n e " opera t ion var ied between 0.10 and 0.15 cc of
hydrogen per kilogram of so lu t ion p e r hour. During t h e low
power t e s t t h e hydrogen generat ion was 0.03 cc H2/kg/hr with
fou r specimens i n t h e loop and 0.017 cc H2/kg/hr w i t h two
specimens. Each of these a r e s i g n i f i c a n t l y less than t h e
r e s u l t o f t h e "base l i n e " operation. I n addi t ion, t h e two
t e s t r e s u l t s a r e i n a r a t i o of about 2 t o 1, t h e same r a t i o
as t h e a rea of aluminum i n the respec t ive tests. The low
level of t h i s genera t ion and the r e l a t ionsh ip between t h e two
r a t e s i nd ica t e s t h a t loop corrosion and the re fo re i t s hydrogen
genera t ion have been reduced s i g n i f i c a n t l y enough t o be ignored.
The r a t e obtained during t h i s
65

.
The loss o f hydrogen from these tes t s has been ignored
i n a l l o f t hese ca l cu la t ions . I n a l l cases t h e amount of
hydrogen present has been w e l l wi th in t h e s o l u b i l i t y l i m i t s
of t h e loop so lu t ion . This coupled wi th t h e low loop opera t ing
temperatiire, and t h e f a c t t h a t t h e r e was no l iqu id-gas i n t e r f a c e
present i n t h e loop, precludes t h e p r e f e r e n t i a l loss of hydrogen
from so lu t ion without l o s ing s i g n i f i c a n t amounts of loop f l u i d ,
which were a t a minimum.
1
The remaining sources of hydrogen were from cor ros ion of
both t h e heat f l u x regions and non-heat f l u x regions of t h e
aluminum specimens.
The specimens had 5 1 inches of l eng th exposed t o loop
so lu t ion a t a temperature between 245OF and 264'F. Only 11
inches of t h i s sur face i s sub jec t t o a heat f l u x across the
i n t e r f a c e with t h e loop f l u i d . The hydrogen generated i n t h e
40 inches of unheated sur face was determined using t h e empir ica l
c o r r e l a t i o n spec i f i ed above, assuming an unheated sur face
temperature of 264°F.
The hydrogen generated i n t h e heat f l u x region was ca lcu la ted
as follows:
1. The t o t a l hydrogen generated i n the loop a t var ious
times i s obtained by mult iplying t h e measured hydrogen
concentrat ion (da t a po in t s shown i n Figure 9) by the
mass of water i n t h e loop (15 kg).
2. The t o t a l hydrogen from t h e unheated sur face of t h e
specimens i s obtained by mult iplying the t o t a l unheated
specimen a rea (0.65 f t /specimen) by t h e hydrogen genera-
t i o n a t 264 F as determined by the empir ica l co r re l a t ion .
2
0
66
3. The t o t a l hydrogen from the heated surface i s the
d i f f e r e n c e between 1. and 2. The hydrogen generation
per square foot of heated surface i s obtained by
dividing by the heated surface a rea (0.18 ft’ per
specimen).
After 167 hours’ exposure, two of t h e fou r hea te r s were
perrllanently removed f o r examination and the experiments continued
w i t h only ha l f t h e surface exposed. This change of surface area
was accounted f o r i n the above mentioned ca l cu la t ions . The values
of hydrogen generat ion calculated from t h e da t a of Figure 9 a r e
shown as d a t a points i n Figure 21.
through these d a t a p a r a l l e l t o t h e lines descr ibing t h e autoclave
tes t r e s u l t s . This was done because a comparison of the co r re l a -
t i o n f o r heat f l uxes between one and two mi l l i on Btu/hr-f t
presented by Griess (ref. 1) and t h e “zero-heat f l u x ” c o r r e l a t i o n
presented herein ind ica t e s heat f l u x has l i t t l e o r no e f f e c t on
the slope of the “log-log” p l o t s , e.g. t h e hydrogen generation
w i t h heat f l u x i s proport ional t o the hydrogen generat ion without
heat f lux .
A c o r r e l a t i n g l i n e was drawn
2
b. S t r ipp ing of a Loop Test Specimen
One of the t e s t specimens (Number 18) was s t r ipped of the
su r face oxide i n the 11 inch region associated w i t h t h e heat f lux .
The specimen was weighed before and a f t e r s t r i p p i n g and the s t r i p
s o l u t i o n was analyzed f o r aluminum content.
The s t r i p so lu t ion contained 59 pg aluminum per m i l l i l i t e r of
solut ion, which converts t o 33 mg aluminm p e r square decimeter
o f surface area. It had been shown t h a t of t h e aluminum s t r ipped ,
21 mgAl/dm had been attacked during pretreatment. Therefore, t h e
aluminum attacked during t e s t i s 33 - 21 o r 12 mgAl/dm . 2
2
67
Using the equation previously discussed, 2 m-moles o r 54 mg
of aluminum attacked produce 3 m-moles o r 67.2 cc of hydrogen,
the r e s u l t i s 150 cc H2 per f t 2 of heated surfaces . This agrees
very wel l with the value based on hydrogen measurements shown i n
Figure 21 (150 c c / f t ) . a t t ack during s t r i p , which would tend t o lower t h i s point .
2 2 This ana lys i s assumed no base metal
The weight change of the specimen during t h e s t r i p p i n g opera-
An ana lys i s of the s t r i p s o l u t i o n f o r t i o n w a s a loss of 248 mg.
f i v e elements yielded t h e following r e s u l t s :
A1 59 Cd < 3 cu < 3.2 Fe 10
N i 16 To ta l 91 IJ.g/ml
The so lu t ion volume was 1011 m l , r e s u l t i n g i n 92 mg of these
metals. If it i s assumed t h a t they e x i s t as t h e i r respect ive
oxides of which about 45% i s metal, then t h e oxide weight was
92/.45 o r 205 mg. Therefore, t h e r e i s some agreement between
t h i s 205 mg l o s s of oxide during s t r i p and the weight change of
the specimen of 248 mg during t h e same operation.
c. Specimen Test Weight Change
The hydrogen generat ion can a l s o be calculated if one knows
the specimen weight change during t e s t and has an ana lys i s of
solut ions and residue t o determine aluminum l o s t from t h e specimen.
The tes t weight change information i s shown on the following page.
68

Preox. A w t * T e s t A w t mg Test Duration H r s . Spec. No. mg/dm 2
11 +15.0 +21
12 +11.5 -549 16 +16.0 -33
* Based upon e n t i r e surface exposed t o f l u i d .
167 167 330
These weight l o s s e s were not expected based upon v i s u a l ex-
amination of t h e specimen. Analysis of t h e loop s o l u t i o n
yielded t h e minimum de tec t ab le amount of aluminum, < 0.04
pg/ml which f o r a loop, volume of 1 5 l i t e r s , i s < 0.6 mg.
Two residues were co l l ec t ed and analyzed f o r aluminum w i t h
the following r e s u l t s :
Res idue W t $ A 1 W t Residue W t A1
1 0.55 5.4 mg 3 % 2 0.60 11.5 mg 7%
Total 10 mg
T h i s t o t a l amount of aluminum found i s so small compared t o
t h a t apparently l o s t , t h a t t h e t e s t weight change d a t a w i l l
not be used f o r determining hydrogen generation. It i s assumed
t h a t t h e drying process used both before and a f t e r t e s t , was
s u f f i c i e n t l y d i f f e r e n t t o cause the discrepancy j u s t described.
2. High Power Loop Test
The r e s u l t s obtained from t h e high power loop t e s t were analyzed
i n the same fashion as was j u s t described f o r the low power test
specimens.
a. Direct Hydrogen Measurement
The d i r e c t measurement of hydrogen generat ion i n the loop
was shown i n Figure 10. These values were converted t o cc per
ft' using t h e same procedure described fo r t h e low power t e s t s
69

.
and t h e d a t a shown i n Figure 10.
but only three specimens were used i n t h e high power t e s t s . The
hydrogen genera t ion per square foo t of heated sur face i s shown
i n Figure 21. This curve has about t h e same slope as t h e auto-
c lave t e s t s .
The loop f l u i d mass was 15 kg
b. Str ipping of a Loop T e s t Specimen
The heat t r a n s f e r region of one of t h e specimens was s t r ipped;
the so lu t ion then analyzed f o r aluminum. The aluminum concentra-
t i o n was 57 ug/ml i n t h e s t r i p so lu t ion .
ca l cu la t ions and allowing f o r a pretreatment aluminum a t t ack of
28.6 mg/dm , t h e r e s u l t i n g hydrogen genera t ion f o r a 10 hour
Performing t h e same
2
2 t e s t was 42 cc H2 per f t . higher than t h e hydrogen measurement r e s u l t s shown i n Figure 21.
This i s about a f a c t o r of t h ree
The so lu t ion ana lys i s f o r t h e f i v e me ta l l i c elements i s con-
firmed by t h e weight change of t h e specimen during t h e s t r i p
operat ions. The ana lys i s was:
A1 57 Cd < 3 cu 6.8 Fe 6.3 N i 21 -
Tota l 95 pg/ml
This converts t o 213 mg of t h e metal oxides, which compares
favorably with t h e s t r i p weight change of 235 mg.
70

c. SDecimen Tes t Weight Change
The specimen weight change during t h i s t e s t appears t o s u f f e r
t h e same f a t e a s t h e low power test r e s u l t s . The weight changes
shown below i n d i c a t e s u b s t a n t i a l weight l o s ses presumably alum-
inum, when i n f a c t p r a c t i c a l l y no aluminum was found i n e i t h e r
t h e p o s t - t e s t loop so lu t ion o r i t s residue
Preox, w t Spec. No. mg/drn2 Test W t rng
10
17 21
28.6 0.2
2.0
-201
-102
-175
71

V I I I . CONCLUSIONS
The ob jec t ives of t h e program were t o determine t h e generat ion of
hydrogen caused by corroding aluminum under c e r t a i n condi t ions. These ob-
j e c t i v e s have been f u l f i l l e d and have been described i n the previous sect ions,
s p e c i f i c a l l y on Figure 20.
One s e t of conditions t h a t were analyzed represent power operat ion of
t h e 'IWMR and i n i t i a l shutdown.
t e s t s w i t h the r e s u l t s t y p i c a l l y i l l u s t r a t e d i n Figure 21. These r e s u l t s i n -
d i c a t e t h a t heat f l u x causes t h e hydrogen generat ion r a t e t o increase. The
g rea t e r t h e heat f lux , t h e higher t h e hydrogen generat ion r a t e . These r e s u l t s
were determined from a l imi t ed number of t e s t s and condi t ions but t h e s lopes
of the curves appear t o agree w i t h work done by o t h e r i n v e s t i g a t o r s .
These conditions were simulated i n the loop
A second s e t of condi t ions inves t iga t ed represented shutdown of the
TWMR f o r periods of time following periods of r e a c t o r operat ion. The auto-
clave t e s t s were used f o r t h i s phase, and t h e i r r e s u l t s were summarized by
the equation:
2 -2 T 3.44 ( t )0 .711 H generation, c c / f t = 1.32 x 10 (z) 2
Again it must be emphasized tha t a l imi t ed number of t e s t s were performed
and these r e s u l t s a r e by no means conclusive.
Treatment of aluminum t o e s t a b l i s h an oxide f i l m on the su r face p r i o r
t o subjecting t o t h e t e s t s conditions, proved successful and q u i t e valuable.
It was determined t h a t a treatment i n 350 F wet steam produced specimen weight
charge of about 15 mg/dm
generation per square f o o t of surface. T h i s f i l m i s adherent, s ince none
appeared t o break away during subsequent t e s t i n g . The use of a pretreatment,
f o r a system where t o t a l hydrogen generat ion could be c r i t i c a l , would mean
t h a t the i n i t i a l rapid corrosion r a t e s which generate l a r g e amounts of hydrogen
would be experienced p r i o r t o system operation. This would minimize hydrogen
generation during periods when it could not be t o l e r a t e d .
0
2 of surface which corresponds t o about 150 cc hydrogen
72

The preoxidation weight change d a t a ind ica t e s t h a t some f a c t o r such
as surface condi t ion may e f f e c t corrosion ra te . T h i s was indicated by the l a r g e
v a r i a t i o n i n sample weight changes i n samples preoxidized simultaneously f o r
t h e same l eng th of t i n e .
Whether the hydrogen generat ion i n t h e TWMR would be excessive as
determined by t h e r e s u l t s of t h i s program, would not absolutely be answered
I a t t h i s t i m e . The maximum allowable hydrogen generat ion f o r the TWMR based I
I upon condi t ions e s t ab l i shed by the NASA i s 164 cc H2 per f t 2 surface. Beyond
t h i s value, hydrogen w i l l leave the so lu t ion when system pressure i s reduced.
T h i s i s not t o l e r a b l e unless provis ion i s made f o r the removal of t h i s gaseous
hydrogen.
periods, t h i s condition could be reached i f the r e s u l t s of t h i s program a r e
used as a guidel ine. Since it i s necessary t o know whether o r not t h i s con-
d i t i o n w i l l be reached and i f so, how much gas w i l l be evolved, so t h a t equip-
ment can be properly sized, it i s recommended t h a t proof t e s t s a t a c t u a l TWMR
Depending upon the a c t u a l combination of power operat ion of the
73
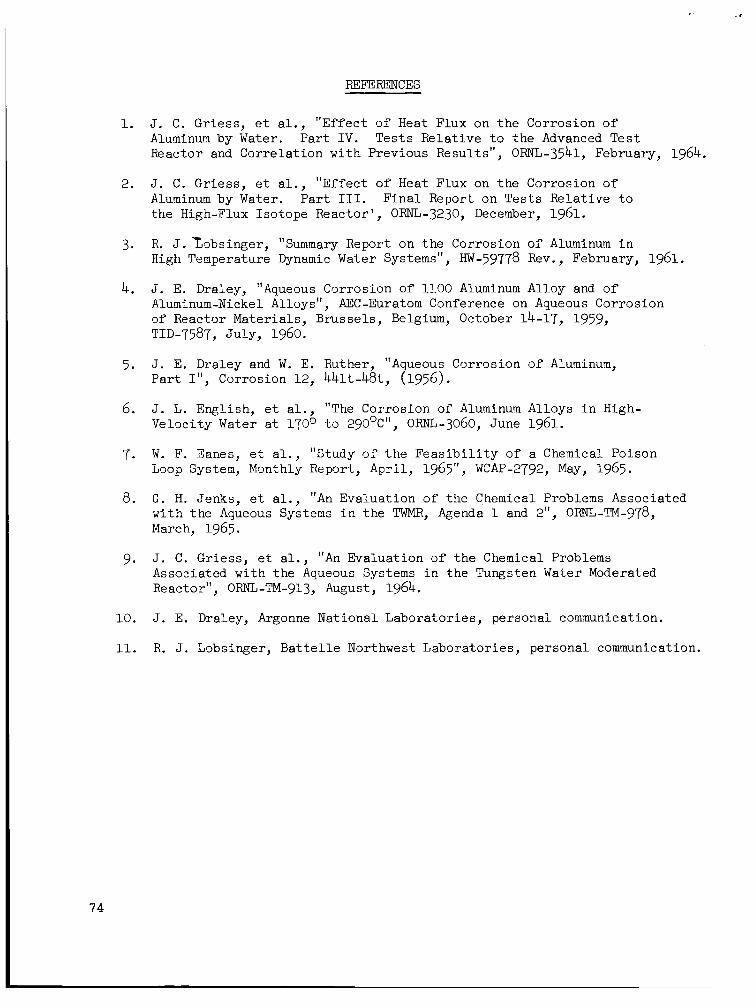
1. J. C. Griess, e t a l . , "Effec t of Heat Flux on the Corrosion of Aluminum by Water. Par t IV. Tests Relat ive t o the Advanced Test Reactor and Correlat ion with Previous Results", ORNL-3541, February, 1964.
2. J. C. Griess , e t a l . , "Effect of Heat Flux on t h e Corrosion of Alurninum by Water. Pa r t 111. F ina l Report on Tests Relat ive t o the High-Flux Isotope Reactor ' , ORNL-3230, December, 1961.
R. J . t o b s i n g e r , "Summary Report on t h e Corrosion of Aluminum i n High Temperature Dynamic Water Systems", HW-59778 Rev., February, 1961.
3.
4. J. E. Draley, "Aqueous Corrosion of 1100 Aluminum Alloy and of Aluminum-Nickel Alloys", AEC-Euratom Conference on Aqueous Corrosion of Reactor Materials, Brussels, Belgium, October 14-17, 1959, TID-7587, July, 1960.
5. J. E. Draley and W. E. Ruther, "Aqueous Corrosion of Aluminum, Pa r t I", Corrosion 12, 441t-48t, (1956).
6. J. L. English, e t al . , "The Corrosion of Aluminum Alloys i n High- Velocity Water a t 170" t o 29O"C", o m - 3 0 6 0 , June 1961.
7. W. F. Eanes, e t a l . , "Study of t h e F e a s i b i l i t y of a Chemical Poison Loop System, Monthly Report, A p r i l , 1965", WCAP-2792, May, 1965.
8. G. H. Jenks, e t a l . , "An Evaluation of the Chemical Problems Associated with the Aqueous Systems i n the TWMR, Agenda 1 and 2", Om-TM-978, March, 1965.
9. J. C. Griess, e t a l . , "An Evaluation of t h e Chemical Problems Associated with the Aqueous Systems i n the Tungsten Water Moderated Reactor", ORNL-TM-913, August, 1964.
10. J. E. Draley, Argonne National Laboratories, personal communication.
11. R. J. Lobsinger, B a t t e l l e Northwest Laborator ies , personal communication.
74

c
APPENDIX A
Analysis of Hydrogen i n Solut ion
The hydrogen generat ion r a t e can be d i r e c t l y measured during t h e loop and
autoclave tes ts by analyzing f o r the hydrogen content of the t e s t f l u i d
pe r iod ica l ly . I n the loop tests, small l iqu id samples, 25 t o 100 cc,
were ex t r ac t ed from the system f o r ana lys i s of hydrogen content and pH.
The sample container was a high pressure sample cy l inde r t h a t was valved
i n t o the t es t system. The sample was swept w i t h t h e appropriate gas
(Nitrogen o r Argon) depending upon the an t i c ipa t ed concentrat ion of
hydrogen.
A known quan t i ty of t h e mixture of swept gas and hydrogen was in j ec t ed i n t o
a F i she r Gas P a r t i t i o n e r , Model 25 where the thermal conduct ivi ty of t h e
mixture i s compared t o t h a t of the pure sweep gas. The s i g n a l generated
by the conduct ivi ty d i f f e rence i s recorded on a Minneapolis Honeywell
Brown Electronik Recorder 0-1 mv full sca le de f l ec t ion . The p a r t i t i o n e r
i s kept a t a constant temperature and i s regulated by a Fisher Constant
Current Supply, Model 28.
by t h e 5 ranges ava i l ab le on the P a r t i t i o n e r capable of sending 100, 50,
25, 10 o r 2$ of the s i g n a l depending upon the an t i c ipa t ed gas concentrat ion
and i t s conductivity.
The s i g n a l sen t t o the recorder can be control led
The system was ca l ib ra t ed with the following r e s u l t s using Argon sweep gas
f o r hydrogen d e t e c t ion :
P a r t i t ione r Max. H2 Min. Detectable Re pe a t ab i 1 it y Scale, $ Content, cc/@ L i m i t , CC/Q cc/kg
100
50
25
10
2
40 80
160
400 2000
0.2
0.4
0.8
2.0 10.0
0.2
0.4 0.8
2.0
10.0
With knowledge of t h e sample s ize , t h e injected sample s ize , and t h e system
c a l i b r a t i o n , the hydrogen content of the loop f l u i d was calculated.
75

APPENDIX B
Aluminum S t r ipp ing Procedure ( 6 0 6 1 - ~ 6 )
A. Solutions :
No. 1 - Saturated aqueous s o l u t i o n of b o r i c acid.
No. 2 - Aqueous so lu t ion of 4 w/o chromic acid ( C r O ) and 10 w/o 3 phosphoric acid ( H PO ). 3 4
B. Procedure:
1. P r e t r e a t piece t o be s t r ipped by immersing i n s o l u t i o n No. 1
(sa tu ra t ed b o r i c a c i d ) .
ma/cm
so lu t ion temperature of 25 C.
Apply an a l t e r n a t i n g cu r ren t of 11
against a platinum cathode f o r a period of 4 minukes 2
0
2. Rinse and immerse immediately i n so lu t ion No. 2 ( C r O + H PO ). 3 3 4 Apply a d i r e c t cu r ren t of 4.5 - 5.0 ma/cm2 against a platinum
anode f o r 60 minutes a t a s o l u t i o n temperature of 8ooc.
Rinse with demineralized water and alcohol, oven dry a t llO°C f o r one hour; cool and weigh.
3.
4. Repeat s teps 2 and 3 u n t i l t h e weight change due t o each
s t r i p p i n g i s near ly constant.
were found t o be s u f f i c i e n t f o r oxides formed i n 165 C water . )
1 (usua l ly 5 s t r i p p i n g s ( s t e p 2 ) 0
5. Specimens must be s t r ipped completely without i n t e r r u p t i o n t o
prevent excessive formation of oxide a t ambient temperature.
76
1 A new clean 6 0 6 1 - ~ 6 aluminum specimen was found t o l o s e on t h e o rde r o f 2.5 mg/dm2 t o t a l wi th t h i s method.
NASA-Langley, 1967 - 17 E-4046