corrosion performance of l80, l80cr1% and l80cr3%...
TRANSCRIPT

Corrosion performance of L80, L80Cr1%
and L80Cr3% steel grades in simulant
solution with carbon dioxide and
scaling
A dissertation submitted to The University of Manchester for the degree of Master of Science
in the School of Materials
2015
Luis Carlos Lozada
Corrosion Control Engineering MSc

I
Abstract
CO2 corrosion is a serious problem associated with the extraction of oil. The presence of
CO2 in well fluids could lead to sweet general corrosion where the use of L80 carbon steel
as production tubing is common. However, L80 is not resistant enough to mild sweet
environments creating a niche which is covered by variations of L80 steel grade such as
L80CR1 and L80Cr3.
In this paper, polarisation sweep and lineal polarisation resistance electrochemical
methods are used to evaluate the corrosion behaviour of three steels (L80, L80Cr1 and
L80Cr3) in two different solutions saturated with CO2. Surface analysis scanning electron
microscopy (SEM), energy dispersive X-ray (EDX) and X-ray diffraction (XRD) are used to
characterise the topography and identify the corrosion products.
The results show that the corrosion performance of L80Cr3, L80Cr1% and L80 are
remarkably diferent at the beginning of the buble experiment where the metallurgic
factors play the most important role to endure corrosion. However, when the corrosion
film is formed the corrosion rate of the three steels under study are in the same range
level.
For L80Cr3 the corrosion layer was more adherent, compact and uniform than the other
layers formed on the L80 and L80Cr1 metal surfaces. Finally, the SEM-EDX and XRD
analyses displayed the presence of siderite for the three steels under study. Additionally,
the L80Cr3 corrosion layer contained chromium layer species which could not be defined
by the XRD due to the roughness of the sample surface.
II
Declaration
This dissertation is a presentation of my original research work.
Wherever contributions of others are involved, every effort is made to
indicate this clearly, with due reference to the literature and
acknowledgment of collaborative research and discussions.
…..……………………
Luis C. Lozada

III
Acknowledgment
My sincere thanks goes to Dr Nicholas Stevens for his enormous, patient and
immense technical support during the different stages of this investigation.
My sincere thanks is also extended to all the staff in the Corrosion and Protection
Centre for their technical assistance.
I thank my lab mates and fellows for their unconditional encouragement and
friendship: Diego Landeta, Nick Tanawit, Nadiah Azwir, Firmandika Harda,
Masoud Nouri so on and so forth.
I take this opportunity to express gratitude to my parents who always support all
my projects; without their support I could not finish my dissertation.
I also place on record my sense of gratitude to the Ecuadorian government, which
has provided all that was necessary to finish my MSc.

IV
Dedicated
To
My daughter Sol Alejandra. She has provided the love, strength and inspiration for
me to complete this stage of my life. I have hope that she will realise that
education is a long journey with sacrifices, restraints, frustrations, experiences,
encouragements, joyfulness and triumphs. However, this way is a reliable one to
have a successful existence.

V
Table of Contents
1. Introduction and Aims ....................................................................................................1
2. Literature Review ............................................................................................................3
2.1. Corrosion .................................................................................................................3
2.1.1. Electrochemical corrosion....................................................................................4
2.2. Oilfield corrosion .....................................................................................................5
2.2.1. Types of corrosion in the oil field operation ........................................................6
2.2.1.1. Oxygen attack................................................................................................6
2.2.1.2. Sweet corrosion ............................................................................................7
2.2.1.3. Sour corrosion ...............................................................................................8
2.3. Carbon dioxide corrosion mechanism.....................................................................8
2.3.1. Factors affecting CO2 corrosion of carbon steel and low alloy steel ...................9
2.3.1.1. Effect of pH .................................................................................................10
2.3.1.2. Effect of temperature .................................................................................11
2.3.1.1. Effect of partial CO2 pressure......................................................................11
2.3.1.2. Effect of scaling tendency ...........................................................................12
2.4. OCTG materials for downhole applications ..........................................................14
2.4.1. Process of manufacturing and heat treatment required...................................15
2.4.2. Chemical composition of API steel grades. ........................................................16
2.4.3. Mechanical properties of API steel grades ........................................................18
2.5. Previous experiments ............................................................................................19
2.5.1. Corrosion behaviour of oil tube steel in simulant solution with hydrogen sulphide and carbon dioxide .............................................................................................19
2.5.1.1. Electrochemical measurements..................................................................19
2.5.1.2. Weight loss test...........................................................................................20
2.5.1.3. Analyses of corrosion scale and observations of corrosion forms .............21
2.5.2. Development of low alloyed carbon steel OCTG products for corrosive environments ....................................................................................................................21
2.5.2.1. Materials .....................................................................................................21

VI
2.5.2.2. CO2 corrosion resistance evaluation ...........................................................22
3. Project Plan and Experimental Programme..................................................................25
3.1. Objectives of the research.....................................................................................25
3.2. Experimental procedure ........................................................................................26
3.2.1. Introduction........................................................................................................26
3.3. Preparation of the samples for corrosion studies.................................................28
3.3.1. Sample preparation for electrochemical techniques ........................................28
3.3.2. Sample preparation and etching for metallographic examination....................28
3.4. Metallographic examination and chemical composition ......................................29
3.5. Solution composition.............................................................................................31
3.5.1. Solution A ...........................................................................................................32
3.5.1.1. CO2 – H2O open system at room conditions (Solution A)..........................32
3.5.2. Solution B ...........................................................................................................34
3.5.2.1. NaHCO3 -CO2-H2O system (Solution B) .....................................................35
3.6. Monitoring the corrosion rate...............................................................................37
3.6.1. Electrochemical bubble test setup.....................................................................37
3.6.2. Full polarisation curve (Tafel constants) ............................................................39
3.6.3. Linear polarisation resistance ............................................................................40
3.6.3.1. Corrosion rate measurements ....................................................................41
3.7. Post-test analyses ..................................................................................................41
3.7.1. Scanning electron microscopy and energy dispersive X-ray analysis ................41
3.7.2. X-ray diffraction analysis ....................................................................................43
4. Results and Discussion ..................................................................................................45
4.1. Visual examination ................................................................................................45
4.2. Metallurgical variables as a factor in the corrosion kinetic ..................................45
4.2.1. Chemical composition (EDX) ..............................................................................45
4.2.2. Metallographic Examination (Optical and SEM) ................................................47
4.2.3. Tafel constants ...................................................................................................49
4.2.4. Corrosion rate measurement: Solution A ..........................................................51
4.3. Corrosion film (scaling) as a factor in the corrosion kinetic ..................................52

VII
4.3.1. Corrosion rate measurement: Solution B ..........................................................52
4.3.2. Surface analysis (SEM-EDX) ................................................................................53
4.3.3. Surface analysis (X-ray diffraction analysis) .......................................................60
5. Conclusions ...................................................................................................................63
6. References.....................................................................................................................65

VIII
List of Figures
FIGURE 1 REFINING-CORROSION CYCLE FOR STEELS (AHMAD, 2006).......................................................................3
FIGURE 2 CORROSION CELL (AHMAD, 2006) ..................................................................................................................4
FIGURE 3 SWEET CORROSION PROPOSED MODEL (PPT, ROBERT LINDSAY; (DE WAARD AND MILLIAMS, 1975)
.......................................................................................................................................................................................9
FIGURE 4 SOLUBILITY OF IRON CARBONATE RELEASED DURING THE CORROSION PROCESS AT 2 BAR PPCO2
AT 40°C (KERMANI AND SMITH, 1997) ............................................................................................................... 10
FIGURE 5 THE EFFECT OF CO2 PPCO2 ON BARE STEEL CORROSION RATE, COMPARISON OF EXPERIMENTAL
RESULTS (POINTS) AND MODEL (LINE); 60°C, PH 5 (COTTIS, GRAHAM, LINDSAY AND OTHERS, 2010).. 11
FIGURE 6 CORROSION RATE VS TEMPERATURE INTO SWEET ENVIRONMENT (KERMANI AND MORSHED,
2003) ......................................................................................................................................................................... 13
FIGURE 7 CR CONTENT % AGAINST CORROSION RATE.............................................................................................. 18
FIGURE 8 EIS OF N80 STEEL IN SOLUTION WITH CONSTANT PARTIAL PRESSURE (1.700MPA) OF CO2 AND
DIFFERENT PARTIAL PRESSURES OF H2S AT (A) 1 H AND (B) 72 H................................................................. 20
FIGURE 9 MACROGRAPHS OF SURFACE OF N80 STEEL REMOVED CORROSION SCALE IN: (A) 1.700MPA CO2,
(B) 1.700MPA CO2 AND 0.010MPA H2S, (C) 1.700MPA CO2 AND 0.020MPA H2S .................................... 21
FIGURE 10 FULL POLARISATION SWEEPS FOR PRE-CORRODED SAMPLES, 60°C (MORALES ET AL., ND) 23
FIGURE 11 SURFACE APPERANCE OF CORROSION FILMS, SEM 250X (MORALES ET AL., ND) ............................ 24
FIGURE 12 EXPERIMENTAL PROCEDURE SUMMARY ................................................................................................. 27
FIGURE 13 WORKING ELECTRODE (GRITTED SAMPLE) .............................................................................................. 28
FIGURE 14 SCHEMATIC DIAGRAM OF THE EXPERIMENTAL SET UP. ....................................................................... 38
FIGURE 15 EXPERIMENTAL SETUP: A) BUBBLE TEST ONE CELL, B) BUBBLE TEST WITH WATER BATH FOR
THREE CELLS............................................................................................................................................................. 38
FIGURE 16 POLARIZATION BEHAVIOUR OF THE METAL IN IDEAL DEAERATED SOLUTION ................................. 39
FIGURE 17 SEM-EDX BASIC SCHEME (HAFNER, 2007) ............................................................................................... 42
FIGURE 18 X-RAY TUBE DEVICE SCHEME (NELSO N, 2014) ........................................................................................ 43
FIGURE 19 EDX ANALYSIS L80CR3.................................................................................................................................. 46
FIGURE 20 MICROSTRUCTURE OF THE STEEL UNDER STUDY (OPTICAL MICROSCOPY AND SEM) .................... 47
FIGURE 21 OPTICAL MICROSTRUCTURE OF THE STEEL UNDER STUDY .................................................................. 48
FIGURE 21 ANODIC TAFEL EXTRAPOLATION: L80 POLARIZATION CURVE IS THE CONTINUOUS RED LINE,
L80CR1 POLARIZATION CURVE IS THE CONTINUOUS BLUE LINE, L80CR3 POLARIZATION CURVE IS THE
CONTINUOUS GREEN LINE, L80 TAFEL EXTRAPOLATION IS THE DASH RED LINE, L80CR1 TAFEL
EXTRAPOLATION IS THE DASH BLUE LINE, L80CR3 TAFEL EXTRAPOLATION IS THE DASH GREEN LINE.. 50
FIGURE 22 LPR RESULTS, SAMPLES SUBMERGED INTO SOLUTION A: A) RESISTANCE POLARISATION, B)
CORROSION RATE ................................................................................................................................................... 51

IX
FIGURE 23 LPR RESULTS, SAMPLES SUBMERGED INTO SOLUTION B: A) RESISTANCE POLARISATION, B)
CORROSION RATE ................................................................................................................................................... 52
FIGURE 24 SEM IMAGES OF SURFACE APPEARANCE OF CORROSION FILMS AFTER 120 HOURS SUBMERGED
INTO SOLUTION B AT 80°C: A) 100X, B) 270X AND C) 500X ............................................................................ 54
FIGURE 25 L80 SURFACE ANALYSES OF TEST CONDUCTED IN SOLUTION B AT 80°C: A) MICROGRAPHS OF
CORROSION PRODUCT 500X, B) EDX ANALYSIS ............................................................................................... 55
FIGURE 26 L80CR1 SURFACE ANALYSES OF TEST CONDUCTED INTO SOLUTION B AT 80°C: A) MICROGRAPHS
OF CORROSION PRODUCT 500X, B) EDX ANALYSIS ......................................................................................... 56
FIGURE 27 L80CR3 SURFACE ANALYSES OF TEST CONDUCTED INTO SOLUTION B AT 80°C: A) MICROGRAPHS
OF CORROSION PRODUCT 500X, B) EDX ANALYSIS ......................................................................................... 57
FIGURE 28 TYPES OF CORROSION PRODUCTS OVER L80CR3 METAL SURFACE: (A) IRON CARBONATE SCALE
PRECIPITATED ON CARBON STEEL SAMPLES AT 75°C EXPOSED TO A SOLUTION AT PH 6.30 AT 1 BAR
CO2 SHOWING A SOMEWHAT CUBIC APPEARANCE, MAGNIFICATION: X6,000 (KERMANI AND
MORSHED 2003); (B) SURFACE APPEARANCE OF CORROSION FILMS, STEEL WITH 3%CR AT 60°C, SEM,
250X (MORALES ET AL., ND) .................................................................................................................................. 57
FIGURE 29 EDX MAPPING FOR SURFACE APPEARANCE OF CORROSION FILMS AFTER 120 HOURS
SUBMERGED INTO SOLUTION B AT 80°C (X500) ............................................................................................... 59
FIGURE 30 XRD SPECTRUM MADE AFTER THE BUBBLE TEST A) XRD SPECTRA FOR L80, B) XRD SPECTRA FOR
L80CR1 AND C) ........................................................................................................................................................ 61

X
List of Tables
TABLE 1 PROCESS OF MANUFACTURING AND HEAT TREATMENT (ISO 11960, 2010)......................................... 16
TABLE 2 CHEMICAL COMPOSITION, API STEEL GRADES (MASS FRACTION %) (ISO 11960, 2010) ..................... 17
TABLE 3 TENSILE AND HARDNESS REQUIREMENTS FOR API STEEL GRADES ......................................................... 19
TABLE 4 EFFECT OF SURFACE CONDITION ON CORROSION RATE, 60°C (MORALES ET AL., ND) ....................... 23
TABLE 5 MANUFACTURING PROCESS OF L80, L80CR1 AND L80CR3 ....................................................................... 30
TABLE 6 MECHANICAL PROPERTIES OF THE THREE STEELS UNDER STUDY ........................................................... 31
TABLE 7 CONCENTRATION EQUILIBRIUM CONSTANTS RELATING CO2 EQUILIBRIA AT 25°C AND 1 ATM........ 33
TABLE 8 CONCENTRATION SPECIES IN SOLUTION A .................................................................................................. 34
TABLE 9 SANDERS’ BRINE COMPOSITION .................................................................................................................... 34
TABLE 10 CONCENTRATION EQUILIBRIUM CONSTANTS RELATING CO2 EQUILIBRIA AT 80°C AND 1 ATM ..... 35
TABLE 11 CONCENTRATION SPECIES IN SOLUTION B ................................................................................................ 37
TABLE 12 CHEMICAL CO MPOSITION OF L80, L80CR1, L80CR3................................................................................. 45

1
1. Introduction and Aims
CO2 corrosion is by far the predominant form of corrosion in oil/gas production which has
the potential to become serious and costly if its impact is not fully appropriate for the
control measures specified and implemented (Ahmad, 2006).
Dry carbon dioxide is non-corrosive to carbon steel in downhole conditions but it
becomes a corrosive species when it dissolves into the produced or condensed water
forming a weak acid H2CO3 (Garverick, 1994). Additionally, it can result in very high
corrosion rates, particularly where corrosion becomes localised. (Jordan and Rhodes,
1995).
The two most common methods used to control CO2 corrosion are: treatment of the
corrosion environment (inhibitors) and changing the composition of the metal to improve
its corrosion resistance (material selection). In some cases inhibitors cannot be used
because their inhibitor efficiency is low. This is the case for production tubing where the
method to control CO2 corrosion is the correct material selection for many oil extraction
operations.
The L80 API steel is the most common metal used as production tubing since it is cheap
and easily available. However, L80 is not resistant enough against CO2 environments
compared to stainless steel. Therefore, the metallurgical industry has developed new
categories of low C and Cr-containing steels (L80Cr1, L80Cr3) with superior resistance to
CO2 corrosion than L80. These new steels are commercial variations of L80 steels which
are economical choices where corrosion resistance alloys CRA are not economically
justified in low or mild CO2 environments (Kermani and Morshed, 2003).
According to Kermani and Smith (1997), small quantities of chromium (0.5 wt% to 3wt%)
can improve the corrosion resistance of low-alloy steels in environments containing CO2
because chromium promotes the formation of a stable chromium containing oxide film.
Moreover, Kermany and Morshed (2003) established that adding 3%Cr in the composition
of the steel can offer a 10-times reduction in the corrosion rate.
Additionally, Morales et al. (ND) showed that the difference between steel with 3%Cr,
1%Cr and carbon steel performance remarkably increased when a corrosion product film

2
is formed. Additionaly, they showed that the 3%Cr corrosion product film is more regular
and adherent than formed in the other two steels.
Hence, CO2 corrosion is a general problem in the oil/gas industry and the application of
either carbon steel or low alloy steel depends to a large degree on two factors: the
formation of protective corrosion product films and the metallurgical factors which can
improve the corrosion resistance of the steels. Local breakdown of corrosion films (scale)
may result in rapid local pitting. Moreover, CO2 corrosion of low alloy steels in oil and gas
production represents active areas of corrosion research (Dugstad, 1998).
Even though extensive research through many years has been performed to understand
sweet corrosion and predict corrosion rates, the mechanism by which CO 2 corrosion
occurs under scaling condition with either low or high corrosion rates is not yet clear
(Morales et al., ND, Kopliku et al., 2000, Ren et al., 2005).
This work attempts to investigate the influence of metallurgical variables and protective
layers formed by corrosion products, which affect the corrosion kinetics. Three different
steel samples (L80, L80Cr1 and L80Cr3) will be used in this investigation under sweet
environment conditions.
Metallurgical variables include the chemical composition and microstructure of steels ,
which play an important role either in promoting or hindering general CO 2 corrosion.
Protective layers which are formed by the precipitation of insoluble salts can play an
important role in limiting the corrosion rate in sweet environments.
To determine the performance of the three steels under sweet corrosion the following
objectives should be completed:
Prior sample analysis including visual examination, chemical composition and
metallographic examination will be performed in the steels under study.
An assessment of the corrosion of the steels under study in two solutions with
carbon dioxide which simulates the formation of brine.
Electrochemical techniques including open circuit potential measurement, full
polarisation sweeps and linear polarisation resistance measurements will be used
to provide information about the corrosion rate.
Post-test analyses will be used in order to know the morphology, topography and
nature of the corrosion product species on the corroded sample surfaces.

3
2. Literature Review
2.1. Corrosion
Many definitions of corrosion have been presented over time; however, many of them
consider that corrosion is material degradation as a result of the interaction between
metal and the environment (Ahmad, 2006).
According to Chilingar et al. (2013), degradation of metals by corrosion occurs by two
processes:
a) In a dry environment at high temperatures, metal degradation is direct (chemical
attack).
b) In water (wet/moist environment) at relatively low temperatures, metal
degradation is by electrochemical process.
Ahmad (2006) pointed out that corrosion is an extractive metallurgy in reverse and he
used steel as an example of his steel degradation theory, which is shown in Figure 1.
Figure 1 Refining-corrosion cycle for steels (Ahmad, 2006)
From Figure 1 it can be seen that steel has a life cycle; it starts with hematite (Fe2O3),
which is an iron oxide found in nature. To produce steel, energy is added to the oxide
(heat) with allowing elements (C, Si, Cr, etc.). Once steel is produced the corrosion
process initiates since hematite is much more stable than steel. Therefore, steel has
internal energy which should be released. The way that steel releases that energy is called
a corrosion process. The steel product of the corrosion process is rust, which has a similar
composition to hematite (Ahmad, 2006). Moreover, thermodynamic laws say there is a
tendency for metals which have high energy states to transform to low energy states
(Revie, 2008).

4
2.1.1. Electrochemical corrosion
The basic wet corrosion cell should be known to understand electrochemical corrosion.
Figure 2 shows a basic wet corrosion cell which should be visualised as either two
dissimilar or similar metals placed into an electrolyte (solution). The two metals are
electrically connected.
Figure 2 Corrosion cell (Ahmad, 2006)
Additionally, electrochemical corrosion reactions can be thought of in terms of a
corrosion cell, which is formed out of four essential components: anode, cathode,
electrolyte and metallic path (Ahmad, 2006). The electrochemical corrosion involves the
effects of mass transfer and charge. Mass is transferred from the metal to the electrolyte
and vice versa, while charge is transferred between the atoms and ions (Trethewey and
Chamberlain, 1995).
- Anode is a metal inserted into an electrolytic cell; it should be a more reactive
metal than the cathode. Electrons are rejected from the anode. Those electrons
are insoluble in the electrolyte and they should move through the metallic path
into the cathode. Anodic reaction is expressed by the simplest electrochemical
reaction (Trethewey and Chamberlain, 1995) :
Where M represents a metal, z is the electrons taken from each atom and it is
ruled by the valency of the metal.
- Cathode consumes the electrons generated by the anode; it does not corrode
because its material is less reactive (higher electronegative potential) than the
anode. Cathodic or reduction reaction must consume electrons in the surface of

5
the metal cathode. The main reduction reactions which occur in the surface of the
cathode are (Ahmad, 2006):
Hydrogen evolution:
Oxygen reduction is the process which consumes dissolved oxygen to produce
hydroxyl ions:
- Electrolyte should be an electrically conducting solution to move ions and charge.
Ions dissolve from the metal anode and thus carry positive current away from it,
through the aqueous electrolyte (Ahmad, 2006).
- Metallic path or electrical connection, anode and cathode require to be connected
for current flow. Metals are paths for the flow of electrons, current flows from (+)
to (-) and electrons in the opposite direction. When the anode and cathode are
the same metal they do not need an electrical path obviously (Trethewey and
Chamberlain, 1995).
As a general rule, the removal of any component of the corrosion cell will stop
material degradation by electrochemical reactions (Trethewey and Chamberlain,
1995).
2.2. Oilfield corrosion
Corrosion is a potential hazard associated with all the stages of oil/gas production and
transportation. Aqueous phase is directly associated with oil and gas environments. The
corrosivity of this aqueous phase is proportional to the concentration of dissolved gases
and the water chemistry such as carbon dioxide, hydrogen sulphide, brine, bicarbonates,
and sulphates, to mention some of them (Kermani and Smith, 1997).
Corrosion should be defined in terms of corrosive environment, because all environments
are corrosive to some degree. The following list shows the main corrosive environments
in the oilfield industry (Ahmad, 2006):
Air and humidity
Reservoir water, fresh, distilled, salt and marine water

6
Steam and gases, like chlorine
Ammonia
Hydrogen sulfide
Sulfur dioxide and oxides of nitrogen
Acids
Alkalies
Soils
Even though many parameters are used to define an aggressive environment, the
following list shows the main factors that influence the corrosion rate (Heidersbach,
2010):
CO2 partial pressure
H2S partial pressure
pH
Fluid temperature
Water chemistry (ionic concentration chloride)
Water cut
Fluid dynamics (flow velocity, turbulence and erosive agents)
Gas/oil ratio
2.2.1. Types of corrosion in the oil field operation
This section aims to discuss some forms of corrosion commonly found in oil/gas tubing
production.
2.2.1.1. Oxygen attack
Even though dissolved oxygen is not typically present at depths more than 100m below
the surface, oxygen attack refers to pitting corrosion due to the presence of oxygen in
inadequate treatment of injection waters that were exposed to oxygen–air in topside
processing and storage (Garverick, 1994); (Kermani, 2004).
Oxygen is a strong oxidant, so that low concentrations of diss olved oxygen can be
detrimental for carbon steel performance. Moreover, oxygen has low solubility in

7
water/brine which promotes conditions in which oxygen mass transport controls the
corrosion kinetic. At stagnant conditions, oxygen has dissolution of 7–8 ppm into water
which may provoke a corrosion rate of 0.25 mm/year. Additionally, in a turbulent system
it can provoke a corrosion rate of above 15 mm/year (Eurocorr, 1999).
The following electrochemical equations represent the anodic and cathodic reactions for
oxygen corrosion (Heidersbach, 2010):
Fe ➝ Fe2+ + 2e- (anode)
O2 + 2H2O + 4e- ➝ 4 OH- (cathode)
In order to control oxygen corrosion some treatments are used such as mechanical de-
aerator, oxygen scavenge and oxygen inhibitors. In high concentrations of oxygen, the
mechanical de-aerator is used to reduce oxygen concentration before the use of oxygen
scavengers which cannot work properly if the oxygen concentration is still high.
Usually, counter current gas stripping towers are used in offshore operations. After
mechanical de-aeration, the oxygen scavenger is used to remove the last traces of oxygen
up to 10 ppb. The most used oxygen scavengers are: sodium sulphide, sodium bisulphite
ammonium bisulphite and hydrazine (Garverick, 1994); (Bardal, 2004).
2.2.1.2. Sweet corrosion
Sweet corrosion is by far the predominant form of corrosion in oil/gas production. Carbon
dioxide corrosion is known as sweet corrosion.
Dry carbon dioxide is non-corrosive to carbon steel in downhole conditions but it
becomes corrosive specie when it dissolves into the produced or condensed water
forming a weak acid H2CO3 (Garverick, 1994). Additionally, it can result in very high
corrosion rates, particularly where it becomes a localised attack.
CO2 corrosion is typically controlled by using corrosion inhibitors ; however, inhibitors
become ineffective as the downhole temperatures and pressures increase (Heidersbach,
2010).
Roughly, the corrosion severity increases for high CO2 partial pressure, flow velocity,
water content, and low pH.

8
2.2.1.3. Sour corrosion
Corrosion due to contact between hydrogen sulphide and wet area surface is named sour
corrosion. Hydrogen sulphide is not corrosive by itself but it becomes very aggressive in
existence with water. The general chemical for sour corrosion equation is expressed
(Chilingar et al., 2013):
H2S + Fe + H2O→ FeSX + 2H H2O
The corrosion products of sour corrosion tend to form iron sulphide scales which are
cathodic with respect to steel surface where corrosion takes place. Commonly, sour
corrosion provokes a deep pitting on the steel surface. Moreover hydrogen sulphide can
embrittle the steel causing catastrophic damage; this phenomenon causes a sulphide
stress cracking (SCC).
2.3. Carbon dioxide corrosion mechanism
CO2 corrosion of carbon steel and low alloy steel is a complex phenomenon and scientists
are still working to develop a realistic and practical model. The following electrochemical
reactions are proposed by de Waard and Milliamit. They pointed out that carbonic acid
H2CO3 is directly reduced at the metal surface (Kermani and Morshed, 2003).
- CO2 dissolution and carbonic acid formation
CO2(g)CO2(aq)
H2O + CO2 H2CO3
- Carbonic acid dissociation
H2CO3 H+ + HCO3-
- Anodic reaction
Fe Fe2++ 2e-
- Cathodic reactions
H2CO3 + e- H + HCO3-
2H+ + 2e- H2 (g)

9
- Global reaction
Fe2++ 2 H2CO3 FeCO3 + H2 (g)
A more complete description of the process is presented in the following scheme of
electrochemical reactions (De Waard and Milliams, 1975).
Figure 3 Sweet corrosion proposed model (PPT, Robert Lindsay; (De Waard and Milliams, 1975)
2.3.1. Factors affecting CO2 corrosion of carbon steel and low alloy steel
The severity of carbon dioxide corrosion of carbon and low alloy steels is influenced by a
number of factors, including environmental, physical, and metallurgical variables . The
following list shows the main parameters affecting sweet corrosion (Kermani and
Morshed, 2003):
- pH
- CO2 content
- Pressure
- Temperature
- Water content (water cut) and water chemistry
- Flow velocity and type
- Scale and corrosion deposits
- Presence of H2S, oxygen and organic acids

10
- Steel composition and microstructure
2.3.1.1. Effect of pH
pH is one of the most important factors in the corrosion of carbon/alloy steels because it
affects both the electrochemical reactions and the formation of corrosion products and
other scales (Eurocorr, 1999).
According to (Richardson et al., 2010), “Typical pH in CO2 saturated condensed water is
about pH 4 while in buffered brines, one frequently encounters 5<pH<7. At pH 4 or
below, direct reduction of H+ ions’ reaction is important particularly at lower partial
pressure of CO2, when direct reduction of carbonic acid reaction, can be ignored. In this
case, the pH has a direct effect on the corrosion rate” . On the other hand, higher pH
promotes the solubility of FeCO3 which could reduce the corrosion rate.
Figure 4 Solubility of iron carbonate released during the corrosion process at 2 bar ppCO2 at 40°C (Kermani and
Smith, 1997)
As illustrated in Figure 4, pH has a dominant effect on the formation of corrosion films
due to its effect on the solubility of iron carbonate. The solubility of corrosion products
affects just five times when pH is increased from 4 to 5. In contrast, it changes by 100
times when it rises from 5 to 6, because the lower solubility gives much higher FeCO3
supersaturation on the steel surface and accelerates the scaling deposition known as
corrosion products’ precipitation (Kermani and Smith, 1997).
Making a higher pH is call pH stabilising and is a technique used to control the corrosion
rate. However, this technique can stimulate excessive scaling in a formation water
system, which can block piping systems (Richardson et al., 2010).

11
2.3.1.2. Effect of temperature
Corrosion of carbon and low alloy steels in wet CO2 environments can form carbonate as
a reaction product. At higher temperature (80°C) the iron carbonate solubility is
decreased so that scale is formed on the metal surface.
Some authors pointed out that the initial rate of uniform corrosion increases up to 70–
90°C and above this temperature the corrosion rate starts to decline. As mentioned
before, more protective scale results due to a decrease in the iron carbonate solubility to
endure metal degradation. Therefore, the corrosion rate is controlled by the diffusion
process as a determining step for sweet corrosion (Kermani and Smith, 1997);
(Abayarathna et al., 2005); (Li et al., 2008).
2.3.1.1. Effect of partial CO2 pressure
If there is not any scale, increasing the partial pressure of CO2 increases the corrosion
rate, as well. Because of increasing the CO2 partial pressure, the concentration of H2CO3
promotes the cathodic reaction which increases the corrosion rate. The following
equation represents the cathodic reaction:
2H2CO3 + 2e- H2 + 2HCO3
-
Figure 5 The effect of CO2 ppCO2 on bare steel corrosion rate, comparison of experimental results (points) and model
(line); 60°C, pH 5 (Cottis, Graham, Lindsay and others, 2010)
Figure 5 illustrates that by increasing CO2 partial pressure the corrosion rate increases, as
well. However, this tendency is up to 10 bar, approximately, because other conditions can
be favourable for scaling layers’ formation, even increasing ppCO2. For instance, at high

12
pH, increasing ppCO2 promotes higher concentration of bicarbonate and carbonate ion
which lead to super-saturation for precipitation of corrosion products (Richardson et al.,
2010).
2.3.1.2. Effect of scaling tendency
Scale formation, which is the precipitation of an insoluble salt, can play an important
role in the decline of the corrosion rate in sweet environments.
Scaling formation is a very important parameter to protect the steel and it depends
on the supersaturation of its specie components. The following equation shows the
supersaturation for an insoluble salt (AB) (Kermani and Morshed, 2003):
AB = A+ + B-
Supersaturating = log [A+][B-]/KSP
Where A+ and B- are ionic species and KSP is the solubility product (Kermani and
Morshed, 2003).
High concentration of ionic species A+ and B- promote precipitation of the corrosion
film and layer which protect the bulk material as a barrier; the following are some
effects of this film:
- Promotes a diffusion barrier between the bulk material and corrosive fluid. Ionic
species (M+) cannot be transferred, which reduces the corrosion rate.
- The layer formed has low porosity which is above the metal surface, providing less
area to be corroded.
- “Creation of a concentration gradient of the principal chemical species (Fe++ and
HCO3-). Ingress of solution to soak the porosity leads to steep concentration
gradients, which may induce a significant shift of the local pH and water chemistry
from the bulk conditions, and therefore a genuine effect of liquid surface state.”
(Kermani and Morshed, 2003)
There are some conditions which promote the formation of a protective iron
carbonate scale (Garverick, 1994):

13
- High temperature decreases scale solubility and CO2 solubility, so that high
temperature favours precipitation kinetics of carbonate scales.
- High pH carbonate scale will form on metal surface (decreased solubility and
reducing [H+]).
- In stagnant condition system (non-turbulence).
Dependence on temperature is complex because temperature influences the nature and
characteristics of surface films (i.e. corrosion products) which influence corrosion. The
uniform corrosion rate tends to increase up to a certain temperature (around 60–100°C
depending on the other conditions), and then decrease (see Figure 6) (Kermani and
Morshed, 2003).
On the other hand, propensity to pitting tends to be higher at higher temperatures
(Jordan and Rhodes, 1995).
Figure 6 Corrosion rate vs temperature into sweet environment (Kermani and Morshed, 2003)
The reason for this disagreement on general and localised corrosion is that corrosion
deposits could mitigate the impact of uniform corrosion by acting as protective or semi
protective layers. However, their presence could promote localised corrosion if it gets
damaged by flow or other agents, either mechanical or chemical (Jordan and Rhodes,
1995).

14
It is always important to have in mind that “CO2 corrosion of carbon and low alloy steels is
strongly dependent on the surface films formed during the corrosion process. A balance
between the formation and destruction of protective film governs the corrosion progress
and determines whether localized or uniform corrosion will take place” (Kermani and
Morshed, 2003).
2.4. OCTG materials for downhole applications
Oil country tubular goods (OCTG) are a family of welded and seamless pipes consisting of
casing, tubing and drill pipe used inside the oil–gas well including:
Casing: pipe serving as structural retainer for the walls of the well. According to
ISO 11960, the casing is manufactured in sizes ranging from 115 to 500 mm (4½ to
20 inches) in outside diameter.
Tubing: pipe placed inside the well and used to produce or to inject fluids.
According to ISO 11960, the tubing is produced in sizes from 26 to 114 mm (1.05
to 4.50 inches) in outside diameter, and several weights per foot.
Drill pipe: pipe used to drill to make the bore hole by transmitting power from the
surface to a rotary drilling tool. Drill pipes are manufactured in sizes ranging from
60 to 170 mm (2 3/8” to 6 5/8”) in outside diameter.
Accessories: tubular pieces to provide mechanical or pressure integrity within the
pipe string. Most of the cases are a tubular joint between two pipes.
The most important international standard for casing, tubing, coupling stocks and
accessories for the OCTG industry is the ISO 11960 “Petroleum and natural gas
industries—Steel pipes for use as casing or tubing for wells”. This specification is reviewed
every four years and through time some grades were deleted, other ones incorporated,
and few of them have change the actual designation (ISO 11960, 2010).
In this standard steel grades are designated by a prefix letter without special meaning and
the minimum yield strength (KSI). For instance, for the steel grade N80, the N letter does
not have a meaning, while 80 means 80 (KSI) of minimum yield strength (ISO 11960,
2010).
The steel are classified in four main groups (Mack, 2005):

15
Group 1 (H, J, K, N and R grade steels): It covers the low strength material and has no
corrosion resistance for sour environment.
Group 2 (M, L, C, and T grade steels): These pipes can be used in environments containing
H2S for corrosion resistance. According to ISO 11960 (2010), a strict process control is
required since the allowed yield strength range is reduced by 50% compared to Group 1.
Group 3 (P grade steel): High strength steel grade but it cannot be used in sour
environments.
Group 4 (Q grade steel): Very high strength steel grade but it cannot be used in sour
environments.
2.4.1. Process of manufacturing and heat treatment required
Steel pipes can be manufactured by the seamless process or by welding steel plates into a
rounded shape, depending on the steel grade. Some require no special heat treatment
whereas for others it is mandatory to produce those using specific heat treatment and/or
manufacturing process (ISO 11960, 2010).
This paper is focused on the API steel grades commonly used like production tubing. L80,
L80Cr1 and L80Cr3 steels are used as production pipe in many operations containing
carbon dioxide and hydrogen sulphide. Even though L80Cr1, L80Cr3 and L80 have the
same yield strength, they have different features which can allow them or not to endure a
sour environment. Regarding environments containing carbon dioxide, there are not any
standards which recommend or give advice to select API steel grades for sweet corrosion.
Table 1 shows API steel grades with their process of manufacturing and heat treatment.
L80 and N80 steel grades can be manufactured by seamless process (S) or electric welded
process (EW). In most of the cases if the steel will be used as tubing, it would be
manufactured as seamless pipe. Concerning heat treatment, L80 type 1 full-length heat
treatment is mandatory quenching and tempering (Q&T). Moreover, for L80 steel grade a
minimum tempering temperature is mandatory (566°C) (ISO 11960, 2010).

16
Table 1 Process of manufacturing and heat treatment (ISO 11960, 2010)
2.4.2. Chemical composition of API steel grades.
Table 2 displays the chemical composition min/max % of elements allowed in API steel
grades. The chemical composition range, though established by the standard, provides a
very wide range. The limits of the main alloying elements are stated, as well as the
maximum acceptable for residual elements.
L80 steel is carbon steel-based. For L80 type 1 steel is stated as a maximum acceptable
residual element for P and S of 0.030 mass fraction percentage. For L80 steel it is stated a
maximum percentage of C, Mn, Ni, and Cu of 0.45, 1.9, 0.25, and 0.35 mass fraction
percentage, respectively (ISO 11960, 2010).

17
Table 2 Chemical composition, API steel grades (mass fraction %) (ISO 11960, 2010)
It is common to find more than one steel design to comply with each grade, and that is
the case of the low alloy steels L80 Cr1 and L80 Cr3, which fulfil all API requirements for
L80 type 1 steel grades. However, their chemical composition is better in order to support
sweet environments. These low alloy steels were created as a response to economic
factors where the range of pp CO2 is too low to use corrosion resistant alloy steels (CRA)
(Kermani and Smith, 1997).
Therefore, each pipe manufacturer defines the actual chemical composition for API steel
grades (L80Cr1, L80Cr3) provided that steel grades fulfil API requirements (chemical and
mechanical), so the pipes supplied by different manufacturers can be designated with the
same grade though they may differ in the chemical composition and actual mechanical
properties (Tenaris, 2015).
According to Kermani and Smith (1997), small quantities of chromium (0.5 wt% to 3wt%)
can improve the corrosion resistance of low-alloy steels in environments containing CO2
because chromium promotes the formation of a stable chromium oxide film.

18
Figure 7 Cr content % against corrosion rate
Figure 7 shows the chromium content influence over corrosion kinetic. Increasing the
chromium content improves the corrosion resistance in a sweet environment. “Cr — An
optimum Cr content had a significant beneficial role on the CO2 corrosion performance of
the steels” (Kermani and Morshed, 2003).
2.4.3. Mechanical properties of API steel grades
Table 3 displays the minimum requirements for mechanical properties regarding strength
and hardness. The main differences between the four groups are (Tenaris, 2015):
Yield strength range: 30 KSI for grades that will not be used in corrosive
environments.
Yield strength range: 15 KSI for wells where there will be the presence of H2S.
A maximum acceptable hardness is stated in order to guarantee the corrosion
resistance properties. In order to guarantee homogenous heat treatment for high
strength material it is also requested that the hardness variation through the wall
thickness should be within a certain range for steel grades intend to be used in
sour conditions.

19
Table 3 Tensile and hardness requirements for API steel grades
2.5. Previous experiments
2.5.1. Corrosion behaviour of oil tube steel in simulant solution with hydrogen
sulphide and carbon dioxide
Ren et al. (2005) conducted several experiment using electrochemical measurement
techniques, X-ray diffraction (XRD) and scanning electron microscopy (SEM), to
investigate the corrosion behaviour of N80 API steel grade in simulant static condition
with CO2 and H2S at 100°C. When the partial pressure of H2S was small, sweet corrosion
accelerated. When partial pressure of H2S was incremented to 0.01MPa general
corrosion declined but pitting attack was found.
2.5.1.1. Electrochemical measurements
Coupons were made of N80 steel grade, polished and degreased before being used in
electrochemical measurement.

20
The simulant solution consisted of CaCl2, 50.5 g L−1, MgCl2, 15.4 g L−1, and NaCl, 20.5 g L−1.
In order to avoid oxygen in the simulant solution nitrogen was used to purge the solution.
The experiments were carried out using an autoclave; the pressure was 34.44 MPa at
100°C. A Three electrodes cell system was used to perform electrochemical impedance
spectroscopy and potentiodynamic polarisation measurements.
The carbon dioxide and hydrogen sulfide were injected into the autoclave. The partial
pressure of CO2 was 1.700MPa, the partial pressure of H2S ranged from 0 to 0.020MPa. All
tests were operated in a static medium (Ren et al., 2005).
Figure 8 EIS of N80 steel in solution with constant partial pressure (1.700MPa) of CO2 and different partial pressures
of H2S at (a) 1 h and (b) 72 h
Figure 8 shows the electrochemical impedance spectroscopy EIS measured in simulant
solution 1700MPa CO2 and different partial pressures of H2S. The shape and size of these
measurements depends on the ppH2S. It is known that the corrosion scale plays an
important role in the corrosion rate. “The addition of H2S made the inductive loop
disappear in EIS and the reaction resistance Rt became small with increasing H2S partial
pressure” (Ren et al., 2005).
2.5.1.2. Weight loss test
The size of the samples were 30mm×30mm×3 mm. Before being immersed into the
simulant solution the samples were weighed. After 72 hours in the solution the

21
specimens were removed. The corrosion products were removed and finally the samples
were weighed again in order to calculate the general corrosion rate (Ren et al., 2005).
2.5.1.3. Analyses of corrosion scale and observations of corrosion forms
XRD was used to determine the chemical compositions and their relative weight content.
Iron carbonate and cementite were found as part of the corrosion products in sweet
corrosion. On the other hand, there was also the addition of H2S produced mackinawite
(FeS1−x) and pyrrhotite (FeS1+x).
Figure 9 Macrographs of surface of N80 steel removed corrosion scale in: (a) 1.700MPa CO2, (b) 1.700MPa CO2 and
0.010MPa H2S, (c) 1.700MPa CO2 and 0.020MPa H2S
SEM was used to observe the superficial corrosion scale. Figure 9 shows the macrographs
of the specimen removed corrosion scale. Uniform corrosion was found in sweet
corrosion but pitting attack can be observed when a low concentration of H2S was added.
On the other hand, when ppH2S was incremented the pitting attack was reduced. By
comparing Figure 9 (b) and (c), the number of pits on the surface of N80 steel decreases
clearly with increasing partial pressure of H2S (Ren et al., 2005).
2.5.2. Development of low alloyed carbon steel OCTG products for corrosive
environments
Morales et al. (ND) conducted the development of low alloy high resistance products for
sour environments and also developed a product with better performance in CO2
environments than API carbon steels. The addition of Cr in the chemical composition was
evaluated. The results of the environment containing CO2 were presented in that study.
2.5.2.1. Materials
They used a chemical composition 3%Cr steel based on the findings of the Leeds
programme. Non chromium and 1%Cr commercial steels were included in the evaluation

22
to act as a reference for the corrosion properties of the new composition (Morales et al.,
ND).
Mechanical tests were carried out following the API procedures (hardness, strength,
charpy, etc). Microstructural evaluation was carried out using optical and SEM.
2.5.2.2. CO2 corrosion resistance evaluation
Experiments were carried out in a conventional glass cell with high purity of CO2 and also
the solution contained 75000ppm of Cl-. Atmospheric pressure was used with a test
temperature of 25°C and 60°C and a simulated flow velocity of 2.5 m/s (Morales et al.,
ND).
Electrochemical techniques such as linear polarisation resistance (LPR), full polarisation
swept and potentiostatic current-time test were used to get information about the
material performance in the two different surface conditions: polished and pre-corroded.
Comparison between the polished and pre-corroded specimens’ performance provided
information about the effect of corrosion products in a sweet environment (Morales et
al., ND).

23
Table 4 Effect of surface condition on corrosion rate, 60°C (Morales et al., ND)
Table 4 shows the corrosion rate for samples “as polished” and pre-corroded”. For 3% Cr
steel, the presence of corrosion products formed during the "pre-corrosion" process
reduces the corrosion rates; while corrosion mitigation increases as the severity of the
process increases (Morales et al., ND).
Figure 10 Full polarisation sweeps for pre-corroded samples, 60°C (Morales et al., ND)
Figure 10 shows a full polarisation sweep for pre-corroded samples at 60°C. The
polarisation curves display the difference between 3%Cr and 1%Cr performance, which
remarkably increased when the corrosion products’ film was formed.

24
Figure 11 Surface apperance of corrosion films, SEM 250X (Morales et al., ND)
Figure 11 displays the surface appearance of 3% and 1%Cr tested at 60°C, as noted the
3%Cr corrosion product layer is more uniform than 1%Cr. Moreover, the film formed on
3%Cr is more adherent than the film formed on the 1%Cr steel (Morales et al., ND)
.

25
3. Project Plan and Experimental Programme
3.1. Objectives of the research
This paper attempts to investigate the influence of metallurgical variables and protective
layers formed by corrosion products, which affect the corrosion kinetics. Three different
steels commonly used in tubing production (L80, L80Cr1 and L80Cr3) will be used in this
investigation under sweet environment conditions.
Metallurgical variables include chemical composition and the microstructure of steels
which play an important role either in promoting or hindering general CO2 corrosion.
Protective layers formed by the precipitation of insoluble salts, can play an important role
in limiting the corrosion rate in sweet environments.
To determine the performance of the three steels under sweet corrosion conditions the
following objectives should be completed:
Prior sample analysis including visual examination, chemical composition and
metallographic examination will be performed on the steels under study. The
chemical analysis is by the Energy dispersive X-ray (EDX), and the metallographic
examination is by optical microscopy and scanning electron microscopy (SEM),
which allows the observation of the surface of the samples at higher magnification
and resolution.
An assessment the corrosion of the steels under study in two solutions with
carbon dioxide which simulates the formation of brine. The first solution will be
prepared to prevent the formation of scaling when the samples are submerged.
The second solution will promote the formation of protective layers on the metal
samples when they are submerged. Therefore, the results obtained in the first
solution will be used to obtain electrochemical data and assess the surface
condition of a sensor when it is clean, without any scale deposition and
experiments using the second solution will evaluate the protective layers
formation and its impact in the corrosion kinetics.

26
Electrochemical techniques including open circuit potential measurement, full
polarisation sweeps and linear polarisation resistance measurements will be used
to provide information about the corrosion rate.
Post-test analyses will be used in order to know the morphology, topography and
corrosion products species on the corroded sample surfaces. The specimens will
be analysed by SEM, EDX and X-ray diffraction (XRD).
3.2. Experimental procedure
3.2.1. Introduction
A summary of the stages involved in this investigation is shown in Figure 12. Generally, it
can be subdivided into a few stages as follows:
i) Sample preparation
ii) Prior sample analysis (chemical analysis and metallographic examination)
iii) Solution preparation. The concentration of species was calculated using the
equilibrium constants for the CO2-H2O and NaHCO3-CO2-H2O systems
iv) Bubble test. Experiments were carried out in a one litre or 1/2 litre three-
electrode cell equipped to perform electrochemical measurements, as shown
in Figure 14.
v) Electrochemical techniques: full polarisation sweeps and LPR measurements
were performed to provide information about the corrosion rate.
vi) Post analysis. the specimens were analysed by SEM, EDX and XRD

27
Experimental procedure
Metallurgical variables
Scaling
Sample preparation
Initial Analysis
-Visual inspection-Chemical composition- SEM: Microstructure
BUBLE TEST
- Solution preparation (3.5% Nacl)
- Oxygen purged (2.3 h)
Polarization scan
- initial stage (0h)- final stage (10H)
Linear polarization resistance
- Each hour during 10 (h)
- Room temperature
- Atmospheric pressure
Analysis electrochemical
tecnhiques
- Tafel costant- Corrosion rate
Post Analysis
- SEM: Micrsotructure- XRD: Corrosion products
- Solution preparation (3.5% Nacl)- Oxygen purged (2.3 h)
- 80 °C- Atmospheric
pressure
Figure 12 Experimental procedure summary
Figure 12 represents the summary of the experimental procedures involved in the
investigation of those factors which affect the corrosion rate, relating to the metallurgical
variables of the steels and the effects of surface film formation (scaling).

28
3.3. Preparation of the samples for corrosion studies
The working electrodes were made of L80, which is an API steel, and L80Cr1/L80Cr3,
which are commercial variations of L80 steel.
The L80 API grade of steel is the most common metal used as production tubing since it is
cheap and easily available. However, L80 is not resistant enough against a sweet
environment compared to stainless steel. Therefore, the metallurgical industry has
developed new categories of low C and Cr-containing steels (L80Cr1, L80Cr3) with
superior resistance to CO2 corrosion (Kermani and Morshed, 2003). Table 12 shows the
chemical compositions of L80, L80Cr1 and L80Cr3 used in this paper.
3.3.1. Sample preparation for electrochemical techniques
Figure 13 Working electrode (gritted sample)
Samples were prepared with an area of approximately 1 cm2 with a thickness of 3 mm.
The samples were mounted in nonconductive resin (araldite 1:10) and a copper wire was
welded to the sample. Plastic tubing protected and covered the copper wire, as shown in
Figure 13.
Finally, the samples were ground using from 400 to 600 grit silicon carbide paper using a
wet electric polishing machine (OmegaPol Twin) in order to obtain a clean and shiny
surface (no-oxides). After polishing they were cleaned and degreased with ethanol and
deionised water
3.3.2. Sample preparation and etching for metallographic examination
Samples of each steel had an area approximately 1 cm2 with 3 mm of thickness. The
samples were ground using from 400 to 4000 grit silicon carbide paper using a wet

29
electric polishing machine. The samples were polished by 3, 1 and ¼ micron diamond
compound over red felt cloths. Finally, the samples were polished with colloidal silica over
imperial cloth to obtain a mirror surface before the nital etching.
Nital is made up of a powerful oxidising acid (nitric acid) and an organic, and therefore
reducing, alcohol. The solution used for this investigation contained 5% (by volume)
concentrated nitric acid in ethanol. The L80 and L80Cr1 samples were immersed for 10
seconds, and L80Cr3 was immersed for 30 seconds. Following etching the samples were
cleaned by deionised water and finally dried. The solution should attack ferrite and
outline the ferrite boundaries. Moreover, the etching should reveal the grain size, grain
flow and alloy segregation banding (Etchant and Store, 2015).
3.4. Metallographic examination and chemical composition
Metallography is the study of the physical structure and components of metals, in this
case carbon steel and mild steel, using optical and electron microscopy (Vander Voort,
1984).
Metallographic examination was performed on the three steels used in this study in order
to understand the importance of their microstructure under a CO2 corrosion
environment.
The optical microscopy used in the metallographic examination was the Axio Scope.A1
which uses visible light and a system of lenses to magnify the images. The image is
captured by light sensitive cameras to generate a micrograph (Davidson and Abramowitz,
2002).
To analyse the microstructure in higher magnification the Hitachi S-3000N spectrum
electron microscopy was used, which is capable of imaging specimens at high vacuum and
also in a variable pressure range from 1–270 Pa. The operation of this microstructure will
be explained in section 3.7.1. (Hitachi, 2015)
30
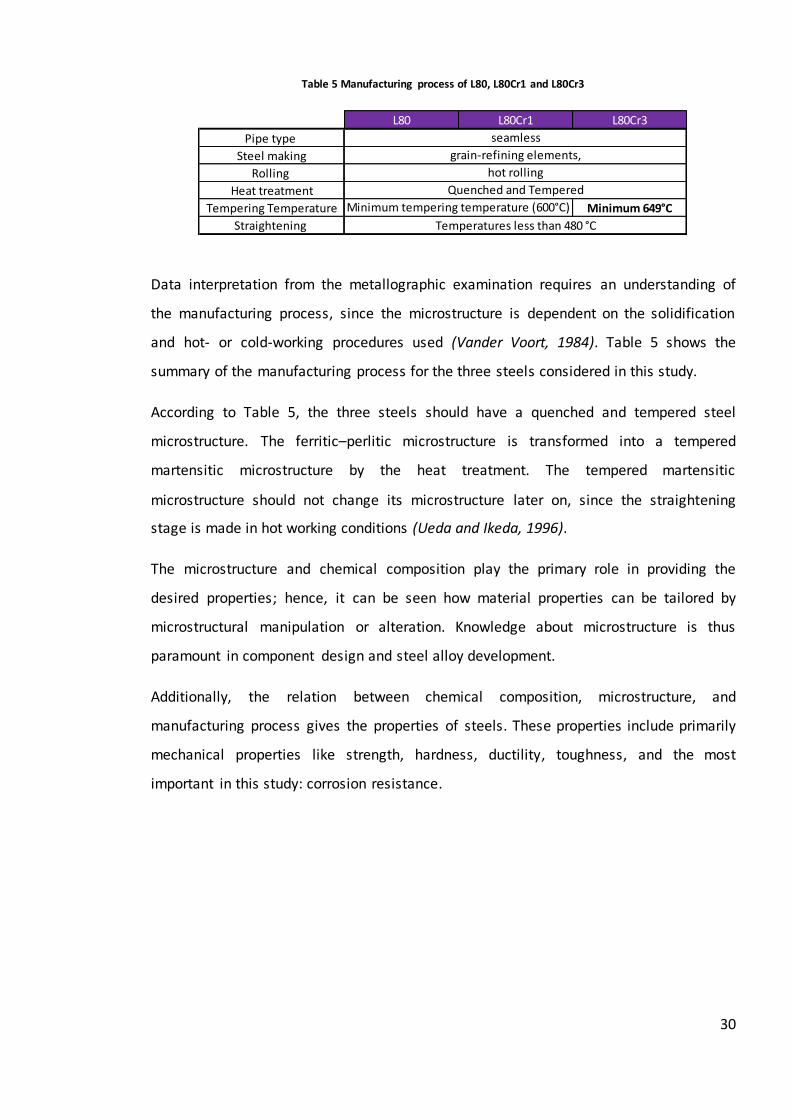
Table 5 Manufacturing process of L80, L80Cr1 and L80Cr3
Data interpretation from the metallographic examination requires an understanding of
the manufacturing process, since the microstructure is dependent on the solidification
and hot- or cold-working procedures used (Vander Voort, 1984). Table 5 shows the
summary of the manufacturing process for the three steels considered in this study.
According to Table 5, the three steels should have a quenched and tempered steel
microstructure. The ferritic–perlitic microstructure is transformed into a tempered
martensitic microstructure by the heat treatment. The tempered martensitic
microstructure should not change its microstructure later on, since the straightening
stage is made in hot working conditions (Ueda and Ikeda, 1996).
The microstructure and chemical composition play the primary role in providing the
desired properties; hence, it can be seen how material properties can be tailored by
microstructural manipulation or alteration. Knowledge about microstructure is thus
paramount in component design and steel alloy development.
Additionally, the relation between chemical composition, microstructure, and
manufacturing process gives the properties of steels. These properties include primarily
mechanical properties like strength, hardness, ductility, toughness, and the most
important in this study: corrosion resistance.
L80 L80Cr1 L80Cr3
Pipe type
Steel making
Rolling
Heat treatment
Tempering Temperature Minimum 649°C
Straightening Temperatures less than 480 °C
seamless
grain-refining elements,
hot rolling
Minimum tempering temperature (600°C)
Quenched and Tempered

31
Table 6 Mechanical properties of the three steels under study
Chemical composition is the key to obtaining desirable mechanical properties, and also it is
directly related to the metal’s corrosion resistance.
Steels’ composition should be designed with low carbon content and the microalloying
addition of strong carbide-forming elements. The intention was that these microalloying
elements should preferentially combine with C, leaving Cr un-combined. Cr can be
oxidised on the surface of a metal to form a stable layer which could be a passive layer or
a corrosion deposited layer (Kermani and Morshed, 2003, Kermani et al., 2001, Lopez et
al., 2003a).
In order to test out the composition of the three steels used in this study an SEM-EDX
device was used. This apparatus can give the elemental composition of a point or an area of
the sample. The EDX technique detects X-rays emitted from the sample during
bombardment by an electron beam to characterise the elemental composition of the
analysed volume. Features or phases as small as 1 µm or less can be analysed
(Engineering, 2014). The chemical composition data collected in the EDX should match
with the steel data sheets.
3.5. Solution composition
As mentioned before, this study attempts to investigate two factors which affect the
corrosion rate which are the metallurgical variables and the scaling formed by the
corrosion products.
To determine the influence of these factors, two solutions were prepared to assess the
samples performance in a sweet environment.
Yield Strength Minimum T. S. HardnessKPSI kPSI HRC
L80 80-95 95 23
L80Cr1 80-95 95 23
L80Cr3 80-90 95 23

32
3.5.1. Solution A
Solution A was prepared in order to evaluate the metallurgic factor of alloying small
amounts of chromium into L80 steel grade. Even though the samples generate corrosion
products, the solution was not intended to form corrosion products on the metal
samples.
The purpose of the solution A is to obtain electrochemical data and assess the surface
condition of the samples when it is clean, without any scale deposition. With the known
surface condition, it acts as a reference or base line, which can be used to compare the
surface coverage once corrosion products are deposited onto the specimen surface.
Solution A (3.5% NaCl) was prepared by adding 35 g of NaCl into 1 l at room temperature
conditions (25°C and 1 atm); which gave a pH=3.992 after the solution has been saturated
by CO2 gas.
3.5.1.1. CO2 – H2O open system at room conditions (Solution A)
In a system which contains CO2-H2O five homogeneous species are found; their
equilibrium equations correspond to (Lower, 1999, Tanupabrungsun, 2013):
- Dissolution of carbon dioxide:
( ) ( )
- Carbon dioxide hydration:
( ) ( ) ( )
- Carbonic acid dissociation:
( )
( )
- Bicarbonate anion dissociation:
- Water dissociation:

33
Where KH is the Henry’s constant for the dissolution of carbon dioxide, Kh is the
equilibrium constant for the carbon dioxide hydration, K1 is the equilibrium constant for
the carbonic acid dissociation, K2 is the equilibrium constant for the bicarbonate anion
dissociation, Kw is the equilibrium constant for the water dissociation, and pCO2 is the
partial pressure of carbon dioxide (Lower, 1999).
The CO2 pressure in the solution is proportional to the partial pressure of the gas in
equilibrium with the solution. Therefore, if the solution is saturated with CO2 gas the
partial pressure of CO2 is the atmospheric pressure at room temperature (2015). At room
condition the partial pressure of CO2 is 1 atm and the concentration equilibrium constant
are determined with the following equations:
(Dickson and Riley, 1979)
( )
( ) ( )
(Weiss, 1974)
(Dickson and Millero,
1987)
(Dickson and Millero, 1987)
Where T is the absolute temperature at 298K (T=t°C+273.15) and the salinity value is
350/00.
Table 7 Concentration equilibrium constants relating CO2 equilibria at 25°C and 1 atm
Table 7 shows the concentration equilibrium constants relating CO2 equilibria at room
conditions.
Rearranging the previous equilibrium equations, multiplying by (H+)2 and substituting (KH x
PCO2) for H2CO3 yields (Lindsay, 1979):
Units Reference Subs. T (K) S(0/00) K pK
KW Dickson and Riley, 1979 H2O 298 0.0035 1.17E-14 13.93
KH (molar S) mol L-1 Weiss (1974) H2CO3 298 0.0035 0.034198 1.47
K1 (dissoci eq) Dickson and Millero (1987) HCO3- 298 0.0035 7.77E-07 6.11
K2 (dissoci eq) Dickson and Millero (1987) CO3 2- 298 0.0035 3.49E-10 9.46

34
( )
(H+) can be found by a variety of numerical techniques and the equilibrium constant
values are data from Table 9, which was verified with the available literature (Lower,
1999, Tanupabrungsun, 2013, Lindsay, 1979, 2015).
Table 8 Concentration species in Solution A
[H+]
(mol/L) pH pCO2
[H2CO3]
(mol/L)
[HCO3-]
(mol/L)
[ ]
(mol/L)
0.000163 3.788 1 0.034198 0.000163 3.49E-10
Table 8 summarises the concentration of the main species in Solution A at room
conditions.
3.5.2. Solution B
Solution B was prepared in order to evaluate the surface film (scale) as a factor in the
corrosion kinetic. Therefore, a special solution and environment should be prepared to
allow the growth of the surface film. Moreover, the solution must simulate the formation
water.
Table 9 Sanders’ brine composition
Sanders (2014) carried out a number of experiments into corrosion and scale using a
brine which is thermodynamically suitable for scale to occur. The brine was determined
using the MultiScale software version 7.1, which considers parameters such as the
temperature, ionic composition, the alkalinity, the CO2 concentration, the mixing ratio
and pH. Table 9 displays the composition of the brine chosen in the Sanders’ experiments.

35
The Sanders’ solution was composed of two distinct parts: Brine A had calcium ions and
Brine B had bicarbonate ions. Both brines were prepared separately with deionised
water, saturated with CO2 and heated. The MultiScale thermodynamic software showed
the supersaturation ratio (SR) to be 92 at 80°C and pH 6.8. The calculations are based on
the thermodynamics of the system, including the solubility product, Henry’s law and the
Pitzer model (Sanders, 2014).
In order to simplify the brine to be used in this study, the following solution composition
is proposed: Solution B which was prepared by adding 35 g of NaCl into 1 L at 80°C and 1
atm, which gave a pH =6.8 after being saturated with CO2 gas and buffered with NaHCO3
3.5.2.1. NaHCO3 -CO2-H2O system (Solution B)
The CO2 pressure in the solution is proportional to the partial pressure of the gas in
equilibrium with the solution. Therefore, if the solution is saturated with CO2 gas the
partial pressure of CO2 is the atmospheric pressure less the vapour pressure of water at
80°C (2015).
The vapour pressure of water at 80°C is 0.47 atm, so that the partial pressure of CO 2 is
0.53 atm at 80°C when the solution is bubbled with CO2 gas.
In order to get the concentration equilibrium constant the previous equations as
developed in section 3.5.1.1 were utilised, where the absolute temperature was 298K and
the salinity value was 3.5%.
Table 10 Concentration equilibrium constants relating CO2 equilibria at 80°C and 1 atm
Table 10 shows the concentration equilibrium constants relating CO2 equilibria at 80°C.
Where KH is the Henry’s constant for the dissolution of carbon dioxide, Kh is the
equilibrium constant for the carbon dioxide hydration, K1 is the equilibrium constant for
the carbonic acid dissociation, K2 is the equilibrium constant for the bicarbonate anion
Units Reference Subs. T (K) S(0/00) K pK
KW Dickson and Riley, 1979 H2O 353 0.0035 3E-13 12.53
KH (molar S) mol L-1 Weiss (1974) H2CO3 353 0.0035 0.0135 1.87
K1 (dissoci eq) Dickson and Millero (1987) HCO3- 353 0.0035 1E-06 5.85
K2 (dissoci eq) Dickson and Millero (1987) CO3 2- 353 0.0035 2E-09 8.73

36
dissociation, Kw is the equilibrium constant for the water dissociation, and pCO2 is the
partial pressure of carbon dioxide (Lower, 1999).
(H+) can be found by a variety of numerical techniques and the equilibrium constant
values are the data from Table 10. The sodium bicarbonate works as a buffer in the
solution to maintain the pH at about 6.8. The following calculations were made in order
to get the amount of sodium bicarbonate to achieve the required pH of 6.8.
Carbonic acid dissociation:
( )
NaHCO3 is a buffer and its dissociation is the following equation:
( )
From Table 10, the concentration of protons at 80°C without the addition of the buffer
can be calculated:
( )
In order to get a pH = 6.8 the concentration of should decrease in the
solution:
( )
The amount of protons to be reduced:
Start 1.023E-4 1.01E-4 0.007153
Change -[X] +[Z] -[X]

37
Finish 1.584E-7 1.01E-4+[Z] 7.051E-3
Molar mass of is 84 g/mol.
Therefore, the amount of added to the solution is 5.23 gr per each Litre of
solution.
Table 11 Concentration species in Solution B
[H+]
(mol/L) pH pCO2
[H2CO3]
(mol/L)
[HCO3- ]
(mol/L)
(mol/L)
Without NaHCO3 (start) 0.0001006
3 3.997 0.53
0.00715
3
0.00010
1
1.87E-
09
Addition NaHCO3
(finish) 1.58E-07 6.8 0.53
0.00705
1
0.06310
1
0.00074
5
Table 11 summarises the concentration of the main species in Solution B before and after
the addition of the buffer specie .
3.6. Monitoring the corrosion rate
To understand the corrosion kinetic and obtain corrosion rate the following
electrochemical methods will be used on each steel sample:
Full polarisation curve
Lineal polarisation resistance
3.6.1. Electrochemical bubble test setup
The bubble tests were conducted in a 1 L glass cell for Solution A and ½ L glass cell for
Solution B using a three-electrode setup, as shown in Figure 14 and Figure 15.

38
Figure 14 Schematic diagram of the experimental set up.
In each experiment three flat samples made of L80, L80Cr1 and L80Cr3 were used for the
electrochemical measurement and surface analysis. Before the samples were submerged,
they were wet polished as indicated in section 3.3.1.
Figure 15 Experimental setup: a) Bubble test one cell, b) bubble test with water bath for three cells
The glasses were filled with solutions A and B, which were made as previously indicated in
section 3.5.
For both solutions the CO2 gas was purged continuously through the solutions. To be sure
that the solutions were totally free of oxygen, pH measurements were performed before
a)
b)

39
initiating the bubble test. Solution B was stirred and the temperature was set to 80°C.
Once the pH was stabilised, the samples were inserted into the glass cell.
Additionally, pH measurements were taken periodically to detect any change in the
solutions, and the pH in Solution B was adjusted to 6.8 each 12 hours by the addition of
sodium bicarbonate.
3.6.2. Full polarisation curve (Tafel constants)
Measurement of a polarisation curve is the most common electrochemical methods used
in corrosion research. The relationship between the current and the potential is the
polarisation curve in a near steady state condition. Usually the polarisation curve is
controlled by the potential, and then used to measure the current (Richardson et al.,
2010).
Experiments were carried out in one litre three-electrode cells equipped to perform
electrochemical measurements. The potentiostat used was PalmSens3 which is a battery
or USB powered potentiostat/ galvanostat and Frequency Response Analyser.
Figure 16 polarization behaviour of the metal in ideal deaerated solution
Figure 16 shows the polarization behaviour of a metal in ideal deaerated solution showing
active corrosion.
At the corrosion potential, Ecorr, rate of cathodic reduction is equal to rate of anodic
reaction (metal corrosion). Tafel constants ( βA and βC ) are calculated from the anodic
and cathodic slopes. To determine values of Ecorr and icorr, extrapolated linear sections
from the anodic and cathodic curves are used as shown in Figure 16.
Ecorr and icorr values can be directly determined from the cross -over point

40
Even though Tafel plots from the full polarisation curve can provide a direct measurement
of the corrosion current (corrosion rate), the electrochemical method selected to monitor
the corrosion rate was LPR.
The LPR electrochemical method needs the Tafel constants and they should be acquired
from the full polarisation curve. The Tafel constants, βA and βC, obtained from the Tafel
plots can be used with the polarisation resistance data to calculate the corrosion rates.
(Scully, 2000)
Moreover, the full polarisation curve shows if the LPR should be used as method to
determine the corrosion rate. Many experiments may not yield a linear relationship,
making it difficult to determine the polarisation resistance. In such cases the LPR analysis
does not apply because it is not possible to determine values of the Tafel constants
(Trethewey and Chamberlain, 1995).
For the polarisation curve a cyclic voltammetry was used. It involves sweeping the
potential in a positive direction until a predetermined value of the current or potential is
reached; then the scan is immediately reversed towards more negative values until the
original value of potential is reached. In some cases, this scan is done repeatedly to
determine changes in the current–potential curve produced with scanning. (Bard and
Faulkner, 1980)
3.6.3. Linear polarisation resistance
The linear polarisation resistance method was chosen as an electrochemical technique to
monitor the corrosion rate, because this method can be used for long term experiments
such as for 120 hours.
In this method the potential is applied to the samples (working electrode), while the
circuit is completed with a counter electrode (platinum). The reference electrode used
was a saturated calomel SCE/KCL for all the measurements taken.
When the potential is applied (ΔE), the working electrode gives a current density (ΔI)
which is measured, and polarisation curves are obtained. The slope of the curve
corresponding to the polarisation resistance is extracted:

41
( ) ( )
( )
Where Rp is the polarisation resistance and the slope of the LPR plot.
Then the Stern Geary equation is used in order to get the icorr.
( )
Where, βa and βc are the anodic and cathodic Tafel constant repectively.
3.6.3.1. Corrosion rate measurements
The samples were submerged into the solution A and B, which were purged with CO2 gas
for 3 hours in order to deplete the oxygen from the solution. The polarisation was
performed in Solution A and B, and as explained in section 3.5.1 and 3.5.2.
The OCP values were measured for 30 minutes, and a limited range of voltage around the
corrosion potential (±10mV) with respect to the OCP was applied at scan rate of 0.2 mV/s.
For the solution A the experiment was conducted over 12 hours; at each hour the data
were recorded in order to obtain the corrosion rate shift, as shown in Figure 23.
For the solution B The experiment was conducted for 120 hours; every three hours the
data were recorded in order to obtain the corrosion rate shift, as shown in Figure 24
3.7. Post-test analyses
3.7.1. Scanning electron microscopy and energy dispersive X-ray analysis
The SEM-EDX method was selected to analyse the surface appearance (topography) of
the corrosion film formed after the samples were exposed during 120 hours into the
solution B. It provided high resolution imaging of the corrosion products adhered to the
metal surface of the three steels under analysis.
SEM uses electrons for imaging, and its advantages over optical microscopy are having
much higher magnification (>100,000X) and greater depth of field. Moreover, it provides
qualitative and quantitative chemical analysis information using an EDX (Engineering,
2014).

42
The SEM consists basically of (Hafner, 2007):
Figure 17 SEM-EDX basic scheme (Hafner, 2007)
Electron gun: the source of the electron beam which is accelerated
Lenses (condenser and objective): control the diameter of the beam; also to focus
the beam on the specimen
Apertures: micron-scale holes in metal film
Control for specimen position: control for position, height and orientation
Beam/specimen interaction: generates signals that should be processed to
produce an image or spectra
Vacuum: the SEM and EDX work with high vacuum levels
The SEM uses a focused beam of high-energy electrons to generate a variety of signals at
the surface of solid specimens. The signals that derive from the electron–sample
interactions reveal information about the sample including the external morphology
(texture), chemical composition, and crystalline structure and orientation of the materials
making up the sample. In most applications, the data are collected over a selected area of
the sample surface, and a 2-dimensional image is generated that displays their properties
(Swapp, 2015).
The morphology of the sample was analysed with the Hitachi S-3000N, which is a variable
pressure SEM with a tungsten electron source and is capable of imaging specimens at
high vacuum, and also in a variable pressure range from 1–270 Pa. This makes it possible
to analyse labile organics at low voltages without metallisation. (Hitachi, 2015)

43
EDX analyses were conducted in order to determine which type of scale deposit was
dominant on the surface of the sample. This apparatus can give the elemental
composition of a point or an area of the sample. The EDS technique detects X-rays
emitted from the sample during bombardment by an electron beam to characterise the
elemental composition of the analysed volume. Features or phases as small as 1 µm or
less can be analysed (Engineering, 2014).
3.7.2. X-ray diffraction analysis
The nature of the scale formed on the surface of the samples was determined with the X-
ray diffraction X'Pert MPD XRD system using the properties of the specific X-ray diffraction
patterns for each crystal, such as siderite, iron carbides, chromium (III) hydroxide and so
on.
This multipurpose X-ray diffractometer is a Philips X'Pert MPD system with a vertical T-T
goniometer (190 mm radius). The X-ray source is a long-fine-focus, ceramic X-ray tube
with Cu anode. Normal operating power is 40 kV, 50 mA (2.0 kW). (Manchester, 2015)
X-rays have a smaller wavelength than visible light, but they have higher energy. X-rays
have wavelengths similar to the size of atoms and they are useful to explore within
crystals. Their electromagnetic radiation is inversely proportional to their wavelength
(0.02 Å-100 Å) (Nelson, 2014).
Figure 18 X-ray tube device scheme (Nelson, 2014)
Figure 18 shows the scheme of the X-ray tube, which is an evacuated chamber with a
tungsten filament, and is used to produce X-rays. The filament is the cathode and the
metal target is the anode. Electrical current is run through the cathode filament, causing
the electrons to move at high velocity from the filament to the metal target. Upon striking

44
the atoms in the target, the electrons dislodge inner shell electrons , resulting in the outer
shell electrons having to jump to a lower energy shell to replace the dislodged electrons.
This electronic transition generates X-rays, which move through a window, and they are
used to provide information of the atoms in crystals (Nelson, 2014).
These X-rays produce monochromatic radiation, collimated to concentrate, and directed
toward the sample. The interaction of the incident rays with the sample produces
constructive interference (and a diffracted ray) when the conditions satisfy Bragg's Law
(Clark and Dutrow, 2015):
nλ=2d sinθ
Where θ is the angle of incidence of X-rays of wavelength λ, d is the separation of the
reflecting planes and n is an integer. (Thomas, 2012)
This law relates the wavelength of electromagnetic radiation to the diffraction angle and
the lattice spacing in a crystalline sample. These diffracted X-rays are then detected,
processed and counted (Clark and Dutrow, 2015)

45
4. Results and Discussion
4.1. Visual examination
Before of the experiments, there was no difference between the three kinds of coupons
used for the bubble test. The three coupons had a metallic colour with the same surface
finishing (600 grit) and moreover they had the same metal shine.
After the corrosion tests, all samples were covered by dark grey corrosion films. However,
they presented different characteristics depending on the type of steel: the L80Cr3
sample tested surfaces were smooth and rather brilliant; the L80 and L80Cr1 presented
the typical aspect of CO2 corroded carbon steel, being opaque and uneven.
4.2. Metallurgical variables as a factor in the corrosion kinetic
4.2.1. Chemical composition (EDX)
Table 12 Chemical composition of L80, L80Cr1, L80Cr3
Table 12 shows the chemical composition of the three steels used in this study. L80 and
L80Cr1 have similar chemical composition, except for the chromium content which is 0
and 1%Cr, respectively. On the other hand, L80Cr3 has a special (more alloying)
composition if it is compared with the other two steels.
Chromium contents’ addition promotes passive film properties, and hence corrosion
resistance. Moreover, Cr leads to decreases in the critical current for passivation,
passivation potential and passive current, and an increase in the pitting potential.
(Richardson et al., 2010)
The L80Cr1 and L80 do not have any micro-alloying elements such as Al, Mo, V and Ti. The
steel L80Cr3 has a lower carbon content than the other steels, and has micro-alloying
elements such as Al, Mo, V and Ti, which make the L80Cr3 steel grade better able to
endure general corrosion (Kermani and Morshed, 2003).
C Si Mn Cr P S Ni Cu Al Mo V Ti
minmax 0.43 0.45 1.9 0.03 0.03 0.25 0.35min 0.8max 0.43 0.45 1.9 1.2 0.03 0.03 0.25 0.35min 3 0.01max 0.11 0.4 0.7 3.8 0.02 0.005 0.15 0.6 0.55 0.035
L80
L80Cr1
L80Cr3
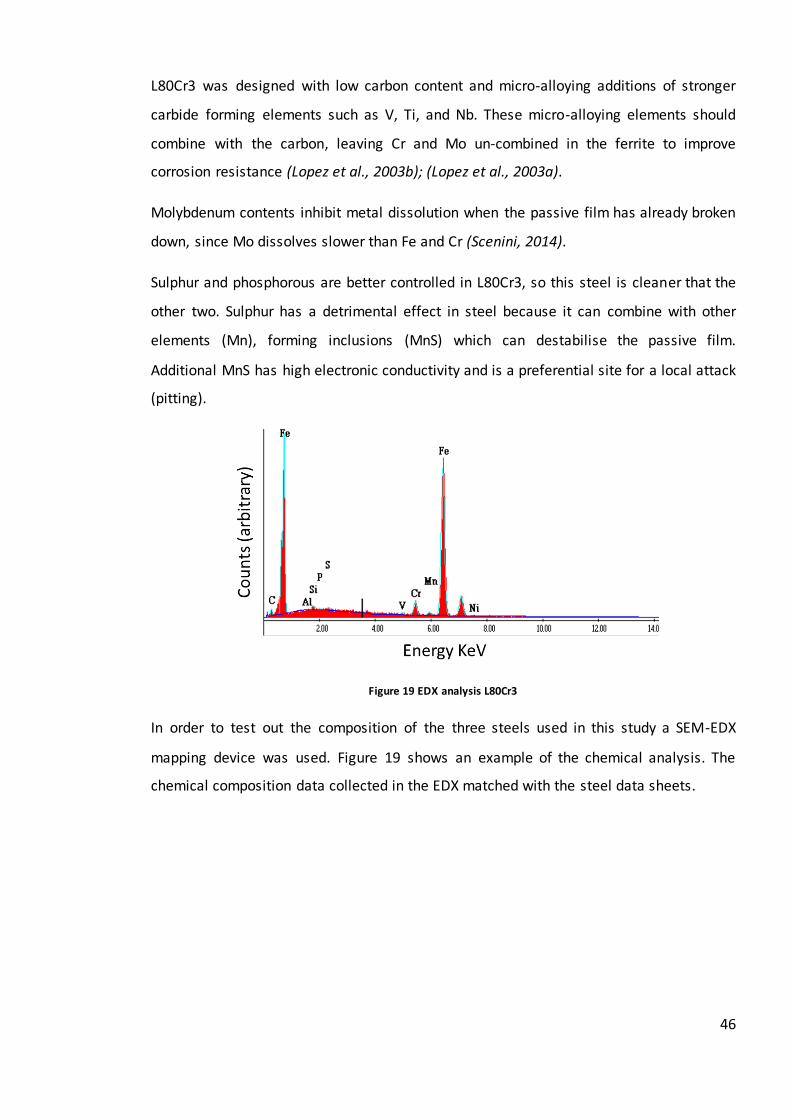
46
L80Cr3 was designed with low carbon content and micro-alloying additions of stronger
carbide forming elements such as V, Ti, and Nb. These micro-alloying elements should
combine with the carbon, leaving Cr and Mo un-combined in the ferrite to improve
corrosion resistance (Lopez et al., 2003b); (Lopez et al., 2003a).
Molybdenum contents inhibit metal dissolution when the passive film has already broken
down, since Mo dissolves slower than Fe and Cr (Scenini, 2014).
Sulphur and phosphorous are better controlled in L80Cr3, so this steel is cleaner that the
other two. Sulphur has a detrimental effect in steel because it can combine with other
elements (Mn), forming inclusions (MnS) which can destabilise the passive film.
Additional MnS has high electronic conductivity and is a preferential site for a local attack
(pitting).
Figure 19 EDX analysis L80Cr3
In order to test out the composition of the three steels used in this study a SEM-EDX
mapping device was used. Figure 19 shows an example of the chemical analysis. The
chemical composition data collected in the EDX matched with the steel data sheets.

47
4.2.2. Metallographic Examination (Optical and SEM)
Figure 20 Microstructure of the steel under study (optical microscopy and SEM)
Figure 20 (a-c) displays the microstructure of L80, L80Cr1 and L80Cr3, respectively.
Metallographic examination was performed on the three steels used in this study in order
to understand the importance of the microstructure on the CO2 corrosion of carbon and
low alloy steels.
L80 L80 Cr1 L80 CR3
X 1.5K, 30um
x100 times, optical
X 7.5K, 5um
a)
b)
c)

48
Figure 21 Optical Microstructure of the steel under study
Figure 21 shows the microstructures as tempered martensitic steels which have large
cementite particles and a recovered dislocation substructure. There are sub-grain
boundaries due to polygonisation and otherwise clean ferrite almost free from
dislocations. The plate microstructure is coarsened but nevertheless retained because the
carbides are located at plate boundaries. The L80Cr3 microstructure shows a
homogeneous tempered martensitic structure. (Bhadeshia, 2015)
Tempered martensitic is not as hard as just-quenched martensitic, as the phase becomes
stable; the needles convert to being smaller and thinner. The hardness decreases with
respect to tempering temperature. The toughness and desired surface hardness can be
achieved.
The transformation of the martensitic microstructure on tempering is directly dependent
on the tempering temperature and holding time cycle. The microstructure is also much
finer-grained than just-quenched martensitic.
When martensitic steel is tempered, it partially decomposes into ferrite and cementite.
The segregation of pearlite and ferrite has a significant impact on the corrosion rate since
the microstructure can influence the morphology and the adherence of corrosive
products (Kermani and Morshed, 2003).
It is generally agreed that Fe3C is cathodic to ferrite in a CO2 environment and it is
revealed by the corrosion of ferrite (Lopez et al., 2003a).

49
Figure 20 (a) shows that L80 and L80Cr1 have a segregated distribution of the iron carbide
phase cementite. By contrast, the L80Cr3 microstructure has a uniform distribution of
cementite.
Niobium, vanadium, titanium and aluminium are grain-refining elements; this means they
can be used to refine the grain size (Lopez et al., 2003a). L80Cr3 has a grain size of around
22–25µm, and L80/L80Cr1 have a grain size around 25–30µm. Table 12 shows that L80Cr3
has grain refining elements which better allow a homogenous grain distribution than the
other steels.
4.2.3. Tafel constants
Before commencing, to submerge the samples into the solution, it was purged with CO2
gas for 3 hours in order to deplete oxygen from the solution. The polarisation was
performed in a solution of 3.5% NaCl saturated with CO2 gas.

50
Figure 22 Anodic Tafel extrapolation: L80 polarization curve is the continuous red line, L80Cr1 polarization curve is
the continuous blue line, L80Cr3 polarization curve is the continuous green line, L80 Tafel extrapolation is the dash
red line, L80Cr1 Tafel extrapolation is the dash blue line, L80Cr3 Tafel extrapolation is the dash green line.
The potentials were swept from -0.35 V to 0.35 V versus a Calomel SCE/KCl reference
electrode with a sweep rate of 1 mVs-1.
Figure 22 shows the fitted values by extrapolation of the anodic and cathodic regions on
the curves. The fitted values can depend strongly on the limits of the curves chosen for
the fit, and these limits must be chosen carefully. Valid extrapolation depends on the
Tafel region: the Tafel region should be either above or below 0.5 mV from the Ecorr and
the line must be straight for at least a factor of 10 change in current. The resulting current
is plotted on a logarithmic scale.
These findings suggest that in general, the cathodic reaction is diffusion controlled and
the anodic reaction is activation controlled. In consequence, the Tafel constant βC is taken
as infinite for the three samples and the anodic Tafel constant βA is taken to be 70 mV for
L80 and L80Cr1, and 50 mV for L80 Cr3.
y = 0,0701x - 0,8127
y = 0,0708x - 0,8342
y = 0,0553x - 0,7794
-1
-0,95
-0,9
-0,85
-0,8
-0,75
-0,7
-0,65
-0,6
-0,55
-0,5
0 0,5 1 1,5 2 2,5 3 3,5
Vo
ltag
e V
LOG I (uA) POL CR1 POL CR3 POL CR0
Lineal (L80 Tafel) Lineal (L80CR1 Tafel) Lineal (L80Cr3 Tafel)

51
4.2.4. Corrosion rate measurement: Solution A
Figure 23 LPR results, samples submerged into Solution A: a) Resistance polarisation, b) Corrosion rate
Figure 23 (b) shows that there was a steady increase in the resistant polarisation during
the experiment time for the three steels under study. The L80 and L80Cr3 have similar
values of resistance polarisation. Differently, for the L80Cr1 the measurements taken
show lower resistance polarisation than L80 and L80Cr3 during the whole test.
Using Faraday’s law, the resistance polarisation was converted into corrosion rate as
shown in Figure 23 (a). The figure reveals that there was a steady decrease in the
corrosion rate in the three steels under analysis.
At the beginning of the experiment the corrosion rate was 2.5, 1.7 and 1.1 mm/year for
L80Cr1, L80 and L80Cr3, respectively and at the end of the experiment the corrosion rate
was 1.5, 1 and 0.7 mm/year for L80Cr1, L80 and L80Cr3, respectively.
Even though the corrosion rate is expected to decline steadily after 12 hours in Solution
A, the samples exposure was stopped to avoid the influence of scaling on the metal
sample surfaces.
The corrosion rate analysis was carried out in Solution A at room conditions, and for these
conditions the findings suggest that L80Cr3 is the best steel and L80Cr1 is the worst
regarding corrosion performance.
What is interesting in Figure 23 (b) is that the L80 has better corrosion performance than
L80Cr1. This rather contradictory result may be due to “Cr [being] detrimental to the
anodic reaction at the lowest concentration and thus can lead to inconsistency in the
a b

52
corrosion performance of low Cr containing. At 3% Cr or more, protective films form at
conditions in which iron carbonate films are hardly stable and they can grow at a pH as
low as 5” (Kermani et al., 2001).
Moreover, Lopez et al. (2003) pointed out that the Cr content required to reduce
corrosion rates was a function of the test temperature. At 60°C, a beneficial effect was
obtained when the Cr content was above 1%, at 80°C a reduction in corrosion rate was
observed for Cr additions above 0.5%, whilst a 1% addition was required to decrease the
corrosion rate at 100°C (Lopez et al., 2003a).
4.3. Corrosion film (scaling) as a factor in the corrosion kinetic
This test was conducted to characterise the scale and corrosion occurs in Solution B. The
intention of this experiment was to characterise a corrosion/scale system through general
corrosion monitoring and the analysis of the scale on the sample surface.
The general corrosion was analysed during the test and the corrosion products on the
sample surface were assessed after the bubble test was over.
4.3.1. Corrosion rate measurement: Solution B
Figure 24 LPR results, samples submerged into Solution B: a) Resistance polarisation, b) Corrosion rate
Figure 24 (a) shows that there was a steady increase in the polarisation resistance during
the experiment for L80Cr1 and L80. However, the L80Cr3 curve shows that there was a
slight rise in the polarisation resistance, and from 38 to 100 hours its polarisation
resistance values were almost constant.
a b

53
Figure 24 (b) reveals that after 20 hours was a marked fall in the corrosion rate for L80
and L80Cr1. However, L80Cr3 (green curve) shows a slight decrease in the corrosion rate
and from 30 to 100 hours its corrosion rate values were almost constant. Even though L80
CR3 reaches a plateau corrosion rate (0.3 mm/year) its corrosion rate would decline to
bellow than 0.3 mm/year after 120 h according to the data collected at the end of the
experiment.
According to Figure 24 (b) blue curve (L80), the corrosion rate starts at 2 mm/year and
falls sharply for the first 30 hours. It reaches a plateau corrosion rate (0.14–0.12
mm/year) from 30 hours, which continues up to the end of the experiment.
Figure 24 (b) red curve (L80Cr1) highlights that the corrosion rate starts at 1.3 mm/year,
and shows a steep decline at the first 100 hours. It reaches a plateau in corrosion rate
(0.14–0.12 mm/year) from 100 hours up to the end of the experiment.
In general, the corrosion rate reduction is attributed to the establishment of the surface
layer on the metal. These layers could have semi-protective properties, since the
corrosion product layers might be porous or non-homogeneous. This assumption should
be clarified in the SEM, EDX and XRD analyses, where surface analysis will take place.
The corrosion rate analysis was carried out in Solution B at 80°C and 1 atm, and for these
conditions the findings suggest that L80Cr3 has better corrosion performance at the
beginning of the experiment, but at the end L80 and L80Cr1 have better corrosion
performance. It can be suggested that L80 and L80Cr1 have developed a corrosion layer
faster than L80Cr3 on the metal surface.
4.3.2. Surface analysis (SEM-EDX)
Following the bubble test the three samples were subjected to surface analysis. Figure 25
shows the SEM images of the surface appearance of corrosion films after 120 hours
submerged into Solution B at 80°C: a) 100X, b) 270X and c) 500X. The SEM observations
reveal differences between the 3% Cr steel and the other two steels.

54
Figure 25 SEM images of surface appearance of corrosion films after 120 hours submerged into Solution B at 80°C: a)
100X, b) 270X and c) 500X
Figure 25 shows corrosion product layers in the three steels at different magnifications.
Corrosion products form crystals which shape a non-continuous layer in the three
samples. However, the L80Cr3 has a higher surface coverage than the other two steels,
and the L80Cr1 steel has better corrosion film coverage than the L80 steel (see Figure 25
(c)).
Moreover, the L80Cr3 scale may have a more regular film which is more adherent than
the other film formed on the other steels
Figure 25 (c) for L80 and L80Cr1 shows a film formed by crystal which looks like a cubic
morphology (bearing in mind that siderite is a rhombohedric crystal). On the other hand,
the L80Cr3 has a film formed by amorphous crystals (Kermani and Morshed, 2003).
L80 L80 Cr1 L80 Cr3
X100, 500µm (a)
X270, 100µm (b)
X500, 100µm (c)
a)
b)
c)

55
As shown in Figure 25 (b), the films on the L80 Cr3 steel were rather dense and no
corrosion attack of the metal was observed. The L80 and L80Cr1 films were thicker than
the ones observed on L80Cr3 sample; for L80Cr1 and L80 there were some pores in the
corrosion films. Additionally, L80Cr3 had more uniform crystal on the surface than L80
and L80Cr1.
Finally Figure 25 (c) reveals that for L80 and L80Cr1 there are more areas either where
corrosion products are not present or the corrosion films are thinner, compared to the
results for L80Cr3. A possible explanation for these results may be the better adhesion
and stability of the L80Cr3 corrosion layer.
The SEM-EDX surface analysis was performed to assess the nature of the corrosion
products over the metal surface of the three steels (Iron carbonate, chromium (III)
hydroxide, iron oxides, iron carbides, chromium carbides, and so on).
Figure 26 L80 surface analyses of test conducted in Solution B at 80°C: a) Micrographs of corrosion product 500X, b)
EDX analysis
The EDX analysis displayed in Figure 26 (b) shows the composition of three chosen areas:
spectrum 1 shows the composition of the thickest scale area where the crystals overlap;
spectrum 3 displays the composition where the corrosion products are uniformly
distributed; and finally spectrum 2 displays the composition on a porous area (almost no
corrosion products).
Spect. 1
Spect. 2
Spect. 3
a) b)
spect.1 spect.2 spect. 3
C K 28.36 36.61 31.27
O K 58.91 55.46 63.04
CrK 0 0.37 0
MoK 0 0 0
FeK 12.73 7.57 5.69
Total 100 100 100
Wt%Elem.

56
The three spectra show no content of Cr and Mo in the corrosion products. This
information makes sense given the chemical composition of the L80 steel. In the three
spectra the corrosion films consisted mainly of Fe, C and O, which indicates the presence
of iron carbonate crystals FeCO3 (siderite).
Figure 27 L80Cr1 surface analyses of test conducted into Solution B at 80°C: a) Micrographs of corrosion product
500X, b) EDX analysis
The EDX analysis displayed in Figure 27 (b) shows the composition of the three chosen
areas: spectrum 1 shows the composition on a porous area (almost no corrosion
products); spectrum 2 displays the composition where the corrosion products are
uniformly distributed, and additionally the crystals are small; finally, spectrum 3 displays
the composition where the corrosion products have the thickest scale area and the
crystals are bigger.
The L80Cr1 spectra differ from the L80 spectra in the amount of chromium, but its
corrosion layers look like almost the same.
Spectra 1 and 3 show a relatively high amount of chromium on the corrosion layer. The
presence of chromium could be due to the penetration of the X-ray beam reaching the
substrate, and the presence of corrosion products incorporating chromium in their lattice.
This assumption makes sense with spectrum 2, where the siderite is more compact and it
shows a low amount of chromium. This may be evidence to suggest that there is not
chromium corrosion layer formation on the L80Cr1 metal surface.
Spect. 1
Spect. 2
Spect. 3
a)
b)
spect.1 spect.2 spect. 3
C K 30.76 24.23 27.98
O K 50.21 65.64 56.35
CrK 3.9 0.3 3.19
MoK 1.64 0.58 0.8
FeK 13.49 9.25 11.68
Total 100 100 100
Elem. Wt%

57
The three spectra of the corrosion films consisted mainly of Fe, C and O, which indicates
the presence of iron carbonate crystals FeCO3 (siderite).
Figure 28 L80Cr3 surface analyses of test conducted into Solution B at 80°C: a) Micrographs of corrosion product
500X, b) EDX analysis
Figure 28 (a) shows two types of corrosion products. The first one looks like siderite
crystals (FeCO3), which resemble a perfect cubic morphology, as shown in the Figure 29
(a) and as also previously reported by many researchers (Kermani and Morshed, 2003).
Figure 29 Types of corrosion products over L80Cr3 metal surface: (a) Iron carbonate scale precipitated on carbon s teel
samples at 75°C exposed to a solution at pH 6.30 at 1 bar CO2 showing a somewhat cubic appearance, magni fication:
X6,000 (Kermani and Morshed 2003); (b) Surface appearance of corros ion fi lms , s teel with 3%Cr at 60°C, SEM, 250X
(Morales et al., ND)
The second corrosion product has an amorphous shape which does not resemble any
perfect crystal; however, it looks compact and more regular, and numerous cracks
b) a)
Spect. 1 Spect. 2
Spect. 3
a)
b)
spect.1 spect.2 spect. 3
C K 14.77 23.74 15.72
O K 67.23 62.56 61.65
CrK 5.13 1.19 4.81
MoK 0.7 0 0
FeK 12.17 12.51 17.82
Total 100 100 100
Elem. Wt%

58
formed upon drying, as shown in Figure 29 (b) and previously reported by Morales et al,
ND.
The EDX analysis displayed in Figure 28 (b) shows the composition of three chosen areas:
spectrum 1 displays the composition where the corrosion products are uniformly
distributed and the crystals are amorphous; spectrum 2 shows the composition where the
corrosion products have the thickest scale and the crystal overlap each other; finally,
spectrum 3 displays the composition on a porous area where the amorphous crystal scale
could not form or it was damaged by either physical or chemical causes.
In spectrum 1, the corrosion films consist mainly of Fe, C, O, Cr and Mo. The EDX results
indicate that films formed on 3% Cr steel are Cr rich.
It is worth noting that chromium scale could not prevent the formation of siderite. It is
believed that the chromium scale becomes compact and continues when it is totally
formed, which will result in higher protection (Jackman, 1999).
In order to highlight the composition of the surface crystals, another type of analysis
offered by the SEM-EDX device was used: the mapping mode. One sample of each steel,
corresponding to the same test conditions after 120 hours submerged into Solution B at
80°C, was analysed at X500 magnification. The images are shown in Figure 30.

59
Figure 30 EDX mapping for surface appearance of corrosion films after 120 hours submerged into Solution B at 80°C
(X500)
Figure 30 shows the iron and carbon levels on the sample surface which were matched
with the crystals observed in the analysis. Iron and chromium (which are part of the
substrate composition in L80Cr1 and L80Cr3), were present on areas “free of corrosion
products”. The mapping concludes to the presence of siderite.
Also, Figure 30 shows that Fe, O, and C are presented in the three corrosion layers, so that
iron carbonates are presented, even with the presence of other corrosion products.
Additionally, Figure 30 shows that the L80Cr3 steel corrosion product has more chromium
contained in its film. Even though the chromium contained in L80Cr1 is higher than in L80,
a) L80, 500X
b) L80Cr1, 500X
c) L80Cr3, 500X

60
this value is still lower than in L80Cr3. Therefore, this is thought absence of Cr scaling in
the corrosion products of L80Cr1.
4.3.3. Surface analysis (X-ray diffraction analysis)
X-Ray diffraction analysis has been used to identify the nature of the scale formed on the
surface of the steel samples, using the property of the specific X-ray diffraction patterns
for each crystal.

61
Figure 31 XRD spectrum made after the bubble test a) XRD spectra for L80, b) XRD spectra for L80Cr1 and c)
Figure 31 (a) for L80, shows the presence of the iron peak at 45, 65 and 82° 2-theta. These
spectras can come either from the substrate or the corrosion product layer.
The peaks such as 24, 32, 53 and 61 match with peaks found on the iron carbonate
characteristic spectrum, according to the database used on site.
Figure 31 (b) for L80Cr1, shows the same peaks for iron carbonate as in L80 spectra.
Additionally it has 3 new peaks which are identified as chromium iron for the data base
a)
b)
c)

62
used on site. This chromium iron can appear either from the substrate or the corrosion
layer. However from the EDX analysis this specie should come from the substrate.
Figure 31 (c) for L80Cr3, shows the same peaks for iron carbonate like L80 and L80Cr1
spectrum. Even though it also has the same peaks for chromium iron as in L80Cr1 spectra,
these spectra are much easier to identify (better definition). Additionally Iron oxide
hydroxide specie was identified in the scale, as well
Chromium three hydroxide species could not be identified in the L80Cr3 sample as a
consequence of roughness surface. According to the SEM-EDX analysis (see 4.3.2) the
Cr(OH)3 is located bellow of the siderite therefore the roughness surface is a barrier to
identified chromium layer scale.
The database has been used to determine if any other reference spectrum from a
different component (such as iron oxide, iron carbides) could fit with the peaks found on
the sample spectrum. As no match has been found the assumption of an iron carbonate
layer formation on the surface of the samples are strengthened, with the peaks
corresponding to a thin FeCO3 film.

63
5. Conclusions
The corrosion rate analysis for the samples without any scale deposition suggests
that L80Cr3 is the best steel for enduring sweet general corrosion, followed by L80
and lastly L80Cr1, which shows the worst performance in Solution A at room
temperature and atmospheric pressure. This inconsistency may be due to the Cr at
lowest concentration perhaps being detrimental for the anodic reaction, and thus
can lead to poor performance in CO2 environments. On the other hand, at 3% Cr or
more, protective films form at conditions in which iron carbonate films are hardly
stable, and they can grow at a pH as low as 5(Kermani et al., 2001).
The results show that the corrosion performance of L80Cr3, L80Cr1% and L80 are
remarkably diferent at the beginning of the bubble experiments, where the
metallurgical factors play the most important role in enduring corrosion. However,
when the corrosion film is formed the corrosion rate of the three steels under study
are in the same range. The formation of corrosion product films can slow down the
corrosion process by forming a diffusion barrier for the reactive species involved in
the corrosion processes, or by covering an area of the metal surface and preventing
it from undergoing further dissolution.
From the results, it was concluded that the microstructure and chemical composition
of the steel influence the corrosion rate:
o L80Cr3 has lower carbon content that the other steels and has micro-alloying
elements such as Al, Mo, V and Ti, which allow it to better endure general
corrosion.
o The L80Cr3 microstructure shows a homogeneous tempered martensitic
structure and homogenous grain distribution that is superior to the other two
steels under study.
For L80Cr3, the corrosion layer was more adherent, compact and uniform than the
layers formed on the L80 and L80Cr1 metal surfaces. Finally, the SEM-EDX and XRD

64
analyses revealed the presence of siderite for the three steels under study.
Additionally, the L80Cr3 corrosion layer contained chromium species, although the
exact nature of the species could not be defined by the XRD due to the roughness of
the sample surface.

65
6. References
2015. Henry's law [Online]. Wikipedia. Available: http://en.wikipedia.org/wiki/Henry%27s_law
[Accessed 23/05/2015 2015].
ABAYARATHNA, D., NARAGHI, A. & WANG, S. 2005. The Effect of Surface Films on Corrosion of
Carbon Steel in a CO2-H2S-H2O System. Corrosion/2005; Houston, TX; USA; 3-7 Apr. 2005.
NACE International, P.O. Box 218340, Houston, TX, 77218, USA.
AHMAD, Z. 2006. Principles of corrosion engineering and corrosion control, Butterworth-
Heinemann.
BARD, A. J. & FAULKNER, L. R. 1980. Electrochemical methods: fundamentals and applications,
Wiley New York.
BARDAL, E. E. 2004. Corrosion and Protection / edited by Einar Bardal, London : Springer London.
BHADESHIA, H. K. D. H. 2015. Tempered Martensite [Online]. Cambridge: University of Cambridge.
Available: http://www.msm.cam.ac.uk/phase-
trans/2004/Tempered.Martensite/tempered.martensite.html [Accessed 05/09/2015.
CHILINGAR, G. V., MOURHATCH, R. & AL-QAHTANI, G. D. 2013. The Fundamentals of Corrosion
and Scaling for Petroleum & Environmental Engineers, Elsevier.
CLARK, C. M. & DUTROW, B. L. 2015. Single-crystal X-ray Diffraction [Online]. Eastern Michigan
University, Louisiana State University. Available:
http://serc.carleton.edu/research_education/geochemsheets/techniques/SXD.html
[Accessed 25/07/2015 2015].
DAVIDSON, M. W. & ABRAMOWITZ, M. 2002. Optical microscopy. Encyclopedia of imaging science
and technology.
DE WAARD, C. & MILLIAMS, D. 1975. Carbonic acid corrosion of steel. Corrosion, 31, 177-181.
DICKSON, A. & MILLERO, F. 1987. A comparison of the equilibrium constants for the dissociation
of carbonic acid in seawater media. Deep Sea Research Part A. Oceanographic Research
Papers, 34, 1733-1743.
DICKSON, A. & RILEY, J. 1979. The estimation of acid dissociation constants in seawater media
from potentionmetric titrations with strong base. I. The ionic product of water—K w.
Marine Chemistry, 7, 89-99.

66
DUGSTAD, A. 1998. Mechanism of protective film formation during CO {sub 2} corrosion of carbon
steel. NACE International, Houston, TX (United States).
ENGINEERING, M. E. A. 2014. SCANNING ELECTRON MICROSCOPY (SEM) [Online]. Plymouth: MEE.
Available: http://www.mee-inc.com/hamm/scanning-electron-microscopy-sem/
[Accessed 25/07/2015 2015].
ETCHANT & STORE. 2015. Nital Etch, 5%, 250 mL [Online]. Available:
http://www.etchantstore.com/Nital-Etch-5-250-mL-105.htm [Accessed 24/06/2015
2015].
EUROCORR 1999. Advances in corrosion control and materials in oil and gas production : papers
from EUROCORR '97 and EUROCORR '98 / edited by P.S. Jackman and L.M. Smith, London,
London : IOM Communications for the European Federation of Corrosion.
GARVERICK, L. 1994. Corrosion in the petrochemical industry, ASM international.
HAFNER, B. 2007. Scanning electron microscopy primer. Characterization Facility, University of
Minnesota-Twin Cities, 1-29.
HEIDERSBACH, R. 2010. Metallurgy and corrosion control in oil and gas production , John Wiley &
Sons.
HITACHI, C. 2015. Hitachi S-3000N [Online]. Available: http://www.hitachi.co.uk/ [Accessed 04-09-
2015.
ISO 11960, S. 2010. ISO 11960: 2010. Specification for Casing and Tubing.
JACKMAN, P. 1999. Advances in Corrosion Control and Materials in Oil and Gas Production: Papers
from EUROCORR'97 and EUROCORR'98, Maney Pub.
JORDAN, K. G. & RHODES, P. R. 1995. Corrosion of Carbon Steel by Co2 Solutions: The Role of Fluid
Flow.
KERMANI, B. 2004. OILFIELD CORROSION & MATERIALS. KeyTech.
KERMANI, B., DOUGAN, M., GONZALEZ, J. C., LINNE, C. & COCHRANE, R. Development of low
carbon Cr-Mo steels with exceptional corrosion resistance for oilfield applications.
CORROSION 2001, 2001. NACE International.
KERMANI, B. & SMITH, L. M. 1997. A Working Party Report on CO2 Corrosion Control in Oil and
Gas Production: Design Considerations, Maney Pub.

67
KERMANI, M. B. & MORSHED, A. 2003. Carbon Dioxide Corrosion in Oil and Gas Production -A
Compendium. Corrosion, 59, 659-683.
KOPLIKU, A., CAVASSI, P., NICE, P. I., JOHNSEN, S., BAZZONI, B. & BAZZONI, A. 2000. Selecting
materials for OCTG with the help of a decision support system. Corrosion 2000; Orlando,
FL; USA; 26-31 Mar. 2000. NACE International, P.O. Box 218340, Houston, TX 77218, USA.
LI, C.-F., DENG, H.-D. & WANG, B. 2008. Influence of corrosion scale on corrosion behavior of
casing pipe steels in environment containing H2S and CO2. Transactions of Materials and
Heat Treatment, 29, 89-93.
LINDSAY, W. L. 1979. Chemical equilibria in soils, John Wiley and Sons Ltd.
LOPEZ, D., PEREZ, T. & SIMISON, S. 2003a. The influence of microstructure and chemical
composition of carbon and low alloy steels in CO 2 corrosion. A state-of-the-art appraisal.
Materials & Design, 24, 561-575.
LOPEZ, D. A., SCHREINER, W. H., DE SANCHEZ, S. R. & SIMISON, S. N. 2003b. The influence of
carbon steel microstructure on corrosion layers An XPS and SEM characterization. Applied
Surface Science (Netherlands), 207, 69-85.
LOWER, S. K. 1999. Carbonate equilibria in natural waters. Simon Fraser University, 544.
MACK, R. The effect of tubular expansion on the mechanical properties and performance of
selected OCTG-results of laboratory studies. Offshore Technology Conference, 2005.
Offshore Technology Conference.
MANCHESTER, T. U. O. 2015. X-ray Diffraction [Online]. Manchester. Available:
http://www.materials.manchester.ac.uk/our-research/facilities/x-ray-diffraction/.
MORALES, C., PEREZ, T., ECHANIZ, G. & TURCONI, G. L. ND. Development of low alloyed carbon
steel OGTC products for corrosive environments. Argentine: Tenaris.
NELSON, S. A. 2014. X-Ray Crystallography. X-Ray Crystallography [Online]. Available:
http://www.tulane.edu/~sanelson/eens211/x-ray.htm.
REN, C., LIU, D., BAI, Z. & LI, T. 2005. Corrosion behavior of oil tube steel in simulant solution with
hydrogen sulfide and carbon dioxide. Materials chemistry and physics, 93, 305-309.
REVIE, R. W. 2008. Corrosion and corrosion control, John Wiley & Sons.
RICHARDSON, T. J. A., COTTIS, B. R. A., LINDSAY, R., LYON, S., SCANTLEBURY, D. J. D., STOTT, H. &
GRAHAM, M. 2010. Shreir's corrosion, Elsevier Science.

68
SANDERS, L. 2014. An integrated study of corrosion and scale interactions in the absence and
presence of combined chemicals. University of Leeds.
SCENINI, F. 2014. Localized Corrosion. Localized Corrosion. Manchester.
SCULLY, J. R. 2000. Polarization resistance method for determination of instantaneous corrosion
rates. Corrosion, 56, 199-218.
SWAPP, S. 2015. Scanning Electron Microscopy (SEM) [Online]. University of Wyoming: University
of Wyoming. Available:
http://serc.carleton.edu/research_education/geochemsheets/techniques/SEM.html
[Accessed 25/07/2015 2015].
TANUPABRUNGSUN, T. 2013. Thermodynamics and Kinetics of Carbon Dioxide Corrosion of Mild
Steel at Elevated Temperatures. Ohio University.
TENARIS. 2015. OCTG [Online]. Available: http://www.tenaris.com/en/Products/OCTG.aspx
[Accessed 28/02/2015.
THOMAS, J. M. 2012. Centenary: The birth of X-ray crystallography. Nature, 491, 186-187.
TRETHEWEY, K. R. & CHAMBERLAIN, J. 1995. Corrosion for science and engineering.
UEDA, M. & IKEDA, A. Effect of microstructure and Cr content in steel on CO2 corrosion.
CORROSION 96, 1996. NACE International.
VANDER VOORT, G. F. 1984. Metallography, principles and practice, ASM International.
WEISS, R. F. 1974. Carbon dioxide in water and seawater: the solubility of a non-ideal gas. Marine
chemistry, 2, 203-215.