corruption. measuring corruption transparency international (ti) –corruption perception index the...
TRANSCRIPT

Corruption
Measuring corruption
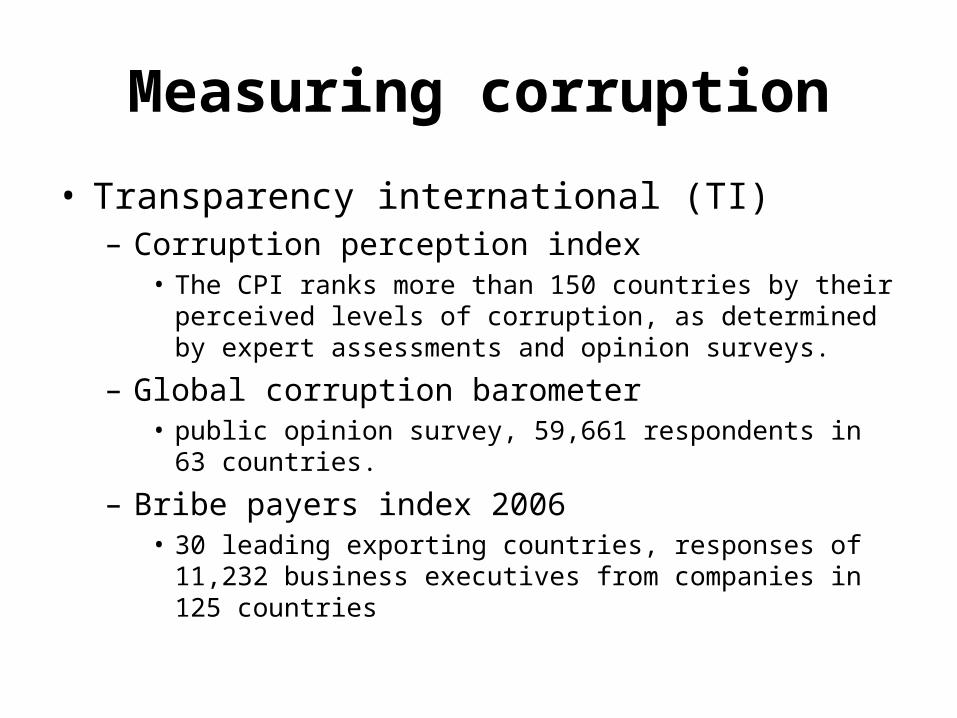
• Transparency international (TI) – Corruption perception index
• The CPI ranks more than 150 countries by their perceived levels of corruption, as determined by expert assessments and opinion surveys.
– Global corruption barometer• public opinion survey, 59,661 respondents in 63 countries.
– Bribe payers index 2006• 30 leading exporting countries, responses of 11,232
business executives from companies in 125 countries
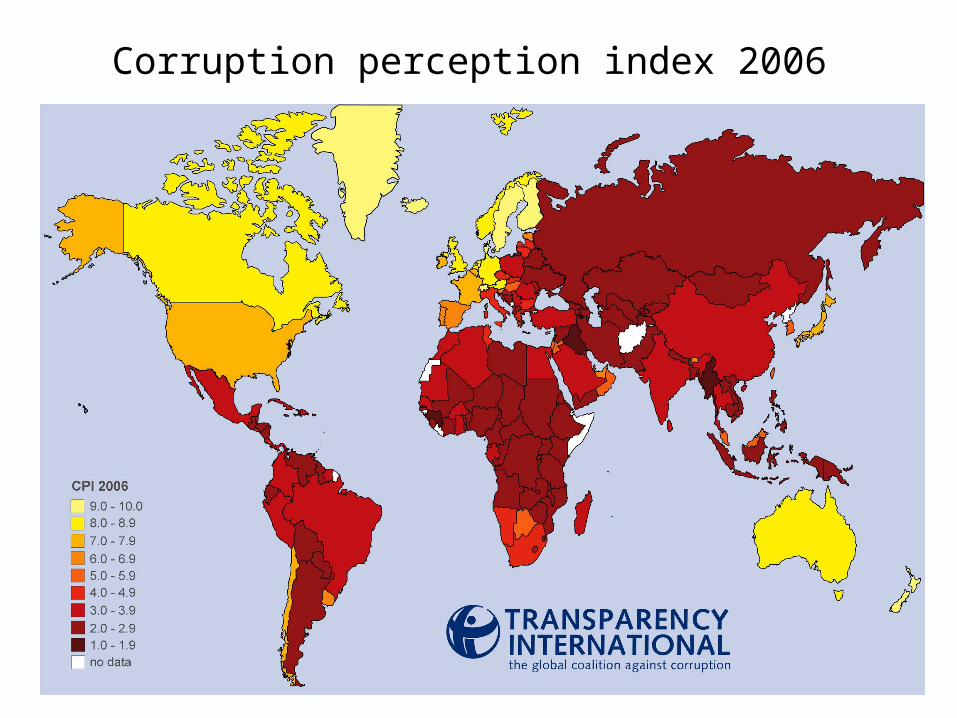
Corruption perception index 2006

CPI 2006: Eastern Europe and Former Soviet Union

Global corruption barometer 2005

Does corruption reduce economic growth?
• Corruption might raise economic growth (Leff, 1964; Huntington, 1968)– Help avoiding bureaucratic delays in countries with
cumbersome regulations– Encourage bureaucrats to work harder
• Corruption reduces economic growth– Discourage investing in long-run projects (Mauro,
1995)– Distort allocation of resources – less in transparent
projects (education) more in hard-to-monitor projects (construction) – Shleifer and Vishny (1993)

Empirical investigation (Mauro, 1995)
• Support the hypothesis that corruption reduces economic growth
• Reduction of corruption by one standard deviation leads to– Increase in investment rate by 2.9% per year– Increase in economic growth by 1.3% per
year
• The result holds regardless of how cumbersome the laws are


What are the determinants of corruption?
• Triesman, 2000– Whether country was democratic for decades– openness to trade– cultural and institutional traditions
• Protestantism• Colonial origin
– Economic development

Specific instances of corruption
• Height distribution of French males was influenced by minimum height for conscription (Quetlet, 1846)
• Political connections influenced stock prices of private companies (Fisman 2001)
• Corruption and sport (Duggan and Levitt, 2002)

Corruption and Sumo (Duggan and Levitt, 2002)
• Non-linearity in payoffs:– normally a win increase ranking of an athlete
by 3 spots– the 8th win increase ranking by 11 spots
• Irregular form of distribution of wins– distribution of wins closely follows binomial
distribution– there are unusually high frequency of winning
the 8th win


Collusion or effort?
• H0: unusually high percentage of winning the 8th match is due to collusion between wrestlers
• H1: wrestler who has 7 wins exerts more effort to get the 8th win

Indirect evidence in favor of collusion
• The next time that those same two wrestlers face each other, it is the opponent who has an unusually high win percentage
• Win rates for wrestlers on the bubble vary in accordance with factors predicted by theory to support implicit collusion. – success rates for wrestlers on the bubble rise
throughout the career – success rates for wrestlers on the bubble fall in the
last year of a wrestler's career.• Match rigging disappears during times of
increased media scrutiny

Indirect evidence in favor of collusion
• Some wrestling stables (known as heya) appear to have worked out reciprocity agreements with other stables: wrestlers from either stable do exceptionally well on the bubble against one another
• Wrestlers identified as "not corrupt" do no better in matches on the bubble than in typical matches, whereas those accused of being corrupt are extremely successful on the bubble.

Conclusions
• Corruption reduces economic growth through negative impact on investment
• Cultural and institutional traditions have long lasting impact on corruption levels
• Studies of specific mechanisms of corruption in various areas of life help to understand how corruption distort incentives