cost and performance baseline for fossil energy plants national energy technology laboratory may 15,...
TRANSCRIPT
Cost and Performance Baseline for Fossil Energy Plants
National Energy Technology Laboratory
May 15, 2007Revised August 2007
Final Results
Revised 7/27/072
DisclaimerThis presentation was prepared as an account of work sponsored by an agency of the United States Government. Neither the United States Government nor any agency thereof, nor any of their employees, makes any warranty, express or implied, or assumes any legal liability or responsibility for the accuracy, completeness, or usefulness of any information, apparatus, product, or process disclosed, or represents that its use would not infringe privately owned rights. Reference therein to any specific commercial product, process, or service by trade name, trademark, manufacturer, or otherwise does not necessarily constitute or imply its endorsement, recommendation, or favoring by the United States Government or any agency thereof. The views and opinions of authors expressed therein do not necessarily state or reflect those of the United States Government or any agency thereof.

Revised 7/27/073
Objective Determine cost and performance estimates of
near-term commercial offerings for power plants both with and without current technology for CO2 capture Consistent design requirements Up-to-date performance and capital cost estimates Technologies built now and deployed by 2010-2012
Provides baseline costs and performance Compare existing technologies Guide R&D for advancing technologies within the FE
Program

Revised 7/27/074
Study Matrix
Plant
Type
ST Cond.
(psig/°F/°F)GT
Gasifier/
Boiler
Acid Gas Removal/
CO2 Separation / Sulfur Recovery
CO2
Cap
IGCC
1800/1050/1050 (non-CO2
capture cases)
1800/1000/1000
(CO2 capture cases)
F Class
GESelexol / - / Claus
Selexol / Selexol / Claus 90%
CoP
E-Gas
MDEA / - / Claus
Selexol / Selexol / Claus 88%1
ShellSulfinol-M / - / Claus
Selexol / Selexol / Claus 90%
PC
2400/1050/1050
SubcriticalWet FGD / - / Gypsum
Wet FGD / Econamine / Gypsum 90%
3500/1100/1100
Supercritical
Wet FGD / - / Gypsum
Wet FGD / Econamine / Gypsum 90%
NGCC 2400/1050/950 F Class HRSG- / Econamine / - 90%
GEE – GE EnergyCoP – Conoco Phillips
1 CO2 capture is limited to 88% by syngas CH4 content
Revised 7/27/075
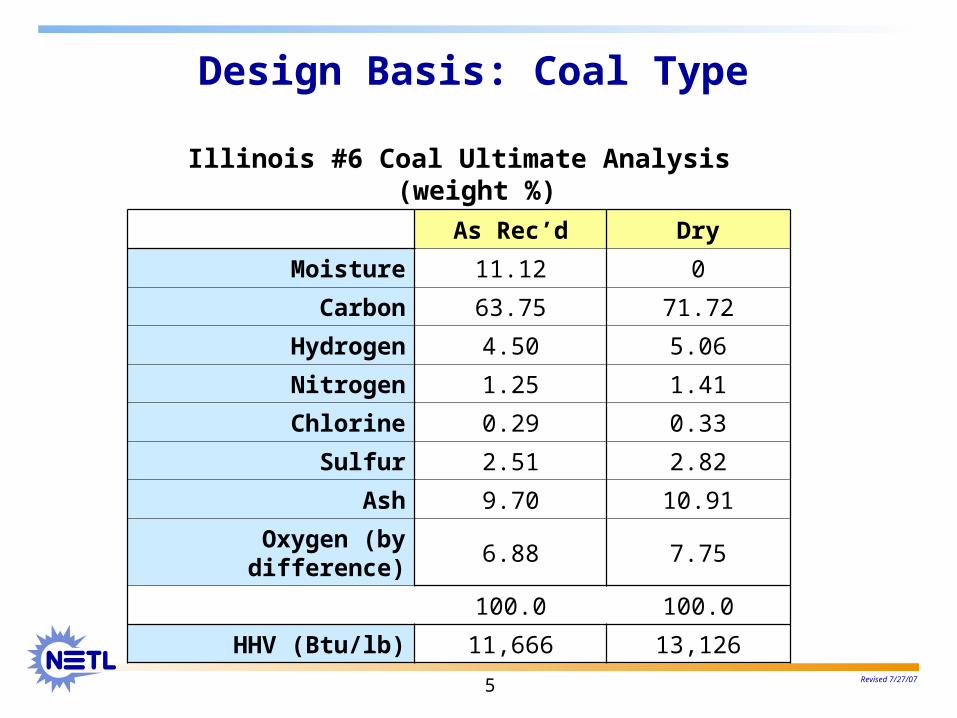
Design Basis: Coal Type
Illinois #6 Coal Ultimate Analysis (weight %)
As Rec’d Dry
Moisture 11.12 0
Carbon 63.75 71.72
Hydrogen 4.50 5.06
Nitrogen 1.25 1.41
Chlorine 0.29 0.33
Sulfur 2.51 2.82
Ash 9.70 10.91
Oxygen (by difference) 6.88 7.75
100.0 100.0
HHV (Btu/lb) 11,666 13,126

Revised 7/27/076
Environmental Targets
PollutantIGCC1 PC2 NGCC3
SO20.0128
lb/MMBtu0.085
lb/MMBtu< 0.6 gr S /100
scf
NOx15 ppmv (dry)
@ 15% O2
0.07 lb/MMBtu
2.5 ppmv @ 15% O2
PM0.0071
lb/MMBtu0.017
lb/MMBtuNegligible
Hg > 90% capture1.14 lb/TBtu
Negligible
1 Based on EPRI’s CoalFleet User Design Basis Specification for Coal-Based IGCC Power Plants2 Based on BACT analysis, exceeding new NSPS requirements3 Based on EPA pipeline natural gas specification and 40 CFR Part 60, Subpart KKKK
Revised 7/27/077
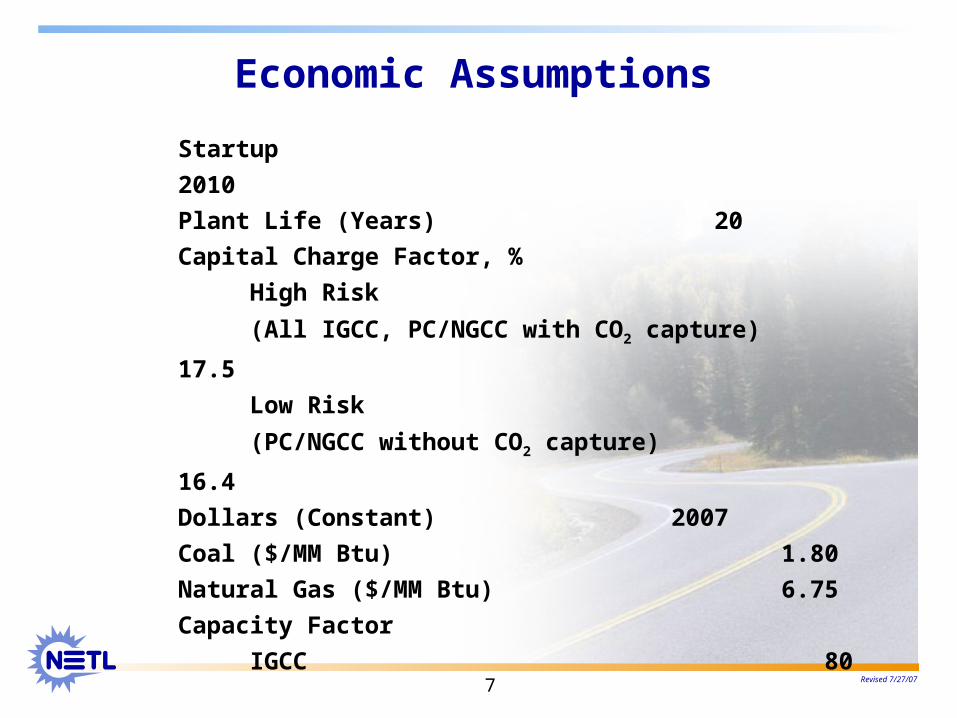
Economic Assumptions
Startup 2010
Plant Life (Years) 20
Capital Charge Factor, %
High Risk
(All IGCC, PC/NGCC with CO2 capture) 17.5
Low Risk
(PC/NGCC without CO2 capture) 16.4
Dollars (Constant) 2007
Coal ($/MM Btu) 1.80
Natural Gas ($/MM Btu) 6.75
Capacity Factor
IGCC 80
PC/NGCC 85
Revised 7/27/078
Technical Approach
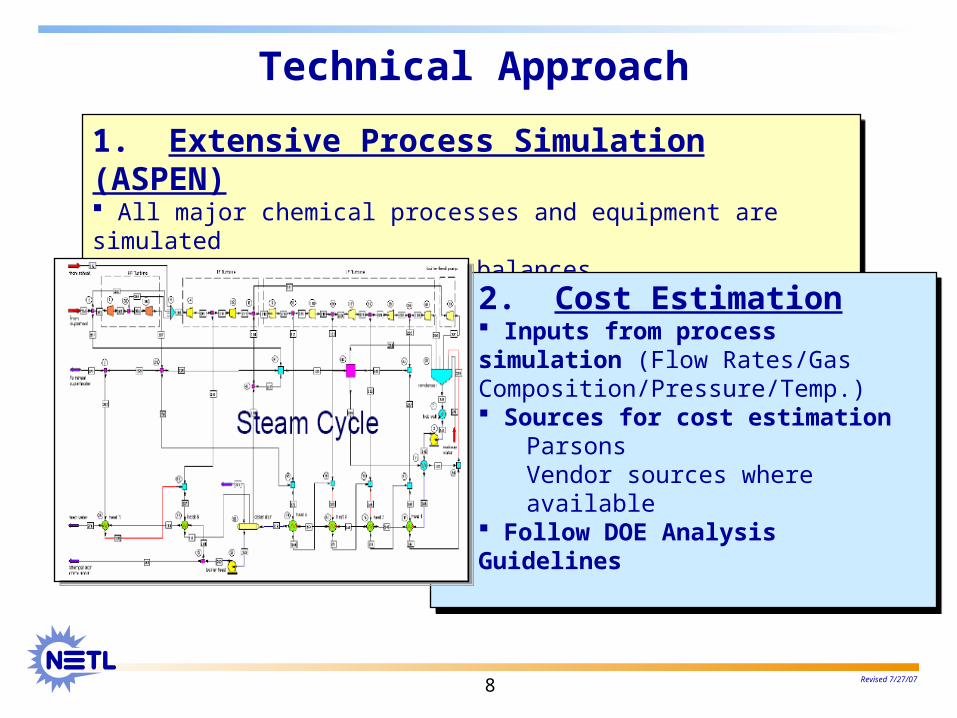
1. Extensive Process Simulation (ASPEN) All major chemical processes and equipment are simulated Detailed mass and energy balances Performance calculations (auxiliary power, gross/net power output)
1. Extensive Process Simulation (ASPEN) All major chemical processes and equipment are simulated Detailed mass and energy balances Performance calculations (auxiliary power, gross/net power output)
2. Cost Estimation Inputs from process simulation (Flow Rates/Gas Composition/Pressure/Temp.) Sources for cost estimation
Parsons Vendor sources where available
Follow DOE Analysis Guidelines
2. Cost Estimation Inputs from process simulation (Flow Rates/Gas Composition/Pressure/Temp.) Sources for cost estimation
Parsons Vendor sources where available
Follow DOE Analysis Guidelines

Revised 7/27/079
Study Assumptions
Capacity Factor assumed to equal Availability IGCC capacity factor = 80% w/ no spare gasifier PC and NGCC capacity factor = 85%
GE gasifier operated in radiant/quench mode Shell gasifier with CO2 capture used water injection for
cooling (instead of syngas recycle) Nitrogen dilution was used to the maximum extent possible in
all IGCC cases and syngas humidification/steam injection were used only if necessary to achieve approximately 120 Btu/scf syngas LHV
In CO2 capture cases, CO2 was compressed to 2200 psig, transported 50 miles, sequestered in a saline formation at a depth of 4,055 feet and monitored for 80 years
CO2 transport, storage and monitoring (TS&M) costs were included in the levelized cost of electricity (COE)

Revised 7/27/0710
IGCC Power Plant
Current State-of-the-Art

Revised 7/27/0711
Current TechnologyIGCC Power Plant
Emission Controls:PM: Water scrubbing and/or candle filters to get 0.0071 lb/MMBtu NOx: N2 dilution to ~120 Btu/scf LHV to get 15 ppmv @15% O2
SOx: AGR design target of 0.0128 lb/MMBtu; Claus plant with tail gas recycle for ~99.8% overall S recovery
Hg: Activated carbon beds for ~95% removal
Advanced F-Class CC Turbine: 232 MWe
Steam Conditions:1800 psig/1050°F/1050°F (non-CO2 capture cases)
1800 psig/1000°F/1000°F (CO2 capture cases)

Revised 7/27/0712
GE Energy Radiant
Coal
Cryogenic Oxygen
Slag/Fines
Water
High Pressure
Steam
Radiant Syngas Cooler
Radiant Quench Gasifier
SyngasScrubber
Solids
Saturated Syngas 398OF
Quench Chamber
2,500OF
1,100OF
419OF
Coal
Cryogenic Oxygen
Slag/Fines
Water
High Pressure
Steam
Radiant Syngas Cooler
Radiant Quench Gasifier
SyngasScrubber
Solids
Saturated Syngas 398OF
Quench Chamber
2,500OF
1,100OF
419OF
Coal Slurry63 wt.%
95% O2
Slag/Fines
Syngas 410°F, 800 Psia
Composition (Mole%):H2 26%CO 27%CO2 12%H2O 34%Other 1%H2O/CO = 1.3
Design: Pressurized, single-stage, downward firing, entrained flow, slurry feed, oxygen blown, slagging, radiant and quench cooling
Note: All gasification performance data estimated by the project team to be representative of GE gasifier
To Acid Gas Removalor
To Shift
Revised 7/27/0713
ConocoPhillips E-Gas™
Coal Slurry63 wt. %
Stage 2
95 % O2Slag
Quench
Char
Slag/Water Slurry
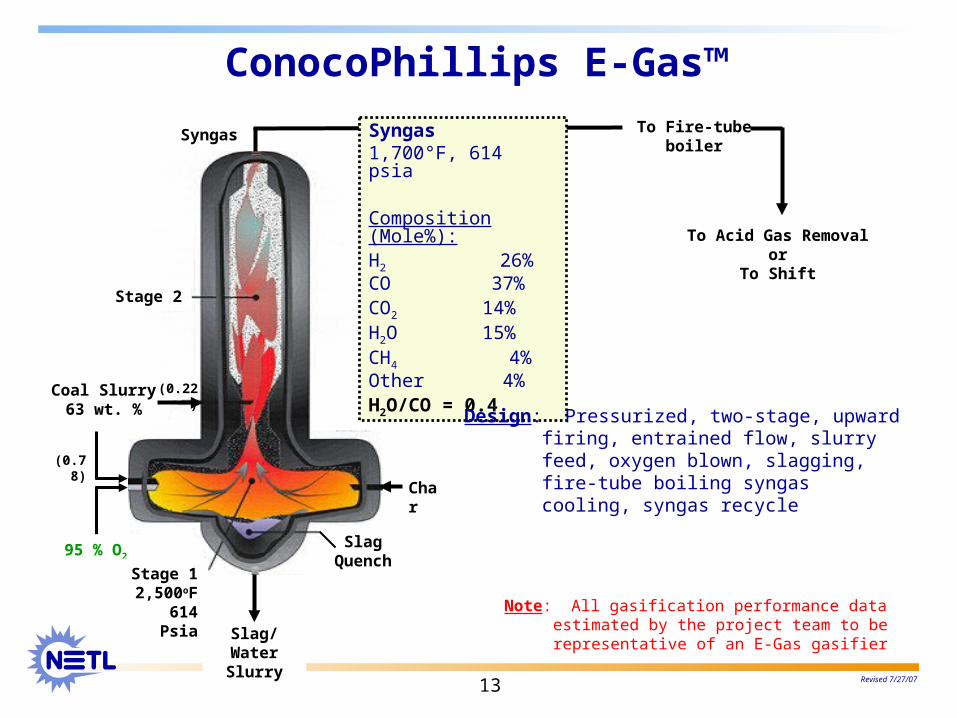
Syngas Syngas1,700°F, 614 psia
Composition (Mole%):H2 26%CO 37%CO2 14%H2O 15%CH4 4%Other 4%H2O/CO = 0.4
(0.78)
(0.22)
Stage 12,500oF
614 Psia
To Fire-tube boiler
Design: Pressurized, two-stage, upward firing, entrained flow, slurry feed, oxygen blown, slagging, fire-tube boiling syngas cooling, syngas recycle
Note: All gasification performance data estimated by the project team to be representative of an E-Gas gasifier
To Acid Gas Removalor
To Shift

Revised 7/27/0714
Shell Gasification
Syngas350°F, 600 Psia
Composition (Mole%):H2 29%CO 57%CO2 2%H2O 4%Other 8%H2O/CO = 0.1
DryCoal
Design: Pressurized, single-stage, downward firing, entrained flow, dry feed, oxygen blown, convective cooler
Convective CoolerSoot Quench& Scrubber
95% O2
HP Steam
650oF
Steam
Source: “The Shell Gasification Process”, Uhde, ThyssenKrupp Technologies
Syngas Quench2
Notes: 1. All gasification performance data
estimated by the project team to be representative of Shell gasifier.
2. CO2 capture incorporates full water quench instead of syngas quench.
To Acid Gas Removalor
To Shift
HP Steam
Slag
Gasifier2,700oF
615 psia
Revised 7/27/0715
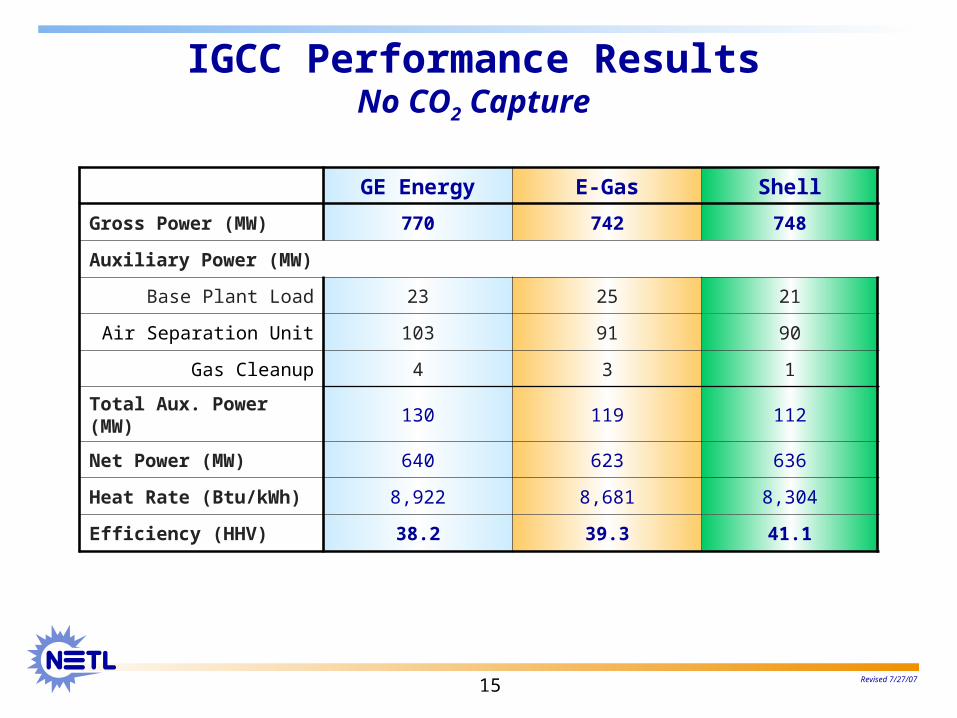
IGCC Performance ResultsNo CO2 Capture
GE Energy E-Gas Shell
Gross Power (MW) 770 742 748
Auxiliary Power (MW)
Base Plant Load 23 25 21
Air Separation Unit 103 91 90
Gas Cleanup 4 3 1
Total Aux. Power (MW) 130 119 112
Net Power (MW) 640 623 636
Heat Rate (Btu/kWh) 8,922 8,681 8,304
Efficiency (HHV) 38.2 39.3 41.1
Revised 7/27/0716
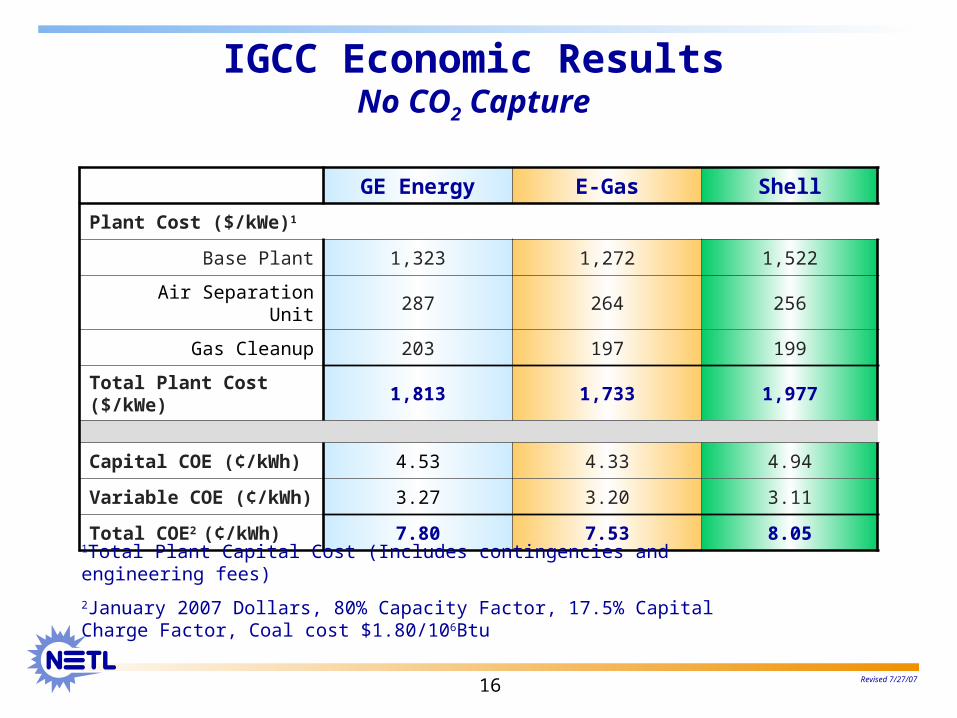
IGCC Economic ResultsNo CO2 Capture
GE Energy E-Gas Shell
Plant Cost ($/kWe)1
Base Plant 1,323 1,272 1,522
Air Separation Unit 287 264 256
Gas Cleanup 203 197 199
Total Plant Cost ($/kWe) 1,813 1,733 1,977
Capital COE (¢/kWh) 4.53 4.33 4.94
Variable COE (¢/kWh) 3.27 3.20 3.11
Total COE2 (¢/kWh) 7.80 7.53 8.05
1Total Plant Capital Cost (Includes contingencies and engineering fees)
2January 2007 Dollars, 80% Capacity Factor, 17.5% Capital Charge Factor, Coal cost $1.80/106Btu
Revised 7/27/0717
IGCC Power Plant
With CO2 Capture
Revised 7/27/0718
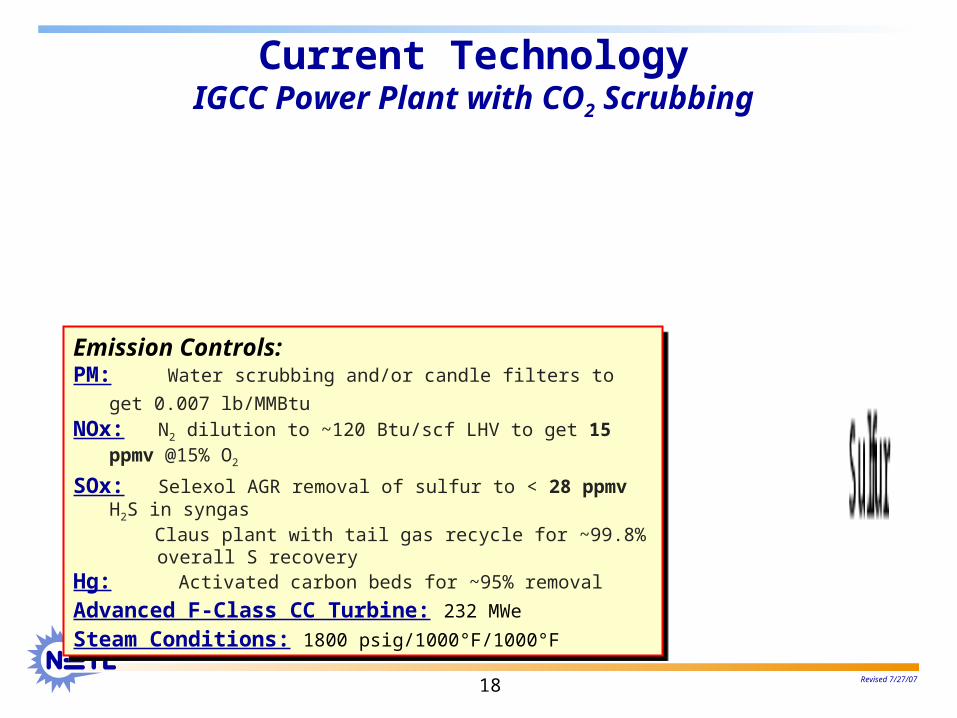
Current TechnologyIGCC Power Plant with CO2 Scrubbing
Emission Controls:PM: Water scrubbing and/or candle filters to get 0.007 lb/MMBtu NOx: N2 dilution to ~120 Btu/scf LHV to get 15 ppmv @15% O2
SOx: Selexol AGR removal of sulfur to < 28 ppmv H2S in syngas Claus plant with tail gas recycle for ~99.8% overall S recovery
Hg: Activated carbon beds for ~95% removal
Advanced F-Class CC Turbine: 232 MWe
Steam Conditions: 1800 psig/1000°F/1000°F

Revised 7/27/0719
Shift 1 Shift 2 Shift 3
Water-Gas Shift Reactor System
H2O/CO Ratio1
GE 1.3
E-Gas 0.4
Shell 1.5
Design: Haldor Topsoe SSK Sulfur Tolerant Catalyst Up to 97.5% CO Conversion 2 stages for GE and Shell, 3 stages for E-Gas H2O/CO = 2.0 (Project Assumption) Overall P = ~30 psia
775oF 450oF 500oF 450oF Cooling
Relative HP* Steam Flow
Steam Turbine Output (MW)
GE 1.0 275
E-Gas 2.4 230
Shell 0.9 230
455oF
Steam Steam
H2O + CO CO2 + H2
*High Pressure Steam
1 Prior to shift steam addition
Revised 7/27/0720
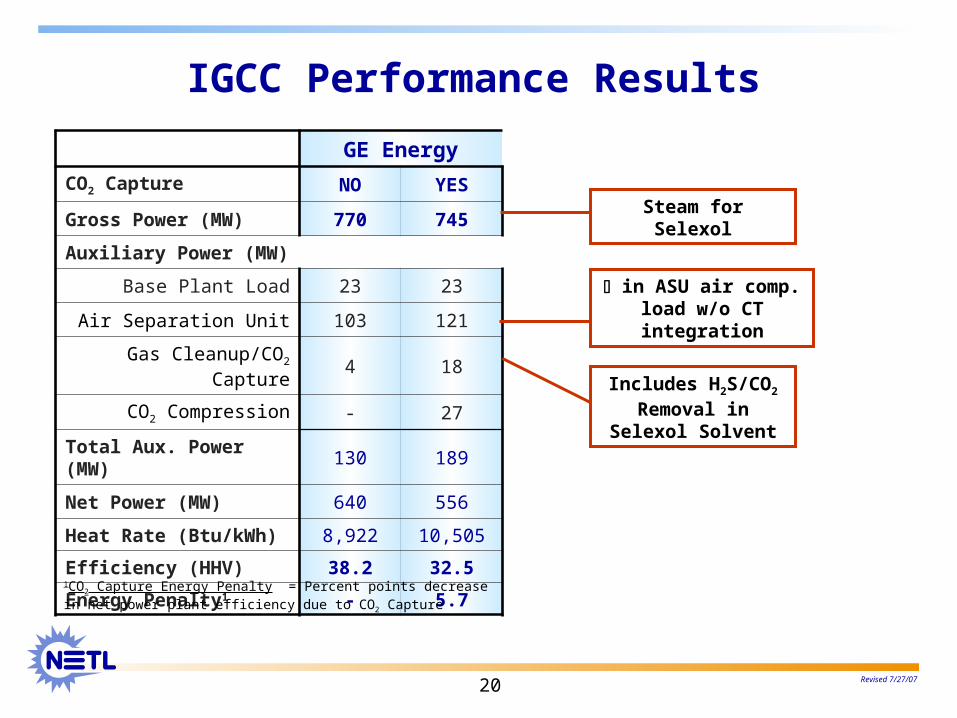
IGCC Performance Results
GE Energy
CO2 Capture NO YES
Gross Power (MW) 770 745
Auxiliary Power (MW)
Base Plant Load 23 23
Air Separation Unit 103 121
Gas Cleanup/CO2 Capture 4 18
CO2 Compression - 27
Total Aux. Power (MW) 130 189
Net Power (MW) 640 556
Heat Rate (Btu/kWh) 8,922 10,505
Efficiency (HHV) 38.2 32.5
Energy Penalty1 - 5.7
1CO2 Capture Energy Penalty = Percent points decrease in net power plant efficiency due to CO2 Capture
in ASU air comp. load w/o CT integration
Steam for Selexol
Includes H2S/CO2 Removal in Selexol
Solvent
Revised 7/27/0721
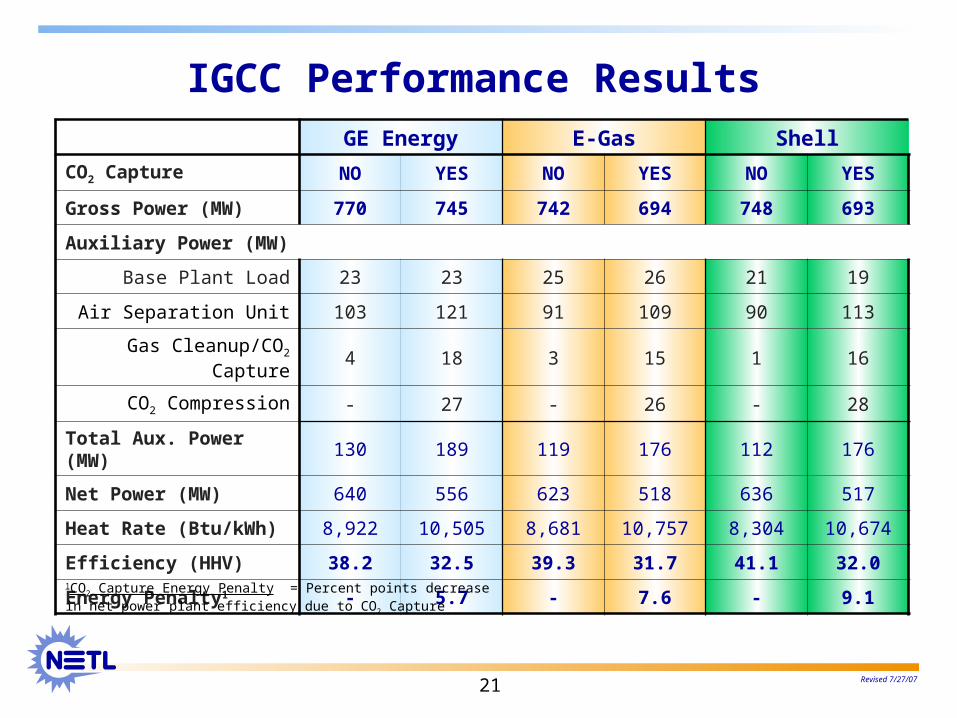
IGCC Performance ResultsGE Energy E-Gas Shell
CO2 Capture NO YES NO YES NO YES
Gross Power (MW) 770 745 742 694 748 693
Auxiliary Power (MW)
Base Plant Load 23 23 25 26 21 19
Air Separation Unit 103 121 91 109 90 113
Gas Cleanup/CO2 Capture 4 18 3 15 1 16
CO2 Compression - 27 - 26 - 28
Total Aux. Power (MW) 130 189 119 176 112 176
Net Power (MW) 640 556 623 518 636 517
Heat Rate (Btu/kWh) 8,922 10,505 8,681 10,757 8,304 10,674
Efficiency (HHV) 38.2 32.5 39.3 31.7 41.1 32.0
Energy Penalty1 - 5.7 - 7.6 - 9.1
1CO2 Capture Energy Penalty = Percent points decrease in net power plant efficiency due to CO2 Capture

Revised 7/27/0722
IGCC Economic ResultsGE Energy E-Gas Shell
CO2 Capture NO YES NO YES NO YES
Plant Cost ($/kWe)1
Base Plant 1,323 1,566 1,272 1,592 1,522 1,817
Air Separation Unit 287 342 264 329 256 336
Gas Cleanup/CO2 Capture 203 414 197 441 199 445
CO2 Compression - 68 - 69 - 70
Total Plant Cost ($/kWe) 1,813 2,390 1,733 2,431 1,977 2,668
Capital COE (¢/kWh) 4.53 5.97 4.33 6.07 4.94 6.66
Variable COE (¢/kWh) 3.27 3.93 3.20 4.09 3.11 3.97
CO2 TS&M COE (¢/kWh) 0.00 0.39 0.00 0.41 0.00 0.41
Total COE2 (¢/kWh) 7.80 10.29 7.53 10.57 8.05 11.04
Increase in COE (%) - 32 - 40 - 37
$/tonne CO2 Avoided - 35 - 45 - 46
1Total Plant Capital Cost (Includes contingencies and engineering fees)
2January 2007 Dollars, 80% Capacity Factor, 17.5% Capital Charge Factor, Coal cost $1.80/106Btu
Revised 7/27/0723
Comparison to PC and NGCC
Current State-of-the-Art

Revised 7/27/0724
Current TechnologyPulverized Coal Power Plant*
PM Control: Baghouse to achieve 0.013 lb/MMBtu (99.8% removal)
SOx Control: FGD to achieve 0.085 lb/MMBtu (98% removal)
NOx Control: LNB + OFA + SCR to maintain 0.07 lb/MMBtu
Mercury Control: Co-benefit capture ~90% removal
Steam Conditions (Sub): 2400 psig/1050°F/1050°F
Steam Conditions (SC): 3500 psig/1100°F/1100°F
*Orange Blocks Indicate Unit Operations Added for CO2 Capture Case
Revised 7/27/0725
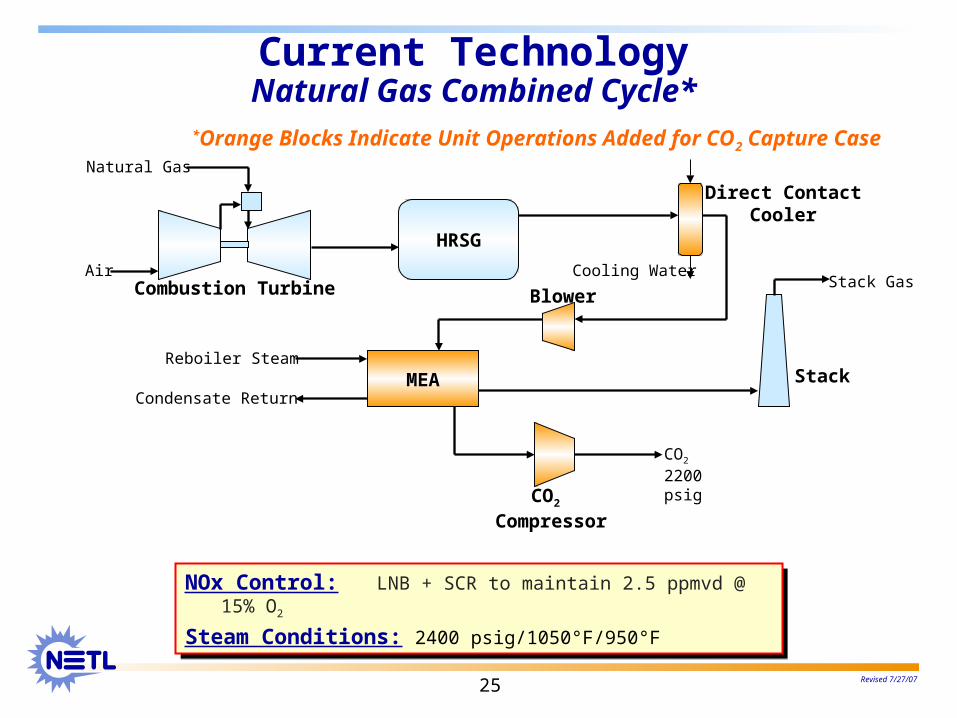
Current TechnologyNatural Gas Combined Cycle*
NOx Control: LNB + SCR to maintain 2.5 ppmvd @ 15% O2
Steam Conditions: 2400 psig/1050°F/950°F
NOx Control: LNB + SCR to maintain 2.5 ppmvd @ 15% O2
Steam Conditions: 2400 psig/1050°F/950°F
*Orange Blocks Indicate Unit Operations Added for CO2 Capture Case
HRSG
MEA
Combustion Turbine
CO2 Compressor
Stack
Direct ContactCooler
Blower
Natural Gas
Air Cooling WaterStack Gas
CO2
2200 psig
Reboiler Steam
Condensate Return
Revised 7/27/0726
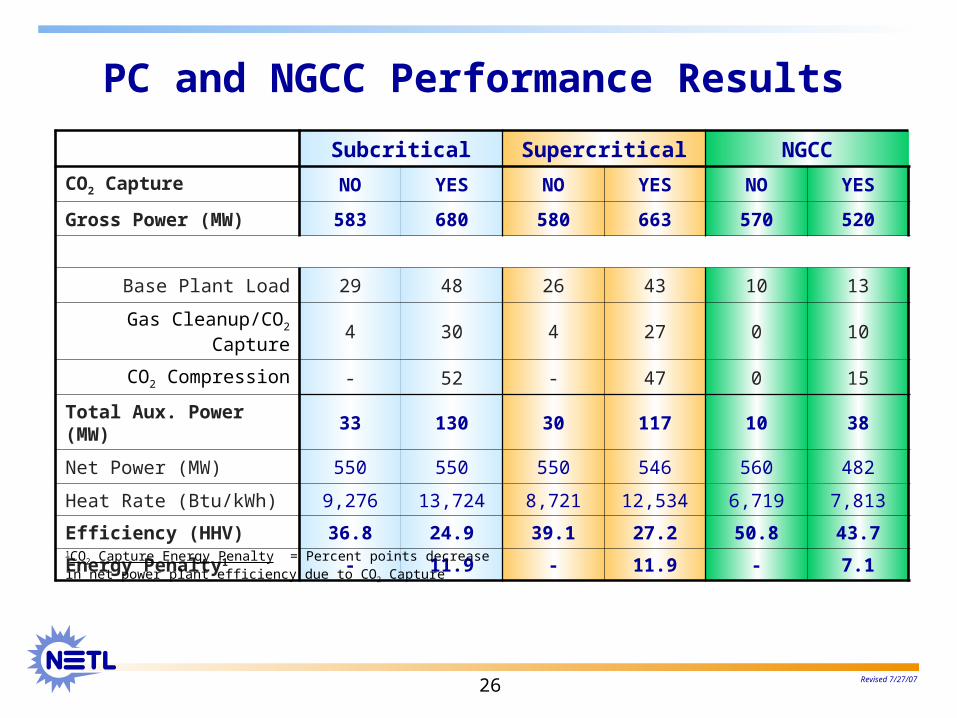
PC and NGCC Performance Results
Subcritical Supercritical NGCC
CO2 Capture NO YES NO YES NO YES
Gross Power (MW) 583 680 580 663 570 520
Base Plant Load 29 48 26 43 10 13
Gas Cleanup/CO2 Capture 4 30 4 27 0 10
CO2 Compression - 52 - 47 0 15
Total Aux. Power (MW) 33 130 30 117 10 38
Net Power (MW) 550 550 550 546 560 482
Heat Rate (Btu/kWh) 9,276 13,724 8,721 12,534 6,719 7,813
Efficiency (HHV) 36.8 24.9 39.1 27.2 50.8 43.7
Energy Penalty1 - 11.9 - 11.9 - 7.1
1CO2 Capture Energy Penalty = Percent points decrease in net power plant efficiency due to CO2 Capture

Revised 7/27/0727
PC and NGCC Economic ResultsSubcritical Supercritical NGCC
CO2 Capture NO YES NO YES NO YES
Plant Cost ($/kWe)1
Base Plant 1,302 1,689 1,345 1,729 554 676
Gas Cleanup (SOx/NOx) 246 323 229 302 - -
CO2 Capture - 792 - 752 - 441
CO2 Compression - 89 - 85 - 52
Total Plant Cost ($/kWe) 1,549 2,895 1,575 2,870 554 1,172
Capital COE (¢/kWh) 3.41 6.81 3.47 6.75 1.22 2.75
Variable COE (¢/kWh) 2.99 4.64 2.86 4.34 5.62 6.70
CO2 TS&M COE (¢/kWh) 0.00 0.43 0.00 0.39 0.00 0.29
Total COE2 (¢/kWh) 6.40 11.88 6.33 11.48 6.84 9.74
Increase in COE (%) - 85 - 81 - 43
$/tonne CO2 Avoided - 75 - 75 - 911Total Plant Capital Cost (Includes contingencies and engineering fees)
2January 2007 Dollars, 85% Capacity Factor, 16.4% (no capture) 17.5% (capture) Capital Charge Factor, Coal cost $1.80/106Btu, Natural Gas cost $6.75/106Btu
Revised 7/27/0728
Environmental Performance Comparison
IGCC, PC and NGCC

Revised 7/27/0729
Criteria Pollutant Emissions for All Cases
0.00
0.01
0.02
0.03
0.04
0.05
0.06
0.07
0.08
0.09
0.10
0.11
0.12
GE GEw/CO2
CoP CoPw/CO2
Shell Shellw/CO2
PC-sub PC-subw/CO2
PC-SC PC-SCw/CO2
NGCC NGCCw/CO2
Em
iss
ion
s (
lb/M
MB
tu)
SO2
NOx
PM
Hg0.0
0.2
0.4
0.6
0.8
1.0
1.2
GE GEw/CO2
CoP CoPw/CO2
Shell Shellw/CO2
PC-sub PC-subw/CO2
PC-SC PC-SCw/CO2
NGCC NGCCw/CO2
Hg lb/TBtu

Revised 7/27/0730
CO2 Emissions for All Cases
197
19.6
199
23.6
200
18.7
203
20.3
203
20.3
119
11.9
0
50
100
150
200
250
GE GEw/CO2
CoP CoPw/CO2
Shell Shellw/CO2
PC-sub
PC-sub
w/CO2
PC-SC PC-SCw/CO2
NGCC NGCCw/CO2
lb/M
MB
tu

Revised 7/27/0731
Raw Water Usage Comparison
IGCC, PC and NGCC
Revised 7/27/0732
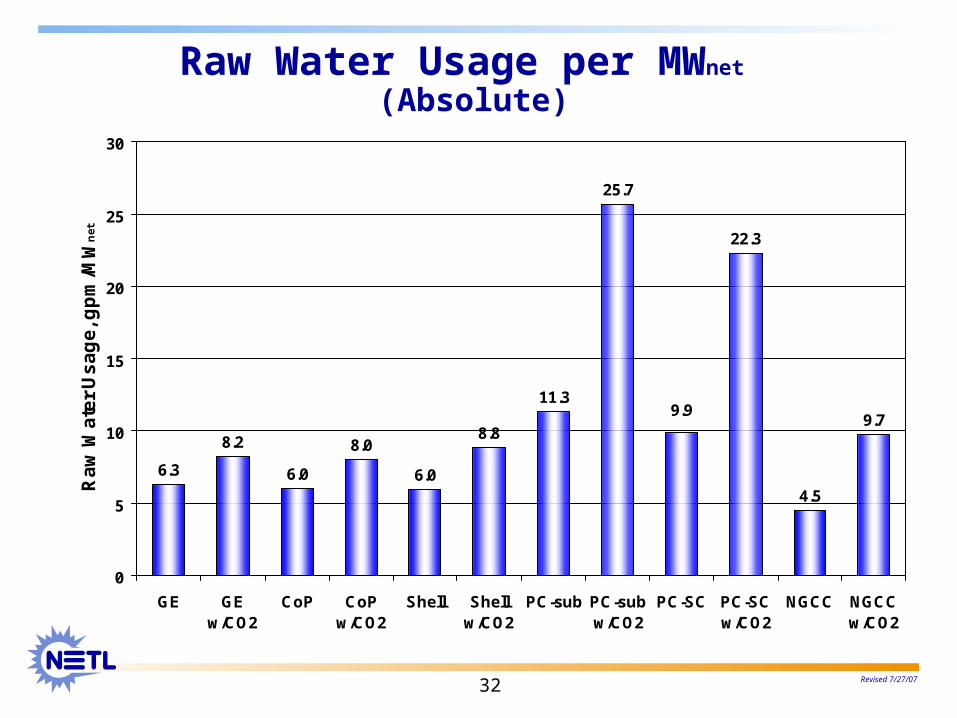
Raw Water Usage per MWnet (Absolute)
6.3
8.2
6.0
8.0
6.0
8.8
11.3
25.7
22.3
4.5
9.79.9
0
5
10
15
20
25
30
GE GEw/CO2
CoP CoPw/CO2
Shell Shellw/CO2
PC-sub PC-subw/CO2
PC-SC PC-SCw/CO2
NGCC NGCCw/CO2
Ra
w W
ate
r U
sa
ge
, gp
m/M
Wn
et
Revised 7/27/0733
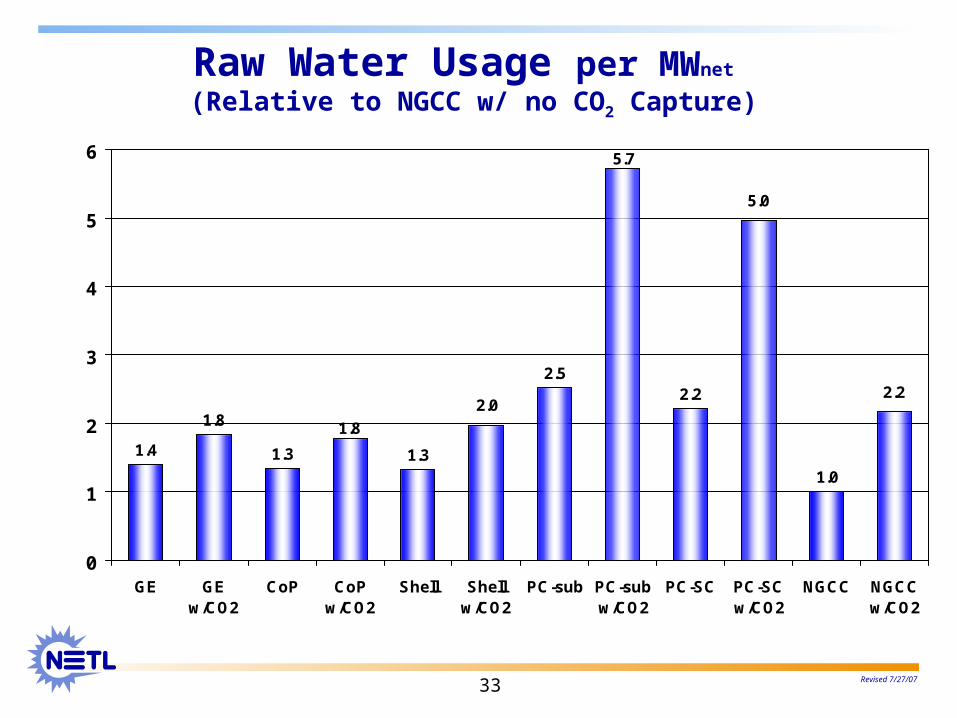
Raw Water Usage per MWnet (Relative to NGCC w/ no CO2 Capture)
1.4
1.8
1.3 1.3
2.52.2
1.0
5.7
2.2
5.0
2.0
1.8
0
1
2
3
4
5
6
GE GEw/CO2
CoP CoPw/CO2
Shell Shellw/CO2
PC-sub PC-subw/CO2
PC-SC PC-SCw/CO2
NGCC NGCCw/CO2
Revised 7/27/0734
Economic Results for All Cases
Revised 7/27/0735
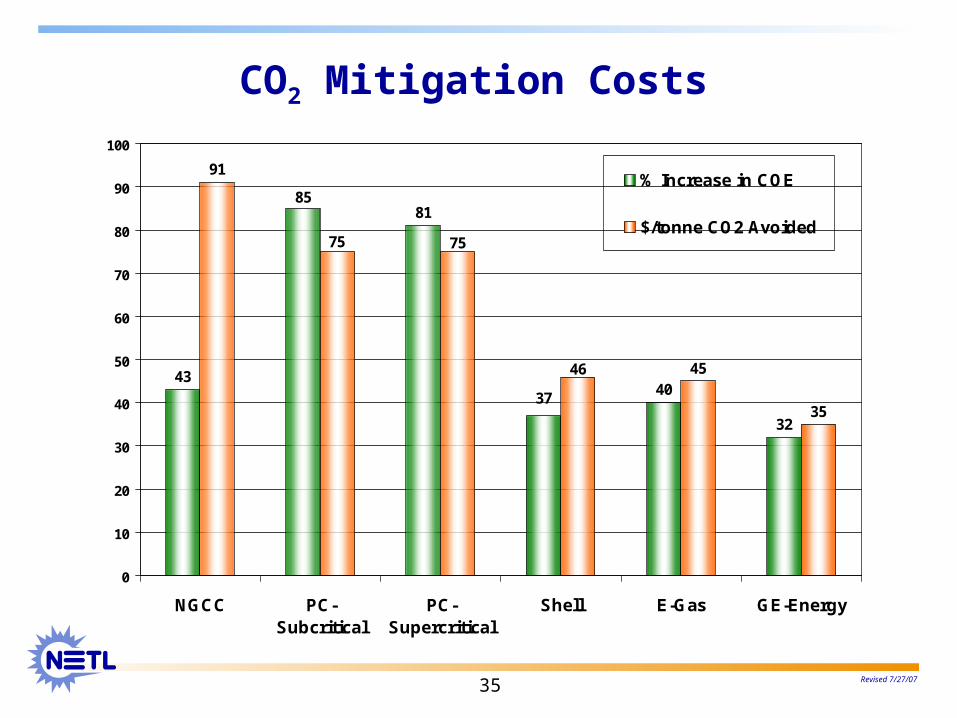
CO2 Mitigation Costs
43
81
40
32
91
85
37
75 75
45
35
46
0
10
20
30
40
50
60
70
80
90
100
NGCC PC-Subcritical
PC-Supercritical
Shell E-Gas GE-Energy
% Increase in COE
$/tonne CO2 Avoided

Revised 7/27/0736
Total Plant Cost Comparison
Total Plant Capital Cost includes contingencies and engineering fees
1841
2496
1549
2895
1575
2870
554
1172
0
500
1000
1500
2000
2500
3000
Avg IGCC Avg IGCCw/ CO2Capture
PC-Sub PC-Sub w/CO2
Capture
PC-Super PC-Superw/ CO2Capture
NGCC NGCC w/CO2
Capture
$/k
W (
$2
00
6)

Revised 7/27/0737
Cost of Electricity Comparison
January 2007 Dollars, Coal cost $1.80/106Btu. Gas cost $6.75/106Btu
7.79
10.63
6.40
11.88
6.33
11.48
6.84
9.74
0.00
2.00
4.00
6.00
8.00
10.00
12.00
14.00
Avg IGCC Avg IGCCw/ CO2Capture
PC-Sub PC-Sub w/CO2
Capture
PC-Super PC-Superw/ CO2Capture
NGCC NGCC w/CO2
Capture
cent
s/kW
h ($
200 7
)

Revised 7/27/0738
Highlights

Revised 7/27/0739
NETL Viewpoint Most up-to-date performance and costs available in
public literature to date
Establishes baseline performance and cost estimates for current state of technology
Improved efficiencies and reduced costs are required to improve competitiveness of advanced coal-based systems In today’s market and regulatory environment Also in a carbon constrained scenario
Fossil Energy RD&D aimed at improving performance and cost of clean coal power systems including development of new approaches to capture and sequester greenhouse gases

Revised 7/27/0740
Result Highlights: Efficiency & Capital Cost Coal-based plants using today’s technology are
efficient and clean IGCC & PC: 39%, HHV (without capture on bituminous coal) Meet or exceed current environmental requirements Today’s capture technology can remove 90% of CO2, but at
significant increase in COE
Total Plant Cost: IGCC ~20% higher than PC capex NGCC: $554/kW PC: $1561/kW (average) IGCC: $1841/kW (average)
Total Plant Cost with Capture: PC > IGCC capex NGCC: $1169/kW IGCC: $2496/kW (average) PC: $2788/kW (average)
Revised 7/27/0741
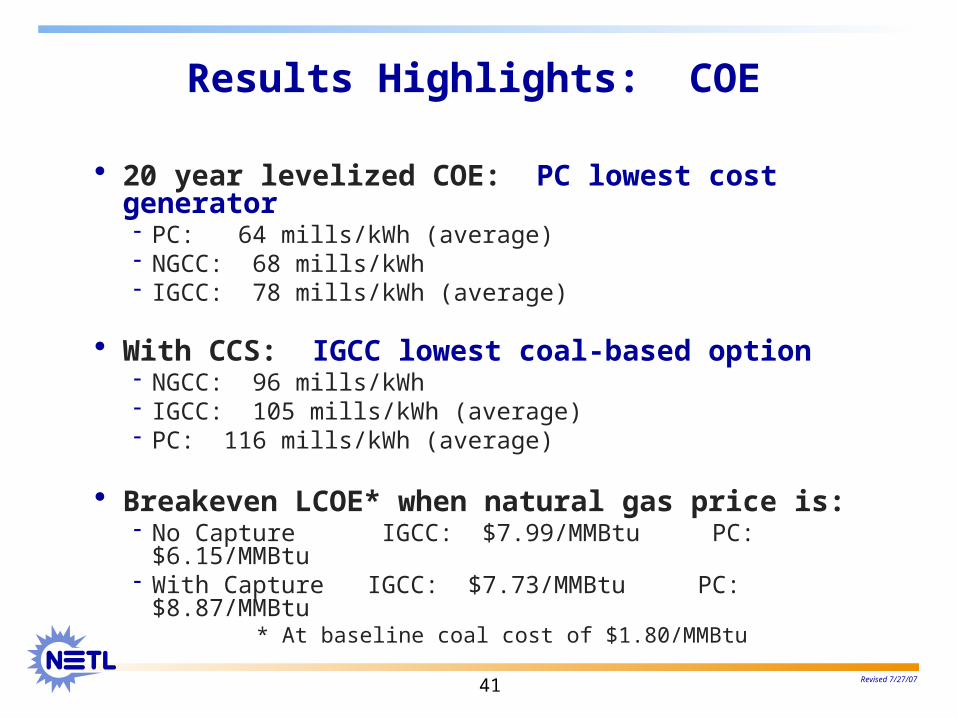
Results Highlights: COE
20 year levelized COE: PC lowest cost generator PC: 64 mills/kWh (average) NGCC: 68 mills/kWh IGCC: 78 mills/kWh (average)
With CCS: IGCC lowest coal-based option NGCC: 96 mills/kWh IGCC: 105 mills/kWh (average) PC: 116 mills/kWh (average)
Breakeven LCOE* when natural gas price is: No Capture IGCC: $7.99/MMBtu PC: $6.15/MMBtu With Capture IGCC: $7.73/MMBtu PC: $8.87/MMBtu
* At baseline coal cost of $1.80/MMBtu
Revised 7/27/0742
Summary Table for All Cases

Revised 7/27/0743
Summary TableCase 1 Case 2 Case 3 Case 4 Case 5 Case 6 Case 9 Case 10 Case 11 Case 12 Case 13 Case 14
CO2 Capture No Yes No Yes No Yes No Yes No Yes No Yes
Gross Power Output (kWe) 770,350 744,960 742,510 693,840 748,020 693,555 583,315 679,923 580,260 663,445 570,200 520,090Auxiliary Power Requirement (kWe) 130,100 189,285 119,140 175,600 112,170 176,420 32,870 130,310 30,110 117,450 9,840 38,200Net Power Output (kWe) 640,250 555,675 623,370 518,240 635,850 517,135 550,445 549,613 550,150 545,995 560,360 481,890Coal Flowrate (lb/hr) 489,634 500,379 463,889 477,855 452,620 473,176 437,699 646,589 411,282 586,627 N/A N/ANatural Gas Flowrate (lb/hr) N/A N/A N/A N/A N/A N/A N/A N/A N/A N/A 165,182 165,182HHV Thermal Input (kWth) 1,674,044 1,710,780 1,586,023 1,633,771 1,547,493 1,617,772 1,496,479 2,210,668 1,406,161 2,005,660 1,103,363 1,103,363Net Plant HHV Efficiency (%) 38.2% 32.5% 39.3% 31.7% 41.1% 32.0% 36.8% 24.9% 39.1% 27.2% 50.8% 43.7%Net Plant HHV Heat Rate (Btu/kW-hr) 8,922 10,505 8,681 10,757 8,304 10,674 9,276 13,724 8,721 12,534 6,719 7,813Raw Water Usage, gpm 4,003 4,579 3,757 4,135 3,792 4,563 6,212 14,098 5,441 12,159 2,511 4,681Total Plant Cost ($ x 1,000) 1,160,919 1,328,209 1,080,166 1,259,883 1,256,810 1,379,524 852,612 1,591,277 866,391 1,567,073 310,710 564,628Total Plant Cost ($/kW) 1,813 2,390 1,733 2,431 1,977 2,668 1,549 2,895 1,575 2,870 554 1,172LCOE (mills/kWh)1
78.0 102.9 75.3 105.7 80.5 110.4 64.0 118.8 63.3 114.8 68.4 97.4CO2 Emissions (lb/hr) 1,123,781 114,476 1,078,144 131,328 1,054,221 103,041 1,038,110 152,975 975,370 138,681 446,339 44,634
CO2 Emissions (tons/year) @ CF1 3,937,728 401,124 3,777,815 460,175 3,693,990 361,056 3,864,884 569,524 3,631,301 516,310 1,661,720 166,172
CO2 Emissions (tonnes/year) @ CF1 3,572,267 363,896 3,427,196 417,466 3,351,151 327,546 3,506,185 516,667 3,294,280 468,392 1,507,496 150,750CO2 Emissions (lb/MMBtu) 197 19.6 199 23.6 200 18.7 203 20.3 203 20.3 119 11.9
CO2 Emissions (lb/MWh)2 1,459 154 1,452 189 1,409 149 1,780 225 1,681 209 783 85.8CO2 Emissions (lb/MWh)3
1,755 206 1,730 253 1,658 199 1,886 278 1,773 254 797 93
SO2 Emissions (lb/hr) 73 56 68 48 66 58 433 Negligible 407 Negligible Negligible Negligible
SO2 Emissions (tons/year) @ CF1 254 196 237 167 230 204 1,613 Negligible 1,514 Negligible Negligible Negligible
SO2 Emissions (tonnes/year) @ CF1 231 178 215 151 209 185 1,463 Negligible 1,373 Negligible Negligible NegligibleSO2 Emissions (lb/MMBtu) 0.0127 0.0096 0.0125 0.0085 0.0124 0.0105 0.0848 Negligible 0.0847 Negligible Negligible NegligibleSO2 Emissions (lb/MWh)2
0.0942 0.0751 0.0909 0.0686 0.0878 0.0837 0.7426 Negligible 0.7007 Negligible Negligible NegligibleNOx Emissions (lb/hr) 313 273 321 277 309 269 357 528 336 479 34 34NOx Emissions (tons/year) @ CF1 1,096 955 1,126 972 1,082 944 1,331 1,966 1,250 1,784 127 127NOx Emissions (tonnes/year) @ CF1 994 867 1,021 882 982 856 1,207 1,783 1,134 1,618 115 115NOx Emissions (lb/MMBtu) 0.055 0.047 0.059 0.050 0.058 0.049 0.070 0.070 0.070 0.070 0.009 0.009NOx Emissions (lb/MWh)2
0.406 0.366 0.433 0.400 0.413 0.388 0.613 0.777 0.579 0.722 0.060 0.066PM Emissions (lb/hr) 41 41 38 40 37 39 66 98 62 89 Negligible NegligiblePM Emissions (tons/year) @ CF1 142 145 135 139 131 137 247 365 232 331 Negligible NegligiblePM Emissions (tonnes/year) @ CF1 129 132 122 126 119 125 224 331 211 300 Negligible NegligiblePM Emissions (lb/MMBtu) 0.0071 0.0071 0.0071 0.0071 0.0071 0.0071 0.0130 0.0130 0.0130 0.0130 Negligible NegligiblePM Emissions (lb/MWh)2
0.053 0.056 0.052 0.057 0.050 0.057 0.114 0.144 0.107 0.134 Negligible NegligibleHg Emissions (lb/hr) 0.0033 0.0033 0.0031 0.0032 0.0030 0.0032 0.0058 0.0086 0.0055 0.0078 Negligible NegligibleHg Emissions (tons/year) @ CF1 0.011 0.012 0.011 0.011 0.011 0.011 0.022 0.032 0.020 0.029 Negligible NegligibleHg Emissions (tonnes/year) @ CF1 0.010 0.011 0.010 0.010 0.010 0.010 0.020 0.029 0.019 0.026 Negligible NegligibleHg Emissions (lb/TBtu) 0.571 0.571 0.571 0.571 0.571 0.571 1.14 1.14 1.14 1.14 Negligible NegligibleHg Emissions (lb/MWh)2
4.24E-06 4.48E-06 4.16E-06 4.59E-06 4.03E-06 4.55E-06 1.00E-05 1.27E-05 9.45E-06 1.18E-05 Negligible Negligible1 Capacity factor is 80% for IGCC cases and 85% for PC and NGCC cases2 Value is based on gross output3 Value is based on net output
GEE CoP ShellIntegrated Gasification Combined Cycle Pulverized Coal Boiler NGCC
PC Subcritical PC Supercritical Advanced F Class