cost-benefit analysis of - … · long-run macro analysis ... countries with respect to the...
TRANSCRIPT

Benefits and Costs of Adapting to Climate Change in Bangladesh
COST-BENEFIT ANALYSIS OF ADAPTATION STRATEGY IN BANGLADESH
ALEXANDER GOLUB, CONSULTANTELENA STRUKOVA GOLUB, CONSULTANT


Cost-Benefit Analysis of Adaptation Strategy in Bangladesh
Bangladesh Priorities
Alexander Golub Consultant
Elena Strukova Golub Consultant
© 2016 Copenhagen Consensus Center [email protected] www.copenhagenconsensus.com This work has been produced as a part of the Bangladesh Priorities project, a collaboration between Copenhagen Consensus Center and BRAC Research and Evaluation Department. The Bangladesh Priorities project was made possible by a generous grant from the C&A Foundation. Some rights reserved
This work is available under the Creative Commons Attribution 4.0 International license (CC BY 4.0). Under the Creative Commons Attribution license, you are free to copy, distribute, transmit, and adapt this work, including for commercial purposes, under the following conditions:
Attribution Please cite the work as follows: #AUTHOR NAME#, #PAPER TITLE#, Bangladesh Priorities, Copenhagen Consensus Center, 2016. License: Creative Commons Attribution CC BY 4.0.
Third-party-content Copenhagen Consensus Center does not necessarily own each component of the content contained within the work. If you wish to re-use a component of the work, it is your responsibility to determine whether permission is needed for that re-use and to obtain permission from the copyright owner. Examples of components can include, but are not limited to, tables, figures, or images.
Abbreviations ADB Asian Development Bank
AR5 The Fifth Assessment Report of the Intergovernmental Panel on Climate Change
BAU Business as usual
BBS Bangladesh Bureau of Statistics
BCA Benefit Cost Analysis
C Carbon
CED Cost of environmental degradation
CEGIS Center of Excellence for Geospatial Information Science
CI Confidence Interval
CIDA Canadian International Development Agency
CO2 Carbon Dioxide
CO2-eq Carbon Dioxide Equivalent
DFID The Department for International Development, UK
DICE The Dynamic Integrated Climate-Economy model
EC Electrical conductivity
EP Exceedance probability
EU European Union
FAO Food and Agriculture Organization of the United Nations
G Gram
GDP Gross domestic Product
GHG Greenhouse gases
GoB Government of Bangladesh
GTZ German Technical Cooperation Agency
Ha Hectare
HH Household
IUCN The International Union for Conservation of Nature
IWG International Working Group
JICA Japan International Cooperation Agency
Kg Kilogram
m Meter
NPV Net present value
PL Post larvae
PV Present Value
RDM Robust Decision-Making
RICE Regional integrated model of climate and the economy
ROA Real Option Analysis
SCC Social Cost of Carbon
SIDA Swedish International Development Cooperation Agency
SIZ The Sundarbans Impact Zone
SRF The Sundarbans Reserve Forest
SD Standard Deviation
SRES Special Report on Emission Scenarios, IPCC, AR4
SST Sea surface temperature
Tk Bangladeshi taka

T Tone
UNDP United Nations Development Programme
UNEP The United Nations Environment Programme
USAID United States Agency for International Development
US$ US dollars
WCMC The UNEP World Conservation Monitoring Centre
WDI World Development Indicators, the World Bank
WG Working Group

3
ABBREVIATIONS ............................................................................................................................................... 1
1. BRIEF DESCRIPTION OF THE SITUATION IN BANGLADESH ............................................................................. 4
1.1. CLIMATE CHANGE AND ECONOMIC GROWTH ........................................................................................................... 4
1.2. MAJOR HAZARDS FROM CLIMATE CHANGE AND NEED FOR ADAPTATION ....................................................................... 8
1.3. LIMITED RESOURCES TO COPE WITH CLIMATE CHANGE ............................................................................................ 14
1.3.1. Long-run macro analysis..................................................................................................................... 14
1.3.2. Midterm perspective .......................................................................................................................... 16
2. METHODOLOGY FOR BENEFITS AND COST ESTIMATION............................................................................. 19
2.1. Uncertainty and risk quantification for BCA .......................................................................................... 19
2.2. EXPECTED VALUE AND RISK ................................................................................................................................ 21
2.3. APPLICATION OF REAL OPTION ANALYSIS FOR VALUATION OF RISK AND RETURN .......................................................... 22
3. MAJOR INTERVENTIONS (WITH BENEFIT AND COST ESTIMATIONS) .......................................................... 25
3.1. INTERIM – REACTIVE ADAPTATION INTERVENTIONS ................................................................................................ 26
3.1.1. Foreshore afforestation (mangroves restoration and plantations) and mangrove protection .......... 27
3.1.2. Multi-purpose cyclone shelters, cyclone-resistant private housing and further strengthening of the
early warning & evacuation system ............................................................................................................. 36
3.1.3. Polders reconstruction and setback .................................................................................................... 42
3.2. LONG-TERM STRATEGY OF RESILIENT ECONOMIC GROWTH, ASSETS DIVERSIFICATION AND HUMAN CAPITAL FORMATION ...... 46
3.2.1. Productivity increase in agriculture .................................................................................................... 48
3.2.2. Population relocation ......................................................................................................................... 52
4. BCA – RESULTS, RECOMMENDATIONS AND DISCUSSION ........................................................................... 57
REFERENCES ................................................................................................................................................... 60
4
1. Brief description of the situation in Bangladesh Due to its location and geological specifics, Bangladesh is among the most exposed countries to climate
change. Low per capita income is an important resource constraint on the path to reducing exposure
and coping with damage from climate change. This makes Bangladesh one of the most vulnerable
countries with respect to the changing global environment. Bangladesh is already exposed to severe
natural hazards and extreme weather events. Continuous sea level rise exacerbated by the sinking
delta of the Ganges River creates an imminent threat to the multimillion-strong population of The
Sundarbans and other coastal areas. Tropical cyclones, tidal surge, regular floods, droughts, and heat
waves have already cost several million dollars per year.
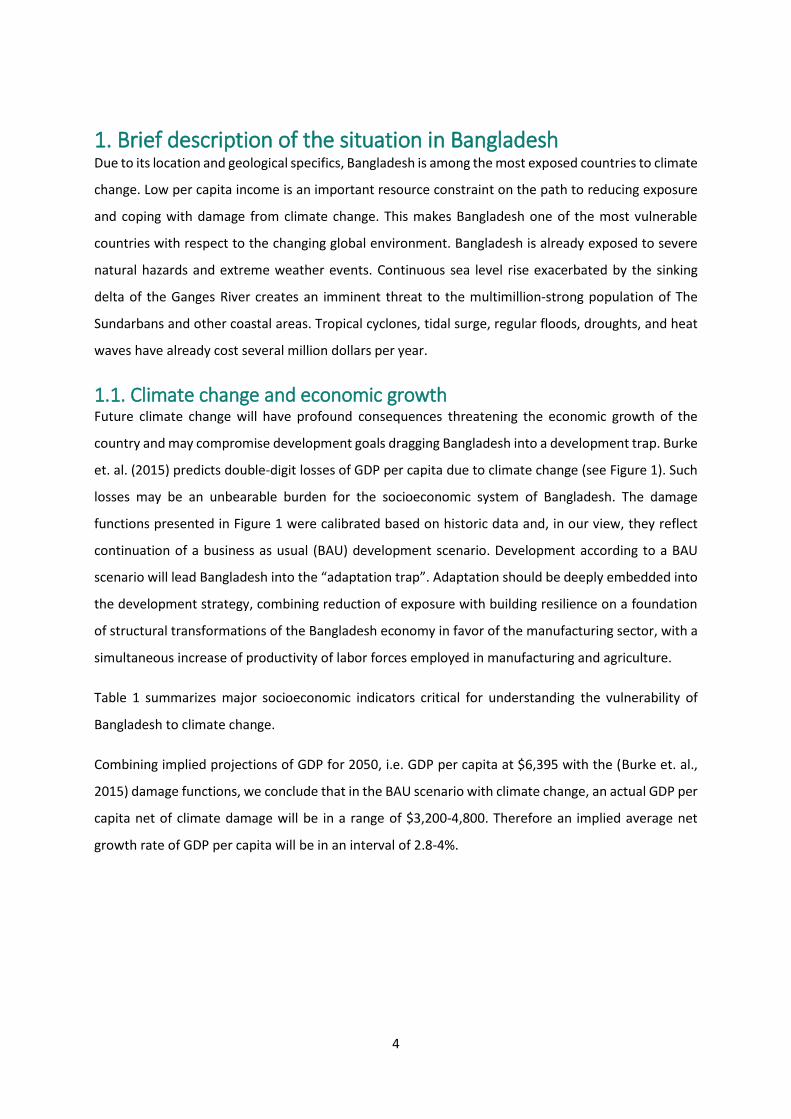
1.1. Climate change and economic growth Future climate change will have profound consequences threatening the economic growth of the
country and may compromise development goals dragging Bangladesh into a development trap. Burke
et. al. (2015) predicts double-digit losses of GDP per capita due to climate change (see Figure 1). Such
losses may be an unbearable burden for the socioeconomic system of Bangladesh. The damage
functions presented in Figure 1 were calibrated based on historic data and, in our view, they reflect
continuation of a business as usual (BAU) development scenario. Development according to a BAU
scenario will lead Bangladesh into the “adaptation trap”. Adaptation should be deeply embedded into
the development strategy, combining reduction of exposure with building resilience on a foundation
of structural transformations of the Bangladesh economy in favor of the manufacturing sector, with a
simultaneous increase of productivity of labor forces employed in manufacturing and agriculture.
Table 1 summarizes major socioeconomic indicators critical for understanding the vulnerability of
Bangladesh to climate change.
Combining implied projections of GDP for 2050, i.e. GDP per capita at $6,395 with the (Burke et. al.,
2015) damage functions, we conclude that in the BAU scenario with climate change, an actual GDP per
capita net of climate damage will be in a range of $3,200-4,800. Therefore an implied average net
growth rate of GDP per capita will be in an interval of 2.8-4%.

5
Figure 1. Damage functions for the major regions, based on econometric analysis of historic data
Source: Burke et. al., 2015.
Table 1. Selected economic indicators in Bangladesh (current and 2050)
Value Year Source/comments Value Source/comments
Population (millions)
159 2014 WDI, 2016 228 BBS
Population annual average growth rate
1.13% 2014 WDI, 2016 1.15% BBS &State of the Coast, 2006
Coastal population (millions)
35 2003 State of The Coast, 2006
58 State of the Coast, 2006
Coastal population annual average growth rate
1.36% 1991-2001
State of the Coast, 2006
1.05% State of the Coast, 2006
GDP (billions of constant 2005 US$)
119 2014 WDI, 2016 1,607 Projected with the growth rate in the following row
GDP average annual growth rate 2001-2014
5.8% 2001-2014
WDI, 2016 7.5% Various Government announcements
Per capita GDP (constant 2005 US$)
478 2014 WDI, 2016 7,045 Estimated
Road length (km) 272,487 2007 BBS 340,609 Assumed 25% expansion
Share of paved roads
30% 2007 BBS 100% Assumed
Primary school net enrollment rate
91% 2007 Ministry of Education
100% WDI, 2016, average rate in comparator countries
Per capita electricity consumption (kWh)
278 2012 WDI, 2016 3210 WDI, 2016, average level in comparator countries
Source: WDI, 2016; World Bank, 2010

6
This is two times lower than the desirable growth rate announced by the Government at 7.5% (seen in
Table 1). In sum, climate change should be treated as an important barrier to meeting development
goals and it should be discussed in the context of a long-term development strategy.
Islam (2010) reported that when the population of SIZ was asked to assess the severity of different
problems associated with climate change, they ranked salinity increase, lack of fresh water, losses in
agriculture and declining yield of SRF the highest. Figure 2 below presents the results of this survey.
Figure 2. Ranking of climate change related problems by population of SIZ
Source: Islam (2010)
The population of Bangladesh is very poor to cope with climate risks with no external assistance. Rural
income in the five selected zilas is very low (Asian Development Bank (ADB), 2006) with rural poverty
level at about 50% and above in Khulna and Barisal divisions of the SIZ. The Table below compares the
head count poverty ration in SIZ versus non-SIZ upazilas as reported in (Islam, 2010). The traditional
production process does not support adequate living standards and provides preconditions for high
malnourishment that results in further degradation of quality of labor and environmental health losses.
There are 3 essential categories to be considered for understanding risks of climate change and crafting
an adaptation strategy:
Hazards,
Exposure, and
Vulnerability.

7
Hazards constitute exogenous parameters. They are defined by patterns of climate change driven by
anthropogenic GHG emissions and a response of the global climatic system to accumulation of GHG in
the atmosphere. These exogenous factors are out of control of any individual country and should be
treated as given for the integrated analysis of development policy in changing climatic conditions and
for benefit-cost analysis (BCA) of adaptation. Global and regional climatic models are the best available
source for hazard projections, while historic data helps to understand the current state of climate
change and to track some important trends.
Uncertainty is a serious challenge for projection of future exposure to climate change; the issue of
attribution complicates the interpretation of current extreme weather events. For example, should an
increase in the severity of cyclones be attributed to climate change or just treated as result of a
“normal” variability? Another example is how to separate an increase in inundation between ongoing
geomorphological processers and the global sea level rise. Applying a holistic approach, we should
avoid attribution issues and treat all benefits and all costs of interventions equally in BCA.
Exposure is more in the control of a country suffering from climate change. In the case of Bangladesh,
reallocation of population from areas with a high rate of hazard would reduce exposure. Updating of
early warning systems and building and reconstruction of shelters reduces exposure of population in
areas with high rate of hazard to deadly consequences of tropical cyclones, storm surge and floods.
However, these interventions will not reduce exposure of agriculture. Therefore there will be residual
damage from extreme weather events, as well as from other negative impacts of climate change.
An ability of the country to deploy comprehensive adaptation interventions and to cope with residual
damage determines the resilience of the country to climate change. Lack of ability or insufficient ability
to implement adaptation interventions and withstand residual damage defines vulnerability to climate
change. Vulnerability could be expressed in economic indicators, e.g. cost of adaptation as a share of
GDP, gross capital formation and residual damage as a share of GDP, or final consumption as a share
of the state budget. Understanding of uncertainty and probabilistic character of climate change is
critical to understand vulnerability of a country to climate change. It is not enough to refer to long-
term average damage from extreme weather events attributed to climate change. It is also important
to consider a magnitude of an individual shock from, for example, a mega cyclone or flood.
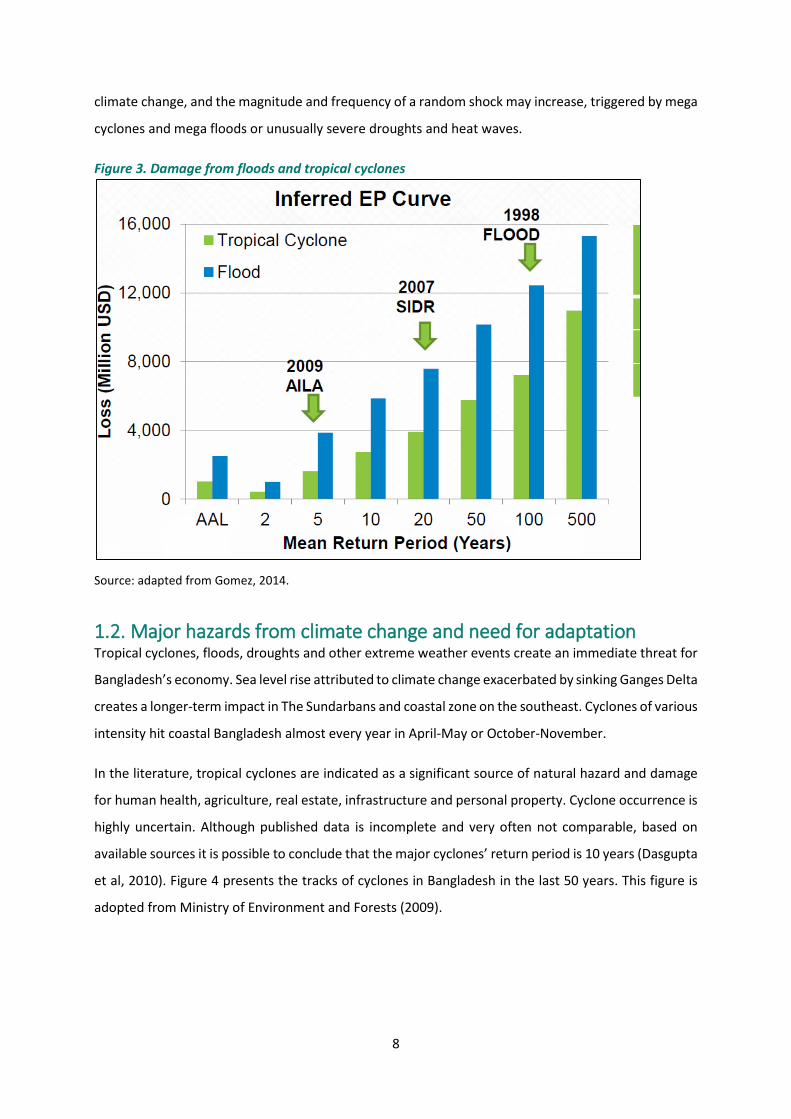
Figure 3 illustrates average damage from cyclones and floods and annual variability. On average, the
total damage from cyclones and floods is at about 2.5% of GDP (see Gomez, 2014), but the total
damage could double or quadruple. A so-called “100 years event” may cause double-digit damage.
This indicates an extreme vulnerability of Bangladesh to “climate shocks”. Over the next decades the
negative impact of climate change on Bangladesh will intensify. Both average annual damage from
8
climate change, and the magnitude and frequency of a random shock may increase, triggered by mega
cyclones and mega floods or unusually severe droughts and heat waves.
Figure 3. Damage from floods and tropical cyclones
Source: adapted from Gomez, 2014.
1.2. Major hazards from climate change and need for adaptation Tropical cyclones, floods, droughts and other extreme weather events create an immediate threat for
Bangladesh’s economy. Sea level rise attributed to climate change exacerbated by sinking Ganges Delta
creates a longer-term impact in The Sundarbans and coastal zone on the southeast. Cyclones of various
intensity hit coastal Bangladesh almost every year in April-May or October-November.
In the literature, tropical cyclones are indicated as a significant source of natural hazard and damage
for human health, agriculture, real estate, infrastructure and personal property. Cyclone occurrence is
highly uncertain. Although published data is incomplete and very often not comparable, based on
available sources it is possible to conclude that the major cyclones’ return period is 10 years (Dasgupta
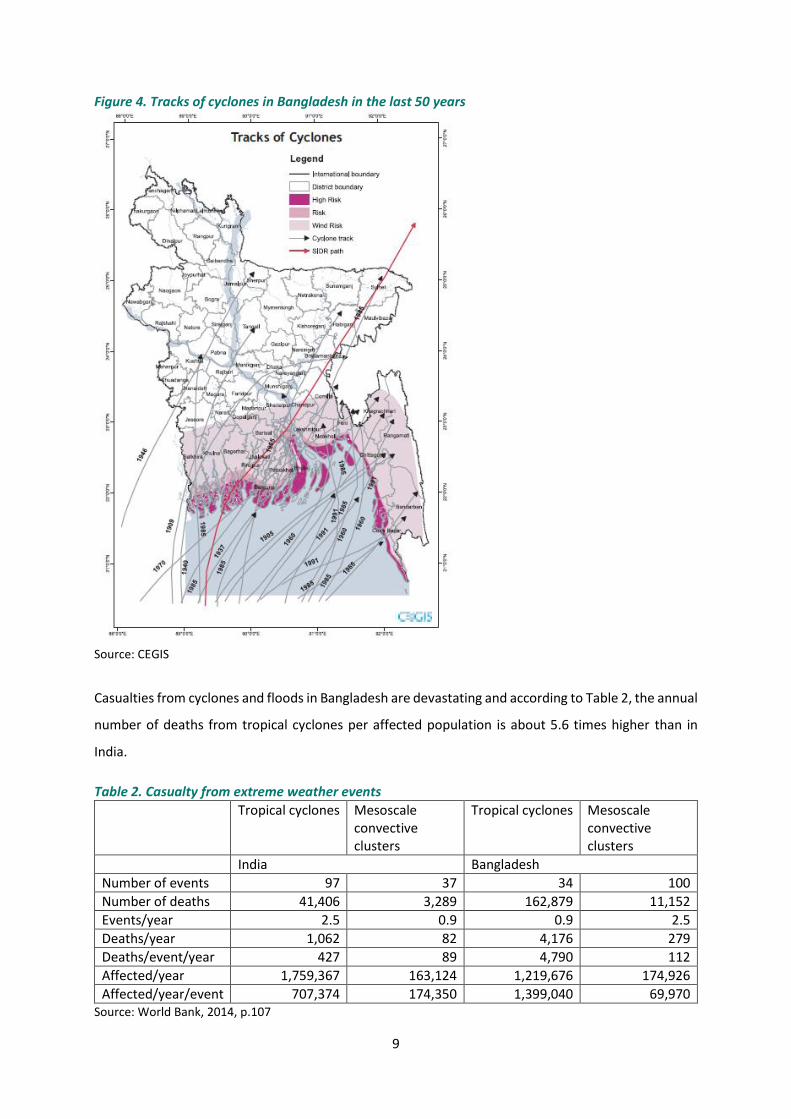
et al, 2010). Figure 4 presents the tracks of cyclones in Bangladesh in the last 50 years. This figure is
adopted from Ministry of Environment and Forests (2009).
9
Figure 4. Tracks of cyclones in Bangladesh in the last 50 years
Source: CEGIS
Casualties from cyclones and floods in Bangladesh are devastating and according to Table 2, the annual
number of deaths from tropical cyclones per affected population is about 5.6 times higher than in
India.
Table 2. Casualty from extreme weather events
Tropical cyclones Mesoscale convective clusters
Tropical cyclones Mesoscale convective clusters
India Bangladesh
Number of events 97 37 34 100
Number of deaths 41,406 3,289 162,879 11,152
Events/year 2.5 0.9 0.9 2.5
Deaths/year 1,062 82 4,176 279
Deaths/event/year 427 89 4,790 112
Affected/year 1,759,367 163,124 1,219,676 174,926
Affected/year/event 707,374 174,350 1,399,040 69,970 Source: World Bank, 2014, p.107

10
Life losses and injuries attributed to extreme weather events is an immediate concern that should be
addressed. Multipurpose shelters and an early warning system should be considered as the most
urgent intervention since it could potentially prevent up to 5000 lives loses a year. However, it would
not prevent other losses due to floods and cyclones.
Table 3 summarizes losses from a “super cyclonic storm” (excluding life losses and injuries). Agriculture
is accountable for 26% of the total damage. However, for less intensive cyclones and floods,
agricultural losses may dominate.
Table 3. Damages and losses during a single super cyclonic storm
Damages and Losses (Cyclone Sidr)
Damages and Losses (Average Severe Cyclone)
Current Million US$
Constant Million 2009 US$
Share of total (%)
Constant 2009 Million US$
Housing 839 978 50 900
Agriculture 438 510 26 469
Transport 141 164 8 151
Water resource control 71 83 4 83
Education infrastructure 69 80 4 73
Industry/Commerce/Tourism 52 61 3 56
Urban and municipal 25 29 2 27
Power 14 16 1 15
Other 26 30 2 28
Total damages and losses 1675 1952 100 1802
Share of GDP 2.6% 2.4%
Source: World Bank 2014, p.32
About 70 % of the population live in rural areas and depend on agriculture as an important source of
income and as subsistence. The population of The Sundarbans already suffering from insufficient
production is disturbed by extreme weather events, increased salinity and other factors of natural
resource degradation.
Figure 5 presents potential rice requirement and actual production for the two different population
growth scenarios in the SIZ. If aquaculture continues to develop, then rice shortage will increase
dramatically. It is necessary to increase productivity to sustain even the existing level of consumption,
which is already insufficient, with about 40-50 % of children under 5 malnourished in the SIZ1.
1 DHS 2007 data

11
Figure 5. Rice production and consumption scenarios in the SIZ
Source: World Bank, 2012
According to figure 6, almost the entire territory of Bangladesh is prone to various natural disasters
that interfere with agriculture. Increase in intensity and frequency of these events is attributed to
climate change. The cyclone-prone zone is the most vulnerable to climate change. Polders protect
population in this zone and agricultural land. However, over time the reliability of polders is diminishing
(see figure 7).
Note that climate change, on one hand, contributes to a permanent decline of productivity in
agriculture (salinity, erosion, permanent losses of agricultural land due to sea level rise). On the other
hand, agriculture is subjected to random shocks attributed to extreme weather events with
devastating consequences for affected areas.

12
Figure 6. Areas prone to various natural disasters
Source https://germanwatch.org/en/download/8347.pdf
Figure 7. Polders exposed to climate change
Source: World Bank, 2014 p. 38
According to the World Bank synthesis study (World Bank, 2010a) where crop yields are separately
modeled for 16 different regions using climate predictions from 16 global circulation models for 3
emission scenarios, “…cumulative rice production is expected to decline by 80 million tons (about 3.9%
each year) over 2005-50. Agricultural GDP is projected to be 3.1% lower each year (US$36 billion in
lost value-added) and total GDP US$129 billion lower due to climate change over the 45-year period
2005-2050” (p.43). It contradicts the goals of GDP growth summarized in table 1.
Radical increase of productivity in agriculture is an important priority in adaptation to climate change.

13
Some agricultural lands would be lost due to sea level rise (see table 5) and salinity increase on
inundated lands due to continuous and intensifying storm surge and regular failure of dykes.
Table 5. Global mean surface temperature change and sea level rise
2046-2065 2081-2100
Scenario Mean Likely range Mean Likely range
Global mean Surface Temperature Change (oC)
RCP2.6 1.0 0.4-1.6 1.0 0.3-1.7
RCP4.5 1.4 0.9-2.0 1.8 1.1-2.6
RCP6.0 1.3 0.8-1.8 2.2 1.4-3.1
RCP8.5 2.0 1.4-2.6 3.7 2.6-4.8
Scenario Mean Likely range Mean Likely range
Global mean Sea Level Rise (oC)
RCP2.6 0.24 0.17-0.32 0.40 0.26-0.55
RCP4.5 0.26 0.19-0.33 0.47 0.32-0.63
RCP6.0 0.25 0.18-0.32 0.48 0.33-0.63
RCP8.5 0.30 0.22-0.38 0.63 0.45-0.82 Source: AR5, WG1, Stocker, 2014.
Major hazards attributed to climate change like sea level rise, cyclones, floods etc., act as compounding
factors mutually amplifying the negative effect of each other on economy and society. Agriculture
suffers from all natural hazards directly (harvest losses as a result of extreme weather events) and
indirectly (decreasing productivity of agricultural land due to salinity, waterlogging etc.).
While existing literature provides a comprehensive assessment of current economic losses and
damages attributed to climate change, the forward looking analysis is fragmented and presents various
elements of future hazards and damages. A comprehensive analysis of the future damages should be
conducted based on integrated modeling of economic growth and climate change in combination with
application of a computable general equilibrium (CGE) model. But even summarizing funding of
existing literature, one can conclude that climate change already interferes with economic growth, and
in the future climate change may become a major barrier for Bangladesh to become a mid-income
country.
Major vulnerability in the midterm in Bangladesh is linked to a low degree of protection of population
from floods and tropical cyclones, especially for population in sea-facing polders. In the long-run, the
major issue is loss of productivity in agriculture and industry that may become an impassable barrier
for the Bangladesh economy to reach a higher steady state and “join the club” of middle income
countries.

14
1.3. Limited resources to cope with climate change
1.3.1. Long-run macro analysis In the long-run, resilience to climate change depends on economic potential of a country. The same
damage of US$2 billion is accountable for 2.6 % of GDP (see table 3) in Bangladesh, while for a country
like South Korea it would be just 0.14% of GDP (WDI, 2016). The Netherlands regularly experiences
damages from storm surge, but despite a higher absolute value of damages from severe events, in
relative terms it constitutes a fraction of a percent of GDP.
Climate hazards will likely increase over time. Due to its geographical location, Bangladesh will always
be exposed to climate change. Building resilience to climate change, in our view, should be a top
priority of a development strategy. Structural changes of economy with a corresponding significant
increase in productivity of agriculture, manufacturing, services, etc., is the only way to converge to a
higher steady state, and to become a middle-income country.
Figure 8. Low and high steady states
Source: Estimates by the authors.
Figure 8 illustrates transition to a higher steady state. If a savings rate corresponds to the blue line, an
economy will be on a convergence path to a higher steady state. If however, savings are insufficient
(orange line), an economy may be trapped in a lower steady state. Climate change has three ways of
interfering with continuous economic growth and convergence to the highest steady state:
Permanent damage reduces total productivity of economy. For a given savings rate (calculated
as a percentage of output), an economy exposed to severe climate change would mobilize less
resources to continue capital accumulation. The blue curve shifts downward;
0.00
5.00
10.00
15.00
20.00
25.00
30.00
35.00
40.00
45.00
1 8
15
22
29
36
43
50
57
64
71
78
85
92
99
10
6
Savings
Savings low
Depreciation
15
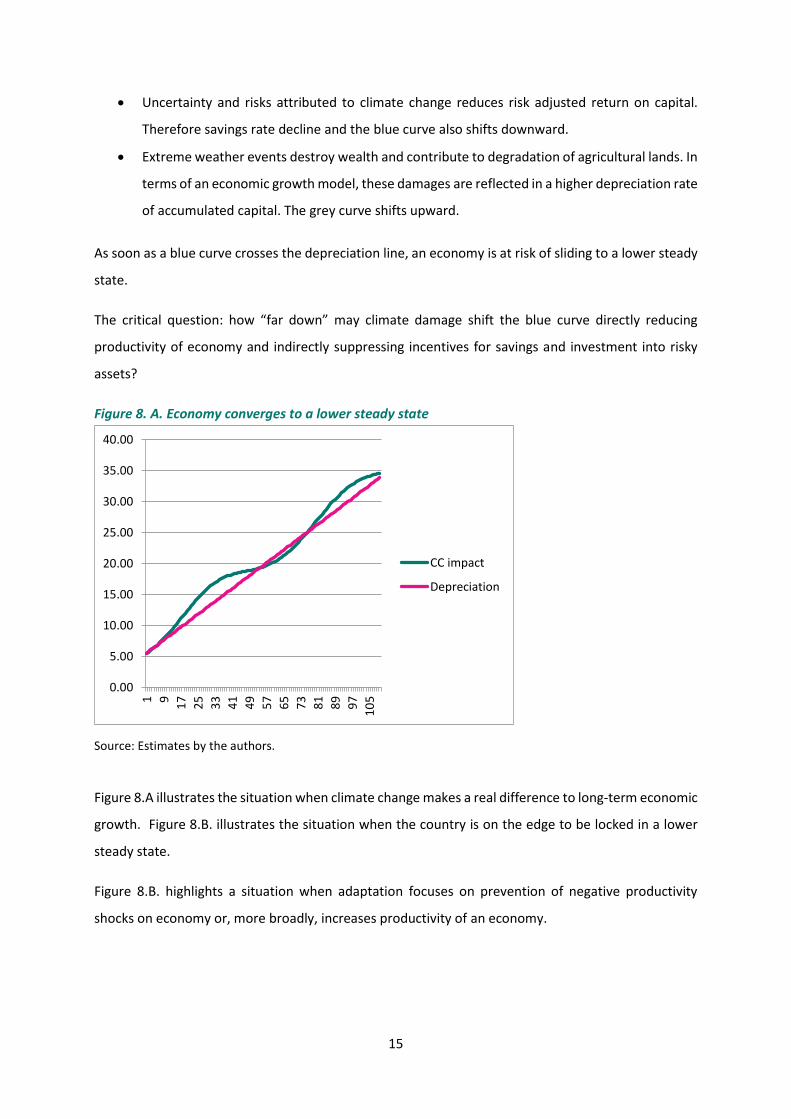
Uncertainty and risks attributed to climate change reduces risk adjusted return on capital.
Therefore savings rate decline and the blue curve also shifts downward.
Extreme weather events destroy wealth and contribute to degradation of agricultural lands. In
terms of an economic growth model, these damages are reflected in a higher depreciation rate
of accumulated capital. The grey curve shifts upward.
As soon as a blue curve crosses the depreciation line, an economy is at risk of sliding to a lower steady
state.
The critical question: how “far down” may climate damage shift the blue curve directly reducing
productivity of economy and indirectly suppressing incentives for savings and investment into risky
assets?
Figure 8. A. Economy converges to a lower steady state
Source: Estimates by the authors.
Figure 8.A illustrates the situation when climate change makes a real difference to long-term economic
growth. Figure 8.B. illustrates the situation when the country is on the edge to be locked in a lower
steady state.
Figure 8.B. highlights a situation when adaptation focuses on prevention of negative productivity
shocks on economy or, more broadly, increases productivity of an economy.
0.00
5.00
10.00
15.00
20.00
25.00
30.00
35.00
40.00
1 9
17
25
33
41
49
57
65
73
81
89
97
10
5
CC impact
Depreciation

16
Figure 8.B. Country on the edge to be locked in a lower steady state
Source: Estimates by the authors.
1.3.2. Midterm perspective In the midterm, there are several pressing needs for adaptation to climate change that require
mobilization of resources immediately. The cost of climate change constitutes a burden on households,
municipal and state budgets.
Relatively low GDP (in absolute terms and per capita) creates an obvious constraint to mobilize
resources for adaptation. Various development priorities are in competition for public money and
multilateral development assistance.
Nevertheless, in 2008 the government of Bangladesh adopted the Climate Change Strategies and
Action Plan, which was revised in 2009. The strategy focuses on the following priorities (see Mallick et
al 2012):
Food security, social protection and health,
Comprehensive disaster management,
Infrastructure development and protection
Research and knowledge management,
Mitigation and low carbon development, and
Capacity building and institutional strengthening.
The total cost of adaptation programs for the five years is estimated at around US$5 billion (Climate
Change Unit, 2012) i.e. about US$1 billion per year. It is about 0.6% of Bangladesh 2014 GDP, 3.6% of
gross capital formation, about 7% of tax revenues and 37% of net development assistance. The
0.00
5.00
10.00
15.00
20.00
25.00
30.00
35.00
40.00
45.00
1 9
17
25
33
41
49
57
65
73
81
89
97
10
5
CC impact
Depreciation

17
government of Bangladesh established the Climate Change Trust Fund and was able to allocate about
US$ 100 million annually in its budget. Multinational development assistance plays an important role
in mobilization of relevant funds. Table 6 summarizes ongoing projects on climate change. Committed
funds are sizable, but are unlikely to be sufficient to meet all adaptation needs of Bangladesh.
Presented in Table 6 overview of international assistance to Bangladesh to support adaptation is an
illustration of insufficient funds currently available for adaptation in Bangladesh.
Poverty exacerbates gaps between available resources and need to implement near-term
interventions and compensate for residual damage from climate change.
Figure 9 demonstrates overlapping of poverty, flooding and tidal surge including current situation and
forecast up to 2050.
The impacts of climatic hazards are geographically concentrated in the regions with a higher
concentration of the poor. These regions are most vulnerable and have the lowest capacity to
implement adaptation interventions and cope with residual damage from climate change.
Figure 9. Poverty and extreme weather events
Source: The World Bank, 2010a

18
Table 6. Summary of ongoing projects on climate change in Bangladesh
Source: Mallick et al 2012
19
2. Methodology for benefits and cost estimation
2.1. Uncertainty and risk quantification for BCA Cost-benefit analysis is a powerful tool to support the decision-making process. It helps a decision
maker to choose among a wide range of well-specified alternatives (development goals, investment
strategies, etc.) providing a common denominator to assess and rank them in a consistent way. In our
case alternatives are specified as a potential decision of a country to navigate capital formation in order
to build “the assets portfolio” less vulnerable to the climate change related events. According to AR5
WG 3, benefit-cost analysis (BCA) is extremely useful when dealing with well defined problems like the
benefits and costs assessment of building dykes to reduce the likelihood and consequences of cyclones
given a projected sea level rise attributed to climate change. Another example mentioned in AR-5: BCA
can provide a framework for defining a range of global long-term abatement targets across countries
to facilitate negotiations (see also Stern, 2007).
“The main advantage of BCA in the context of climate change is that it is internally coherent and based
on the axioms of expected utility theory. As the prices used to aggregate costs and benefits are the
outcomes of market activity, BCA is, at least in principle, a tool reflecting people's preferences…this
line of reasoning can also be the basis for recommending that this approach not be employed for
making choices if market prices are unavailable. Indeed, many impacts associated with climate change
are not valued in any market and are therefore hard to measure in monetary terms. Omitting these
impacts distorts the cost-benefit relationship” (AR 5, WG 3, Chapter 2 p.28).
Acknowledging an important role of BCA for decision-making, AR-5 also stresses major challenges
when defining the optimal level of mitigation actions:
(1) The need to determine and aggregate individual welfare,
(2) The presence of distributional and intertemporal issues, and
(3) The difficulty in assigning probabilities to uncertain climate change impacts.”2
“A strong and recurrent argument against BCA (Azar and Lindgren, 2003; Tol, 2003; Weitzman, 2009,
2011) relates to its failure in dealing with infinite (negative) expected utilities arising from low
probability, catastrophic events often referred to as ‘fat tails’.” (AR 5, WG 3, Chapter 2 p.28).
AR-5 WG -2 summarizes different tools for decision making under uncertainty that can be applied in
different contexts and with different degree of quantification of available information: from loose
2 http://opim.wharton.upenn.edu/risk/library/IPCC-AR5-WG3-Ch02_Mitigation-of-Climate-Change_Assessment-of-
Response-Policies.pdf p.27.
20
specification of a plausible interval to fitting specific probability distributions. Watkiss et al, 2014)
provides taxonomy and discusses strengths and weaknesses of each method (see diagram adopted
from Watkiss et al, 2014).
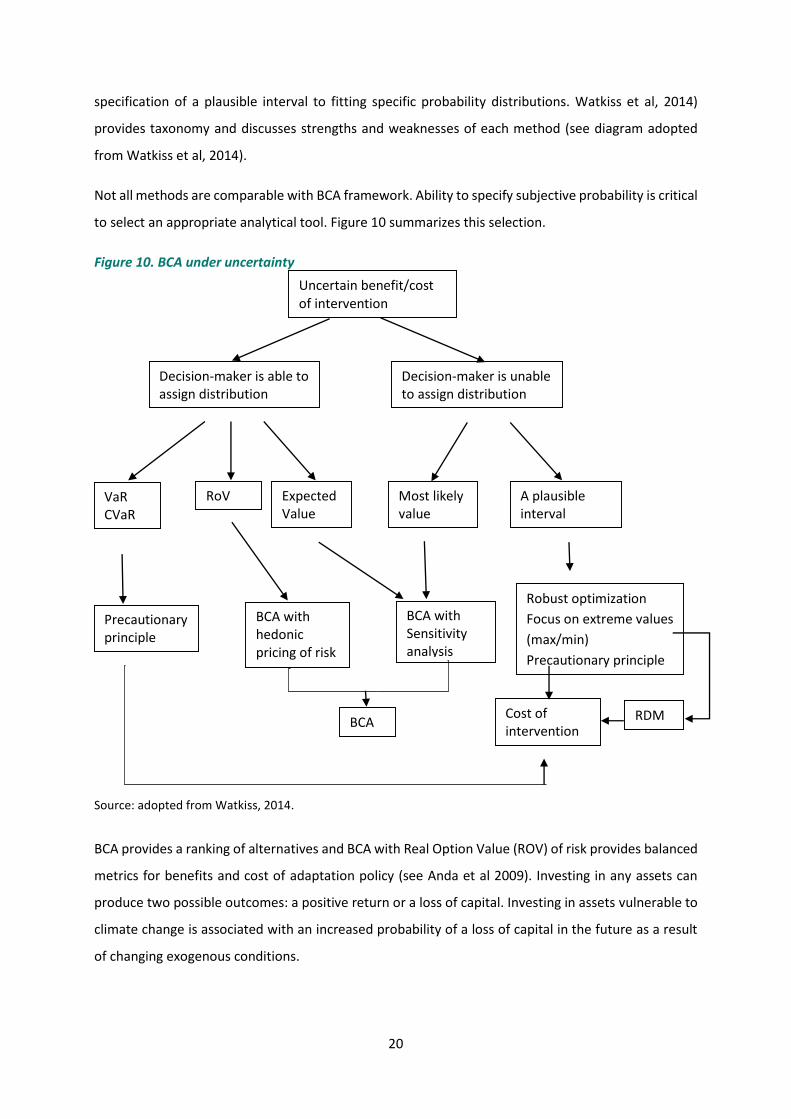
Not all methods are comparable with BCA framework. Ability to specify subjective probability is critical
to select an appropriate analytical tool. Figure 10 summarizes this selection.
Figure 10. BCA under uncertainty
Source: adopted from Watkiss, 2014.
BCA provides a ranking of alternatives and BCA with Real Option Value (ROV) of risk provides balanced
metrics for benefits and cost of adaptation policy (see Anda et al 2009). Investing in any assets can
produce two possible outcomes: a positive return or a loss of capital. Investing in assets vulnerable to
climate change is associated with an increased probability of a loss of capital in the future as a result
of changing exogenous conditions.
Uncertain benefit/cost of intervention
Decision-maker is able to assign distribution
Decision-maker is unable to assign distribution
VaR CVaR
RoV Most likely value
Expected Value
A plausible interval
Precautionary principle
BCA with hedonic pricing of risk
BCA with Sensitivity analysis
Robust optimization
Focus on extreme values
(max/min)
Precautionary principle
BCA Cost of intervention
RDM

21
Putting aside an issue of quantification of environmental goods and services, and assuming we are
dealing with quantifiable monetary terms indicators, the major issue is ability to assign subjective
probabilities to underlying uncertain parameters. This ability or inability may determine choice of an
analytical tool illustrated in Figure 10. Inability to represent an uncertain parameter with a distribution
is a reason to prefer robust optimization and robust decision-making (RDM). However, if a decision-
maker inclines to choose a single value to represent an uncertain parameter (i.e. just ignore risk), BCA
could be conducted in a “deterministic” form.
2.2. Expected value and risk The conventional method of conducting BCA relies on the mean value of an uncertain parameter, i.e.
just relies on the first moment of distribution. But, the three other moments of the distribution
(variance, skewness and kurtosis) can also be important. Variance, skewness and kurtosis (the last two
describe the tail of the probability distribution) constitute information lost in aggregation. For example,
the two probability distributions shown in Figure 11 have different expected value and different shape.
Figure 11. Distributions with one having a lower expected value but a heavier tail
Source: Presented by the authors.
The blue line describes a distribution with a relatively lower mean but with a relatively heavy tail. The
red distribution has relatively higher expected value but much lighter tail. Assume that each of
depicted in figure 11 distributions represents the sum of adaptation cost and residual damage for two
alternative interventions. Which intervention should be selected? Conventional approach suggests
that a “blue” alternative should be selected. Expected value of adaptation cost plus residual damage
is lower. However, since an actual cost will be revealed until after an adaptation intervention was
selected, a decision maker may end up in a situation when an actual cost (mainly residual damage) is

22
much higher than anticipated. In contrast to independent random shocks, when losses in one time
period would be compensated by surplus in another time period, climate change is represented by
correlated shocks attributed to irreversible changes of climatic system. In this case, the shape of
distribution should not be ignored.
Anda et al. (2009) propose an application of a real options analysis to address uncertainties in
environmental policy. They argued that advanced option pricing formulas could capture differences in
distributions and provide consistent metrics to price risk and uncertainty for economic valuation and
integrated assessment analysis (see also Golub et al, 2014). These examples illustrate how application
of a single expected value as a substitute for the underlying distribution may result in
misrepresentation of benefits and costs of abatement interventions.
2.3. Application of Real Option Analysis for valuation of risk and return A decision-maker should use Real Options Analysis (ROA) to estimate an impact of climate change as
a natural extension of benefit cost analysis framework under uncertainty.
Consider an adaptation intervention that costs Z (capital cost) and reduces damage from D0 to D1. The
difference D0 - D1 = DR is a residual damage. Residual damage is a deferred liability. Selecting an
adaptation strategy (intervention) decision maker commits cost Z and simultaneously takes a liability
DR known up to probability distribution. In conventional BCA, the total cost of intervention assumed to
be equal to Z+E(DR), where E(DR) denotes an expected value of a residual damage. An actual value of a
residual damage reveals when an extreme weather event attributed to climate change takes place.
Exposure to residual damage is similar to exposure of holding a short position on commodity or a share.
A stock price may spike much above its expected value, then a short position would cost its holder the
expected value (cost anticipated when a share was sold short) plus the difference between an actual
price and expected price. If projected price is highly uncertain it may be risky to sale this share short.
Economic value of this risk could be calculated as a cost of hedging position. A holder of the short
position can buy a call option on the stock and cover the short position. A call option price reflects
magnitude of uncertainties.
Residual damage is equivalent of a short position on a stock market. But in contrast to a stock market
speculator, a decision maker deals with an exposure to the future damage from the very beginning. In
absence of adaptation this exposure is D0. The risk adjusted value of this future damage is E(D0)+P(D0),
where P(D0) is value of risk that could be calculated using option pricing methodology. Now benefits
of adaptation could be calculated as E(D0)+P(D0) - E(DR)-
P(DR). Then benefit cost ratio 𝐸(𝐷0)+𝑃(𝐷0)− 𝐸(𝐷𝑅)−𝑃(𝐷𝑅)
𝑍=
𝐸(𝐷0)−𝐸(𝐷𝑅)
𝑍+
𝑃(𝐷0)−𝑃(𝐷𝑅)
𝑍
23
Conventional BCR calculation takes into account expected values only. Then
𝐶𝑅 =𝐸(𝐷0)−𝐸(𝐷𝑅)
𝑍 .
This methodology extends a conventional approach of BCR calculation including economic value of risk
reduction. Then risk adjusted BCR (RABCR) equals to the following expression:
𝑅𝐴𝐵𝐶𝑅 = 𝐵𝐶𝑅 +𝑃(𝐷0) − 𝑃(𝐷𝑅)
𝑍
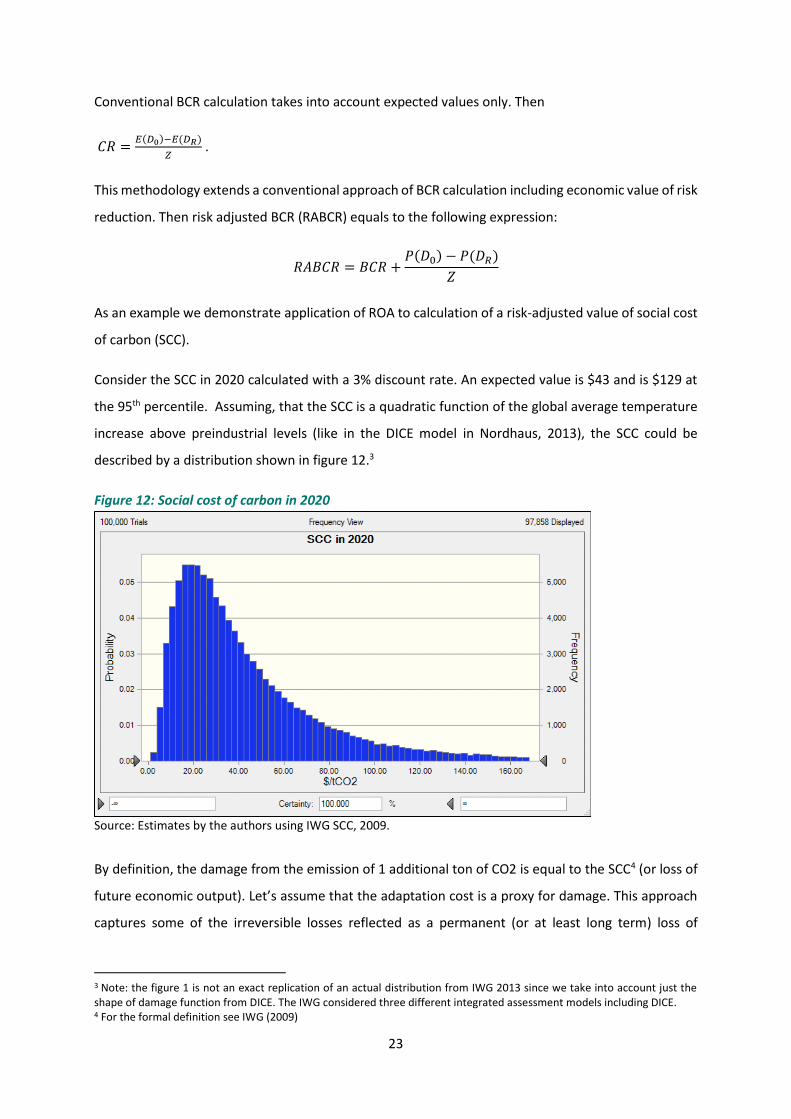
As an example we demonstrate application of ROA to calculation of a risk-adjusted value of social cost
of carbon (SCC).
Consider the SCC in 2020 calculated with a 3% discount rate. An expected value is $43 and is $129 at
the 95th percentile. Assuming, that the SCC is a quadratic function of the global average temperature
increase above preindustrial levels (like in the DICE model in Nordhaus, 2013), the SCC could be
described by a distribution shown in figure 12.3
Figure 12: Social cost of carbon in 2020
Source: Estimates by the authors using IWG SCC, 2009.
By definition, the damage from the emission of 1 additional ton of CO2 is equal to the SCC4 (or loss of
future economic output). Let’s assume that the adaptation cost is a proxy for damage. This approach
captures some of the irreversible losses reflected as a permanent (or at least long term) loss of
3 Note: the figure 1 is not an exact replication of an actual distribution from IWG 2013 since we take into account just the shape of damage function from DICE. The IWG considered three different integrated assessment models including DICE. 4 For the formal definition see IWG (2009)

24
productivity of the global economy in response to changing climatic conditions. In this formulation the
economic consequences of climate change can be fully compensated by higher productivity of the
global economy.
Society may invest in carbon intensive, buy very productive technologies and accumulate enough
resources to successfully tackle climate change. However, society may decide to abate 1 t of CO2 and
save on SCC. How much should society spend on abatement? An average value of SCC $43/tCO2 may
be too little, but $129/tCO2 looks like too much at this point in our knowledge.
What would be the market price of hedging risk? If someone sells a share short, then in order to
eliminate risk, he needs to create a hedging position by purchasing a call option. Given a distribution
of future value (say the value of the share in question has the same distribution as the SCC), at the
money call option would cost about $16/tCO2. Then the maximum that the investor would be willing
to pay in the future to close the short position is $43+$16 =$59/tCO2. Then the risk of the short
position costs $16. Therefore, by emitting 1 t of CO2 society is ready to accept a cost equal to $59/tCO2.
If, nevertheless, abatement is less expensive, it makes sense to abate this ton of CO2 instead.
25
3. Major interventions (with benefit and cost estimations) Based on consideration of hazards, exposure and vulnerabilities of Bangladesh to climate change and
also taking into account various kind of uncertainties we conclude that adaptation should satisfy the
following criteria:
The strategy should be flexible enough to accommodate learning and new knowledge about
global climate change and its specific implications for Bangladesh;
The initial interventions should be robust vis-à-vis imminent adjustment in response to
learning;
Initial interventions should address the most pressing adaptation needs;
Adaptation strategy should be embedded into the long-term development strategy.
Using World Bank (2010), World Bank (2012) and several other publications on adaptation in
Bangladesh and applying above listed criteria we selected six strategically relevant interventions for
BCA.
Adaptation alternatives include interim and long-term interventions:
Interim interventions present reactive adaptation interventions:
Polders reconstruction and setback;
Foreshore afforestation (mangroves restoration and plantations);
Multi-purpose cyclone shelters, cyclone-resistant private housing and further
strengthening of early warning & evacuation system
Long-term strategy of resilient economic growth, assets diversification and human capital formation:
Population reallocation;
Improvements of productivity of agriculture and fishery;
Manufacturing in the second-tier cities
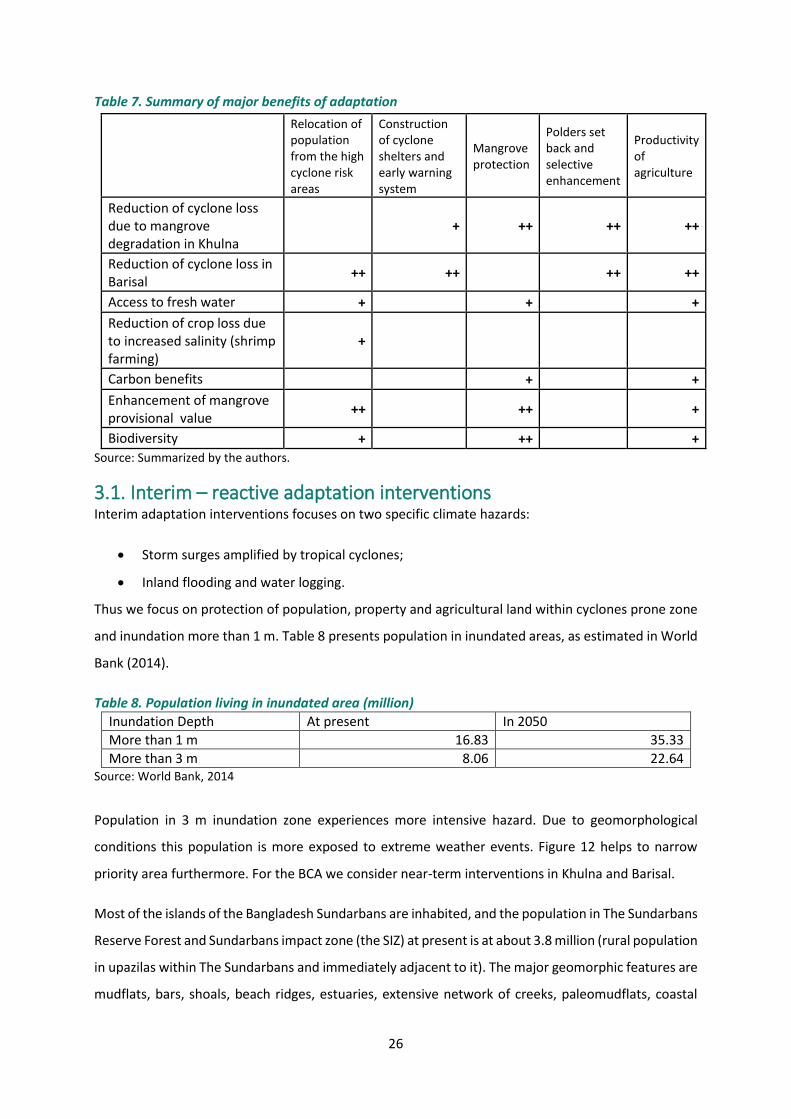
Interventions generate direct and indirect ancillary benefits that are briefly summarized in Table 7.
26
Table 7. Summary of major benefits of adaptation
Relocation of population from the high cyclone risk areas
Construction of cyclone shelters and early warning system
Mangrove protection
Polders set back and selective enhancement
Productivity of agriculture
Reduction of cyclone loss due to mangrove degradation in Khulna
+ ++ ++ ++
Reduction of cyclone loss in Barisal
++ ++ ++ ++
Access to fresh water + + +
Reduction of crop loss due to increased salinity (shrimp farming)
+
Carbon benefits + +
Enhancement of mangrove provisional value
++ ++ +
Biodiversity + ++ +
Source: Summarized by the authors.
3.1. Interim – reactive adaptation interventions Interim adaptation interventions focuses on two specific climate hazards:
Storm surges amplified by tropical cyclones;
Inland flooding and water logging.
Thus we focus on protection of population, property and agricultural land within cyclones prone zone
and inundation more than 1 m. Table 8 presents population in inundated areas, as estimated in World
Bank (2014).
Table 8. Population living in inundated area (million)
Inundation Depth At present In 2050
More than 1 m 16.83 35.33
More than 3 m 8.06 22.64 Source: World Bank, 2014
Population in 3 m inundation zone experiences more intensive hazard. Due to geomorphological
conditions this population is more exposed to extreme weather events. Figure 12 helps to narrow
priority area furthermore. For the BCA we consider near-term interventions in Khulna and Barisal.
Most of the islands of the Bangladesh Sundarbans are inhabited, and the population in The Sundarbans
Reserve Forest and Sundarbans impact zone (the SIZ) at present is at about 3.8 million (rural population
in upazilas within The Sundarbans and immediately adjacent to it). The major geomorphic features are
mudflats, bars, shoals, beach ridges, estuaries, extensive network of creeks, paleomudflats, coastal

27
dunes, large number of islands and saltpans. Figure 13 below presents inundation map of Sundarbans
by inundated area. About 8 million population is located in blue area that is more than 3 m inundated
during storm surge. This population is expected to almost triple by 2050.
The spatial distribution of the population in The Sundarbans is closely linked with their occupational
distribution. Landless and marginal households, who are often directly dependent on the forest and
rivers, are concentrated on the river-banks bordering the forest. The landed households are mostly
placed in the interiors or towards the mainland.
Figure 13. Projection of storm surge inundation
Source: World Bank, 2014
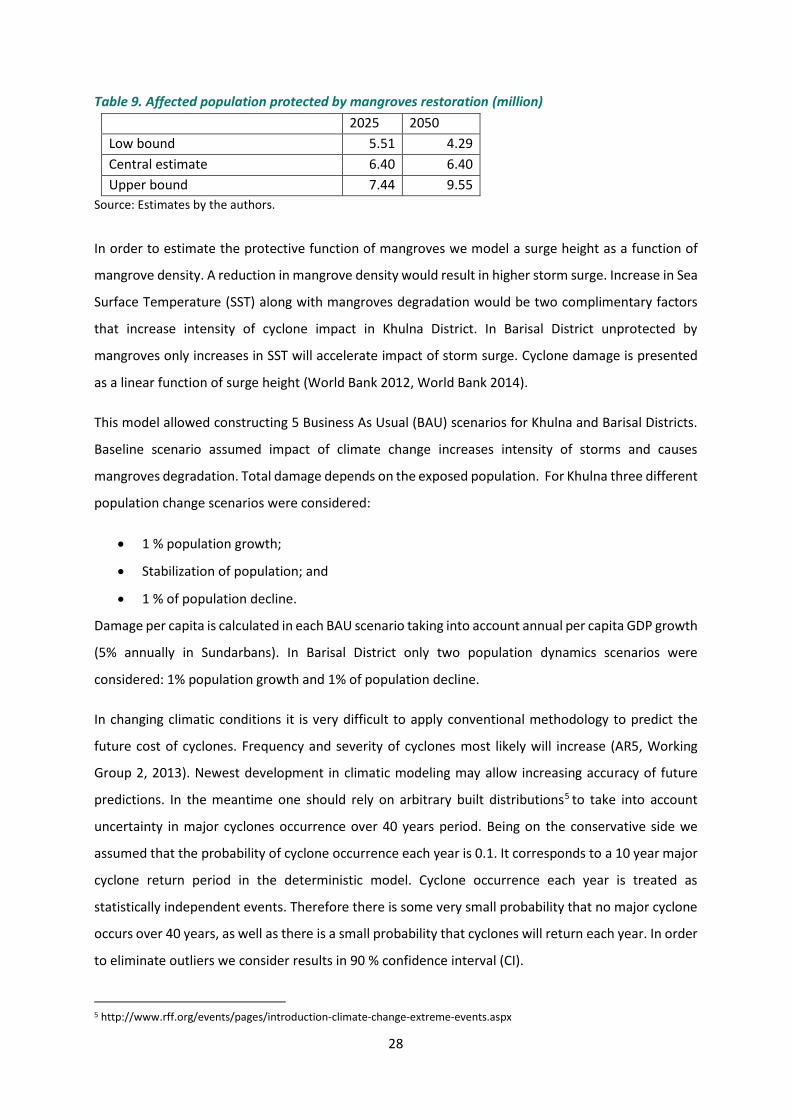
3.1.1. Foreshore afforestation (mangroves restoration and plantations) and mangrove protection Mangroves protects coastal zone from storm surge. Benefits and cost of this intervention was
calculated for the period 2015-2050. This intervention protects population in Khulna. The range of
estimates for affected populations that could be protected by mangrove restoration summarized in
table 9.
28
Table 9. Affected population protected by mangroves restoration (million)
2025 2050
Low bound 5.51 4.29
Central estimate 6.40 6.40
Upper bound 7.44 9.55
Source: Estimates by the authors.
In order to estimate the protective function of mangroves we model a surge height as a function of
mangrove density. A reduction in mangrove density would result in higher storm surge. Increase in Sea
Surface Temperature (SST) along with mangroves degradation would be two complimentary factors
that increase intensity of cyclone impact in Khulna District. In Barisal District unprotected by
mangroves only increases in SST will accelerate impact of storm surge. Cyclone damage is presented
as a linear function of surge height (World Bank 2012, World Bank 2014).
This model allowed constructing 5 Business As Usual (BAU) scenarios for Khulna and Barisal Districts.
Baseline scenario assumed impact of climate change increases intensity of storms and causes
mangroves degradation. Total damage depends on the exposed population. For Khulna three different
population change scenarios were considered:
1 % population growth;
Stabilization of population; and
1 % of population decline.
Damage per capita is calculated in each BAU scenario taking into account annual per capita GDP growth
(5% annually in Sundarbans). In Barisal District only two population dynamics scenarios were
considered: 1% population growth and 1% of population decline.
In changing climatic conditions it is very difficult to apply conventional methodology to predict the
future cost of cyclones. Frequency and severity of cyclones most likely will increase (AR5, Working
Group 2, 2013). Newest development in climatic modeling may allow increasing accuracy of future
predictions. In the meantime one should rely on arbitrary built distributions5 to take into account
uncertainty in major cyclones occurrence over 40 years period. Being on the conservative side we
assumed that the probability of cyclone occurrence each year is 0.1. It corresponds to a 10 year major
cyclone return period in the deterministic model. Cyclone occurrence each year is treated as
statistically independent events. Therefore there is some very small probability that no major cyclone
occurs over 40 years, as well as there is a small probability that cyclones will return each year. In order
to eliminate outliers we consider results in 90 % confidence interval (CI).
5 http://www.rff.org/events/pages/introduction-climate-change-extreme-events.aspx

29
Figure 14 below illustrates distribution of cyclones frequency over the next 40 years. Number of
cyclones in 90 % CI is from 1 to 7 over the 40 years period.
Being on the conservative side we assume that probability of major cyclones does not depend on global
temperature rise. However, as we mentioned before, cyclone intensity will increase with SST rise that
is a function of global temperature in our model. Global temperature depends on the global emission
scenario. For the global temperature simulation we use DICE 2013 (Nordhaus), the open source
integrated assessment model. The model translates global Greenhouse gases (GHG) emissions into
global temperature increase.
Figure 14. Average predicted number of cyclones in Bangladesh in 2011-2050
Source: Estimates by the authors.
Box 1. Reconstruction of baseline and alternative scenarios for mangroves protection/planting
The baseline scenario assumes on average 1% of mangrove degradation over the period up to 2050.
Mangrove protection constitutes an adaptation intervention. We assume that planting of mangroves
on 5,530 ha every year during the next 20 years would prevent degradation of mangroves in
Sundarbans (the total area of 395,000 ha) 6 . Also, protection of mangroves requires husbandry
sedimentation of a shoreline. Total costal line is about 750 km. Annual sedimentation should be
6 Planting of forest could be scattered across an entire forested area in order to obtain maximum protecting effect. Also we assume additional 40% of replanting required due to 60% survival rate of seedlings.

30
completed on about 37.5 km per year. The cost of mangrove planting per ha is US$1,680 (see Dasgupta,
2010); and cost of husbandry sedimentation is estimated at US$1.5 million per km of coastline,
assuming 500 m3 of land is needed to reinforce 1m of costal line, and cost of moving 1 m3 is US$3.
Benefits of intervention include direct and indirect benefits of mangroves protection. Mangroves
reduces exposure to storm surge and damage from cyclones, mitigating negative impact of relatively
frequent and moderately intensive cyclones. The protective value of mangroves is estimated in (World
Bank, 2012) and briefly summarized below.
Projection of storm surge inundation in a changing climate (Dasgupta et al, 2010) confirmed an
essential protective function of mangroves. Storm surge in mangroves area is projected two times less
than in the area without mangroves (marked in red in the map figure 13). Degradation of mangrove
forests due to climate change and human activity results in losses of its protective function, while
interventions to protect mangroves enhances their protective function and reduces the risk of cyclone
damage. Cyclone Sidr that hit the SIZ in 2007 generated substantial damage in Barisal District,
unprotected by mangroves, while damage was relatively lower in Khulna District, protected by
mangroves (see Government of Bangladesh (GoB), 2008).
In World Bank, 2011 an average per capita damage in Barisal is about US$170 per capita, and in Khulna
District – about US$77. Degradation of mangroves results in increased damage calculated as a linear
function of reduction mangroves density (based on the reported data for the whole affected area
damage. This damage was estimated as a function of storm surge). A 5% per year appreciation
coefficient was applied to the base value of damage from cyclone, assuming the values reported in WB
2011 were calculated for the year 2010.
The difference between degradation (reference or BAU) scenario and protection scenario constitutes
benefits of proposed adaptation intervention. In addition to protective benefits from cyclones and
storm surge, mangroves have several quantifiable benefits that we include in BCA. A detailed
description of benefits presented below.
Value of mangrove services in Sundarbans
Proposed intervention allows preservation of various benefits provided by mangroves. We monetized
provisional value, recreational value, biodiversity protection values and climate regulation values of
mangroves.
31
1) Provisional values
The study by Islam7 (2010) quantifies the economics of extraction and sale of marketed products from
the Sundarbans Reserved Forest (SRF) that form the basis for an assessment of direct annual use of
the various categories of goods extracted from SRF: timber; non-timber forest products; fish; and other
aquatic resources. Timber and fuel wood were exclude from the study since the Ministry of Forest put
a moratorium on timber felling in 1989 and on fuel wood collection in 1995 (Islam , 2010). Growth of
tree volume in the SRF reported in Ministry of Environment and Forests in Bangladesh (2010) suggests
that this moratorium is quite effective.
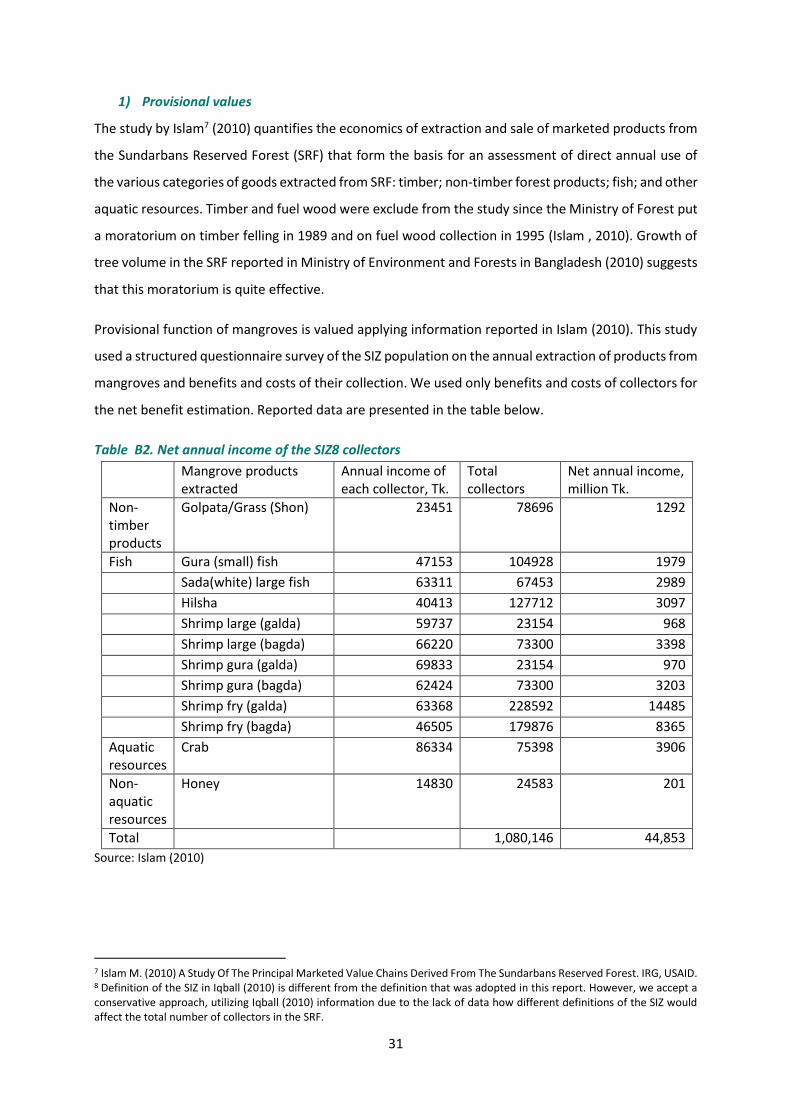
Provisional function of mangroves is valued applying information reported in Islam (2010). This study
used a structured questionnaire survey of the SIZ population on the annual extraction of products from
mangroves and benefits and costs of their collection. We used only benefits and costs of collectors for
the net benefit estimation. Reported data are presented in the table below.
Table B2. Net annual income of the SIZ8 collectors
Mangrove products extracted
Annual income of each collector, Tk.
Total collectors
Net annual income, million Tk.
Non-timber products
Golpata/Grass (Shon) 23451 78696 1292
Fish Gura (small) fish 47153 104928 1979
Sada(white) large fish 63311 67453 2989
Hilsha 40413 127712 3097
Shrimp large (galda) 59737 23154 968
Shrimp large (bagda) 66220 73300 3398
Shrimp gura (galda) 69833 23154 970
Shrimp gura (bagda) 62424 73300 3203
Shrimp fry (galda) 63368 228592 14485
Shrimp fry (bagda) 46505 179876 8365
Aquatic resources
Crab 86334 75398 3906
Non-aquatic resources
Honey 14830 24583 201
Total 1,080,146 44,853
Source: Islam (2010)
7 Islam M. (2010) A Study Of The Principal Marketed Value Chains Derived From The Sundarbans Reserved Forest. IRG, USAID. 8 Definition of the SIZ in Iqball (2010) is different from the definition that was adopted in this report. However, we accept a conservative approach, utilizing Iqball (2010) information due to the lack of data how different definitions of the SIZ would affect the total number of collectors in the SRF.

32
Then applying Tk.79 per US$ 1 exchange rate, average provisional value of mangroves in Sundarbans
is estimated at US$ 1,646 per hectare.
2) Recreational values
Domestic and international tourist flow in the SIZ is reported in Iqball et al (2010).
Table B3. Foreign and domestic tourists in the SRF
Foreign tourists Domestic tourists
2004 1,457 46,887
2005 1,298 69,078
2006 1,582 92,632
2007 2,083 94,745
2008 1,861 78,689
Source: Iqball et al (2010)
Expenses of a foreign tourist are estimated at about US$3000 per trip, including US$2000 air ticket,
US$500 trip to Sundarbans, and remaining US$500 for hotel in Dhaka and other expenses. Domestic
tourist expenses are estimated at about US$50 per person/trip. Total expenses are estimated at 0.6
billion Tk. annually. The expenses reflect a low level of ecotourism development in the SRF. Ecotourism
development is one of the ways to improve livelihoods of local population and accumulate
conservation funds for the SRF. Recreation value per hectare of forest in Sundarbans is estimated at
US$24 per hectare.
3) Biodiversity values
There are several meta-analysis studies of ecosystem services values available (Hussain et al, 2011; de
Groot et al, 2012). The study by de Groot et al is a background estimate provided by the TEEB project.9
The study presents meta-analysis of ecosystem services valuation studies from all over the world. It
gives a comprehensive summary of reported values of ecosystem services in different ecosystems,
including tropical forests. This study presents an average median value of coastal forests that include
coastal areas with mangroves. Median nursery service value per hectare of coastal area is estimated
at International US$1,127 per hectare or US$376 per hectare; and gene pool conservation values are
estimated at International US$ 1,815 per hectare or US$605 per hectare in Bangladesh using PPP
conversion of International UD$ into US$.
4) Climate regulation or carbon pool value
Carbon sequestration in Sundarbans is estimated in Government of Bangladesh (2011). Only above
ground accumulation is taken into account on this report.
9 http://www.teebweb.org

33
Table B4. Carbon sequestered in different mangrove forest in Sundarbans
Sundri Gewa Goran
C t/ha 95%CI C t/ha 95%CI C t/ha 95%CI
Trees above ground
109 +/-15 56 +/-15 20 +/-4
Source: Government of Bangladesh, 2011
For the whole Sundarbans (Government of Bangladesh, 2011) estimates that average carbon pool for
trees aboveground is at about 82 t/ha (+/-11t/ha). Then applying price per tone of carbon as in (Tol,
2011) for the Social Cost of Carbon (SCC) at 5.2US$/t CO2 with discount 5%, average cost of carbon
accumulated in mangroves is estimated at US$1,563 per hectare.
Although for deterministic calculations we apply the SCC from Tol 2011, as it was required to establish
a “common denominator” with other studies for Bangladesh, for uncertainty analysis we apply DICE
2013 to compute the SCC. For calculating revenues from REDD+ we assumed heavily discounted
market price @5/tCO2 in 2015, i.e. about the same as in 5% discount rate scenario.
Then total mangroves values are summarized in the table below
Table B5. Annual mangrove values estimated in the report (US$ per hectare)
Provisional 1,646
Biodiversity protection 981
Recreational 24
Climate regulation 1,563
Total 4,214 Source: Estimated by authors
Results of benefit cost analysis for different discount rates summarized in table 10.
Table 10. Benefits and cost of mangroves protection in The Sundarbans (US$ million)10
Discount 3% 5% 10%
Cost 1,788 1,352 783
Provisional benefits, biodiversity, ecotourism values
3,655 2,321 907
Protective services values 2,123 1,218 368
Climate regulation (carbon pool) values 293 194 0-87
Total benefits 6,071 3,733 1,362
BCR 3.40 2.76 1.63-1.74
10 According to Tol 2011 SCC at 10% discount rate is zero, at the same time it is advisable to apply at list a market value of carbon around $5/tCO2. A 5% a year appreciation coefficient was applied to SCC.
34
If we apply the USEPA recommended SCC at US$11/tCO2 calculated with 5% discount rate11, then the
BCR increases from 2.76 to 2.92.
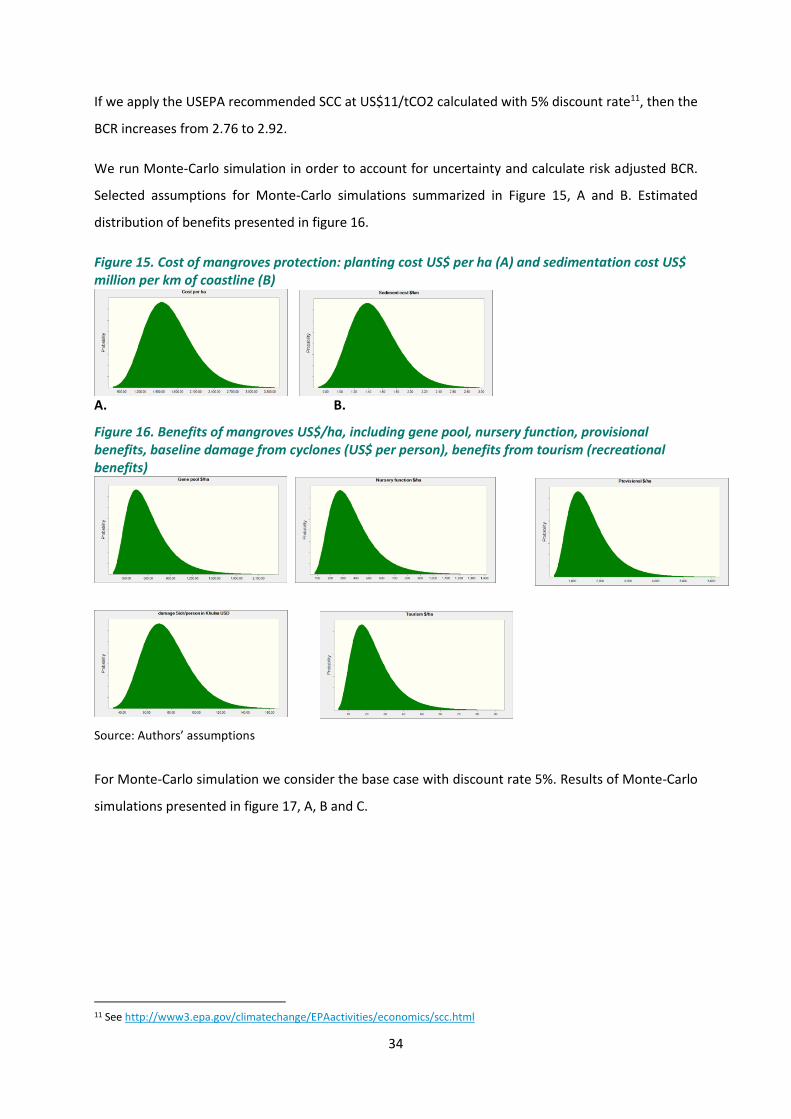
We run Monte-Carlo simulation in order to account for uncertainty and calculate risk adjusted BCR.
Selected assumptions for Monte-Carlo simulations summarized in Figure 15, A and B. Estimated
distribution of benefits presented in figure 16.
Figure 15. Cost of mangroves protection: planting cost US$ per ha (A) and sedimentation cost US$ million per km of coastline (B)
A. B.
Figure 16. Benefits of mangroves US$/ha, including gene pool, nursery function, provisional benefits, baseline damage from cyclones (US$ per person), benefits from tourism (recreational benefits)
Source: Authors’ assumptions
For Monte-Carlo simulation we consider the base case with discount rate 5%. Results of Monte-Carlo
simulations presented in figure 17, A, B and C.
11 See http://www3.epa.gov/climatechange/EPAactivities/economics/scc.html

35
Figure 17. A. Distribution of BCR for mangroves protection benefits
Source: Estimates by the authors.
Figure 17. B. Distribution of BCR for mangroves protection including global carbon benefits, provisional value, biodiversity and tourism
Source: Estimates by the authors.

36
Figure 17. C. Distribution of BCR for mangroves protection including potential monetizable carbon benefits from participation in REDD+
Source: Estimates by the authors.
In all carbon monetization cases, the expected BCR is higher than 1.
In case with all benefits included, the BCR is about 3. With an option value, the risk adjusted BCR is
about 10% higher, i.e. it is about 3.3. In the worst case scenario the BCR may not be lower than 1.2.
Therefore, mangroves protection could be recommended for implementation. It may take about 20
years to implement the program of mangroves protection. New information on climate change, status
of global carbon market, actual efficiency of mangroves to mitigate damage from storm surge, etc.
would become available during this period. It allows a narrowing range for the BCR and deciding on
acceleration of phasing out the project. Taking into account benefits of flexibilities, the risk adjusted
BCR for mangroves protection with REDD+ benefits increases to 1.2.
3.1.2. Multi-purpose cyclone shelters, cyclone-resistant private housing and further strengthening of the early warning & evacuation system Shelters and an early warning system prevent risk of human health losses, primarily. All other losses
may still occur. In 1991 about 190,000 lives were lost. Multipurpose cyclone shelters, which were built
mainly after the cyclone of 1991, were found useful in flood and in small intense cyclones from 1991
onward. At present, about 15% of the coastal population is under the coverage of cyclone shelters.
About 1.5 million people took shelter during cyclone Sidr. During cyclone Sidr about 3.5 thousand lives
were lost (Government of Bangladesh, 2009).
37
To ensure the safety of the rest of the 85% people in the area with the highest cyclone risk12, 530
cyclone shelters are needed and with the increase in population, more cyclone shelters will be
required. Shelter construction was considered in Barisal district in the areas where population is most
exposed to mortality risk from cyclones taking into account relocation of some population. While
relocation practically eliminates risk of human life loss, shelter construction significantly reduces, but
not completely eliminates this risk due to various reasons related to population response to early
warning, efficiency of enforcement of mandatory evacuation, accuracy and predictability of cyclone
path, etc. 75 per cent of shelters efficiency was assumed in the study.
Each shelter can accommodate 1,000-1,300 people and 450-500 cattle, and includes separate rooms
for men, women and sick people, as well as toilet facilities, a rainwater tank, solar panels, generator
and loudspeaker. One million cattle perished during Sidr. Then 530 shelters protect about 2.5 million
cows.
The early warning system is critical to increase shelters efficiency, timely dispatching population
exposed to the immanent risk of an unfolding extreme event to a nearest shelter will increase its
efficiency. According to the (World Bank, 2010) the cost of one shelter is US$ 227 thousand.
Maintenance cost is at 5% of capital cost per year.
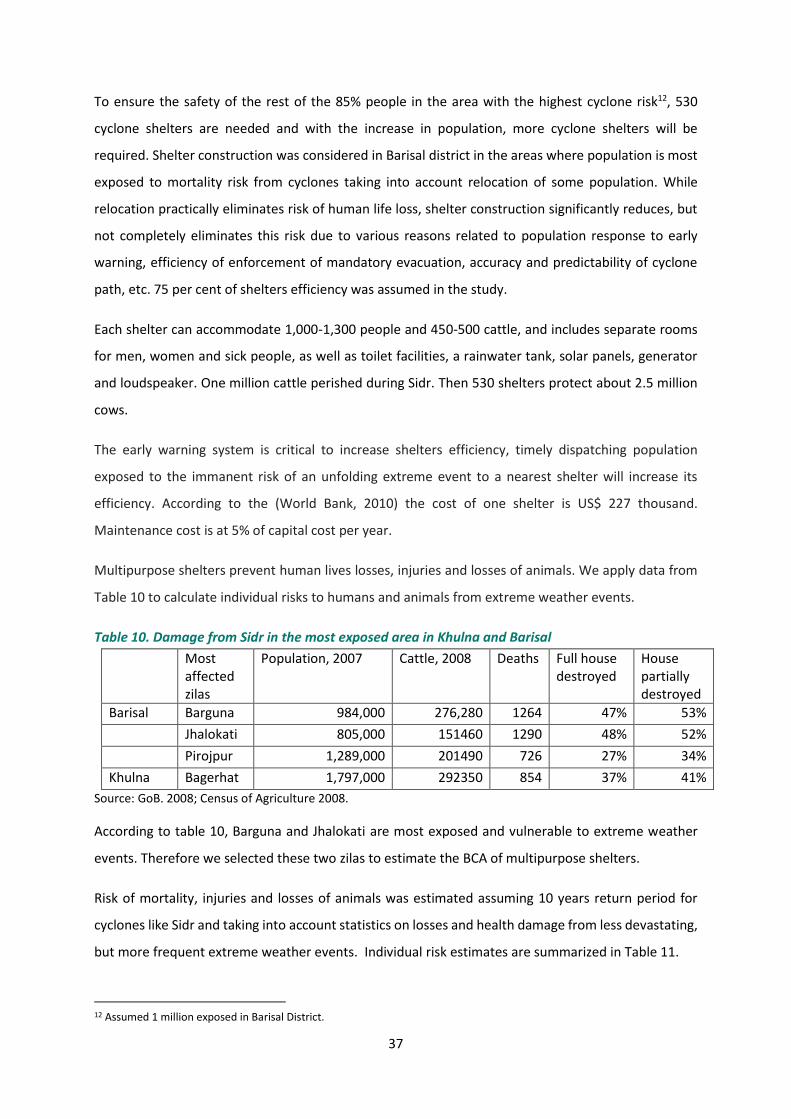
Multipurpose shelters prevent human lives losses, injuries and losses of animals. We apply data from
Table 10 to calculate individual risks to humans and animals from extreme weather events.
Table 10. Damage from Sidr in the most exposed area in Khulna and Barisal
Most affected zilas
Population, 2007 Cattle, 2008 Deaths Full house destroyed
House partially destroyed
Barisal Barguna 984,000 276,280 1264 47% 53%
Jhalokati 805,000 151460 1290 48% 52%
Pirojpur 1,289,000 201490 726 27% 34%
Khulna Bagerhat 1,797,000 292350 854 37% 41%
Source: GoB. 2008; Census of Agriculture 2008.
According to table 10, Barguna and Jhalokati are most exposed and vulnerable to extreme weather
events. Therefore we selected these two zilas to estimate the BCA of multipurpose shelters.
Risk of mortality, injuries and losses of animals was estimated assuming 10 years return period for
cyclones like Sidr and taking into account statistics on losses and health damage from less devastating,
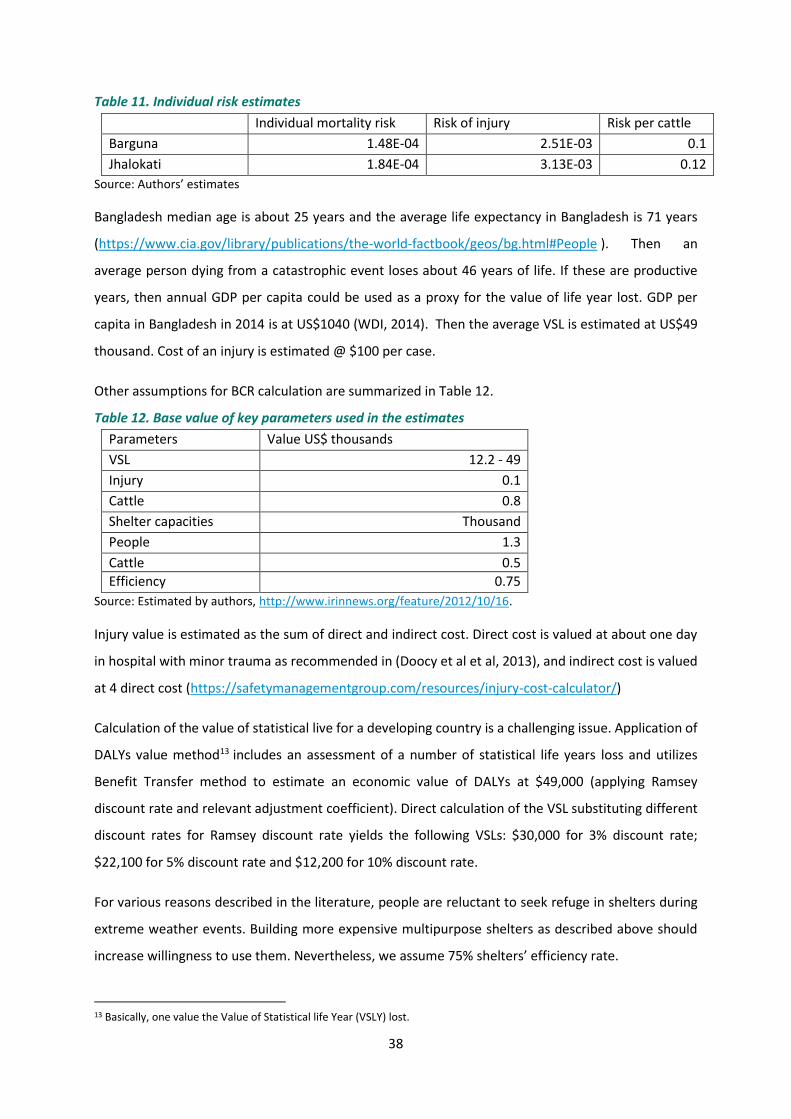
but more frequent extreme weather events. Individual risk estimates are summarized in Table 11.
12 Assumed 1 million exposed in Barisal District.
38
Table 11. Individual risk estimates
Individual mortality risk Risk of injury Risk per cattle
Barguna 1.48E-04 2.51E-03 0.1
Jhalokati 1.84E-04 3.13E-03 0.12
Source: Authors’ estimates
Bangladesh median age is about 25 years and the average life expectancy in Bangladesh is 71 years
(https://www.cia.gov/library/publications/the-world-factbook/geos/bg.html#People ). Then an
average person dying from a catastrophic event loses about 46 years of life. If these are productive
years, then annual GDP per capita could be used as a proxy for the value of life year lost. GDP per
capita in Bangladesh in 2014 is at US$1040 (WDI, 2014). Then the average VSL is estimated at US$49
thousand. Cost of an injury is estimated @ $100 per case.
Other assumptions for BCR calculation are summarized in Table 12.
Table 12. Base value of key parameters used in the estimates
Parameters Value US$ thousands
VSL 12.2 - 49
Injury 0.1
Cattle 0.8
Shelter capacities Thousand
People 1.3
Cattle 0.5
Efficiency 0.75
Source: Estimated by authors, http://www.irinnews.org/feature/2012/10/16.
Injury value is estimated as the sum of direct and indirect cost. Direct cost is valued at about one day
in hospital with minor trauma as recommended in (Doocy et al et al, 2013), and indirect cost is valued
at 4 direct cost (https://safetymanagementgroup.com/resources/injury-cost-calculator/)
Calculation of the value of statistical live for a developing country is a challenging issue. Application of
DALYs value method13 includes an assessment of a number of statistical life years loss and utilizes
Benefit Transfer method to estimate an economic value of DALYs at $49,000 (applying Ramsey
discount rate and relevant adjustment coefficient). Direct calculation of the VSL substituting different
discount rates for Ramsey discount rate yields the following VSLs: $30,000 for 3% discount rate;
$22,100 for 5% discount rate and $12,200 for 10% discount rate.
For various reasons described in the literature, people are reluctant to seek refuge in shelters during
extreme weather events. Building more expensive multipurpose shelters as described above should
increase willingness to use them. Nevertheless, we assume 75% shelters’ efficiency rate.
13 Basically, one value the Value of Statistical life Year (VSLY) lost.
39
An average incremental capital cost for multipurpose shelter estimated at $277,000, and operation
annual cost including maintenance is 5% of capital cost. Cost calculations also include US$40 thousand
investment into early warning system and 5% maintenance cost calculated as implied cost per a
shelter, based on the cost information presented in (Dasgupta, 2010; World Bank, 2011).
As in the case of mangroves protection, the shelters construction program covers the period 2015-
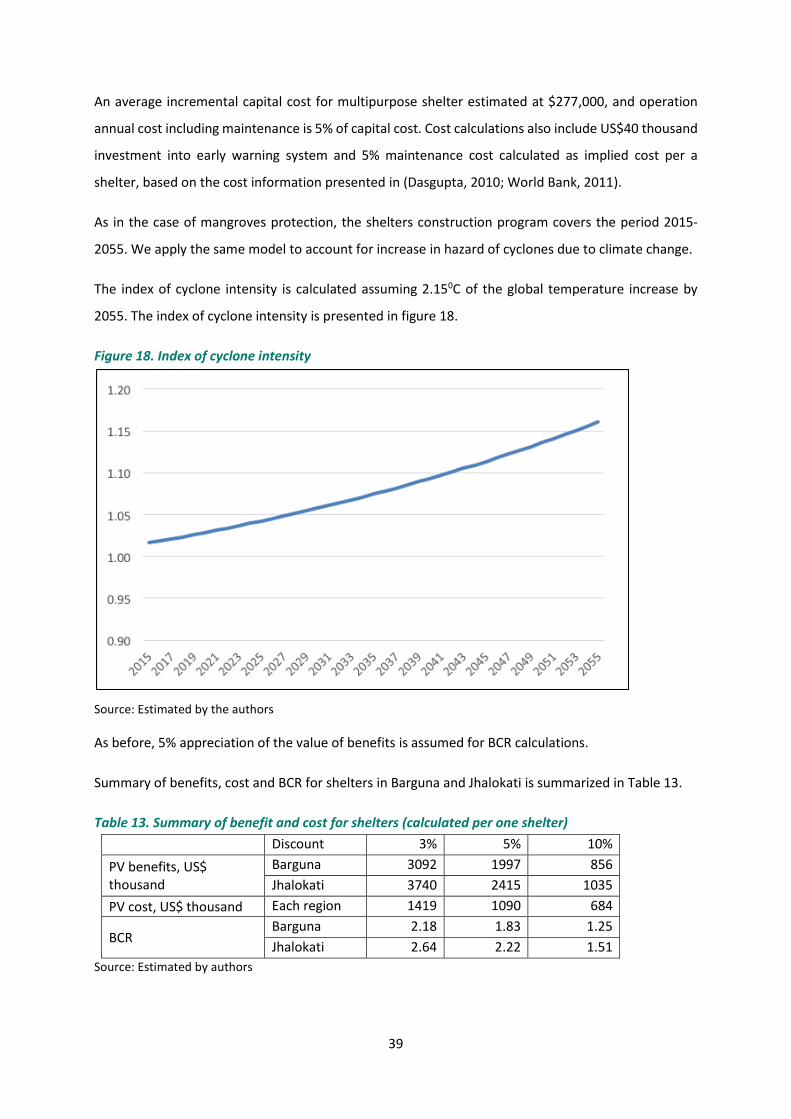
2055. We apply the same model to account for increase in hazard of cyclones due to climate change.
The index of cyclone intensity is calculated assuming 2.150C of the global temperature increase by
2055. The index of cyclone intensity is presented in figure 18.
Figure 18. Index of cyclone intensity
Source: Estimated by the authors
As before, 5% appreciation of the value of benefits is assumed for BCR calculations.
Summary of benefits, cost and BCR for shelters in Barguna and Jhalokati is summarized in Table 13.
Table 13. Summary of benefit and cost for shelters (calculated per one shelter)
Discount 3% 5% 10%
PV benefits, US$ thousand
Barguna 3092 1997 856
Jhalokati 3740 2415 1035
PV cost, US$ thousand Each region 1419 1090 684
BCR Barguna 2.18 1.83 1.25
Jhalokati 2.64 2.22 1.51
Source: Estimated by authors

40
Table 13A. Summary of benefit and cost for shelters calculated with different VSLs for different discount rates
Discount 3% 5% 10%
PV benefits, US$ thousand
Barguna 2,873 1,790 734
Jhalokati 3,466 2,157 883
PV cost, US$ thousand Each region 1,419 1,090 684
BCR Barguna 2.02 1.64 1.07
Jhalokati 2.44 1.98 1.29 Source: Estimated by authors
Application of a lower value of VSL drives BCR lower, however it is still higher than unity in all cases.
On contrary, application of higher VSL, say $200,000, derives BCR significantly higher. At 5% discount
rate the BCR of shelters in Barguna is estimated at 2.9 and in Jhalokati at 3.55.
The BCR in Jhalokati is slightly higher since this region is more vulnerable to climate change (figure 19).
Figure 19. The BCR for Barguna and Jhalokati
Source: Estimated by the authors
A major factor of uncertainty is frequency of cyclones occurrence. Frequency of cyclone occurrence
was modeled in the same way as for the analysis of the mangroves protective function. We use the
same assumptions as in case of mangroves describes above. Beta-PERT distribution was applied for
efficiency of shelters distribution on the interval 0.65-0.85 that corresponds to the central value 0.75.
Shelter construction cost and cost of early warning system were assumed log normal with SD=25%.
41
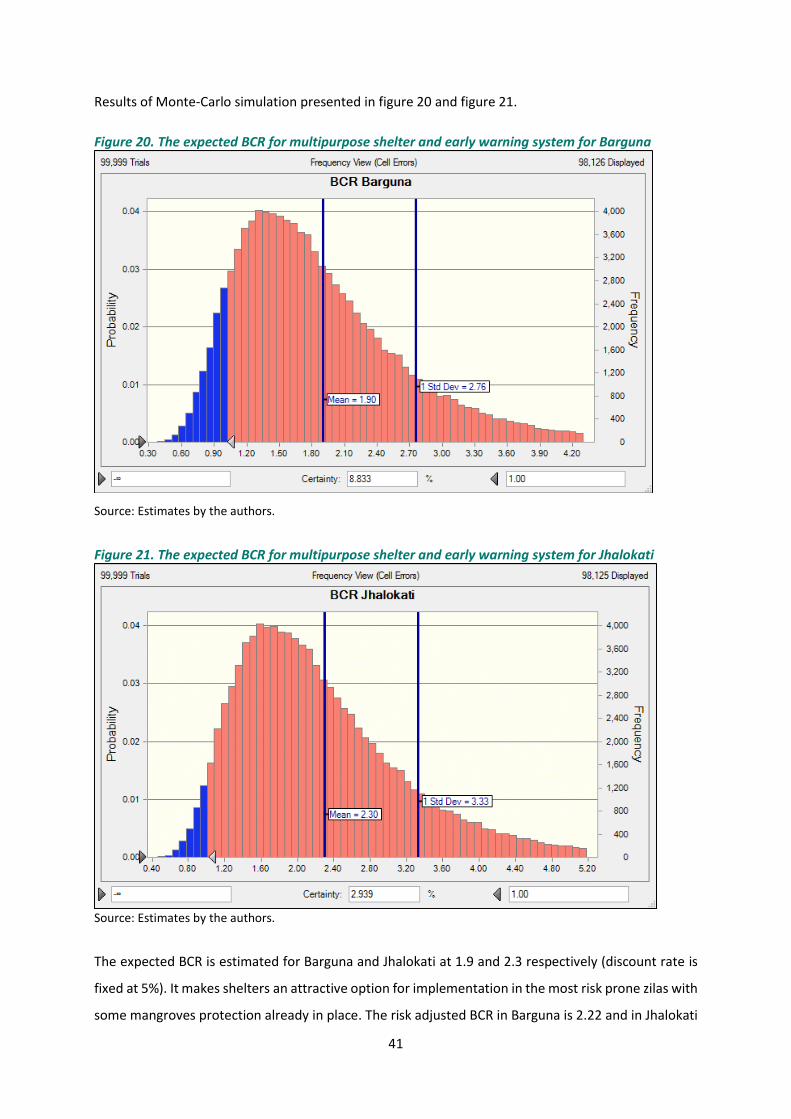
Results of Monte-Carlo simulation presented in figure 20 and figure 21.
Figure 20. The expected BCR for multipurpose shelter and early warning system for Barguna
Source: Estimates by the authors.
Figure 21. The expected BCR for multipurpose shelter and early warning system for Jhalokati
Source: Estimates by the authors.
The expected BCR is estimated for Barguna and Jhalokati at 1.9 and 2.3 respectively (discount rate is
fixed at 5%). It makes shelters an attractive option for implementation in the most risk prone zilas with
some mangroves protection already in place. The risk adjusted BCR in Barguna is 2.22 and in Jhalokati
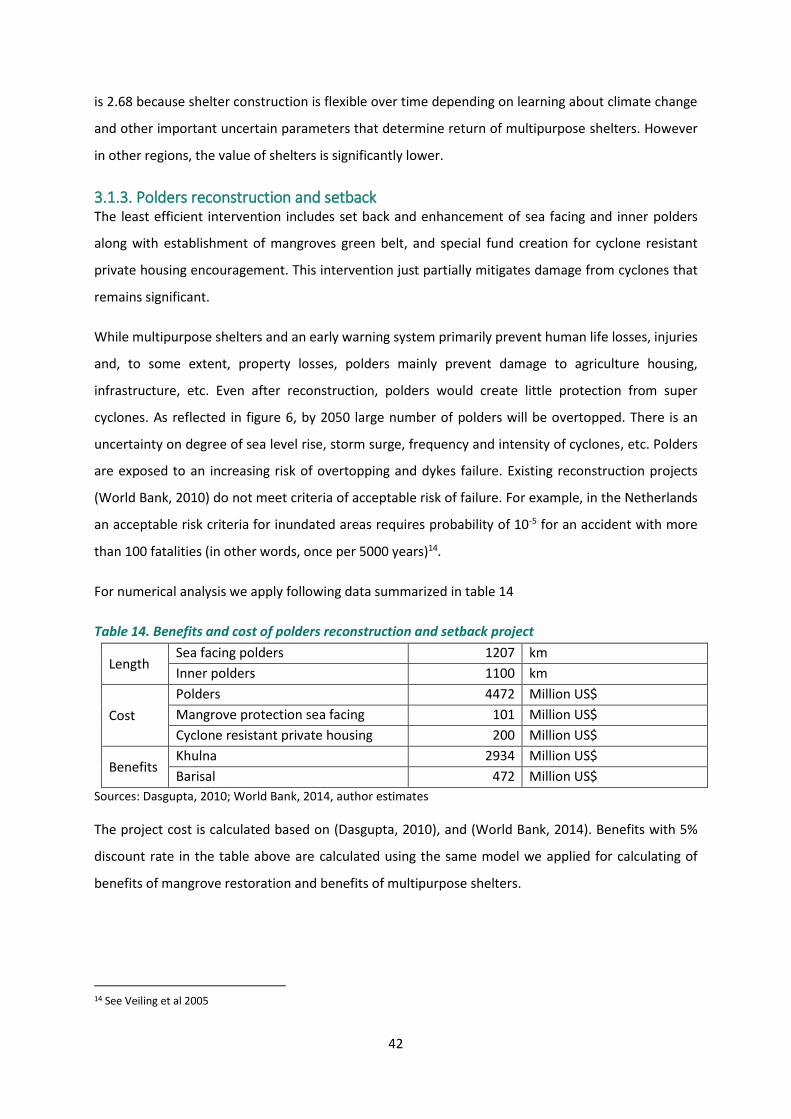
42
is 2.68 because shelter construction is flexible over time depending on learning about climate change
and other important uncertain parameters that determine return of multipurpose shelters. However
in other regions, the value of shelters is significantly lower.
3.1.3. Polders reconstruction and setback The least efficient intervention includes set back and enhancement of sea facing and inner polders
along with establishment of mangroves green belt, and special fund creation for cyclone resistant
private housing encouragement. This intervention just partially mitigates damage from cyclones that
remains significant.
While multipurpose shelters and an early warning system primarily prevent human life losses, injuries
and, to some extent, property losses, polders mainly prevent damage to agriculture housing,
infrastructure, etc. Even after reconstruction, polders would create little protection from super
cyclones. As reflected in figure 6, by 2050 large number of polders will be overtopped. There is an
uncertainty on degree of sea level rise, storm surge, frequency and intensity of cyclones, etc. Polders
are exposed to an increasing risk of overtopping and dykes failure. Existing reconstruction projects
(World Bank, 2010) do not meet criteria of acceptable risk of failure. For example, in the Netherlands
an acceptable risk criteria for inundated areas requires probability of 10-5 for an accident with more
than 100 fatalities (in other words, once per 5000 years)14.
For numerical analysis we apply following data summarized in table 14
Table 14. Benefits and cost of polders reconstruction and setback project
Length Sea facing polders 1207 km
Inner polders 1100 km
Cost
Polders 4472 Million US$
Mangrove protection sea facing 101 Million US$
Cyclone resistant private housing 200 Million US$
Benefits Khulna 2934 Million US$
Barisal 472 Million US$
Sources: Dasgupta, 2010; World Bank, 2014, author estimates
The project cost is calculated based on (Dasgupta, 2010), and (World Bank, 2014). Benefits with 5%
discount rate in the table above are calculated using the same model we applied for calculating of
benefits of mangrove restoration and benefits of multipurpose shelters.
14 See Veiling et al 2005

43
In other discount rates are applied, then the BCR of the entire polders reconstruction and setback
project is above unity just for discount rate 3%.
Polders reconstruction and setback project is an expensive and not very reliable intervention to protect
delta from extreme weather events. Maximum polders efficiency is 80% for Khulna District protected
by mangroves, and 50 % for Barisal district (World bank, 2011).
Despite a significant cyclone risk, the estimated BCR for the entire region is not sufficient to justify
polders set back and enhancement as an area wide intervention (figure 22). However, some local
improvements could be viable. As Pethick (2011) suggests more analysis is required to elaborate an
embankments enhancement program that should be considered along with other interventions.
Figure 22. The BCR for polders reconstruction and setback calculated with different discount rates
Source: Estimates by the authors.
For example, more selective approach to polders reconstruction focusing on areas with inundation less
than 3 meters will increase efficiency of polders project, rising BCR above 1 (figure 23).
Effectiveness of this intervention increases with an increase in intensity and frequency of cyclones and
height of storm surge. Existing polders already protect affected territory from relatively “mild” events.
Incremental benefits are harvested only with an increase of intensity, frequency and severity of the
future extreme weather events. However, even enhanced polders will not protect from a mega storm
like Sidr. Therefore, for a given height of dikes, their protective efficiency is represented as a function
of time with a reversed U-shape

44
Selective approach to polders reconstruction yields a higher BCR. For example, reconstruction of
interior polders costs disproportionally less than the entire project we discuss above (table 14). Using
the same assumptions as in (Dasgupta, 2010) on cost of polders reconstruction in two areas of
inundation, the attributable share of the entire polders set back and reconstruction project cost in the
area with inundation less than 3 m, is estimated at about 20% of the total project cost, while
attributable fraction of the benefits (proportionally to population leaving onshore and inland) is
estimated at 65% in Khulna and at 45% in Barisal.
The estimated BCR for reconstruction and setback in the less than 3m inundation area (see figure 24)
is higher that for the entire project as presented in figure 22.
Figure 23. Effectiveness of polders reconstruction and setback for the selected polders in the less than 3m inundation
Source: Estimates by the authors.

45
Figure 24. The BCR for reconstruction and setback in the less than 3m inundation area with different discount rate for project costs
Source: Estimates by the authors.
Thus, a selective approach demonstrates an efficiency of the polders reconstruction and setback
project in the selected areas with inundation less than 3 m.
The probabilistic model of damage from cyclones is calibrated to take into account uncertainties. Base
value of cyclone damage in Khulna District is assumed log normal with SD=25% and SD=50% in Barisal
District. Coefficient of cost attribution between Khulna and Barisal is also uncertain. We applied a
lognormal distribution with mean value at 0.2 and SD=0.07. An additional maintenance cost (5% of
the capital cost) is included to account for damage to dikes from climate change, if temperature
increases above the reference level. For example, in 2055, the global temperature rise reaches 30C, an
additional maintenance and repair cost reaches 10% of the capital cost. Then distribution of the BCR
in the selected inundation area (less than 3 m) is presented in Figure 25. Mean BCR is estimated at
1.59.
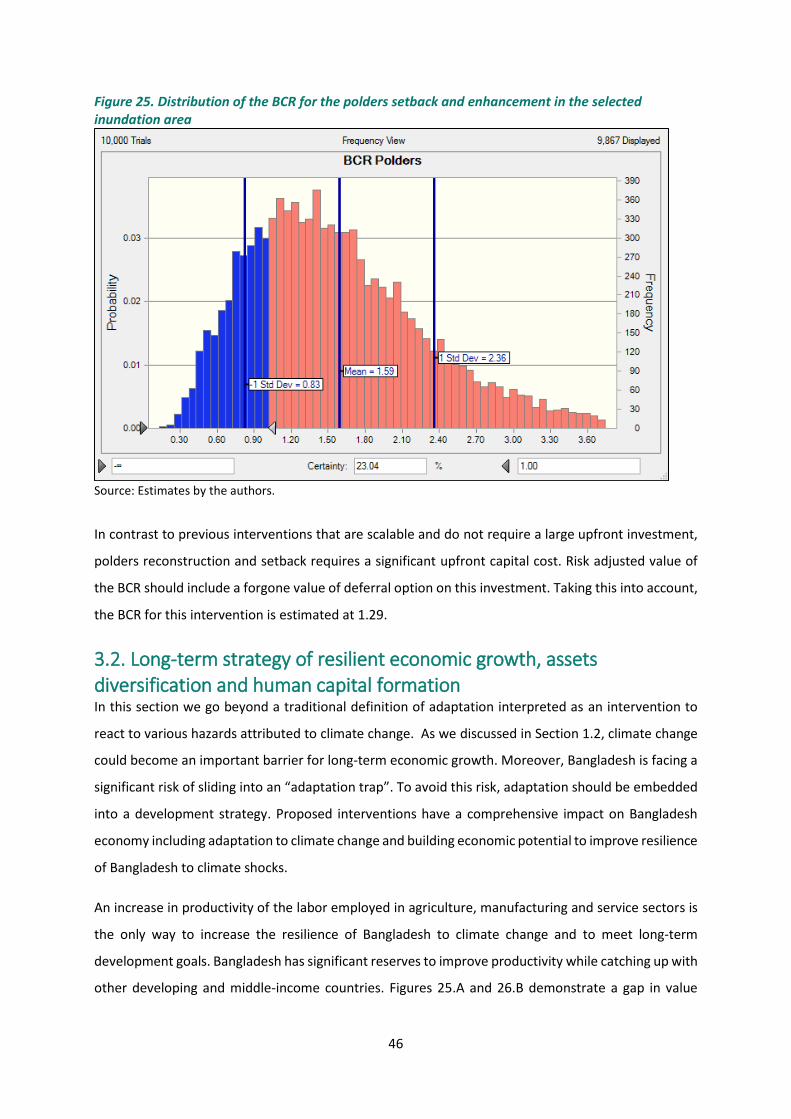
46
Figure 25. Distribution of the BCR for the polders setback and enhancement in the selected inundation area
Source: Estimates by the authors.
In contrast to previous interventions that are scalable and do not require a large upfront investment,
polders reconstruction and setback requires a significant upfront capital cost. Risk adjusted value of
the BCR should include a forgone value of deferral option on this investment. Taking this into account,
the BCR for this intervention is estimated at 1.29.
3.2. Long-term strategy of resilient economic growth, assets diversification and human capital formation In this section we go beyond a traditional definition of adaptation interpreted as an intervention to
react to various hazards attributed to climate change. As we discussed in Section 1.2, climate change
could become an important barrier for long-term economic growth. Moreover, Bangladesh is facing a
significant risk of sliding into an “adaptation trap”. To avoid this risk, adaptation should be embedded
into a development strategy. Proposed interventions have a comprehensive impact on Bangladesh
economy including adaptation to climate change and building economic potential to improve resilience
of Bangladesh to climate shocks.
An increase in productivity of the labor employed in agriculture, manufacturing and service sectors is
the only way to increase the resilience of Bangladesh to climate change and to meet long-term
development goals. Bangladesh has significant reserves to improve productivity while catching up with
other developing and middle-income countries. Figures 25.A and 26.B demonstrate a gap in value

47
added in agriculture and manufacturing per employee in Bangladesh compared to India and China
(about US$3,300-7,500 in industry and US$650-4,000 in agriculture).
Figure 26. A. Value added per employed in agriculture (current US$)
Source: Estimates by the authors using WDI, 2016.
Figure 26.B. Value added per employed in industry (current US$)
Source: Estimates by the authors using WDI, 2016.
There is also a room for improvement in the weighted average productivity of the economy shifting
labor from agriculture to manufacturing and services. The next intervention demonstrates the
economic benefits of population reallocation and population reallocation with simultaneous increase
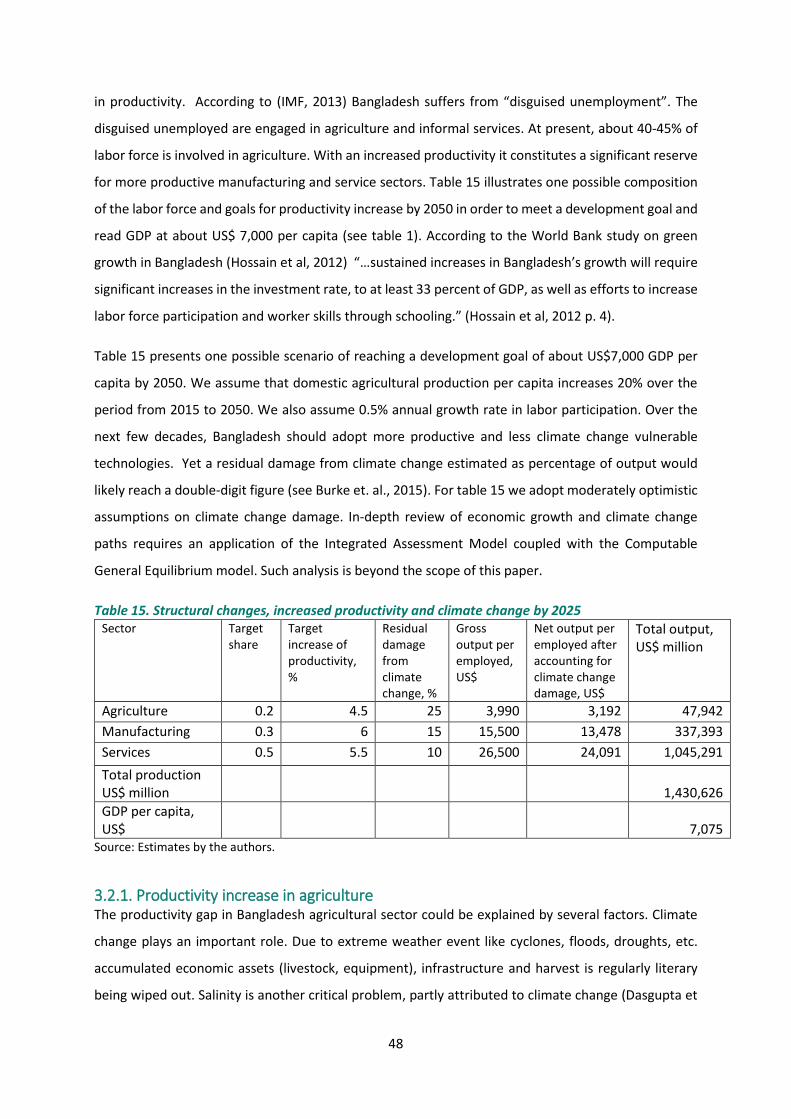
48
in productivity. According to (IMF, 2013) Bangladesh suffers from “disguised unemployment”. The
disguised unemployed are engaged in agriculture and informal services. At present, about 40-45% of
labor force is involved in agriculture. With an increased productivity it constitutes a significant reserve
for more productive manufacturing and service sectors. Table 15 illustrates one possible composition
of the labor force and goals for productivity increase by 2050 in order to meet a development goal and
read GDP at about US$ 7,000 per capita (see table 1). According to the World Bank study on green
growth in Bangladesh (Hossain et al, 2012) “…sustained increases in Bangladesh’s growth will require
significant increases in the investment rate, to at least 33 percent of GDP, as well as efforts to increase
labor force participation and worker skills through schooling.” (Hossain et al, 2012 p. 4).
Table 15 presents one possible scenario of reaching a development goal of about US$7,000 GDP per
capita by 2050. We assume that domestic agricultural production per capita increases 20% over the
period from 2015 to 2050. We also assume 0.5% annual growth rate in labor participation. Over the
next few decades, Bangladesh should adopt more productive and less climate change vulnerable
technologies. Yet a residual damage from climate change estimated as percentage of output would
likely reach a double-digit figure (see Burke et. al., 2015). For table 15 we adopt moderately optimistic
assumptions on climate change damage. In-depth review of economic growth and climate change
paths requires an application of the Integrated Assessment Model coupled with the Computable
General Equilibrium model. Such analysis is beyond the scope of this paper.
Table 15. Structural changes, increased productivity and climate change by 2025 Sector Target
share Target increase of productivity, %
Residual damage from climate change, %
Gross output per employed, US$
Net output per employed after accounting for climate change damage, US$
Total output, US$ million
Agriculture 0.2 4.5 25 3,990 3,192 47,942
Manufacturing 0.3 6 15 15,500 13,478 337,393
Services 0.5 5.5 10 26,500 24,091 1,045,291
Total production US$ million
1,430,626
GDP per capita, US$
7,075
Source: Estimates by the authors.
3.2.1. Productivity increase in agriculture The productivity gap in Bangladesh agricultural sector could be explained by several factors. Climate
change plays an important role. Due to extreme weather event like cyclones, floods, droughts, etc.
accumulated economic assets (livestock, equipment), infrastructure and harvest is regularly literary
being wiped out. Salinity is another critical problem, partly attributed to climate change (Dasgupta et
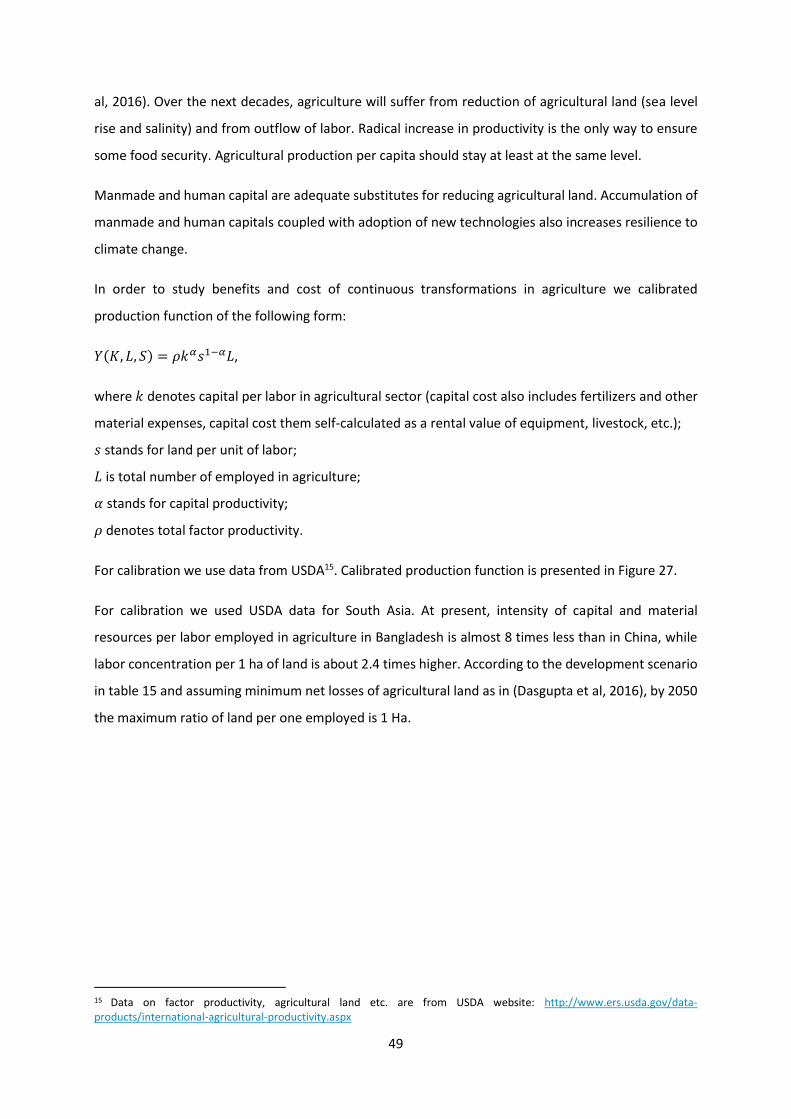
49
al, 2016). Over the next decades, agriculture will suffer from reduction of agricultural land (sea level
rise and salinity) and from outflow of labor. Radical increase in productivity is the only way to ensure
some food security. Agricultural production per capita should stay at least at the same level.
Manmade and human capital are adequate substitutes for reducing agricultural land. Accumulation of
manmade and human capitals coupled with adoption of new technologies also increases resilience to
climate change.
In order to study benefits and cost of continuous transformations in agriculture we calibrated
production function of the following form:
𝑌(𝐾, 𝐿, 𝑆) = 𝜌𝑘𝛼𝑠1−𝛼𝐿,
where 𝑘 denotes capital per labor in agricultural sector (capital cost also includes fertilizers and other
material expenses, capital cost them self-calculated as a rental value of equipment, livestock, etc.);
𝑠 stands for land per unit of labor;
𝐿 is total number of employed in agriculture;
𝛼 stands for capital productivity;
𝜌 denotes total factor productivity.
For calibration we use data from USDA15. Calibrated production function is presented in Figure 27.
For calibration we used USDA data for South Asia. At present, intensity of capital and material
resources per labor employed in agriculture in Bangladesh is almost 8 times less than in China, while
labor concentration per 1 ha of land is about 2.4 times higher. According to the development scenario
in table 15 and assuming minimum net losses of agricultural land as in (Dasgupta et al, 2016), by 2050
the maximum ratio of land per one employed is 1 Ha.
15 Data on factor productivity, agricultural land etc. are from USDA website: http://www.ers.usda.gov/data-products/international-agricultural-productivity.aspx
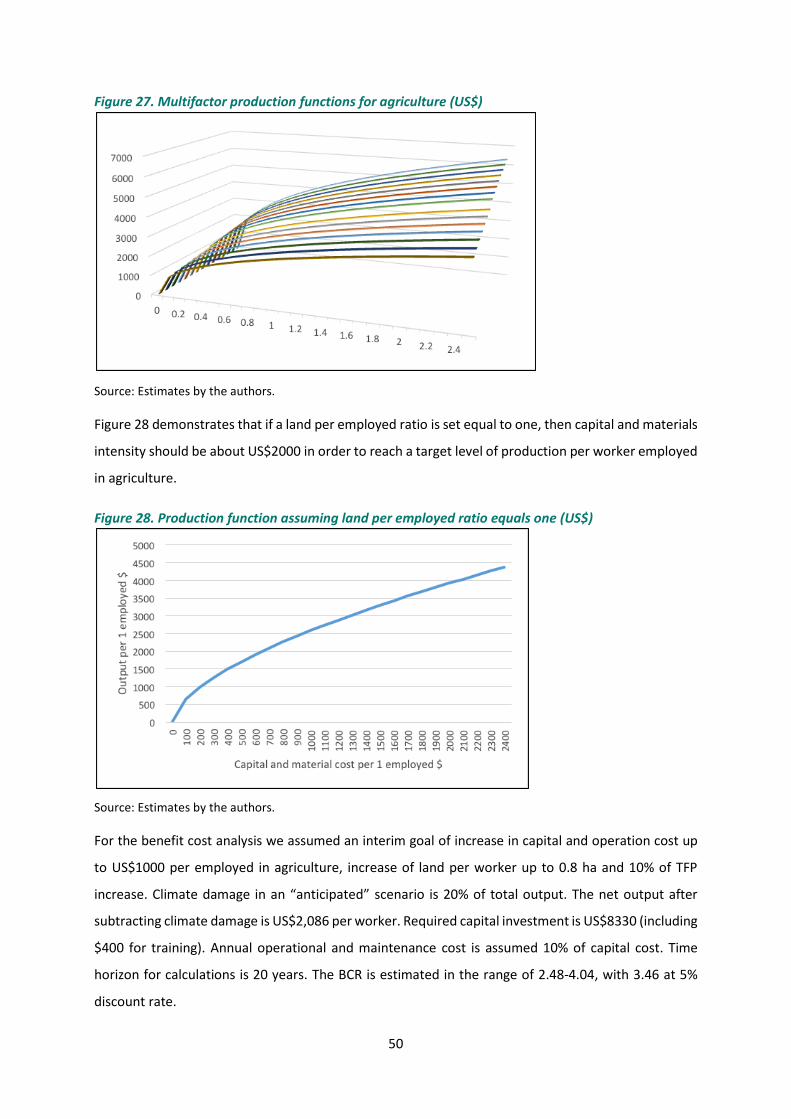
50
Figure 27. Multifactor production functions for agriculture (US$)
Source: Estimates by the authors.
Figure 28 demonstrates that if a land per employed ratio is set equal to one, then capital and materials
intensity should be about US$2000 in order to reach a target level of production per worker employed
in agriculture.
Figure 28. Production function assuming land per employed ratio equals one (US$)
Source: Estimates by the authors.
For the benefit cost analysis we assumed an interim goal of increase in capital and operation cost up
to US$1000 per employed in agriculture, increase of land per worker up to 0.8 ha and 10% of TFP
increase. Climate damage in an “anticipated” scenario is 20% of total output. The net output after
subtracting climate damage is US$2,086 per worker. Required capital investment is US$8330 (including
$400 for training). Annual operational and maintenance cost is assumed 10% of capital cost. Time
horizon for calculations is 20 years. The BCR is estimated in the range of 2.48-4.04, with 3.46 at 5%
discount rate.

51
Table 16. BCA for improvement of productivity in agriculture
3% 5% 10%
PV cost, US$ per one employed 9,352 9,029 8,398
PV benefits, US$ per one employed 37,800 31,220 20,804
BCR 4.04 3.46 2.48
Source: Estimates by the authors.
Probabilistic model of productivity in agriculture increase is calibrated to take into account economic
and climatic uncertainties. The new agricultural practice is still vulnerable to climate change, also it is
not clear how fast and how successful it will be implemented. Cost parameters are also uncertain. In
order to take into account all these uncertainties, we run Monte-Carlo simulations with the following
assumptions: summarized in Figure 29.
Figure 29. Assumptions for Monte-Carlo simulations
Source: Assumptions for the analysis.
Climate damage is quadratic function of the global temperature increase above preindustrial level with
scaling constant equals 0.05. The agricultural sector in Bangladesh is already suffering from a weather
related damage that is included into the damage function. Temperature increase is computed using
the DICE model (Nordhaus, 2013) like in case with Monte-Carlo simulations for mangroves protection.
Then distribution of the BCR is presented in figure 30. Mean BCR is estimated at 3.67. With probability
98.5% BCR is higher than 2. Taking into account an option value, risk adjusted BCR is estimated at about
4.
High benefit cost ratio indicates relative importance of this intervention. Proposed intervention is
scalable and could be replicated over the next 20 years to converge entire agricultural production in
Bangladesh. However, if during this time a better technology becomes available, there is a possibility
of an easy switch to the next generation technology, more productive and more resilient to climate
change.

52
Figure 30. Distribution of the BCR for interventions in agriculture
Source: Estimates by the authors.
3.2.2. Population relocation Relocation of population inland is the most efficient risk mitigation intervention. Over the next 20 years
around 1 million people currently exposed to a high cyclone threat should be relocated. Relocation
reduces total damage from cyclones in this area, which is not protected by mangroves. In addition to
damage from cyclones, the population of Barisal District experiences losses from degradation of
agricultural lands due to increased salinity, and losses from shortage of fresh water. Lower productivity
of agriculture and saline soils, as well as time spent for water search reduces labor productivity. Also,
there are some biodiversity losses, by-catch losses from larvae collection and mangroves productivity
losses associated with their economic activity in the SRF. According to World Bank 2014, the BCR of
relocation is 1.27.
Such a low BCR seems discouraging, however, relocation of about 1 million people from the most
vulnerable areas in Barisal district is a matter of necessity. The only way to increase efficiency of
relocation is to ensure that the relocated population will have new employment opportunities in more
productive sectors of the Bangladeshi economy. Therefore in this section we coincide relocation in
combination with job creation in manufacturing and service sector. For numerical analysis we focus on
manufacturing sector, but the same methodology could be applied to the service sector.
Reallocation is a scalable intervention. Initial experience with reallocation allows narrowing
uncertainties, and scaling it up if actual return on investment is higher than expected. According to
table 9, by 2050 up to 22 million may be residing in more than 3 m inundated area. Relocation of this
population in the second tier cities coupled with training and better education creates a potential for

53
productivity growth of the Bangladeshi’s economy crucial to improve resilience to climate change.
Applying an average household size in Bangladesh at 4.7 (BBS, 2011) and assuming that 1-2 people in
the family will receive an adequate education and training for getting a high productive job in
manufacturing sector, we calculate the benefits of relocation. We also assume a logistic learning that
results in increase of value added per employed worker in the manufacturing sector (see Figure 32).
The one-time cost of relocation for a family (including help with housing etc.) is estimated at US$
10,000. It may take on average up to 3 years for a family to settle and receive a relevant training to get
a more productive job in manufacturing sector. It requires another US$2,000 per year per family
(support and expenses for education). Being on a conservative side we assume that probability to find
this more productive and better-paid job is around 0.75 (otherwise a “conventional” employment in
manufacturing or agriculture could be available). Also, we assume that in addition to that expense,
creation of a new workplace requires US$7,500 (taking into account probability to get the new job
mentioned above, job creation investment per family estimated at US$ 15,000 for 2 workplaces).
Attributed benefits include tangible revenues from additional productivity in manufacturing sector
(see Figure 32) and avoided damage from extreme weather events estimated similar to the case of
shelters construction. This estimate takes into account an increase in intensity of natural disasters and
annual appreciation of the base value of benefits. Calculations represent benefits of relocation of most
vulnerable population from Barisal. We applied the base value of the annual avoided damage per
person at US $170 (World Bank, 2014).
Estimates of central values for the BCA analysis are summarized in Table 17.
Figure 32. Net increase in value added per employed worker in manufacturing sector
Source: Estimates by the authors.
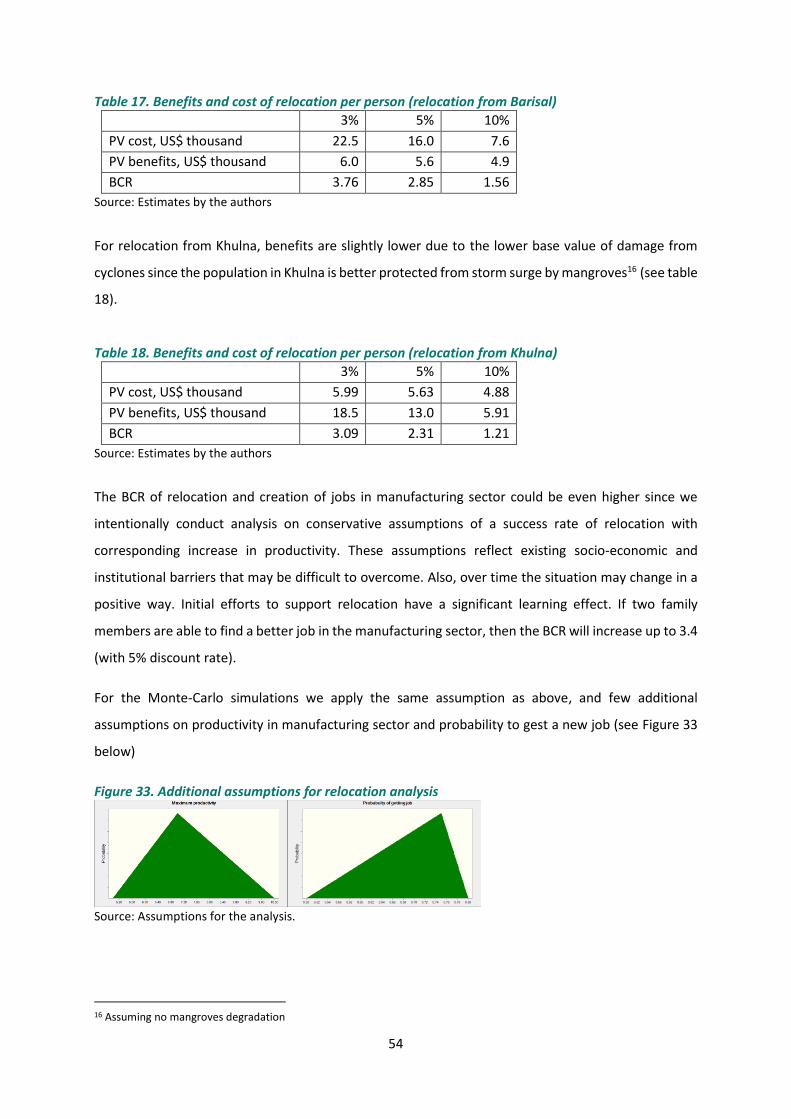
54
Table 17. Benefits and cost of relocation per person (relocation from Barisal)
3% 5% 10%
PV cost, US$ thousand 22.5 16.0 7.6
PV benefits, US$ thousand 6.0 5.6 4.9
BCR 3.76 2.85 1.56
Source: Estimates by the authors
For relocation from Khulna, benefits are slightly lower due to the lower base value of damage from
cyclones since the population in Khulna is better protected from storm surge by mangroves16 (see table
18).
Table 18. Benefits and cost of relocation per person (relocation from Khulna)
3% 5% 10%
PV cost, US$ thousand 5.99 5.63 4.88
PV benefits, US$ thousand 18.5 13.0 5.91
BCR 3.09 2.31 1.21
Source: Estimates by the authors
The BCR of relocation and creation of jobs in manufacturing sector could be even higher since we
intentionally conduct analysis on conservative assumptions of a success rate of relocation with
corresponding increase in productivity. These assumptions reflect existing socio-economic and
institutional barriers that may be difficult to overcome. Also, over time the situation may change in a
positive way. Initial efforts to support relocation have a significant learning effect. If two family
members are able to find a better job in the manufacturing sector, then the BCR will increase up to 3.4
(with 5% discount rate).
For the Monte-Carlo simulations we apply the same assumption as above, and few additional
assumptions on productivity in manufacturing sector and probability to gest a new job (see Figure 33
below)
Figure 33. Additional assumptions for relocation analysis
Source: Assumptions for the analysis.
16 Assuming no mangroves degradation

55
The expected PV of benefits per relocated person is US$8,600 and US$12,300 in 95th percentile, while
an expected cost are estimated US$5,230 and US$6,700 in 95th percentile. The cost includes assistance
with settlement, education cost and the cost of job creation.
Figure 34. Benefit cost ratio for relocation to the second tier cities from Barisal
Source: Estimates by the authors.
Even with conservative assumptions about benefits and cost of relocation into the second tier cities,
the expected BCR is relatively high (mean BCR is 2.86). Moreover, the BCR is always positive and not
less that 1.8 within two standard deviation interval. Taking into account option value, the BCR reaches
3.06.
Figure 35. Benefit cost ratio for relocation to the second tier cities from Khulna
Source: Estimates by the authors.

56
The BCR for relocation from Khulna is slightly lower. Including an option value, the BCR for relocation
from Khulna is 2.44.
Adoption of the strategy of structural transformations of employment in Bangladesh in favor of
manufacturing sector is a fundamental precondition to build resilience to climate change.
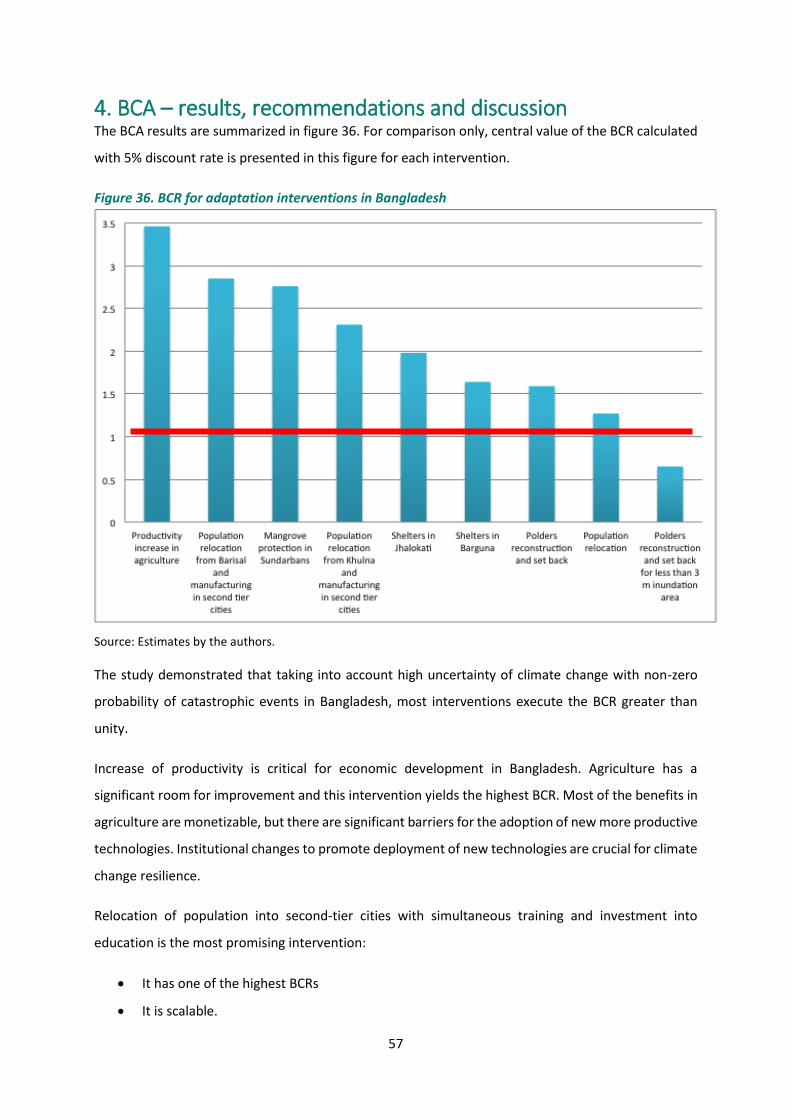
57
4. BCA – results, recommendations and discussion The BCA results are summarized in figure 36. For comparison only, central value of the BCR calculated
with 5% discount rate is presented in this figure for each intervention.
Figure 36. BCR for adaptation interventions in Bangladesh
Source: Estimates by the authors.
The study demonstrated that taking into account high uncertainty of climate change with non-zero
probability of catastrophic events in Bangladesh, most interventions execute the BCR greater than
unity.
Increase of productivity is critical for economic development in Bangladesh. Agriculture has a
significant room for improvement and this intervention yields the highest BCR. Most of the benefits in
agriculture are monetizable, but there are significant barriers for the adoption of new more productive
technologies. Institutional changes to promote deployment of new technologies are crucial for climate
change resilience.
Relocation of population into second-tier cities with simultaneous training and investment into
education is the most promising intervention:
It has one of the highest BCRs
It is scalable.
58
It simultaneously reduces exposure and increases resilience of Bangladesh to climate change.
Population relocation also has a relatively high BCR, especially when relocation is coupled with training
for the manufacturing sector. Adoption of a structural transformation strategy of employment in
Bangladesh in favor of the manufacturing sector is another fundamental precondition to build
resilience to climate change.
Mangroves protection is an important interim intervention. It yields the third highest BCR. In contrast
to agricultural productivity increase, a sizable share of benefits is external. However, this intervention
is important in the mid-term:
It helps by buying time for gradual reallocation;
Carbon benefits potentially could be monetized.
Shelters yield reasonably high BCR; this intervention also should be considered for implementation,
especially in Jhalokati.
Polders reconstruction and reinforcement requires a selective approach. Also, large investments
should be delayed until major uncertainty on intensity of future climate change is resolved or
significantly narrowed.
Flexibility and learning has an economic value that should be taken into account in BCA. Calculation of
an option value helps to quantify risk. In contrast to alternative risk metrics, Real Options Analysis
offers a valuation methodology consistent with BCA. Moreover, application of ROA helps to build a
flexible investment strategy, taking into account potential learning on climate change. An example of
a corresponding decision tree is presented in Figure 37.
The decision tree in Figure 37 illustrates a dilemma between relocation of vulnerable population and
protection of inundated lands. Relocation is scalable and could be scaled up in response to more severe
climate or (and) in response to higher increase of productivity in agriculture and in the manufacturing
sector.
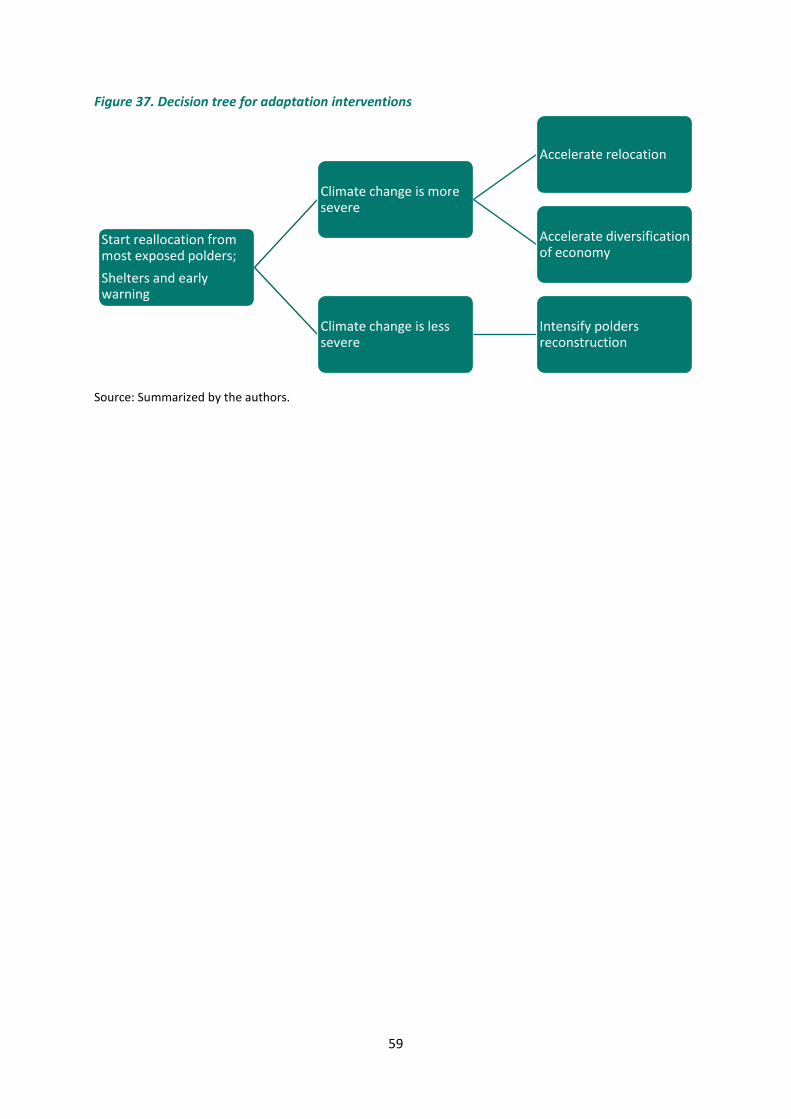
59
Figure 37. Decision tree for adaptation interventions
Source: Summarized by the authors.
Start reallocation from most exposed polders;
Shelters and early warning
Climate change is more severe
Accelerate relocation
Accelerate diversification of economy
Climate change is less severe
Intensify polders reconstruction
60
References Agrawala, S., Ota, T., Uddin Ahmed, A., Smith, J. and van Aalst, M. 2003. Development and Climate
Change in Bangladesh: Focus on Coastal Flooding and the Sundarabans. OECD. Report No.
COM/ENV/EPOC/DCD/DAC (2003)3/FINAL.
Agricultural Census Bangladesh . 2008. Preliminary results.
Ahmed, A. 2011. Some of the major environmental problems relating to land use changes in the coastal
areas of Bangladesh: A review. Journal of Geography and Regional Planning Vol. 4(1), pp. 1-8, January
2011. Available online at http://www.academicjournals.org/JGRP .
Alam, F. 2005. Linkage between fishery, poverty and growth: Bangladesh study DFID. Dhaka,
Bangladesh.
Alam, M. 2008. “Monitoring of Forest Cover Change in Sundarban mangrove forest using Remote
sensing and GIS”, presentation, April 2008, published at: http://printfu.org/
Anda, J., Golub, A., and Strukova, E. 2008. Economics Of Climate Change Under Uncertainty: Benefits
Of Flexibility. Energy Policy, Volume 37, Issue 4, April 2009, Pages 1345-1355.
Angell, Ch. 1994. Promotion of small-scale shrimp and prawn hatcheries in India and Bangladesh. The
Bay of Bengal Programme BOBP/REP/66, India, Madras.
AR4 2007. The Physical Science Basis. Working Group I contribution to the Fourth Assessment Report
of the Intergovernmental Panel on Climate Change. Downloaded from
http://www.ipcc.ch/publications_and_data/ar4/wg1/en/contents.html
AR4, Working Group 1 and 2, 2007. Summary for Policy Makers. The Fourth Assessment Report of the
Intergovernmental Panel on Climate Change. Downloaded from http://www.ipcc.ch/pdf/assessment-
report/ar4/wg1/ar4-wg1-spm.pdf.
Azar, C. and Lindgren, K., 2003. Catastrophic events and stochastic cost-benefit analysis of climate
change. Climatic Change, 56(3), pp.245-255.
Bangladesh Bureau of Statistics, Zilla Profiles Downloaded from .http://www.bbs.gov.bd in
December, 2011.
Barbier, E., Acreman, M. and Knowler, D. 1997. Economic Valuation of Wetlands. A Guide for Policy
Makers and Planners. Ramsar Convention Bureau. Downloaded from
http://cmsdata.iucn.org/downloads/03e_economic_valuation_of_wetlands.pdf.
Barker, A. 2008. Climate change migrants: A case study analysis. Internship Project Report. Asian
Development Bank, Washington, DC.
BBS. 2005. Population Census-2001: Community Series, Zila: Bagerhat, Barguna, Khulna, Pirjopur,
Sathkhira; Bangladesh Bureau of Statistics, www.bbs.gov.bd
BBS. 2005a. Agricultural Sample Survey Census, Upzilla profiles, Bangladesh Bureau of Statistics,
available at http://www.bbs.gov.bd/PageWebMenuContent.aspx?MenuKey=145

61
BBS. 2010. Household and Population Information, Bangladesh Bureau of Statistics Electronic
database, published at
http://www.bbs.gov.bd/RptPopCen.aspx?page=/PageReportLists.aspx?PARENTKEY=41
BBS. 2010. Census Of Agriculture 2008. Structure of Agricultural Holdings & Livestock Population.
BBS. 2010a. Estimates for rice production for 2008-2010, Bangladesh Bureau of Statistics, rice
production survey reports, downloaded from
http://www.bbs.gov.bd/PageWebMenuContent.aspx?MenuKey=144
BBS. 2011. Population and Housing Census 2011, Preliminary Results, Bangladesh Bureau of Statistics
July 2011 as published in www.bbs.gov.bd
BBS. 2011a. Estimates of Jute, 2010-2011, Agriculture Wing, Bangladesh Bureau of Statistics,
downloaded from http://www.bbs.gov.bd/PageWebMenuContent.aspx?MenuKey=144
BCAS, 2012. Sundarbans Climate Change Adaptation, Biodiversity Conservation and Sustainable
Development. Households Survey. Draft Final Report. Bangladesh Center for Advanced Studies.
February, 2012
Biswas, S.N. 2010. Sustainable Development of Fisheries in Sundarban and Conservation of
Biodiversity: A Sundarban Development Board Conception. Presentation.
Biswas, S.N. 2010a. Activities of Fisheries Division. Sundarban Development Board
Govt. of West Bengal Presentation.
Bose, S. 2002. The Sundarbans Biosphere: A Study on Uncertainties and Impacts in Active Delta Region.
Centre for Built Environment, Kolkata.
Bose, S. 2005. Mangrove forests in Sunderbans active delta – ecological disaster and remedies.
Bruner, A., Gullison, R.E. and Balmford, A. 2004. Financial needs for comprehensive, functional
protected area systems in developing countries, BioScience 54: 1119-1126.
BFISH. 2011. Bangladesh Fisheries Information Share Home, http://en.bdfish.org/2011/08/asian-cory-
chandramara-chandramara/
BFISH. 2011a. Bangladesh Fisheries Information Share Home, http://en.bdfish.org/2011/06/pangas-
catfish-pangasius-pangasius-hamilton-1822/
Burke, M., Hsiang, S.M. and Miguel, E., 2015. Global non-linear effect of temperature on economic
production. Nature
CEGIS. 2011. Inception report on Bangladesh climate change adaptation, biodiversity conservation,
and socio-economic sustainable development of the Sundarbans area: Socio-economic development.
Prepared for the World Bank by the Center for Environmental and Geographic Information Services.
Dhaka, Bangladesh.
62
Chandra G. and Sagar R. 2004. Fisheries in Sundarban: Problems and prospects, Central Inland Fisheries
Research Institute, Parganas, India downloaded from
http://zunia.org/uploads/media/knowledge/Fisheries_in_Sundarbans_paper.doc
Chatterjee, S., Rae, A., and Ray., R. 2007. Food Consumption and Calorie Intake in Contemporary India.
Downloaded from https://editorialexpress.com/cgi-bin/conference/download.cgi?db_name
=NZAE2007&paper_id=72.
Choudhury, J., and Hossain, A. 2011. Bangladesh Forestry Outlook Study. FAO Working Paper No.
APFSOS II/ WP/ 2011/ 33.
Chowdhury, T. 2010. Resource-dependent livelihoods in the Sundarbans. CRBOM: Center for River
Basin Organizations and Management, Solo, Central Java, Indonesia
Climate Change Unit. 2012. Assessment of PPCR for Climate Change Adaptation, Report, MoEF, Dhaka
Climate change 2014: impacts, adaptation, and vulnerability (Vol. 1). Cambridge, New York, NY:
Cambridge University Press.
Dahlberg M. 1979. A Review of Survival Rates of Fish Eggs and Larvae in Relation to Impact
Assessments. Marine Fisheries Review.
Danda, A.A., 2007. Surviving in the Sunderbans: Threats and Responses, An analytical description of
life in an Indian riparian commons, Ph.D. dissertation, University of Twente, Enschede, The
Netherlands.
Dasgupta, S., Huq, M., Huq Khan, S., Zahid Ahmed, M., Mukherjee, N., Fida Khan, M., Pandey, K. 2010.
Vulnerability of Bangladesh to Cyclones in a Changing Climate: Potential Damages and Adaptation Cost.
World Bank. Policy Research Working Paper 5280
Dasgupta, S., Huq, M., Mustafa, G., Sobhan, I., Wheeler, D. 2016. Impact of Climate Change and Aquatic
Salinizationon Fish Habitats and Poor Communitiesin Southwest Coastal Bangladesh and Bangladesh
Sundarbans. Policy Research Working Paper 7593, World Bank.
Dixit, A.K. and Pindyck, R.S. 1995. The Options Approach to Capital Investment. Harvard Business
Review.
DoF. 2010. Fish Production of Bangladesh, Department of Fisheries, Government of Bangladesh,
downloaded from http://www.fisheries.gov.bd/node/150
DoF. 2010a. Fisheries Statistics Yearbook of Bangladesh 2008-2009, Vol. 26 Number 1, Fisheries
Resources Survey System, Department of Fisheries, Bangladesh Dhaka 2010, downloaded from
http://www.fisheries.gov.bd/node/321
DoF. 2012. Department of Fisheries, Government of The People’s Republic of Bangladesh,
http://www.fisheries.gov.bd/node/143
Doocy S, Dick A, Daniels A, Kirsch TD. The Human Impact of Tropical Cyclones: a Historical Review of
Events 1980-2009 and Systematic Literature Review. PLOS Currents Disasters. 2013 Apr 16 . Edition 1.
doi: 10.1371/currents.dis.2664354a5571512063ed29d25ffbce74.
63
ECHO. 2009. In-depth Recovery Needs Assessment of Cyclone Aila Affected Areas. Educational
Concerns for Hunger Organization. Texas.
FAO. 2000. Forest resources of Bangladesh - Country report. The Food and Agriculture Organization
of the United Nations. Rome, Italy.
FAO. 2007. The Role of Coastal Forests in the Mitigation of Tsunami Impacts – Main report. The Food
and Agriculture Organization of the United Nations. Downloaded from
www.fao.org/forestry/site/coastalprotection/en.
Ferdoushi Z., Xiang-guo Z. and Hasan M.R. 2010. Mud crab (Scylla sp.) marketing system in Bangladesh,
Asian Journal of Food and Agro-Industry, 2010, 3(02), 248-265
Fritz, H., and Blount, C. Role of forests and trees in protecting coastal areas against cyclones.
Downloaded from ftp://ftp.fao.org/docrep/fao/010/ag127e/ag127e03.pdf.
Froese, R. and D. Pauly. Editors. 2011. FishBase, World Wide Web electronic publication.
http://www.fishbase.org/summary/speciessummary.php?id=12017
Garrod, Guy, and Kenneth George Willis. Economic valuation of the environment: methods and case
studies. Cheltenham: Edward Elgar, 1999.
Ghosh, A. and A.A. Danda, 2001, “Case study on the Sundarbans,” Regional Awareness Workshop on
Global Environment Facility at Indian Institute of Management Calcutta, Centre for Environment and
Development. Downloaded from http://www.geocities.com/abcxtra/joka/Frameset2.htm.
GoB. 2008. Cyclone Sidr in Bangladesh. Damage, Loss and Needs Assessment for Disaster Recovery and
Reconstruction. Government of Bangladesh. Dhaka. Bangladesh. .
GoB. 2010. Project Concept Note. Collaborative REDD+IFM Sundarbans Project (CRISP). Government
of Bangladesh. Dhaka. Bangladesh.
Golub, A. and Markandya A. 2008. Modeling Environment-Improving Technological Innovations under
Uncertainty. Routledge Explorations in Environmental Economics.
Gomez, E. 2014. Natural Hazard Risk Profile of Bangladesh. ADB Bangladesh Capacity Building for
Disaster Risk Finance Project Risk Modeling. Presentation. Dhaka, 2014.
Gopal, B., and Chauhan, M. 2006. Biodiversity and its conservation in the Sundarban Mangrove
Ecosystem Aquat. Sci. Vol. 68, 2006.
Haque, E. 2003. How fishers’ endeavors and information help in managing the fisheries resources of
the Sundarban mangrove forest of Bangladesh, from Haque, E.: Fisheries Management in the
Sundarban Mangroves, Conference proceedings “Putting Fishers’ Knowledge to Work”, Bangladesh
2003
Harun-ur-Rashid, M., and Islam, M.S. 2007. Adaptation to Climate Change for Sustainable
Development of Bangladesh Agriculture. Presentation at third session of the Technical Committee of
the Asian and Pacific Center for Agricultural Engineering and Machinery (APCAEM), November 20-21,
Beijing, China.

64
Hazra, S., Ghosh, T., DasGupta, R., and Sen, G. 2002. Sea Level and associated changes in the
Sundarbans, Science and Culture. Vol 68, no 9-12, 2002, p 309-321.
Hoq, M. E., Islam, M.N., Kamal, M. and Wahab, M.A. 2001. Abundance and seasonal distribution of
Penaeus monodon postlarvae in the Sundarbans mangrove, Bangladesh. Hydrobiologia 457, 97–104.
Hoque, M.A. Sarkar, M.S.K.A., Khan, S.A.K.U., Moral, M.A.H., and Khurram, A.K.M. 2006. Present Status
of Salinity Rise in Sundarban Area and its Effect on Sundari (Heritiera fomes) Species, Research Journal
of Agriculture and Biological Sciences, 2(3): 115-121, 2006, INSInet Publication 2006
Hossain, M., Sen, B. and Sawada, Y. 2012. Jobs, Growth and Development: Making of the “Other”
Bangladesh. Background paper for the WDR 2013. World Bank.
IEP. 2008. India Environment Portal, “Honey collection in Sundarban begins”,
http://www.indiaenvironmentportal.org.in/news/honey-collection-sundarban-begins
Iqball, S., Salequzzaman, M., Haque, S., Islam, R., and Ahmed, S. 2010. Ecotourism in the Sundarbans
and Its Surrounding – A Possible Sustainable Option for Alternative Livelihood Development.
Bangladesh Res. Pub. J. 4(3): 244-253. Downloaded from
http://www.bdresearchpublications.com/admin/journal/upload/09179/09179.pdf
Intergovernmental Panel on Climate Change, 2015. Climate Change 2014: Mitigation of Climate
Change (Vol. 3). Cambridge University Press.ach, K. and Mastrandrea, M., 2014.
IMF, 2013. Bangladesh: Poverty Reduction Strategy Paper. Sixth Five-Year Plan. FY2011-FY2015.
Accelerating Growth and Reducing Poverty. Part Strategic Directions and Policy Framework.
Independent. 2011. The Independent, “Honey collection season begins in Sundarbans”,
http://theindependentbd.com/paper-edition/frontpage/129-frontpage/42662-honey-collection-
season-begins-in-Sundarban.html
Islam, M.R. 2004. “Degeneration of Bangladesh’s Sundarbans Mangroves: A Management Issue.”
International Forestry Review 6(2). Downloaded from http://www.atypon-
link.com/CFA/doi/pdf/10.1505/ifor.6.2.123.38390
Islam, N. 2010. A study of the principal marketed value chains derived from the Sundarbans Reserved
Forest. USAID, Dhaka, Bangladesh
Islam, R. 2006. Managing Diverse Land Uses in Coastal Bangladesh: Institutional Approaches. CAB
International 2006. Environment and Livelihoods in Tropical Coastal Zones (eds C.T. Hoanh, T.P. Tuong,
J.W. Gowing and B. Hardy).
Islam, S., and Haque, M. 2004. The mangrove-based coastal and near shore fisheries of Bangladesh:
ecology, exploitation and management. . Reviews in Fish Biology and Fisheries (2004) 14: 153–180.
IWG SCC (Interagency Working Group on Social Cost of Carbon, U.S. Government). 2009. Social cost of
carbon for regulatory impact analysis under Executive Order 12866, Appendix 15a (p. 53), Washington
DC.

65
KGT. 2010. Al Khalsan General Training, Shrimp Library,
http://www.khalsan.com/foodstuff/shrimplibrary/Penaeus_Monodon.htm
Khan, I., Ali, Z., Asaduzzaman, M., and Bhuyan, H. 2010. The Social Dimensions of Adaptation to Climate
Change in Bangladesh. World Bank. Discussion paper 12. Washington, DC.
Kumar M. et al. 2010. Cyclone Aila: One Year on. Natural Disaster to Human Sufferings. Unnayan
Onneshan-The Innovators. Dhaka, Bangladesh.
Laffoley, D.d’A. & Grimsditch, G. (eds). 2009. The management of natural coastal carbon sinks. IUCN,
Gland, Switzerland.
Mallick, D., Amin, A. and Rahman, A. 2012. Case Study on Climate Compatible Development (CCD) in
Agriculture for Food Security in Bangladesh. Final Report on Bangladesh Country Study. For the
project: Advancing Climate Compatible Development for Food Security through the Implementation
of National Climate Change Strategies. The Project is conducted with support of Germanwatch and
Perspectives from Germany.
MARC. 1995. Socioeconomic studies on Sundarbans Reserve Forest. Multidisciplinary Research Center
Survey. Dhaka, Bangladesh.
McLachlan S., 2002. Export oriented shrimping, Rural People and the environment in Bangladesh:
Good, bad and simply ugly? Chapter 11, from Globalization, Environmental Crisis and Social Change in
Bangladesh, edited by Matiur Rahman, Canada, downloaded from
www.members.shaw.ca/motirahman/Globalization%20and%20Bangladesh/Chapter%2011.pdf
MEF. 2002. Initial National Communication under the UN FCCC. Ministry of Environment and Forests.
Dhaka, Bangladesh.
MEF. 2004. Report on joint tiger census - 2004, Sunderbar Reserve Forests, Ministry of Environment
and Forests, Bangladesh, downloaded from http://www.moef.gov.bd/document/_vti_cnf/
MEF. 2009. Bangladesh climate change strategy and action plan. Ministry of Environment and Forests.
Dhaka, Bangladesh.
Miah, D., Romelahmed and Islam S.J. 2003. Indigenous Management Practices of Golpata (Nypa
fruticans) in Local plantations in Southern Bangladesh, Palms Volume 47(4) 2003
Mome M. A. 2007. The potential of Artisanal Hilsa Fishery in Bangladesh: An Economically Efficient
Fisheries Policy, UNU Fishery Training Programme, Iceland 2007; http://en.wikipedia.org/wiki/Ilish
Nasiruddin Md., Sayeed Hassan M. 2009. Agricultural research priority: vision 2030 and beyond,
Bangladesh Agricultural Research Center (BARC), December 2009, downloaded from
http://www.barc.gov.bd/documents/Final-%20Dr.%20Nasir.pdf
Neumann-Denzau G. and Denzau H. 2010. Examining Certain Aspects of Human-Tiger Conflict in the
Sundarbans Forest, Bangladesh. Tigerpaper. Vol. 37: No. 3 July-September 2010.
Nordhaus, W.D., 2013. The climate casino: Risk, uncertainty, and economics for a warming world. Yale
University Press.

66
Assessment Report (AR5). 2014 .Pachauri, R.K., Allen, M.R., Barros, V.R., Broome, J., Cramer, W.,
Christ, R., Church, J.A., Clarke, L., Dahe, Q., Dasgupta, P. and Dubash, N.K., 2014. Climate Change 2014:
Synthesis Report. Contribution of Working Groups (WG) I, II and III to the Fifth Assessment Report of
the Intergovernmental Panel on Climate Change.
Pethick J. 2011. Assessing Changes in the Landform and Geomorphology due to Sea Level Rise in the
Sundarbans Ecologically Critical Area. Interim report. World Bank.
Pethick, J.,2012. Impact of sea level rises on Sundarban estuaries and embankments. Working Paper.
World Bank. Washington DC.
PRDI. 2006. Participatory Research and Development Initiative, Climate Campaign Brief 3, “Salinity
threatens the World Heritage. The Sundarban of Bangladesh”, downloaded from
http://www.preventionweb.net/english/professional/trainings-events/edu-materials/v.php?id=8203
Quadir, D. A. and Iqbal, A. 2008. Tropical Cyclones: Impacts on Coastal Livelihoods, Investigation of the
coastal inhabitants of Bangladesh. IUCN Working Paper.
Razzaque, M. and Rafiquzzaman, S. 2007. Comparative Analysis of T. Aman Rice Cultivation under
Different Management Practice in Coastal Area. Journal of Agriculture & Rural Development: 5(1&2),
64-69, June 2007 ISSN 1810-1860.
Rouah, F., and Vainberg , G. 2007. Option Pricing Models and Volatility Using Excel-VBA. Wiley Finance.
Ruitenbeek, H.J. 1992. Mangrove Management: An Economic Analysis of Management of Options with
a Focus on Bintuni Bay, Irian Jaya. Report for Environmental Management Development in Indonesia
Project, Halifax, Canada and Jakarta, Indonesia.
Ruitenbeek, H.J. 1994. Modeling Economy-Ecology Linkages in Mangroves: Economic Evidence for
Promoting Conservation in Bintuni Bay, Indonesia. Ecological Economics. 10: 233-247.
Ruitenbeek, H.J. 2012. Benefit Cost Analysis of Sundarban Embankment Options. Preliminary Analysis.
World Bank. Washington DC.
Santhakumar, V., Haque, A., and Bhattacharya, R. 2002. An Economic Analysis of Mangroves in South
Asia.
Santhakumar, V., Haque, E., and Bhattacharya, R. 2002. An Economic Analysis of Mangroves in South
Asia.
Sarwar, G. 2005. Impacts of Sea Level Rise on the Coastal Zone of Bangladesh. Master Thesis. Lund
University International Masters Programme in Environnemental Science.
SCBD. 2001. The Value of Forest Ecosystems. Montreal, 67p. (CBD Technical Series no. 4). Secretariat
of the Convention on Biological Diversity. Montreal, Canada.
Sen, S. 2010. Conservation of the Sundarbans in Bangladesh through Sustainable Shrimp Aquaculture.
JFK School of Government, Cambridge.

67
Shah S. and Ahmed K. 2006. Socio-economy and livelihoods of stakeholders at different levels of
production, processing and marketing and value chain of freshwater prawn (Macrobrachium
rosenbergii) in greater Khulna and Noakhali areas of Bangladesh, in Value Chain and Market
Assessment of Coastal and Marine Aquatic Products of Bangladesh, downloaded from
http://www.bfrf.org/galda-marketing.pdf
Sharp Results. 2006. Assessing Environmental Management Options to Achieve Sustainability in the
Shrimp-Mangrove System in the Indian Coastal Zone of Bay of Bengal. Shastri Applied Research.
Skjelvik, J.M. 2012. Environmental health in the Sundarbans area of Bangladesh: The case of household
water supply, sanitation and hygiene. Working paper. World Bank, Washington, DC.
Stocker, T.F. ed., 2014. Climate change 2013: the physical science basis: Working Group I contribution
to the Fifth assessment report of the Intergovernmental Panel on Climate Change. Cambridge
University Press.
Tol, R.S., 2005. The marginal damage costs of carbon dioxide emissions: an assessment of the
uncertainties. Energy policy, 33(16), pp.2064-2074.
Uddin Miah , M. 2010. Assessing Long-term Impacts of Vulnerabilities on Crop Production Due to
Climate Change in the Coastal Areas of Bangladesh. Bangladesh Center for Advanced Studies. National
Food Policy Capacity Strengthening Programme.
Umamaheswari, K., Hattab, O., Nasurudeen, P., and Selvaraj, P. 2009. Should Shrimp Farmers Pay
Paddy Farmers. SANDEE Working Paper No. 41-09.
USAID. 2010. Integrated Protected Area Management (IPAC), Volume 1: Main report, A study of the
principal marketed value chains derived from the Sundarban Reserved Forest, prepared by
International Research Group, January 2010, downloaded from
http://www.preventionweb.net/files/18616_18616nabiulislamsrfreportvolume1fin.pdf
Veiling, J.K., van Gelder, P.H.A.J.M. and Ouwerkerk, S.J., 2005. Criteria for acceptable risk in the
Netherlands. Infrastructure risk management processes: natural, accidental and deliberate hazards.
In ASCE.
Watkiss P, Hunt A., Blyth W., & J. Dyszynski 2014. The Use of New Economic Decision Support Tools for
Adaptation Assessment: A Review of Methods and Applications, Towards Guidance on Applicability.
Climatic Change 132:401–416. DOI 10.1007/s10584-014-1250-9
Weitzman, M.L., 2009. Income, wealth, and the maximum principle. Harvard University Press.
Weitzman, M.L., 2011. Fat-tailed uncertainty in the economics of catastrophic climate change. Review
of Environmental Economics and Policy, 5(2), pp.275-292.
World Bank. 2005. Management of Capture Fisheries in Bangladesh. World Bank, Washington, DC
World Bank. 2009. Background Paper for the Sundarbans in Bangladesh. The World Bank. Draft Paper,
Washington, DC

68
World Bank. 2010. Economics of Adaptation to Climate Change. Bangladesh. The World Bank,
Washington, DC
World Bank. 2010a. Economics of Adaptation to Climate Change. The World Bank, Washington, DC
World Bank. 2011. Inception report of Bangladesh Climate Change Adaptation, Biodiversity
Conservation and Socio-Economic Sustainable Development of the Sundarban Area: non-lending
technical assistance, November 3, 2011, Washington, DC.
World Bank. 2014. Building Resilience for Sustainable Development of the Sundarbans: Strategy
Report. Washington, DC
World Development Indicators (WDI). 2016. World Bank.


© Copenhagen Consensus Center 2016
Bangladesh, like most nations, faces a large number of challenges. What should be the top priorities for policy makers, international donors, NGOs and businesses? With limited resources and time, it is crucial that focus is informed by what will do the most good for each taka spent. The Bangladesh Priorities project, a collaboration between Copenhagen Consensus and BRAC, works with stakeholders across Bangladesh to find, analyze, rank and disseminate the best solutions for the country. We engage Bangladeshis from all parts of society, through readers of newspapers, along with NGOs, decision makers, sector experts and businesses to propose the best solutions. We have commissioned some of the best economists from Bangladesh and the world to calculate the social, environmental and economic costs and benefits of these proposals. This research will help set priorities for the country through a nationwide conversation about what the smart - and not-so-smart - solutions are for Bangladesh's future.
For more information vis it w ww .Bangladesh -Prior it ies.com
C O P E N H A G E N C O N S E N S U S C E N T E R Copenhagen Consensus Center is a think tank that investigates and publishes the best policies and investment opportunities based on social good (measured in dollars, but also incorporating e.g. welfare, health and environmental protection) for every dollar spent. The Copenhagen Consensus was conceived to address a fundamental, but overlooked topic in international development: In a world with limited budgets and attention spans, we need to find effective ways to do the most good for the most people. The Copenhagen Consensus works with 300+ of the world's top economists including 7 Nobel Laureates to prioritize solutions to the world's biggest problems, on the basis of data and cost-benefit analysis.