cost-benefit analysis of participatory irrigation …
TRANSCRIPT

COST-BENEFIT ANALYSISOF
PARTICIPATORY IRRIGATION MANAGEMENTA Case Study of Dharoi Irrigation Project, Gujarat
Development Support CentreNear Government Tube Well, Bopal, Ahmedabad- 380058
Tel: +91-2717- 235994/ 235995/ 235998Fax: +91-2717- 235997. Email: [email protected]
Web page: www.dscindia.org
Research Report
(PIM)
Garima Srivastava
Preface by
Shri Anil C Shah
March, 2007

Content
Preface…………………………………………………………………………………........ iExecutive summary…………………………………………………………………............vList of Tables…………………………………………………………………………........viiiList of Annexure……………………………………………………………………….......viii
Chapter 1: IntroductionBackground……………………………………………………………................................1Rationale of the study…………………………………………………................................1Objectives………………………………………………………………...............................2Hypothesis………………………………………………………………..............................2Methodology……………………………………………………………...............................2Variables and Calculations……………………………………………...............................4
Chapter: 2 Analysis and FindingsBenefits…………………………………………………………………...............................5Cropping pattern………………………………………………………................................5Increase in irrigated area………………………………………………..............................6Increase in canal water availability……………………………………...............................7Water Expense…………………………………………………………………...................7Crop productivity………………………………………………………................................8Employment generation………………………………………………..............................10Employment status for landless labour……………………………..................................11Milk Production………………………………………………………................................11Impact on ground water……………………………………………….............................. 12Benefit due to time saved in watering………………………………...............................13Benefit of conflict resolution…………………………………………............................... 13
Chapter 3: Benefit Cost RatioBenefit Cost Ratio……………………………………………………...............................14DSC total Area………………………………………………………................................20
Chapter 4 : Conclusion………………………………………………………......22
Annexure……………………………………………………………………………...........23

Preface
Participatory Irrigation Management (PIM) Can Work Viably And More1
Anil C Shah2
This is a small but a uniquely significant research that looks into issue of financial viability of an irrigationsystem transferred to management of a Farmers’ Organization. Since canal irrigation is in the public domain,the investment decisions are taken by the Government, which has to show that the benefits to society are morethan the cost the Government would incur. To get such projects approved the projected costs are minimizedand the expected benefits are exaggerated. The interesting part is what happens to these assumptions. Whenthe project is completed, benefits are not looked into again. If this is the condition when construction is undertakenfor hundreds of small and large surface irrigation projects, there would be the least concern about investmentbeing made in promoting Participatory Irrigation Management where the cost is incurred not only by GovernmentIrrigation Department but also by Farmers’ Organizations and if there is a facilitating agency whetherGovernmental or NGO their costs are not even properly recorded.
So far as cost incurred by the farmer leaders (office-bearers of Farmers’ Organizations) when they devote theirtime to the affairs of organization such as visiting the site on the canal where rehabilitation work is going on orwhere there might be some dispute between farmers, attending meetings of the Executive Committee, meetingvisiting officers, auditors etc.; such time need not be taken as cost because outsiders assume that villagers haveplenty of idle time and therefore devoting sometime for their own benefit of managing their programme neednot be counted as cost! I have examined this separately in another study on cost benefit of Joint ForestManagement3 and it was found that of the total cost incurred on protecting the forest by the community on anaverage constitutes about 51.5% of the total average cost of time incurred by the office bearers of the forestprotection committee and the volunteers who protected the forest. It is time therefore that “time contribution “by villagers is not considered without opportunity cost and therefore free. Villagers have plenty of productivework to do on their farm and in the village and they even have right to take time off for leisure after arduouswork during busy seasons of high agriculture activity.
Encouraging findings of an exploratory study
Development Support Center has always been curious about the cost and investment of any developmentactivity. It has therefore also undertaken the cost benefit study of watershed programme4 also. In case of PIM,DSC first undertook an exploratory study conducted in 20045 , which was to give an overall picture of costbenefit of PIM. Even though based largely on participatory rural appraisal (PRA) technique, it gave a fairlygood idea that benefits are much more than the costs incurred. The benefit cost ratio was almost 7. When thefindings of sample villages in the small study were extrapolated to the whole project of 56800 ha. DSC made anestimate that when all the planned investment was made over 10 years, it would amount to Rs18 crores by 2008and benefit from 10th year onwards would be Rs 44 crores per year. Very impressive indeed!
1 Preface for a study “CBA of PIM” by Research Unit of DSC - Feb 20072 Chairman (Emeritus), Development Support Centre3 Preface by Anil C Shah for DSC Research Study on Joint Forest Management, Minimising Costs Maximising Benfits,20024 Refer to Research Paper on Cost Benefit of Watershed Development: An exploratory study in Gujarat, conducted by VaibhavChaturvedi, March 20055 The pilot study was conducted by Vaibhav Chaturvedi in year 2004
i

However we thought let us look more closely at the cost benefit by supplementing PRA technique with traditionalquestionnaire methodology also. Three villages selected had been practicing PRA for more than five years andenough data was available, as was the cooperation of the villagers for sharing their experience and information.Detailed Study brought out more impressive and widespread benefits against costs.
The costs were grouped under three heads:
i) Rehabilitation cost (90% contributed by Irrigation Department)ii) Administration cost of the facilitating agency (Development Support Center in this study)iii) Administration cost of managing the Irrigation Cooperative.
The benefits were also grouped under three heads:
i) Due to increase in crop productivityii) Due to income from additional employmentiii) Income due to increase in milk production
Based on the figures of investment made on the three irrigation cooperatives studied, the overall picture of theinvestment made for the entire PIM project area i.e. 56800 ha. promoted jointly by DSC and State IrrigationDepartment ,by 2008 would be as; 1) Cost of rehabilitation of canal by government would be Rs 12.9 crores.2) Cost allocated by the facilitating agency would be Rs.2.59 crores and 3) Administrative and R&M cost ofmanaging irrigation cooperatives would be Rs.4.33 crores. Thus total cost to be incurred would be Rs.20 croresby 2008; whereas the benefits would be Rs 25 crores over 10-year period. Thus the overall BCR ratio would be1.25. Since after 2008 there would be no expenditure on rehabilitation the overall benefit for the project wouldbe Rs.25 crores per year even considering three out of 10 years as lean years. Average net benefit per yearwould be Rs.18 crores
Depending upon several factors the benefits and costs were different in three villages, the benefit-cost ratios inall three were positive ranging from 1.3 to 4.5. The more elaborate study therefore reiterated the findings of thepreliminary study, rather more forcefully.
The PIM Study brings spread out benefits to farmers as well as employment seekers and livestock families
DSC’s Research has looked into the finer aspects of impact of PIM. For our purpose we may look into theessential parameters that indicate whether the system is working more satisfactorily after PIM than was before.We have looked into selected parameters of:
1) Efficiency of water utilizatio+n:
The area irrigated by the canals increased by 55%, 40% and 30% in three irrigation projects of Rangpur,Kiyadar and Thalota respectively.
2) Saving in cost of water:
The planning of water distribution was more satisfactory and reliable and therefore, farmers did not have to runaround to secure water for their farm. According to their experience, the study showed that on an average reductionin water expenses per hectare was Rs.2026 for Rangpur, Rs.1228 for Kiyadar and Rs.848 for Thalota.
3) Crop Productivity Enhancements:
On account of the assured and timely water availability, the crop yields improved. Keeping in view the areaunder different crops in different villages. There is a large variation in yields and income but the taking average
ii

the findings indicate that after PIM there is increase in yield by 20% to 60%. Depending upon crop, the increasein income was of the range from Rs 6000 to Rs16000 per hectare. On the whole the researcher has concludedthat after PIM the average income per hectare per year has increased by Rs8000.
4) Additional employment generation after PIM:
When water distribution is managed according to PIM regulations there is increase in intensity of cultivationand also diversification. Both have contributed to increase in demand for labour. Research finding indicatesthat on an average there is an increase in wage income of Rs.250 per year per hectare.
5) Impact on livestock population and milk production:
With better availability of water and increased production of fodder, the increase in milk yield is 1260 litres peranimal per year and in terms of money, Rs11340 per animal per year. Taking the entire command area of thethree irrigation systems, the increase in income from livestock is estimated at Rs482 lakhs per year.
Do not rush to conclude that introduction of PIM will necessarily benefit all stakeholders in the command area
Benefit of PIM will spread to all sections of rural society dependent upon irrigation in terms of increase inyield and income, increase in wage employment and also increase in income derived from livestock. This willbe a false and misleading conclusion. The comparatively more satisfactorily working of PIM in the northGujarat projects of Dharoi, Guhai and Mazam areas due to very a large effort that has gone into making asuccess of each component. The Irrigation Department committed itself to provide adequate funds and technicalinputs for rehabilitation of the canal, while transferring them to farmers’ organizations for management;Development Support Centre, which has long experience, understanding and a competent team to provide softwaresupport for the formation of irrigation cooperatives and equipping them for their new role, may not be availablewherever PIM is promoted. The farmer leaders who constituted executive committees of irrigation cooperativeswere very responsive and cooperative to various requirements that would make PIM a success. It is a matter ofspeculation if the leadership in these projects was exceptional or whether the facilitating agency, DevelopmentSupport Centre, was able to bring out the best elements essential for successfully running of PIM organization.
Lessons of the study that can be applied to areas where PIM is to be introduced:
From the experience of introducing PIM in north Gujarat irrigation projects of Dharoi, Guhai and Mazam, withfairly positive results in terms of financial viability and other essential parameters of sound institutionalfunctioning; Prof Kirit Parikh, Member, Planning Commission compared the model developing of PIM inDharoi etc with the white revolution that Gujarat gifted to the nation through the Amul model naming it a bluerevolution. Based on their experiences, the two packages were developed by State Irrigation Department andDSC, which are now known all over the country as Gujarat model of PIM packages. These are known as;1) Package of incentives for the farmers and 2) Package of software support by facilitating agency
iii

1
CHAPTER 1 INTRODUCTION
Background
Cost-Benefit Analysis (CBA) is one of the tools used by policy makers for decision-making about alternativeopportunity for investment. It is a widely practiced technique for testing the financial viability of any projecti.e. whether the investment to be made is worth; whether the project is financially rewarding. Costs can bedescribed as the intended or unintended negative effects of project investment. Benefits can be describedthen as the intended or unintended positive effects of a project.
The key principle is that the impact on each affected person, experienced over a period of time, is identified(gain or loss), quantified, valued and aggregated. A CBA consists of four steps:
1. Identification of costs and benefits2. Quantification of costs and benefits3. Valuation of costs and benefits4. Aggregation and comparison of costs and benefits
Irrigation increases crop production by increasing crop yield, cropping intensity and making possible cultivationof high value and remunerative crops. This was the objective with which the irrigation system was started.However, mere provision or irrigation facility to the land does not ensure enhanced agricultural production.The productivity impact of irrigation is critically dependent on the way water is applied and utilised. Thequality of irrigation service in terms of adequacy, timeliness, equity, dependability, predictability andconvenience in its supply remarkably determine the yield from irrigation. For obtaining optimum yield, watershould be provided in time and in adequate quantity according to the water requirement of the crops at theirvarious growth stages. Irrespective of the location and size of the farm, water should be allocated equitablyamong the head enders and tail enders and also large farmers and small farmers. For planning the croppingpattern, farmers need to know in advance the timing and quantity of water supply. This was not happeningsatisfactorily when managed by irrigation bureaucracy. As a consequence, the ‘National Water Policy ofIndia adopted in 1987 and again in year 2002 clearly envisages that ‘Farmers should be involved progressivelyin various aspects of management of irrigation system, particularly in water distribution and collection ofwater rates’. Of late, most of the state governments in India have taken a policy decision to introduceParticipatory Irrigation Management (PIM) and turning over the management of tertiary segment of the canalslike minor/sub-minors/ distributaries to Water Users’ Associations (WUAs). It is envisaged that WUAs willbe entrusted with the responsibilities of operation and maintenance of the tertiary units, distribution of wateramong water users and collection of water rates.
Rationale of the study
A number of Irrigation Cooperatives (ICs) have been promoted in Gujarat in the backdrop of the ParticipatoryIrrigation Management (PIM) policy laid down by the Government of Gujarat (GoG) in 1995. The benefits ofthese institutions are known. Many researchers have studied the benefits of the PIM efforts, e.g. increase inarea irrigated, increase in the agriculture production, less number of conflicts, better service delivery,improvement in maintenance of irrigation system, etc. but most of the studies have not compared thebenefits in money terms with the investment over a periods of time. Comparison of benefits with costs cangive a reliable idea about the relative importance of the investments in the PIM programme.
2
Objectives
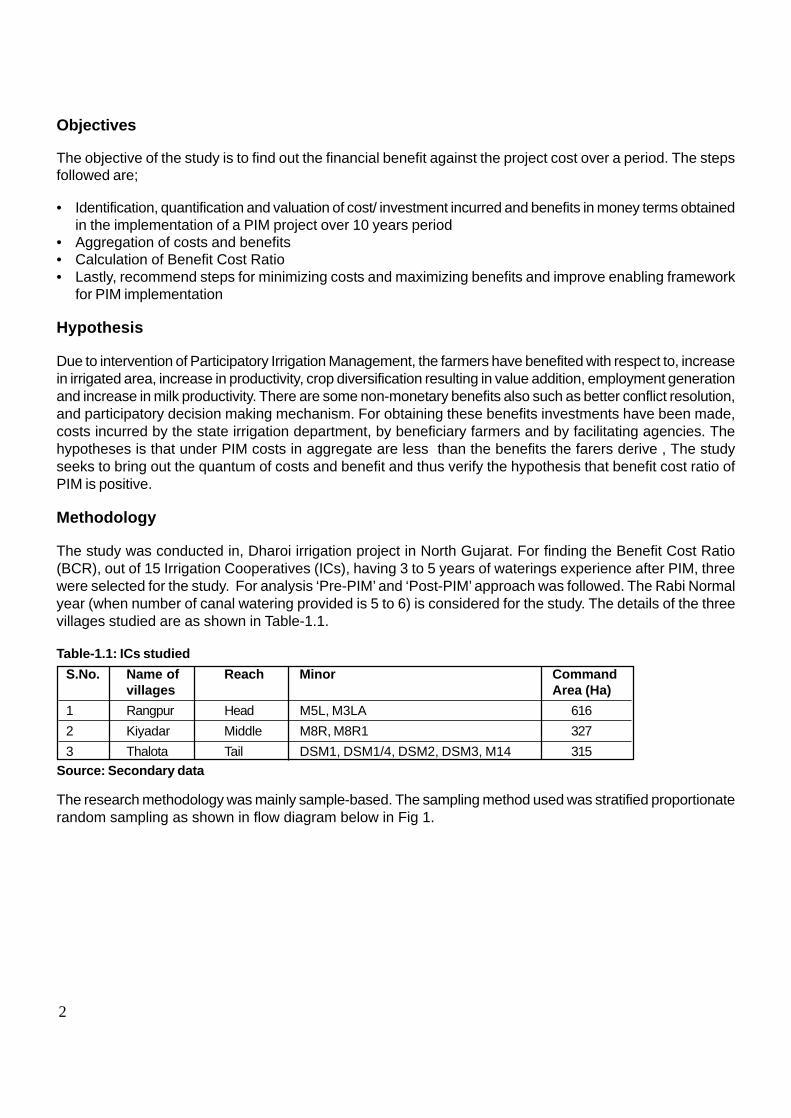
The objective of the study is to find out the financial benefit against the project cost over a period. The stepsfollowed are;
• Identification, quantification and valuation of cost/ investment incurred and benefits in money terms obtainedin the implementation of a PIM project over 10 years period
• Aggregation of costs and benefits• Calculation of Benefit Cost Ratio• Lastly, recommend steps for minimizing costs and maximizing benefits and improve enabling framework
for PIM implementation
Hypothesis
Due to intervention of Participatory Irrigation Management, the farmers have benefited with respect to, increasein irrigated area, increase in productivity, crop diversification resulting in value addition, employment generationand increase in milk productivity. There are some non-monetary benefits also such as better conflict resolution,and participatory decision making mechanism. For obtaining these benefits investments have been made,costs incurred by the state irrigation department, by beneficiary farmers and by facilitating agencies. Thehypotheses is that under PIM costs in aggregate are less than the benefits the farers derive , The studyseeks to bring out the quantum of costs and benefit and thus verify the hypothesis that benefit cost ratio ofPIM is positive.
Methodology
The study was conducted in, Dharoi irrigation project in North Gujarat. For finding the Benefit Cost Ratio(BCR), out of 15 Irrigation Cooperatives (ICs), having 3 to 5 years of waterings experience after PIM, threewere selected for the study. For analysis ‘Pre-PIM’ and ‘Post-PIM’ approach was followed. The Rabi Normalyear (when number of canal watering provided is 5 to 6) is considered for the study. The details of the threevillages studied are as shown in Table-1.1.
The research methodology was mainly sample-based. The sampling method used was stratified proportionaterandom sampling as shown in flow diagram below in Fig 1.
Source: Secondary data
S.No. Name of Reach Minor Commandvillages Area (Ha)
1 Rangpur Head M5L, M3LA 616
2 Kiyadar Middle M8R, M8R1 327
3 Thalota Tail DSM1, DSM1/4, DSM2, DSM3, M14 315
Table-1.1: ICs studied

3
SPRS
Big Small Marginal
Big Small Marginal
Big Small Marginal
HEAD TAIL MIDDLE
Fig: Flow diagram of sampling
The first stratum or layer of sample is the location of IC on irrigation system i.e. head, middle and tail reachof the system. One IC each, from three reaches, was selected. The second stratum is the location offarmers on the minor i.e. head, middle and tail reach of ICs’ minor. The third stratum is the size of thelandholding. Depending on the size of the land 10% farmers are picked from big1 , small and marginal landsize from each three locations on the minor.
Reach Rangpur (258*) Kiyadar (110*) Thalota (260*)
Big Small Marginal Big Small Marginal Big Small Marginal
Head 2 3 2 1 1 2 2 3 4
Middle 2 4 5 1 3 3 2 3 4
Tail 2 3 4 2 2 2 2 4 5
Total 6 10 11 4 6 7 6 10 13
% of sample 11 15 11
Table 1.2: Sampling detail
*- Number of members
Table-1.2 shows the detail of the members in the IC, interviewed. The total percentage of sample rangedfrom 11% - 15 %. Two landless farmers from each of the three IC were also interviewed. The team thatconducted the data collection consisted of two persons, one researcher and another investigator.
The technique used for collecting primary information was through a questionnaire and Participatory RuralAppraisal (PRA).
2 Big- land size greater than 2.5 haSmall – land size less than 2.5 ha and greater than 1 haMarginal – land size less than 1 ha

4
Variables and Calculations:
Benefits
• Increase in irrigated area (Head, Middle and Tail).• Adequate water supply as per their cropping pattern• Timely availability of water.• Equity (small and marginal farmers)• Decrease in water expense• Increase in crop productivity• Increase in milk production• Increase in employment in mandays (agricultural labours)• Ground water recharge.• Crop diversification• Occupation diversification (Animal Husbandry)
Cost factor
Cost factors included
Irrigation Cooperative cost
• Cost of administration, operation, maintenance and water charges collection by Irrigation Cooperatives• Rehabilitation cost shared by Irrigation Dept (90%) and IC (10%).
Organization cost of facilitating agency (DSC)
1) Field office- Salary, travel2) Central office- Salary, travel3) Software support- Exposure visits, training materials, street shows, video shows, flyers etc.

5
CHAPTER 2 ANALYSIS AND FINDINGS
Benefits
Benefits can be seen at two levels, primary and secondary. At both levels they can either be quantitative orqualitative. The flow chart below shows them in detail with respect to the ICs studied.
Fig 2: Flow diagram of benefits
Cropping pattern
Tables-2.1, 2.1 and 2.3, show the changes in cropping patterns of Rangpur, Kiyadar and Thalota commandareas respectively. The crops that were mostly taken are wheat, mustard, castor and cotton. The generaltrend that was found before PIM was that farmers went for mustard, which requires less water. Wheatrequires 6 to 7 waterings. Hence those farmers who had an assured water source could only take wheat.After PIM because of assured canal water to more number of farmers, the cropping area of wheat increased.It was found to be remarkable, in case of Rangpur and Thalota, which ranged from 20% - 35%. However,Kiyadar did not show much difference in the cropping pattern. Generally, farmers consume wheat for homeuse and the remaining they sell in the market. They grow mustard and cotton as cash crops. As per thefarmers’ opinion, it would some more years before they can think of crop diversification.
QUANTITATIVE QUALITATIVE QUANTITATIVE QUALITATIVE• Increase
in irrigatedarea.
• Decrease inwater expense
• Increase in milkproduction
• Increase in % oftail endersreceiving water.
• Increase in agriproduction
• EstablishingCommunity BasedOrganisation (CBO)at village level, whichhas built sense ofownership amongthe villagers
• Marginal and smallfarmers’ effective rolesay in decisionmaking process
• Employmentgeneration
• Incomegeneration
• Time saved dueto certainty ofwater availability
• Increase inconfidencelevel of thefarmers.
• Good rapportwith IrrigationDept officials
Table-2.1: Change in cropping pattern in % (Rangpur)
Crop Head Middle Tail Average
Pre Post Pre Post Pre Post Pre Post Diff
Wheat 27.5 +48.5 23 46.5 29 47 30 49.5 19.5
Mustard 27.5 -16.5 34 17.5 23 15.5 28 16.5 -11.5
Castor 5.5 +7 10.5 14.5 7.5 5.5 9.5 9 -0.5
Cotton 17.5 +20 17.5 7.5 29.5 22.5 21.5 16.5 -5
Fodder 18.5 _-9.5 6 5.5 8.5 10 11 8.5 -2.5
Source: Primary data collected
BENEFITS
PRIMARY

6
Increase in irrigated area
Table-2.4 shows an average percentage increase in the land cultivated by a farmer in the Rabi season, Preand post PIM in a normal year. This is the average of all the three ICs taken together. Increase in irrigated areawas found to be least in case of tail reach. It was found from the field survey that there are still areas in the tailreach, mainly in case of Kiyadar; where rehabilitation work is still not done, due to lack of fund, and water doesnot reach farmers there. Hence, other limited ground water sources also could not be recharged. In the headreach, average increase is 25% and in the middle, it is 9%. When discussed with the villagers, it was found thatin case of the head reach there was the problem of water logging, because of which considerable land wasdamaged and could not be irrigated, which after PIM and following repairing could be covered under irrigation.As being in the head reach, there was no water crisis, so the average increase per farmer was good. Besides,other sources like well and tube well also gets recharged when canal water is flowing.
Table-2.3: Change in cropping pattern in % (Thalota)Crop Head Middle Tail Average
Pre Post Pre Post Pre Post Pre Post Diff
Wheat 9 48 26 59 23 54 19 54 35
Mustard 43 14 42 19 19 9 35 14 -21
Cotton 9 6 15 7 15 9 13 7 -6
Castor 22 22 14 7 35 22 24 17 -7
Grass 17 10 3 8 8 6 9 8 -1
Source: Primary data collected
Table-2.2: Change in cropping pattern in % (Kiyadar)Crop Head Middle Tail Average
Pre Post Pre Post Pre Post Pre Post Diff
Wheat 46 49 20 34 35 40 33 45 8
Mustard 12 19 26 16 25 22 27 19 -8
Cotton 2 8 6 22 0 2 6 11 5
Castor 13 18 21 8 24 23 21 16 -5
Fodder 20 9 9 3 9 14 13 9 -4
Source: Primary data collected
Big Small Marginal Average
Pre Post Benefit Pre Post Benefit Pre Post Benefit Pre Post BenefitReach PIM PIM PIM PIM PIM PIM PIM PIM
Head 50 68.5 18.5 65.5 90 24.5 47 79.5 32.5 54 79.25 25
Middle 74.5 78.5 4 69 84.5 15.5 83.5 91.5 8 75.5 84.75 9
Tail 75 75 0 61 68.5 7.5 61 66 5 65.5 69.75 4
Average 66.5 74 7.5 65 81 15.75 63.75 79 15 65 78 12.75
Source: Primary calculation
Table-2.4: Average change in irrigated area per farmer (in %)

7
A landholding-wise on average increase in area irrigated was found to be more in case of small (15.75%)and marginal (15%) farmers than big (7.5%) farmers. Big farmers anyway had the other sources of irrigationbefore PIM. Small and marginal farmers, who mainly faced water crisis earlier and were mostly dependenton rainfed agriculture as in Rabi season tube well exorbitantly expensive water was not affordable, theycould not irrigate their whole area. Hence when canal water was made available to them after PIM there wasnoticeable increase in their irrigated area.
Reach-wise increase in irrigated area was found to be maximum in head (25%) and minimum in tail (4%).This head reach increase is mainly as they get assured canal water and the canal rehabilitation also mainlytakes from head to reach. Some part of tail end still do not get water because of broken canal or water notflowing till the end.
Increase in canal water availability
Table-2.5 show the percentage of ground and canal water source used for irrigation pre and post PIM. It wasfound from the farmers’ discussion that canal water availability was not more than 30%, 10% and 30% of thedesigned command area of Rangpur, Kiyadar and Thalota respectively before PIM; which increased to85%, 50% and 60% in after PIM. Irrigation through ground water source was found to be 50%, 70% and60%, of total water used for irrigation in Rangpur, Kiyadar and Thalota respectively before PIM; which wasreduced to 5%, 30% and 40% after PIM. Thus, once the canal water was made available to more and morefarmers their dependency on ground water was reduced. Farmers were of the opinion that if water distributionhad continued as before they would have faced severe water crisis, as the remaining wells/tube wells wouldalso have become defunct and canal water distribution status would have remained the same patheticsituation. Now, because of canal water availability, ground water also gets recharged apart from farmersshifting to canal water. The uncultivated land was also reduced by 10% to 15%.
Water Expense
As seen from the Table-2.5, increase in canal irrigation area was 55%, 30% and 40% in Rangpur, Thalotaand Kiyadar respectively. On account of canal water, farmers saved considerable amount of water expense,which is shown in Table-2.7. It shows the average expenditure of water incurred before and after PIM for thewhole command area depending upon the areas of each IC irrigated from various other, sources as per thefigures shown in Table-2.6.
Table-2.5: Change in irrigation through different source (in %)
Irrigation Only Only bore Well Canal UncultivatedCooperative well well +borewell
Pre Post Pre Post Pre Post Pre Post Pre Post
Rangpur 0 0 50 10 0 0 30 85 20 5
Kiyadar 0 0 0 0 70 40 10 50 20 10
Thalota 0 0 10 5 50 35 30 60 10 0
Source: Group discussion

8
From the table above it can be that gradually the shift is there from ground source to canal source. Actuallyfarmers prefer canal water, as it is cost effective. They go for tube well water only in special case.6 Thisdecrease in ground water dependency would also result in rise in water table. Rangpur shows the maximumbenefit that is mainly because canal coverage is 100% and usage of ground water has also decreasedconsiderably. In case of Thalota coverage is 100%, but percentage of ground water usage is comparativelymore than Rangpur. Kiyadar shows the least benefit as here canal water coverage has reached 60% and isin progress; hence ground water dependency is slightly higher.
Crop productivity
As informed by the farmers, crop productivity has increased due to the timely water availability, increase innumber of watering and additional area under irrigation after PIM. Table-2.8 shows the net income per cropper hectare. As discussed with the farmers they opined that 50% to 75% increase in crop yield is due to PIM.
As discussed with the group of farmers, the cost of water per hectare from individual sources of well borewell and canal came o be Rs 4000, Rs 6000 and Rs 680 respectively. On average reduction in waterexpense per hectare were Rs 2026, Rs 1228 and Rs 846 in case of Rangpur, Kiyadar and Thalota respectively.
3 50 (percentage of bore well for Rangpur pre PIM from Table-2.5) X 616 (command area of Rangpur IC) ÷ 100. Accordingly area and percentagewill change as per three ICs4 Rangpur area (from Table 2.6) X 6000. Similarly other cells are calculated.5 (-) sign shows the decrease in water expense per hectare6 some farmers prefer last water for wheat to be from ground water as it is warm and gives more productivity as per their perception.
Table-2.6: Average area irrigated through various sources of water (in ha)
Source: Calculated
Irrigation Only Well Only Bore well Well +borewell Canal Uncultivated
Coop. Pre Post Pre Post Pre Post Pre Post Pre Post
Rangpur 0 0 3083 61.6 0 0 184.8 523.6 123.2 30.8(616)
Kiyadar 0 0 0 0 220.5 126 31.5 157.5 63 31.5(315)
Thalota 0 0 32.7 16.35 163.5 114.45 98.1 196.2 32.7 0(327)
Table 2.7: Average water expense/ ha (in Rs)
Irrigation 1.Well 2.Bore well 3.Well 4.Canal (@ Total Diff/haCoop. (@Rs4000/ (@Rs +borewell Rs 680/ha)
ha) 6000/ha) (@ Rs 5000/ha)
1.aPr 1.bP 2.a Pre 2.b 3.a 3.b 4.a 4.b 5.aPre 5bPost Diffe ost Post Pre Post Pre Post (1a+2a+3a (1b+2b+3b (5b-5b)
+4a) +4b)Rangpur 0 0 18480004 369600 0 0 125664 356048 193664 725648 -1248016 (-)5
(616) 2026
Kiyadar 0 0 0 0 1102500 630000 21420 107100 1123920 737100 -386820 (-)1228(315)
Thalota 0 0 196200 98100 817500 572250 66708 133416 1080408 803766 -276642 (-) 846(327)
Source: calculated

9
7 Calculation shown in annexure
Crop Production Col 3. Col 4. Col 6. Gross Income Cost of Net income =(kg)/ha % Increase Market (Rs/ha) cultivation Gross income-
[(Col2- Price (Rs/ha)7 cost of cultivation
Col 1. Col 2. /Col1) Col1] (Rs/Kg) Pre (Col 1 Pre (Col 2 Pre Post Pre PostPre Post X 100 X Col 4) X Col 4)
Wheat 2000 3200 60 7.5 15000 24000 11812 7847 3188 16153
Mustard 900 1200 33 15.5 13950 18600 5562 3822 8388 14778
Cotton 1100 1350 23 25 27500 33750 12668 10668 14832 23082
Castor 1525 1800 18 15 22875 27000 7862 5284 15013 21716
Grass 1800 2400 33 5 9000 12000 8662 6142 338 5858
Table-2.8: Average crop yield (Kg/ha)
On account of assured and timely water availability, the crop yield has improved. The net income per hectare,for each IC, was calculated from their cropping pattern. Table-2.9 shows the average percentage of croptaken by the farmers. Weighted mean of the cropping pattern is calculated in Table-2.10. Thus, net incomeas per the cropping pattern before and after PIM is shown in Table-2.11. On an average, it comes out to beRs 8500/ha.
Source: Calculated
Source: calculated
Crop Rangpur Kiyadar Thalota
Pre Post Pre Post Pre Post
Wheat 26 49.5 33 45 19 54
Mustard 31 16.5 27 19 35 14
Castor 9.5 9 6 11 13 7
Cotton 22.5 16.5 21 16 24 17
Fodder 11 8.5 13 9 9 8
Table 2.9: Average cropping pattern (in %)
Crop Rangpur Kiyadar Thalota
Pre Post Diff Pre Post Diff Pre Post Diff
Wheat 0.26 0.495 0.235 0.33 0.45 0.12 0.19 0.54 0.35
Mustard 0.31 0.165 -0.145 0.27 0.19 -0.08 0.35 0.14 -0.21
Castor 0.095 0.09 -0.005 0.06 0.11 0.05 0.13 0.07 -0.06
Cotton 0.225 0.165 -0.06 0.21 0.16 -0.05 0.24 0.17 -0.07
Fodder 0.11 0.085 -0.025 0.13 0.09 -0.04 0.09 0.08 -0.01
Table 2.10: weighted mean of percentages of cropping pattern
10
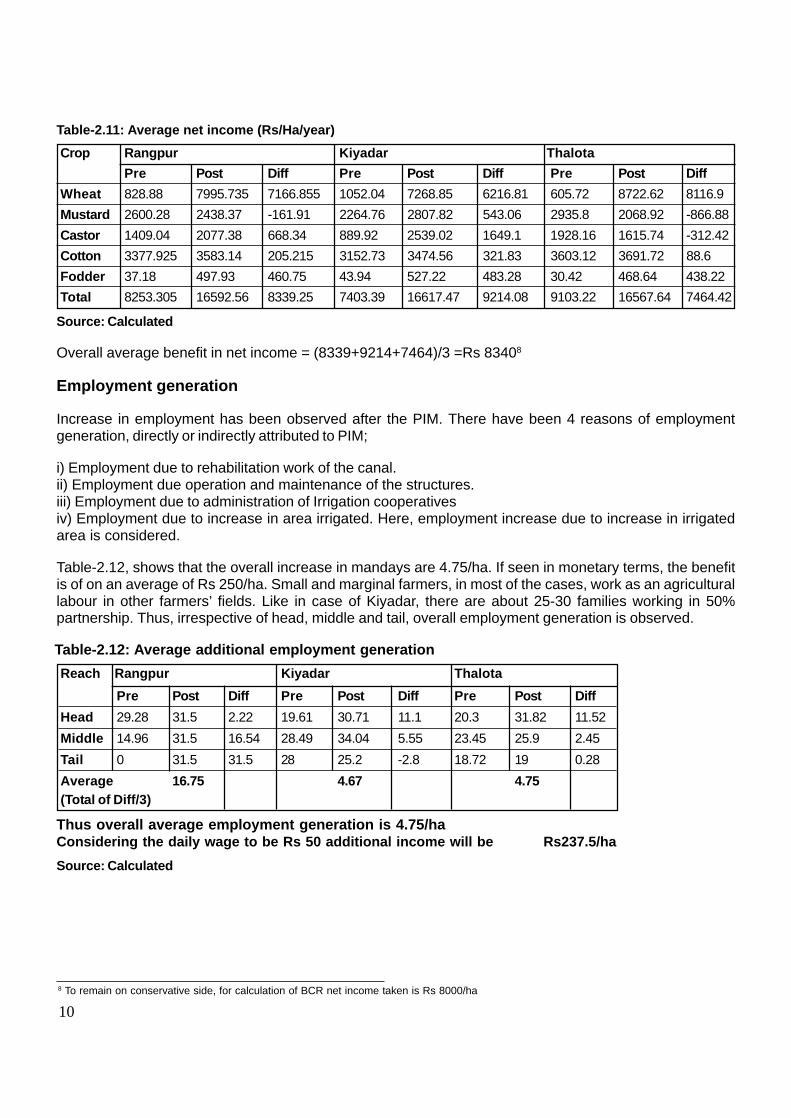
Thus overall average employment generation is 4.75/haConsidering the daily wage to be Rs 50 additional income will be Rs237.5/ha
Source: Calculated
Source: Calculated
Overall average benefit in net income = (8339+9214+7464)/3 =Rs 83408
Employment generation
Increase in employment has been observed after the PIM. There have been 4 reasons of employmentgeneration, directly or indirectly attributed to PIM;
i) Employment due to rehabilitation work of the canal.ii) Employment due operation and maintenance of the structures.iii) Employment due to administration of Irrigation cooperativesiv) Employment due to increase in area irrigated. Here, employment increase due to increase in irrigatedarea is considered.
Table-2.12, shows that the overall increase in mandays are 4.75/ha. If seen in monetary terms, the benefitis of on an average of Rs 250/ha. Small and marginal farmers, in most of the cases, work as an agriculturallabour in other farmers’ fields. Like in case of Kiyadar, there are about 25-30 families working in 50%partnership. Thus, irrespective of head, middle and tail, overall employment generation is observed.
8 To remain on conservative side, for calculation of BCR net income taken is Rs 8000/ha
Reach Rangpur Kiyadar Thalota
Pre Post Diff Pre Post Diff Pre Post Diff
Head 29.28 31.5 2.22 19.61 30.71 11.1 20.3 31.82 11.52
Middle 14.96 31.5 16.54 28.49 34.04 5.55 23.45 25.9 2.45
Tail 0 31.5 31.5 28 25.2 -2.8 18.72 19 0.28
Average 16.75 4.67 4.75(Total of Diff/3)
Table-2.12: Average additional employment generation
Crop Rangpur Kiyadar Thalota
Pre Post Diff Pre Post Diff Pre Post Diff
Wheat 828.88 7995.735 7166.855 1052.04 7268.85 6216.81 605.72 8722.62 8116.9
Mustard 2600.28 2438.37 -161.91 2264.76 2807.82 543.06 2935.8 2068.92 -866.88
Castor 1409.04 2077.38 668.34 889.92 2539.02 1649.1 1928.16 1615.74 -312.42
Cotton 3377.925 3583.14 205.215 3152.73 3474.56 321.83 3603.12 3691.72 88.6
Fodder 37.18 497.93 460.75 43.94 527.22 483.28 30.42 468.64 438.22
Total 8253.305 16592.56 8339.25 7403.39 16617.47 9214.08 9103.22 16567.64 7464.42
Table-2.11: Average net income (Rs/Ha/year)

11
Employment status for landless labour
Table-2.13 shows the additional mandays/ labour generated for landless in all the three ICs. Kiyadar showedthe maximum increase in the mandays/labour created in the village. In case of Thalota, some people go toGujarat Industrial Development Corporation estates for work. Still, increase in mandays is observed. This alsosupports the previous finding of increase in mandays due to increase in irrigated area and crop productivity.
Table-2.14 shows the reduction in forced migration9 . In Kiyadar it was encouraging to see that it reducedsubstantially. In case of Thalota, too, also reduction was observed, which shows positive sign in employmentgeneration per labour in the village.
9 Forced migration is when somebody is compelled to leave his or her place and go to some other place to earn livelihood. In villages, generallymeans of livelihood is agriculture, but due to certain circumstances like lack of water, availability farmers are forced to leave their village and moveto city for earning.
Source: Primary data collection from the farmers
Name of the IC Agri(days/labour) Non-Agri(days/labour)
Pre PIM Post PIM Diff Pre PIM Post PIM Diff
Rangpur 0 0 0 0 0 0
Kiyadar 35 13 -22 0 0 0
Thalota 0 0 0 20 18 -2
Source: Primary data collection
Table-2.14: Reduction in net migration
Milk Production
From the Table-2.15, it can be seen that an increase in number of animals was found in all the three ICs.This ranged from 75 to 200 after PIM. It can be said that farmers showed interest in pursuing dairy businessin the normal years when they were assured of water availability.
Table-2.15: Average number of milch animal
Milch Rangpur Kiyadar Thalotaanimal Pre Post Diff Pre Post Diff Pre Post Diff
Cow 350 500 150 331 497 166 9 35 26
Buffalo 400 600 200 944 1021 77 134 314 180
Reach Agri (days/labour) Non-Agri(days/labour)
Pre PIM Post PIM Diff Pre PIM Post PIM Diff
Rangpur 76 84 8 10 10 0
Kiyadar 73 98 25 0 0 0
Thalota 50 55 5 0 42.5 42.5
Table-2.13: Change in employment availability for landless (in the village)

12
As seen from Table-2.16, overall increase in milk production per milch animal was found to be more or lesssame. Hence, increase in milk production per household was observed, which was mainly due to increase innumber of animals per household. Per hectare increase in average milk production was found to be 853 lit/ha/year. Increase in income per hectare was found to be on an average Rs 7677/ha/year as shown in Table-2.17.
Impact on ground water
In all the three villages, there is a well-maintained drinking water supply pipeline and for domestic use tubewell water is available whenever necessary.
The details of other sources in the command areas are given below in Table-2.18. It can be seen that about50% of the wells have become defunct. In the remaining wells, water is available only for half an hour perday, which and that is not suitable for agricultural purpose.
Milch Rangpur Kiyadar Thalota Average
animal Pre Post Pre Post Pre Post Pre Post
Cow 10 15 10 11 9 11 10 12
Buffalo 4 6 7 9 5 7 5 7
Table-2.16: Average milk production (litres/day)/per ranimal?
Reach Big Small Marginal
Pre Post Diff Pre Post Diff Pre Post Diff
Head 898 1065 167 352 405 53 618 706 88
Middle 2725 3462 737 2907 4502 1595 2448 3936 1488
Tail 1444 1787 343 3258 5508 2250 4485 5439 954
Average (Total of Diff/3) 416 1299 843
Average milk production (Lit/year/ha) 853
Therefore overall average additional Income due to increase in milk yield 7677(lit/ha/year) (@Rs 9 /litre)
Source: Primary data collected
Table-2.17: Impact on milk yield (Lit/year/ha)
IC Well Tube Well
Rangpur 55(37 in use) 4 (3 in head 1 in middle)
Kiyadar 40 (20 in use) 3
Thalota 22 (12 in use) 8
Table- 2.18: Details of sources other than canal
In these villages, canal water is available since 1990, but before that, wells were constructed having a depthof 200 to 400 ft, which in the long run have been defunct due to clogging & rusting. Farmers said that thereis an increase in ground water level after the canal water has been used. After PIM this increase is feltwidespread, even in some of the wells located at the tail reach.

13
Benefit due to time saved in watering
From the discussion with farmers it was found that there is saving of, on an average, 3 hours/watering/hectare, due to timely availability of canal water, as compared to water distribution before PIM. Table-2.19shows the days saved per hectare. In case of small and marginal farmers, it is less obvious because ofsmall landholding size. On an average, the days saved are 15 per hectare and in monetary terms, Rs 750/ha considering daily wage to be Rs 50.
Benefit of conflict resolution
It is observed that farmers have become disciplined now, as they have confidence that they will be providedwater in turn. If somebody is caught stealing or misusing water, he is punished and is made to pay a heavypenalty. As in case of Rangpur, in 2004-05, IC collected penalty of about Rs 4000 from four farmers, whichis equivalent to the cost that they would have borne when irrigated by a through tube well. Given below aresome instances of penalty from the three ICs:
Source: Calculated
Instance of penalty in Thalota in 2004 - 05
No such instances have been reported in Thalota in 2004 - 05. The most rampant violation is of not applyingfor water demands before the due date with the advance fee. Many farmers apply after the due date andtherefore, IC charges them at 1.5 times the normal rate, 50% being the penalty. The secretary of the IC wasof the view that over the years farmers have learnt that there are no gains in breaking the rules and therefore,no such cases have been reported.
Table-2.19: Days saved/hectare/year for watering
Location Days saved/ha
Big Small Marginal Total
Head 7 4.38 1.62 13
Middle 15.5 5 2.3 23
Tail 6 1.75 1.63 9.38
45.56
Average days saved/ha (45/3) 15
Table-2.20: Instances of penalty in Rangpur IC in 2004–05
S.No. Name of farmer Penalty Description of incidences
1. Kantibhai (Sarpanch) 1704 Two times irrigation in single rotation
2. Becharbhai Patel and 8 1200 Irrigating without the permission ofother farmers (Rs.150 each) operator
3. Pursottambhai 451 Two times irrigation in single rotation
4. Ishwarbhai Patel 251 Irrigating more land than what he hadindicated in demand form
Source: Secretary of the IC
Table-2.21: Instances of penalty in Kiyadar IC in 2004 – 05S.No. Name of farmer Penalty Description of incidences
1. Ganeshji Lavji Thakor 500 Two times irrigation in single rotation
2. Abheraj Bhemabhai Chaudhary 200 Took irrigation out of turn
3. Thakor Chehraji 300 Had put obstruction in the canalSource: Secretary of the IC
14
CHAPTER 3 BENEFIT COST RATIO
Benefit Cost Ratio
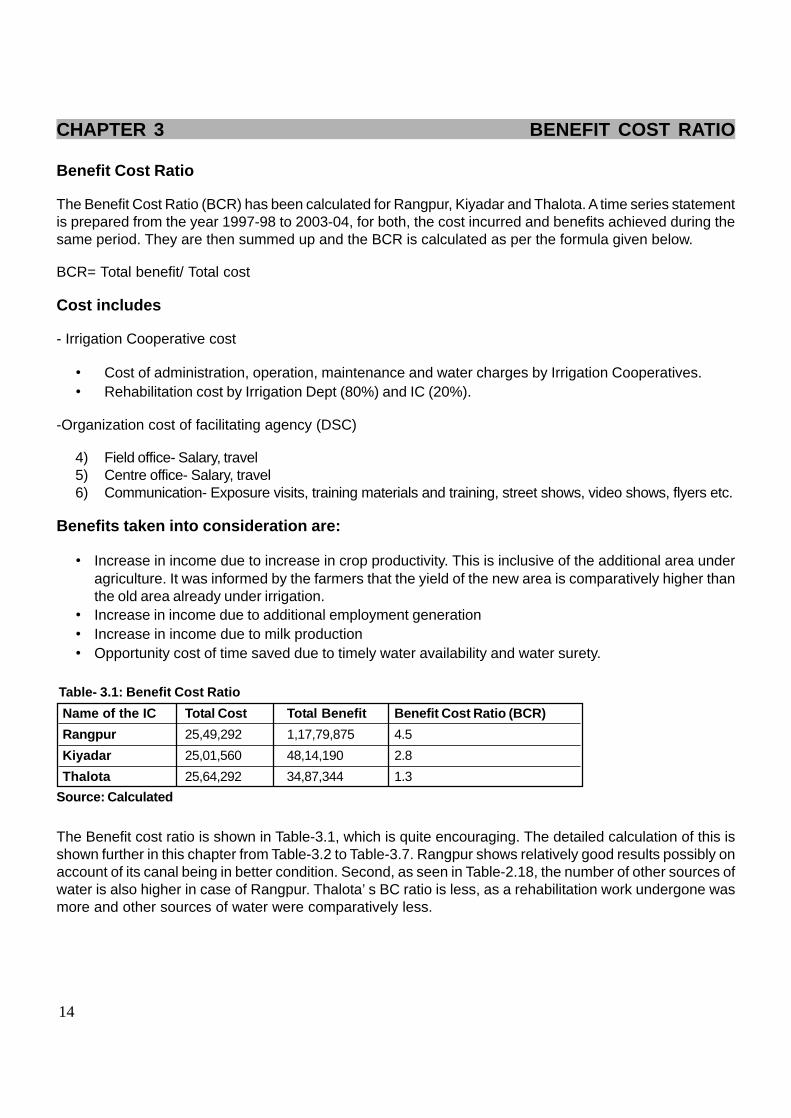
The Benefit Cost Ratio (BCR) has been calculated for Rangpur, Kiyadar and Thalota. A time series statementis prepared from the year 1997-98 to 2003-04, for both, the cost incurred and benefits achieved during thesame period. They are then summed up and the BCR is calculated as per the formula given below.
BCR= Total benefit/ Total cost
Cost includes
- Irrigation Cooperative cost
• Cost of administration, operation, maintenance and water charges by Irrigation Cooperatives.• Rehabilitation cost by Irrigation Dept (80%) and IC (20%).
-Organization cost of facilitating agency (DSC)
4) Field office- Salary, travel5) Centre office- Salary, travel6) Communication- Exposure visits, training materials and training, street shows, video shows, flyers etc.
Benefits taken into consideration are:
• Increase in income due to increase in crop productivity. This is inclusive of the additional area underagriculture. It was informed by the farmers that the yield of the new area is comparatively higher thanthe old area already under irrigation.
• Increase in income due to additional employment generation• Increase in income due to milk production• Opportunity cost of time saved due to timely water availability and water surety.
The Benefit cost ratio is shown in Table-3.1, which is quite encouraging. The detailed calculation of this isshown further in this chapter from Table-3.2 to Table-3.7. Rangpur shows relatively good results possibly onaccount of its canal being in better condition. Second, as seen in Table-2.18, the number of other sources ofwater is also higher in case of Rangpur. Thalota’ s BC ratio is less, as a rehabilitation work undergone wasmore and other sources of water were comparatively less.
Source: Calculated
Table- 3.1: Benefit Cost Ratio
Name of the IC Total Cost Total Benefit Benefit Cost Ratio (BCR)
Rangpur 25,49,292 1,17,79,875 4.5
Kiyadar 25,01,560 48,14,190 2.8
Thalota 25,64,292 34,87,344 1.3

15
S.No. Year
Cost C1 C2 C3 C4 C5 C6 C7
1997- 1998- 1999- 2000- 2001- 2002- 2003-98 99 00 01 02 03 04
R1 Rehabilitation cost 1050000
Administration cost
IC cost
Area Irrigated 138 120 0 0 174 0 110
Water rate (Rs/ha) 420 250 0 0 536 0 680
Govt. water rate (Rs/ha) 130 130 0 0 270 0 357
Water charges paid togovernment (area irrigated X 17940 15600 0 0 46980 0 39270Govt. water rate)
Salary of secretary (Rs6000/year) 3000 6000 3000 6000 6000 3000 3000
Salary of operator (Rs 60 for4 months for 4 operators for 0 28800 0 28800 28800 0 28800a year)
Stationery (Rs 5/month fora year) 60 60 60 60 60 60 60
Vehicle (Rs 200/month for 6months) 1200 1200 1200 1200 1200 1200 1200
Guest exp (Rs 100/monthfor 6 months 600 600 600 600 600 600 600
Canal cleaning (Rs2.5/running mt on average 0 22500 0 22500 22500 0 22500of 9km canal)
R2 Sub total 22800 74760 4860 59160 106140 4860 95430
DSC cost Field
Administration 11952 14442 10956 11952 17864 20944 22176
Travel 8217 8217 8217 8217 20328 20328 20328
Others 31125 31125 31125 31125 77000 77000 77000
R3 Sub total 51294 53784 50298 51294 115192 118272 119504
DSC cost Head office
Salary 39840 39840 39840 39840 98560 98560 98560
Travel 10209 10209 10209 10209 25256 25256 25256
R4 Sub total 50049 50049 50049 50049 123816 123816 123816
R5 TOTAL (R5 = R2+R3+R4) 124143 178593 105207 160503 345148 246948 338750
Total for 7 years (R5 of C1 to C7) 14,99,292
Grand total = Admin cost + Rehab cost (R5 + R1) 25,49,292
Table- 3.2- Cost detail and Calculation in Rs (Rangpur)

16
Thus BCR = 11779875/2549292 = 4.5
YEAR
BENEFIT C1 C2 C3 C4 C5 C6 C71997-98 1998-99 1999-00 2000-01 2001-02 2002-03 2003-04
No. of Watering 5 3 0 0 5 0 2
R1 Area irrigated (inhectares) 301 278 0 0 320 0 227.38
R2 Benefit due toincrease in cropproductivity (@ Rs 2889600 2668800 0 0 3072000 0 21828489600/ha) (R1 X9600)
R3 Income due toadditionalemployment 75250 41700 0 0 80000 0 22738generation (@Rs250/ha) (R1 X250)
R4 Income due toincrease in milkproduction (@Rs 255850 141780 0 0 272000 0 77309.2850/ha) (R1 X 850)
R5 Total Benefit (R5 = 3220700 2852280 0 0 3424000 0 2282895R2 + R3 + R4)
Total benefit for theseven years (in Rs) 11779875
Table- 3.3:Benefit detail and calculation in Rs (Rangpur)

17
Table- 3.4: Cost detail and calculation in Rs (Kiyadar)
Year
C1 C2 C3 C4 C5 C6 C7
S. No. COST 1997-98 1998-99 1999-00 2000-01 2001-02 2002-03 2003-04
R1 Rehabilitation cost 1260000
Administration cost
IC cost
Area Irrigated 0 52 0 0 141 0 160
Water rate (Rs/ha) 420 250 0 0 536 0 680
Govt. water rate (Rs/ha) 130 130 0 0 270 0 357
Water charges paid togovernment (area irrigated XGovt. water rate) 6240 6760 0 0 38070 0 57120
Salary of secretary (Rs6000/year) 3000 6000 3000 6000 6000 3000 3000
Salary of operator (Rs 60for 4 months for 4operators for a year) 0 28800 0 28800 28800 0 28800
Stationery (Rs 5/monthfor a year) 60 60 60 60 60 60 60
Vehicle (Rs 200/month for 6months) 1200 1200 1200 1200 1200 1200 1200
Guest exp (Rs 100/monthfor 6 months 600 600 600 600 600 600 600
Canal cleaning (Rs2.5/running mt onaverage of 9km canal) 0 22500 0 22500 22500 0 22500
R2 Sub total 11100 65920 4860 59160 97230 4860 113280
DSC cost_ Field
Administration 15120 18270 13860 15120 9135 10710 11340
Travel 10395 10395 10395 10395 10395 10395 10395
Others 39375 39375 39375 39375 39375 39375 39375
R3 Sub total 64890 68040 63630 64890 58905 60480 61110
DSC cost_ Head office
Salary 50400 50400 50400 50400 50400 50400 50400
Travel 12915 12915 12915 12915 12915 12915 12915
R4 Sub total 63315 63315 63315 63315 63315 63315 63315
R5 Total Administrationcost(R2+R3+R4) 139305 197275 131805 187365 219450 128655 237705
Total admin cost for 7 years (in Rs) (R5 of C1 to C7) 1241560
Total admin cost +Rehab cost (R5 + R1) 2501560

18
Table-3.5: Benefit detail and calculation in Rs (Kiyadar)
C1 C2 C3 C4 C5 C6 C7
Year 1997-98 1998-99 1999-00 2000-01 2001-02 2002-03 2003-04
No. of Watering 5 3 0 0 5 0 2
R1 Area irrigated(in hectares) 110 160 0 0 140 0 60
Benefits (in Rs)
R2 Benefit due to increasein crop productivity (@ 1031470 1500320 0 0 1312780 0 562620Rs 9377/ha) (R1 X9377)
R3 Benefit from incomedue to additionalemployment generation 27500 24000 0 0 35000 0 6000(@ Rs250/ha)(R1 X 250)
R4 Benefit from incomedue to increase in milk 93500 81600 0 0 119000 0 20400production (@Rs 850/ha) (R1 X 850)
R5 Total Benefit(R5 = R2+R3+R4) 1152470 1605920 0 0 1466780 0 589020
Total Benefit from all the 7 years (sum of col 1 to 7 of R5) 4814190
Thus BCR = 4814190/2501560 = 2.8

19
Year C1 C2 C3 C4 C5 C6 C7
S. No. COST 1997-98 1998-99 1999-00 2000-01 2001-02 2002-03 2003-04
R1 Rehabilitation cost 1065000
IC cost
Area Irrigated 138 120 0 0 174 0 110
Water rate (Rs/ha) 420 250 0 0 536 0 680
Govt. water rate (Rs/ha) 130 130 0 0 270 0 357
Water charges paid togovernment (area irrigated X 17940 15600 0 0 46980 0 39270Govt. water rate)
Salary of secretary(Rs 6000/year) 3000 6000 3000 6000 6000 3000 3000
Salary of operator (Rs 60 for 4months for 4operators for a year) 0 28800 0 28800 28800 0 28800
Stationery (Rs 5/monthfor a year) 60 60 60 60 60 60 60
Vehicle(Rs 200/monthfor 6 months) 1200 1200 1200 1200 1200 1200 1200
Guest exp (Rs 100/monthfor 6 months 600 600 600 600 600 600 600
Canal cleaning (Rs 2.5/runningmt on average of 9km canal) 0 22500 0 22500 22500 0 22500
R2 Sub total 22800 74760 4860 59160 106140 4860 95430
DSC cost_ Field
Administration 11952 14442 10956 11952 17864 20944 22176
Travel 8217 8217 8217 8217 20328 20328 20328
Others 31125 31125 31125 31125 77000 77000 77000
R3 Sub total 2 51294 53784 50298 51294 115192 118272 119504
DSC cost Head_ office
Salary 39840 39840 39840 39840 98560 98560 98560
Travel 10209 10209 10209 10209 25256 25256 25256
R4 Sub total 3 50049 50049 50049 50049 123816 123816 123816
R5 Total Administrationcost (R2+R3+R4) 124143 178593 105207 160503 345148 246948 338750
Therefore total cost throughout the years for 7 years (In Rs) 1499292
Total (admin + rehab cost) (R5 + R1) 2564292
Table- 3.6: -Cost detail and calculation in Rs (Thalota)

20
Year
Benefit 1997-98 1998-99 1999-00 2000-01 2001-02 2002-03 2003-04
No. of Watering 5 3 0 0 5 0 2
R1 Area irrigated (in hectares) 138 120 0 0 174 0 110Benefit (in Rs.)
R2 Benefit due to increase incrop productivity (@ Rs 972624 507456 0 0 1226352 0 3101127048/ha)(R1 X 7048)
R3 Income due to additionalemployment generation (@ 34500 18000 0 0 43500 0 11000Rs250/ha)(R1 X 250)
R4 Income due to increase inmilk production (@Rs 117300 61200 0 0 147900 0 37400850/ha) (R1 X 850)
R5 Total (R5 = R2 + R3 + R4) 1124424 586656 0 0 1417752 0 358512
Total Benefit from all the 7 years (sum of col 1 to 7 of R5) 3487344
Thus BCR = 3487344/2564292 = 1.3
Table- 3.7: Benefit detail and calculation in Rs (Thalota)
DSC total Area
DSC’s total area, including Dharoi, Mazum and Guhai irrigation systems in Gujarat is 56800 hectares. It isproposed that by the end of year 2008, the rehabilitation work and software work would be completed. Thegovernment would be providing 80% of the rehabilitation cost and farmers would contribute 20%. For softwaresupport National Dairy Development Board (NDDB) would be providing 80% and 20% by DSC and othersources. Thus the total cost (Rehabilitation + software cost of DSC + Admin cost of IC) was estimated tobe Rs 20 crores10
10 Rehabilitation =129250000 Software cost = 25850000 IC administration cost = 4333057411 Calculation shown separately
Table-3.8: total estimated cost of DSC area of 56800ha
Year Col-1 % Col-2 Col-3 Total Col-4 Col-5 IC Col-6 Area Col-7of the Area area covered Rehabilitation Software admini- irrigated in No ofarea to in ha (will include expenditure cost_DSC stration ha wate-be 5100ha cost11 (assuming ringcovered already 50% irrigated
rehabil- as per designitated) norms)
2005-06 21 10857 15957 27142500 5428500 7950602 4787.1 3
2006-07 40 20680 25780 51700000 10340000 10340000 0 0
2007-08 39 20163 25263 50407500 10081500 17663060 12631.5 5
2008-09 100 51700 56800 0 0 11709510 17040 3
Total (in Rs) 12,92,50,000 2,58,50,000 4,76,63,172

21
Table-3.9: IC administration cost
Benefits are calculated taking into considerations the three factors;i) Agricultural benefit;ii) benefit due to additional employment generation;iii) benefit due to increase in milk production. Hence, the total benefit after the total DSC’s area of 56800 hais completed is calculated to be Rs 25 crores.
The BCR ratio thus calculated is 1.2612 , considering all the three benefits and 1.113 , considering onlyagricultural benefits.
12 BCR = 250858608/198430574 = 1.2613 BCR = 220535040/198430574 = 1.11
Year Govt. Water IC’s Salary of Salary of Statio- Vehical Guest Canal Totalwater charges contri- Secretary operator nery ( Rs. / Travel exp. cleaningrate paid to bution for ( Rs. (Rs. 60 / 5/month ) ( Rs. 200 (Rs.100/ (Rs. 2(Rs/ha) gover- rehab- 1200 / day for four /month) month) / Rmt
nment ilitation month ) months, on for 8.5(area average 4 kmsirrigated X operators inovt. water normalrate) watering)
2005-06 517.65 2478042 5428500 8640 17280 60 720 360 17000 7950602
2006-07 0 0 10340000 0 0 0 0 0 0 10340000
2007-08 595.2975 7519500 10081500 14400 28800 60 1200 600 17000 17663060
2008-09 684.5921 11665450 0 8640 17280 60 720 360 17000 11709510
TOTAL(in Rs) 43330574
Table-3.10: Benefit out of total DSC area once the project is completed
Year Col1-Due to increase in Col-2 Due to income from Co-3 Income due tocrop productivity (@ Rs additional employment increase in milk production8000/ha/year) (@Rs250/ha/year) (@Rs 850/ha/year)
2005-06 38296800 1196775 4069035
2006-07 0 0 0
2007-08 101052000 3157875 10736775
2008-09 136320000 4260000 14484000
Total (in Rs) 22,05,35,040 68,91,720 2,34,31,848
Grand Total (Col-1 +Col-2 + Col-3) 25,08,58,608

22
Chapter- 4 Conclusion
From the findings it can be seen that PIM ultimately over a period of time, gives positive results.
Most of the time timely water is made available to farmers, due to effective and efficient water distributionsystem by the IC. This has lead to increase in irrigated area and consequently to increase in income perhectare. The irrigation dept. is also benefited, as farmers are now able to pay timely water charges and also100%. The IC in turn gets 50% rebate on water charge collection.
From the favourable benefit-cost ratio of the three ICs studied, it is evident that the investment in PIM hasyielded high returns to the villagers. Thus, investment in promoting PIM can be regarded as a worthwhileinvestment opportunity. The investment agency in this case is the Irrigation Department, as well as a non-government organization with significant contribution from the villagers. The benefits have largely accruedto the farmers as well as agriculture labour (In terms of higher employment opportunities), while somebenefits are also gained by the Irrigation Department (reduced cost and man power requirement). The costhas been largely borne by the implementation agency (DSC) and the government jointly.
This social welfare investment has proved beneficial for the target farming community as well as the labourcommunity and hence, should be taken for large-scale implementation.

23
AN
NE
XU
RE
I Sam
ple
of
calc
ula
tio
n o
f im
pac
t o
n c
rop
pro
du
ctio
n
Pre
PIM
(Hea
d/B
ig)
II S
amp
le o
f w
ater
exp
ense
cal
cula
ted
Pre
PIM
(H
ead
/sm
all)
Pre
PIM
(H
ead
/sm
all)
Cro
pA
rea
So
urc
e o
f w
ater
ing
Exp
end
itu
reTo
tal
Can
alW
ell
Tub
e w
ell
Can
alW
ell
Tub
e w
ell
Cos
t/ha
% Ir
rig
ated
Wei
gh
ted
%M
ean
exp
Wh
eat
4.25
51
151
0075
0076
5020
250
4764
.706
32.6
9231
0.33
1572
.353
Mus
tard
2.5
40
024
000
024
0096
019
.230
770.
1918
2.4
Cot
ton
15
00
1200
00
1200
1200
7.69
2308
0.08
96
Cas
tor
3.5
41
133
6048
0052
5013
410
3831
.429
26.9
2308
0.27
1034
.486
Gra
ss1.
754
21
1680
5250
2625
9555
1820
13.4
6154
0.13
236.
6
1346
815
3601
.154
3601
.154
3121
.839
Cro
pA
rea
So
urc
e o
f w
ater
ing
Exp
end
itu
reTo
tal
Can
alW
ell
Tub
e w
ell
Can
alW
ell
Tub
e w
ell
Cos
t/ha
% Ir
rig
ated
Wei
gh
ted
%M
ean
exp
Wh
eat
5.75
00
60
062
100
6210
010
800
41.0
7143
0.41
4428
Mus
tard
3.75
00
40
027
000
2700
072
0026
.785
710.
2719
44
Cot
ton
00
00
00
00
00
00
Cas
tor
3.25
00
40
019
500
1950
060
0023
.214
290.
2313
80
Gra
ss1.
250
04
00
7500
7500
6000
8.92
8571
0.09
540
1411
6100
8292
.857
8292
.857
8292

24
Overall time saved in terms of ??? mandays andopportunity cost
III Sample of calculation for time saved (Hours)
Head/big
Crop 1. Area 2. Area 3. Weightage 4. No.of 5.Time saved(in hrs) 6. Weighted time(in derived from % watering 3 hrs/hectare saved (in hrs)percentage) area by canal 5=1*4*3hrs 6=5*3
Wheat 5.75 42 0.42 5 86.25 36.225
Mustard 3.25 24 0.24 4 39 9.36
Cotton 3.25 24 0.24 4 39 9.36
Castor 1.5 10 0.1 5 22.5 2.25
Grass 13.75
Therefore time saved/ha as per the cropping pattern 57.195
Note: On discussion with the farmers 3hrs/ha was approximately the time saved on every watering.
Reach Big Small Marginal Total
Head 57 35 13 105
Middle 125 41 18.5 184.5
Tail 48 14 13 75
Total 230 90 44.5 364.5
Location Opportunity cost Rs/hec
Big Small Marginal Total
Head 2850 1750 650 5250
Middle 6250 2050 925 9225
Tail 2400 700 650 3750
Total 11500 4500 2225 18225
Therefore m oney saved/ha due to time saved 18225
Note: Assuming the wage Rs 50/day
IV Sample of employment generation
Post PIM 1. Area (in 2. Man days required 3. Weight-age 4 == 2*3Percentage) for harvesting in 1 Ha (derived from 1)
Wheat 60 30.25 .60 18.15
Mustard 22 17.5 .22 3.85
Castor 10 47.5 .10 4.75
Cotton 5 95 .05 4.75
Fodder 3 0 .03 0
Water
Logged 0 0 0 0
31.50
Note : Fodder is harvested by the family members and usually no labour is hired for such purposeand hence 0 man-days have been used for it.

25
V Sample of the calculation for milk production and fodder
Pre 1. Area (in 2. Man days required for 3. Weight-age 4 == 2*3PIM Percentage) harvesting in 1 Ha (derived from 1)
Wheat 58 30.25 .58 17.54
Mustard 21 17.5 .21 3.67
Castor 9 47.5 .09 4.27
Cotton 4 95 .04 3.8
Fodder 3 0 .03 0
Water Logged 5 0 .05 0
29.28
Note: Wet is the green fodder
Post PIM
Animal No 1.Milk production 2. Wet 3. Dry 4. Cake 5. Prod/lt 6. Wet/unit 7. Dry/unit 8. Cake/unit
Cow 4 8700 7300 21900 5840 2175 1825 5475 1460
Buffalo 7 12060 14600 43800 17520 1722.857 2085.714 6257.143 2502.857
Bullock 6 0 13870 27010 0
Other 3 0 3285 7300 0
Total 20 39055 100010 23360 1948.929 1955.357 5866.071 1981.429
V Sample of calculation for milk and fodder production
Note: Wet is the green fodder
Note: Post PIM per unit consumption of fodder (Wet, dry and cake) has increased and hence the milk productionSimilarly calculation is done for each reach and L/H, and for all three ICs, Rangpur, Kiyadar and Thalota. Then theaverage of all the three is taken out to convert to the monetary benefit.
Post PIM
Animal No 1.Milk production 2. Wet 3. Dry 4. Cake 5. Prod/lt 6. Wet/unit 7. Dry/unit 8. Cake/unit
Cow 3 6000 5475 16425 4015 2000 1825 5475 1338.333
Buffalo 7 11520 12775 38325 7300 1645.714 1825 5475 1042.857
Bullock 6 0 13870 27740 0
Other 2 1981.429 2190 4745 23360
Total 18 34310 87235 34675 1822.857 1825 5475 1190.595

26
Crop Wheat Mustard Castor Cotton Grass
Ploughing 800 800 800 1000 1200
Soving 400 400 500 500 400
Seeds 1200 150 200 1800 750
Inter-culture 0 0 400 600 0
Urea 320 320 320 320 480
DAP 500 250 400 500 0
Bunding 100 80 100 100 90
Pesticides 200 200 100 200 0
Harvesting 500 400 500 600 400
Bundle making 0 0 0 0 50
Threshing 400 400 200 0 0
Carting 100 100 100 150 50
Weeding 300 200 100 100 0
Total 4820 3300 3720 5870 3420
VI Cost of Cultivation of the Rabi crops
Source: Group discussion

ABOUT DSC...
Development Support Centre (DSC) was established in 1994 in Ahmedabad under the leadership ofFounder Chairman, a Retired IAS Officer Mr. Anil C Shah in response to the need felt, from variousnon-governmental organizations. The DSC provides support to NGOs, government agencies andother administrative bodies, which are involved in participatory management of natural resources inGujarat. DSC’s multi-disciplinary professional team helps in capacity building of key functionaries,performs hand holding operations in the field when required, takes initiatives for appropriate policychanges and carries out field studies related to policy issues.
DSC offers the following portfolio of services:
• Field Support Services• Research and Monitoring Activities• Training• Policy Advocacy• Communications and Publications• Networking• Field Units
DSC’s main focus presently is on the following four programs;
Participatory Irrigation ManagementDSC is playing pivotal role in promoting the PIM in Gujarat in close cooperation with the state irrigationdepartment and strives to promote the program at state and national levels. The DSC directlyimplements the program in 66 villages in three projects covering 56,000 hectares of command area.
Watershed DevelopmentDSC has made a significant contribution in the formulation of the National Watershed DevelopmentGuidelines and has sustained its involvement in the program. The emphasis is to ensure that the keyfunctionaries appreciate and build necessary skills, attitudes and behaviour to translate the rhetoricof participation into practice.
Agricultural Productivity Enhancement and Improving LivelihoodsTo enhance agricultural productivity and improve livelihoods, the DSC has promoted Sajjata Sangh, anetwork of NGOs, bringing together agricultural scientists; the NGOs and the farmers on a commonplatform so that the scientists understand the problems and the needs of the farmers, take them intoaccount in their research. The farmers are provided with expert advice in turn.
Joint Forest ManagementGujarat was one of the first states in the country to introduce JFM. However, despite enabling policies andtentative initiatives of the state government, the program has not picked up the desired momentum. TheDSC is striving to remedy the situation by advocating changes in the implementation of the program atstate and national levels.