cost-benefit analysis of redd+ strategy options · cost-benefit analysis of redd+ strategy options...
TRANSCRIPT

Cost-Benefit Analysis of REDD+
Strategy Options
Technical Annex E
Final Report
Consulting Services Contract For the Development of A National REDD+
Strategy for Liberia
November 2016
Technical Annex A – Draft REDD+ Strategy
Technical Annex B – REDD+ Roadmap
Technical Annex C – Forest cover and land use analysis
Technical Annex D – REDD+ Strategy Options
Technical Annex E – Cost-benefit analysis
Technical Annex F – Policy, Legal and Institutional Framework
Technical Annex G – Consultation Report

LTS International Limited
Pentlands Science Park, Bush Loan
Penicuik, EH26 0PL
United Kingdom
Tel. +44 (0)131 440 5500 Fax. +44 (0)131 440 5501 Email.
Web. www.ltsi.co.uk Twitter. @LTS_Int
Registered in Scotland Number 100833
NIRAS A/S
Sortemosevej 19
DK-3450
Allerød, Denmark
This Technical Annex is part of a set of reports produced by LTS & NIRAS as part of
the ‘Consulting Services Contract For the Development of A National REDD+ Strategy
for Liberia’ commissioned by the Forestry Development Authority as part of its
Readiness Preparation Proposal (R-PP) Implementation Grant from the Forest Carbon
Partnership Facility.
The complete set of reports can be found here:
http://www.ltsi.co.uk/projects/liberia-national-redd-strategy-consultation/

Acronyms
BAU Business as usual
CBA Cost benefit analysis
CFMA Community Forest Management Agreement
CO2 Carbon dioxide
ENNR East Nimba Nature Reserve
EU European Union
FDA Forest Development Authority
FMC Forest Management Concession
NGO Non-governmental organization
NPV Net-present value
PA Protected Area
REDD Reduced Emissions for Deforestation and Degradation
RIL Reduced Impact Logging
R-PP Readiness Preparation Proposal
SFM Sustainable Forest Management
USD United States Dollar
VPA Voluntary Partnership Agreement
Content
1. BACKGROUND AND APPROACH ..................................................................................................... 2
2. RESULTS ............................................................................................................................................. 11
2.1 REDD+ OPPORTUNITY COST .................................................................................................................................... 15
2.1.1 Complete and strengthen the Protected Areas network ..................................................................... 15
2.1.2 Sustainable forest management ................................................................................................................. 17
2.1.3 Intensification of agricultural production on non-forest land .......................................................... 21
2.1.4 Development of oil palm plantations ........................................................................................................ 23
2.1.5 Comparison of land use change options .................................................................................................. 26
2.2 IMPLEMENTATION COST ............................................................................................................................................. 28
2.3 POTENTIAL REDD+ BENEFITS ................................................................................................................................... 29
3. CONCLUSIONS .................................................................................................................................. 32
3.1 CONCLUSIONS FROM COST-BENEFIT ANALYSIS ON REDD+ STRATEGY OPTIONS ............................................ 32
3.2 RECOMMENDATIONS FOR REDD+ STRATEGY DEVELOPMENT .............................................................................. 33
ANNEXES .................................................................................................................................................... 35
ANNEX 1: LITERATURE CITED ..................................................................................................................................................... 36
ANNEX 2: ASSUMPTIONS LAND USE MODELS ......................................................................................................................... 38
ANNEX 3: ASSUMPTIONS IMPLEMENTATION COST ................................................................................................................. 49
ANNEX 4: AVERAGE CARBON STOCKS FOR DIFFERENT LAND USE CLASSES .......................................................................... 51
ANNEX 5: LAND USE AND CARBON STOCK CHANGES WITH REDD+ ................................................................................... 52
ANNEX 6: GHG EMISSIONS AND REMOVALS FOR LAND COVER CLASSES FOR BAU AND REDD+ .................................. 53
Cost-Benefit Analysis of REDD+ Strategy Options – Technical Annex E P a g e | 1
List of tables Table 1: Focus of the cost-benefit analysis .................................................................................................... 2
Table 2: Land cover and land use classes use for the assessment ........................................................ 5
Table 3: Deforestation and degradation rates for BAU and REDD+ .................................................... 6
Table 4: Land use change matrix for BAU and REDD+ .............................................................................. 7
Table 5: Land uses under BAU and REDD+ .................................................................................................... 8
Table 6: Costs and benefit of forest conservation in protected areas .............................................. 16
Table 7: Cost and benefit of forest management in FMC ...................................................................... 18
Table 8: Cost and benefit of unregulated harvesting versus CFM ..................................................... 19
Table 9: Economics of charcoal production ................................................................................................ 20
Table 10: Cost and benefit of permanent agricultural production systems ................................... 21
Table 11: Economic comparison of agricultural production systems BAU vs. improved farming
...................................................................................................................................................................................... 23
Table 12: Economic benefit of industrial oil palm plantations versus other land uses .............. 25
Table 13: REDD+ implementation measures .............................................................................................. 28
Table 14: REDD+ program cost and potential emission reductions ................................................. 29
Table 15: Potential REDD+ benefit ................................................................................................................. 30
List of figures Figure 1: Workflow for the cost-benefit analysis ......................................................................................... 3
Figure 2: Approach for assessing opportunity costs and REDD+ benefits ........................................ 4
Figure 3: Land use change and related emissions for BAU and REDD+ scenarios for Liberia 12
Figure 4: Opportunity cost of avoided emissions in the REDD+ land use change scenario .... 14
Figure 5: Net-present value for BAU land REDD+ scenarios ................................................................ 27
Figure 6: Employment generated in different land uses ........................................................................ 31
Cost-Benefit Analysis of REDD+ Strategy Options – Technical Annex E P a g e | 2
1. Background and approach
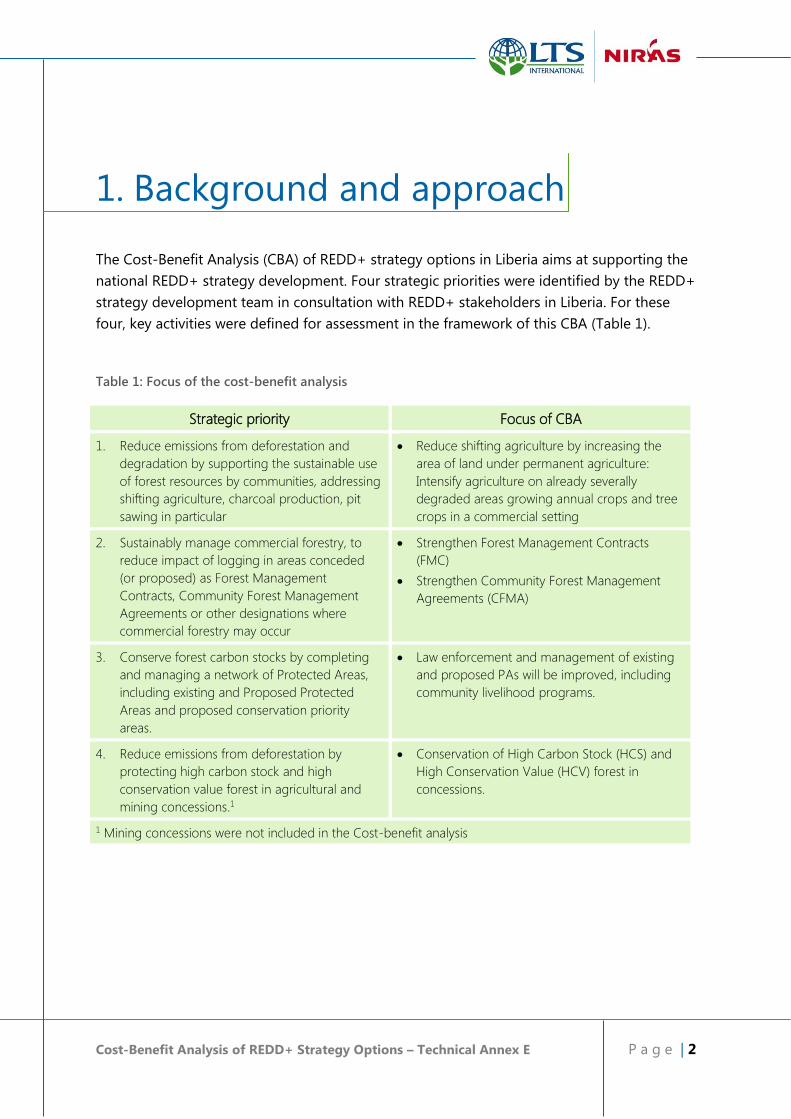
The Cost-Benefit Analysis (CBA) of REDD+ strategy options in Liberia aims at supporting the
national REDD+ strategy development. Four strategic priorities were identified by the REDD+
strategy development team in consultation with REDD+ stakeholders in Liberia. For these
four, key activities were defined for assessment in the framework of this CBA (Table 1).
Table 1: Focus of the cost-benefit analysis
Strategic priority Focus of CBA
1. Reduce emissions from deforestation and
degradation by supporting the sustainable use
of forest resources by communities, addressing
shifting agriculture, charcoal production, pit
sawing in particular
Reduce shifting agriculture by increasing the
area of land under permanent agriculture:
Intensify agriculture on already severally
degraded areas growing annual crops and tree
crops in a commercial setting
2. Sustainably manage commercial forestry, to
reduce impact of logging in areas conceded
(or proposed) as Forest Management
Contracts, Community Forest Management
Agreements or other designations where
commercial forestry may occur
Strengthen Forest Management Contracts
(FMC)
Strengthen Community Forest Management
Agreements (CFMA)
3. Conserve forest carbon stocks by completing
and managing a network of Protected Areas,
including existing and Proposed Protected
Areas and proposed conservation priority
areas.
Law enforcement and management of existing
and proposed PAs will be improved, including
community livelihood programs.
4. Reduce emissions from deforestation by
protecting high carbon stock and high
conservation value forest in agricultural and
mining concessions.1
Conservation of High Carbon Stock (HCS) and
High Conservation Value (HCV) forest in
concessions.
1 Mining concessions were not included in the Cost-benefit analysis
Cost-Benefit Analysis of REDD+ Strategy Options – Technical Annex E P a g e | 3
Approach and methodology
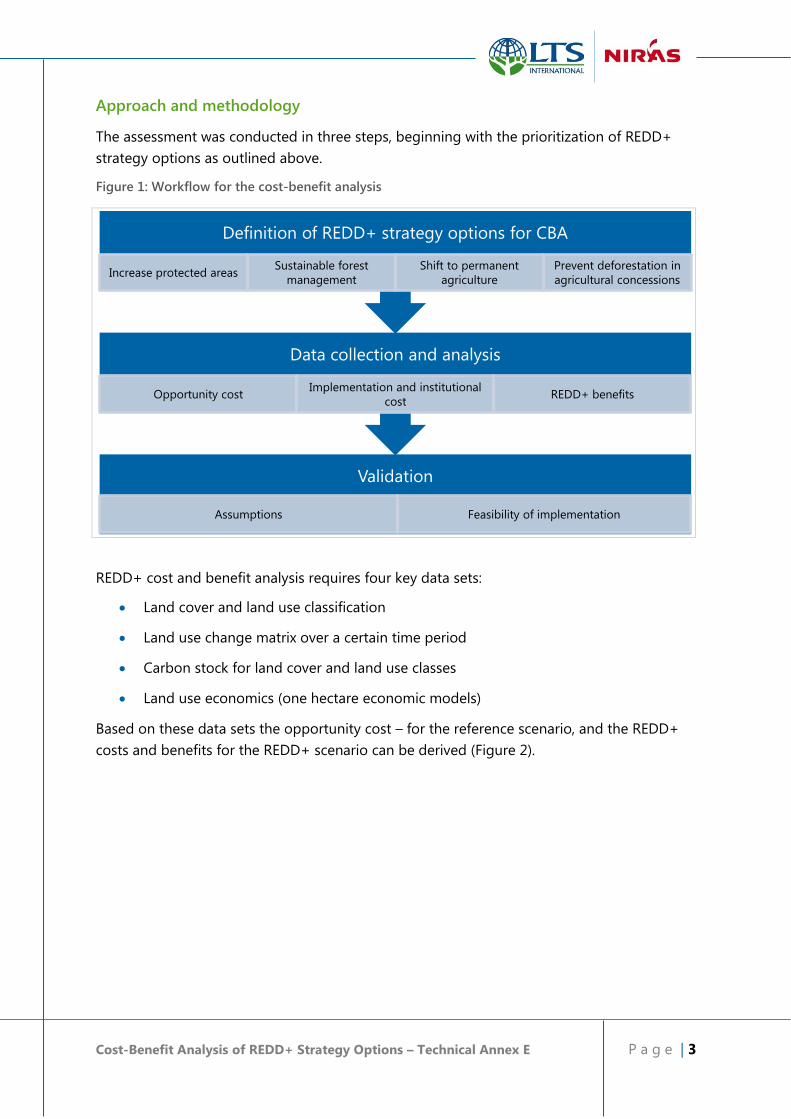
The assessment was conducted in three steps, beginning with the prioritization of REDD+
strategy options as outlined above.
Figure 1: Workflow for the cost-benefit analysis
REDD+ cost and benefit analysis requires four key data sets:
Land cover and land use classification
Land use change matrix over a certain time period
Carbon stock for land cover and land use classes
Land use economics (one hectare economic models)
Based on these data sets the opportunity cost – for the reference scenario, and the REDD+
costs and benefits for the REDD+ scenario can be derived (Figure 2).
Validation
Assumptions Feasibility of implementation
Data collection and analysis
Opportunity costImplementation and institutional
costREDD+ benefits
Definition of REDD+ strategy options for CBA
Increase protected areasSustainable forest
management
Shift to permanent
agriculture
Prevent deforestation in
agricultural concessions
Cost-Benefit Analysis of REDD+ Strategy Options – Technical Annex E P a g e | 4
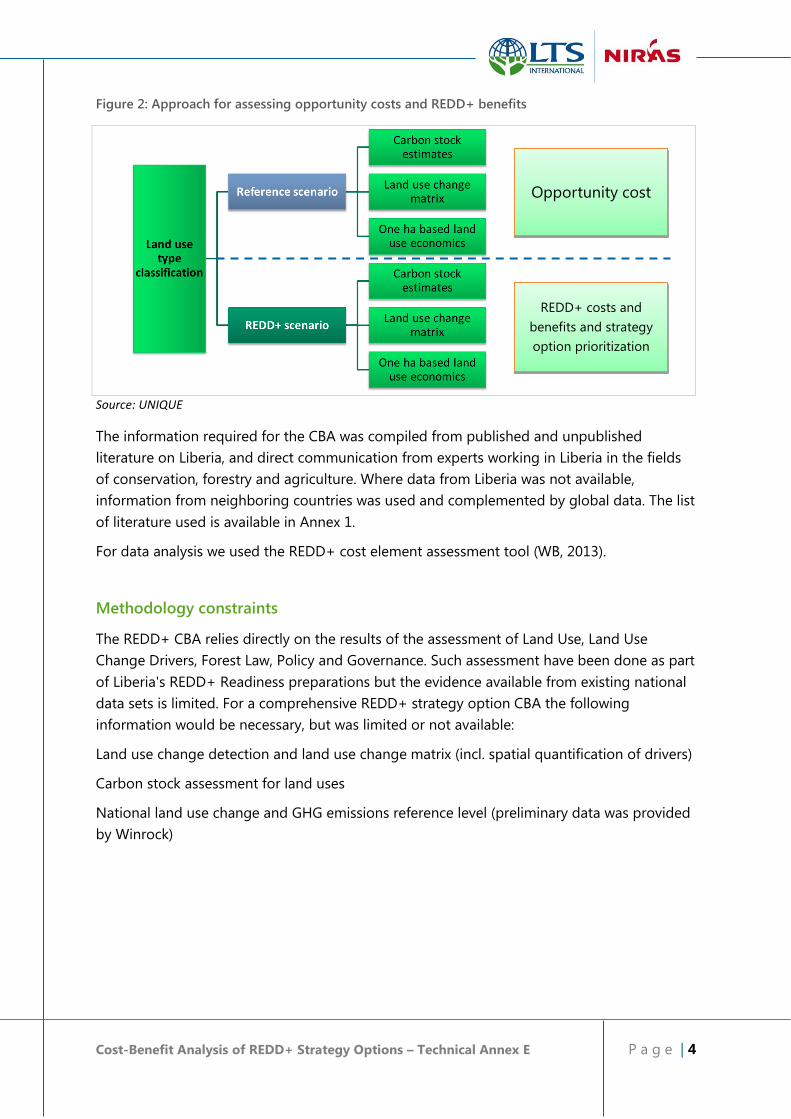
Figure 2: Approach for assessing opportunity costs and REDD+ benefits
Source: UNIQUE
The information required for the CBA was compiled from published and unpublished
literature on Liberia, and direct communication from experts working in Liberia in the fields
of conservation, forestry and agriculture. Where data from Liberia was not available,
information from neighboring countries was used and complemented by global data. The list
of literature used is available in Annex 1.
For data analysis we used the REDD+ cost element assessment tool (WB, 2013).
Methodology constraints
The REDD+ CBA relies directly on the results of the assessment of Land Use, Land Use
Change Drivers, Forest Law, Policy and Governance. Such assessment have been done as part
of Liberia's REDD+ Readiness preparations but the evidence available from existing national
data sets is limited. For a comprehensive REDD+ strategy option CBA the following
information would be necessary, but was limited or not available:
Land use change detection and land use change matrix (incl. spatial quantification of drivers)
Carbon stock assessment for land uses
National land use change and GHG emissions reference level (preliminary data was provided
by Winrock)
Opportunity cost
REDD+ costs and
benefits and strategy
option prioritization

Cost-Benefit Analysis of REDD+ Strategy Options – Technical Annex E P a g e | 5
Land cover, use and land use change assumptions
To the extent possible, information on actual land use was compiled using a variety of
literature sources and the recent land cover data compiled by Forest Development Authority
(FDA) and JV Metria/GeoVille (2015). Table 2 shows the assumed relationship between land
cover and land uses. Unregulated forest and shifting cultivation constitute by far the biggest
land uses in Liberia.
Table 2: Land cover and land use classes use for the assessment
Land cover class
2015 Area Land use class Area
Share within
land cover class
Forest cover >80% 4,589,270 Protected area 200,000 4%
Forest (not regulated /
protected)
2,889,270 63%
Forest regulated logging 1,008,137 22%
Forest unregulated
logging
291,863 6%
Rubber plantations 200,000 4%
30%< Forest Cover
<80%
1,986,495 Agroforestry 45,000 2%
Shifting cultivation 1,941,495 98%
Forest Cover <30% 1,529,949 Smallholder oil palm 20,000 1%
Industrial oil palm 26,300 2%
Shifting cultivation 1,383,649 90%
Intensive agriculture 100,000 7%
Other 1,550,348 Other (excl. clouds) 1,550,348
Total mapped area 9,656,062
9,656,062
Source: Land cover classes: GeoVille 2015
The rate of deforestation applied to the business as usual (BAU) scenario is based on a
preliminary value provided by Winrock (Table 3). The rate of forest
degradation/deforestation for the REDD+ scenarios was assumed to be reduced by 50%.

Cost-Benefit Analysis of REDD+ Strategy Options – Technical Annex E P a g e | 6
Table 3: Deforestation and degradation rates for BAU and REDD+
Land cover class
Forest cover class > 80% 30% < Forest Cover < 80%
BAU1 REDD+ BAU1 REDD+
Deforestation and forest
degradation 0.23% 0.115% 0.74% 0.37%
1 Winrock, Personal communication from Katie Goslee. Rates reflect forest cover change between 2002-
2012. The final values may differ from the ones used here.
No rates were available for forest degradation. They are assumed to be the same as for deforestation.
Forest degradation in the context of this CBA is understood as a conversion from the forest cover class >
80% to the 30% < x < 80% cover class.
Deforestation and degradation with REDD+ is assumed to be half as high as in the BAU scenario.
Preliminary carbon stock values for the three land cover classes were likewise provided by
Winrock. However, as values provided were not land use specific, they had to be
supplemented with values from the literature (IPCC 2003 & 2006 and other). Further details
are provided in Annex 4.
To put opportunity cost into perspective to the likely scale of land use change and potential
emissions the following land use change matrix was used. Values in Table 4 show the current
and future predicted area for a given land use. Planned and unplanned land use changes
taking place between today and the end of the assessment period are reflected by the
changed total.

Cost-Benefit Analysis of REDD+ Strategy Options – Technical Annex E P a g e | 7
Table 4: Land use change matrix for BAU and REDD+
Land cover Land use and land use change
Area
Currently BAU1 REDD+1
From: To: ha ha ha
Forest cover
>80%
Forest
(not used, not
protected)
Remaining without protection
status
2,900,000 2,500,000 900,000
Sustainable logging in FMC
(sustainable V, RIL)
0 0 1,000,000
Protected forest 200,000 300,000 1,100,000
Industrial oil palm n/a 170,000 0
Conventional
logging in FMC
Remaining FMC (conventional) 1,000,000 900,000 500,000
Sustainable logging in FMC
(sustainable V, RIL)
0 0 500,000
Unregulated
logging
Remaining unregulated 300,000 300,000 160,000
CFM
(Chainsaw milling)
0 0 140,000
Rubber plantation No change 200,000 200,000 200,000
Forest cover
30-80%
Shifting cultivation
(long cycles)
No change 1,900,000 1,400,000 1,400,000
Commercial agriculture
(improved)
0 0 50,000
Industrial oil palm n/a 170,000 250,000
Agroforestry Agroforestry (improved) 45,000 50,000 90,000
Forest cover
<30%
Shifting cultivation
(short cycles)
No change 1,400,000 1,800,000 1,400,000
Commercial agriculture
(improved)
0 0 50,000
Industrial oil palm 30,000 170,000 200,000
Intensive
agriculture
Commercial agriculture
(improved)
100,000 100,000 100,000
Smallholder oil
palm
No change 20,000 20,000 20,000
Other 1,600,000
Total 9,700,000
1 Area after 25 years, i.e. after planned and unplanned land use changes. Unplanned land use change =
deforestation and degradation. The sub-totals of the BAU and REDD+ scenario for the individual land
cover classes differ from the current area due to planned conversion to other land uses and
deforestation/degradation.
Sources: Land cover: FDA and JV Metria/GeoVille (2015), land use: various sources – refer to Annex 1,
Winrock personal communication; Figures presented are rounded values.

Cost-Benefit Analysis of REDD+ Strategy Options – Technical Annex E P a g e | 8
Economic modelling
Economic 1-hectare models were developed for the land uses listed in Table 5 to compare
the financial performance under business as usual (BAU) and REDD+. Under REDD+, land
management will change to more sustainable forms, contributing to reducing pressure on
forests, reducing the impact of forestry, and retaining and increasing carbon stocks.
The economic comparison is based on net-present value over 25 years.1 Costs and revenues
were discounted using a rate of 15%, reflecting the high cost of capital in Liberia. A complete
list of assumptions is provided in Annex 2-4.
Table 5: Land uses under BAU and REDD+
Land use Business as usual REDD+
Protected
areas (PA)
The existing 3 PAs will remain protected
areas with similar management activities
and intensity.
Encroachment of the protected areas for
livelihood activities, artisanal mining and
others continues, leading to conflict,
deforestation and forest degradation.
Management of existing PAs will be
intensified; incl. alternative livelihood
measurements in nearby communities and
additional PAs (see R-PP) will be gazetted.
Deforestation and degradation will be
reduced.
Commercial
logging
Logging takes place in concessions granted
by government and on community
controlled land. Logging standards in
concession areas do not always conform to
international best practice. In community
forests logging standards are not applied.
Many small scale logging business (chain
saw millers) exist. They are largely
unregulated and harvest in all forest types.
Poor logging standards cause significant
damage to residual stands and the amount
of timber harvested exceeds the rate of
regrowth. As a result forests are severally
degraded and/or eventually converted to
other land uses.
Commercial logging in concessions is
further formalized. Companies adjust
volume harvested per ha to rate of growth
and apply Reduced Impact Logging (RIL).
Community forests are formalised, and use
similar standards to the above for
commercial forestry. Alternatively
communities can decide to protect forests
allowing only very limited use of forest
resources.
Chainsaw millers are regulated and have to
work according to minimum standards and
cannot operate in formal logging
concessions. Control of volume harvested is
linked community forest plans.
Deforestation and degradation will be
reduced.
Forestry will remain a profitable sector
beyond one contract period.
Charcoal
production
Charcoal production is frequently linked to
clearing land for agriculture and replanting
of rubber plantations, but likely takes place
as a primary income generating activity in
REDD+ activities may seek to limit the
impact of charcoal production on forests
remaining forests by regulating access (e.g.
linked to community forest management).
1 The period of 25 years was chosen based on the common duration of concession agreements in agriculture and
forestry.

Cost-Benefit Analysis of REDD+ Strategy Options – Technical Annex E P a g e | 9
Land use Business as usual REDD+
forests as well, contributing to forest
degradation. Production and trade is not
regulated. Charcoal is the main energy
source for Liberia’s urban population; it can
be assumed that consumption will increase
in line with the growing urban population.
The use of better charcoal production
technologies can increase conversion
efficiency, reducing wood consumption.
More efficient end user technologies can
reduce overall consumption and alternative
sources of energy can replace charcoal and
fuel wood
Degradation will be reduced.
Agro-
forestry
(example
cocoa)
Agroforestry crops such as cocoa create
little income due to sub-optimal stocking,
old trees, very limited use of inputs and the
poor quality produced. Market access is
difficult.
Little incentive exists to sustain agroforestry
crops or invest into new ones/intensification;
rather farmers rely on shifting cultivation
converting more forest to agricultural land
(see below).
With the aim to diversify livelihoods and
provide alternative income for subsistence
farmers currently relying on shifting
cultivation cocoa production is intensified
applying modern management practices,
using better varieties and inputs, and
creating value addition and marketing
structures.
Yield and profitability increase. Farmers
have higher income from smaller land
areas reducing the need for shifting
cultivation and deforestation. Permanent
agroforestry systems sequester carbon.
Shifting
cultivation
The majority of farmers use shifting
agriculture. Population growth leads to
conversion of new forest areas and
shortening cultivation cycles resulting in
decreasing productivity.
Subsistence farming is a major driver of
deforestation.
A shift to permanent agriculture is
encouraged, using better agricultural
practises and inputs; raising yield and
income and reducing the need to expand
agriculture to forested areas.
Deforestation will be reduced.
Rubber
(smallholder
farmers)
Rubber used to be an important cash crop
for small and medium sized farmers.
Plantations were overexploited during the
conflict, are often very old and are now
often unproductive. Prices for natural
rubber are very low, leaving little incentive
to rejuvenate existing plantations or invest
in new ones.
The future of smallholder rubber in Liberia is
not clear.
Therefore, rubber was not a focus of the
REDD+ CBA.
Oil palm Farmers grow the local Dura variety
dispersed on agricultural land or in small
lots producing oil from the fruit for the local
market.
Several hundred thousand hectares of oil
palm concessions, incl. out-grower schemes
are planned. Concessions are expected to
contribute significantly to deforestation.
Smallholder farmers will continue to grow
oil palm for local consumption but also
become part of the industrial supply chains.
Conversion of existing agricultural land and
forests to oil palm will take into
consideration HCS and HCV areas and
exclude them from conversion. Sufficient
agricultural land and forest for community
use is set aside as well.
Deforestation will be limited to low
carbon stock land cover types.
Cost-Benefit Analysis of REDD+ Strategy Options – Technical Annex E P a g e | 10
Land use Business as usual REDD+
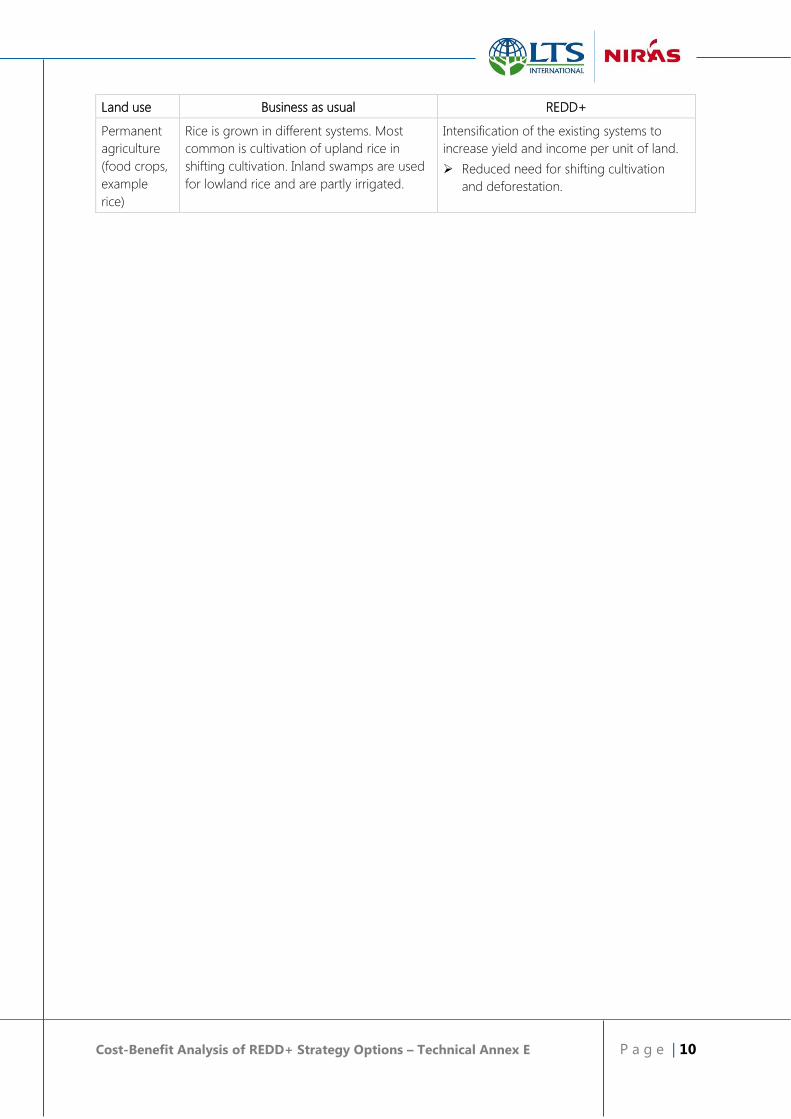
Permanent
agriculture
(food crops,
example
rice)
Rice is grown in different systems. Most
common is cultivation of upland rice in
shifting cultivation. Inland swamps are used
for lowland rice and are partly irrigated.
Intensification of the existing systems to
increase yield and income per unit of land.
Reduced need for shifting cultivation
and deforestation.

Cost-Benefit Analysis of REDD+ Strategy Options – Technical Annex E P a g e | 11
2. Results Summary
The cost-benefit analysis of REDD+ includes different aspects which have to be considered in
parallel:
The scale of implementation (e.g. area to be covered by, or farmers to be included in
REDD+ activities)
The likely emission reductions resulting from different land management practices (a
function of scale of land use change and difference in carbon stock per unit of land
between the two land uses)
The opportunity cost of the land user as an indication for the level of effort required
to change land management practices in order to reduce emissions
Environmental and socio-economic benefits/impacts of REDD+ implementation (e.g.
impact on biodiversity, employment and macro-economic development) and
The implementation cost, e.g. creating an enabling environment for sustainable land
management.
The potential scale of the different land uses to be covered by REDD+ is indicated in
Table 4 above. The biggest land use with significant carbon stock is forest without any
protection or management status (2.9 million ha), followed by areas used extensively for
agriculture (shifting cultivation with long management cycles) with 1.9 million ha. Both are
threatened by deforestation and forest degradation.
The combination of scale in terms of area potentially affected (i.e. converted from one
land use to another – planned or unplanned) and resulting emissions or emission
reductions is shown in Figure 3 for the BAU and REDD+ scenarios. For example:
If converting currently unprotected forest to oil palm an amount of carbon
disproportionate to the comparatively small area converted is emitted.
If allowing sustainable forest management on an area five times as big as forest land
converted to oil palm less than twice as many emissions will be released while many
qualities inherent to forests (carbon, biodiversity, watershed protection) will be
retained.
If current unsustainable logging practices are changed to more sustainable ones
(FMC; CFM) GHGs will be sequestered.
The case is similar for the expansion of agroforestry systems, although the area
concerned is very small.
Last but not least agriculture (incl. oil palm) can be intensified on already degraded
land and will result in very few emissions per ha and, if implemented correctly,
reducing pressure on forests.
Cost-Benefit Analysis of REDD+ Strategy Options – Technical Annex E P a g e | 12
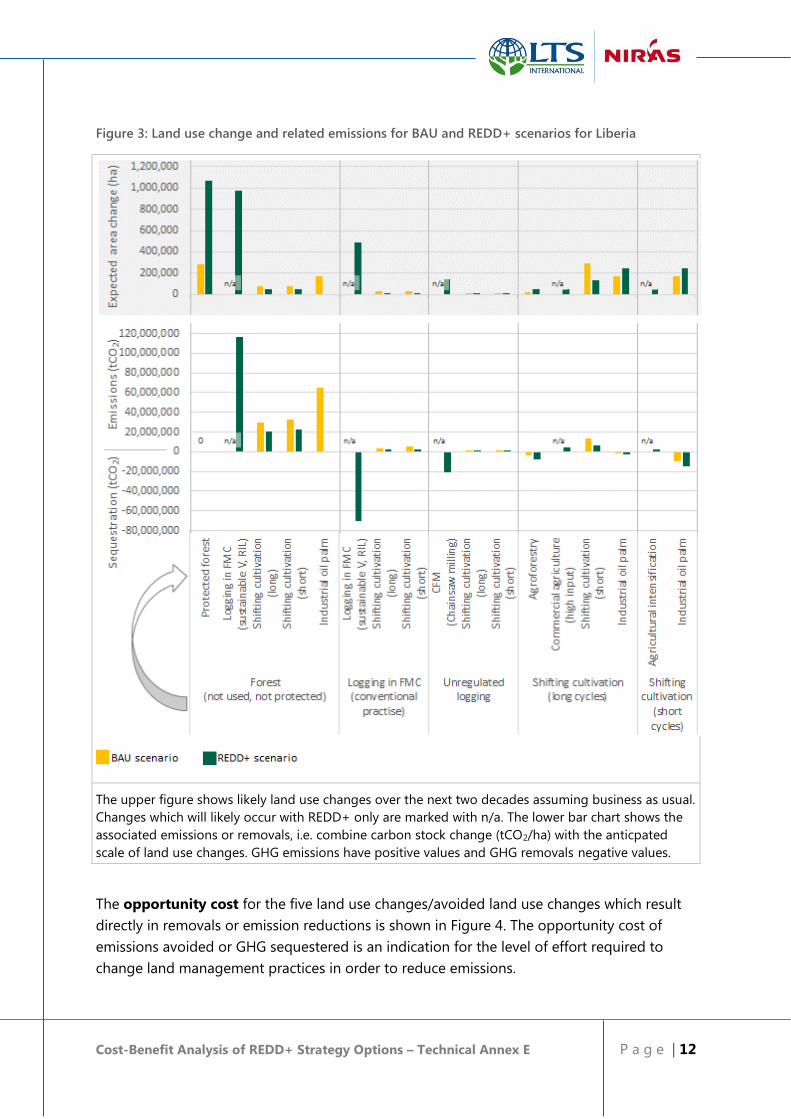
Figure 3: Land use change and related emissions for BAU and REDD+ scenarios for Liberia
The upper figure shows likely land use changes over the next two decades assuming business as usual.
Changes which will likely occur with REDD+ only are marked with n/a. The lower bar chart shows the
associated emissions or removals, i.e. combine carbon stock change (tCO2/ha) with the anticpated
scale of land use changes. GHG emissions have positive values and GHG removals negative values.
The opportunity cost for the five land use changes/avoided land use changes which result
directly in removals or emission reductions is shown in Figure 4. The opportunity cost of
emissions avoided or GHG sequestered is an indication for the level of effort required to
change land management practices in order to reduce emissions.

Cost-Benefit Analysis of REDD+ Strategy Options – Technical Annex E P a g e | 13
Expanding the protected area network and changing timber harvesting practices to more
sustainable ones will result in additional costs/foregone economic benefits to the land user,
i.e. emitting CO2 in a business as usual setting would be profitable to the land user. To avoid
doing so will result in additional costs/foregone economic benefits. This barrier can be
overcome by passing on the cost directly to the state (e.g. for protection in form of PAs), by
providing incentives (e.g. tax reductions for sustainably harvested timber) and stronger
regulations and enforcement thereof.
In contrast, agroforestry with permanent tree crops, but also the establishment of oil palm
plantations on degraded land will sequester carbon and increase the financial benefit to the
land user – a win-win situation. However, the negative opportunity cost is dependent on the
creation of an enabling environment such as providing access to inputs, financial and
technical services for smallholder farmers and e.g. investment ready land for oil palm
concessions.
Other measures, such as allowing formalized sustainable logging in primary forest not
covered through the protected area network (FMC, CFM) and intensification of agricultural
uses on already degraded land will contribute to reducing deforestation by attributing a
tangible value to forests and by reducing pressure on forests respectively. Neither activity
will reduce emissions directly, hence, they are not included in Figure 4.
The environmental impact of REDD+, such as conserving biodiversity and protecting of
water resources will be highest in undisturbed ecosystems. However, land uses retaining
some of the original ecosystem structures (e.g. forestry and extensive agriculture) also retain
part of their protective function. Positive socio-economic changes would result from the
sustainable intensification of agroforestry and agriculture. Developments in agroforestry and
agricultural can benefit in particular the rural population.
The estimated REDD+ implementation cost over 25 years is 1.7 billion USD (see Table 14).
The establishment and maintenance of PAs alone is estimated to cost 750 million USD,
constituting over 40% of the total cost. On a per hectare basis sustainable forest
management (SFM) is the most attractive option with an estimated annual cost of < 10
USD/ha. Regulated access to forests for timber production will give these forests a certain
status of protection while generating revenues. Interventions targeting the agriculture sector
are comparatively expensive with annual costs in the range of 30 USD/ha but are highly
complementary to forest conservation and have the potential to contribute to the economic
development of Liberia.

Cost-Benefit Analysis of REDD+ Strategy Options – Technical Annex E P a g e | 14
Figure 4: Opportunity cost of avoided emissions in the REDD+ land use change scenario
The values presented combine the opportunity cost per ha (NPV) for REDD+ land management practices with the carbon stock change per ha (tCO2).
Values are only provided for land use changes that directly result in reduced emissions.
Bars in yellow indicate that implementing the land management comes at a cost to the land user (or in other words emitting CO2 would be profitable),
which means doing so will require incentives and regulation. Bars in green (negative values) indicate that the land management practice is profitable to
the land user, i.e. will require little incentive. The opportunity cost for agroforestry are influenced by REDD+ activities such as providing access to inputs,
financial and technical services, regulations and enforcement thereof. However, the cost of implementing these measures is not part of the opportunity
cost calculation.
Cost-Benefit Analysis of REDD+ Strategy Options – Technical Annex E P a g e | 15
2.1 REDD+ opportunity cost
The REDD+ opportunity cost is the cost to the land user of forsaking the change from the
current land use to another that leads to change of GHG emissions and economic
performance of the land. Opportunity costs are important for the design of the REDD+
strategy because they indicate the economic incentive to the land user required to motivate
a change of land use practices in support of forest protection. If current practices (land use
changes) are very profitable, the opportunity costs of foregoing that profit will be high and
land users will require a relatively large incentive to be persuaded to change their practice.
The profitability of land uses related to the four target strategies was calculated for the
business as usual (BAU) scenario as well as for changes likely to occur with implementation
of REDD+. A comparison of profitability, expressed as net-present value over 25 years, and
carbon stocks for BAU and REDD+ are presented below for the four strategies.
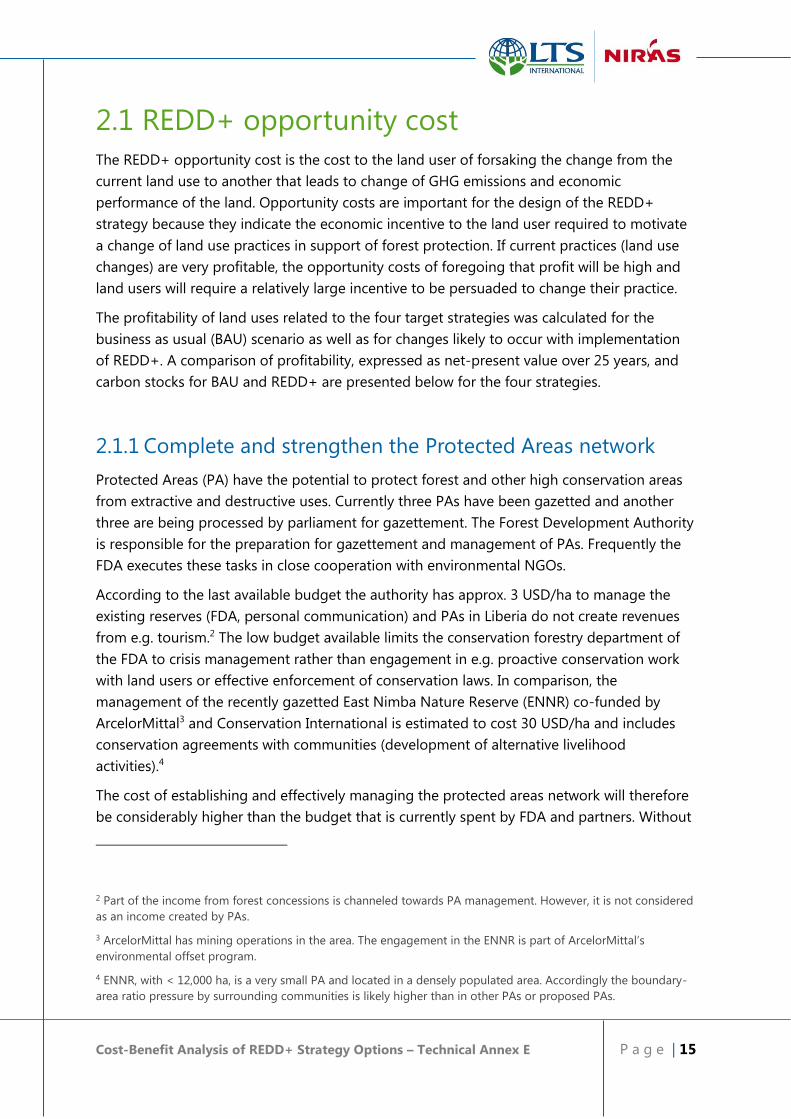
2.1.1 Complete and strengthen the Protected Areas network
Protected Areas (PA) have the potential to protect forest and other high conservation areas
from extractive and destructive uses. Currently three PAs have been gazetted and another
three are being processed by parliament for gazettement. The Forest Development Authority
is responsible for the preparation for gazettement and management of PAs. Frequently the
FDA executes these tasks in close cooperation with environmental NGOs.
According to the last available budget the authority has approx. 3 USD/ha to manage the
existing reserves (FDA, personal communication) and PAs in Liberia do not create revenues
from e.g. tourism.2 The low budget available limits the conservation forestry department of
the FDA to crisis management rather than engagement in e.g. proactive conservation work
with land users or effective enforcement of conservation laws. In comparison, the
management of the recently gazetted East Nimba Nature Reserve (ENNR) co-funded by
ArcelorMittal3 and Conservation International is estimated to cost 30 USD/ha and includes
conservation agreements with communities (development of alternative livelihood
activities).4
The cost of establishing and effectively managing the protected areas network will therefore
be considerably higher than the budget that is currently spent by FDA and partners. Without
2 Part of the income from forest concessions is channeled towards PA management. However, it is not considered
as an income created by PAs.
3 ArcelorMittal has mining operations in the area. The engagement in the ENNR is part of ArcelorMittal’s
environmental offset program.
4 ENNR, with < 12,000 ha, is a very small PA and located in a densely populated area. Accordingly the boundary-
area ratio pressure by surrounding communities is likely higher than in other PAs or proposed PAs.

Cost-Benefit Analysis of REDD+ Strategy Options – Technical Annex E P a g e | 16
revenues offsetting the management costs PAs will come at a net-cost (Table 6). However,
carbon savings can be substantial if compared to alternative land use forms.
30% of the tax revenues from commercial logging are meant to be directed towards
conservation. Currently, this income is mostly diverted into general government expenditure,
to meet other spending priorities, but it represents another potential source of income for
Protected Areas. There are therefore substantial and currently untapped revenue streams
that could offset the heavy costs of conservation. Another potential revenue stream is
biodiversity offsets. This is the approach adopted by Arcelor Mittal that delivers substantially
more funding for conservation of East Nimba Nature Reserve. It has been proposed as an
approach for the mining industry as a whole in Liberia (Johnson, 2014) and is potentially
applicable to other industries (including agricultural concessions) that result in the clearance
of forest.
Table 6: Costs and benefit of forest conservation in protected areas
Parameter Management
Change BAU REDD+
Cost in USD/ha over 25 years 78 736
- 379
Revenues in USD/ha over 25 years 0 0
NPV1 in USD/ha after 25 years - 45 - 424
Likely land use changes without protection:
Carbon stock2 change (tCO2/ha) from undisturbed forest
to
499 499 N/A
- Commercial logging (conventional practice) 234 n/a - 265
- Commercial logging (sustainable) n/a 379 - 120
- Agriculture < 50 n/a - 450
Economic benefit of changing from undisturbed forest to
… NPV1 in USD/tCO2
- Commercial logging (conventional practice) + 2.5
- Commercial logging (sustainable) + 1.5
- Agriculture (Shifting cultivation)3 + 1.6 to + 2.0
1 The discount rate is 15%. Values are inflation adjusted.
2 Carbon stock includes above ground and below ground biomass.
3 NPV depends on the intensity of agriculture, e.g. time until returning to the same plot of land.
Effective protection of protected areas requires a higher budget per hectare. In combination with the
absence of any income generation in Liberia’s protected areas the NPV becomes very negative.
Likely alternative uses of primary forests in BAU are logging and conversion to subsistence agriculture,
especially along forest frontiers. In the REDD+ scenario allocation of currently unprotected forests to
sustainable forest management may become an alternative option (lower form of protection). These uses,
incl. sustainable forest management, will cause GHG emissions (lowering carbon stock) but create
economic benefit to the land user, i.e. alternative land uses have an opportunity cost between 1.5-2.5
USD/tCO2.

Cost-Benefit Analysis of REDD+ Strategy Options – Technical Annex E P a g e | 17
2.1.2 Sustainable forest management
Various forms of authorized forest management exist. Most notable are Forest
Management Concessions (FMC) and Community Forest Management Agreements
(CFMA). FMCs are large concessions usually exceeding 100,000 ha and produce timber for
the export market. Additionally a few large CFMAs were licensed to private sector
organizations but have been suspended due to controversy in the licensing process. Several
smaller CFMAs have been granted directly to communities against the background of the
proposed Land Rights Act (strengthening land tenure and land use of communities). The
required process, incl. development of management plans was heavily supported by NGOs
and development partners. These CFMAs focus on forest conservation. Individuals or groups
(commonly referred to as chainsaw millers) harvesting timber where it is accessible are not
regulated. Timber available in rural and urban markets stems from these sources.
Commercial forest management has been the focus of the Liberian economy in the past
and has been scrutinized in the framework of several studies as well as the Voluntary
Partnership Agreement (VPA) with the EU5 over the last years. Accordingly potential impacts
of logging concessions on forests and economics are fairly well documented. A sustainable
forest management standard exists. However, it is likely not always well implemented by
companies due to lacking enforcement. Volume harvested per hectare over the length of the
FMC (25 years) is suspected to exceed the increment over the same period by far (Shearman,
2009). A reduction of volume harvested to sustainable levels would likely have a significant
impact on the profit of logging companies, reducing NPV (25 years) from ca. $650 USD/ha to
< $200 USD/ha (Table 7). The change in management could result in an increase in carbon
stock of ca. 150 tCO2/ha over time (time horizon depending on state of degradation). If the
Government of Liberia is to achieve its policy objective of having a timber industry that
generates employment and revenues for the long term, a shift to sustainable forestry is
necessary.
5 Part of Forest Law Enforcement, Governance and Trade (FLEGT)

Cost-Benefit Analysis of REDD+ Strategy Options – Technical Annex E P a g e | 18
Table 7: Cost and benefit of forest management in FMC
Land use Parameter Management
Change BAU REDD+
Forest Management
Concessions (FMC)
BAU: conventional
logging
REDD+: sustainable
forest management
Cost1 in USD/ha 3,695 1,056
- 474
Revenues1 in USD/ha 4,825 1,363
NPV1,2 in USD/ha 651 177
Carbon stock3 in tCO2/ha 234 379 + 145
Economic cost of changing from BAU to REDD+, NPV in
USD/tCO2
- 3.3
1 Cost, revenue and NPV for FMC presented were calculated over a timeframe of 25 years. Round wood is
exported to overseas destinations.
2 A discount rate of 15% was applied. Values are inflation adjusted.
3 Carbon stock after 25 years. Includes above ground and below ground biomass.
Both cost and revenues in FMC are to a large extent driven by volume harvested but are also influenced
by area based fees. As a result costs in sustainable forest management (REDD+) decrease less than
revenues resulting in lower NPV. The lower NPV will result in opportunity cost of USD 3.3/tCO2 in order to
avoid emissions from unsustainable forestry.
Chainsaw millers harvest without any permits or pay only a small fee to communities who
claim ownership of a certain forest. This fee can be in-kind (sawn timber) or paid in cash. The
estimate for log volume harvested by chainsaw millers ranges between 280,000 and 650,000
m³/year (FDA, 2009). In unregulated circumstances the NPV of chainsaw milling is just below
$300 USD/ha (harvesting of all trees with market value) (Table 8). The REDD+ scenario
assumes regulation of chainsaw millers through communities adhering to sustainable forest
management standards through Community Forest Management. Communities would
benefit from timber harvests through a fee to be paid by the chainsaw millers. The NPV of
the chainsaw miller in this scenario is much lower, with only $ 34 USD/ha. The lower
harvesting volumes will result in higher carbon stocks.

Cost-Benefit Analysis of REDD+ Strategy Options – Technical Annex E P a g e | 19
Table 8: Cost and benefit of unregulated harvesting versus CFM
Land use Parameter Management
Change BAU4 REDD+5
BAU: Unregulated
timber harvesting by
chainsaw millers
REDD+: Community
forest management
(CFM)
Cost in USD/ha 857 11
- 261
Revenues in USD/ha 1,166 13
NPV1,2 in USD/ha 295 34
Carbon stock3 in tCO2/ha 234 3796 + 145
Economic cost of changing from BAU to REDD+, NPV in
USD/tCO2
- 2.0
1 Cost, revenue and NPV were calculated over a timeframe of 25 years. Sawn timber is sold in rural and
local markets.
2 A discount rate of 15% was applied. Values are inflation adjusted.
3 Carbon stock after 25 years. Includes above ground and below ground biomass.
4 Cost and revenues occur in year 1 only, i.e. no long term management costs are considered.
5 The REDD+ scenario assumes that chainsaw milling is linked to sustainable CFM management. I.e.
additional costs apply (fee to the community) and harvesting volume/ha*year is much lower (equal to
volume increment/year). Cost for REDD+/CFM excludes operational/management cost by the
communities as no experiences were available at the time of data collection. The additional costs and
lower volume harvested will result in opportunity costs of USD 2 per tCO2.
6 The value given assumes use of timber only (as in commercial forest management, Table 7). However,
carbon stock is likely lower as additional uses such as fuel wood collection and charcoal production may
apply to community forests.
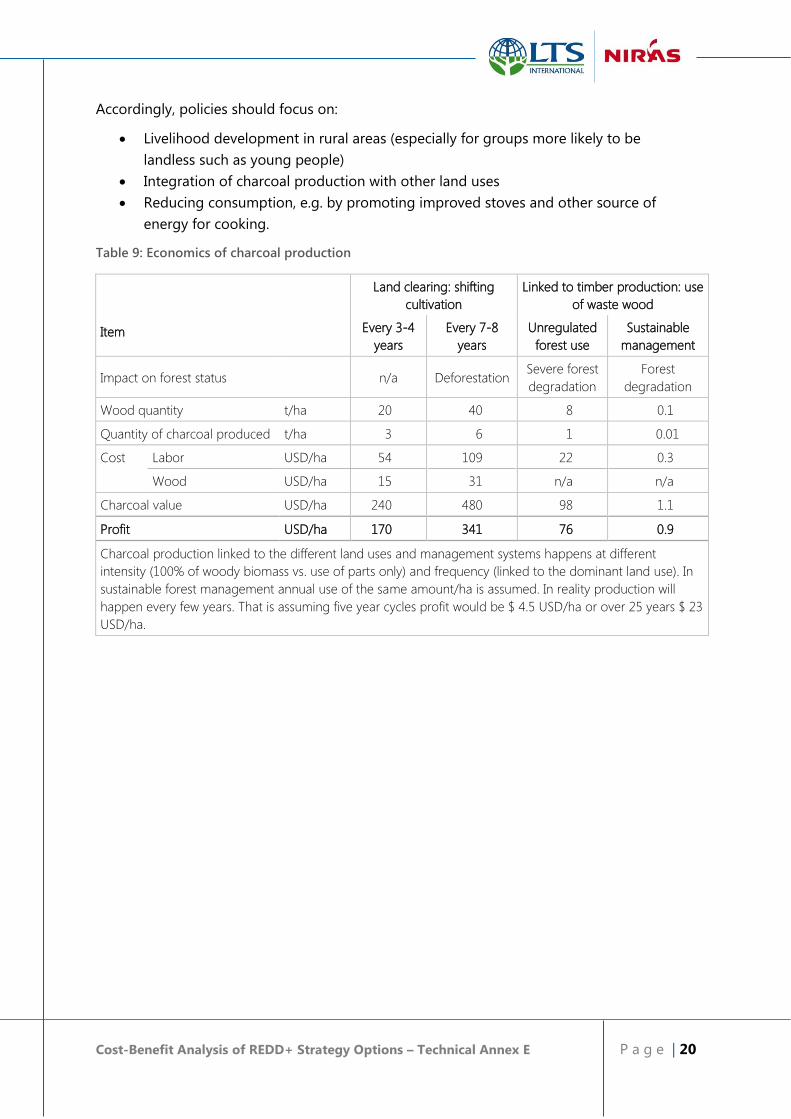
Charcoal production and trade is an important economic activity. Annual charcoal
consumption in Liberia is estimated to be 130,000 tons (van der Plas 2011 and GoL LISGIS
2008) which is approx. equivalent to 1.5 million cubic meter wood. Charcoal production
seems to be largely linked to land clearing for agriculture as well as the rehabilitation of
rubber plantations. The extent of charcoal production in primary forest is unknown.
Charcoal production is generally speaking a labor intensive activity creating little value for
the wood used. Table 9 provides estimates of the economic return per hectare for different
scenarios. Most woody biomass suitable for charcoal production may be easily available in
subsistence farming were shifting cultivation is used. Where waste wood from timber
harvesting activities is used, less biomass is available per hectare – especially if applying
sustainable forest management. In all cases charcoal production can increase the economic
benefit of the land user.
However, charcoal production can be a driver of forest degradation and deforestation,
especially if other income opportunities in rural areas fail (subsistence agriculture,
employment) and charcoal production is delinked from agriculture or timber harvest.
Cost-Benefit Analysis of REDD+ Strategy Options – Technical Annex E P a g e | 20
Accordingly, policies should focus on:
Livelihood development in rural areas (especially for groups more likely to be
landless such as young people)
Integration of charcoal production with other land uses
Reducing consumption, e.g. by promoting improved stoves and other source of
energy for cooking.
Table 9: Economics of charcoal production
Item
Land clearing: shifting
cultivation
Linked to timber production: use
of waste wood
Every 3-4
years
Every 7-8
years
Unregulated
forest use
Sustainable
management
Impact on forest status
n/a Deforestation Severe forest
degradation
Forest
degradation
Wood quantity t/ha 20 40 8 0.1
Quantity of charcoal produced t/ha 3 6 1 0.01
Cost Labor USD/ha 54 109 22 0.3
Wood USD/ha 15 31 n/a n/a
Charcoal value USD/ha 240 480 98 1.1
Profit USD/ha 170 341 76 0.9
Charcoal production linked to the different land uses and management systems happens at different
intensity (100% of woody biomass vs. use of parts only) and frequency (linked to the dominant land use). In
sustainable forest management annual use of the same amount/ha is assumed. In reality production will
happen every few years. That is assuming five year cycles profit would be $ 4.5 USD/ha or over 25 years $ 23
USD/ha.
Cost-Benefit Analysis of REDD+ Strategy Options – Technical Annex E P a g e | 21
2.1.3 Intensification of agricultural production on non-forest
land
Agriculture in the country is dominated by subsistence farmers producing food crops and
palm oil for home consumption and to a limited extent for sale in the local market (e.g. rice
and palm oil) or the export market (cocoa). Farming of food crops (rice, maize, cassava,
vegetables) relies usually on shifting cultivation and little or no inputs such as fertilizer and
other agro-chemicals are used. Likewise farmers cultivating tree crops tend to use local
(unimproved) varieties and few if any inputs. As a result yields are low and product quality
often not compliant with international standards (e.g. USAID 2015; GoL MoA 2007, personal
communication CARI (Suakoko) and WIENCO).
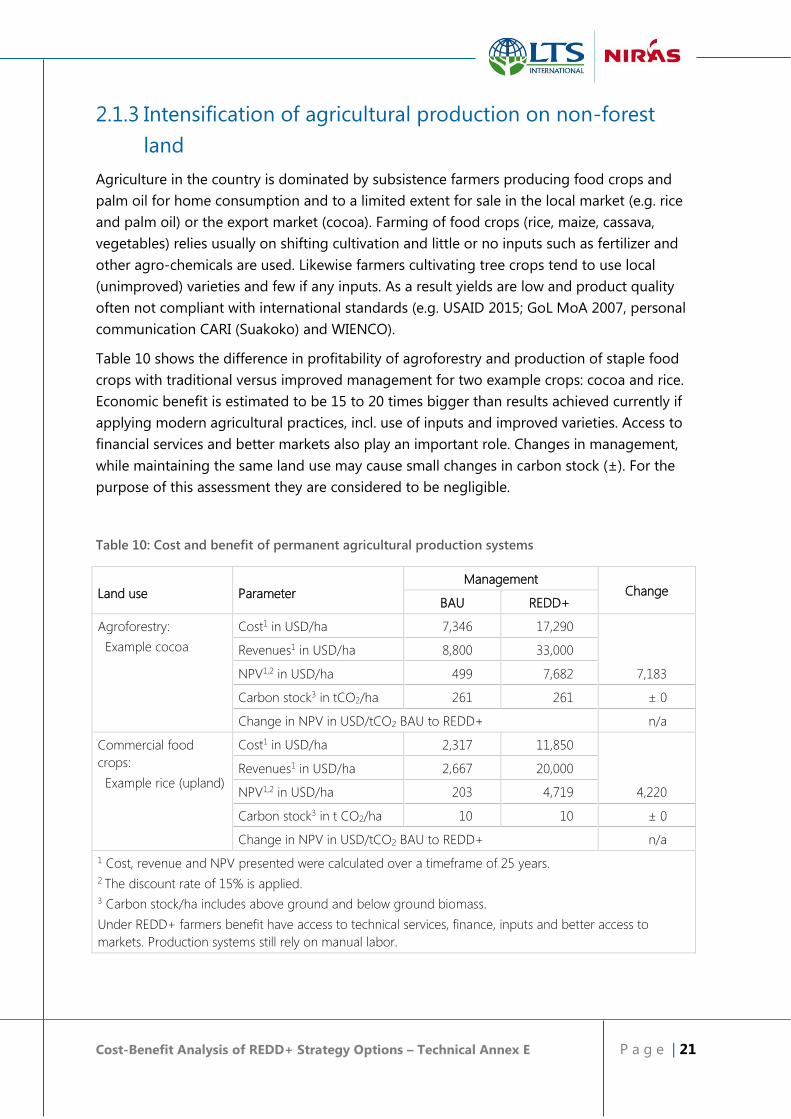
Table 10 shows the difference in profitability of agroforestry and production of staple food
crops with traditional versus improved management for two example crops: cocoa and rice.
Economic benefit is estimated to be 15 to 20 times bigger than results achieved currently if
applying modern agricultural practices, incl. use of inputs and improved varieties. Access to
financial services and better markets also play an important role. Changes in management,
while maintaining the same land use may cause small changes in carbon stock (±). For the
purpose of this assessment they are considered to be negligible.
Table 10: Cost and benefit of permanent agricultural production systems
Land use Parameter Management
Change BAU REDD+
Agroforestry:
Example cocoa
Cost1 in USD/ha 7,346 17,290
7,183
Revenues1 in USD/ha 8,800 33,000
NPV1,2 in USD/ha 499 7,682
Carbon stock3 in tCO2/ha 261 261 ± 0
Change in NPV in USD/tCO2 BAU to REDD+ n/a
Commercial food
crops:
Example rice (upland)
Cost1 in USD/ha 2,317 11,850
4,220
Revenues1 in USD/ha 2,667 20,000
NPV1,2 in USD/ha 203 4,719
Carbon stock3 in t CO2/ha 10 10 ± 0
Change in NPV in USD/tCO2 BAU to REDD+ n/a
1 Cost, revenue and NPV presented were calculated over a timeframe of 25 years.
2 The discount rate of 15% is applied.
3 Carbon stock/ha includes above ground and below ground biomass.
Under REDD+ farmers benefit have access to technical services, finance, inputs and better access to
markets. Production systems still rely on manual labor.
Cost-Benefit Analysis of REDD+ Strategy Options – Technical Annex E P a g e | 22
A comparison of agroforestry and commercial agriculture with shifting cultivation is provided
in Table 11. Commercial agriculture and agroforestry without the use of modern farming
practices cannot compete with shifting agriculture; i.e. farmers have little incentive to change
to permanent farming systems requiring less land.
However, in an enabling environment yields can be increased substantially making
permanent farming economically more attractive than shifting cultivation. The direct impact
in terms of emissions is positive for a shift to agroforestry with crops such as cocoa; GHG will
be sequestered. If converting shifting agriculture systems to permanent cropping systems
such as rice, cassava or maize carbon stocks will be reduced. Accordingly such change should
be preferentially limited to sites which are already considered open land (forest cover <
30%).
Higher yield per unit of land can help to reduce the expansion of agricultural land into
forests. However, more profitable agriculture and access to e.g. export markets may create a
reverse incentive leading to accelerated forest conversion if not supported by an appropriate
legal framework and enforcement.

Cost-Benefit Analysis of REDD+ Strategy Options – Technical Annex E P a g e | 23
Table 11: Economic comparison of agricultural production systems BAU vs. improved farming
Production system Products NPV1 Carbon stock2
(USD/ha) (tCO2/ha)
Subsistence farming:
shifting cultivation
Cycle: 7-8 years Mixed food
crops and fruit
815 95
Agroforestry with
commercial tree
crops
Traditional: low input Example: cocoa 499 261
Improved 7,682
Economic cost/benefit of changing from (7-8 year cycle) to agroforestry, NPV in
USD/tCO2:
Traditional agroforestry - 2
Improved agroforestry + 41
Subsistence farming:
shifting cultivation
Cycle: 3-4 years Mixed food
crops and fruit
742 47
Commercial
agriculture Staple
food crops
Traditional: low input Example: rice 203 10
Improved 4,719
Economic cost/benefit of changing from shifting cultivation (3-4 year cycle) to
commercial agriculture, NPV in USD/tCO2:
Traditional agriculture - 15
Improved agriculture + 107
1NPV presented was calculated over a timeframe of 25 years with a discount rate of 15%.
2Carbon stock/ha includes above ground and below ground biomass.
In improved production systems farmers have access to technical services, finance and inputs and better
access to markets. Production systems still rely on manual labor. Farming applying improved
agroforestry creates a win-win situation: carbon stock and economic benefits increase in comparison to
shifting cultivation. Intensification to commercial agriculture will always result in GHG emissions but
creates an economic benefit to the farmers only if applying better agricultural practices.
2.1.4 Development of oil palm plantations
Oil palm plantations are a special case of agricultural intensification, driven by the big and
growing international demand for palm oil and the resulting high benefit for growers. Oil
palm investments in Liberia are implemented by few big companies, together holding
concessions for over 550,000 ha. To date an estimated 30,000 ha of industrial oil palm
plantations exist. Oil palm plantation development foresees the establishment of out-grower
schemes on approx. 15% of the total developed area. While out-grower schemes have not
yet been established in Liberia, it is a common system in South-east Asia, in particular in
Indonesia. Large scale oil palm development is frequently associated with deforestation and
land use conflicts with the resident population.
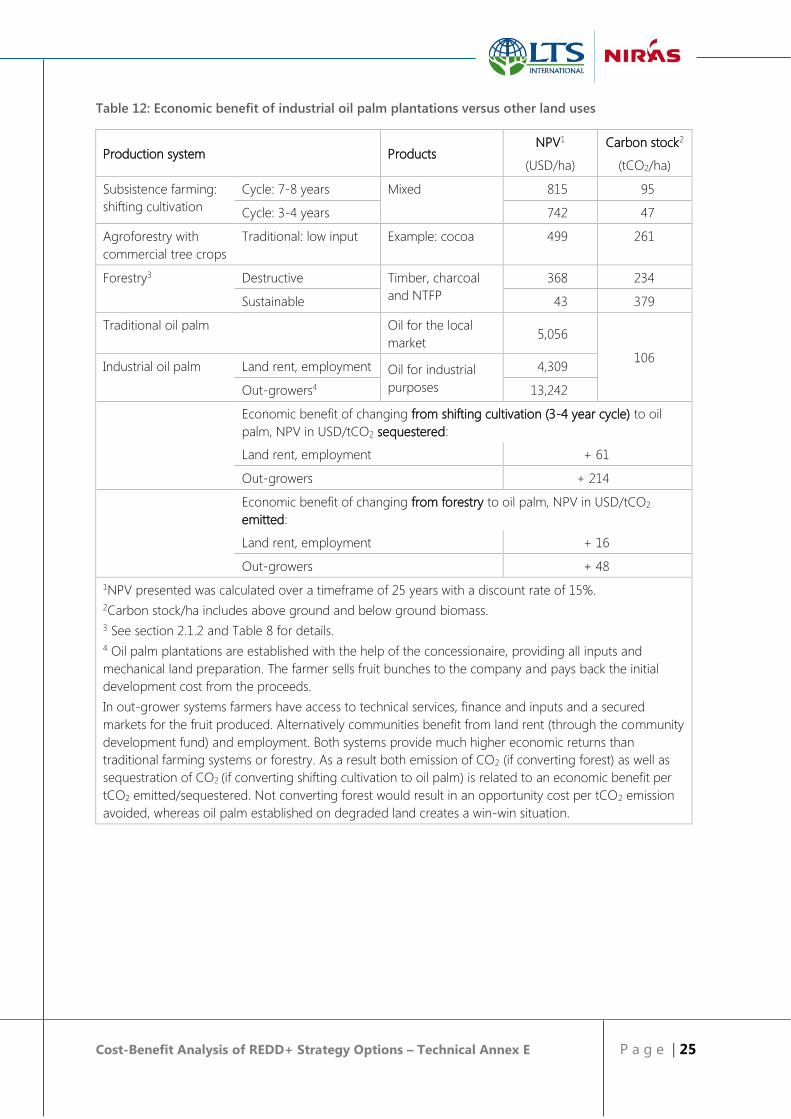
Table 12 provides an overview of economic returns from different land uses, comparing
them to industrial oil palm plantations. Returns to out growers selling the unprocessed fruit
are over 20 times higher than returns from forestry or traditional farming systems. The net-

Cost-Benefit Analysis of REDD+ Strategy Options – Technical Annex E P a g e | 24
benefit to communities from land rent and employment for plantations established by the
concessionaire is lower, but still approx. eight times higher than income from traditional land
uses.
Seen from a purely climate point of view oil palm plantations can be both detrimental and
beneficial, depending on the land use they replace. If replacing forests otherwise used for
timber production up to 270 ton of carbon dioxide will be released. However, if oil palm
plantations are established on non-forest land (forest cover < 30%) carbon will be
sequestered. However, similar to other crops grown at large scale the conversion of mixed
farm/forest land to oil palm will reduce biodiversity and may have negative impacts on
watersheds (erosion, pollution with agro-chemicals etc.).
Oil palm developments can be beneficial if strong environmental and social safeguards are
put into place, amongst them not to convert forest land to oil palm, leaving sufficient
agricultural land for subsistence agriculture and sharing benefits from the oil palm
investment fairly with the communities giving their land to the developer.
Cost-Benefit Analysis of REDD+ Strategy Options – Technical Annex E P a g e | 25
Table 12: Economic benefit of industrial oil palm plantations versus other land uses
Production system Products NPV1 Carbon stock2
(USD/ha) (tCO2/ha)
Subsistence farming:
shifting cultivation
Cycle: 7-8 years Mixed 815 95
Cycle: 3-4 years 742 47
Agroforestry with
commercial tree crops
Traditional: low input Example: cocoa 499 261
Forestry3 Destructive Timber, charcoal
and NTFP
368 234
Sustainable 43 379
Traditional oil palm Oil for the local
market 5,056
106 Industrial oil palm Land rent, employment Oil for industrial
purposes
4,309
Out-growers4 13,242
Economic benefit of changing from shifting cultivation (3-4 year cycle) to oil
palm, NPV in USD/tCO2 sequestered:
Land rent, employment + 61
Out-growers + 214
Economic benefit of changing from forestry to oil palm, NPV in USD/tCO2
emitted:
Land rent, employment + 16
Out-growers + 48
1NPV presented was calculated over a timeframe of 25 years with a discount rate of 15%.
2Carbon stock/ha includes above ground and below ground biomass.
3 See section 2.1.2 and Table 8 for details.
4 Oil palm plantations are established with the help of the concessionaire, providing all inputs and
mechanical land preparation. The farmer sells fruit bunches to the company and pays back the initial
development cost from the proceeds.
In out-grower systems farmers have access to technical services, finance and inputs and a secured
markets for the fruit produced. Alternatively communities benefit from land rent (through the community
development fund) and employment. Both systems provide much higher economic returns than
traditional farming systems or forestry. As a result both emission of CO2 (if converting forest) as well as
sequestration of CO2 (if converting shifting cultivation to oil palm) is related to an economic benefit per
tCO2 emitted/sequestered. Not converting forest would result in an opportunity cost per tCO2 emission
avoided, whereas oil palm established on degraded land creates a win-win situation.
Cost-Benefit Analysis of REDD+ Strategy Options – Technical Annex E P a g e | 26
2.1.5 Comparison of land use change options
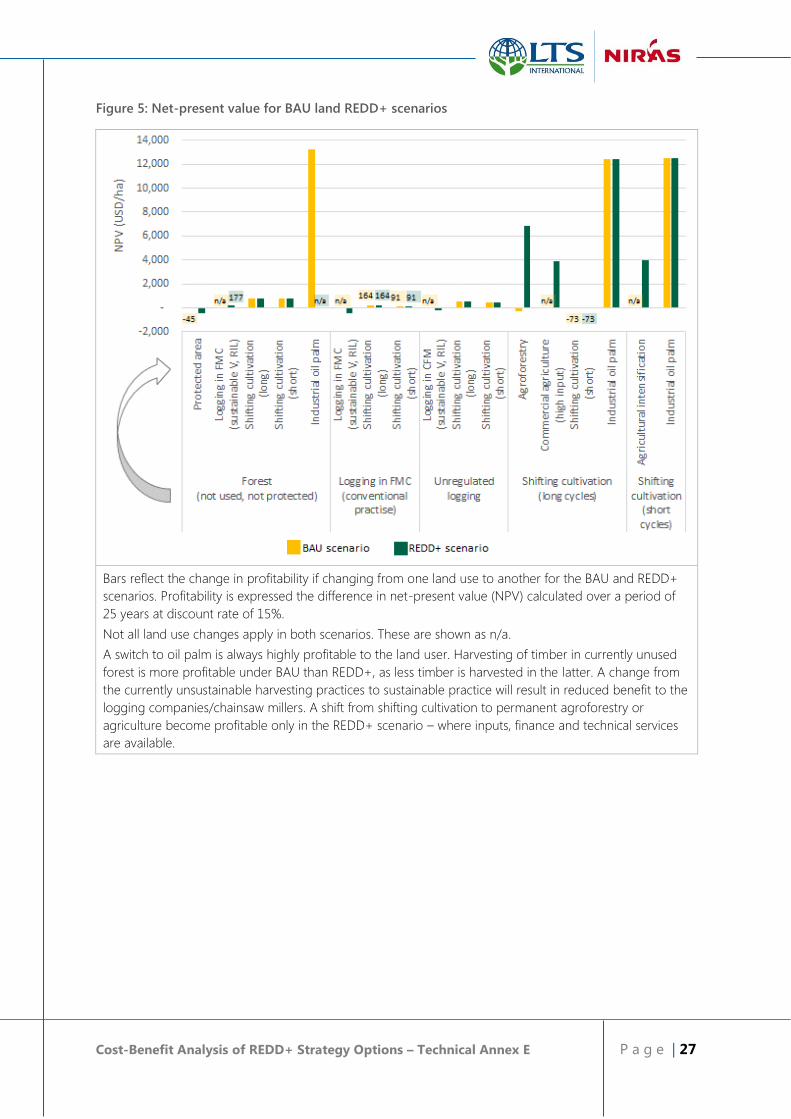
The economic impact of changing land use or management is shown in Figure 5. Land use
changes where the difference between the new land use and the former land use is positive
are beneficial to the land user, i.e. have a positive opportunity cost. If the difference is
negative the change would come at an economic cost to the land user.6
Under BAU all land use changes from forest to some form of agriculture have high
opportunity cost as the NPV for forestry is comparatively low.
The shift from unsustainable forest uses to more sustainable ones comes at a cost to
the land user. That is logging companies and chain saw millers will be allowed to
harvest less timber per hectare and must apply reduced impact logging (RIL)
reducing the profitability of their businesses – while ensuring continued timber use
for future generations.
To protect forest, convert shifting cultivation into permanent
agroforestry/agriculture7, or reduce the time until returning to the same plot of land
come as a cost to the land users in the BAU scenario, i.e. are not attractive to the land
user.
Particular high is the incentive to change from other land uses to industrial oil palm
plantations8 with an opportunity cost of more 12,500 USD/ha.
If agricultural extension and rural financial services, and inputs are available (REDD+)
agroforestry and intensive agriculture become attractive.
6 For example changing from shifting agriculture with long cycles to shorter cycles will result in lower yields and
lower income. The change does not make sense from an economic point of view but may happen anyway due to
population growth and reduced land availability.
7 Example cocoa: currently farmers have very limited access to inputs, technical advice and poor access to
markets. As a result yields and prices per kg cocoa are low, making cocoa farming less profitable than shifting
agriculture. Refer to section 2.1.3 for details.
8 Industrial oil palm refers to oil palm monocultures being part of or linked to oil palm concessions.
Cost-Benefit Analysis of REDD+ Strategy Options – Technical Annex E P a g e | 27
Figure 5: Net-present value for BAU land REDD+ scenarios
Bars reflect the change in profitability if changing from one land use to another for the BAU and REDD+
scenarios. Profitability is expressed the difference in net-present value (NPV) calculated over a period of
25 years at discount rate of 15%.
Not all land use changes apply in both scenarios. These are shown as n/a.
A switch to oil palm is always highly profitable to the land user. Harvesting of timber in currently unused
forest is more profitable under BAU than REDD+, as less timber is harvested in the latter. A change from
the currently unsustainable harvesting practices to sustainable practice will result in reduced benefit to the
logging companies/chainsaw millers. A shift from shifting cultivation to permanent agroforestry or
agriculture become profitable only in the REDD+ scenario – where inputs, finance and technical services
are available.
Cost-Benefit Analysis of REDD+ Strategy Options – Technical Annex E P a g e | 28
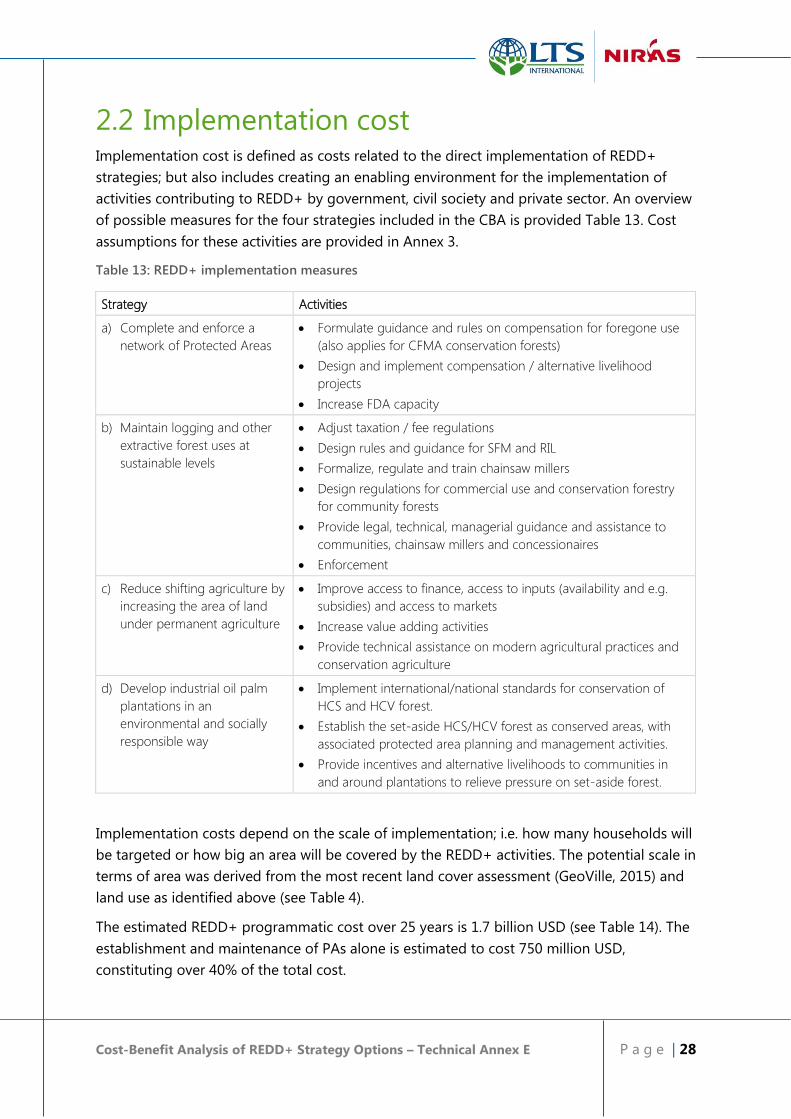
2.2 Implementation cost Implementation cost is defined as costs related to the direct implementation of REDD+
strategies; but also includes creating an enabling environment for the implementation of
activities contributing to REDD+ by government, civil society and private sector. An overview
of possible measures for the four strategies included in the CBA is provided Table 13. Cost
assumptions for these activities are provided in Annex 3.
Table 13: REDD+ implementation measures
Strategy Activities
a) Complete and enforce a
network of Protected Areas
Formulate guidance and rules on compensation for foregone use
(also applies for CFMA conservation forests)
Design and implement compensation / alternative livelihood
projects
Increase FDA capacity
b) Maintain logging and other
extractive forest uses at
sustainable levels
Adjust taxation / fee regulations
Design rules and guidance for SFM and RIL
Formalize, regulate and train chainsaw millers
Design regulations for commercial use and conservation forestry
for community forests
Provide legal, technical, managerial guidance and assistance to
communities, chainsaw millers and concessionaires
Enforcement
c) Reduce shifting agriculture by
increasing the area of land
under permanent agriculture
Improve access to finance, access to inputs (availability and e.g.
subsidies) and access to markets
Increase value adding activities
Provide technical assistance on modern agricultural practices and
conservation agriculture
d) Develop industrial oil palm
plantations in an
environmental and socially
responsible way
Implement international/national standards for conservation of
HCS and HCV forest.
Establish the set-aside HCS/HCV forest as conserved areas, with
associated protected area planning and management activities.
Provide incentives and alternative livelihoods to communities in
and around plantations to relieve pressure on set-aside forest.
Implementation costs depend on the scale of implementation; i.e. how many households will
be targeted or how big an area will be covered by the REDD+ activities. The potential scale in
terms of area was derived from the most recent land cover assessment (GeoVille, 2015) and
land use as identified above (see Table 4).
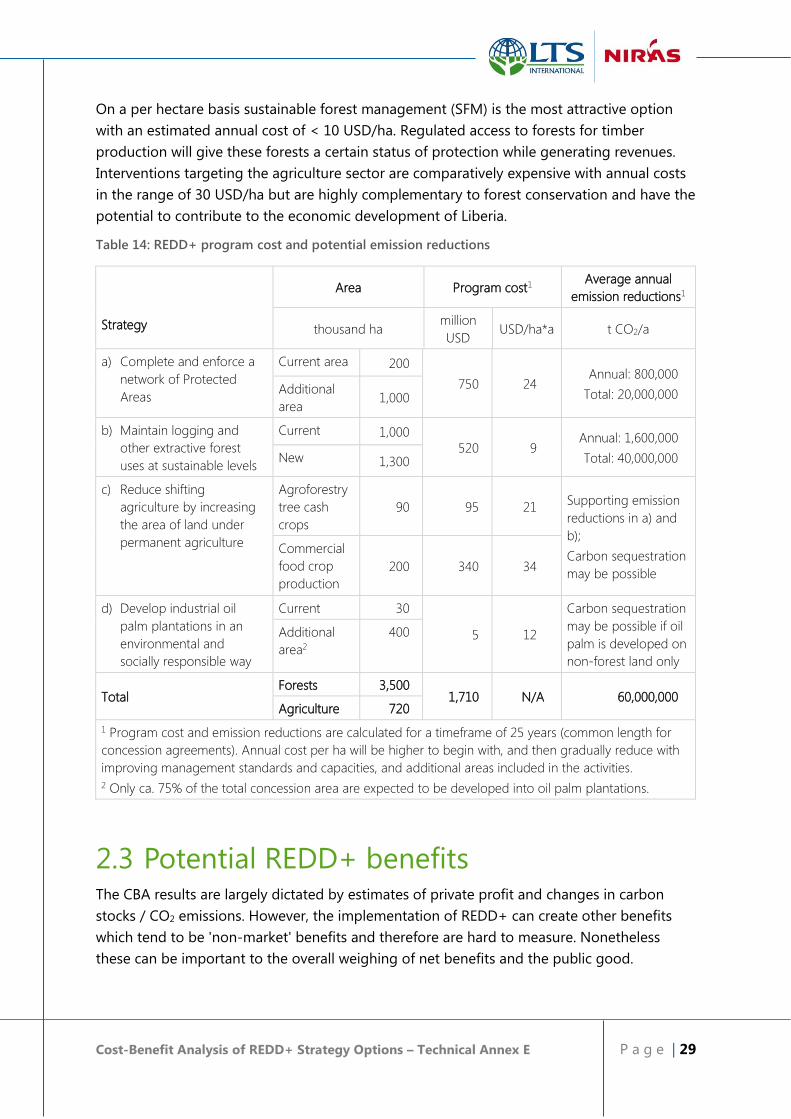
The estimated REDD+ programmatic cost over 25 years is 1.7 billion USD (see Table 14). The
establishment and maintenance of PAs alone is estimated to cost 750 million USD,
constituting over 40% of the total cost.
Cost-Benefit Analysis of REDD+ Strategy Options – Technical Annex E P a g e | 29
On a per hectare basis sustainable forest management (SFM) is the most attractive option
with an estimated annual cost of < 10 USD/ha. Regulated access to forests for timber
production will give these forests a certain status of protection while generating revenues.
Interventions targeting the agriculture sector are comparatively expensive with annual costs
in the range of 30 USD/ha but are highly complementary to forest conservation and have the
potential to contribute to the economic development of Liberia.
Table 14: REDD+ program cost and potential emission reductions
Strategy
Area Program cost1 Average annual
emission reductions1
thousand ha million
USD USD/ha*a t CO2/a
a) Complete and enforce a
network of Protected
Areas
Current area 200
750 24 Annual: 800,000
Total: 20,000,000 Additional
area 1,000
b) Maintain logging and
other extractive forest
uses at sustainable levels
Current 1,000
520 9 Annual: 1,600,000
Total: 40,000,000 New 1,300
c) Reduce shifting
agriculture by increasing
the area of land under
permanent agriculture
Agroforestry
tree cash
crops
90 95 21 Supporting emission
reductions in a) and
b);
Carbon sequestration
may be possible
Commercial
food crop
production
200 340 34
d) Develop industrial oil
palm plantations in an
environmental and
socially responsible way
Current 30
5 12
Carbon sequestration
may be possible if oil
palm is developed on
non-forest land only
Additional
area2
400
Total Forests 3,500
1,710 N/A 60,000,000 Agriculture 720
1 Program cost and emission reductions are calculated for a timeframe of 25 years (common length for
concession agreements). Annual cost per ha will be higher to begin with, and then gradually reduce with
improving management standards and capacities, and additional areas included in the activities.
2 Only ca. 75% of the total concession area are expected to be developed into oil palm plantations.
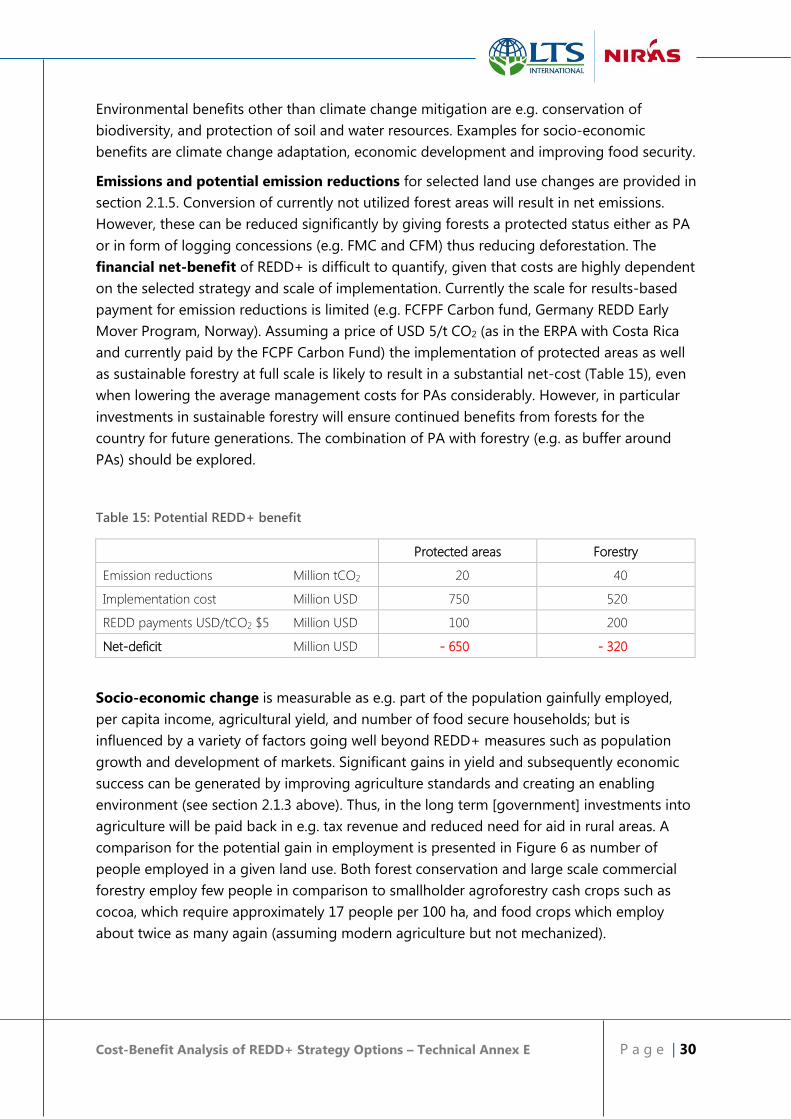
2.3 Potential REDD+ benefits The CBA results are largely dictated by estimates of private profit and changes in carbon
stocks / CO2 emissions. However, the implementation of REDD+ can create other benefits
which tend to be 'non-market' benefits and therefore are hard to measure. Nonetheless
these can be important to the overall weighing of net benefits and the public good.
Cost-Benefit Analysis of REDD+ Strategy Options – Technical Annex E P a g e | 30
Environmental benefits other than climate change mitigation are e.g. conservation of
biodiversity, and protection of soil and water resources. Examples for socio-economic
benefits are climate change adaptation, economic development and improving food security.
Emissions and potential emission reductions for selected land use changes are provided in
section 2.1.5. Conversion of currently not utilized forest areas will result in net emissions.
However, these can be reduced significantly by giving forests a protected status either as PA
or in form of logging concessions (e.g. FMC and CFM) thus reducing deforestation. The
financial net-benefit of REDD+ is difficult to quantify, given that costs are highly dependent
on the selected strategy and scale of implementation. Currently the scale for results-based
payment for emission reductions is limited (e.g. FCFPF Carbon fund, Germany REDD Early
Mover Program, Norway). Assuming a price of USD 5/t CO2 (as in the ERPA with Costa Rica
and currently paid by the FCPF Carbon Fund) the implementation of protected areas as well
as sustainable forestry at full scale is likely to result in a substantial net-cost (Table 15), even
when lowering the average management costs for PAs considerably. However, in particular
investments in sustainable forestry will ensure continued benefits from forests for the
country for future generations. The combination of PA with forestry (e.g. as buffer around
PAs) should be explored.
Table 15: Potential REDD+ benefit
Protected areas Forestry
Emission reductions Million tCO2 20 40
Implementation cost Million USD 750 520
REDD payments USD/tCO2 $5 Million USD 100 200
Net-deficit Million USD - 650 - 320
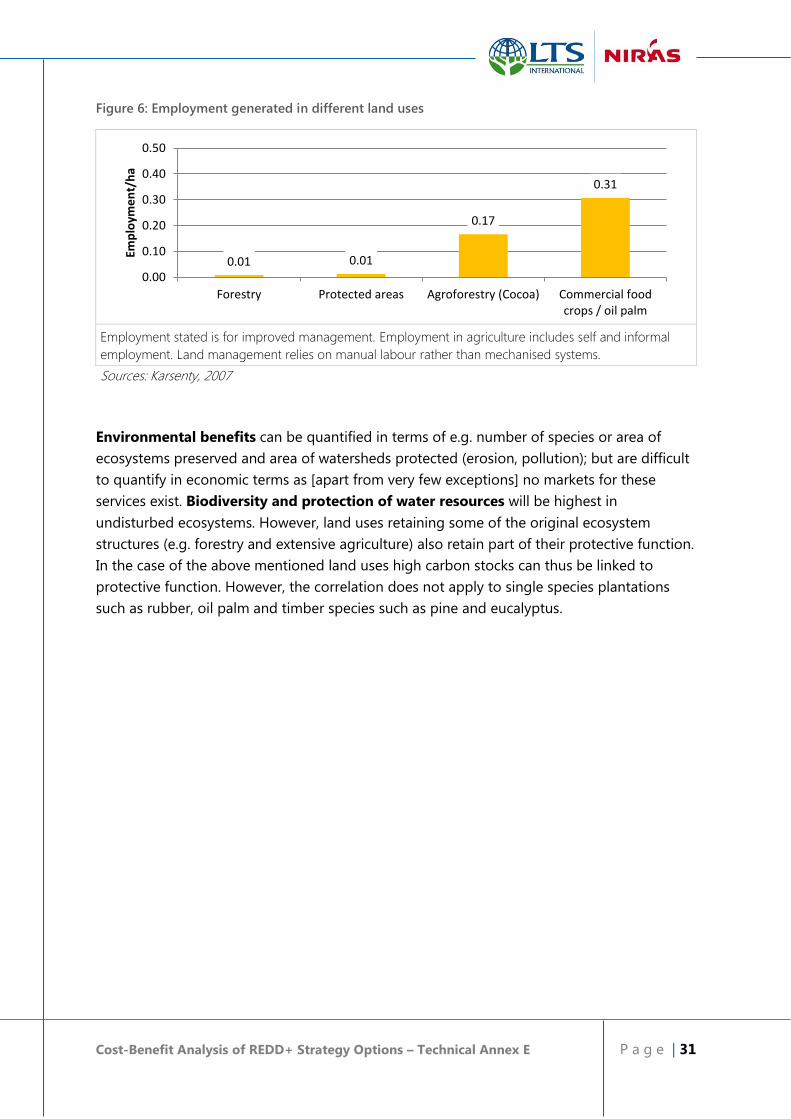
Socio-economic change is measurable as e.g. part of the population gainfully employed,
per capita income, agricultural yield, and number of food secure households; but is
influenced by a variety of factors going well beyond REDD+ measures such as population
growth and development of markets. Significant gains in yield and subsequently economic
success can be generated by improving agriculture standards and creating an enabling
environment (see section 2.1.3 above). Thus, in the long term [government] investments into
agriculture will be paid back in e.g. tax revenue and reduced need for aid in rural areas. A
comparison for the potential gain in employment is presented in Figure 6 as number of
people employed in a given land use. Both forest conservation and large scale commercial
forestry employ few people in comparison to smallholder agroforestry cash crops such as
cocoa, which require approximately 17 people per 100 ha, and food crops which employ
about twice as many again (assuming modern agriculture but not mechanized).
Cost-Benefit Analysis of REDD+ Strategy Options – Technical Annex E P a g e | 31
Figure 6: Employment generated in different land uses
Employment stated is for improved management. Employment in agriculture includes self and informal
employment. Land management relies on manual labour rather than mechanised systems.
Sources: Karsenty, 2007
Environmental benefits can be quantified in terms of e.g. number of species or area of
ecosystems preserved and area of watersheds protected (erosion, pollution); but are difficult
to quantify in economic terms as [apart from very few exceptions] no markets for these
services exist. Biodiversity and protection of water resources will be highest in
undisturbed ecosystems. However, land uses retaining some of the original ecosystem
structures (e.g. forestry and extensive agriculture) also retain part of their protective function.
In the case of the above mentioned land uses high carbon stocks can thus be linked to
protective function. However, the correlation does not apply to single species plantations
such as rubber, oil palm and timber species such as pine and eucalyptus.
0.01 0.01
0.17
0.31
0.00
0.10
0.20
0.30
0.40
0.50
Forestry Protected areas Agroforestry (Cocoa) Commercial foodcrops / oil palm
Employm
ent/ha

Cost-Benefit Analysis of REDD+ Strategy Options – Technical Annex E P a g e | 32
3. Conclusions
3.1 Conclusions from Cost-Benefit Analysis on
REDD+ strategy options Strategic priority 1: Reduce shifting agriculture by increasing the area of land under
permanent agriculture
Improved management of agricultural land will result in a clear net gain to farmers /
investors. Additionally, agroforestry if implemented on degraded land has the potential to
sequester carbon. Improved management of annual crops and related yield gains will
contribute to reducing pressure on forests. However, considerable public sector investment
will be required to change agricultural practices in Liberia.
Strategic priority 2: Maintain logging and other extractive forest uses at sustainable
levels
Similar to forests in protected areas, sustainably managed forests can store a lot of carbon
per ha and retain many of the other values inherent to natural forest (e.g. biodiversity and
water shed protection). Contrary to PAs, commercial forestry does create revenues making it
very suitable to private sector involvement both at small (CFM) and large scale (e.g. FMC).
Additionally the financial burden of the government for implementation of sustainable forest
management is considerably lower than forest conservation.
Strategic Priority 3: Complete and enforce a network of Protected Areas
Both carbon stock per ha and up-scaling potential are high, putting PAs high on the list of
REDD+ strategy options. However, effective PAs in Liberia will be costly to establish and
manage and do not collect revenues (other than potential REDD+ payments).
Strategic Priority 4: Develop industrial oil palm plantations in an environmentally and
socially responsible way
Industrial oil palm developments can be beneficial for the country, provided that forest land
and sensitive areas (e.g. near streams, wetlands) are excluded from development and that
communities within the concession area truly benefit from the development be that as out-
Cost-Benefit Analysis of REDD+ Strategy Options – Technical Annex E P a g e | 33
growers, through employment or in the form of community benefits. Communities should
always retain enough farmland to ensure their livelihoods.
3.2 Recommendations for REDD+ strategy
development Potential REDD payments cannot not cover all investments and costs envisioned in the
REDD+ strategy. Additionally, funding sources to meet these costs cannot, at this stage, be
fully identified. The bi-lateral agreement with Norway for results-based payments provides
one important source, and income from voluntary carbon credit schemes are likely within the
next five years, although on a small scale. Accordingly, the potential REDD+ payments can
only be seen as a trigger for a REDD+ friendly development pathway for the forestry and
agricultural sectors, rather than the sole means to it.
REDD+ investments must be prioritized weighing the potential GHG emission
reductions, cost of interventions and likely impact on the socio-economic development
potential of Liberia. For example sustainable forest management comes at low public cost
(but high private sector cost) and can generate substantial GHG emission reductions in
comparison to e.g. agriculture. Stimulating agroforestry crops as an alternative to shifting
cultivation requires significant public expenditure but also creates multiple benefits –
contributing to reduced deforestation and carbon sequestration and economic development
in rural areas.
Effectively managed protected areas can be very expensive. Cost efficiency can be
improved by concentrating PAs on large areas. Wherever possible alternative revenue
streams (e.g. biodiversity) should be identified.
Sustainable forest use can be a mechanism for forest protection. SFM should be seen as
an alternative and/or complementary approach to PAs, with the combination likely being less
costly. However, if SFM is to have a protective function it must be supported by better
regulations, enforcement and alternative livelihoods for people relying on forests (similar to
PAs).
Private sector will carry a large share of the financial burden of implementing SFM, in
particular in terms of reducing annual allowable cut to a sustainable rate. To support
the transition from current logging practices to more sustainable ones, more and better
evidence regarding the impact of different logging practices on long term sustainability of
forestry must be generated.
Agricultural intensification (including oil palm) increases profit per unit of land and can
reduce the need for agricultural expansion if combined with effective land use planning and
a better legal framework and its enforcement.

Cost-Benefit Analysis of REDD+ Strategy Options – Technical Annex E P a g e | 34
The burden on REDD+ finance can be reduced by increasing reliance on private sector
in the outreach to farmers.
Community forestry is gaining increasing attention. However, it is not a panacea and
lessons learned from African community forest management must be taken into account.
Considerable investment in capacity development will be required and a simple but effective
standard for CFM must be developed.
Lastly, the scenarios presented here must be constantly revised and adapted as
new/more information becomes available as a basis for adjustments to the REDD+ strategy.

Cost-Benefit Analysis of REDD+ Strategy Options – Technical Annex E P a g e | 35
Annexes
Annex 1: Literature cited
Annex 2: Assumptions land use models
Annex 3: Assumptions implementation cost
Annex 4: Average carbon stocks for different land uses
Annex 5: Land use and carbon stock changes with REDD+
Annex 6: GHG emissions and removals for land cover classes for
BAU and REDD+

Cost-Benefit Analysis of REDD+ Strategy Options – Technical Annex E P a g e | 36
Annex 1: Literature cited
ADB 2012: Liberia: Maryland Oil Palm Plantation Project. Project SAP number: P-LR-AAG-001.
Summary of the Environment and Social Impact Assessment (ESIA)
Buchanan Renewables 2012: Overview of Harvesting Non Productive Rubber Trees &
Charcoal Production in Liberia.
Carodenuto S, Merger E, Essomba E, Panev M, Pistorius T, Amougou J, 2015: A
Methodological Framework for Assessing Agents, Proximate Drivers and Underlying Causes
of Deforestation: Field Test Results from Southern Cameroon. Forests 2015, 6, 203-224.
CI and ArcelorMittal, 2015: Sehtontuo Conservation Agreement to protect the East Nimba
nature reserve and surrounding forests.
FAO 1987: Simple technologies for charcoal making. FAO forestry paper 41.
http://www.fao.org/docrep/x5328e/x5328e00.htm#Contents
FDA 2007: Ten core regulations.
FDA 2009: Chainsaw Logging in Liberia: An Analysis of Chainsaw Logging (Pit-Sawing) in the
Natural Forests of Liberia Towards a more Sustainable Production. Final report.
FFI 2013: REDD+ Wonegizi Agro-Ecology Report for the project Empowering grassroots
capacity for REDD+ development. Unpublished.
FFI 2014: Review of Smallholder Models: Liberia and Sierra Leone. Compiled by Rob Small,
Programme Manager, Agricultural Landscapes.
GoL LISGIS 2008: 2008 National population and housing census: preliminary results. Liberia
Institute of Statistics and Geo-Information Services.
GoL 2010: Liberia Agriculture Investment Program (LASIP) report. Prepared for the
Comprehensive African Agriculture Development Program (CAADP).
GoL 2012: Readiness Preparation Proposal (R-PP) for the Republic of Liberia.
GoL and EC, 2001: Farm Management Survey of Liberian Smallholder Tree and Food Crops.
Resettlement and Reintegration Programme of the Second Liberia Rehabilitation
Programme. Government of Liberia and European Commission.
GoL MoA 2007: Comprehensive assessment of the agricultural sector in Liberia. Volume 2.1.
sub-sector report.
GoL: National Export Strategy: Cocoa Export Strategy 2014-2018.
GVL 2010: Concession Agreement Between Golden Veroleum Liberia and the Government of
the Republic of Liberia. Available at: http://goldenveroleumliberia.com/
Cost-Benefit Analysis of REDD+ Strategy Options – Technical Annex E P a g e | 37
IPCC 2006: 2006 IPCC Guidelines for National Greenhouse Gas Inventories. Volume 4:
Agriculture, Forestry and Other Land Use.
Karsenty A, 2007: Overview of Industrial Forest Concessions and Concession-based Industry
in Central and West Africa and Considerations of Alternatives. Prepared for the Rights and
Resources Group. CIRAD
Lawrence K, Niesten E, Werker E, 2009: Economic Analysis of a Low Carbon Economy for
Liberia.
Ofosu-Budu, K, Sarpong D 2013: Oil palm industry growth in Africa: A value chain and
smallholders study for Ghana. In: Rebuilding West Africa’s Food Potential, A. Elbehri (ed.),
FAO/IFAD.
SGS 2015: Monthly revenue report August 2015 for the project Establishing and Operating a
Timber Legality Verification Department (LVD) within Liberia’s Forestry Development
Authority (FDA) and Building Capacity within FDA.
Shearman PL 2009: An Assessment of Liberian Forest Area, Dynamics, FDA Concession Plans,
and their Relevance to Revenue Projections. Commissioned by Green Advocates, Monrovia,
Liberia.
USAID 2009: Attachement II to the Global food security response West Africa rice value chain
analysis: Liberia rice study. Micro report # 157
USAID 2009: development of non-timber forest products in Sinoe and Nimba counties. Land
Rights and Community Forestry Program (LRCFP).
USAID 2013: Forest concessions - Commercial forest revenue projections. Final report.
USAID 2015: Liberia market study for selected agricultural products. Enabling Agricultural
Trade (EAT) project.
van der Plas R 2011: Liberia Project Identification Sustainable Charcoal Supply Chain. EUEI
PDF.
WB 2012: Liberia forest sec-tor diagnostic: results of a diagnostic on advances and learning
from Liberia’s six years of experience in forest sector reform.

Cost-Benefit Analysis of REDD+ Strategy Options – Technical Annex E P a g e | 38
Annex 2: Assumptions land use models
a) Complete and enforce a network of Protected Areas
Costs current PA management
Item Value
Current FDA funding conservation department 900,000 USD/yr
Area currently managed by FDA 289,112 ha
Management cost per ha 3 USD/ha*yr
Source: FDA budget 2015/2016
Costs East Nimba Nature Reserve (ENNR) management
Item Value
Management cost 220,000 USD/yr
Conservation agreements with communities 5,000 USD/agreement
# of conservation agreements 24
ENNR management cost per ha 29 USD/ha*yr
Source: personal communication CI and ArcelorMittal
Existing protected areas
Protected area Area
East Nimba Nature Reserve (ENNR) 11,553
Sapo NP 180,400
Lake Piso 97,159
Total 289,112

Cost-Benefit Analysis of REDD+ Strategy Options – Technical Annex E P a g e | 39
b) Maintain logging and other extractive forest uses at sustainable levels
Forest management concessions – general input values
Item Cost / revenue Source Comments / assumptions
Contract fee 1,000 USD/contract*yr FDA 2007: Regulations
Area fee FMC 2.5 USD/ha*yr FDA 2007: Regulations Applicable to the total
concession area
Coupe
inspection fee
0.5 USD/ha*yr FDA 2007: Regulations Applicable to the operational
area
Waybill fee 0.25 USD/m³ FDA 2007: Regulations Applies to contracts covered
by CoC system only
Export license
fee
100 USD/shipment FDA 2007: Regulations
Log export fee 5 % of USD/m³ FDA 2007: Regulations 2.5-10% of FOB price per
class
Log stumpage
fee
5 % of USD/m³ USAID 2013: Commercial
forest revenue
projections
Based on stumpage value, i.e.
the FOB minus all operational
cost; 2.5-10% of FOB price
per class
Community
benefit
1.5 USD/m³ USAID 2013: Commercial
forest revenue
projections
CoC fee 1.4 % of USD/m³ USAID 2013: Commercial
forest revenue
projections
Of FOB
Bid premium 4.7 USD/ha*yr SGS 2015
Tax burden
harvested
timber
106 USD/m³ USAID 2013: Commercial
forest revenue
projections
Tax burden
exported
timber
172 USD/m³ USAID 2013: Commercial
forest revenue
projections
Port handling
charges
20 USD/m³ USAID 2013: Commercial
forest revenue
projections
Operational
and overhead
cost1
110 USD/m³ USAID 2013: Commercial
forest revenue
projections
Average value
FOB average 204 USD/m³ SGS 2015
1 Includes harvest, transport and overhead cost not covered otherwise.
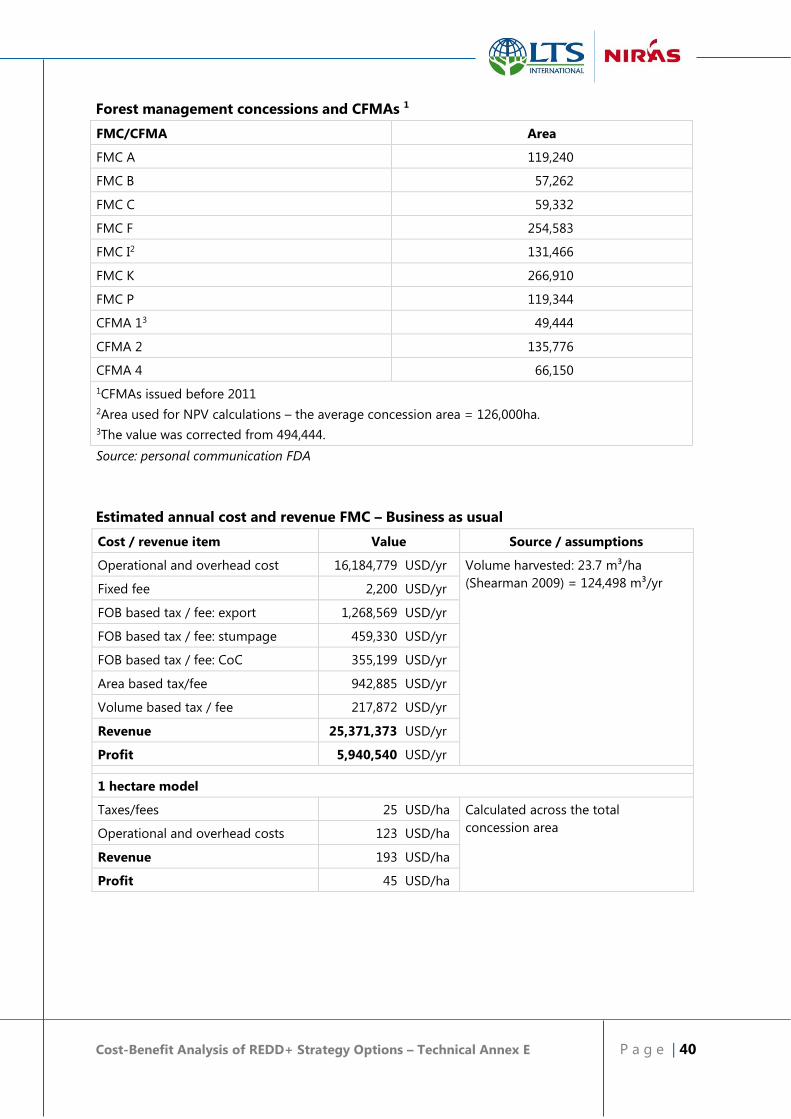
Cost-Benefit Analysis of REDD+ Strategy Options – Technical Annex E P a g e | 40
Forest management concessions and CFMAs 1
FMC/CFMA Area
FMC A 119,240
FMC B 57,262
FMC C 59,332
FMC F 254,583
FMC I2 131,466
FMC K 266,910
FMC P 119,344
CFMA 13 49,444
CFMA 2 135,776
CFMA 4 66,150
1CFMAs issued before 2011
2Area used for NPV calculations – the average concession area = 126,000ha.
3The value was corrected from 494,444.
Source: personal communication FDA
Estimated annual cost and revenue FMC – Business as usual
Cost / revenue item Value Source / assumptions
Operational and overhead cost 16,184,779 USD/yr Volume harvested: 23.7 m³/ha
(Shearman 2009) = 124,498 m³/yr Fixed fee 2,200 USD/yr
FOB based tax / fee: export 1,268,569 USD/yr
FOB based tax / fee: stumpage 459,330 USD/yr
FOB based tax / fee: CoC 355,199 USD/yr
Area based tax/fee 942,885 USD/yr
Volume based tax / fee 217,872 USD/yr
Revenue 25,371,373 USD/yr
Profit 5,940,540 USD/yr
1 hectare model
Taxes/fees 25 USD/ha Calculated across the total
concession area Operational and overhead costs 123 USD/ha
Revenue 193 USD/ha
Profit 45 USD/ha
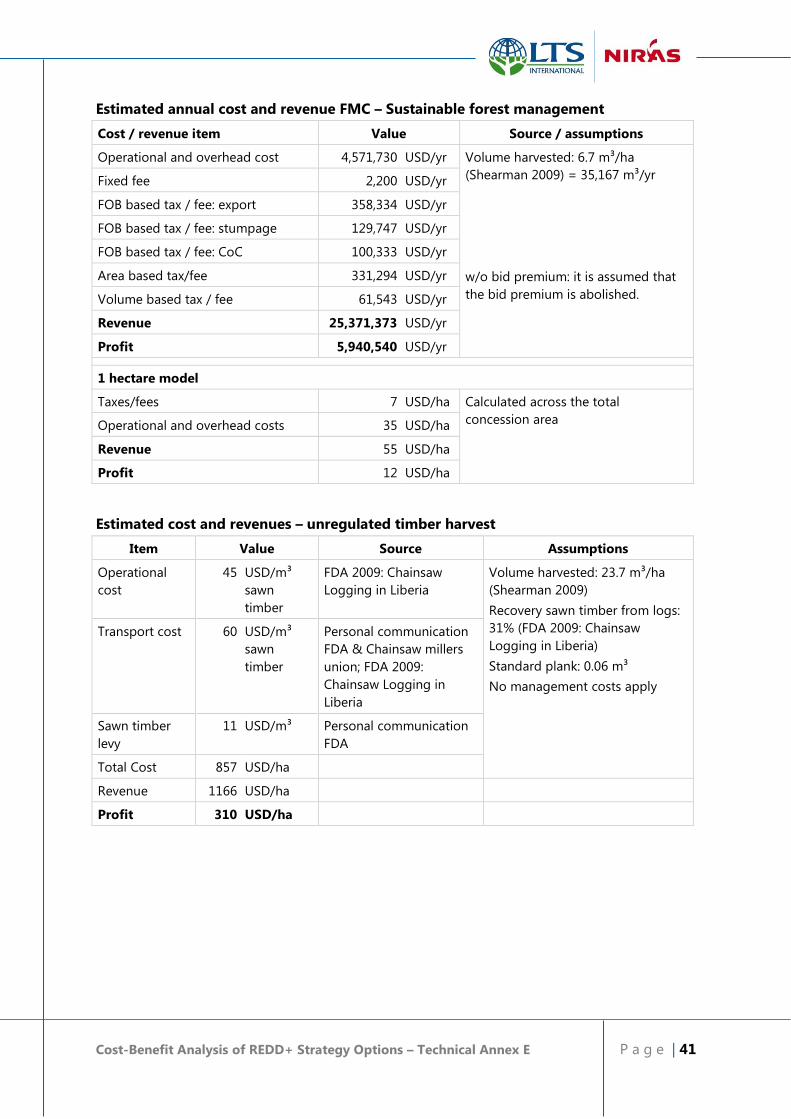
Cost-Benefit Analysis of REDD+ Strategy Options – Technical Annex E P a g e | 41
Estimated annual cost and revenue FMC – Sustainable forest management
Cost / revenue item Value Source / assumptions
Operational and overhead cost 4,571,730 USD/yr Volume harvested: 6.7 m³/ha
(Shearman 2009) = 35,167 m³/yr
w/o bid premium: it is assumed that
the bid premium is abolished.
Fixed fee 2,200 USD/yr
FOB based tax / fee: export 358,334 USD/yr
FOB based tax / fee: stumpage 129,747 USD/yr
FOB based tax / fee: CoC 100,333 USD/yr
Area based tax/fee 331,294 USD/yr
Volume based tax / fee 61,543 USD/yr
Revenue 25,371,373 USD/yr
Profit 5,940,540 USD/yr
1 hectare model
Taxes/fees 7 USD/ha Calculated across the total
concession area Operational and overhead costs 35 USD/ha
Revenue 55 USD/ha
Profit 12 USD/ha
Estimated cost and revenues – unregulated timber harvest
Item Value Source Assumptions
Operational
cost
45 USD/m³
sawn
timber
FDA 2009: Chainsaw
Logging in Liberia
Volume harvested: 23.7 m³/ha
(Shearman 2009)
Recovery sawn timber from logs:
31% (FDA 2009: Chainsaw
Logging in Liberia)
Standard plank: 0.06 m³
No management costs apply
Transport cost 60 USD/m³
sawn
timber
Personal communication
FDA & Chainsaw millers
union; FDA 2009:
Chainsaw Logging in
Liberia
Sawn timber
levy
11 USD/m³ Personal communication
FDA
Total Cost 857 USD/ha
Revenue 1166 USD/ha
Profit 310 USD/ha
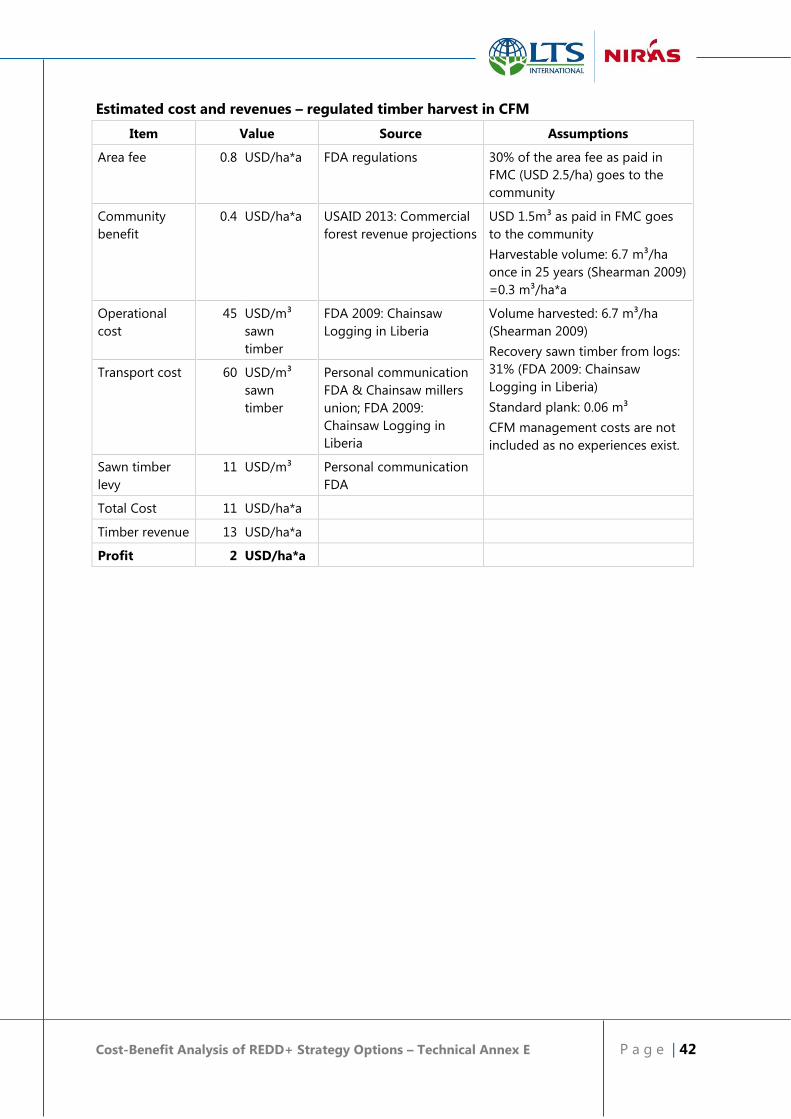
Cost-Benefit Analysis of REDD+ Strategy Options – Technical Annex E P a g e | 42
Estimated cost and revenues – regulated timber harvest in CFM
Item Value Source Assumptions
Area fee 0.8 USD/ha*a FDA regulations 30% of the area fee as paid in
FMC (USD 2.5/ha) goes to the
community
Community
benefit
0.4 USD/ha*a USAID 2013: Commercial
forest revenue projections
USD 1.5m³ as paid in FMC goes
to the community
Harvestable volume: 6.7 m³/ha
once in 25 years (Shearman 2009)
=0.3 m³/ha*a
Operational
cost
45 USD/m³
sawn
timber
FDA 2009: Chainsaw
Logging in Liberia
Volume harvested: 6.7 m³/ha
(Shearman 2009)
Recovery sawn timber from logs:
31% (FDA 2009: Chainsaw
Logging in Liberia)
Standard plank: 0.06 m³
CFM management costs are not
included as no experiences exist.
Transport cost 60 USD/m³
sawn
timber
Personal communication
FDA & Chainsaw millers
union; FDA 2009:
Chainsaw Logging in
Liberia
Sawn timber
levy
11 USD/m³ Personal communication
FDA
Total Cost 11 USD/ha*a
Timber revenue 13 USD/ha*a
Profit 2 USD/ha*a
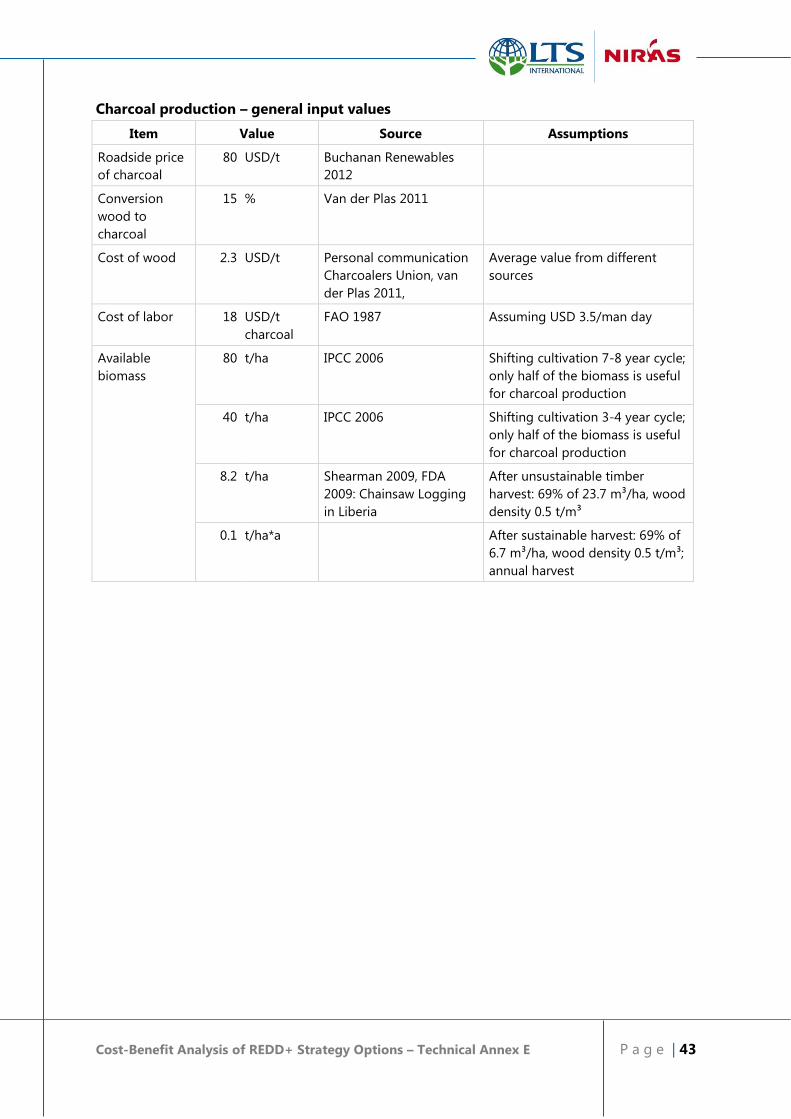
Cost-Benefit Analysis of REDD+ Strategy Options – Technical Annex E P a g e | 43
Charcoal production – general input values
Item Value Source Assumptions
Roadside price
of charcoal
80 USD/t Buchanan Renewables
2012
Conversion
wood to
charcoal
15 % Van der Plas 2011
Cost of wood 2.3 USD/t Personal communication
Charcoalers Union, van
der Plas 2011,
Average value from different
sources
Cost of labor 18 USD/t
charcoal
FAO 1987 Assuming USD 3.5/man day
Available
biomass
80 t/ha IPCC 2006 Shifting cultivation 7-8 year cycle;
only half of the biomass is useful
for charcoal production
40 t/ha IPCC 2006 Shifting cultivation 3-4 year cycle;
only half of the biomass is useful
for charcoal production
8.2 t/ha Shearman 2009, FDA
2009: Chainsaw Logging
in Liberia
After unsustainable timber
harvest: 69% of 23.7 m³/ha, wood
density 0.5 t/m³
0.1 t/ha*a After sustainable harvest: 69% of
6.7 m³/ha, wood density 0.5 t/m³;
annual harvest
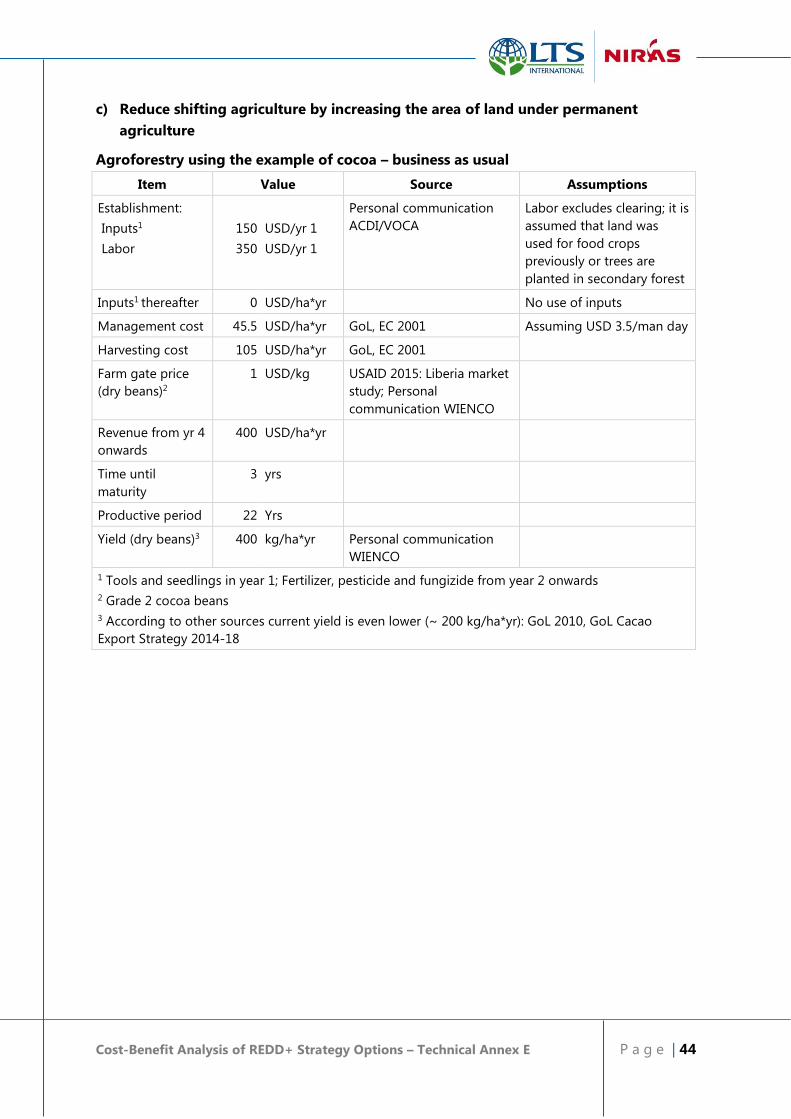
Cost-Benefit Analysis of REDD+ Strategy Options – Technical Annex E P a g e | 44
c) Reduce shifting agriculture by increasing the area of land under permanent
agriculture
Agroforestry using the example of cocoa – business as usual
Item Value Source Assumptions
Establishment:
Inputs1
Labor
150
350
USD/yr 1
USD/yr 1
Personal communication
ACDI/VOCA
Labor excludes clearing; it is
assumed that land was
used for food crops
previously or trees are
planted in secondary forest
Inputs1 thereafter 0 USD/ha*yr No use of inputs
Management cost 45.5 USD/ha*yr GoL, EC 2001 Assuming USD 3.5/man day
Harvesting cost 105 USD/ha*yr GoL, EC 2001
Farm gate price
(dry beans)2
1 USD/kg USAID 2015: Liberia market
study; Personal
communication WIENCO
Revenue from yr 4
onwards
400 USD/ha*yr
Time until
maturity
3 yrs
Productive period 22 Yrs
Yield (dry beans)3 400 kg/ha*yr Personal communication
WIENCO
1 Tools and seedlings in year 1; Fertilizer, pesticide and fungizide from year 2 onwards
2 Grade 2 cocoa beans
3 According to other sources current yield is even lower (~ 200 kg/ha*yr): GoL 2010, GoL Cacao
Export Strategy 2014-18

Cost-Benefit Analysis of REDD+ Strategy Options – Technical Annex E P a g e | 45
Agroforestry using the example of cocoa – improved management
Item Value Source Assumptions
Establishment:
Inputs1
Labor
650
350
USD/yr 1
USD/yr 1
Personal communication
ACDI/VOCA
Improved seedling material
Labor excludes clearing; it is
assumed that land was
used for food crops
previously or trees are
planted in secondary forest
Inputs1 thereafter 250 USD/ha*yr Personal communication
WIENCO and ACDI/VOCA
Management cost 140 USD/ha*yr GoL, EC 2001 Assuming USD 3.5/man day
Harvesting cost 315 USD/ha*yr GoL, EC 2001
Farmgate price
(dry beans)2
1.5 USD/kg USAID 2015: Liberia market
study; FFI 2014
Better management,
harvesting and processing
practices lead to
improvement in quality
Revenue from yr 4
onwards
1,500 USD/ha*yr
Time until
maturity
3 yrs
Productive period 22 yrs
Yield (dry beans) 1,000 kg/ha*yr Personal communication
WIENCO
1 Tools and seedlings; fertilizer, pesticide and fungizide are applied from year 1 onwards
2 Grade 1 cocoa beans
Commercial food crops using the example of upland rice – business as usual
Item Value Source Assumptions
Labor cost 278 USD/ha USAID 2009: Liberia rice
study
No use of inputs
Shifting cultivation, 3 yr
cycle: only 1/3 of cost
applies for 1 ha model
Farm gate price
(rough rice)
0.4 USD/kg Personal communication
FED and Nimba County
Agricultural Office
Yield (rough rice) 800 kg/ha USAID 2009: Liberia rice
study
Shifting cultivation, 3 yr
cycle: only 1/3 of the yield
applies for 1 ha model
Profit 14 USD/ha*yr

Cost-Benefit Analysis of REDD+ Strategy Options – Technical Annex E P a g e | 46
Commercial food crops using the example of upland rice – improved management
Item Value Source Assumptions
Production cost 474 USD/ha Personal communication
FED
Includes land clearing,
management and harvest
Using improved seed and
fertilizer
Farm gate price
(rough rice)
0.4 USD/kg Personal communication
FED and Nimba County
Agricultural Office
Yield (rough rice) 2,000 kg/ha USAID 2009: Liberia rice
study
Profit 326 USD/ha*yr
Oil palm – traditional management, incl. processing to palm oil
Item Value Source Assumptions
Establishment:
Inputs
Labor
0
154
USD/yr 1
USD/yr 1
Personal communication
ACDI/VOCA and GROW,
UNIQUE expert estimate
from West Africa
Dura variety, wild seedlings
and no input = 0
Assuming USD 3.5/man day
Management cost
yr 2 and 3
210 USD/ha*yr GoL, EC 2001 Assuming USD 3.5/man day
Management cost
yr 3 onwards
175 USD/ha*yr GoL, EC 2001
Harvesting cost 70 USD/ha*yr GoL, EC 2001
Processing of fruit 245 USD/ha*yr GoL, EC 2001; Ofosu-Budu
et al 2013
Manual processing of fruit
Product price:
palm oil
1.2 USD/l USAID 2015: Liberia market
study; USAID 2009: NTFP
Palm oil/fruit 0.2 l/kg FFI 2014
Revenue from yr 5
onwards
1,017 USD/ha*yr
Time until
maturity
4 yrs Personal communication
ACDI/VOCA and GROW
Productive period 21 Yrs
Yield (FFB) 4,000 kg/ha*yr GoL, EC 2001: 6,000
kg/ha*yr
Ofosu-Budu et al 2013:
2,000 kg/ha*yr
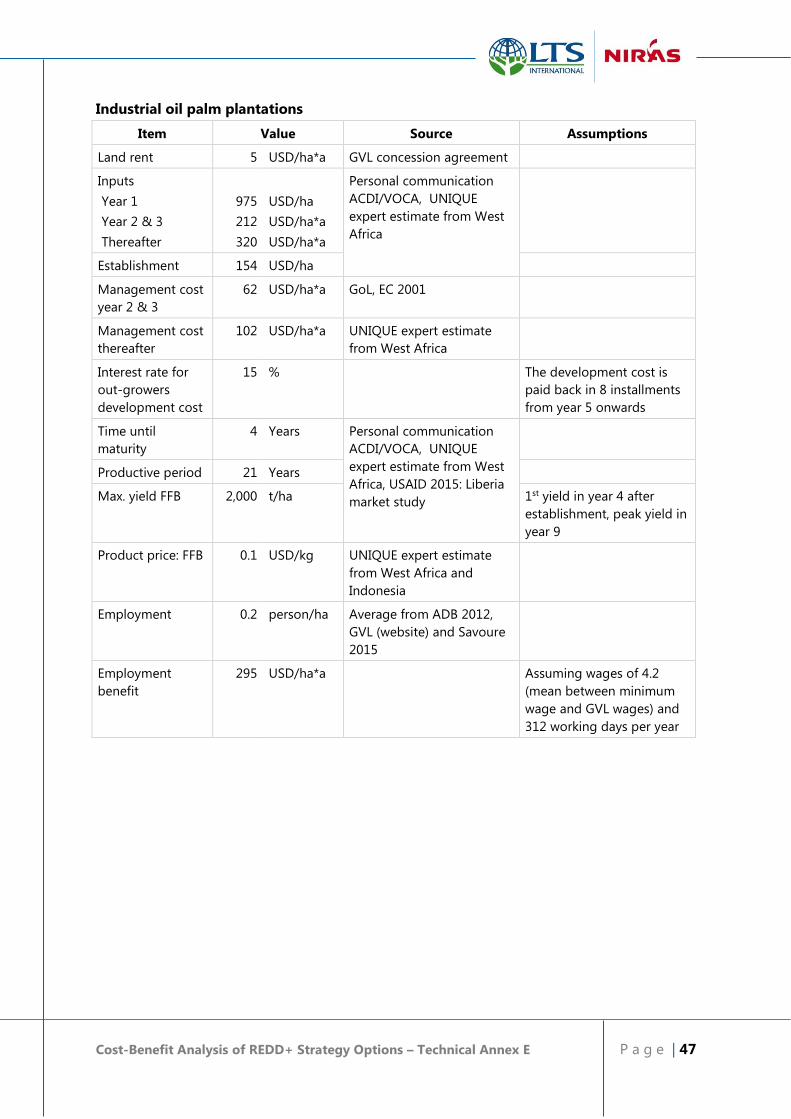
Cost-Benefit Analysis of REDD+ Strategy Options – Technical Annex E P a g e | 47
Industrial oil palm plantations
Item Value Source Assumptions
Land rent 5 USD/ha*a GVL concession agreement
Inputs
Year 1
Year 2 & 3
Thereafter
975
212
320
USD/ha
USD/ha*a
USD/ha*a
Personal communication
ACDI/VOCA, UNIQUE
expert estimate from West
Africa
Establishment 154 USD/ha
Management cost
year 2 & 3
62 USD/ha*a GoL, EC 2001
Management cost
thereafter
102 USD/ha*a UNIQUE expert estimate
from West Africa
Interest rate for
out-growers
development cost
15 % The development cost is
paid back in 8 installments
from year 5 onwards
Time until
maturity
4 Years Personal communication
ACDI/VOCA, UNIQUE
expert estimate from West
Africa, USAID 2015: Liberia
market study
Productive period 21 Years
Max. yield FFB 2,000 t/ha 1st yield in year 4 after
establishment, peak yield in
year 9
Product price: FFB 0.1 USD/kg UNIQUE expert estimate
from West Africa and
Indonesia
Employment 0.2 person/ha Average from ADB 2012,
GVL (website) and Savoure
2015
Employment
benefit
295 USD/ha*a Assuming wages of 4.2
(mean between minimum
wage and GVL wages) and
312 working days per year

Cost-Benefit Analysis of REDD+ Strategy Options – Technical Annex E P a g e | 48
Rubber plantations
Item Value Source Assumptions
Establishment:
Inputs1
Labor
555
305
USD/yr 1
USD/yr 1
UNIQUE expert estimate
from West Africa
Assuming USD 3.5/man day Management cost
from yr 2 onwards
87.5 USD/ha*yr GoL, EC 2001
Harvesting cost 438 USD/ha*yr GoL, EC 2001
Inputs 45 USD/ha*yr UNIQUE expert estimate
from West Africa
Cups and tools for rubber
collection
Product price (wet
rubber)
0.8 USD/l FFI 2013: REDD Wonegizi;
GoL 2007
At buying stations
Revenue from yr 7
onwards
640 USD/ha*yr
Time until
maturity
6 yrs
Productive period 19 Yrs
Yield (wet rubber) 800 kg/ha*yr GoL 2010
Subsistence agriculture – shifting cultivation
Income Value Source Assumptions
Long cycle (7-8 yrs)
Short cycle (3-4
yrs)2
333
220
USD/ha*yr
USD/ha*yr
Based on GoL, EC
2001, values are
inflation adjusted
Mixed crop system
Yr 1: Rice
Yr 2: Cassava/vegetables
Yr 3: Plantain/banana
Yr 5-
7:
Slowly reverting back to
secondary forest
1 The income only applies every 7-8 or 3-4 years respectively in the cashflow of the 1 ha model.
2 Reduced income of approx. 65% of long cycle due to loss in soil fertility.
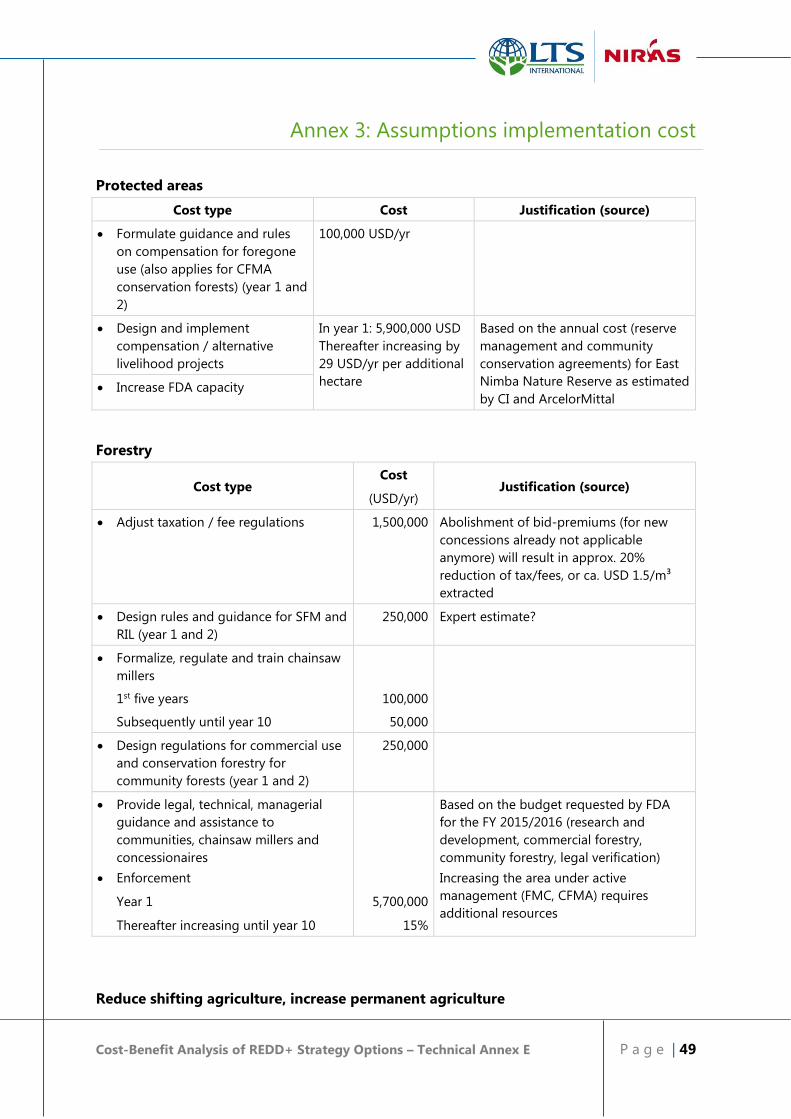
Cost-Benefit Analysis of REDD+ Strategy Options – Technical Annex E P a g e | 49
Annex 3: Assumptions implementation cost
Protected areas
Cost type Cost Justification (source)
Formulate guidance and rules
on compensation for foregone
use (also applies for CFMA
conservation forests) (year 1 and
2)
100,000 USD/yr
Design and implement
compensation / alternative
livelihood projects
In year 1: 5,900,000 USD
Thereafter increasing by
29 USD/yr per additional
hectare
Based on the annual cost (reserve
management and community
conservation agreements) for East
Nimba Nature Reserve as estimated
by CI and ArcelorMittal Increase FDA capacity
Forestry
Cost type Cost
Justification (source) (USD/yr)
Adjust taxation / fee regulations 1,500,000 Abolishment of bid-premiums (for new
concessions already not applicable
anymore) will result in approx. 20%
reduction of tax/fees, or ca. USD 1.5/m³
extracted
Design rules and guidance for SFM and
RIL (year 1 and 2)
250,000 Expert estimate?
Formalize, regulate and train chainsaw
millers
1st five years 100,000
Subsequently until year 10 50,000
Design regulations for commercial use
and conservation forestry for
community forests (year 1 and 2)
250,000
Provide legal, technical, managerial
guidance and assistance to
communities, chainsaw millers and
concessionaires
Enforcement
Based on the budget requested by FDA
for the FY 2015/2016 (research and
development, commercial forestry,
community forestry, legal verification)
Increasing the area under active
management (FMC, CFMA) requires
additional resources Year 1 5,700,000
Thereafter increasing until year 10 15%
Reduce shifting agriculture, increase permanent agriculture

Cost-Benefit Analysis of REDD+ Strategy Options – Technical Annex E P a g e | 50
Cost type Cost
Justification (source) (USD/yr)
Improve access to finance
Improve access to inputs
(availability and e.g.
subsidies)
Improve access to markets
and value addition
Provide technical assistance
on modern agricultural
practices and conservation
agriculture
per farmer targeted:
Year 1-6:
Year 7-12:
210
37,800,000
18,900,000
Conservation International
2009
Approx. 40,000 farmers grow
cocoa, 15,000 oil palm (FFI,
2014) and > 150,000 rice and
other food crops. Assuming
role out of the agricultural
program across the country,
but targeting only approx. half
the farmers in the 1st phase.
Thereafter decreasing by 5%/yr
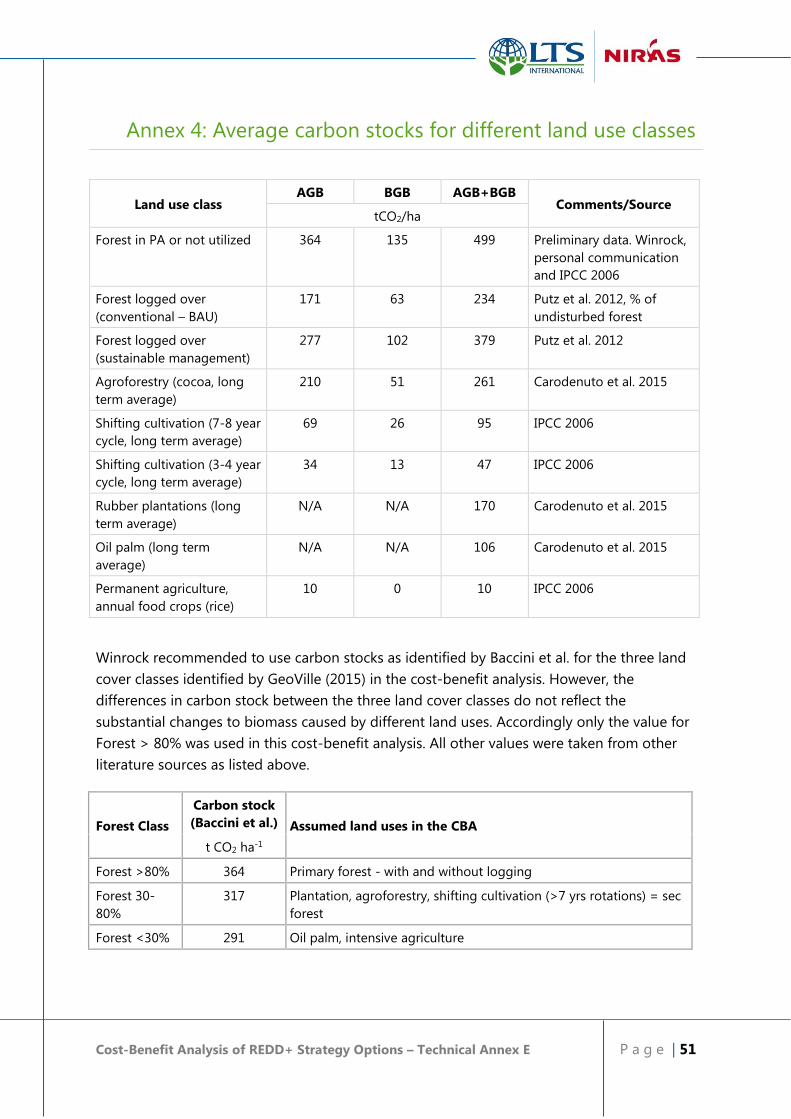
Cost-Benefit Analysis of REDD+ Strategy Options – Technical Annex E P a g e | 51
Annex 4: Average carbon stocks for different land use classes
Land use class AGB BGB AGB+BGB
Comments/Source tCO2/ha
Forest in PA or not utilized 364 135 499 Preliminary data. Winrock,
personal communication
and IPCC 2006
Forest logged over
(conventional – BAU)
171 63 234 Putz et al. 2012, % of
undisturbed forest
Forest logged over
(sustainable management)
277 102 379 Putz et al. 2012
Agroforestry (cocoa, long
term average)
210 51 261 Carodenuto et al. 2015
Shifting cultivation (7-8 year
cycle, long term average)
69 26 95 IPCC 2006
Shifting cultivation (3-4 year
cycle, long term average)
34 13 47 IPCC 2006
Rubber plantations (long
term average)
N/A N/A 170 Carodenuto et al. 2015
Oil palm (long term
average)
N/A N/A 106 Carodenuto et al. 2015
Permanent agriculture,
annual food crops (rice)
10 0 10 IPCC 2006
Winrock recommended to use carbon stocks as identified by Baccini et al. for the three land
cover classes identified by GeoVille (2015) in the cost-benefit analysis. However, the
differences in carbon stock between the three land cover classes do not reflect the
substantial changes to biomass caused by different land uses. Accordingly only the value for
Forest > 80% was used in this cost-benefit analysis. All other values were taken from other
literature sources as listed above.
Forest Class
Carbon stock
(Baccini et al.) Assumed land uses in the CBA
t CO2 ha-1
Forest >80% 364 Primary forest - with and without logging
Forest 30-
80%
317 Plantation, agroforestry, shifting cultivation (>7 yrs rotations) = sec
forest
Forest <30% 291 Oil palm, intensive agriculture
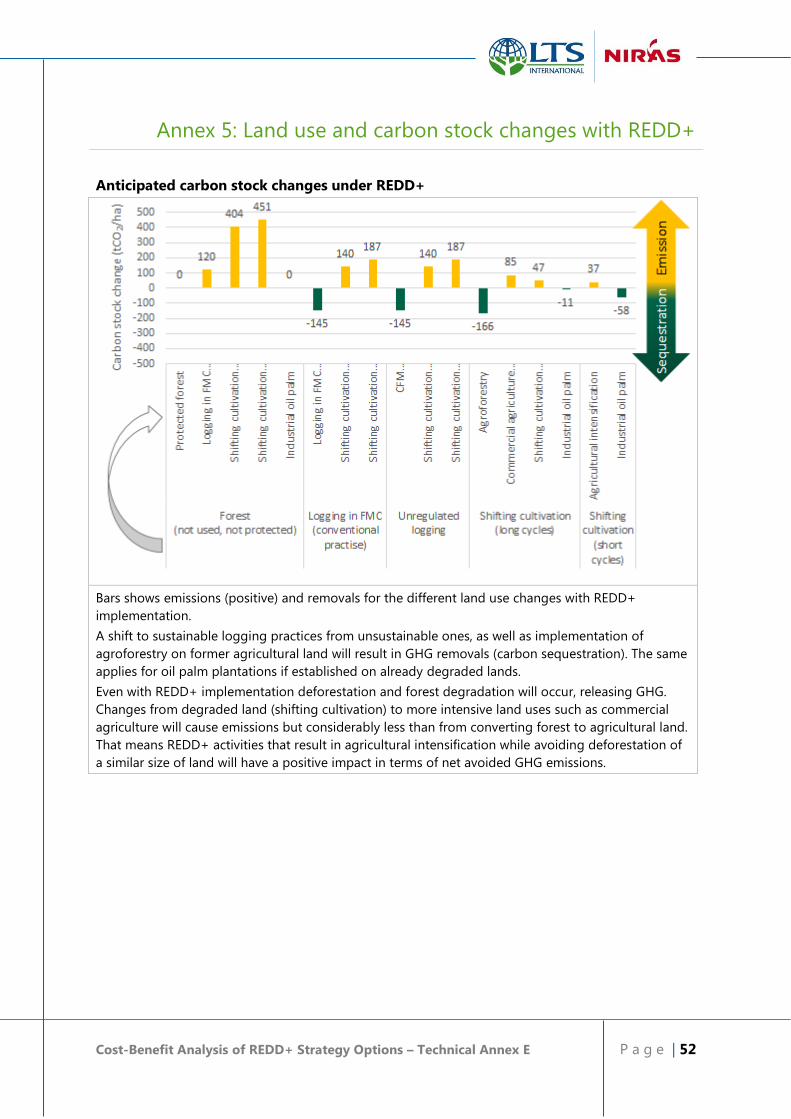
Cost-Benefit Analysis of REDD+ Strategy Options – Technical Annex E P a g e | 52
Annex 5: Land use and carbon stock changes with REDD+
Anticipated carbon stock changes under REDD+
Bars shows emissions (positive) and removals for the different land use changes with REDD+
implementation.
A shift to sustainable logging practices from unsustainable ones, as well as implementation of
agroforestry on former agricultural land will result in GHG removals (carbon sequestration). The same
applies for oil palm plantations if established on already degraded lands.
Even with REDD+ implementation deforestation and forest degradation will occur, releasing GHG.
Changes from degraded land (shifting cultivation) to more intensive land uses such as commercial
agriculture will cause emissions but considerably less than from converting forest to agricultural land.
That means REDD+ activities that result in agricultural intensification while avoiding deforestation of
a similar size of land will have a positive impact in terms of net avoided GHG emissions.

Cost-Benefit Analysis of REDD+ Strategy Options – Technical Annex E P a g e | 53
Annex 6: GHG emissions and removals for land cover classes
for BAU and REDD+
The expected GHG emissions for the different land uses were summarized for the land cover
classes as identified by GeoVille 2015 (see Table 2 above).
Under business as usual deforestation of [relatively] intact forests (Forest cover > 80%) is
expected to take place on an area of ca. 250,000 ha and constitutes the biggest source of
GHG emissions, followed by degradation from forest to the next land cover class (Forest
cover between 80% and 30%). Intensification of agriculture (oil palm on non-forest land) will
result in GHG removals.
Forest cover change and related emissions for BAU for Liberia
Bars show the area within a Forest cover class (FC) which is expected to be protected, degraded or
deforested, or where CO2 sequestration is likely to take place. Green bars stand for carbon
sequestration or the protection from degradation/deforestation and yellow bars for areas where
degradation/deforestation will occur. Boxes show the net-GHG emissions.
With REDD+ the main source of emissions will be sustainable logging in to date undisturbed
forests, while helping to avoid deforestation. This will be largely offset by changing
management practices in already logged forests and the resulting removals. REDD+
measures targeting forest protection and sustainable management must cover a very large
area (approx. 2.5 million ha) and variety of activities to achieve significant emission

Cost-Benefit Analysis of REDD+ Strategy Options – Technical Annex E P a g e | 54
reductions. REDD+ measures targeting the sustainable intensification of agriculture will take
place on a much smaller area. However, the measures required will likely be just as expensive
as forest protection and sustainable forest management.
Forest cover change and related emissions for REDD+ for Liberia
Bars show the area within a Forest cover class (FC) which is expected to be protected, degraded or
deforested, or where CO2 sequestration is likely to take place. Green bars stand for carbon
sequestration or the protection from degradation/deforestation and yellow bars for areas where
degradation/deforestation will occur. Boxes show the net-GHG emissions.